collateral flows and balance sheet(s) space collateral flows is hampered by the inadequacy of the...
TRANSCRIPT
Journal of Financial Market Infrastructures 5(1), 65–82DOI: 10.21314/JFMI.2016.065
Forum Paper
Collateral flows and balance sheet(s) space
Manmohan Singh
International Monetary Fund, 1900 Pennsylvania Avenue NW, Washington, DC 20431, USA;email: [email protected]
(Received May 17, 2016; revised July 15, 2016; accepted July 15, 2016)
ABSTRACT
Collateral does not flow in a vacuum; it needs balance sheets to move within thefinancial system. The new regulations constrain private sector bank balance sheetsand thus impede market plumbing. This paper looks at securities-lending, derivativesand prime-brokerage markets as suppliers of collateral (as much has been written onthe repo market). Going forward, the choice of balance sheet(s), private or public,should be driven by market forces and not by the ad hoc allocation of central banks.Otherwise, this may be suboptimal for monetary policy transmission.
Keywords: collateral flows; securities lending; prime-brokerage; derivatives; balance sheets;monetary policy transmission.
1 INTRODUCTION
Collateral flows lie at the heart of any proper understanding of market liquidity and,hence, financial stability. No other market is so critical to the functioning of thefinancial system and yet so poorly understood. In addition, though, as policy makersbegin to acknowledge the inadequacies of traditional theories of money and lending,collateral flows are increasingly being recognized as a driver of credit creation that isjust as important as money itself. Despite this, a true appreciation of the importance
Print ISSN 2049-5404 jOnline ISSN 2049-5412Copyright © 2016 Incisive Risk Information (IP) Limited
65
66 M. Singh
of collateral flows is hampered by the inadequacy of the way in which they areaccounted for.
For overall financial lubrication, the financial system requires collateral or moneyfor intraday debits and credits. The cross-border financial markets traditionally use“cash or cash-equivalent” collateral (ie, money or highly liquid fungible securities)in lieu of cash to settle accounts. Financial collateral does not have to be highly rated(AAA/AA): as long as the securities (which can be either debt or equity) are liquid,mark-to-market and part of a legal cross-border master agreement, they can be usedas “cash equivalent”. In this way, collateral underpins a wide range of secured fund-ing and hedging (primarily with over-the-counter (OTC) derivatives) transactions.Increasingly, collateral has a regulatory value in addition to being cash-equivalent.Such financial collateral has not yet been quantified by regulators and is not (yet)part of official sector statistics; however, it is a key component of financial plumbing(Baklanova et al 2016).
1.1 The discomfort with “collateral chains”
The term “pledged for reuse” means that the collateral taker has the right to reuse itin their own name. Its practical effect is economically equivalent to title transfer (ie, achange in ownership) and is essential to the financial lubrication that makes collateralakin to cash-equivalent. In the bilateral market, contracts that embrace repurchaseagreement (repo), securities-lending, OTC derivatives and customer margin loansmay involve title transfer. Under a title-transfer arrangement, the collateral providertransfers ownership of collateral to the collateral taker.
The latter acquires full title to the collateral received and, as its new owner, iscompletely free to utilize it. In return, the parties agree that, once the collateral providerhas discharged its financial obligation to the collateral taker, the collateral taker willreturn equivalent collateral to the collateral provider. Note that the obligation is toreturn equivalent collateral: that is to say, securities of the same type and value terms,but not the original security. This point about equivalence is important. After thecollateral has changed hands via title transfer and been reused by the collateral taker,it would not be obligatory on the part of the collateral taker to return exactly the sameproperty initially received as collateral. A simplistic example is a physical twenty-dollar bill with serial number XYZ. If you provide that very bill as collateral to thecollateral recipient, it does not matter if they give you back a different twenty-dollarbill – any twenty-dollar bill will do.
Although the terms “rehypothecation” and “pledged collateral that can be reused”are often employed interchangeably, each has a specific and slightly different meaning.“Rehypothecation” means the use of financial collateral by a collateral taker as securityfor their own obligations to some third party (ie, onward pledging). Reuse is broader in
Journal of Financial Market Infrastructures www.risk.net/journal

Collateral flows and balance sheet(s) space 67
scope, encompassing not only repledging but also any use of the collateral compatiblewith ownership of the property (such as selling or lending it to a third party). Not allpledged collateral can be reused in this way. Rights of reuse are thus inherent in title-transfer financial collateral arrangements, because ownership of the property actuallychanges, whereas under a pledge the collateral taker takes a security interest only in thepledged assets, and they will enjoy rights of rehypothecation only if reuse is expresslygranted in the pledge agreement.1 Market practice suggests that rehypothecation ofassets has historically been a cheaper way of financing the prime business than turningto the repo market, and some of the recent regulations are more beneficial to nettingfor prime brokerage (eg, equity long/short positions) than repo.
Within the United States, rehypothecation rights are strictly limited. Outside theUnited States (that is, outside New York-governed contracts), the prevalence of rehy-pothecation allows for a market clearing price for financial collateral (ie, the UnitedKingdom and continental Europe). Rights of reuse have a strong legal underpin-ning under the Financial Collateral Directive of the EU. The EU legal framework forfinancial collateral is flexible and can accommodate the preferences of prudent andrisk-averse clients and counterparties. Whether or not sophisticated market partici-pants strike bargains that offer them appropriate protection is a matter for them aloneto decide. In most cases, UK broker-dealers operate subject to contractually agreedreuse limits (see Appendix A).
Some policy makers, especially in the financial stability groups (eg, the Finan-cial Stability Board (FSB)), perceive “rehypothecation” to be systemically dangerous(because of the way it can drive leverage). However, ordinary banking is not funda-mentally different. In economic terms, the “reuse” or rehypothecation of a securityis identical to the money creation that takes place in commercial banking throughthe process of accepting deposits and making loans. So, why is it that a deposit at abank of US$100 dollars can be lent, but financial collateral that is mark-to-market atUS$100 dollars is restricted for reuse by policy makers? A bank such as Citibank hascapital; so does shadow banking via haircuts and overcollateralization whenever col-lateral is reused. Central banks are trying to rejuvenate the credit-creation engine viaquantitative easing (QE); so far, they are not having great success. Monetary policy
1 Under a pledged collateral agreement, the collateral taker, or the “pledgee”, does not have automaticrights of reuse or rehypothecation in the pledge agreement unless such rights of reuse are expresslygranted in the contract. The pledgee will not be able to seize or use that pledged collateral fortheir own purposes unless the “pledgor” defaults on their obligation to the pledgee, triggeringenforcement. However, in cases where a pledgor, or collateral provider, grants a pledgee rightsof rehypothecation over pledged collateral, and if the pledgee has exercised this right prior toinsolvency, the pledgor’s legal rights are as if they had transferred title in the property to the pledgee.The pledgor’s legal remedies against an insolvent pledgee are, in practice, extremely limited.
www.risk.net/journal Journal of Financial Market Infrastructures

68 M. Singh
is ultra loose. Restricting collateral reuse is a tight monetary policy that seems to beat odds with the current policies of key monetary authorities. In fact, the money met-rics such as M0, M1 and M2 need to integrate the sizable pledged collateral metrics.Otherwise, fully understanding the financial plumbing (that accepts both money andpledged collateral as lubricants) will not be possible.
2 QUANTITATIVE EASING AND REGULATIONS
Expanded central bank balance sheets that silo sizable holdings of US treasuries, UKgilts, Japanese government bonds (JGBs), German bunds and other AAA eurozonecollateral have placed central bankers in the midst of market plumbing. It is now goingto be very difficult for them to walk away from that role. For example, had QE nothappened then deposits would have grown roughly in line with the economy’s growthand/or household wealth. However, in the United States, where QE has ended, datafrom June 2015 shows that deposits with the Federal Deposit Insurance Corporation(FDIC) have doubled in the top fifty US bank holding companies relative to June2008 levels. The eurozone and Japan are in the midst of their QE at present.
Given the near double digit return that global systemically important financialinstitutions (G-SIFIs) need for their shareholders, some deposits are being pushedout to the official sector balance sheet; otherwise, these deposits would be a dragfor the banks and result in lower returns for their shareholders. In other words, theexcess deposits (stemming from nonbank sales of collateral to the central banks) andforthcoming regulations, such as the leverage ratio, which effectively requires banksto hold capital against deposits, are too “costly” for banks; hence the reluctance bybanks to take these deposits on their balance sheet. A typical bank’s marginal returnon these sizable deposits is below their marginal return to their shareholders. Giventhe limited balance sheet space at the private sector banks, the demands for the officialsector (ie, central banks’) balance sheets will remain important unless regulations arefine-tuned to allow for more bank/nonbank intermediation.
The recent experience of the United States Federal Reserve (Fed) sheds some lighton the operational aspects that are relevant. For example, the taper tantrum of May2013 highlighted market volatility concerns; not surprisingly, the Fed’s liftoff decisionin December 2015 was associated with a large reverse-repo program (RRP), whichis a deft way of handling financial stability concerns stemming from losses and/orvolatility on longer-tenor US treasuries. Large foreign repo pools at the Fed (ie, thedeposits of foreign governments, central banks and international official institutions)and deposit accounts for central counterparties (CCPs) at central banks, etc, alsosuggest an expanded role for central bank balance sheets. However, financial plumb-ing, where money and collateral interface, is a role that has historically always beenassociated with private-sector market participants (ie, banks, nonbanks, custodians,
Journal of Financial Market Infrastructures www.risk.net/journal
Collateral flows and balance sheet(s) space 69
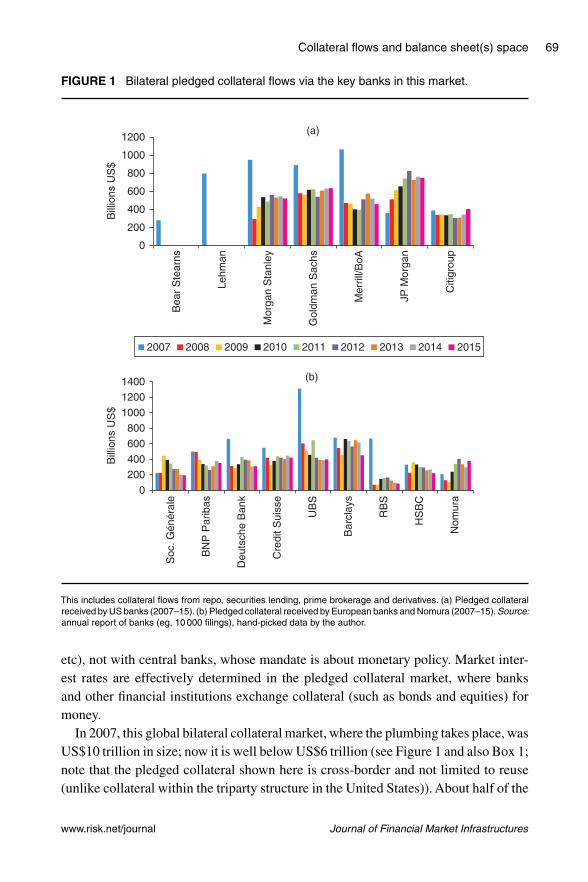
FIGURE 1 Bilateral pledged collateral flows via the key banks in this market.
0
200
400
600
800
1000
1200
0
200
400
600
800
1000
1200
1400
Bill
ions
US
$B
illio
ns U
S$
Bea
r S
tear
ns
2007 2008 2009 2010 2011 2012 2013 2014 2015
Lehm
an
Mor
gan
Sta
nley
Gol
dman
Sac
hs
Mer
rill/B
oA
JP M
orga
n
Citi
grou
p
(a)
(b)
Soc
. Gén
éral
e
BN
P P
arib
as
Deu
tsch
e B
ank
Cre
dit S
uiss
e
UB
S
Bar
clay
s
RB
S
HS
BC
Nom
ura
This includes collateral flows from repo, securities lending, prime brokerage and derivatives. (a) Pledged collateralreceived by US banks (2007–15). (b) Pledged collateral received by European banks and Nomura (2007–15).Source:annual report of banks (eg, 10 000 filings), hand-picked data by the author.
etc), not with central banks, whose mandate is about monetary policy. Market inter-est rates are effectively determined in the pledged collateral market, where banksand other financial institutions exchange collateral (such as bonds and equities) formoney.
In 2007, this global bilateral collateral market, where the plumbing takes place, wasUS$10 trillion in size; now it is well below US$6 trillion (see Figure 1 and also Box 1;note that the pledged collateral shown here is cross-border and not limited to reuse(unlike collateral within the triparty structure in the United States)). About half of the
www.risk.net/journal Journal of Financial Market Infrastructures
70 M. Singh
pledged collateral comes from the hedge fund industry; the other source of pledgedcollateral is pensions, insurers, central banks, sovereign wealth funds (SWFs), etc(Singh 2011; European Systemic Risk Board 2014).
From Lehman’s last annual report:
At November 30, 2007, the fair value of securities received as collateral that werepermitted to sell or repledge was approximately [US]$798 billion.... The fair valueof securities received as collateral that were sold or repledged was approximately[US]$725 billion at November 30, 2007.
Pledged collateral from bilateral, securities-lending, prime brokerage, and OTCderivatives margin is hard to disentangle as it shows up bunched up in footnotes tobalance sheets. Collateral with title transfer is pooled at the central collateral desks atlarge banks (the top-tier G-SIFIs that have a global footprint). Major dealers active inthe collateral industry include Goldman Sachs, Morgan Stanley, JP Morgan, Bank ofAmerica/Merrill and Citibank in the United States. In Europe and elsewhere, importantcollateral dealers are Deutsche Bank, UBS, Barclays, Credit Suisse, Société Générale,BNP Paribas, HSBC, Royal Bank of Scotland and Nomura. This collateral with titletransfer (or a variant thereof) can come into the banks via reverse repo, securitiesborrowing or OTC derivatives margin posting, or the use of client assets under aprime-brokerage agreement. Thus, any collateral metric should capture the typicaldocumentation that underpins collateral use and reuse in contracts such as the globalmaster securities lending agreement (GMSLA), global master repurchase agreement(GMRA) and International Swaps and DerivativesAssociation (ISDA) agreement, etc.The documentation does not restrict collateral reuse to one jurisdiction (or region);hence, the collateral metric needs to be global.
Table 1 provides a succinct summary of the sources of collateral, the total volumereceived by the large banks and the resultant velocity. The velocity is not an exactmetric but gives an idea of the length of the collateral chains in that year. So, wecan infer that, on average, the collateral chains were longer in 2007 than in 2015.The intuition is that counterparty risk before the collapse of Lehman Brothers wasminimal. In the aftermath of Lehman’s demise, fewer trusted counterparties in themarket owing to elevated counterparty risk led to stranded liquidity pools; incompletemarkets; idle collateral; and shorter collateral chains, missed trades and deleveraging.At present, the collateral landscape has changed even more due to central banks’ QEpolicies, new regulations, etc. Collateral reuse (or velocity) is at an all-time low ofabout 1.8, compared with 3.0 before Lehman’s demise. This collateral reuse rate is acentral theme of this special edition of The Journal of Financial Market Infrastructuresand deserves more attention in policy circles (for example, the recent Jackson Holepapers straddled plumbing issues but were silent on collateral reuse rate).
Journal of Financial Market Infrastructures www.risk.net/journal
Collateral flows and balance sheet(s) space 71
BOX 1 The ten to fifteen banks at the core of global financial plumbing.
Let the financial system that includes banks, hedge funds, pension funds, insurers, SWFs,etc, be represented by A to Z. Only a handful (say XYZ) can move financial collateral acrossborders. XYZ also happen to be the large ten to fifteen banks discussed earlier. The rest ofthe financial system from A to W that demand and supply collateral need to connect with eachother via XYZ. Entry into this market is not prohibited but extremely expensive and difficult, aswe need a global footprint and global clients (and the acumen and sophistication to move andprice liquid securities very quickly, in seconds sometimes). For example, a Chilean pensionfund may want Indonesian bonds for six months, and W (for example, a hedge fund or asecurities lender in Hong Kong) may be holding these bonds and willing to rent out to A forsix months for a small fee. But W does not know there is demand from A. Only via XYZ canA connect to W. Since XYZ sit in the middle of the web, they have the ability to optimize inways that give them an advantage; the Indonesian bonds may come into their possessionbecause they have loaned W money, or because they have a derivative with W or through asecurity lending agreement.
Such securities that need to move cross-border under a “repo” or “security lending” or relatedtransaction need to be legally perfected (herein, legal perfection entails rules such as titletransfer and rehypothecation). Perfection is also possible under pledge, as documented inthe master securities lending agreement (MSLA). Similarly, for OTC derivative margins, thereis an ISDA master agreement. For prime-brokerage/hedge-fund collateral, there is a similarmaster agreement that resonates easily between XYZ.Thus, it is not easy for all real-economycollateral to be able to move across borders. This market for bilateral pledged collateral isthe only true market that prices at mark-to-market all liquid securities (bonds C equities).Given that collateral is in short supply (as reflected by repo rates), one of two things is likelyto happen.
(a) The velocity of collateral may come back: this is a task that only XYZ can handle inbulk if more good collateral is sourced through them. However, regulatory proposalssuch as leverage and liquidity ratio have resulted in balance-sheet constraints for XYZto do collateral transformation. So, the velocity or reuser rate is unlikely to come back(see Table 2).
(b) Central banks can make balance-sheet “space” in order to augment the balancesheets with XYZ, for example, the Fed’s reverse repo program since September 2013,which was augmented to almost US$2 trillion in December 2015. But this programdoes not release collateral to the market, as it uses the triparty structure; so, theFed’s counterparty gets ownership but not possession. This is one way to not let thecollateral “velocity” escape, which, in turn, would increase repo rates (and this mightcreate a wedge with the policy rate, so, conservatively, there is no leakage of durationto the market); thus, all maturing bonds bought under QE are reinvested. The Euro-pean Central Bank (ECB)-type of approach (that was seen during the EU crisis withsubsidized haircuts relative to market) may not be market based. More recently, inthe aftermath of the ECB’s QE since March 2015, its securities-lending program hasremained in its infancy. On the other hand, the Reserve Bank of Australia will not issuenew debt to meet collateral demand, but it will provide good collateral (or high-qualityliquid assets) at market price.
www.risk.net/journal Journal of Financial Market Infrastructures

72 M. Singh
TABLE 1 Sources of pledged collateral, volume of market and velocity (2007; 2010–15).
Sources‚ …„ ƒ Volume of
Hedge Securities secured Reuse rateYear funds lending Total operations (or velocity)
2007 1.7 1.7 3.4 10.0 3.02010 1.3 1.1 2.4 5.8 2.42011 1.3 1.05 2.35 6.1 2.52012 1.8 1.0 2.8 6.0 2.22013 1.85 1.0 2.85 5.8 2.02014 1.9 1.1 3.0 5.8 1.92015 2.0 1.1 3.1 5.6 1.8
In trillions of US dollars; velocity in units. Sources: Risk Management Association (RMA); International MonetaryFund (IMF) Working Paper, “Velocity of pledged collateral” (Singh 2011).
3 EVIDENCE FROM SECURITIES-LENDING, DERIVATIVES ANDPRIME-BROKERAGE MARKETS
Much has been written about repo markets shrinking, but securities lending, deriva-tives and prime brokerage are also key avenues for collateral flows and reuse. Thus,the focus here is on these avenues, but repo (bilateral and triparty) is discussed suc-cinctly in Box 2. Collateral does not flow in a vacuum and thus needs balance sheetspace to move.
3.1 Securities lending
Although the large banks are unlikely to make room for the “high volume, low margin”securities lending business (due to leverage ratio), it is often assumed that the majorcustodians, such as Bank of NewYork (BNY) Mellon, Citibank, State Street, Euroclearand Clearstream, will have “balance sheet space” to move collateral around. Assetsheld by custodians are not part of their balance sheets; only principal positions areon these balance sheets. However, an indemnification requirement to clients requiresupfront capital provision, and this is not cost effective. Pre-Lehman, dealers wouldoblige the custodians that pushed out general collateral (eg, IBM or Merck equities)along with specials that the dealers really wanted (and still do). In this era, custodianswould set a general collateral (GC) to “specials” ratio as high as 5:1 or even 13:1;there was less balance sheet constraint. For almost a decade now, there has been notying of GC to specials.
The asset-management complex, which includes pensions, insurers and official sec-tor accounts such as SWFs and central banks, is a rich source of collateral deposits. Thesecurities they hold are continuously reinvested (via securities lending) to maximize
Journal of Financial Market Infrastructures www.risk.net/journal
Collateral flows and balance sheet(s) space 73
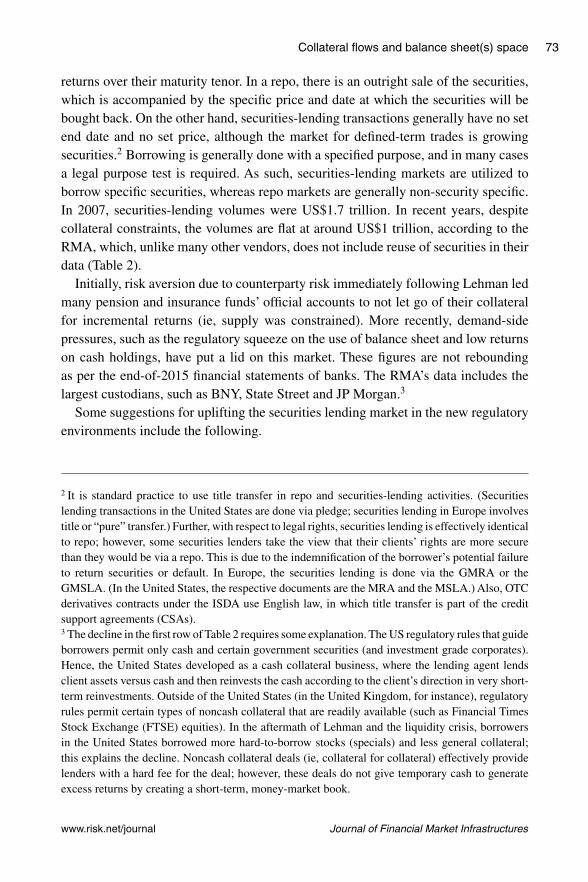
returns over their maturity tenor. In a repo, there is an outright sale of the securities,which is accompanied by the specific price and date at which the securities will bebought back. On the other hand, securities-lending transactions generally have no setend date and no set price, although the market for defined-term trades is growingsecurities.2 Borrowing is generally done with a specified purpose, and in many casesa legal purpose test is required. As such, securities-lending markets are utilized toborrow specific securities, whereas repo markets are generally non-security specific.In 2007, securities-lending volumes were US$1.7 trillion. In recent years, despitecollateral constraints, the volumes are flat at around US$1 trillion, according to theRMA, which, unlike many other vendors, does not include reuse of securities in theirdata (Table 2).
Initially, risk aversion due to counterparty risk immediately following Lehman ledmany pension and insurance funds’ official accounts to not let go of their collateralfor incremental returns (ie, supply was constrained). More recently, demand-sidepressures, such as the regulatory squeeze on the use of balance sheet and low returnson cash holdings, have put a lid on this market. These figures are not reboundingas per the end-of-2015 financial statements of banks. The RMA’s data includes thelargest custodians, such as BNY, State Street and JP Morgan.3
Some suggestions for uplifting the securities lending market in the new regulatoryenvironments include the following.
2 It is standard practice to use title transfer in repo and securities-lending activities. (Securitieslending transactions in the United States are done via pledge; securities lending in Europe involvestitle or “pure” transfer.) Further, with respect to legal rights, securities lending is effectively identicalto repo; however, some securities lenders take the view that their clients’ rights are more securethan they would be via a repo. This is due to the indemnification of the borrower’s potential failureto return securities or default. In Europe, the securities lending is done via the GMRA or theGMSLA. (In the United States, the respective documents are the MRA and the MSLA.) Also, OTCderivatives contracts under the ISDA use English law, in which title transfer is part of the creditsupport agreements (CSAs).3 The decline in the first row of Table 2 requires some explanation. The US regulatory rules that guideborrowers permit only cash and certain government securities (and investment grade corporates).Hence, the United States developed as a cash collateral business, where the lending agent lendsclient assets versus cash and then reinvests the cash according to the client’s direction in very short-term reinvestments. Outside of the United States (in the United Kingdom, for instance), regulatoryrules permit certain types of noncash collateral that are readily available (such as Financial TimesStock Exchange (FTSE) equities). In the aftermath of Lehman and the liquidity crisis, borrowersin the United States borrowed more hard-to-borrow stocks (specials) and less general collateral;this explains the decline. Noncash collateral deals (ie, collateral for collateral) effectively providelenders with a hard fee for the deal; however, these deals do not give temporary cash to generateexcess returns by creating a short-term, money-market book.
www.risk.net/journal Journal of Financial Market Infrastructures

74 M. Singh
TABLE 2 Sources of pledged collateral, velocity and collateral (2007; 2010–13).
Collateral received from pension funds, insurers,official accounts, etc (US dollars, billions)
‚ …„ ƒ
2007 2008 2009 2010 2011 2012 2013 2014 2015
Securities 1209 935 875 818 687 620 669 701 644lending vscashcollateral
Securities 486 251 270 301 370 378 338 425 454lending vsnoncashcollateral
Total 1695 1187 1146 1119 1058 998 1008 1137 1098securitieslending
All data in US trillions; velocity in units.
� The noncash collateral market in the United States should work toward those inEurope; at present, the United States has more attractive collateral rates (thanelsewhere), in part due to the repo rates being floored at 25 basis points (bps)at present, which is due to the Fed’s monetary policy.
� Equities can be increasingly mobilized and swapped with US treasuries,but regulations may need to change here (eg, the Securities and ExchangeCommission’s (SEC’s) Rule 15c3).
� Moreover, large holders of good collateral (eg, US treasuries) in the Gulfregion or some Asian countries cannot lend, as their rules prohibit the net-ting of sovereign client’s transactions (ie, their immunity angle).4 Given thehigher leverage ratio requirements for G-SIBs (especially in the United States),
4 For transactions collateralized by cash, the collateral receiver gives out cash and has a receivable(asset), and the collateral provider receives cash and books as payable (liability). Essentially, thetransaction is booked as a cash loan, or cash borrowed, collateralized by the security lent (or repo-ed) from an accounting standpoint. Under US generally accepted accounting principles (GAAP),if certain conditions are met (ie, same counterparty, same explicit maturity date (not open), intentto net settle, master netting agreement in place and legal right to offset in default), only then mayaccounts receivables and payables be netted down. Under Basel rules, if similar, but slightly moreexpansive, requirements are met, then the transactions may be netted. The legal right to offset indefault has led to many prime brokers determining that certain counterparties, most specificallySWFs and central banks, cannot be netted.
Journal of Financial Market Infrastructures www.risk.net/journal
Collateral flows and balance sheet(s) space 75
certain transactions do not make economic sense for some prime brokers toenter.5 Note that noncash trades are off balance sheet unless the collateral isre-hypothecated, so the re-hypothecation is what leads to a leverage issue.
� While the supply side (ie, central banks and SWFs) may be eager to increaselending, and the demand side (ie, hedge funds) may be eager to increase bor-rowing, the intermediaries (ie, large banks and agency lenders) will remain con-strained by the regulations for banks’ leverage and liquidity ratios; for agents,single counterparty credit limits and conservative risk-based capital rules.
If the market were to grow back to pre-crisis size, it would probably involve a muchlarger participation by nonregulated institutions, and/or connect supply to demandwithout an intermediary. While this is possible (the FSB already has a working groupto look at nonbank-to-nonbank collateral moves), it would be a very different marketfrom that which operates today, and one in which credit and duration managementand intermediation would have to be assumed by a different group of players, andpotentially under a different set of rules.
3.2 Derivative markets use of collateral
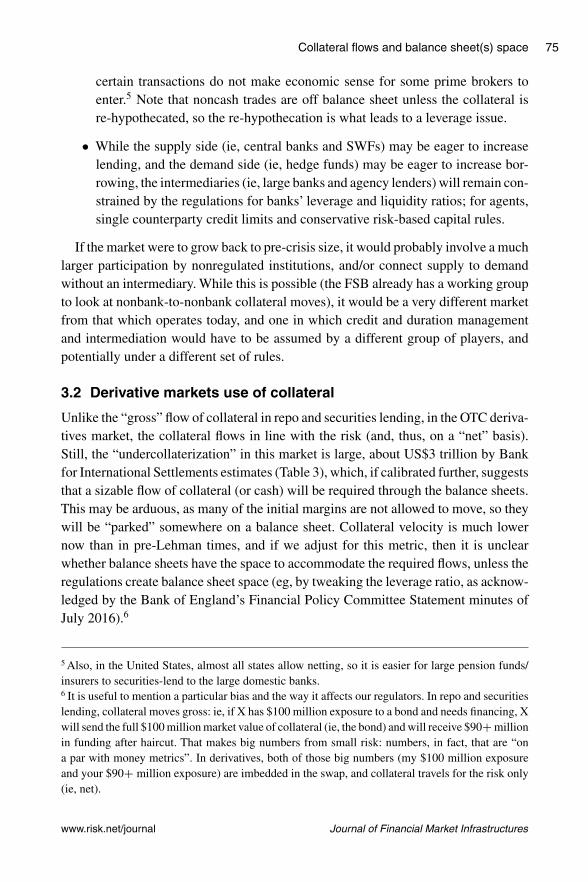
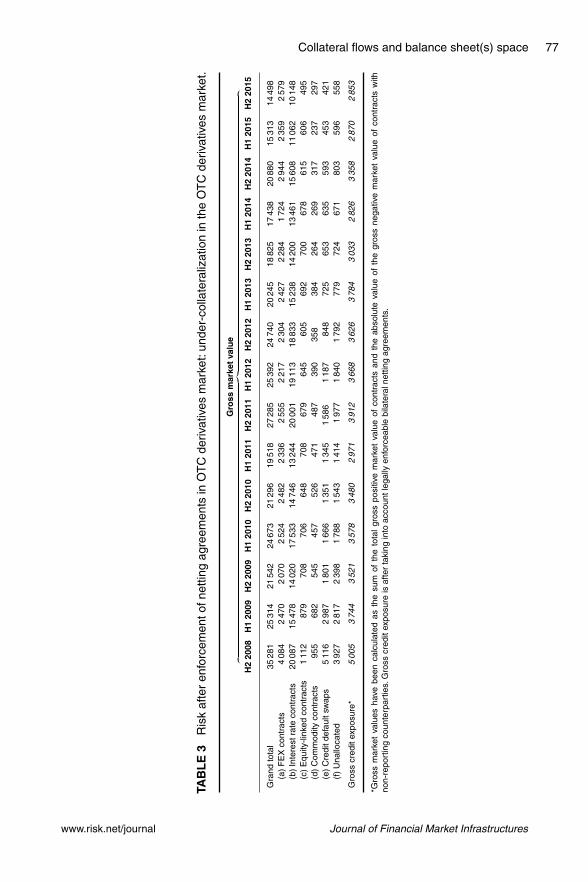
Unlike the “gross” flow of collateral in repo and securities lending, in the OTC deriva-tives market, the collateral flows in line with the risk (and, thus, on a “net” basis).Still, the “undercollaterization” in this market is large, about US$3 trillion by Bankfor International Settlements estimates (Table 3), which, if calibrated further, suggeststhat a sizable flow of collateral (or cash) will be required through the balance sheets.This may be arduous, as many of the initial margins are not allowed to move, so theywill be “parked” somewhere on a balance sheet. Collateral velocity is much lowernow than in pre-Lehman times, and if we adjust for this metric, then it is unclearwhether balance sheets have the space to accommodate the required flows, unless theregulations create balance sheet space (eg, by tweaking the leverage ratio, as acknow-ledged by the Bank of England’s Financial Policy Committee Statement minutes ofJuly 2016).6
5 Also, in the United States, almost all states allow netting, so it is easier for large pension funds/insurers to securities-lend to the large domestic banks.6 It is useful to mention a particular bias and the way it affects our regulators. In repo and securitieslending, collateral moves gross: ie, if X has $100 million exposure to a bond and needs financing, Xwill send the full $100 million market value of collateral (ie, the bond) and will receive $90Cmillionin funding after haircut. That makes big numbers from small risk: numbers, in fact, that are “ona par with money metrics”. In derivatives, both of those big numbers (my $100 million exposureand your $90C million exposure) are imbedded in the swap, and collateral travels for the risk only(ie, net).
www.risk.net/journal Journal of Financial Market Infrastructures
76 M. Singh
Cognizant of the dilemma and push toward mandatory clearing of standard con-tracts at CCPs, these large institutions are now allowed to park client margins atcentral banks (including at the Fed).
3.3 Prime brokerage
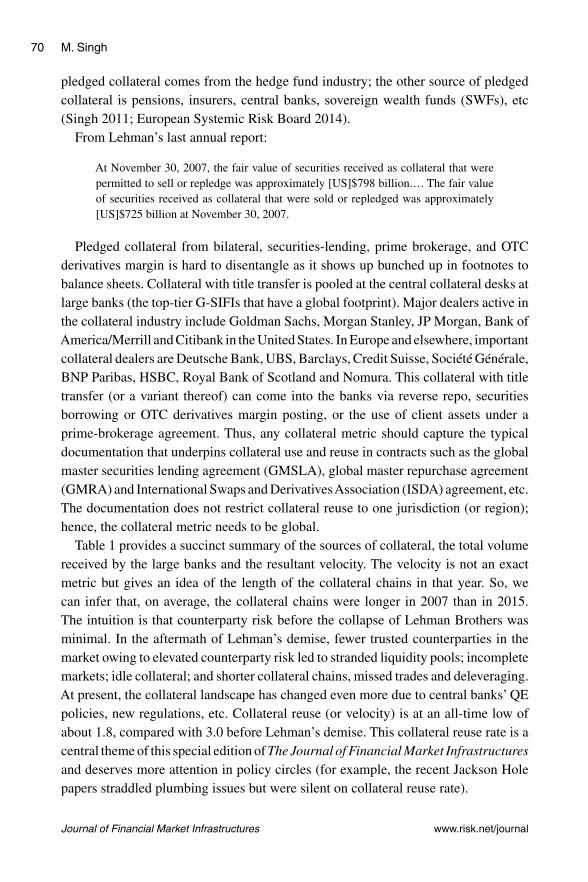
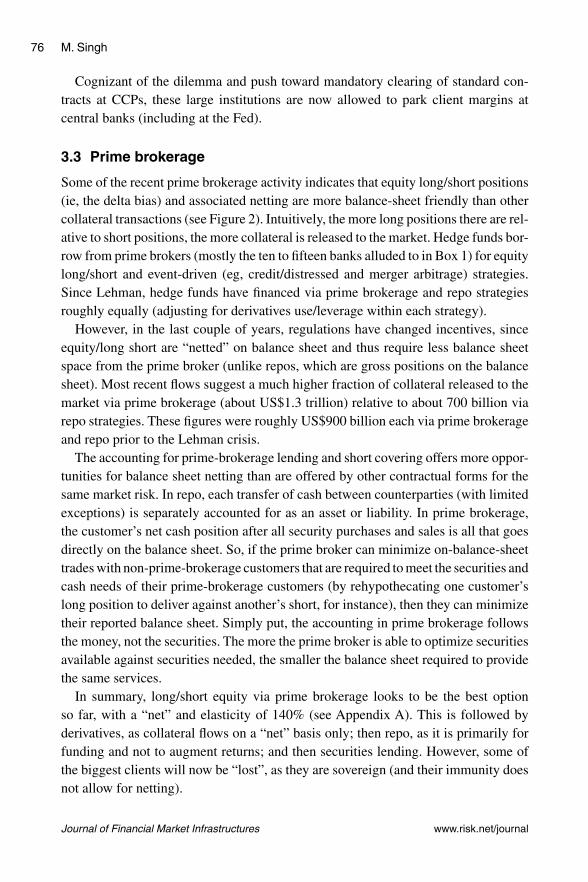
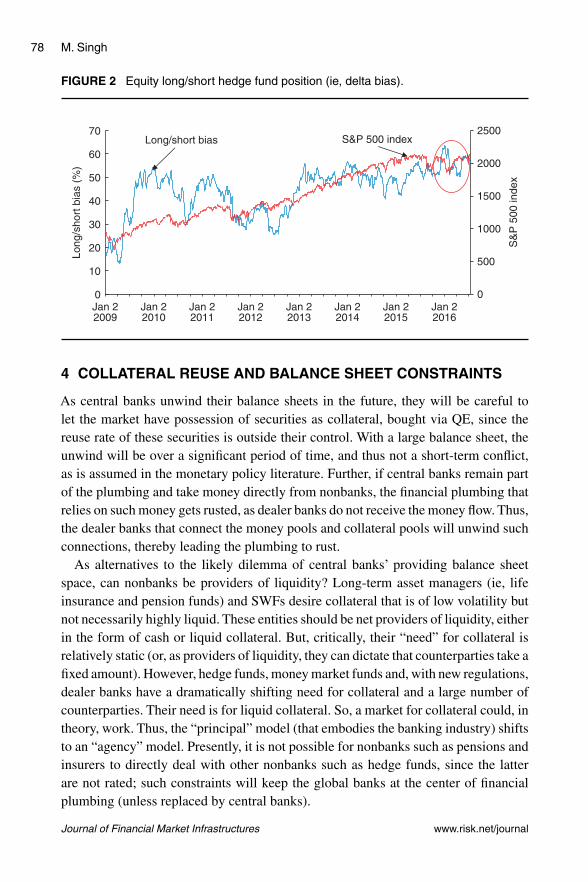
Some of the recent prime brokerage activity indicates that equity long/short positions(ie, the delta bias) and associated netting are more balance-sheet friendly than othercollateral transactions (see Figure 2). Intuitively, the more long positions there are rel-ative to short positions, the more collateral is released to the market. Hedge funds bor-row from prime brokers (mostly the ten to fifteen banks alluded to in Box 1) for equitylong/short and event-driven (eg, credit/distressed and merger arbitrage) strategies.Since Lehman, hedge funds have financed via prime brokerage and repo strategiesroughly equally (adjusting for derivatives use/leverage within each strategy).
However, in the last couple of years, regulations have changed incentives, sinceequity/long short are “netted” on balance sheet and thus require less balance sheetspace from the prime broker (unlike repos, which are gross positions on the balancesheet). Most recent flows suggest a much higher fraction of collateral released to themarket via prime brokerage (about US$1.3 trillion) relative to about 700 billion viarepo strategies. These figures were roughly US$900 billion each via prime brokerageand repo prior to the Lehman crisis.
The accounting for prime-brokerage lending and short covering offers more oppor-tunities for balance sheet netting than are offered by other contractual forms for thesame market risk. In repo, each transfer of cash between counterparties (with limitedexceptions) is separately accounted for as an asset or liability. In prime brokerage,the customer’s net cash position after all security purchases and sales is all that goesdirectly on the balance sheet. So, if the prime broker can minimize on-balance-sheettrades with non-prime-brokerage customers that are required to meet the securities andcash needs of their prime-brokerage customers (by rehypothecating one customer’slong position to deliver against another’s short, for instance), then they can minimizetheir reported balance sheet. Simply put, the accounting in prime brokerage followsthe money, not the securities. The more the prime broker is able to optimize securitiesavailable against securities needed, the smaller the balance sheet required to providethe same services.
In summary, long/short equity via prime brokerage looks to be the best optionso far, with a “net” and elasticity of 140% (see Appendix A). This is followed byderivatives, as collateral flows on a “net” basis only; then repo, as it is primarily forfunding and not to augment returns; and then securities lending. However, some ofthe biggest clients will now be “lost”, as they are sovereign (and their immunity doesnot allow for netting).
Journal of Financial Market Infrastructures www.risk.net/journal
Collateral flows and balance sheet(s) space 77
TAB
LE
3R
isk
afte
ren
forc
emen
tofn
ettin
gag
reem
ents
inO
TC
deriv
ativ
esm
arke
t:un
der-
colla
tera
lizat
ion
inth
eO
TC
deriv
ativ
esm
arke
t.
Gro
ssm
arke
tva
lue
‚…„
ƒ
H2
2008
H1
2009
H2
2009
H1
2010
H2
2010
H1
2011
H2
2011
H1
2012
H2
2012
H1
2013
H2
2013
H1
2014
H2
2014
H1
2015
H2
2015
Gra
ndto
tal
3528
125
314
2154
224
673
2129
619
518
2728
525
392
2474
020
245
1882
517
438
2088
015
313
1449
8(a
)F
EX
cont
ract
s4
084
247
02
070
252
42
482
233
62
555
221
72
304
242
72
284
172
42
944
235
92
579
(b)
Inte
rest
rate
cont
ract
s20
087
1547
814
020
1753
314
746
1324
420
001
1911
318
833
1523
814
200
1346
115
608
1106
210
148
(c)
Equ
ity-li
nked
cont
ract
s1
112
879
708
706
648
708
679
645
605
692
700
678
615
606
495
(d)
Com
mod
ityco
ntra
cts
955
682
545
457
526
471
487
390
358
384
264
269
317
237
297
(e)
Cre
ditd
efau
ltsw
aps
511
62
987
180
11
666
135
11
345
158
61
187
848
725
653
635
593
453
421
(f)
Una
lloca
ted
392
72
817
239
81
788
154
31
414
197
71
840
179
277
972
467
180
359
655
8
Gro
sscr
edit
expo
sure
*5
005
374
43
521
357
83
480
297
13
912
366
83
626
378
43
033
282
63
358
287
02
853
*Gro
ssm
arke
tva
lues
have
been
calc
ulat
edas
the
sum
ofth
eto
tal
gros
spo
sitiv
em
arke
tva
lue
ofco
ntra
cts
and
the
abso
lute
valu
eof
the
gros
sne
gativ
em
arke
tva
lue
ofco
ntra
cts
with
non-
repo
rtin
gco
unte
rpar
ties.
Gro
sscr
edit
expo
sure
isaf
ter
taki
ngin
toac
coun
tleg
ally
enfo
rcea
ble
bila
tera
lnet
ting
agre
emen
ts.
www.risk.net/journal Journal of Financial Market Infrastructures
78 M. Singh
FIGURE 2 Equity long/short hedge fund position (ie, delta bias).
0
500
1000
1500
2000
2500
0
10
20
30
40
50
60
70
Long
/sho
rt b
ias
(%)
S&
P 5
00 in
dex
Long/short bias S&P 500 index
Jan 22009
Jan 22010
Jan 22011
Jan 22012
Jan 22013
Jan 22014
Jan 22016
Jan 22015
4 COLLATERAL REUSE AND BALANCE SHEET CONSTRAINTS
As central banks unwind their balance sheets in the future, they will be careful tolet the market have possession of securities as collateral, bought via QE, since thereuse rate of these securities is outside their control. With a large balance sheet, theunwind will be over a significant period of time, and thus not a short-term conflict,as is assumed in the monetary policy literature. Further, if central banks remain partof the plumbing and take money directly from nonbanks, the financial plumbing thatrelies on such money gets rusted, as dealer banks do not receive the money flow. Thus,the dealer banks that connect the money pools and collateral pools will unwind suchconnections, thereby leading the plumbing to rust.
As alternatives to the likely dilemma of central banks’ providing balance sheetspace, can nonbanks be providers of liquidity? Long-term asset managers (ie, lifeinsurance and pension funds) and SWFs desire collateral that is of low volatility butnot necessarily highly liquid. These entities should be net providers of liquidity, eitherin the form of cash or liquid collateral. But, critically, their “need” for collateral isrelatively static (or, as providers of liquidity, they can dictate that counterparties take afixed amount). However, hedge funds, money market funds and, with new regulations,dealer banks have a dramatically shifting need for collateral and a large number ofcounterparties. Their need is for liquid collateral. So, a market for collateral could, intheory, work. Thus, the “principal” model (that embodies the banking industry) shiftsto an “agency” model. Presently, it is not possible for nonbanks such as pensions andinsurers to directly deal with other nonbanks such as hedge funds, since the latterare not rated; such constraints will keep the global banks at the center of financialplumbing (unless replaced by central banks).
Journal of Financial Market Infrastructures www.risk.net/journal
Collateral flows and balance sheet(s) space 79
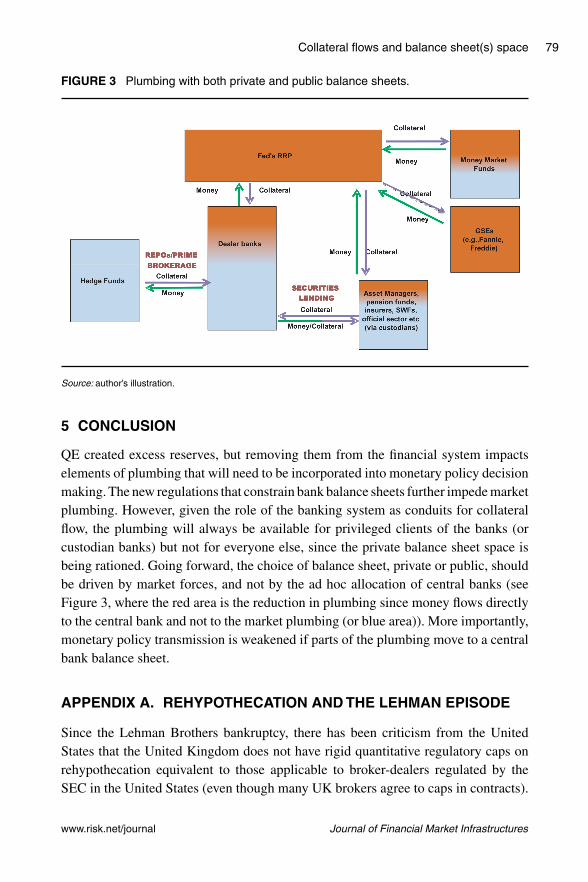
FIGURE 3 Plumbing with both private and public balance sheets.
Source: author’s illustration.
5 CONCLUSION
QE created excess reserves, but removing them from the financial system impactselements of plumbing that will need to be incorporated into monetary policy decisionmaking. The new regulations that constrain bank balance sheets further impede marketplumbing. However, given the role of the banking system as conduits for collateralflow, the plumbing will always be available for privileged clients of the banks (orcustodian banks) but not for everyone else, since the private balance sheet space isbeing rationed. Going forward, the choice of balance sheet, private or public, shouldbe driven by market forces, and not by the ad hoc allocation of central banks (seeFigure 3, where the red area is the reduction in plumbing since money flows directlyto the central bank and not to the market plumbing (or blue area)). More importantly,monetary policy transmission is weakened if parts of the plumbing move to a centralbank balance sheet.
APPENDIX A. REHYPOTHECATION AND THE LEHMAN EPISODE
Since the Lehman Brothers bankruptcy, there has been criticism from the UnitedStates that the United Kingdom does not have rigid quantitative regulatory caps onrehypothecation equivalent to those applicable to broker-dealers regulated by theSEC in the United States (even though many UK brokers agree to caps in contracts).
www.risk.net/journal Journal of Financial Market Infrastructures
80 M. Singh
BOX 2 The global bilateral collateral market (relative to the US triparty repo market).
Collateral use and reuse in financial markets is popular.Before the Lehman crash, the volumeof funding via pledged collateral (including title transfer) was about US$10 trillion, higher thanthe US broad measure of money, M2.This box tries to summarize the difference between themuch-researched triparty “repo” market and the less-researched bilateral collateral market;the latter includes collateral flows from not only bilateral repo but also securities lending,derivatives and prime brokerage.
The US bilateral repo market is a subset of the “market for collateral” (securities for posses-sion and use, incidentally against cash). The triparty repo (TPR) market in the United Statesis a “market for funding” (money for broker-dealers/banks, incidentally collateralized by secu-rities). The TPR market is currently estimated at US$1.6 trillion from a peak of almost US$3trillion before the Lehman crisis. The TPR market provides banks with cash on a securedbasis, with the collateral being posted to cash lenders (eg, money market funds) through oneof the two clearing banks: BNY Mellon and JP Morgan. The bilateral repo market is sizable,and although no official statistics exist, some recent work at central banks suggests thismarket to be on par with or bigger than the TPR market (eg, the New York Fed estimates thismarket to be between US$1 and US$2 trillion in the United States alone) (Baklanova et al2016).
Think of the bilateral repo market using this analogy for the old-clothing trade.Typically, mer-chants in developed countries shrink wrap old clothes in shipping-container-sized bundles(under pressure) and send these plastic-wrapped blocks to poor countries. There, clothingbrokers buy the blocks and resell them by weight to jobbers. So, if a block weighs 500 pounds,and the broker decides to sell it in 10-pound lots, fifty people will gather around to make apurchase. However, some people will pay slightly more to be at the front of the crowd, andsome will pay slightly less to be at the back. When the jobber pops the bundle open with abig knife and the shrink wrap explodes, everyone gathered around scrambles for the bestpieces. Collateral desks are a bit like those jobbers. Big lots come in from hedge funds andsecurity lenders, and the large bank’s collateral desk paws through it, searching for gems.Those gems go out bilaterally to customers who will pay a premium. The remainder goesto the guys at the back of the crowd (for example, TPR repo). To the extent that securitieseligible for the TPR market are in demand in the bilateral market, banks will generally usethem first in the bilateral market, as it offers a better price.
The figures shown above that depict the bilateral-pledged collateral do not count TPR-relatedcollateral, as this is trapped within the TPR structure. The operational structure of the RRPfacility puts practical restrictions on the reuse of collateral outside the triparty system. Col-lateral can only be used in a triparty repo liability. (So, a firm that is a “dealer” in the tripartysystem, such as JPMorgan Chase or BNY Mellon, could have as an asset a Fed RRP and asa liability a triparty repo with a customer.) Members of the Government Securities Division(GSD) of the Depository Trust and Clearing Corporation (DTCC) can reuse the collateralwithin the General Collateral Finance (GCF) triparty system. Here, we use the term “banks”very loosely; for example, Citibank could take collateral from the Fed and give this to a Fidelitymutual fund as a triparty investment, or it could take collateral from the Fed and give this inthe GCF to Credit Suisse to give to that Fidelity fund. To be clear, members of the GSD maybe classified differently: Goldman Sachs is actually Goldman Sachs & Co., Deutsche Bankis Deutsche Bank Securities Inc. and Barclays is Barclays Capital Inc. Members also includePierpont Securities LLC, Jefferies LLC and Cantor Fitzgerald & Co. The important point isthat reuse of collateral can only end in a triparty repo; it can have no other use outside thissystem.
Journal of Financial Market Infrastructures www.risk.net/journal
Collateral flows and balance sheet(s) space 81
Specifically, some feel that this asymmetry is akin to regulatory arbitrage and that theUnited Kingdom offers a unique forum for “unlimited rehypothecation”.7
Proposed regulations seem to be at odds with “title transfer”. If I transfer title,then the recipient of collateral is able to use that asset in any way they deem fit.This is not compatible with regulations that treat the asset as “client property” andlimit rehypothecation or segregate for the client. In fact, insisting on segregationundermines the legal construction under which title was transferred. An importantdistinction is the interpretation of the prefix “re” in “rehypothecation”. In the UnitedStates, this is normally done with a pledge with consent to reuse. So, there is a cleardistinction between pledged securities and sold securities. However, in Europe a repois a contract of sale with a promise to repurchase at an agreed future date and price.Legally, if I sell securities, the resulting securities are no longer my securities; if thesesecurities are then onward pledged, that is not a rehypothecation from my angle.However, is this economically different if I sell securities on the basis that you agreeto sell me equivalent securities at some future time? The Basel approach is along thelines that the existence of the promise to sell back means that the original sale is nolonger a “pure” sale, and therefore it is caught by the rehypothecation restrictions.
But these criticisms risk overlooking three significant counterarguments. First, assubsequent litigation has revealed, the UK broker Lehman Brothers InternationalEurope (LBIE) appeared to have broken the UK rules on client asset segregation. Incertain cases, it appears that LBIE had not been properly segregating client property.Quantitative limits on reuse do not protect clients whose brokers do not follow therules. Second, it could be argued that Lehman clients who had voluntarily agreed togive broad rights of reuse in their prime-brokerage contracts essentially got what theybargained for when LBIE failed. Those clients (for the most part, professional andsophisticated counterparties) had misjudged the counterparty credit risk on Lehman,but they had not been cheated any more than an uninsured depositor is “cheated”by a failing bank. Third, the supposed uniqueness of the UK legal regime is perhaps
7 A key reason why hedge funds may have previously opted for funding in Europe is that leverageis not capped as in the United States via the 140% rule under Rule 15c3–3. In the United States,the SEC’s Rule 15c3–3 prevents a broker-dealer from using its customer’s securities to financeits proprietary activities. Under this rule, the broker-dealer may use/rehypothecate an amount upto 140% of the customer’s debit balance (ie, borrowing from the broker-dealer). As an example,assume a customer has US$500 in pledged securities and a debit balance of US$200, resulting innet equity of US$300. The broker-dealer can rehypothecate up to US$280 of the client’s assets(140%�US$200). Created by the Securities Investor Protection Act (SIPA), the Securities InvestorProtection Corporation (SIPC) is an important part of the overall system of investor protection inthe United States. SIPC’s focus is very specific: restoring securities (rather than cash) to investorswith assets in the hands of bankrupt brokerage firms (eg, Lehman). MF Global is a useful recentprecedent.
www.risk.net/journal Journal of Financial Market Infrastructures
82 M. Singh
overplayed: the types of counterparties that go to London, rather than Frankfurt orParis, do not do so for any unique features of UK law. In fact, the strong legal basisfor title-transfer financial collateral actually has its roots in English law, which alsounderpins the Financial Collateral Directive of the EU. The market is in London notbecause it offers unique arbitrage but because UK courts are viewed as having a longhistory of contractual adjudication and legal principles.
DECLARATION OF INTEREST
The authors report no conflicts of interest. The authors alone are responsible for thecontent and writing of the paper. The views expressed are done in a personal capacityand should not be reported as representing the views of the IMF or IMF policy.
REFERENCES
Baklanova, V., Caglio, C., Cipriani, M., and Copeland, A. (2016). The US bilateral repomarket: lessons from a new survey. Report, Office of Financial Research.
European Systemic Risk Board (2014). An analysis of the ESRB’s first data collection onsecurities financing transactions and collateral (re)use. Occasional Paper 6, September,ESRB.
Gourinchas, P.-O., and Jeanne, O. (2012). Global safe assets. Working Paper 399,December, Bank for International Settlements.
Singh, M. (2011).Velocity of pledged collateral: policy and analysis.Working Paper 11/256,International Monetary Fund.
Singh, M. (2014). Collateral and Financial Plumbing. Risk Books, London. URL: http://bit.ly/2aGBgcF.
Singh, M. (2015). Managing the Fed’s liftoff and transmission of monetary policy. WorkingPaper 15/202, International Monetary Fund.
Journal of Financial Market Infrastructures www.risk.net/journal