collection of theses andrás sugár theoretical and
TRANSCRIPT

Corvinus University of Budapest
Ph.D in Economics
COLLECTION OF THESES
András Sugár
THEORETICAL AND PRACTICAL ASPECTS OF PRICE
REGULATION THROUGH THE EXAMPLES OF ENERGY
SECTORS
Submitted for the degree of Ph.D
Budapest 2011

2

3
Department of Statistics
Ph.D in Economics
COLLECTION OF THESES
András Sugár
THEORETICAL AND PRACTICAL ASPECTS OF PRICE
REGULATION THROUGH THE EXAMPLES OF ENERGY SECTORS
Submitted for the degree of Ph.D Budapest 2011
András Sugár

4
5
CONTENTS
1. RESEARCH BACKGROUND AND JUSTIFICATION OF TOPIC........................................................... 7
2. METHODS ........................................................................................................................................................ 9
3. RESULTS AND FINDINGS OF THE DISSERTATION.............................................................................11
4. KEY FEATURES OF ELECTRICITY SECTOR WITH PARTICULAR REGARD TO LONG-TERM
POWER PURCHASE AGREEMENTS ............................................................................................................15
5. PROCESSES OF BARGAINING AND THE ASSOCIATING CALCULATIONS..................................21
6. PRICE CAP REGULATION..........................................................................................................................27
7. SUMMARY – THE CONTENT OF REGULATION...................................................................................35
8. KEY REFERENCES .......................................................................................................................................39
9. OWN AND CO-WRITED PUBLICATIONS ON THE TOPIC ..................................................................41

6

7
1. Research background and justification of topic
The dissertation examines a special slice of state regulation, the price regulation. I have been involved in this topic both in theory and in practice for ten years. Although I were primarily involved in the topic in the field of energy, I several times performed similar tasks in tele-communication sector that were in relation with administrative price regulation.
Primarily, I am a university teacher and a statistician-economist, even though I worked for the Hungarian Energy Office (Magyar Energia Hivatal) for four years, where among oth-ers I had the responsibility to provide for the theoretical founding for price regulation and to assist in solving the occurring methodological problems. I have regularly provided assistance to the Hungarian Energy Office and the National Communications Authority (Nemzeti Hírközlési Hatóság) in theoretical issues of price regulation.
These practical works raised such problems, the solution of which required researches and the thorough knowledge of literature. The abovementioned are the basis of my disserta-tion, which deploys several practical cases in addition to theoretical explanations. The disser-tation is the summary of my researches made so far in this field, which may be significant from the viewpoint of economic history in addition to its practical benefits.
Certainly, I have not always conducted the relevant researches alone. At the Hungarian Energy Office, as the head of Economic Department, I cooperated with the colleagues of the department, and had a close professional relationship with the Price Department. At the uni-versity, we founded the Regional Energy Research Centre (Regionális Energiagazdasági Ku-tató Központ), which delivered important theoretical and practical projects in the last five years. It is not necessary to list the studies and analyses written in the framework of the re-search centre (as much as 25 researches in the last years) since these can be found on the homepage at www.rekk.eu.

8

9
2. Methods
In the dissertation, I essentially used descriptive, statistical, econometric, economic and politi-cal economic analysis methods. The nature of the topic requires a multifarious approach.
Descriptions on market structure (electricity and gas) are based on researches performed together with colleagues. All of the calculations are from own source, and even the methodol-ogy of the regression method of temperature adjustment is an own development, although now it is already used by several companies for preparing schedules1.
I played an active role in the elaboration of the Hungarian price regulation both in the field of energy and telecommunications. Although I do not go into details with regard to tele-communications, I introduce the sector’s price cap regulation because of its theoretical par-ticularity on the one hand, and the methodology elaborated by myself, on the other hand.
The first chapter describes the market structure of electricity sector, which is followed by the history of price regulation in recent years. The analysis of each period contains the thorough examination of a certain problem that I regarded as important in the given period, since the issues being in crossfire of debates changed rapidly even during this short period of time. This chapter gives also an overview of the price cap regulation in telecommunications.
The following chapter is of theoretical nature. Although this is not a regular order, I be-lieve that after learning practical problems it is more clear to understand the given theoretical argumentation reacting on practical problems and reflecting to contradictions. The theoretical section also contains a historical description and a summary of microeconomic nature. This section contains a few own statistic calculations, however, these are purely to illustrate the given theoretical problem.
References to legal provisions, the description of the market structure of gas market (for being very similar to electricity I have not placed it into the main part of the text, still, inter-ested readers can learn the differences and the background of regulation) and the brief intro-duction of WACC and CAPM models can be found in the appendix. The two models are used in the course of regulation, and their inclusion in the appendix is necessary being a theoretical background and a starting point to the bargain expounded in the dissertation.
1 Schedule in electricity sector is a forecast for the following day in quarter hourly breakdown. Any deviation
from the schedule is sanctioned.

10

11
3. Results and findings of the dissertation
In the following, I highlight the results I consider own research results.
1. Regression methodology of examination of temperature, temperature adjust-ment and scheduling on a regression basis.
2. Significant contribution to the practical methodology of price cap regulation
both in the field of energy and telecommunications.
3. Periodisation of price regulation.
4. Original formulation of the content of price regulation including an interpreta-
tion in the case of liberalisation, which is totally different from the mainstream
interpretation.
5. Formulation of the recent content of price regulation and its linking with the
previous periods.
6. Interpretation of Ramsey-pricing, original examination of peak period pricing
with an aim to reveal contradictions.
Exposition: The dissertation essentially explains a few theoretical and practical aspects of price
regulation. The topic of the dissertation is not price regulation in general. It presents the
price regulation models of public utility undertakings providing universal services through the samples of energy and telecommunications sectors in particular.
Economic theory and practice have most contra dictionary views on price regulation. • There is a debate whether prices should be regulated in any way at all or the regula-
tory role of market is the most appropriate of all the solutions. • Once prices are regulated, on what basis and with what technique to regulate them. • Although it may be more important than the previous question, it is still raised more
seldom: what is the cause behind the necessity that prices have to be regulated, and how the applied methodology should adjust to it.
Legally, only those sectors may apply administrative price regulation that are specified
in the Price Act of 1991. The Act indicates two levels to differentiate. One is state regulation of prices (electricity, gas, railway, given postal services, given parts of telecommunication) and the other is price setting by local governments (water, sewage, waste, chimney-sweeping, district heat, funeral services). In sectors not listed by the Price Act, administrative prices cannot be applied. Potential market abuses, collusions and cartels fall under the competence of the Hungarian Competition Authority (Gazdasági Versenyhivatal), which may (and does) conduct inspections on the given fields.
The dissertation primarily seeks to answer the question, why to regulate or not regulate prices and what is the economic content of regulation, respectively. In addition to the theo-retical questions of regulation, a few practical problems and their statistical aspects are ad-dressed in details, as well.
Two positions are analysed from theoretical point of view and based on historical ex-perience:
� The first says that regulation is a force. The state is forced by the price increas-
ing effect of natural monopolies in the interest of the protection of customers and improve social welfare,

12
� The other considers regulation a bargaining process, which may end in a consensus like in a game theory model, which may result in an equilibrium under given condi-tions.
With regard to the regulation of electricity, I included the description of the process of
market opening since the history of price regulation in the various sectors has a strong rela-tionship with introducing market. EU directives ordered a full market opening until 1 July 2007, and in fact, there is a significant progress made in the process. Therefore, in the case of electricity market, I present the transitory market model then the process of price regulation. I do not go into details with regard to gas market and telecommunications (however, the de-scription of gas market can be found in the appendix), I only draw the attention to the differ-ences.
It worth paying attention to the historic periods of price regulation playing an important role both in the theoretical and the practical explanations. Identifying historic periods is par-ticularly important in Hungary, where the various sectors were suddenly faced price regula-tion after 1990 therefore solutions relevant only in certain periods were mixed and imple-mented at the same time, and often deteriorated each others’ effect. I defined the following periods of price regulation (own typology):
Period 0: Period before itemised price regulation, when the key problem is monop-oly, which is in strong relation with price control. Typically, it lasted from Mill – refus-ing Smith – until the Great Depression. Main orientation is anti-trust acts.
Period 1: Period of New Deal and the welfare state. This is the period (golden age) of direct price regulation, when a new role of the state evolves. Regulations are typically conducted by state offices responsible for the specific control, often the determination or guading of prices. Period 2: Crisis of the welfare state, mainly in the years of 1980 to 2000, the period of deregulation and liberalisation. Since the state’s regulatory role raises several problems (asymmetric information, over evaluation, rigid prices, lack of market compe-tition and innovation), the liberalisation of the sector starts. Liberalisation particularly means freeing prices and the strengthening role of energy exchanges (the latter relates only to the power market since the operation of gas exchanges – hubs2 – are very lim-ited, gas prices are typically indexed to oil, however, there are significant free market mechanisms – eg. auctions – within countries. Period 3: Liberalisation also seems to raise several problems. A part of economic lit-erature for example considers California crisis at the beginning of the 1990s a great failure of liberalisation (although I do not share this opinion as it turns out from the fol-lowing sections), however, the scandals (eg. Enron scandal in addition to the former) repeatedly raise the issue of a stronger state. This is, however, a totally new relation-
ship between state and companies, which is characterised by bargains between the two players. Lobbysts appear in the various sectors, or with regard to Hungary, a com-munication starts between authorities and companies. This communication has its Hun-garian specialties compared to the American model, but still is a communication (bal-anced or unbalanced), a compromise and an agreement. The point is the companies’
active participation in price regulation. 2 A hub is a physical point where several gas pipelines are connected. At hubs, there may be available spare
capacities of significant quantity and not booked by any buyer that can be sold on a market basis. In Europe there are five major hubs including the closest Baumgarten hub.

13
The sections of the dissertation were prepared between 2005 and 2010 therefore the fig-ures of the given chapters relate to different periods. However, calculations generally are to back a theoretical thesis or the practical applicability of a technique, therefore the analysed period is less relevant from the viewpoint of the topic.

14

15
4. Key features of electricity sector with particular regard to long-term
power purchase agreements
The development of electricity sector is determined by the process of market opening and deregulation. Principally, each customer may freely buy electricity since 2008, even though international experience shows that supplier switching will be less characteristic of residential and other small customers still for a long time. In addition, it is a special Hungarian feature of the price system that price of electricity (and more typically the price of gas) are influenced by politics that is individual considerations (social policy, preserving investors’ confidence, attaching to political promises) in addition to economic aspects. These, however, hinder real price conditions from evolving.
Prior to the crisis, the trend of electricity consumption showed a stabile annual increase of 1.6%, however, the specific figure of some years strongly deviated from this trend because of the effect of the weather. Consequently, the rise in consumption means a balanced market only in the medium and long term. The crisis broke the trend, and resulted in a decline in elec-tricity consumption already from the second half of 2008.
On production side, large power plants are determinant. Paks satisfies 35% of the Hungarian consumption, while the subsequent largest four power plants accounts for 50%. However, the number of small power plants are dynamically growing. On the one hand, small
power plants include co-generation gas engines, which produce electricity in addition to heat, therefore operate with high efficiency, and power plants generating electricity from re-
newables. With regard to both groups, the scheme of obligatory feed-in eliminates every generation market risk, and ensures a higher feed-in price. In the case of co-generation power plants, higher feed-in prices may be projected to the future with a higher uncertainly, while high feed-in prices in the case of renewables will last even for a long term thank to EU provi-sions. Co-generation plants would theoretically have lost their price support from 2010, but a lobby based on a very strong collaboration of the political parties MSZP and Fidesz hindered it by legislation at the end of 2010.
The new Electricity Act came into force on 1 January 2008. The new act provided for the full market opening on the one hand, and fixed the MVM’s monopol position, on the other hand. In the course of 2008, the Prime Minister made several but unsuccessful attempts to change this situation. The new act also made the changes of prices unpredictable. This is tinged by the fact that the regular four yearly cost review of companies, which sets the starting price levels for four years, took place in 2008, and was cut into two by the eruption of the crisis therefore its results are doubtful.
As a summary of the above, it is a characteristic of the electricity sector that several separate (according to ownership) actors must constitute a uniform system in a country.
Key actors • Power plants (generators), including large and small power plants; • System operator (MAVIR ZRt.), which operated as an independent company limited
between 2003 and 2005, then became a part again of MVM in 2005, now includes transmission network, as well;
• A trader Holding (Magyar Villamos Művek Zrt.), which owns both power plants and a free market trader, and contracts a large proportion of the production of other power plants by long-term power purchase agreements and their successor agree-ments;

16
• Successors of former electricity suppliers being in the hand of one owner but legally unbundled, which have a distribution, a universal service provider and (sometimes more) trading companies;
• Other electricity traders; • Customers (households and a few other small customers as customers eligible for
universal service and free market customers, respectively, including public institutes as a special segment),
• Regulatory authority(ies)
Generators produce electricity and feed it in the transmission and distribution network, respectively. Currently (in 2010), there are 18 licensed large generators in the electricity sec-tor. Licenses are issued in line with the Electricity Act by the Hungarian Energy Office (Mag-yar Energia Hivatal) for a determined period of time. In accordance with the act, only power plants exceeding a given capacity are subject to license, small power plants are not subject to such license. The number of small power plants was as much as 300 at the beginning of 2010.
There is a special concept, the stranded cost that appeared typically in the electricity sector. Although this primarily relates to generation that is the supply side, it determined the purchase prices of public utility market and the whole system of administrative price regula-tion in a long run, therefore I give a detailed explanation on stranded costs. (Stranded cost existed by law only between 2003 and 2010, but no compensation was paid under this title either in 2008 and 2009.)
In international practice, stranded costs include the costs that incur as a consequence of market opening and would not incur otherwise, it is therefore reasonable to reimburse these costs to market players. Stranded costs also include the costs the return on investment of which could have been expected at the time of planning the project but finally became much slower or totally impossible due to changes in legislation that took place in the meantime.
Each changes in legislation result for the circle of given players of the economy in un-expected new costs or decreasing return on investment relative to the business plan of the pro-ject. The fact that there is not any news on the stranded costs and their reasonable reimburse-ment for dentists, bakers or cement factories is thank to the significantly different interest rep-resentation ability of the various sectors and companies.
The European Commission took a position in a decision in relation with the stranded costs as state aids incurring in the electricity sector. A similar concept in gas sector was not needed, (however, certain elements of stranded cost were applied in the Hungarian Gas Act). Here, we outline four key points of the position:
• Obligations or guarantees among the undertakings of the same company group may
not be qualified as stranded costs (this is a rule).
• Stranded costs may not contain any profit or added value deriving from obligations
or guarantees.
• The contribution charged for any groups (eligible or non-eligible) may not exceed
the share of stranded costs to be compensated that is in compliance with the market
share projected to customers.
• In order to avoid any accumulation of support, the Member State must in advance
undertake not to pay any aid or support for restructuring to companies that obtain
support for repaying stranded costs. The Commission is in the opinion that those
payment that aim to compensate stranded costs of asset investments not providing
for long time viability fail to ease the transition of electricity sector to liberalised
market and therefore may not gain any aid specified under Article (87)(3)(c) of the
EC Treaty.

17
Most frequently, costs incurring in relation with shutdowns of power plants are reim-bursed. In the international practice, stranded costs are reimbursed to power plants. In Hun-gary, stranded costs incur because of long-term power purchase agreements (PPAs).
Stranded cost defined in Section 1 of Article 3 of the previous Electricity Act of 2001 is as follows:
’stranded costs: the financial claims of public utility wholesale licensee arising from the
entry into force and implementation of the provisions of this Act subsequent to the re-
negotiation of long-term contracts specified in subsection 23) as defined in separate
regulations, or deriving from the take-over of electricity co-generated with the use of
coal – but not exceeding the compulsory heat supply limit – before 31 December 2003,
which are recognized by law, but cannot be claimed in the price of electricity. Stranded
costs may not be claimed on any other legal grounds.’
Accordingly, stranded cost may incur because the public utility wholesaler has currently
effective long-term power purchase agreements, the renegotiation of which failed or successes but only in part, thus the public utility wholesaler contracts more capacities than it needs in the public utility segment.
The old Electricity Act intended to prevent from the non-transparent sale of the con-tracted capacities by the provision that the public utility wholesaler may not claim the reim-bursement of stranded costs for the quantities sold in a non-transparent way. However, the enforcement of this provision is difficult.
In accordance with the governmental decree 183/2002. (23.08)3 MVM was obliged to initiate renegotiation of purchase quantities determined in long-term capacity booking and power purchase agreements (PPAs) – so attempting to moderate their disadvantegous market effects. None of the power plants accepted for a long time (in the first four years) the initia-tion to renegotiate the quantities of capacities booked in the public utility segment and of elec-tricity purchase guaranteed in public utility segment, with the aim to reduce these quantities. In the meaning of Section 3. b) of the above governmental decree, if initiations to renegotiate PPAs fail, MVM may sell their contracted generation capacities remaining beyond public utility supply obligation through public auction. In this case, the government pays to MVM the difference between the purchase price paid by MVM for the electricity and the price of further selling of the electricity.
Stranded costs are paid by end users in the form of stranded charge constituting a part of system operation charge, and is handled by the system operator on a separate account. The public utility wholesaler submits its claim for stranded costs, which is supervised by Hungar-ian Energy Office, and based on the proposal of the Office, the Minister of Economy and Transport determines the size of stranded cost.
The Table below shows the size of the tariff component included in prices for covering stranded costs, the size of source the tariff component provided in the various years and the proportion of that used by MVM.
3 Government Decree 183/2002 on the detailed rules of the definition and handling of stranded costs. The ma-
jority of the content of this decree was prepared by myself when I worked for HEO, where I was also respon-sible for the supervision of auctions.

18
Table 1. Stranded charges in the tariff system from 2003 to 2005
Stranded cost Fact 2003 Fact 2004 Fact 2005 Charge included in prices (HUF/kWh) 0.15 0.22 0.30
Collected sum (billion HUF) 4.5 7.4 10.0
Deferred sum from the previous year (billion HUF)
- +0.6 -1.5
Effective payment (billion HUF) 3.9 9.5 13.4
Source: MEH
The figures of the Table reveal that between 2003 and 2005 MVM calculated with a
loss in the auction roughly as much as the size of the source provided from the collected stranded charge.
The supply of public utility customers continued to be based on a single buyer model – and within the framework of the former system of price regulation. Public utility customers may buy electricity exclusively from the public utility supplier of his territory, and public util-ity suppliers may buy the electricity required by its public utility customers exclusively from the public utility wholesaler MVM. The only significant change concerning the public utility segment was the termination of the regulation of generation prices from the beginning of 2004, which was introduced again in 2006 – primarily because of political reasons.
In the summer of 2003, the European Union issued the new Directive 2003/54/EC con-cerning the regulation of electricity market. Several provisions of the then effective Hungarian legislation had to be amended in order to be in line with the requirements of the Community’s new Directive. For instance, the exclusive role of public utility wholesaler is not in line with the EU principle that says that monopole rights may be created by law only in exceptional and thoroughfully justified cases. The requirement of legal harmonisation forced out the deregula-tion of public utility wholesale, and the ’hybrid model’ was replaced by the market model based on the full deregulation of wholesale. Although this resulted in an artificial division of the wholesale market − which had a favorable impact on the transparency and the liquidity of the market − the supply still remained highly concentrated because of the relatively un-changed contractual structure.
These picture has been changed by the procedure launched by the European Commis-sion, which inspected the long-term PPAs in the fall of 2005. The Commission found that the monopoly MVM concluded agreements with such power plant companies that intended to invest in Hungary. In virtue of the agreements, MVM is obliged to buy a fixed amount of electricity at a fixed price, so ensuring a riskless return on investment for the owners of the power plants. The profit was also guaranteed by the agreements. This in all may deter new market players in the EU’s view. Most of the long-term PPAs will expire between 2010 and 2020.
A crucial question is whether a not state owned equivalent of MVM may conclude such agreements. In other words, whether effective market processes could lead to similar situa-tions. The inspection gave an impetus to the successful renegotiation of the agreements. How-ever, renegotiations and the possible termination of the agreements that is liberalisation did not always result in a direct price decrease, only improved the transparency of the system.
The Act LXXIX of 2005 on electric energy outlines a liberalised energy market by fur-ther eliminating market barriers. Based on the Act, all the suppliers, traders and customers are eligible to purchase electricity on the free market at an agreed price from 2007. Universal service providers sell power to household customers at administrative prices. The Act defines

19
a new market player, the last resort supplier, which is a new form of state supply obligation. (Supply must be provided if the universal service provider goes bankrupt!) The Act handles relevant markets and gives the opportunity to regulate dominant players or the ones having significant market power on given submarkets. The coming into force of the new Electricity Act theoretically has created new conditions since 1 January 2008.
The main features of the new situation are the following:
• Free supplier switching, 100% market opening.
• Universal service for household customers backed by a last resort supplier. (House-hold customers may freely switch supplier, but for the time being there are practi-cally not any suppliers to choose from.)
• Customers other than households and small enterprises have no right to return to universal service.
• Free wholesale, free purchase for universal service providers (end of single buyer model)
• Public auctions of spare capacities
• System use and universal service prices are administrative prices, mainly posterior control
• Features, regulation and annual review of SMP (companies representing Signifi-
cant Market Power)
• BUT!!! The Act fails to provide for PPAs, and MAVIR remains within MVM.

20

21
5. Processes of bargaining and the associating calculations
This chapter gives a closer look at temperature adjustment and capital cost calculation. The English version outlines only a few elements of temperature adjustment.
Changes of consumption are influenced by changes of temperature. Accordingly, a real picture of consumption is gained only by calculating temperature adjusted changes.
In the course of this calculation, the effect of the fluctuation of temperature is excluded. We take eg. the mean temperature of the last 40 years and replace fact temperature figures by this mean. This is the time-series of the temperature adjusted consumption. (The calculation may be based on a regression model explaining electricity consumption also with temperature, but there are more simple methods, as well.)
The temperature adjusted time series show a relatively steady growth on average of 1.6% annually except for the years of 2008 and 2009, which were already characterised by the crisis, when electricity consumption fell back parallel to GDP. This trend, however, hides rather different tendencies by sectors. Although sectoral data of 2009 are not yet available, suppliers’reports reveal that it is the consumption of the industry that declined radically, while residential consumption essentially remained unchanged.
Rise of consumption in the summer is always higher than in other seasons and has a higher standard deviation, as well. Consequently, the share of electricity consumption in the summer compared to total annual electricity consumption is increasingly growing year by year.
The crisis is expected to be followed even by a significant growth in electricity produc-tion because of two reasons. On the one hand, crisis is generally followed by Jánossy’s recon-struction period (since the production structure remains unchanged), and on the other hand, consumption may increase to a larger extent, by as much as 2% annually in the residential and communal sectors. In these sectors, the main drive of growth is the spread of air conditioning.
In given sectors like electricity and gas, regulation takes place as follows. In the course of a cost review, a justified income mass is determined for the whole of the sector, and for companies, respectively. Then this amount is tarifficated that is devided by the forecasted size of consumption (separately in each segment). Here, the amount taken as basis is of crucial significance, since a smaller quantity results in a higher, while a higher quantity induces smaller tariff rates. In addition, in the case of electricity and gas, consumption strongly and in various ways depends on temperature.
Temperature also influences several economic and social events. The basic question is the direction, intensity and the possible methods of its demonstration.
It is a typical phenomenon in the case of gas consumption that in a given period of time there is a very strong reverse linear relationship between temperature and gas consumption. The colder is the weather, the more gas is used for heating. Last years could be relatively for-mally characterised by the following relationship. Assuming that other factors are unchanged, if temperature falls by one oC in winter months, the average daily gas consumption grows by 1.5-2 million cubic meter. Increasing temperature after a given period of time makes heating redundant, and in warm periods the size of gas consumption stop depending on the size of temperature.
When analysing gas consumption, it is a crucial question what is the threshold value over which gas consumption stops depending on temperature. Experience suggests to gener-ally assume a value around 16 oC, although our last years’ modeling show that this threshold is slightly increasing. A traditional tool for measure the effect of temperature in gas consump-tion is the application of degree-days. A degree-day is the cumulated sum of the degrees be-

22
low the threshold value in a given period of time (generally in a month). The size of consump-tion is traditionally explained and adjusted, respectively, by this sum.
In the case electricity consumption, the relationship is two-directional, negative in cold periods and positive in warm ones, due to heating effect in winter and cooling effect in sum-mer.
Gas – degree-days
Traditionally, the relationship between consumption and temperature can be best described on the basis of the so-called degree-days. Degree-day is a deviation from a threshold value, since gas consumption increases if the weather is cold but warm weather does not have any direct effect on the size of gas consumption (contrary to electricity).
The figure below shows the relationship between the daily mean temperature and the size of gas consumption between 2004 and 2008.
Figure 1. Relationship between daily mean temperature and gas consumption
between 2004 and 2008
0
10
20
30
40
50
60
70
80
90
100
-15 -10 -5 0 5 10 15 20 25 30 35
Threshold
Temperature
Consumption
Sources: own calculation based on FGSZ
The question is what the threshold value should be, over which the quantity stops to de-pend on temperature. Using an optimalisation algorithm (which exemines how well tempera-ture explains the quantity of consumption in the case of various threshold values), the thresh-old for the period between 2004 and 2008 is the traditionally used 16 degree Celsius also ac-cording to my calculations.
To forecast, we take into account the effect of temperature in two steps. In the first step, we exclude the effect of temperature. To do this, we explain consumption with regression, than substitute temperature with the annual degree-days of 2500 on the average and estimate consumption on the basis of these degree-days. This temperature adjusted consumption shows what the size of gas consumption excluding the fluctuation of temperature would have been, which is shown on the following figure.

23
Figure 2. Effective and temperature adjusted gas consumption, million cubic meter,
1990 to 2007
9500
10500
11500
12500
13500
14500
15500
1989
1990
1991
1992
1993
1994
1995
1996
1997
1998
1999
2000
2001
2002
2003
2004
2005
2006
2007
Consumption Consumption with correction
million cubic neter
év
Source: Own calculation
It can be seen that gas consumption grew from 1992 to 2003 excluding the effect of
temperature. This trend stopped in 2003 and has been stagnating and slightly decreasing, re-spectively. This phenomenon has several explanatory factors, which are described later in brief, since these factors will be taken into account also in the case of prediction. Electricity Modeling based on daily figures Temperature and other dependencies are usually handled with two modeling techniques in the case of daily figures. One is the regression technique including linear recession model. In this case, explanatory variables may be trend variables following a long-term tendency or external variables (eg. monthly time-series of industrial production) or binary variables handling sea-sonality (dummy variables with value 0 or 1), which help to handle seasonal effect within a week and a year like holidays.
Two further variables are included in the model. One is to explain electricity used for lighting. This variable is the proportion of the period from sunrise to sunset compared to the full length of a day. Similarly to seasonal variables, this is fully deterministic, iterating with annual periodicity. The other variable is the effect of temperature. In fact, this is t he only stochastic element depending on a random factor among the explanatory factors. Based on the above, this cannot be handled with one variable because its effect is not one directional. Our model consists of three variables:
• A dummy, binary variable, the value of which is 1 in the summer months and 0 in the remaining months,
• A variable containing temperature,

24
• And the multiplication of the above two variables, which is the so-called interaction.
The associating parameters are interpreted later in the case of the specific estimations. When using regression technique, it must be taken into account that the database of the
analysis consists of daily time series, i.e. time series regression estimations are made. When doing so (like in our case), if estimations are based on the traditional principle of the least squares residuum’s often fail to be independent, which distorts parameter estimation. This problem may be solved in two ways.
On the one hand, one-day lagged values of the explained variable Y (in this case the electricity consumption) i.e. an autoregressive term is included. Logically, this means that today’s electricity consumption depends not only on deterministic factors and the temperature but to a certain extent also on the level of the previous day’s consumption.
The other typical solution is that the lagged value of not the whole variable is included in the model but only the previous period’s random estimation that is the moving average term. Logically, this means that today’s consumption depends not on the level of the previous day's consumption but only on the deviation from the level prognosed by regression that is the random effect.
In our case, both methods handle residual autocorrelation. An autoregressive model gives more accurate prognoses (determination co-efficient takes higher values), but in fact not allows the interpretation of parameters, because the size of consumption also depends on the level of the previous day’s consumption. Thus, the results of parameter estimation are con-strued on the basis of the model extended with a moving average term, while estimations are made on the basis of an autoregressive model.
Estimation of temperature adjusted consumption is calculated as follows. We estimate the model parameters and replace temperature figures with the mean daily temperatures of the previous 40 years assuming that other variables remain unchanged. These values are consid-ered the values of temperature adjusted consumption, that is the consumption values that are independent from the effective short-term temperature effects.
In addition to regression technique, another tool for modeling with similar purposes is neural networks. (This tool was applied earlier by MVM and MAVIR, respectively.) An ad-vantage of neural networks is that they can model not only linear or easily linearizable rela-tionships but they are more general. Their disadvantage is, however, that results are more dif-ficult to interpret due to their ’black box’ nature. Regression results In the following, we present the results of regression runs in details. In the introduction, we already listed the variables and time series regression techniques applied. The specific ex-planatory variables are the following.
25
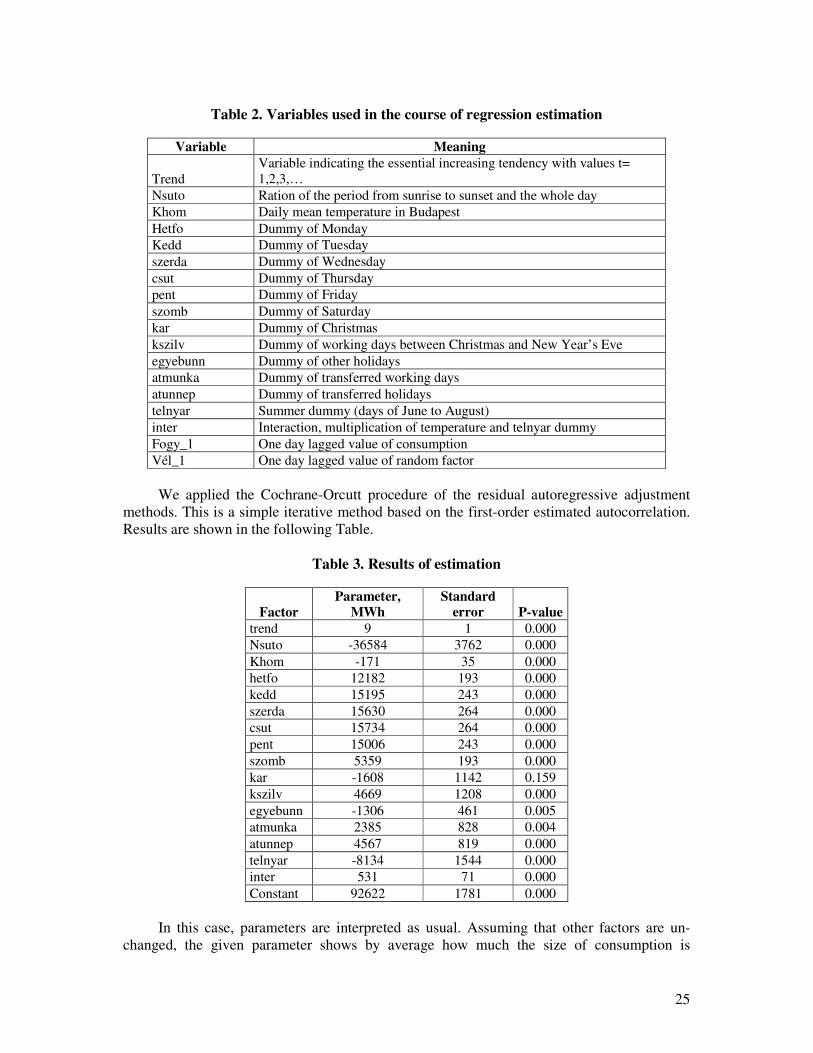
Table 2. Variables used in the course of regression estimation
Variable Meaning
Trend Variable indicating the essential increasing tendency with values t= 1,2,3,…
Nsuto Ration of the period from sunrise to sunset and the whole day Khom Daily mean temperature in Budapest Hetfo Dummy of Monday Kedd Dummy of Tuesday szerda Dummy of Wednesday csut Dummy of Thursday pent Dummy of Friday szomb Dummy of Saturday kar Dummy of Christmas kszilv Dummy of working days between Christmas and New Year’s Eve egyebunn Dummy of other holidays atmunka Dummy of transferred working days atunnep Dummy of transferred holidays telnyar Summer dummy (days of June to August) inter Interaction, multiplication of temperature and telnyar dummy Fogy_1 One day lagged value of consumption Vél_1 One day lagged value of random factor
We applied the Cochrane-Orcutt procedure of the residual autoregressive adjustment
methods. This is a simple iterative method based on the first-order estimated autocorrelation. Results are shown in the following Table.
Table 3. Results of estimation
Factor Parameter,
MWh Standard
error P-value
trend 9 1 0.000 Nsuto -36584 3762 0.000 Khom -171 35 0.000 hetfo 12182 193 0.000 kedd 15195 243 0.000 szerda 15630 264 0.000 csut 15734 264 0.000 pent 15006 243 0.000 szomb 5359 193 0.000 kar -1608 1142 0.159 kszilv 4669 1208 0.000 egyebunn -1306 461 0.005 atmunka 2385 828 0.004 atunnep 4567 819 0.000 telnyar -8134 1544 0.000 inter 531 71 0.000 Constant 92622 1781 0.000
In this case, parameters are interpreted as usual. Assuming that other factors are un-
changed, the given parameter shows by average how much the size of consumption is

26
changed by a unit change of the factor variable. The basis of comparison is Sunday both in the case of week days and holidays.
The trend effect is significant, i.e. assuming that seasonal effects are unchanged, con-sumption grows daily by 9 MWh on the average. Alike temperature the share of the period from sunrise to sunset within a day also has a significant effect on the size of consumption. With regard to temperature, it is worth having an overview of the parameters of all the rele-vant three variables.
-171*KHOM-8134*TELNYAR+531*INTER Variable telnyar is 0 in the case of a period from September to May and the interaction is 0, as well. For instance, parameter -171, which is the winter effect of temperature, means that if temperature is 1 degree lower, the size of consumption grows by an average of 171 MWh (assuming that other factors are unchanged). In summer, the value of interaction is 1, which means that the average consumption level is lower, however, the effect of temperature is rela-tively stronger, -171+531=360, i.e. each degree increases the average size of consumption by 360 MWh.
The explanatory power of the above model is 82%, the DW-statistics is 1.9, and the value of the estimated residual autocorrelation is 0.749.
A very important part of the dissertation is the periodization of market regulation and
the description of the given periods. Periodization can be found in the beginning of this draft,
but is skipped here due to lack of space despite of its importance.

27
6. Price cap regulation
One of the central issues addressed in the dissertation is the analysis of price regulation. I have performed considerable own research in this field, and I have contributed to the elabora-tion of various analysis methods.
One of the most widespread methods of price regulation is the price cap regulation. This is as a matter of fact a technique that spread in Period 1, but since this is one of the central parts of my theoretical and mainly empirical work, I devote a separate chapter to it. In this case the regulation restricts the measure of price increases in given4 frequency, i.e. regulation is practically a form of indexation. The general formula of indexation (the maximum price increase, in %) is:
XPP −= infmax
where Pmax = the upper limit of the average rate of price increase (price factor), %, Pinf = the rate of inflation (inflation factor), % X = efficiency improvement factor, %5
If, for example, we assume a 5% inflation and a 3% improvement of efficiency (productivity), then the upper limit of average price increase is 2%. (One can see that the upper limit can be a negative number as well. In this case the prices of the sector have to be lowered in average).
The principle of price cap regulation appears in Hungary both in energy and telecommunications price regulation.
The price cap regulation in the field of energy supply is of ex ante nature; this means that decrees provide that price changes must be in line with the price factor expected in the future. The inflation rate is the forward-looking annual consumer price index of the Hungarian National Bank, and factor X is a question of bargaining, but its value varies between 0.6% and 0.7% for electricity as an example. If, for example, the inflation forecast of the Hungarian National Bank is 5% and the value of X is 0.7 then the rate of average increase can be 4.3 at most. The increase of individual prices is determined by the decrees of the price authority. The price authority ‘allocates’ this average price increase to the 100 different tariffs in a way that the Laspreyres-type effective price index weighted with the values of the previous year gives the maximum price increase rate set in the price regulation.
In telecommunications, the price regulation is of ex-post nature. The inflation factor is forward-looking as well, but the planning value specified in the budgetary act must be taken as a base. If the real consumer price index of the Hungarian Statistical Office is different from the forecast of the previous year, the inflation factor has to be adjusted with 2/3 of the difference. Factor X is 3% as per the current regulation, i.e. this is a relatively significant efficiency improvement factor set by the relevant ministerial decree. If the forecast is 6% for the base year and 5% for the actual year and the factual number of the Hungarian Statistical Office is 8% for the previous year then the value of price factor is 5+1.33-3=3.33%.
In telecommunications, the price cap regulates only the average rate of price increase. The price authority verifies the real price level change after the end of the actual year, and if a
4 L Sugár (2004) 5 As one can see, the formal definition of price cap regulation is commonly understood in a percentage point
form, and therefore it can be defined as an amount in contrast to the proportional, series-like relationships common in statistics.
28
company has increased its prices by a higher rate than allowed, the allowed price increase rate will be reduced by twice the difference for the following year.6
The price cap regulation was changed in 2005 in landline telecommunications. Price
increase rates are not verified in the circle of all the services any more, but only in the
circle of access charges. In resolution No. DH-664-69/2005 of 14 February 2005 concerning the subject of
definition of markets, designation of suppliers having significant market power, and imposing of obligations, and regarding the ‘localised access to public phone networks by household consumers’ (market 1), and in Section II.5.4 of resolution DH-664-71/2005 of 14 February 2005 regarding ‘localised access to public phone networks by non-household consumers’(market 2) NHH provided as follows:
„Concerning the suppliers designated as having significant market power, it has
imposed the obligation of the prohibition of applying unjustified high charges in accordance
with Article 109, section (1) subsection a) in the subject of obligations regarding the charges
for subscribers in accordance with Article 109 of Act C of 2003 on Electronic
Communications (Eht); if the increase of the price of the household and non-household
subscribers’ access service (subscription charge) exceeds in 2005 compared to 2004 the
consumer price index rate, then it is seen as an unjustified high price, and therefore the
Council has prohibited the charge increase over the consumer price index. Regarding the
consumer price index, the consumer price index provided (measured) by Hungarian Central
Statistical Office (KSH) for the year 2005 has to be taken into consideration. The general
justification attached to the draft budgetary act of 2005 contains the expected rate of forward-
looking consumer price index, and KSH each month forecasts the consumer price index rate,
which – as the actual year passes – forecasts the effective value of the consumers price index
with an increasing probability. Therefore it is not a disproportionate and unjustified
expectation that the suppliers continuously monitor the development of the consumers price
index and the economy, and continuously analyze and verify the expected total annual effect
of the effectively done and planned price actions, as they analyze and verify the effect of these
on the behaviour of their customers (in their business plans). According to the findings of the
Council it shall be considered as an unjustified high price if the increase of prices compared
to the prices of the previous period exceeds the consumer inflation rate.’ In the following, I will show theoretically and in a simple numerical example the
controversy of the price cap regulation defined in 2004, and the traps of its practical application.
It is an important question what are the services the price changes of which have to be monitored according to the resolution, in other words what is contained in the consumer basket the price level change of which is measured. As the resolution says it is the price change of the subscriber access price (subscription charge). Thus the services are limietd to subscription charges. Real turnover data is not available, but this covers only 45-50% of the turnover of SMP undertakings, therefore it is in fact a significant limitation. The limitation may be justified from economic point of view, as suppliers have natural monopoly with regard to the network, therefore it is worth regulating access charges. However, other services can generally not be used indepedently from subscription charges (except for public phones, where there is no access-like charge), therefore the limitation of price changes to this circle is not absolutely justified from economic point of view.
6 At the time of introduction of the price regulation it was not known by the companies what formula the author-
ity would use to verify the real price increase level; later on the authority decided to use the Törnquist price index.

29
At the same time, the question arises what we consider subscription and access charge, respectively. The subscription charge is interpreted here on the basis of the calculation method of the Office. Accordingly, two types of subscription charges can be distinguished.
One of the subscription charge types appears as a completely separate tariff element, ir-respective of whether the subscription and turnover charges are different between two possi-ble tariff packages, which would make the cross-financing probable. With regard to the calcu-lation, we include here the supplementary packages where the subscription charges can be determined easily.
In the other case, some type of benefits are connected to subscription charges. The methodology does not take into account benefits like a free device, internet access, etc., which cannot be considered publicly accessible phone services. Another type of benefits is when the subscription charge of the package in question is connected to benefits provided in turnover charges (e.g. the subscription charge is partially or fully usable for speech, or in order to com-pensate some of the benefits given for specific turnover service types, the subscription charge is relatively higher than in other cases.)
I show below a simple example to demonstrate subscription and access and their charges and prices.
The two starting points to the 2004 price regulation: • The authority controls the increase of the access price, and calculates a price cap for
it. • Access is a category indirectly derived, it is the part of the subscription charge which
is not spent on benefits. (Therefore where benefits are not connected to subscription, the access charge is equal to the subscription charge.)
In order to demonstrate the basic logic let us take a very simple example, a ‘Felező’
(Halving) package of a single subscriber. The supplier increases the subscription charge from the previous month to the next by 10% from HUF 3000, while it lowers the per minute rate (the only variable charge) by 10% from HUF 20 to HUF 18. (T-COM is just introducing such an option called ‘Dupla felező’ (Double Halving) by decreasing the per minute rates of the ‘Felező’ package.) The process is shown in the next table through a fictive example:
Table 4. An example 1.
Title base period actual period index HUF/minute 20 18 0.9 minutes 100 150 1.5 charge of calls, HUF 2000 2700 1.35 access charge 1500 1650 1.1 spent on benefit 1500 1650 1.1 total subscription 3000 3300 1.1 calls above that 500 1050 2.1 total 3500 4350 1.243
The calculation of the price index according to the logic of NHH is the following: • the average of the access charge price index and the price index of benefits is the
subscription charge price index, i.e. the access charge price index can be calculated indirectly.
• the price index of benefits is the price index of calls.
30
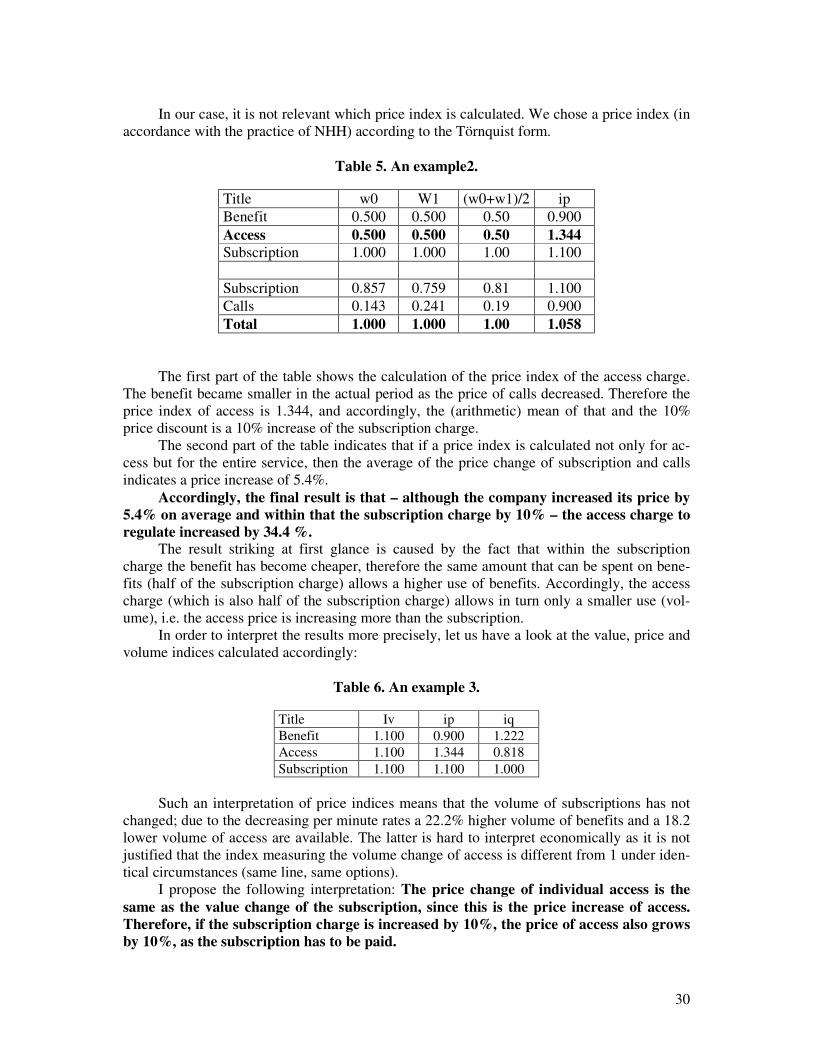
In our case, it is not relevant which price index is calculated. We chose a price index (in
accordance with the practice of NHH) according to the Törnquist form.
Table 5. An example2.
Title w0 W1 (w0+w1)/2 ip Benefit 0.500 0.500 0.50 0.900 Access 0.500 0.500 0.50 1.344
Subscription 1.000 1.000 1.00 1.100 Subscription 0.857 0.759 0.81 1.100 Calls 0.143 0.241 0.19 0.900 Total 1.000 1.000 1.00 1.058
The first part of the table shows the calculation of the price index of the access charge. The benefit became smaller in the actual period as the price of calls decreased. Therefore the price index of access is 1.344, and accordingly, the (arithmetic) mean of that and the 10% price discount is a 10% increase of the subscription charge.
The second part of the table indicates that if a price index is calculated not only for ac-cess but for the entire service, then the average of the price change of subscription and calls indicates a price increase of 5.4%.
Accordingly, the final result is that – although the company increased its price by
5.4% on average and within that the subscription charge by 10% – the access charge to
regulate increased by 34.4 %. The result striking at first glance is caused by the fact that within the subscription
charge the benefit has become cheaper, therefore the same amount that can be spent on bene-fits (half of the subscription charge) allows a higher use of benefits. Accordingly, the access charge (which is also half of the subscription charge) allows in turn only a smaller use (vol-ume), i.e. the access price is increasing more than the subscription.
In order to interpret the results more precisely, let us have a look at the value, price and volume indices calculated accordingly:
Table 6. An example 3.
Title Iv ip iq Benefit 1.100 0.900 1.222 Access 1.100 1.344 0.818 Subscription 1.100 1.100 1.000
Such an interpretation of price indices means that the volume of subscriptions has not
changed; due to the decreasing per minute rates a 22.2% higher volume of benefits and a 18.2 lower volume of access are available. The latter is hard to interpret economically as it is not justified that the index measuring the volume change of access is different from 1 under iden-tical circumstances (same line, same options).
I propose the following interpretation: The price change of individual access is the
same as the value change of the subscription, since this is the price increase of access.
Therefore, if the subscription charge is increased by 10%, the price of access also grows
by 10%, as the subscription has to be paid.

31
The ‘logical’ value, price and volume index system is the following:
Table 7. An examle 4.
Title Iv ip iq Benefit 1.100 0.9 1.222 Access 1.100 1.1 1,0 Subscription 1.100 0,995 1,106
The ‘price’ of benefit decreased, the price of access increased by 10%, the average of
the two is the price index of the subscription. (0.995 here is the average of 0.9 and 1.1. The average is not 1 despite in the case of this ‘Felező’ package the value distribution of access and benefit is 50-50%, because T calculates a geometric mean.
The volume of access has not changed (in our opinion this is logical, as the ‘amount’ paid is still the access to one line), the volume of benefit used has increased (the benefit has become cheaper) therefore the volume of subscription has also increased by 10.6%. If sub-scription is defined as access plus benefits, and the benefits alone became cheaper, i.e. their volume increased, then the amount used under the title of subscription had to increase as well. The above logic supports the idea that the price index of access is the same as the value
index of an individual subscription (the price increase of subscription), the correspond-
ing weight is the value reduced by benefits. The logic outlined above was accepted by the regulatory authority (on the author’s pro-
posal), and the access charge was redefined accordingly. In the year 2004/2005, one of the suppliers exceeded the allowed price increase rate, and therefore it was imposed a consider-able fine, due to which the company turned to the court as usual.
The basic components of the price index calculation method shaped in 2006 and the
control procedure are as follows: • Indexation is only applied to the one-time (connection, joining, transfer) charges and
to the monthly subscription charge; this is the access charge without the payment of which the customer is not able to access the service.
• The access charge itself does not depend on benefits, as the customer cannot use the service without paying it.
• It is to emphasize that the benefits on which the access charges can be spent, leave only the prices unaffected (as they do not change them in reality), but they do play a role in the setting of weights, because the use of benefits reduces the value paid for access, which is part of the weights.
• The broken period packages are basically handled by the resolution in a way that the turnover of the packages terminated or created during the year are allocated to the existing packages in the proportion of their usage, however, it is allowed to calculate it differently if there is any additional information available.
• The so-calculated access charges are used to create individual prices, which are then used to calculate individual price indices, and the changes of these are weighted with the turnover of the various tariff components, where the turnover is reduced by the benefits used.
• The resolution allows to use a so-called concentrated sample during inspection, only taking into account the packages the cumulated turnover of which exceeds 95%. In practice, this yields an easily understandable result, narrowing down the analyzed individual observations to 15 packages.

32
• the turnover-weighted average of price indices has to be calculated with the Törn-quist index formula.
The mentioned significant market power supplier objected to two things. One of them is
the way of considerations of the benefits, the other one is the handling of migration, however, the two are interdependent in the objections.
With regard to the consideration of benefits the supplier claimed that for the packages introduced during the actual year the way of handling migrations as explained above resulted in an unrealistically high price index. The argued point means for example that one of the tariff packages is a new type of tariff package different from the ones existing so far, therefore the input base year price is unrealistic, that is why we get a high price index.
The argued package – the one having a high price index – was introduced in the middle of the actual period. Other packages taking part in the calculation of the index were existing in both periods. The average subscription charge of the new packages was by 27% higher in 2005 than the subscription charge of the old ones.
The phenomenon of price discrimination as a theoretical basis of the regulation of access
In landline telecommunications, all conditions are given for the companies to apply price dis-crimination and increase their profits. The main point of price discrimination is that buyers do not face a unique price. Customers who better appreciate the product or its parts are willing to pay higher prices.
The sale of an additional unit in a multi-actor, competitive market has a dual effect. First, this reduces the price for all products sold, and it reduces the revenue for the previous unit of output as well; second it yields additional revenue for the last product unit sold. Price discrimination aims at minimizing the first effect, i.e. it aims that the lower price prevailing for additional sales has the least effect on the price of the previous output and therefore on the sales revenue, i.e. to sell it in a way that the price of the other units does not decrease.
In landline telecommunications, all course-book conditions and instruments of price discrimination of price discrimination are present. The conditions are as follows:
• The service cannot be resold. • Market dominance is present. • The willingness to pay of the consumers is well-known (from this point of view
landline (and mobile) telecommunication providers are much more informed than energy and water/sewage suppliers, as the former have computer logs at consumer level updated in each minute. It is not by accident that electricity and gas suppliers could not think in packages with regard to residential customers unless the necessary technical conditions of continuous measurement are established.)
Landline suppliers intensively use the below types of price discrimination: • Two-part pricing (this in theory ensures that the fix costs are paid universally by all,
and the volume effect is paid by all according to consumption. (In energy, the sub-scription (fix) charge is not allowed in the case of household consumers, and this amount is also small for gas in order to prevent price discrimination against the least informed group; larger customers are often charged by capacity or availability charges).
• Further quantitative benefits (e.g. ‘Felező’ package). • Bundled sales (a typical example was the practice – later declared as anticompetitive
– where the internet access was bundled with landline phone, even if no phone de-vice was working at the subscriber.).
33
• Qualitative discrimination (if consumer groups preferring higher or lower quality can be distinguished).
In landline telecommunications, first degree and third degree price discrimination is
prevailing at the same time; first degree is when fix and variable charges are separated in the way explained, while third degree means when packages appear. The third degree price dis-crimination is only based on the differentiation between consumer groups, and it provides benefits for the consumers groups having a higher price elasticity of demand.
It is worth having a closer look at the case of non-linear pricing, when the supplier can-not simply differentiate between customers; he can only classify them into types, and offers packages accordingly, assuming that there are groups having higher and lower price elasticity. The higher is the price elasticity of demand of a group, the more profitable it is for the firm to increase the fix tariff.
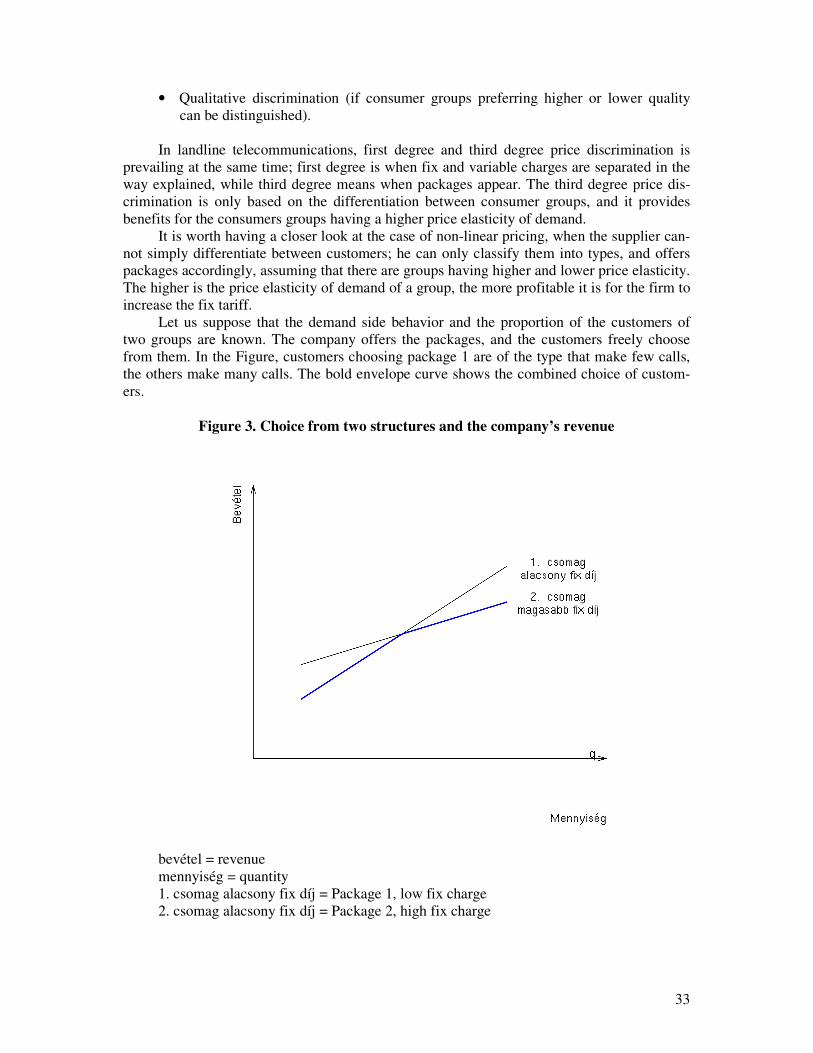
Let us suppose that the demand side behavior and the proportion of the customers of two groups are known. The company offers the packages, and the customers freely choose from them. In the Figure, customers choosing package 1 are of the type that make few calls, the others make many calls. The bold envelope curve shows the combined choice of custom-ers.
Figure 3. Choice from two structures and the company’s revenue
bevétel = revenue mennyiség = quantity 1. csomag alacsony fix díj = Package 1, low fix charge 2. csomag alacsony fix díj = Package 2, high fix charge
34
In theory, the company is aiming at a a pricing that maximizes the profit. The previous
train of thought implies that
1. the regulatory authority only sets a price limit for the access charge, since other
prices are determined through profit maximizing (and the different preferences
of customers),
2. switching between packages (from 1 to 2) is a rational consumer behavior,
which effectively increases the access charge, however, this is compensated with
regard to some of the customers due to the elastic demand, and maximizes the
profit of the company at the same time.
As the company introduced new structures in order to – as explained in the price discrimination section – discriminate groups of customers having different price elastic-
ity, i.e. to separate them; this implied a real price increase in terms of access charges.
The other benefits, cheap calls make it worth for this group of customers to pay higher access charges, but this induces a significant price increase in terms of access charge. (Again, it must be emphasized that the separation or discrimination of a new group of customers is generally an instrument of profit maximization, and this has effectively increased the access charge to be paid by these customers.

35
7. Summary – The content of regulation
The dissertation discusses in details the ‘rampage of liberalization’, then the development of a bargaining process. The limited size of this paper, however, does not allow to introduce these issues in details, therefore, I only present conclusions.
In traditional economic theory, the regulation of a sector with state instruments ‘is tar-geting to influence prices, sales, and production of companies through government instruc-tions or market incentives”. (Samuelson – Nordhaus (2000).)
Regulation may be necessary because of the following reasons: • moderation, limitation of market power in order to improve social efficiency; • remedy of information failures, to alleviate problems deriving from information
asymmetries; • handling externalities.
Opinion 1: Regulation is an economic necessity
The reduction of market power comes up in the case of industries where there are monopolies; there are too few or only one company operating on the market. Economic theory considers natural monopoly as a typical subject of regulation. Natural monopolies are considered to be the areas where the capital investment need is huge, and due to the increasing returns to scale, the operation of one than one company is not economical. These areas are mainly the public services, certain areas of postal service, the water and sewage sector, electricity, district heat and gas supply, formerly air traffic, and railway traffic, respectively. (These or some of these are still under some kind of price control. In air traffic usually only the airport services are still regulated with a price cap, however, not by all countries.) Moreover, these sectors pro-vide essential products and services, where the price elasticity of demand is low.
In microeconomic theory, perfect competition (with decreasing returns to scale) en-forces an efficient operation and equilibrium prices. Price is an exogenous condition for the company taking part in a perfect competition, i.e. the company cannot influence the price.
The most important difference of the imperfect, monopolistic market compared to the perfect one is that increasing returns to scale is prevailing, meaning the bigger the company, the more economically it operates. An extreme case is natural monopoly, where in the end only one company remains in the market, the one which can operate the most efficiently, but at the same time it becomes the sole market power in the given segment. A typical example of natural monopolies mentioned in economics is network industries, where the formation of networks leads to a very large entry cost.
Therefore, according to standard theory, the development of natural monopoly is the necessary consequence of economies of scale; the price, however, is not an exogenous condi-tion for a monopolist, he can freely change it in a free market. Microeconomic handbooks usually show graphically that in these conditions the equilibrium price is higher than in per-fect competition; which implies a lower quantity of production, therefore in the equilibrium state of the monopolist (where he realizes extra profit) the outcome is unfavorable for the en-tire society, as it is provided with a smaller quantity of products at higher prices, in other words, the monopolistic market produces scarcity, which causes social loss.
It is thus straightforward that the state must intervene in order to protect social welfare. Two models of state intervention have been developed. One is more characteristic for
Europe (France could be the primary example) and it realizes the intervention in the form of nationalization and national companies, while in the American model companies are strictly

36
held in private ownership (they generally operate in the form of public companies limited by shares), and the state only performs ‘regulatory’ activities. In the USA, a regulatory office has been operating since 1887; the energy sector became regulated in 1920, while telecommunica-tions in the 30s. In the regulated circle the state maintains its own monopolies in the form of concessions, and activities subject to license. According to the Economics by Samuelson, the extension of the regulated activities reached its peak in 1978, when 15% of the GNP was pro-duced by companies belonging to the regulated circle.
Interestingly, parallel to the regulation, where – as explained above – the state was maintaining the monopolies itself, anti-monopolistic actions were taking place. This activity spans from the 1890 Sherman Act to the anti-monopolistic litigations of the 60s and 70s (which, looking at its specific effects, has not yielded significant results).
The energy or telecommunications sector – for example –belongs to the regulated ac-tivities. The classic model of regulation – which was flourishing in the years of the 50s to the 70s – can be demonstrated for example, through the following example of the energy sector: the companies operating in the sector are usually fully integrated vertically (this means they are engaged in both electricity and gas supply, from the extraction through power plants to services, i.e. in the case of electricity everything belongs to the company from the power plant production to the last plug.) The company enjoys monopoly in a given field, it is typically a private company limited by shares, which are listed in the stock exchange, its shares are con-sidered a conservative, reliable investment, and therefore they are particularly preferred by small individual investors, and investment funds.
The two main instruments of state intervention and regulation are licensing and price regulation. Licensing encompasses both extraction and service, and it is generally a complex, lengthy procedure; the licensing of a power plant often takes for long years, which are ac-companied by inspections, public hearings and discussions. Price regulation is based on two pillars. The first pillar is the so-called cost regulation, where companies can realize the costs and the profit recognized by the authorities in their prices. The second pillar is price cap regu-lation, which, after the declaration of a starting price system, allows to increase the price to the extent of an inflation-based price index (generally the producer price index) minus the increase of productivity (if the improvement of productivity is higher than the rate of infla-tion, then a price reduction is imposed).
Summarizing the essence of the American model, in the energy market, high entry costs result in natural monopolies. Although these are privately owned, if the state does not regulate them, they set prices higher than in the equilibrium, and thus they cause a smaller product output and social welfare loss. Therefore, it is a moral obligation of the state to regulate and to set the prices on the basis of real costs, and to limit price increases to a ‘just’ extent.
Opinion 2: Regulation is a bargaining process
The standard microeconomic model is logical and handy, however, typically for all good eco-nomic theories, it is more of an instrument of ideology and propaganda for the prevailing situa-tion. The previously described model is not true to history. The development of energy sector could not happen on a market basis due to its high cost of capital and strategic importance, there-fore the state played an essential role in developing the market. (The huge costs of development of essential technologies like oil and gas turbine, nuclear energy, or the electrification of whole regions were born by the state.) The similarity and the small distance in time between the electri-fication plan of Lenin and Roosevelt is not an accident (GOELRO and the electrification of the Tennessee valley).
The strategic importance of electricity was not only based on its extraordinary relevance for the weapon industry, but also on the fact that it became a basis of the welfare state flourishing
37
in the 50s and 60s; the key sectors of development, like the car industry, machinery, aluminium industry were all built on electricity; and the electricity-based welfare and mechanized house-holds also became the symbol of welfare for the population. It is also important to note that this source of welfare must be cheap, therefore this model was accompanied by wastage. Energy firms (and generally public utilities) became in these circumstances the flagships of welfare state, as they embodied a care based on private ownership. The mechanism of state care was regula-tion; in the course of regulation, the state administration and the monopolistic company were bargaining (during which the state administration and the management of large companies be-came naturally interlocked), the result of which was on one hand a secure supply, and the appro-priate profit of the company on the other hand.
Regulation is not simply a market good. In case of some strategic sectors (like the energy industry), it is the instrument of exercising power over the companies and consumers, and of the searching equilibrium between them.
A good example of this is when a sector is not a strategic sector any more, or the effects of
regulation are politically detrimental, because they generate so much rigid institutions which prevent development. In this case, regulation has to be removed even drastically. A famous ex-ample for this is the regulation of air traffic in the USA in the years between 1930 and 1980. The strategic importance of air traffic was obvious, therefore a strict licensing and price regulation system was in place from the 30s. From 1938 until 1978, no new airline company was licensed, and prices were kept high, which was explained by the safety of flight, and supply obligations. (It was explained that in the case of a free market, companies would not provide flight to less fre-quented places.) In 1978, under President Carter, the entry was made completely free, and the prices were released. After this step, average prices fell steeply, and the usage of flights increased as well. At the same time, the safety of flights has not deteriorated thanks to market competition. The exit of the state from the sector was made possible by the fact that flying has lost from its military importance (at least from the importance of the Vietnamese-type strategy carrying big masses) and it was less dominant in transport, and in the forwarding of news, information, as new technologies have appeared.
In addition to physical actions, actions against regulated markets appeared also in the the-ory. ‘Suddenly’ economists discovered that the recognition of costs in prices can encourage companies to wastages, or it can shift their cost structure to capital intensive directions. (Al-though these theories, such as the ‘gilding’ or the Averch-Johnson effect are 40 years old, the demand for removing regulations awoke them from their long sleep.)
Through the crisis of the welfare state and the appearance of new technologies, also the electricity sector lost its previous leading role. However, the ‘flagships’ (typically public utility companies) were able to conserve the status quo to some extent as a result of their extreme eco-nomic power and their interlocking with the state administration. In other words, they became mummies left from the welfare state, which – through their power – are still very healthy. There-fore they could not have been destructed and terminated peacefully, only through great convul-sion.
There is any need to bring up-to-date examples in order to introduce the contents of regula-tion. Coase discusses the problem of lighthouses in details in one of his studies (Coase 2000). Lighthouses are brought up as examples for necessary state investments and regulation in the economic literature. In addition to two XIX century authors, Coase mentions Samuelson as an example, according to whom it is the state who has to build and operate lighthouses, because entrepreneurs would not build and operate them in the hope of profit, partially because it would be difficult to collect the charges from the seamen using the lighthouses, and also because the collection of charges would not even theoretically be fair, as all usage charges increase the profit, while there is no additional cost.

38
Coase introduces how the British lighthouse system was developed and operated. From 1566 on, when they received the right of maintaining and regulating navigational buoys, the lighthouses were supervised by the organization Trinity House established in 1514. (At that time there were almost no lighthouses, only two of them were operating.) In addition to the supervi-sion of lighthouses, this organization was performing the regulation of the pilot system and some charity activities. Trinity House was a private organization performing public tasks. In the 17th-18th centuries, the majority of towers were not built by Trinity House, but usually by private entrepreneurs. These entrepreneurs either received a specific letter of privilege from the Parlia-ment, or they rented the establishment and maintenance rights from Trinity House. Agents col-lected charges for the lighthouses in the harbors depending on the size of the ships. The towers, mainly in order to efficiently standardize the charges – were bought up by Trinity House in the 19th century, providing a huge return to the owners of the towers or for the renters of the rights. This buy-up was encouraged by a relevant act in 1836. The system operating during the entire 20th century was formed at the end of the 19th century; and was regulated by the Navigation Act of 1898. The essence of the system is that the ships pay a standard charge, which is put in a fund (the General Lighthouse Fund), which only serves the operation of the lighthouses. The duty is a standard charge depending on the type of the ship and the displacement tons value. Homeland ships pay it for 10 voyages, while foreign ships for 6 occasions; any further trips are duty-free. Charges are set annually; which is strictly supervised by the experts of Trinity House, HM Treasury (Ministry of Finance) and the representatives of the owners of the ships, therefore it is under efficient control.
The regulation of the financing of lighthouses shows well that the prevailing British sys-tem was not created because private property would not be able to operate it profitably, but in order to be able to create a just, standardised system of charges in addition to the ability to control of the buyers of the service. When having a look at the history of regulation in the past decade, we can see that in the classic regulated industries steps are made towards the system of lighthouses that has existed for 100 years. The bureaucratic regulation of Samuelson, which often serves the interest of lobby groups of companies, is replaced with social or consumer control, often through the introduction of market instruments.
Accordingly, the definition of regulation is modified in the following way. Regulation
democratically controls the prices, sales, and production of companies, and influences
these in order to achieve certain social objectives.

39
8. Key references
Smith Adam [1776]: The Wealth of Nations London Averch, H.–Johnson, L. L. [1962]: Behavior of the firm under regulatory constraint, American Eco-
nomic Review, Vol. 52. No. 5. pp. 1053-69. Baumol, W. J.–Sidak, J. G. [1994]: The pricing of inputs sold to competitors. Yale Journal on Regula-
tion, Vol. 11. No. 1. pp. 171-202. Baumol, W. J.–Willig, R. D. [1981]: Fixed costs, sunk costs, entry barriers, and sustainability of mo-
nopoly, The Quarterly Journal of Economics, Vol. 96. No. 3 (August); pp. 405-31. Becker, G. [1983]: A theory of competition among pressure groups for political influence. The Quar-
terly Journal of Economics, Vol. 98. No. 3. pp. 371-400. Brown, S.–Sibley, D. [1986]: The theory of public utility pricing. Cambridge University Press, Cam-
bridge MA. Cambridge, MA. Kiss Ferenc [1991]: Constant and variable productivity adjustments for price cap
regulation, in: Einhorn, M. (ed.) Price caps and incentive regulation in telecommunications, Kluwer Academic Publishers, Boston, Dordrecht, London; pp. 95-126.
Coase, R. [1960/2004]: A társadalmi költség problémája. Megjelent: A vállalat, a piac és a jog. Nem-zeti Tankönyvkiadó, Budapest, pp 137-214.
Cullis, John-Jones, Philip [2003]: Közpénzügyek és közösségi döntések. Aula Kiadó, Budapest, p 658 De Fraja, G. and A. Iozzi [2000]: ‘Short term and Long Term Effects of Price Cap Regulation’. Uni-
versity of York - Discussion Papers in Economics no. 00/61. Demsetz, H. [1968]: Why Regulate utilities? Journal of Law and Economics, Vol. 11. No. 1. pp. 55-
65. Demsetz H. (1968): Why Regulate Utilites? Journal of Law and Economics 1968/2. 55-66 o. Ekelund, R. B. (ed.) [1998]: The foundations of regulatory economics, Edward Elgar, Cheltenham. Fox, Loren: Enron, The Rise and Fall [2003] John Wiley and Sons, New York. Galbraith, John Kenneth [1970]: Az ipari állam. Közgazdasági és Jogi könyvkiadó, Budapest. George J. Stigler [1989]: Piac és állami szabályozás. KJK. Budapest IEA, [1999]: Electricity Market Reform: An IEA Handbook. International Energy Agency, Paris. Ihrig Dénes (szerk.) [1973]: A magyar vízszabályozás története. Budapest Illés Mária: [2000]: A közszolgáltató vállalatok gazdasági szabályozása, Aula Kiadó Kft, Budapest, J. Clark B.[1901]: The Control of Trust, New York, Macmillan J. Hirshfeiler-A. Glazer-D. Hirshfeiler [2009]: Mikroökonómia, árelmélet és alkalmazásai – döntések,
piacok és információ. Osiris. Jamasb, T., Pollitt, M., [2001]: Benchmarking and Regulation of Electricity Transmission and Distri-
bution Utilities: Lessons from International Experience. Department of Applied Economics, University of Cambridge.
Jamasb, Tooraj – Pollitt, Michael [2004]: Electrity Market Reform in the European Union. Cambridge Working Papers in Economics, CWPE 0471, p 36
John Kenneth Galbraith [1970]: Az új ipari állam. KJK. p 427 Joskow, P. L. [2007]: Regulation of natural monopolies. In: Polinsky, A. M.–Shavell, S. (eds.): Hand-
book of law and economics Joskow, P.L., [1998]: Electricity sectors in transition. The Energy Journal 19, 2, pp. 25-55. Joskow, Paul – Tirole, Jean [2004]: Retail Electrity Competition, Cambridge Working Papers in Eco-
nomics CWPE 0430, p 43 Kahn, A. E. [1970–1971]: The economics of regulation. Vols. 1–2, Wiley, New York. Kahn, A. E. [1988]: The economics of regulation: Principles and institutions, MIT Press, Laffont, J-J.–Tirole, J. [1991]: The politics of government decision-making: A theory of regulatory
capture. The Quarterly Journal of Economics, Vol. 106. No. 4. pp. 1089-1127. Marshall, A. [1890/1961]: Principles of economics. 9th edition MacMillan, London. Marx Karl [1975]: A tőke. II. kötet Kossuth, 1978 Marx Karl [1978]: A filozófia nyomorúsága. Helikon Nemec, Juraj és Glen Wright [2000]: szerk. Közösségi pénzügyek. Elmélet és gyakorlat a közép-
európai átmenetben. Budapest: Aula Kiadó.

40
Ofgem [1999a]: Social Action Plan: A Framework Document. London: Ofgem. 28 Ofgem [1999b]: Prepayment meters: A Consultation Document. London: Ofgem. Ofgem [2000]: The Social Action Plan. London: Ofgem. Pigou, A. C. [1920]: The economics of welfare, MacMillan, London. Posner, R. [1974]: Theories of economic regulation, Bell Journal of Economics and Management Sci-
ence, Vol. 5. No. 3 (Autumn); pp. 335-58. Posner, R. [1992]: Economic analysis of law, Little Brown, Boston. Ramsey, F. P. [1927]: A contribution to the theory of taxation, Economic Journal, Vol. 37. pp 47–61. Robert Reich [2009]: Szuperkapitalizmus, Gondolat, 346 o. Roosevelt Franklin D. [[1934]: 33]: On our way, New York Roosevelt Franklin D. [1933]: Looking forward, New York, Samuelson, Paul A. – William D. Nordhaus [2000]: Közgazdaságtan, KJK-KERSZÖV Jogi és Üzleti
Kiadó Kft, Budapest,
Sharkey, W.W. [1982]: The theory of natural monopoly. Cambridge University Press, Cambridge, MA.
Stiglitz [2005]: Azok a kilencvenes évek. Napvilág Kiadó, Budapest Theiss Ede [1938]: Franklin D. Roosevelt gazdaságpolitikája 1938. Special Issue of Volume 41-42 of
Magyar mérnök és építész-egylet közlönye, pp 41-42 Stádium Sajtóvállalat, Budapest p 24 Viscusi, W. K.–Harrington J. E.–Vernon, J. M. [2005]: Economics of regulation and anti-trust. 4th
edition. MIT Press, Cambridge, Vogel, S. K. [1996]: Freer markets, more rules: Regulatory reform in advanced industrial countries.
Cornell University Press, Ithaca. Williamson, O. E. [1981]: The economics of organization: The transaction cost approach. The Ameri-
can Journal of Sociology, Vol. 87. pp. 548-577. Zajac, E. E. [1970]: A geometric treatment of Averch-Johnson’s behavior of the firm model. American
Economic Review, Vol. 60. No. 1. pp. 117-125.

41
9. Own and co-writed publications on the topic
Books
Statisztikai módszerek és alkalmazásuk a gazdasági és társadalmi elemzésekben (Statistical methods and their application in economic and social analyses) (2008a.) (co-writers: Dr. Lukácsné Balogh Irén, Kerékgyártó Györgyné, Szarvas Beatrix. AULA, Budapest. p 446
Articles
Szezonális kiigazítási eljárások (Seasonal adjustment procedures) I. (1999a) Statisztikai Szemle, 1999/9 pp 705-721 Szezonális kiigazítási eljárások (Seasonal adjustment procedures) II. (1999b) Statisztikai Szemle, 1999/10-11 pp 816-832 Az ársapka-szabályozás és az indexálás (Price cap regulation and indexation) (2004) Statiszti-kai Szemle, 2004/6-7. pp 583-594 A hőmérséklet hatásáról és a korrekcióról a villamosenergia- és gázfogyasztás példáján Ma-gyarországon (The effect of temperature and its correction in the electricity and gas sector) (2011) 23 o. Statisztikai Szemle, megjelenés alatt A hazai benzin és gázolaj árszintjének és árazásának empirikus elemzése (The empirical analysis of price-level and changing of price of benzine and diesel oil) 17 o. Statisztikai Szemle, megjelenés alatt The political economy of price control (2011) 25 o. Society and economy, megjelenés alatt
Book chapters
A kaliforniai energiaválságról (About the California energy crisis) (2001d.) (in: A természet-nek, művészetnek és tudománynak nevében, kötet Kozma Ferenc tiszteletére) pp 294-303

42
Studies (within the framework of Regional Energy Research Centre):
1. January 2004: Preparing GHG emission prognoses in 16 production sectors, research worker
2. January 2005: Economic and environmental inspection of district heat prices and their influencing factors, research leader
3. January 2007: Prices in the new electricity market model, research worker 4. January 2008: Inspection of commercial and technical possibilities of consumer side
regulation, research worker 5. 2008: Issues of electricity cost review and price regulation, research leader 6. September 2008: Future of gas market after market opening and its effect on sector
players and macroeconomic processes, research leader 7. Paizs László, Sugár András and Tóth András: Expected electricity prices in 2008 8. Brief evaluation of the power market change in 2008, REKK, research worker 9. March 2009: Analysis of Hungarian gas and electricity market and long-term price
forecast, research leader 10. May 2009: Small customers on the liberalised electricity market, research leader 11. 2009: Issue of review of gas energy costs and price regulation, research leader