collective impact assessment report | i
TRANSCRIPT

COLLECTIVE IMPACT ASSESSMENT REPORT | i
Photo
: E
rlan
d H
ow
lan
d

COLLECTIVE IMPACT ASSESSMENT REPORT | ii
E2Q is helps companies and institutions to harness the power of cognitive, emotional and ecological
intelligence to improve economic, environmental and social performance. We use human-centred
design principles and empirical research methods to inform the design, implementation
and optimisation of organisational and social change projects and programs aimed
towards a more sustainable future.
For further information visit: www.e2q.com.au
The Institute for Sustainable Futures (ISF) was established by the University of Technology,
Sydney in 1996 to work with industry, government and the community to develop sustainable futures
through research and consultancy. Our mission is to create change toward sustainable futures that
protect and enhance the environment, human wellbeing and social equity.
For further information visit: www.isf.uts.edu.au
Please cite as:
Kirsch, C., Jackson, M., Langham, E. & Ison, N. (2015) Community Energy Collective Impact
Assessment (An Appendix of the National Community Energy Strategy).
We would like to acknowledge the generous contributions of the following people, without whom this
work would not have been possible: Erland Howden for being an excellent facilitator, Franziska Mey,
Chris Cooper, Warren Yates, Margaret Page, Jarra Hicks, Tom Nockold, Craig Memery, Bruce
Thompson, Adam Blakester, Taryn Lane for their generosity and openness. We also would like to thank
all the community groups and their representatives that have taken the time to answer our surveys.
We would also like to thank ARENA for the funding provided for this report, which
has been developed as part of the ARENA supported National Community
Energy Strategy project.
INSTITUTE FOR SUSTAINABLE FUTURES
University of Technology, Sydney
PO Box 123
Broadway, NSW, 2007
www.isf.edu.au
© UTS March 2015
Icons designed by Freepik
Disclaimer: The views and opinions expressed in this document are those of the authors and do not necessarily
represent all C4CE member organisations.

COLLECTIVE IMPACT ASSESSMENT REPORT | iii
Community energy is an emerging sector that is growing in countries around the world, offering new
opportunities for energy and wealth creation at the local community level. Since the first advent of
community energy groups in Australia in 2006, the sector has been gaining momentum and interest is
growing. Yet, community groups are still facing significant entry barriers to the market. In 2014, key
stakeholder groups and the organisations that are spearheading community energy in Australia,
founded the Coalition for Community Energy (C4CE), which aims to support the uptake and success of
community energy projects in Australia.
This project was funded by ARENA as part of the National Community Energy Strategy project. It has
provided the groundwork for future work to develop an online Shared Measurement Platform and the
processes and structures required to manage the ongoing data collection and reporting on the
collective impact of the Australian community energy sector.
The objectives for this work stream were:
- The development of a set of shared indicators for community energy in Australia
- Data collection and Baseline report on the impact of community energy projects in Australia
- Recommendations and system specifications for a Shared Measurement Platform.
The project included a preliminary survey of community energy organisations in Australia to determine
the key objectives and success factors, current indicators and ongoing reporting needs of the various
groups. This was followed up with a stakeholder workshop in which a set of shared indicators was
developed. These indicators were used to collect baseline data and to develop recommendations and
specifications for the development of an online Shared Measurement Platform (SMP) and
measurement and reporting framework, including structures, processes and possible funding structures
for the ongoing management and operation. Fifty three community energy groups were invited to
participate in the baseline assessment, of these data was received from 27 groups., The baseline data
provide interesting preliminary overview of the contributions that community energy is making and the
challenges it is facing.
The baseline data shows the significant environmental, economic and social benefits of community
energy in Australia. In this early stage the community energy sector has already:
- Contributed over AU $23 million in community funding for energy infrastructure
- Installed over 9 MW of renewable energy systems
- Produced over 50,000 MWh of clean energy (as at the end of 2014)
- Avoided over 43,000 tonnes in carbon emissions
- Developed a membership and supporter base of over 21,000 people.
According to the survey results, members of community energy groups see the main obstacles to the
uptake of community energy in Australia to be a lack of access to host sites, access to funding and
finance, the demand on volunteer time and the unfavourable regulatory environment and lack of
political support, especially at the Federal Government level.
Key enablers are support from local government and state MPs, sufficient people with the right skills,
access to training and/or advice, effective decision making and administrative processes and support to
access funding and potential host sites.

COLLECTIVE IMPACT ASSESSMENT REPORT | iv
The data-set provided relevant information on the current state of community energy projects in
Australia, especially in regards to the installed kW, amount of energy produced, project costs and
funding structures. Indicators that proved too onerous to report or that were not relevant to many of the
survey participants have been eliminated from the set of key indicators (Table 1) that provide the basis
for the shared measurement system, but can be included as optional indicators.
Table 1: Key and Optional Community Energy Impact Indicators
Community Energy Group
Community Energy Project
Key Indicators Optional Indicators Key Indicators Optional Indicators
Date of inception,
# of active members and
supporters,
# of active decision makers
# of events organised
(distinguish small scale (<20),
medium scale (20-100), large
scale (>100 participants))
Resources scale
Obstacles scale
Changes in Key Drivers scale
# social media supporters
# articles or reports/ media
coverage (radio, TV, press)
# people participating in
political advocacy
# Political appearances at
events
Technology
Business model / Project type
# kW installed, in planning
$ project cost
Years contract duration,
$ total expected income
# of investors,
$ funding by funding source
# kWh generated/ saved
# volunteer hours
# jobs created by project stage
Tonnes CO2e avoided
# of site visits/ visitors
# of objections/ complaints
$ supporting primary
producer land use
# of installations
#. kW projects ‘inspired”
$ flow-on outputs
RoI
Costs versus Savings
Payback period
$ savings (energy)
These indicators will be reviewed regularly by a data committee comprising representatives of key
stakeholders in the community energy sector.
The next steps in the development of the Collective Impact Assessment framework are to:
Develop a web-based Shared Measurement Platform, that links to or is integrated with an
international community energy database and map, for example the Energy Archipelago1 currently
under development.
Adopt the set of core indicators outlined in Table 1, as the basis of future impact assessments
Institute an annual data collection process, including continuation of the C4CE data committee to
review and update the process, funding for the C4CE backbone manage the process, an annual
reminder and survey to collect qualitative data and remind groups to update their data in the
Shared Measurement Platform.
1 http://beta.energyarchipelago.com

COLLECTIVE IMPACT ASSESSMENT REPORT | v
Executive Summary ii
1 Background 1
2 Methodology 6
2.1 Collective impact assessment – baseline indicators 7
2.2 Groups surveyed 8
3 Results and Discussion 10
3.1 Environmental Impact 12
3.2 Economic Impact 13
3.3 Social Impact 16
3.4 Obstacles and Key Success Factors 17
4 Recommended Next Steps 21
5 References 25
5.1 Data feeds and online resources 25
APPENDICES 26
A Key Indicators 26
B Baseline Survey 27
C Baseline Data for Key Indicators 36
D Economic Indicators for Community Energy 37
Photo: Jarra Hicks

COLLECTIVE IMPACT ASSESSMENT REPORT | 1
Community energy is an emerging sector that is growing in countries around the world, offering new
opportunities for energy and wealth creation at the local community level. Since the first advent of
community energy groups in Australia in 2006, the sector has been gaining momentum and interest is
growing. Yet, community groups are still facing significant entry barriers to the market.
Community Energy refers to a wide range of ways that communities can develop, deliver and benefit
from sustainable energy. It can involve supply-based projects such as renewable energy installations,
storage, and demand side projects such as energy efficiency and demand management. Community
energy can even include community-based approaches to selling or distributing energy.
Community energy projects encompass a variety of technologies and activities across a range of
scales, determined by community needs, availability of local natural resources, technologies and
funding, and community support.
Community energy projects can create positive outcomes across several impact areas. A common
framework for the identification of cross-impacts has been suggested by Ison and Hicks (2012) (Figure
1). It includes the following five categories:
Environmental
Increase in clean energy production, avoided greenhouse gas (GHG) emissions
compared with fossil-fuel based electricity generation
Economic
Localised, equitable wealth creation (O’Neill et al, 2010); fossil fuel divestment
opportunity; transition from carbon-based to post-carbon economic models
(Wiseman et al, 2013); community assets and increased resilience; local job
creation
Social
Local ownership, participation and engagement; increased skills and
competencies; attitudinal and behavioural changes
Political
Community engagement and empowerment; ‘winning hearts and minds’ –
developing the ‘what’s in it for me’ that will support the transition into a
decarbonised economy; development of a broad community support base for
political strategic leadership and regulatory changes
Technological
Increased uptake of innovative technologies; development of a sustainable
renewable energy industry; energy self-sufficiency; supportive environment for
innovation in renewable energy technologies

COLLECTIVE IMPACT ASSESSMENT REPORT | 2
Figure 1: Benefits of community renewable energy projects (Ison and Hicks, 2012)
The community energy sector in Australia has grown from little more than an abstract concept in 2006,
to a point where as at the end of 2014 there are 11 community energy groups operating that have
multiple projects established with over 9 MW of installed capacity and at least 52 more projects in
development. While this is still very small compared to the existing generation capacity of the Australian
National Energy Market (NEM) of 45,000 MW, the rate of growth particularly in recent years has been
accelerating.
In addition, there are a range of organisations providing services to and supporting community energy
at a state and national scale. In 2014, key stakeholder groups and the organisations that are
spearheading community energy in Australia, founded the Coalition for Community Energy (C4CE), – a
collaborative governance system to enable greater collective impact across the growing community
energy sector through joint priority initiatives.
The core objectives of C4CE are to2:
- Guide and support development of the community energy sector
- Create a coordinated voice to better advocate for the needs of the sector
- Grow the sector’s profile, influence and membership
- Facilitate the alignment of efforts by Members with support, systems, tools and training which
enable collaboration for collective impact
- Identify and create strategic opportunities and attract investment for the sector
- Coordinate strategic initiatives which build the knowledge, know-how and capacity of Members and
the sector.
C4CE anticipates that with policy support the Australian community energy sector could follow in the
footsteps of the Scottish community energy sector, which grew to over 300 operating community
renewable energy projects in a decade.
2 http://c4ce.net.au

COLLECTIVE IMPACT ASSESSMENT REPORT | 3
Photo: NSW Office of Environment and Heritage
C4CE is based on a Collective Impact approach, a framework developed to address complex social
problems. It is a structured approach to collaborative work across government, business, philanthropy,
non-profit organisations and communities aimed at significant and sustainable social change. It is
based on the notion that no single entity can achieve the paradigm shift necessary to facilitate the
social and cultural change necessary to address the issue at the core of the initiative.
One of the key elements of a Collective Impact approach is the development of a sound measurement
and evaluation framework and the ongoing and consistent collection of data and measurement of
outcomes and impacts across all the participants to ensure alignment and accountability (Kania &
Kramer, 2011).
In order to track the progress of the community energy sector in Australia, in this report the C4CE,
supported by the Australian Renewable Energy Agency (ARENA), has developed a monitoring and
evaluation framework to provide valid and reliable metrics on sector progress. It is anticipated that this
framework will then be integrated into a ‘shared measurement platform’ to communicate this data to
stakeholders and decision makers. Shared measurement has been defined as the “use of a common
set of measures to monitor performance, track progress towards outcomes and learn what is and is not
working in the group’s collective approach” (John Kania, FSG). The ongoing assessment of the
performance and impact of the community energy sector will provide actionable data and
recommendations for the implementation of the National Community Energy Strategy (NCES)3.
The shared measurement of key indicators across the sector will allow C4CE to:
- Continuously improve data quality
- Track progress towards the intended outcomes and impact
- Enable coordination and collaboration across all stakeholders
- Learn and correct the strategic direction, actions and interventions
- Catalyse collective action amongst all key players.
The objective of the ‘Community Energy in Australia – Collective Impact Assessment’ (CEA-CIA)
project is the development of a measurement and evaluation framework and core indicators for the
ongoing strategic monitoring of the community energy sector. The benefits of community energy extend
beyond the economic impact of localised wealth creation. Community energy projects can empower
local communities to produce clean energy and reduce their environmental impacts, including those
without access to adequate roof-space to do so individually, create local jobs, localise energy
production and therefore increase the resilience of the local community, increase awareness for the
benefits of clean energy, provide learning experiences and add to the skill base and capabilities of the
local communities (Hicks et al, 2014).
Community energy can also provide
an avenue for action on clean energy
where government and institutional
action is limited and galvanise
collective action around a common
social purpose, thereby fostering a
sense of community.
Yet, despite the potential benefits
and many projects in development,
relatively few community energy
projects are operating, due in large
part to numerous obstacles and
impediments.
3 The Draft National Community Energy Strategy is available at http://c4ce.net.au/nces/

COLLECTIVE IMPACT ASSESSMENT REPORT | 4
This includes regulatory barriers, a volatile or unpredictable policy environment, inadequate processes,
lack of skills and capabilities with community groups to implement projects, and accessibility of finance.
Empirical data is needed to establish a baseline of the Australian community energy sector and identify
drivers that facilitate and obstacles that undermine the development of a vibrant and viable sector.
The aim of this project is to provide that baseline through a measurement and evaluation framework
that will be used collectively to record key performance indicators of community energy projects and to
track their impact and that of the sector as a whole. The database will be used to provide regular
reports to all interested stakeholders on the environmental, economic, technological, social and political
outcomes and impact of community energy projects in Australia and on changes in key drivers and
obstacles. Measurement and evaluation are the key to ongoing program optimisation. As the old adage
goes ‘You cannot manage what you do not measure’.
Comprehensive measurement that includes results-based performance indicators and lead indicators
that capture the drivers of program success can be used to identify the obstacles that prevent the
establishment of community energy projects, track the ongoing performance of the community energy
sector, and continuously fine-tune the strategies, programs and activities of C4CE as well as inform
government and industry support to the sector. This allows C4CE to develop targeted initiatives and
interventions to remove obstacles and support the community energy sector and adjust the strategic
initiatives if and as required, as outlined in Figure 2.
Figure 2: Collective Impact Assessment as key component of Program Implementation
Ultimately, the collective impact assessment will provide empirical evidence regarding the impact of
community energy while acting as a tool to support individual groups and the C4CE in their endeavours
to bring the community energy sector to maturity through activities such as community and stakeholder
engagement, negotiating with host sites, investors or networks and to advocate for political and
regulatory support.
Measurement and Evaluation How can we provide the feedback required to support community energy in Australia?
Feedback and Action Planning What actions will make a difference? How do we ensure that people have the information they need to steer the initiative/project?
Governance Do we have effective governance structures? Is the program aligned to the strategy? What are the intended impacts? What strategic interventions are needed? What can C4CE do to support community energy? What is needed from other stakeholders? What barriers are in place? How can these be removed?
Projects Do we have the most effective strategy? Do we have sufficient resources? Where do we face resistance? Where can it be overcome? What support is needed at the moment? What are the obstacles at the moment? What is the impact on members? How much has been contributed so far?

COLLECTIVE IMPACT ASSESSMENT REPORT | 5
The collective impact assessment covers key indicators along the results chain (Figure 3) from inputs
(e.g. grant funding, volunteer efforts etc.) to activities (e.g. funded CE projects, workshops, community
events), to outputs (e.g. number of community energy pilot projects established), outcomes (e.g.
successful business models established and replicated), and impact (MW installed, kWh/ MWh of
energy produced; CO2e emissions avoided, financial returns to community investors, local jobs
created).
Figure 3: Results Chain
In summary, the objective in this work stream were:
Development of a set of shared indicators for community energy in Australia to track the outcomes
and impact of funding inputs and activities in the community energy sector
Data collection and Baseline report on the impact of community energy projects in Australia
Recommendations and system specifications for a Shared Measurement Platform.
INPUTS Financial, human
and material resources,
e.g. OEH funding for CE projects
ACTIVITIES Tasks and actions that
transform inputs into outputs, e.g. projects
funded
OUTPUTS Products and
services produced,
e.g. pilot projects, business models
OUTCOMES Intermediate
effects of outputs,
e.g. successful CE projects
IMPACT Long-term
improvements in community
energy impacts, e.g. MW installed
Photo: Jarra Hicks

COLLECTIVE IMPACT ASSESSMENT REPORT | 6
2 METHODOLOGY
The project involved the following three steps:
A preliminary survey of key stakeholders and community energy groups
registered with C4CE was conducted in November 2014 in order to develop a
clear overview of the definition of success and relevant performance indicators
for community energy projects and gain an understanding of the feedback and
reports that stakeholders and the broader community would like to receive on
community energy.
The survey results provided the input for the Collective Impact Assessment
Workshop, which engaged key stakeholders and community representatives in
the development of the set of key indicators that provided the basis for
measurement and evaluation (Appendix A).
The objectives of the Community Stakeholder Workshop were to:
- Develop a set of shared key indicators for recording the environmental,
economic, social, political and technological benefits of community energy in
Australia
- Clarify needs and specifications for reports that will be provided to
community groups involved in the shared measurement system: frequency,
format, indicators; and
- Establish processes and structures for the ongoing assessment of the
collective impact of the community energy sector in Australia.
The Indicators developed in the workshop provided the basis of an online survey
(Appendix B) that was used to collect a first set of baseline data on community
energy and its impact in Australia. The subsequent data collection was used to
identify the requirement specifications for a Shared Measurement System for the
community energy sector and C4CE.
Due to the limitations in scope, the project used an ‘off the shelf’ platform to
collect the baseline data from community energy groups. The survey items were
derived from the Stakeholder Workshop and collected from community energy
groups in the period between 18th December 2014 and 15th February 2015.
Note: All results presented in this document are derived from data input directly by the community
energy group respondents to the survey. No verification of the data has taken place and it is assumed
that data provided is correct as at time of writing.

COLLECTIVE IMPACT ASSESSMENT REPORT | 7
2.1 COLLECTIVE IMPACT ASSESSMENT – BASELINE INDICATORS
The set of key indicators that were developed in the community workshop were incorporated in an
online survey to community groups. The indicators covered items relating to the principal community
group that initiated the community energy project(s) and to the community energy projects established
by those groups. The full list of indicators, by the STEEP categories and aligned to the elements of the
results chain (Figure 3) is provided in Appendix A.
The survey used quantitative measures to cover the following indicators in regards to the principal
community group:
- Community efforts in terms of volunteer hours and number of active members and decision makers
- Political engagement of community members in terms of the number of attendance at community
events, and the number of politically engaged community members and political engagement
efforts
- Political support from political representatives across all there levels of government – local, state
and federal - in terms of attendance of representatives from local, state and federal government at
community events
- Amount and channels of communication to members.
The survey also included three subjective rating scales that captured the following aspects:
- Perceived obstacles and hindrances that undermine the establishment of community energy
projects (e.g. lack of time, lack of finance/ funding, lack of technology, availability of host sites, lack
of replicable business model, political and/ or regulatory environment, lack of skills & capabilities,
reluctance to take on project risk)
- Availability of resources (skills and knowledge, access to training/advice, support from other CE
groups, access to replicable models for CE, sufficient people, effective decision making processes,
effective administration processes, tools and technology, sufficient time , sufficient funding, ability
to borrow money)
- Perceived changes over the last 6 months in members’ skills and capabilities, access to host sites,
access to funding, regulatory environment, support from your local council, support from state MPs,
support from Federal Government, satisfaction of your members, environmentally sustainable
behaviour, the community's attitude towards renewable energy.
For community energy projects the survey covered key indicators in regards to the environmental,
economic and social performance of the projects:
- Economic performance indicators: expected return over the lifetime of the project, internal rate of
return (IRR), expected payback period, income generated to date, project costs, funding sources,
government grant funding compared to community funding
- Environmental performance indicators: amount of clean energy produced in kWh, greenhouse gas
emissions avoided in tonnes of CO2-e
- Technological performance indicators: amount of kW installed, cost of the energy project,
technology used, expected contract duration
- Social performance indicators: amount of volunteer hours, job creation, locally sourced services.
COLLECTIVE IMPACT ASSESSMENT REPORT | 8
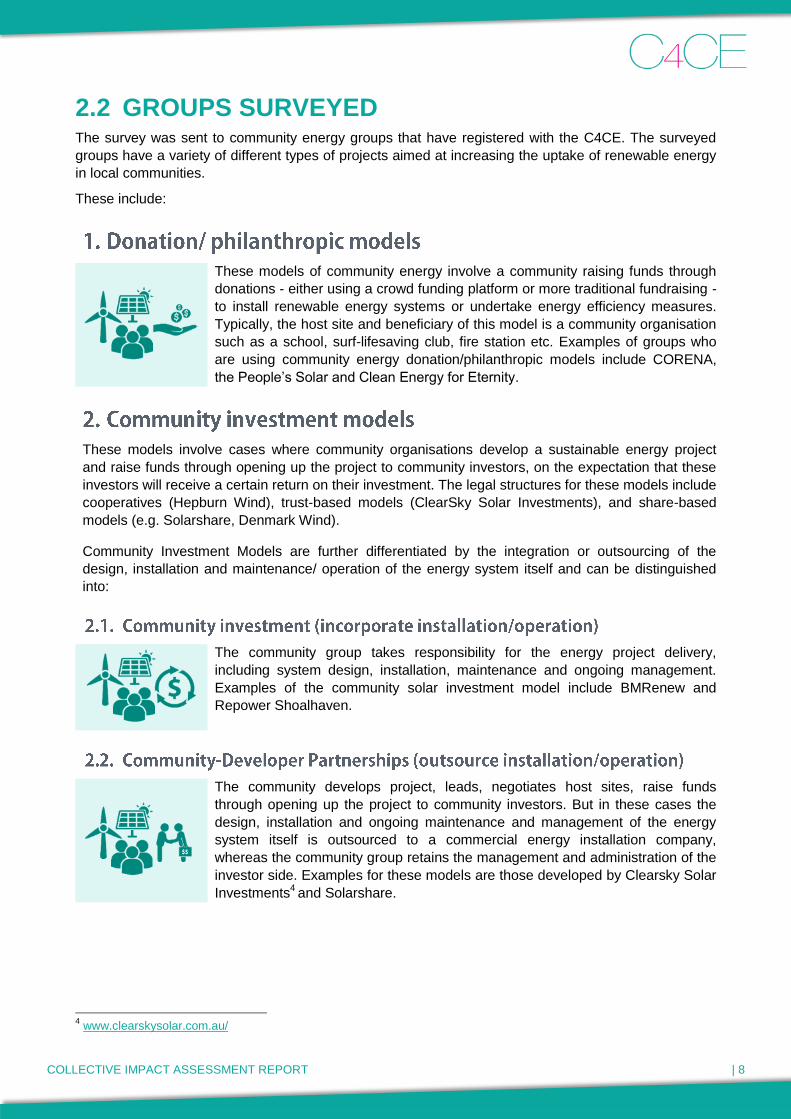
2.2 GROUPS SURVEYED The survey was sent to community energy groups that have registered with the C4CE. The surveyed
groups have a variety of different types of projects aimed at increasing the uptake of renewable energy
in local communities.
These include:
These models of community energy involve a community raising funds through
donations - either using a crowd funding platform or more traditional fundraising -
to install renewable energy systems or undertake energy efficiency measures.
Typically, the host site and beneficiary of this model is a community organisation
such as a school, surf-lifesaving club, fire station etc. Examples of groups who
are using community energy donation/philanthropic models include CORENA,
the People’s Solar and Clean Energy for Eternity.
These models involve cases where community organisations develop a sustainable energy project
and raise funds through opening up the project to community investors, on the expectation that these
investors will receive a certain return on their investment. The legal structures for these models include
cooperatives (Hepburn Wind), trust-based models (ClearSky Solar Investments), and share-based
models (e.g. Solarshare, Denmark Wind).
Community Investment Models are further differentiated by the integration or outsourcing of the
design, installation and maintenance/ operation of the energy system itself and can be distinguished
into:
The community group takes responsibility for the energy project delivery,
including system design, installation, maintenance and ongoing management.
Examples of the community solar investment model include BMRenew and
Repower Shoalhaven.
The community develops project, leads, negotiates host sites, raise funds
through opening up the project to community investors. But in these cases the
design, installation and ongoing maintenance and management of the energy
system itself is outsourced to a commercial energy installation company,
whereas the community group retains the management and administration of the
investor side. Examples for these models are those developed by Clearsky Solar
Investments4 and Solarshare.
4 www.clearskysolar.com.au/

COLLECTIVE IMPACT ASSESSMENT REPORT | 9
These models are about aggregating households to deliver sustainable energy
solutions. Examples of such models include solar bulk-buys which were popular
around 2009, the Moreland Energy Foundation’s5 rates backed solar model for
low income households (Darebin Solar Savers), and Bendigo Sustainability
Group with a government grant funded community education and support
program for small scale household solar PV that resulted in over AU$5 Million of
community investment and achieved a 21% solar penetration in the local
community, twice the state average. It should be noted that not all groups who
conducted solar bulk-buy programs were invited to participate in this survey, as
only groups that have registered with C4CE have been included in the survey.
Solar bulk-buy initiatives are often overlooked in terms of community energy, but
provide an effective means to increase the uptake of renewable energy systems
in local communities.
In the analysis we therefore distinguish between (a) small scale solar/ bulk-buy programs, (b) donation
models, and (c) community investment models comprising share based companies, cooperatives, and
trust-based models.
The invitation to participate in the Baseline survey was sent to 53 community energy groups and
followed up with two reminders. A total of 27 responses were received in time for analysis.
5 www.mefl.com.au/activity-areas/sustainable-energy-supply/item/535-energy-services-company-business-plan.html
Photo: Thomas Yoo

COLLECTIVE IMPACT ASSESSMENT REPORT | 10
3 RESULTS AND DISCUSSION Of the 27 survey responses, 13 were from Not-for-profit organisations (Company limited by Guarantee
(Ltd.)), 6 were from Cooperatives, 4 were Incorporated Associations with charitable status, 3 were
informal community groups without a separate legal entity, and one was a Company limited by Shares.
These groups cover a membership base of over 21,000 people of which approximately 20% are active
members and 8% are involved in decision-making and political advocacy. Victoria is leading the way
with 65%, followed by NSW with 28% of people that are involved in community energy groups in this
sample.
Table 2: Survey respondent summary - project and member numbers by state
Overall
members/ supporters
Active members
Members involved in
decisions
Members participating
in political advocacy
ACT 444 20 10 1
NSW 5,949 1,625 1,362 33
SA 900 50 20 -
VIC 13,666 2,339 216 1,564
WA 130 130 4 4
Total 21,089 4,164 1,612 1,602
From the 27 responses, the survey found that 11 groups, or 21% of respondents, have projects that are
fully financed, installed and operating. These community groups have managed to install over 9 MW of
community energy over the last 10 years.
The largest proportion of installed capacity is coming from small-scale solar installation and bulk-buy
projects (33%) and the large wind and solar energy cooperatives (45%). This is followed by 18% of
installed capacity within share-based structures, mainly due to the 1.6 MW Denmark wind farm, and 2%
of capacity installed by philanthropic projects and community trust investment respectively (Table 1).
Table 3: kW installed by Project Type in each state
NSW SA VIC WA ACT Total
Small scale solar/Bulk buy 3,100 3,100
Donation 127 10 40 177
Community Investment
Company limited by shares 100 1,600 1,700
Cooperative 30 4,100 4,130
Trust with trustee company 150 150
Total 406 10 7,240 1,600 9,256
The majority of installed capacity (78% of installed kW) is in Victoria, spanning small-scale solar
projects like the Moreland Energy Foundation and the Bendigo Sustainability Group’s Goldfields
SolarHub project, the Hepburn Wind cooperative and various philanthropic projects. A follow-up
interview with the Bendigo Sustainability Group revealed that the small-scale solar model in Victoria has
been facilitated by grant funding from Sustainability Victoria, which has achieved significant community
investment in small-scale solar PV systems.

COLLECTIVE IMPACT ASSESSMENT REPORT | 11
WA has the Denmark Community Windfarm, a large-scale community investment project accounting for
the bulk of community energy in WA. NSW is showing a significant diversity in philanthropic and
investment-based models, many of which have been launched recently, facilitated by the recent
increase in support for community energy from the NSW government. SA has only one philanthropic
community energy project, established by CORENA and the ACT needs to play ‘catch up’, with the
large-scale Solarshare community energy project in the pipeline, facilitated by the existence of a
community feed-in-tariff in the ACT. There are at least 52 further projects in planning.
Table 4: kW installed and kWh produced by state/ community energy group
kW installed
kWh produced (to date)
Projects in Planning
NSW 406 830,775 40
Clean Energy for Eternity 66 243,560 2
ClearSky Solar Investments 150 224,268 4
CORENA 7 14,947 3
Embark 10
Manilla Community Solar Co. 1
Narara Ecovillage Co-operative Ltd 30 20,000 1
NEEN 10
NRE 1
Pingala 3
Repower Shoalhaven 109 84,000 3
Nimbin Solar Farm 45 244,000 1
CCCE Inc. 1
SA 10 15,330 1
CORENA 10 15,330 -
PV Community 1
VIC 7,240 49,419,796 8
Bendigo Sustainability Group 2,530 12,000,000 3
CORENA 10 13,140 -
Hepburn Wind 4,100 37,190,656 -
LIVE Community Power 1
MNCEH 1
Moreland Energy Foundation Ltd 600 216,000 -
Ranges Energy Cooperative Limited 1
Yarra Community Solar Coop Ltd 1
MRSG - Community Renewables 1
WA 1,600 84,600 -
Denmark Community Windfarm Inc. 1,600 84,600 -
ACT 3
SolarShare Canberra 3
Total 9,256 50,350,501 52

COLLECTIVE IMPACT ASSESSMENT REPORT | 12
3.1 ENVIRONMENTAL IMPACT One of the main objectives of community energy projects is to empower local action to combat climate
change and avoid production of greenhouse gas emissions and reduce the ecological footprint of local
communities. The key indicators are the amount of greenhouse gases (in CO2-e) that have been
avoided. The amount of CO2-e avoided is dependent on the number of kilowatt hours (kWh) produced
to date, which in turn is dependent on project start date, the system capacity and location. Some of the
community energy projects have been operating for almost 10 years, as for example the early small-
scale community philanthropic projects pursued by Clean Energy for Eternity in Tathra and Bega.
These projects, despite their smaller size, have already contributed significant amounts of clean energy
to their local communities and prevented large amounts of CO2-e entering the atmosphere.
Overall, according to the data provided by community energy groups, to date community energy has
produced over 50,350 MWh of clean energy in Australia. This equates to over 9,000 cars taken off the
road and compares to the annual greenhouse gas emissions from the energy use of over 6,150
Australian households.6
Figure 4: CO2-e emissions avoided due to community renewable energy projects by State
Figure 5: CO2-e emissions avoided by different types of community energy projects
Even though the community energy sector in Australia is still in its early stages the data show the
significant environmental, economic and social benefits of community energy in Australia. It has already
contributed over AU$23 Million in community funding for energy infrastructure, installed over 9MWs of
renewable energy systems, produced over 50,000 MWh of clean energy by the end of 2014 and
avoided over 43,000 tonnes in carbon emissions (Figure 4 and Figure 5).
6 Based on 7 tonnes CO2-e emissions per year; www.yourhome.gov.au/energy
0
5,000
10,000
15,000
20,000
25,000
30,000
35,000
40,000
45,000
NSW SA VIC WA ACT
CO2-e avoided (tonnes)
0
5,000
10,000
15,000
20,000
25,000
30,000
35,000
Small ScaleSolar
/ Bulk Buy
Donation CompanyLimited
by Shares
Cooperative Trust withtrustee
company
Community Investment
CO2-e avoided (tonnes)

COLLECTIVE IMPACT ASSESSMENT REPORT | 13
3.2 ECONOMIC IMPACT With an overall installed capacity of more than 9 MW, community energy has increased significantly
over the past 10 years and has become a contributor to the Australian energy mix with AU$26 Million
invested in renewable energy infrastructure. Of this AU$26 million only 22% or approximately AU$5.77
million has been covered by government grants. Figure 6 shows the majority of project funding, with
over AU$20 million in investments, was provided by community investors (61%). A further 16% in bank
loans and 1% in philanthropic donations has been provided by community energy projects. Overall
community investment, donations and guaranteed loans have covered 88% of the cost of community
renewable energy projects.
Government investment in community energy has in turn attracted significant community investment,
which has provided overall quadruple the amount of government grant funding. We predict this ratio will
improve as the sector matures, modelling undertaken by Marsden Jacobs and Associates suggests that
with significant funding support and scale-up of the sector, this ratio could improve to 17:1 ($17 dollars
leveraged for every $1 of government funding).7
Figure 6: Funding sources for community energy in Australia
Overall in Australia, community investors have contributed more than three times as much - in
philanthropic donations, direct investment and bank loans guaranteed by the community - as
government grants towards funding community energy projects (
7 http://cpagency.org.au/wp-content/uploads/2014/03/MJA-Report-to-CCE-Final-14Jun13.pdf
Community Investors
Government Grant
Bank Loan
Philanthropy/ Donations
Community Group

COLLECTIVE IMPACT ASSESSMENT REPORT | 14
Figure 7).
Victoria has seen the highest level of economic impact with significant community investment in the
Hepburn Wind Farm and the small-scale solar PV systems of the Bendigo Sustainability Group’s
Goldfield SolarHubs project. Community energy has attracted AU$ 7.1 million community funding in WA
and AU$ 0.5 million community funding in NSW (Appendix E).

COLLECTIVE IMPACT ASSESSMENT REPORT | 15
Figure 7: Government grant funding versus Community funding of community energy projects by State
To date community energy projects have earned over AU$3.5 million for community investors,
localising not only energy, but also wealth creation. Several of the clean energy projects surveyed are
philanthropic projects without any returns to investors, instead they will deliver savings of over half a
million dollars (AU$) in energy costs over the project lifetime and avoid Greenhouse gas emissions in
local communities (Table 5).
Table 5: Economic indicators for community energy projects
Economic Indicator Sum Average
Expected Income - all $39,231,770 $3,566,525
Expected Payback Period - 5.6 Years
Expected Internal Rate of Return (IRR) - 8%
Income generated to date $3,550,852 $394,539
Expected energy cost savings over project lifetime $586,253 $24,427
Energy cost savings to date $59,000 $3,105
Amount invested in community benefit schemes $159,000 $19,875
$0m
$5m
$10m
$15m
$20m
$25m
NSW SA VIC WA ACT
AU$ millions
Government Grant Funding Community Funding

COLLECTIVE IMPACT ASSESSMENT REPORT | 16
3.3 SOCIAL IMPACT A further objective of many community energy projects is to create or safeguard local jobs in the
renewable energy sector. The data showed that although only 12% of products (e.g. renewable energy
technology components) were sourced locally, with major parts of the energy system coming from
overseas, the majority of services (e.g. installers, construction workers, electricians, administration etc.)
with 92% were sourced locally.
Table 6: Job Creation in Community Energy Projects in workweeks (40 hours) by Project Phase
Project phase Sum Average Min Max
Development 79 16 0.50 75
Planning 86 4 0.40 75
Installation 664 25 - 365
Operation (ongoing) 372 37 0.01 209
The key indicators are the amount of jobs (in employee hours) created during the development,
planning, installation and ongoing operation of community energy projects. The data shows that on
average community energy projects create 4 months of work during development, 1 month during
planning, approximately half a year in installation and 37 weeks on an ongoing basis (Table 6). Large
scale projects like community wind farms, even at this comparably small scale, created up to four
ongoing positions and seven full time jobs for a year during construction and installation. Community
energy projects therefore have contributed to local job creation.
Table 7: Volunteer Hours in Community Energy Projects in workweeks by Project Phase
Project phase Sum Average Min Max
Development 339 31 0.13 300
Planning 8 1 0.25 3
Installation 1 0.13 - 0.25
Operation (ongoing p/a) 21 3 0.05 13
What tends to be overlooked is the significant amount of
volunteer effort that is spent on the development of community
energy projects. Table 7 shows that community groups spend
on average 31 volunteer weeks on the development of
community energy projects with some groups having spent up to
6 years on this first phase. Planning took on average 1 week,
with a maximum of 3 weeks in volunteer hours and ongoing
operation requires between 0 and 13 weeks per year in
volunteer efforts with an average of 3 weeks per project in
volunteer hours.
The total volunteer investment across the project cycled shows
that without the passion and commitment and significant
sacrifice in time and energy during the development phase
these kinds of projects would not be possible.
Photo
: N
SW
Off
ice o
f E
nv
iro
nm
en
t an
d H
eri
tag
e

COLLECTIVE IMPACT ASSESSMENT REPORT | 17
3.4 OBSTACLES AND KEY SUCCESS FACTORS
The survey asked for an assessment of the various obstacles that prevent community groups from
achieving the successful development of a community energy project. The list of obstacles had been
developed at the workshop and refined in interviews. Based on the list of obstacles provided, the results
show that the ‘political and/or regulatory environment’, ‘lack of time’, ‘availability of host sites’ and ‘lack
of access to finance or funding’ were rated as the strongest obstacles (Figure 8).
A comparison of the perceived obstacles between those community groups that have managed to
successfully establish community energy projects and those that have planned to do so but not yet
achieved their objective shows that the main difference was the ‘availability of host sites’, followed by
‘lack of a replicable business model’ and the ‘political or regulatory environment’ (Figure 9).
Figure 8: Average level of obstacles faced by community energy groups
8
Figure 9: Difference between community groups with ‘projects’ and with ‘no projects’ operating on obstacles faced
8 In response the question “To what extent do the following issues/ obstacles prevent you from achieving your goals?”
-3 0 3
Lack oftime
Lack offinance/funding
Lack oftechnology
Availabilityof host sites
Lack ofreplicable
business model
Political and/or regulatoryenvironment
Lack of skills& capabilities
Reluctanceto take onproject risk
Major obstacle Some No obstacle
Lack oftime
Lack offinance/funding
Lack oftechnology
Availability ofhost sites
Lack ofreplicable
business model
Political and/orregulatory
environment
Lack of skills& capabilities
Reluctanceto take onproject risk
Project(s)operating
No projectsoperating
Major obstacle No obstacle Some

COLLECTIVE IMPACT ASSESSMENT REPORT | 18
We asked the various community groups ‘to what degree does your group have access to’ various
critical resources, as for example ‘skills and knowledge’, ‘sufficient funding’, ‘sufficient people’, ‘access
to replicable models for CE’. In regards to the availability of resources, ‘lack of time’ and ‘sufficient
funding’, ‘access to replicable models for CE’ and ‘support from other community energy groups’ were
lacking the most. On the other hand, ‘access to adequate skills and capabilities’ was not identified as a
significant issue for community groups (Figure 10).
A comparison of resource availability between those community groups that have managed to
successfully establish community energy projects and those that have planned to do so but not yet
achieved their objective shows that the main differences are in regards to having ‘sufficient people’,
‘effective decision making processes’ and ‘effective administrative processes’ (Figure 11).
Figure 10: Average resource availability for community energy groups
Figure 11: Difference between community groups with ‘projects’ and with ‘no projects’ operating in resource availability
-3 0 3
Skills andknowledge
Access totraining/ advice
Support fromotherCE groups
Access toreplicable
models for CE
Sufficientpeople
Effectivedecision making
processes
Effectiveadministration
processes
Tools andtechnology
Sufficienttime
Sufficientfunding
Ability toborrow the
money
Some Not at all Considerable
Skills andknowledge
Access totraining/advic
e
Supportfrom otherCE groups
Access toreplicablemodels for…
Sufficientpeople
Effectivedecisionmaking…
Effectiveadministratio
n…
Tools andtechnology
Sufficienttime
Sufficientfunding
Ability toborrowmoney
No projects operating Project(s) operating
Not at all Considerable Some

COLLECTIVE IMPACT ASSESSMENT REPORT | 19
In order to track perceived changes in key success factors over the last year we have included a
question that asks the respondent “how has the following changed over the last year ..?”
The results show that there has been an increase in ‘members skills and capabilities’, the ‘community’s
attitude towards renewable energy’, ‘environmentally sustainable behaviour’ of members. Whereas
‘support from Federal Government’ and the ‘regulatory environment’ conducive to community energy
are perceived to have declined (Figure 12).
Figure 12: Changes over the last year in key indicators
A comparison of perceived changes over the last year between those community groups that have
managed to successfully establish community energy projects and those that have planned to do so but
not yet achieved their objective shows that the main differences are in regards to ‘satisfaction of
members’, ‘support from local council’, and the ‘community’s attitude to renewable energy’ (Figure 13).
Community groups that have operating projects have a significantly increase in member satisfaction,
whereas groups without projects have seen a decline in members’ satisfaction. ‘Support from Federal
Government’ and ‘regulatory environment’ is perceived to have declined by both groups, but those that
have projects operating report an increase in ‘support from State MPs’.
(3.00) - 3.00
Membersskills and
capabilities
Access tohost sites
Access tofunding
Regulatoryenvironment
Support fromyour local
council
Support fromstate MPs
Support fromFederal
Government
Satisfaction ofyour members
Environmentallysustainablebehaviour
Community'sattitude
towards RE
Worse Better Same

COLLECTIVE IMPACT ASSESSMENT REPORT | 20
The difference in changes in the ‘environmentally sustainable behaviour’ of members is negligible, but
the change in ‘attitude towards renewable energy’ is markedly higher for groups that have operating
projects. ‘Support from local council’ is seen as having increased by groups with operating projects and
declined by those without projects. ‘Access to host sites’ – unsurprisingly – is seen as ‘better now’ by
groups with projects, but ‘same’ by those without projects. ‘Access to funding’ is seen as having
declined, but significantly less by groups that have projects operating.
Figure 13: Changes over the last year for community groups that have ‘projects’ and those that have ‘no projects’ operating
Membersskills and
capabilities
Access tohost sites
Access tofunding
Regulatoryenvironment
Support fromlocal council
Support fromstate MPs
Support fromFederal
Government
Satisfactionof members
Environmentallysustainablebehaviour
Community'sattitude
towards RE
No projects operating Project(s) operating
Worse Better Same

COLLECTIVE IMPACT ASSESSMENT REPORT | 21
4 RECOMMENDED NEXT STEPS Drawing on the lessons learnt in this project, the following steps are recommended to advance the
understanding of the collective impact of the Australian Community Energy Sector:
1. Develop a Shared Measurement Platform 2. Adopt a set of core indicators as the basis of future impact assessments 3. Institute an annual data collection process.
Online survey platforms are not well suited to the registration of key indicators for projects and
community groups, as the financial and technical data required are complex and time-consuming to
determine in the first place. However, there are elements of the data collected in the baseline
assessment (e.g. the scales on ‘Resources’, ‘Obstacles’ and ‘Changes in Key Drivers’) that are well
suited to online surveys. Therefore we suggest the development of a multi-platform measurement and
evaluation system, the core component of which would be the development of a Shared Measurement
Platform.
The Shared Management Platform would consist of:
- A cloud-based information system and database
- A web-based user-friendly data entry interface
- Data display for example through interactive maps
- Data export into a pre-developed report template
- If sufficient funding is secured, a smart-phone/tablet interface (app).
The ideal functionality would allow community energy groups to register on the platform, update and
simply analyse data on the core indicators when convenient. This would further help community energy
groups to track and evaluate their individual progress, avoiding or at least reducing duplication of effort
between evaluation at the project, group and sector levels.
Another issue found through this project is the complexity and diversity that can be found in the sector.
Community energy projects can range from the traditional bulk-buy and small-scale solar projects to
megawatt-scale wind farms. The differentiation between community group and community energy
project is sometimes difficult in cases where the community group was set up as the community energy
project.
As such it is further recommended that the Shared Measurement Platform be split into two sections -
one for the primary community organisation data and another for the registration of community energy
project data.
The objective of the Collective Impact Assessment for Community Energy in Australia is to provide a
measurement framework and tools that will allow the tracking of key performance indicators and drivers
that impact on the success of community energy in Australia. Therefore it has a comprehensive list of
indicators that exceeds that used by other internationally focused projects that aim to capture
information regarding community energy projects at a global level. Those are generally limited to small
set of indicators to ensure comparability across countries (e.g. http://beta.energyarchipelago.com).
Ideally, the Shared Measurement Platform on community energy in Australia and the indicators used
would be linked to and compatible with the respective international databases. That is, the Platform
would automatically or facilitate regular manual update of an international community energy
map/database for a selected set of key indicators on behalf of the Australian community energy
projects. This will ensure international visibility and recognition of community energy projects in
Australia and facilitate inter-community networking and knowledge exchange. In order to allow this the
shared indicators – those that are used for reporting at the national as well as at the global level – need
to be aligned to ensure compatibility.

COLLECTIVE IMPACT ASSESSMENT REPORT | 22
The response rate of 51% for the baseline assessment was lower than expected given volunteers in the
community energy sector generally show a high level of engagement and commitment. However,
feedback received in the follow-up calls suggested the majority of the groups that didn’t respond were
at a very early stage of developing a community renewable energy project and as such they found it
difficult to answer even some of the basic questions.
Interviews in the follow-up calls also stressed the fact that volunteers are already over-committed and
spending hours of personal time on these projects. The time needed to complete the survey and collect
the data therefore needs to be minimised.
There was also a significant amount of data not provided on some of the variables. However, for easily
accessible data, such as for the amount of kW installed or cost of the project, more responses were
provided. The representatives of community energy groups were interested in contributing to the
collective data collection effort, but most of them were volunteers and facing time constraints.
Therefore, the future measurement and evaluation framework needs to provide a streamlined and
efficient process for projects to input data with a focus on collecting highly relevant and easily
accessible indicators that will tell the story of community energy in Australia. A balance between the
effort required and therefore willingness to provide data and the rigour and complexity of data that will
tell the story needs to be found.
The final data-set revealed that despite the significant amount of data not being provided, relevant
information on the current state of community energy projects in Australia was provided, especially in
regards to the installed kW, amount of energy produced, project costs and funding structures. Indicators
that proved too onerous to report or that were not relevant to many of the survey participants can be
eliminated from future iterations of the shared measurement platform.
It is therefore recommended that the indicators outlined in Table 8 become the core indicators for the
basis of future collective impact assessments. As per the recommended structure of the Shared
Measurement Platform and data collection process, there are two sets of indicators – for community
energy groups and for community energy projects.
Table 8: Key Indicators
Community Group
Key Indicators Metric Who When How
Date of inception
Overall members
Active members and supporters
Active decision makers
Events organised. Distinguish: -small scale (<20), - medium scale (20-100), - large scale (>100 participants)
Resources scale
Obstacles scale
Changes in Key Drivers scale
Day/Month/Year
# members overall
# active members
# people involved in decision making
# events - events < 20 - events 20-100 - events >100
Rating scale (5 pt)
Rating scale (5 pt)
Rating scale (5 pt)
C4CE Secretariat
C4CE Secretariat
C4CE Secretariat
C4CE Secretariat
C4CE Secretariat
C4CE Secretariat
C4CE Secretariat
C4CE Secretariat
Once
Annually
Annually
Annually
Annually
Annually
Annually
Annually
Telephone Survey
Annual CIA Survey
Annual CIA Survey
Annual CIA Survey
Annual CIA Survey
Annual CIA Survey
Annual CIA Survey
Annual CIA Survey

COLLECTIVE IMPACT ASSESSMENT REPORT | 23
Community Energy Project
Key Indicators Metric Who When How
Technology
Business model / Project type
Size of installed systems
Systems in planning
Project cost
Contract length (operation)
Total expected income
Number of investors/ project
Amount of funding by source
Amount of renewable energy produced
Volunteer hours
Jobs created by project stage
Tonnes CO2e avoided
Multiple choice
Multiple choice
# kW installed
# kW in planning
$
Years
$
# of investors
$ by funding source
# kWh generated
# hours/ project stage
# jobs (employee hours)
tonnes CO2e
Community Group
Community Group
Community Group
Community Group
Community Group
Community Group
Community Group
Community Group
Community Group
Community Group
Community Group
Community Group
Calculated
Ongoing
Ongoing
Ongoing
Ongoing
Ongoing
Ongoing
Ongoing
Ongoing
Ongoing
Ongoing
Ongoing
Ongoing
Ongoing
CIA Platform
CIA Platform
CIA Platform
CIA Platform
CIA Platform
CIA Platform
CIA Platform
CIA Platform
CIA Platform
CIA Platform
CIA Platform
CIA Platform
Calculated (from kWh produced
Additional optional indicators are outlined in Table 9 below. These could be provided if groups have
easily accessible data and the time to provide them. In some cases, these indicators will not be
applicable to all community groups.
Table 9: Optional Indicators
Community Groups
Community Energy Projects
Optional Indicators Metric Optional Indicators Metric
Social media supporters
Media coverage
Political advocacy
Political support
# of ‘friends’ or ‘likes’ on FB
# articles (radio, TV, press)
# people participating
# Political appearances at events
Public interest
Resistance
Primary land-use support Installations (dispersed)
Projects ‘inspired”
Flow-on outputs
RoI
Costs versus Savings
Payback period
Energy savings
# of visits/ visitors
# of objections/ complaints
$ supporting primary producer land use
# of installations
#. kW of projects ‘inspired”
$ flow-on outputs
% RoI
Cost-Benefit Analysis
Yearsr
$ savings (energy)
It is further recommended that a process be set up to review these indicators annually (as part of the
data collection process proposed below), in collaboration with representatives of key stakeholders in
the community energy sector to ensure that all indicators are relevant and that parsimony of the set of
key indicators can be achieved. However, consistency of indicators year on year will allow for
comparative analysis and building a picture of the community energy sector as it develops and should
remain a core principle that underpins the indicator review process.
COLLECTIVE IMPACT ASSESSMENT REPORT | 24
Responsibility for reporting on the collective impact of the community energy sector is currently
proposed to lie with the Coalition for Community Energy. Specifically, delivery of annual reporting is
expected to be undertaken by the C4CE Backbone support organisation (Secretariat) and the C4CE
Data Committee which was established through this project.
It is proposed that C4CE send out an annual reminder to community groups to ensure that the data for
their community group in the Shared Measure Platform is current. Specifically, requesting groups to (a)
update their group information, and to (b) add all their latest project data. In addition, a short survey with
the scales used in this baseline assessment - ‘Resources’, ‘Obstacles’ and ‘Changes in Key Drivers’
would be circulated at the same time.
The information provided through these scales, albeit subjective judgments, provide valuable insights in
regards to what community energy organisations perceive to be obstacles to them achieving their
intended objectives. Other studies have shown that subjective assessments of items that are
observable at the individual level correlate highly with more ‘objective’ data based on measurements
(Parry, Kirsch, Carey & Shaw, 2014).
Additionally, community energy groups would be encouraged to integrate these rating scales into their
efforts to survey their own membership base.
Finally, development of case studies to provide more depth to the collected data and to illustrate the
projects’ story from a more human perspective including the inspiration and passion of local community
energy groups, the challenges and obstacles faced as well as the successes and how these were
achieved. Many case studies have already been captured on the Embark Wiki, with more in
development. However, a review of the results of the collective impact assessment should inform which
community energy case studies to capture.
Like all of the initiatives outlined in the National Community Energy Strategy, funding will need to be
sought for implementation of the collective impact assessment next steps. The Coalition for Community
Energy, will work with its now 50 member groups, funders and other stakeholders to advance initiatives
including this one where a) it is identified as a priority to progress the community energy sector in the
immediate context, b) there are organisations interested in pursuing it and c) there is a funding avenue
to be pursued. This prioritisation process will evolve over time and will be coordinated by the C4CE
Secretariat and Steering Group.
Photo: RePower Shoalhaven

COLLECTIVE IMPACT ASSESSMENT REPORT | 25
5 REFERENCES
- Hicks, J., Ison, N., Gilding, J. & Mey, F. (2014). Community-owned renewable energy – A How to
Guide. Community Power Agency. (available at http://cpagency.org.au/wp-
content/uploads/2014/06/CPAgency_HowtoGuide2014-web.pdf)
- Ison, N & Hicks, J (2012) ‘What is Community Energy’ in Shepherd, Allen and Harper, Home
Energy Handbook. Powys, Center for Alternative Technology Publications.
- Kania, J. & Kramer, M. (2011). Collective Impact. 4: 88, Stanford Social Innovation Review
(available at www.ssireview.org/articles/entry/collective_impact)
- O’Neill, D.W., Dietz, R., Jones, N. (Editors), 2010. Enough is Enough: Ideas for a sustainable
economy in a world of finite resources. The report of the Steady State Economy Conference.
Center for the Advancement of the Steady State Economy and Economic Justice for All, Leeds,
UK.
- Wiseman, J., Edwards, T. & Luckins. K. (2013). Post Carbon Pathways: Towards a Just and
Resilient Post Carbon Future; Learning from leading international post-carbon economy
researchers and policy makers. Melbourne Sustainable Society Institute, University of Melbourne
and the Centre for Policy Development (available at www.postcarbonpathways.net.au/wp-
content/uploads/2013/05/Post-Carbon-Pathways-Report-2013_Final-V.pdf)
5.1 DATA FEEDS AND ONLINE RESOURCES - www.mistervint.com
- www.observant.net
- http://beta.energyarchipelago.com

COLLECTIVE IMPACT ASSESSMENT REPORT | 26
A
The table below outlines the indicators used in the baseline assessment, by STEEP category and
where they fit into the results chain.
Indicator Category Scale Data Collection Key Indicators
Results Chain

COLLECTIVE IMPACT ASSESSMENT REPORT | 27
B

COLLECTIVE IMPACT ASSESSMENT REPORT | 28

COLLECTIVE IMPACT ASSESSMENT REPORT | 29
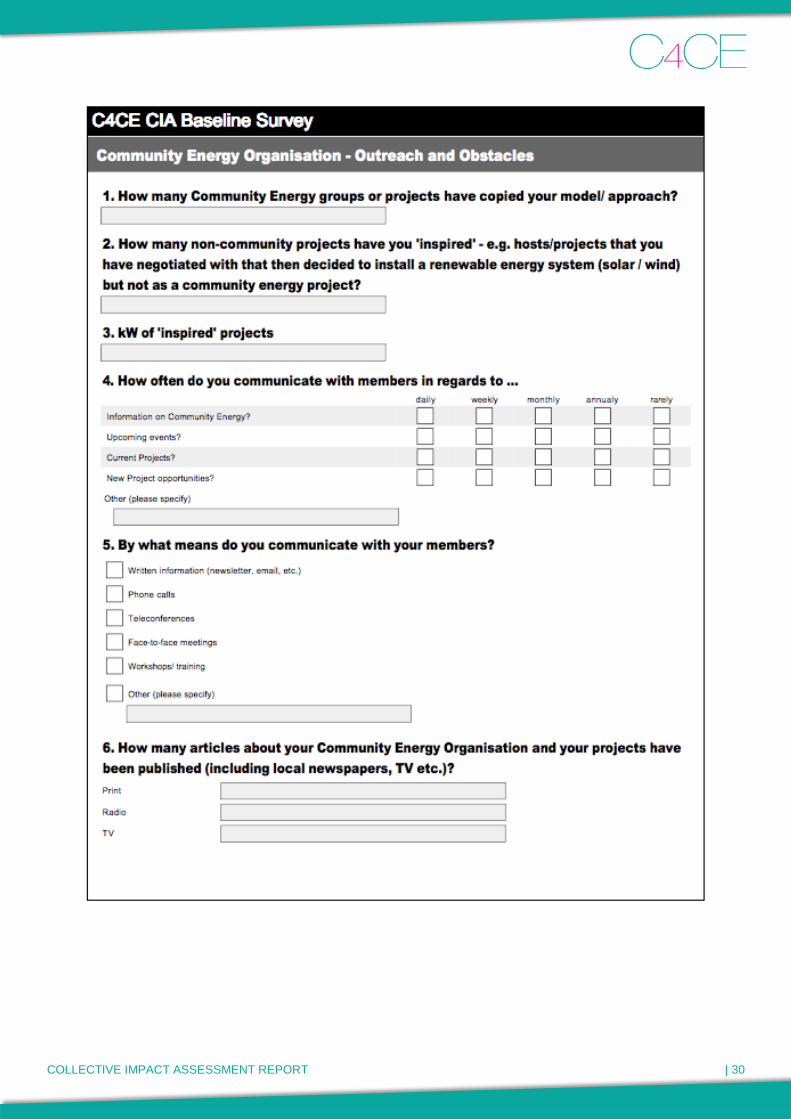
COLLECTIVE IMPACT ASSESSMENT REPORT | 30

COLLECTIVE IMPACT ASSESSMENT REPORT | 31

COLLECTIVE IMPACT ASSESSMENT REPORT | 32

COLLECTIVE IMPACT ASSESSMENT REPORT | 33

COLLECTIVE IMPACT ASSESSMENT REPORT | 34

COLLECTIVE IMPACT ASSESSMENT REPORT | 35

COLLECTIVE IMPACT ASSESSMENT REPORT | 36
C
SUM AVERAGE Min Max StdDev
Projects in Planning 52 2.36 0 10 2.70
Operating Projects 334 13 0 300 59.82
Decision Makers 165 5 2 10 2.20
Project duration/ Contract term (years)
9 0 25 7.68
kW installed 9,256 264 1.5 4,100 832.33
kWh produced (to date) 50,350,501 1,480,897 0 37,190,656 6,634,892.22
kW saved (Energy efficiency projects) 16,851 2,809 0 15,000 6,015.26
Project cost ($AU) $21,190,386 $605,440 $0 $13,100,000 2,414,165.51
Grant funding $5,773,000 $641,444 $0 $3,000,000 1,046,073.03
Bank loans $4,100,000 $1,366,667 $0 $3,100,000 1,582,192.57
Investor Funding $15,932,500 $2,276,071 $25,500 $9,600,000 3,695,248.55
CE Group Funding $50,000 $25,000 $0 $50,000 35,355.34
Philanthropy/ Donations $236,386 $9,455 $3,157 $55,000 14,169.54
Number of investors 2067 188 0 1500 444.51
Average amount of investment ($AU) $102,120 $11,347 $500 $25,500 9,799.57
Expected Income - all $39,231,770 $3,566,525 $0 $23,000,000 7,914,368.16
Expected Payback Period
5.6 5 7 0.95
Expected Internal Rate of Return (IRR)
8.4 0 12.65 5.79
Income generated to date ($AU) $3,550,852 $394,539 $0 $2,723,026 908,825.01
Expected energy cost savings over project lifetime ($AU) $586,254 $24,427 $0 $300,000 59,043.28
Energy cost savings to date ($AU) $59,000 $3,105 $0 $7,200 2,225.48
Amount invested in community benefit schemes $159,000 $19,875 $0 $77,000 33,917.71
Volunteer Hours Development 13,565 1,233 5 12,000 3,582.44
Volunteer Hours Planning 330 37 10 100 27.84
Volunteer Hours Installation 20 5 0 10 5.77
Volunteer Hours Operation (ongoing p/a) 856 122 2 500 180.89
Job Creation Development (in employee hours) 3,160 632 20 3,000 1,323.83
Job Creation Planning (in employee hours) 3,448 150 16 3,000 621.40
Job Creation Installation (in employee hours) 26,570 984 0 14,609 3,110.48
Job Creation (Ongoing - Operation) 14,863 1,486 1 8,348 3,105.91
Products sourced locally (%)
12 0 50 13.22
Services sourced locally (%)
92 50 100 20.41
Site Visits 15 2.5 0 5 1.87
Visitors 10,112 1,445 0 10,000 3,772.77
Media Articles 125 4.2 0 50 9.84
Objections 18 0.72 0 18 3.60
CO2 Emissions Avoided to date (tonnes) 43,116 880 0 31,984 4,768.84
COLLECTIVE IMPACT ASSESSMENT REPORT | 37
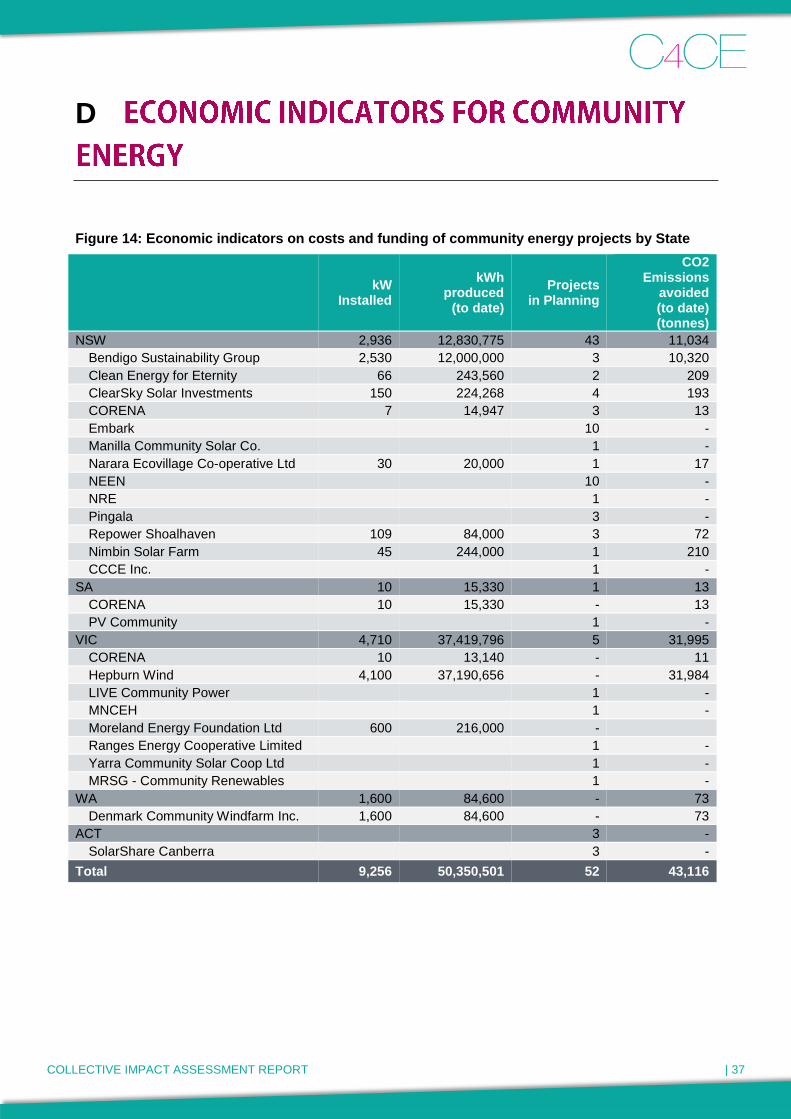
D
Figure 14: Economic indicators on costs and funding of community energy projects by State
kW
Installed
kWh produced
(to date)
Projects in Planning
CO2 Emissions
avoided (to date) (tonnes)
NSW 2,936 12,830,775 43 11,034
Bendigo Sustainability Group 2,530 12,000,000 3 10,320
Clean Energy for Eternity 66 243,560 2 209
ClearSky Solar Investments 150 224,268 4 193
CORENA 7 14,947 3 13
Embark
10 -
Manilla Community Solar Co.
1 -
Narara Ecovillage Co-operative Ltd 30 20,000 1 17
NEEN
10 -
NRE
1 -
Pingala
3 -
Repower Shoalhaven 109 84,000 3 72
Nimbin Solar Farm 45 244,000 1 210
CCCE Inc.
1 -
SA 10 15,330 1 13
CORENA 10 15,330 - 13
PV Community
1 -
VIC 4,710 37,419,796 5 31,995
CORENA 10 13,140 - 11
Hepburn Wind 4,100 37,190,656 - 31,984
LIVE Community Power
1 -
MNCEH
1 -
Moreland Energy Foundation Ltd 600 216,000 -
Ranges Energy Cooperative Limited
1 -
Yarra Community Solar Coop Ltd
1 -
MRSG - Community Renewables
1 -
WA 1,600 84,600 - 73
Denmark Community Windfarm Inc. 1,600 84,600 - 73
ACT
3 -
SolarShare Canberra
3 -
Total 9,256 50,350,501 52 43,116