college of business and economics - de la salle … effect in the philippine stock market 3 november...
TRANSCRIPT

College of Business and Economics CHED Center of Development in Business and Management Education
The Day-of-the-week effect in the Philippine Stock Market
January 3, 2000 to July 23, 2004
SERIES 2004-010
Catherine Kalayaan S. Almonte, MBA De La Salle University – Manila, Philippines
The CBERD Working Paper Series constitutes studies that are preliminary and subject to further revisions. They are being circulated in a limited number of copies only for purposes of soliciting comments and suggestions for further refinements. The studies under the Series are unedited and unreviewed. The views and opinions expressed are those of the author(s) and do not necessarily reflect those of the Center. Not for quotation without permission from the author(s) and the Center.
For comments, suggestions or further inquiries please contact: Center for Business and Economics Research and Development (CBERD)
2nd Floor, Medrano Hall, La Salle Bldg., 2401 Taft Avenue, Manila, Philippines Tel Nos: (632) 3030869 and (632) 5244611 loc. 149; Fax No: (632) 3030869
Email: [email protected] Or visit our website at http://www.dlsu.edu.ph

Day-of-the-week effect in the Philippine Stock Market 2 November 2004
About the Author
Catherine Kalayaan S. Almonte is a part-time faculty member of the Financial Management Department, of the College of Business and Economics, De La Salle University-Manila. In 1996, she obtained her undergraduate degree, Bachelor of Science in Commerce Major in Management of Financial Institutions (BSC-MFI), from De La Salle University. In 2002, she earned her Master of Business Administration (MBA) degree from De La Salle University Professional Schools, Inc. She is currently enrolled in the Doctor of Business Administration (DBA) program of the same institution.

Day-of-the-week effect in the Philippine Stock Market 3 November 2004
Abstract The returns of the Philippine Stock Exchange (PSE) Composite Index (PHISIX) were used to determine the existence of the day-of-the-week effect in the Philippine stock market from January 3, 2000 to July 23, 2004. The Kruskal-Wallis H test showed that at least one of the trading days is different from at least one of the other trading days. Further analysis revealed that the medians of (1) Monday returns were significantly different from Friday returns and (2) Tuesday returns were significantly different from Friday returns. Hence, the Philippine stock market was observed to exhibit some form of market inefficiency. Keywords: day-of-the-week effect, Monday effect, weekend effect, efficient market hypothesis, Philippine Stock Exchange (PSE) Composite Index (PHISIX), stock returns

Day-of-the-week effect in the Philippine Stock Market 4 November 2004
Table of Contents
1. Introduction 6
A. Background of the study 6 B. Framework 6 The efficient market hypothesis (EMH) 6 Relevant data sets 7 C. Scope and limitations of the study 8 D. Assumptions of the study 9 E. Definition of terms 9
2. Review of related literature 10 3. Methodology 11
A. Research design 11 B. Population and respondents 11 C. Sampling design 11 D. Measurement and instrumentation 11 Measurement 11 Instrumentation 12 E. Research procedures 13
4. Analysis 15 A. Initial tests 15
B. Data transformation 16 C. Post-transformation tests 17 D. Descriptive statistics 18 E. Kruskal-Wallis H test 19
5. Conclusions and recommendations 21 References 22 Appendices 23
List of tables Table 1 Relationship of variables used in nonparametric test 7 Table 2 Selected annual data on the PHISIX (a, b, c, d) 8 Table 3 Normality statistics for the variable Return 15 Table 4 Normality statistics for the variable BCRet 17 Table 5 Summary statistics of variables 18
Table 6 Kruskal-Wallis H test 19 Table 7 Test statistics (a, b) 19 Table 8 Multiple comparisons between treatments 20 Table 9 Supporting computation for number of comparisons 25

Day-of-the-week effect in the Philippine Stock Market 5 November 2004
Table 10 Supporting computation for critical value of z (a) 25 Table 11 Supporting computations for differences 25
between the average rankings Table 12 Supporting computations for critical difference 26
List of figures
Figure 1 Further analysis of the Kruskal-Wallis H test 8 Figure 2 Histogram of the variable Return 15 Figure 3 Normal probability plot of the variable Return 16 Figure 4 Histogram of the variable BCRet 17 Figure 5 Normal probability plot of the variable BCRet 18 Figure 6 Boxcox transformation output from Stata 8.0 24
Day-of-the-week effect in the Philippine Stock Market 6 November 2004
The Day-of-the-week Effect in the Philippine Stock Market January 3, 2000 to July 23, 2004
Catherine Kalayaan S. Almonte De La Salle University - Manila
1. Introduction A. Background of the study
The day-of-the-week effect sometimes called Monday effect or weekend effect, in its traditional sense, suggests that “stocks tend to peak in value on Friday and generally decline in value on Monday” (Hirt and Block, 2003).
This phenomenon has been legitimate “over many decades” (Hirt and Block 2003) although others have found that this market anomaly does not hold true for other markets (Aly, Mehdian, & Perry, 2004; Platev, Lyroudi, & Kanaryan, n.d.; Wong, Hui, & Chan, 1992). Some even observed the day-of-the-week effect but in a different form (Lyroudi, Subeniotis, and Komisopoulos, 2002). This study considers the presence of the day-of-the-week effect if it occurs in the traditional sense or if it occurs in its variant forms.
The day-of-the-week effect is a contradiction of the efficient market hypothesis (EMH;
Aly, et al., 2004). This is so because if the market is efficient then “security prices fully reflect all available information” (Higgins, 1992) and that it would be futile to try to find “mispriced (undervalued or overvalued) securities” since stocks are “fully and fairly priced” (Gitman, 2003).
This study examines if the day-of-the week effect exists in the Philippine setting, specifically the Philippine stock market, by using the daily returns of the Philippine Stock Exchange (PSE) Composite Index (PHISIX) from January 3, 2000 to July 23, 2004.
The research hypothesis is that daily stock market returns on Monday, Tuesday, Wednesday, Thursday, and Friday are significantly different from one another. B. Framework The efficient market hypothesis (EMH)
The EMH “evolved in the 1960s from the Ph.D. dissertation of Eugene Fama” (Higgins, 1992). According to Fama (1965):
An ‘efficient’ market is defined as a market where there are
large numbers of rational, profit-maximizers actively competing, with each trying to predict future market values of individual securities, and where important current information is almost freely available to all participants.

Day-of-the-week effect in the Philippine Stock Market 7 November 2004
In an efficient market, competition among the many intelligent participants leads to a situation where, at any point in time, actual prices of individual securities already reflect the effects of information based both on events that have already occurred and on events which, as of now, the market expects to take place in the future. In other words, in an efficient market at any point in time the actual price of a security will be a good estimate of its intrinsic value.
There are three forms of market efficiency: weak, semi-strong, and strong (Higgins, 1992). Higgins (1992) states that the weak form of market efficiency “asserts that all past market prices and data are fully reflected in securities prices”, making technical analysis useless; the semi-strong form of market efficiency “asserts that all publicly available information is fully reflected in securities prices”, making fundamental analysis irrelevant; and the strong form of market efficiency “asserts that all information is fully reflected in securities prices”, making insider information immaterial.
Thus, the presence of market anomalies like the day-of-the-week effect, January effect and others contradict the EMH (Aly, et al., 2004).
Relevant data sets
The study is about the day-of-the-week effect in the Philippine stock market from January 3, 2000 until July 23, 2004.
The following variables were used: Return and Days.
The Kruskal-Wallis H test was used to test the hypothesis (refer to section 4 for details). Return, calculated based on the closing values of the index, was used as the test variable while Days was used as the grouping variable. Number coding was utilized with 1 representing Monday, 2 representing Tuesday, 3 representing Wednesday, 4 representing Thursday, and 5 representing Friday. The variables are expressed in the table below:
Table 1. Relationship of variables used in nonparametric test
Day Return
1 Returns for Monday 2 Returns for Tuesday 3 Returns for Wednesday 4 Returns for Thursday 5 Returns for Friday
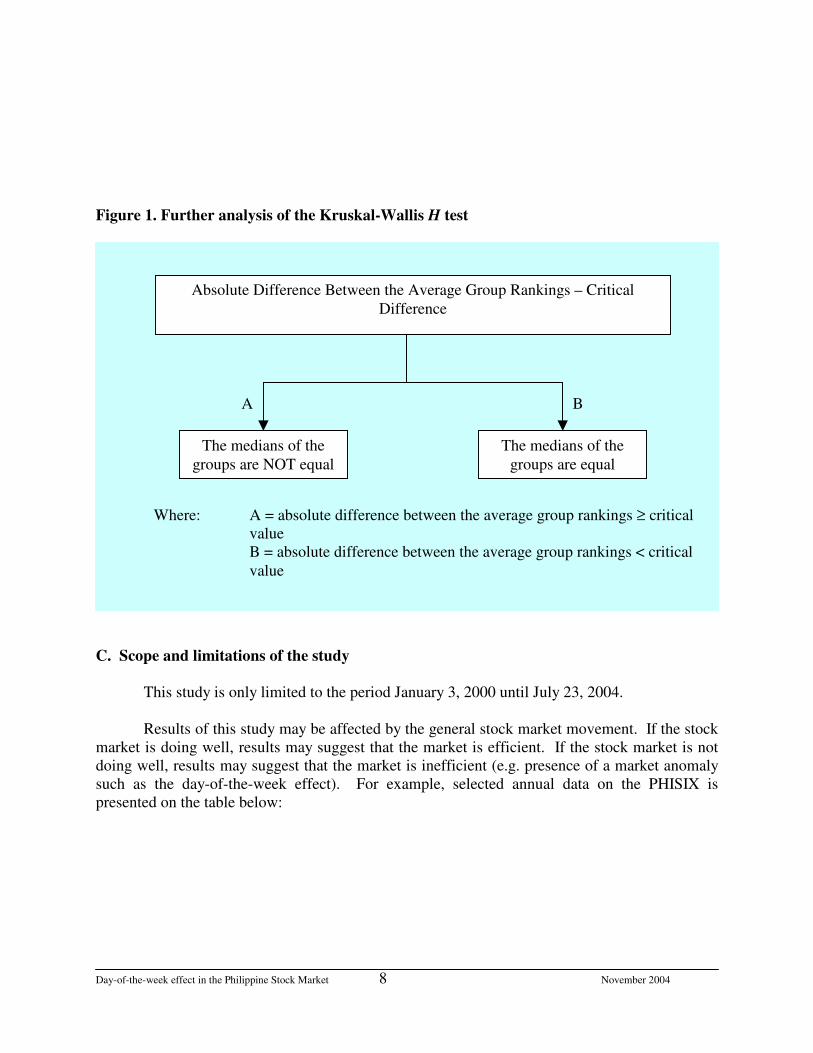
Further analysis was made since the Kruskal-Wallis test produced a significant result (refer to section 4 E for details). Each trading day was compared with other trading days to establish which days are different from each other. The figure 1 below shows how the analysis was conducted:
Day-of-the-week effect in the Philippine Stock Market 8 November 2004
Figure 1. Further analysis of the Kruskal-Wallis H test
C. Scope and limitations of the study This study is only limited to the period January 3, 2000 until July 23, 2004. Results of this study may be affected by the general stock market movement. If the stock market is doing well, results may suggest that the market is efficient. If the stock market is not doing well, results may suggest that the market is inefficient (e.g. presence of a market anomaly such as the day-of-the-week effect). For example, selected annual data on the PHISIX is presented on the table below:
A B
Where: A = absolute difference between the average group rankings ≥ critical value B = absolute difference between the average group rankings < critical value
Absolute Difference Between the Average Group Rankings – Critical Difference
The medians of the groups are NOT equal
The medians of the groups are equal

Day-of-the-week effect in the Philippine Stock Market 9 November 2004
Table 2. Selected Annual Data on the PHISIX (a, b, c, d)
1999 2000 2001 2002 2003 Market Capitalization (in PHP)
1.937 Trillion 2.577 Trillion 2.141 Trillion 2.083 Trillion 2.974 Trillion
Closing Value 2,142.97 1,494.50 1,168.08 1,018.41 1,442.37 Change in Closing Value (in %)
8.55 (30.26) (21.84) (12.81) 41.63
Number of Trading Days
251 250 247 246 247
a Source: Draft of the Philippine Stock Exchange Fact Book 2003 (2004) by the Research and International Affairs Department, The Philippine Stock Exchange, Inc. b PHP = Philippine Peso c Market capitalization amounts differ to that presented in the Draft of the Philippine Stock Exchange Fact Book 2003 (2004) due to rounding d Unavailable annual data for 2004 Table 2 shows that the stock market has not been performing well over the five-year period. This is evidenced by the sharp decline in the closing values of the PHISIX for years 2000 through 2002. Although the closing value improved dramatically in 2003 (with a 41.63 percent increase), if a significant portion of a study on the day-of-the-week effect consisted of periods with declining values, such as this study, then the result might confirm the existence of said market anomaly because of the sample period chosen.
The closing values of the PHISIX were considered as the main component of returns. Transaction costs were not considered in the study. The PHISIX is only made up of 30 firms listed in the PSE. As such, results of this study
should be taken cautiously.
D. Assumptions of the study
This study assumes that the data obtained are true and correct and that the PHISIX represents the general movement of the Philippine stock market. E. Definition of terms
Philippine Stock Exchange (PSE) Composite Index (PHISIX) is an “aggregate measure of relative changes in the market capitalization of common stocks that provides comprehensive picture of market trends. Composed of a fixed basket of 30 listed common stocks carefully selected to represent general movement of market prices” (Philippine Stock Exchange website, http://www.pse.com.ph/, 2001).

Day-of-the-week effect in the Philippine Stock Market 10 November 2004
According to the Philippine Stock Exchange Fact Book 1999-2000 (2001, p. 45), the index is calculated by using a chain-linking method so that the data series is not disrupted due to adjustments. The same source cites the formula for the daily chaining method:
Equation 1 tionCapitalizaMarket s'Yesterday
tionCapitalizaMarket sToday' Index sYesterday' Index sToday' ×=
Where: Market Capitalization = Closing Price X Outstanding
Shares
Return is the “total gain or loss experienced on an investment over a given period of time” (Gitman, 2003, p. 214). For this study, Return, signifies PHISIX Return. 2. Review of related literature The day-of-the-week market anomaly has been studied by other researchers. Some of these studies were conducted by the following:
Aly, et al. (2004) studied the existence of the day-of-the week effect in the Egyptian stock market, which has only four trading days (Monday to Thursday), for the period April 26, 1998 until June 6, 2001. They have concluded that “Monday returns in the Egyptian stock market are positive and significant on average, but are not significantly different from returns of the rest of the week”, making the market “consistent with the weak form of market efficiency”.
Lyroudi, et al. (2002) determined that for the period January 1, 1997 to December 30, 1999 the day-of-the-week effect was existent in the Greek stock market but in a different form. Instead of having negative returns on Mondays, returns were positive and statistically significant. This was also true for Tuesdays and Wednesdays. The negative returns occurred during Thursdays but they were not statistically significant.
Platev, et al. (n.d.) studied the day-of-the-week effect in the Central European transition stock markets from September 22, 1997 to March 29, 2002 and have determined the following: Monday returns were negative and significant for the Czech and Romanian stock markets, Wednesday returns were positive and significant for the Slovenian stock market but Friday returns were negative and not significant, and the day-of-the-week effect was non-existent in the Polish and Slovak stock markets. Al-Rjoub (n.d.) prepared a paper on the day-of-the-week effect in the Amman Stock Exchange. The Amman Stock Exchange is quite unique in that the first trading day starts on Sunday whereas most markets start trading on Mondays. His study revealed that Thursday returns “tend to be positive and the highest” while Monday returns are “negative and the worst”. Bildik (1999) observed the day-of-the-week effects in Turkish stock and money markets. His study showed that a significant day-of-the-week effect exists “both in overnight interest rate changes and stock returns”. Specifically, Bildik (1999) observed that overnight interest rates fell

Day-of-the-week effect in the Philippine Stock Market 11 November 2004
significantly during Wednesdays and rose during Mondays “relative to the previous days” while stock market returns were “lower in the first two days of the week” and “higher in the second part of the week”. Wong, et al. (1992) studied the day-of-the-week effect in the Hong Kong, Malaysia, Singapore, Taiwan, and Thailand stock markets. They determined that the aforementioned stock markets, except for Taiwan, exhibited “negative mean returns on Monday or Tuesday and high positive returns on Friday”. French (1980) used the daily returns of “Standard and Poor’s composite portfolio” found out that “the average return for the other four days of the week was positive” while “the average for Monday was significantly negative during each of five five-year subperiods”. 3. Methodology A. Research design
A descriptive research design was used. Secondary data was utilized.
B. Population and respondents
Closing values of the PHISIX was obtained. The time-frame considered for the study was the period January 3, 2000 until July 23, 2004. C. Sampling design
Judgment sampling, a type of purposive sampling under nonprobability sampling, was used.
The sample consisted of closing values of the PHISIX from December 29, 1999 until July
23, 2004. This is so because the variable Returns is a vital component of the study. PHISIX Returns could only be computed if previous closing values were present. For example, the return for January 3, 2000 was computed by dividing the closing value of January 3, 2000 (the current period) by the closing value of December 29, 1999 (the previous period).
D. Measurement and instrumentation Measurement
In finance, return is computed by “dividing the asset’s cash distributions during the period, plus change in value, by its beginning-of-period investment value” (Gitman, 2003, p. 214). Thus, expressed in the following formula:
Equation 2 1t-
1t-tt V
CFs V - V Return
+=

Day-of-the-week effect in the Philippine Stock Market 12 November 2004
Where: Returnt = return at time t Vt = value at time t
Vt-1 = value at time t – 1 CFs = cash flows from time t – 1 to t If cash flows (or cash distributions) are non-existent, then equation 2 would be simplified as follows:
Equation 3 1t-
1t-tt V
V - V Return =
Where: Returnt = return at time t Vt = value at time t
Vt-1 = value at time t – 1
However, it is possible that equation 3 would produce negative return values. Negative return values might be problematic in case data transformation needs to be implemented. In order to address this issue, an index-based return expressed in equation 4 was used instead of equation 3.
Equation 4 1t-
tt V
V Return =
Where: Returnt = return at time t Vt = value at time t
Vt-1 = value at time t – 1
Thus, under equation 4, a return value of exactly 1 means zero gain and zero loss, a return value of > 1 means a gain, and a return value of < 1 means a loss. Instrumentation
Ideally, a parametric test would be preferred over a nonparametric test. However, the data exhibited non-normality even after transformation so the Kruskal-Wallis H test, a nonparametric test, was used (refer to section 4 for details). “The Kruskal-Wallis technique tests the null hypothesis that the k samples come from the same population” (Siegel and Castellan, Jr., 1988). If the computed value is significant, “it indicates that at least one of the groups is different from at least one of the others. It does not tell the researcher which ones are different, nor does it tell the researcher how many of the groups are different from each other” (Siegel and Castellan, Jr., 1988).

Day-of-the-week effect in the Philippine Stock Market 13 November 2004
In order to determine which groups are different, the following criteria (Siegel and Castellan, Jr., 1988) was used:
Equation 5 ( )
���
����
�++≥− −α
vu)1k(k/vu n
1n1
121NN
zRR
Where: rankings average ebetween th sdifference RR vu =−
z of valuecritical z )1k(k/ =−α
( )
difference critical n1
n1
121NN
zvu
)1k(k/ =���
����
�++
−α
u group ofrank average R u =
vgroup ofrank average R v = k = number of groups N = number of cases in the pooled sample nu = number of cases in group u nv = number of cases in group v Equation 5 tests whether the null hypothesis that medians of some groups u and v are equal against the alternative hypothesis that the medians of groups u and v are not equal (Siegel and Castellan, Jr., 1988). If the difference of the average of the ranks between the groups is greater than or equal to the critical value, then the null hypothesis that the medians of some groups u and v are equal is rejected and conclude than the medians of some groups u and v are not equal (Siegel and Castellan, Jr., 1988).
Note that the critical value of z was obtained by looking at Table AII, “a table of the standard normal distribution which has been arranged so that values used in multiple comparisons may be obtained easily” (Siegel and Castellan, Jr., 1988). The intersection of the value of α and the number of comparisons is the critical value of z (Siegel and Castellan, Jr., 1988, p. 213 - 214). The formula (Siegel and Castellan, Jr., 1988) used to determine the number of comparisons is given below:
Equation 6 ( )
21kk
c#−=
Where: #c = number of comparisons or row entries k = number of groups
E. Research procedures The following steps were conducted for this study:

Day-of-the-week effect in the Philippine Stock Market 14 November 2004
1. Daily data on the closing values of the PHISIX from December 29, 1999 until July 23, 2004 was obtained from the internet (website http://finance.yahoo.com/q/hp?s=^PSI ) on July 25, 2004. The data was downloaded into Excel.
2. The data was verified via the local newspapers such as: Manila Bulletin, Philippine Daily
Inquirer, and Business World. Any discrepancy between the downloaded data and the published newspaper data was addressed.
3. The data was rearranged from earliest to latest since the downloaded data was originally
arranged from latest to earliest. 4. Daily return values were computed using equation 4. 5. A Days column was added in Excel in order to perform the Kruskal-Wallis H test. The
number 1 would be placed to indicate Monday, the number 2 would be placed to indicate Tuesday, and so forth.
6. The file was saved under Excel and also under Excel’s comma delimited format (*.csv). It
was necessary to save the file in *.csv format so that the data could be run in Stata 8.0. 7. The level of significance was set at 95%. 8. The Return values were tested for normality. 9. The Return values were transformed using Boxcox transformation. 10. Post-transformation tests were conducted. 11. Statistical tests were performed. 12. Conclusions and recommendations were made.

Day-of-the-week effect in the Philippine Stock Market 15 November 2004
4. Analysis A. Initial tests The Return variable was tested for normality. EViews 5 generated the following results:
Table 3. Normality statistics for the variable Return
Statistic Value
Skewness 3.021529 Kurtosis 40.72231 Jarque-Bera 68717.72 Probability of Jarque-Bera 0.000000 The probability of the Jarque-Bera statistic is not more than 0.05. This indicates that the distribution is not normal because “a small probability value leads to the rejection of the null hypothesis of a normal distribution” (Quantitative Micro Software, LLC, 2004, p. 300).
Moreover, skewness is not zero and kurtosis is > 3. These indicate that the variable Return is not normally distributed.
Furthermore, a histogram and a normal probability plot were constructed using Stata 8.0.
Figure 2. Histogram of the variable Return
010
020
030
040
0Fr
eque
ncy
.95 1 1.05 1.1 1.15 1.2Return
Based on Figure 2, the variable Return, is not normally distributed. The histogram is skewed and leptokurtic.

Day-of-the-week effect in the Philippine Stock Market 16 November 2004
Figure 3. Normal probability plot of the variable Return
0.00
0.25
0.50
0.75
1.00
Nor
mal
F[(
retu
rn-m
)/s]
0.00 0.25 0.50 0.75 1.00Empirical P[i] = i/(N+1)
Based on Figure 3, the variable Return, is not normally distributed since there are a
number of points that fall far from the diagonal line.
B. Data transformation Boxcox transformation is “used for nonnegative response variables” (Albert, 2004) and “uses the power transformation” (Albert, 2004).
Boxcox transformation was used to normalize the variable Return. Using Stata 8.0, the boxcox regression generated a coefficient of -8.985387 (see Figure 6, Appendix section for details). Therefore, each transformed return (boxcox return symbolized as BCRet) was computed by using the following formula:
Equation 7 985387.8
1turnRe
1
tReBC985387.8
tt −
−
=
Where: BCRett = boxcox return at time t or transformed return at time t Returnt = return at time t

Day-of-the-week effect in the Philippine Stock Market 17 November 2004
C. Post-transformation tests The BCRet variable was tested for normality. EViews 5 generated the following results:
Table 4. Normality statistics for the variable BCRet
Statistic Value Skewness -0.313337 Kurtosis 9.037882 Jarque-Bera 1734.961 Probability of Jarque-Bera 0.000000 The probability of the Jarque-Bera statistic is not more than 0.05 which indicates that the distribution is not normal.
The skewness and kurtosis of the transformed variable improved compared with the skewness and kurtosis of the original variable. However, skewness is still not zero and kurtosis still exceeds 3 so the transformed variable still does not follow a normal distribution.
The transformed Return variable, BCRet, was also tested for normality using a histogram
and a normal probability plot using Stata 8.0.
Figure 4. Histogram of the variable BCRet
050
100
150
200
250
Freq
uenc
y
-.1 -.05 0 .05 .1BCRet
Based on Figure 4, the variable BCRet is not normally distributed. The histogram is leptokurtic.

Day-of-the-week effect in the Philippine Stock Market 18 November 2004
Figure 5. Normal probability plot of the variable BCRet
0.00
0.25
0.50
0.75
1.00
Nor
mal
F[(b
cret
-m)/
s]
0.00 0.25 0.50 0.75 1.00Empirical P[i] = i/(N+1)
Figure 5 is an improvement compared with that of Figure 3 in that more points are nearer to the diagonal line. However, there are still a number of points that are far from this 45-degree line. Although, a perfect alignment between the data and the diagonal line is very difficult to achieve, an examination of this graph might lead someone to think that the data is normal. As such, this graph along with the histogram (Figure 4) and the results of Table 4 are necessary to determine if the transformed variable, BCRet, is normal.
Thus, based on the results generated by EViews 5 and Stata 8.0, the transformed variable BCRet, is still not normal. D. Descriptive statistics Summary statistics, using Stata 8.0, of the different variables are presented in the table below: Table 5. Summary statistics of variables
Variable Obs Mean Std. Dev. Min Max
Return 1130 0.9998155 0.0141007 0.9399661 1.175597 BCRet 1130 -0.001086 0.0130379 -0.0828238 0.0852804 Days 1130 2.993805 1.407608 1 5 According to Table 5, the average Return of the PHISIX was negative 0.01845 percent (computed by subtracting 1 from the mean of 0.9998155 and then multiplying the difference by 100 percent). This is quite alarming because a stock market that generates losses, on the average, may discourage potential investors. For the sample period chosen, the lowest return was negative 6.00339 percent (computed by subtracting 1 from the minimum value of 0.9399661

Day-of-the-week effect in the Philippine Stock Market 19 November 2004
and then multiplying the difference by 100 percent) while the highest return was 17.5597 percent (computed by subtracting 1 from the maximum value of 1.175597 and then multiplying the difference by 100 percent). Thus, the total difference between the maximum and minimum values is 0.2356309 or 23.56309 percent (computed by subtracting 0.9399661 from 1.175597 or adding 6.00339 percent and 17.5597 percent). On the other hand, the transformed variable, BCRet, had a smaller total difference between the maximum and minimum values at 0.1681042 (computed by subtracting negative 0.0828238 from 0.0852804). The smaller total difference of the transformed variable was expected since transformations are supposed to normalize the data. E. Kruskal-Wallis H test The Kruskal-Wallis H test was performed using SPSS 11.50. Table 6. Kruskal-Wallis H test
Days N Mean Rank
1 223 537.93 2 231 528.00 3 228 561.98 4 226 568.01 5 222 633.27
Return
Total 1130 Table 6 shows the number of observations (N) for each day or group and their corresponding average ranks. These are useful for calculating the absolute difference between the average group rankings as well as the critical difference.
Based on the average ranks of the different trading days, the best day appears to be Friday (the day with the highest mean rank) while the worst day appears to be Tuesday (the day with the lowest mean rank). This is similar to the results of the study made by Wong, et al. (1992).
Table 7. Test statistics (a, b)
Return
Chi-square 14.257 df 4 Asymp. Sig. 0.007 a Kruskal Wallis Test b Grouping Variable: Days
Based on Table 7, there is a significant difference among the daily stock market returns of the different trading days (i.e., Monday, Tuesday, Wednesday, Thursday, and Friday) since the significance level, Asymp. Sig., is less than 0.05. However, it does not specify which group or groups are different from each other.

Day-of-the-week effect in the Philippine Stock Market 20 November 2004
In order to determine which groups are different from each other, multiple comparisons between treatments was performed. The results are summarized on Table 8. Table 8. Multiple comparisons between treatments
Groups Absolute Difference Between
the Average Group Rankings
Critical Difference
1 and 2 9.93 86.00 1 and 3 24.05 86.28 1 and 4 30.08 86.46 1 and 5 95.34 86.85 2 and 3 33.98 85.16 2 and 4 40.01 85.71 2 and 5 105.27 86.10 3 and 4 6.03 85.99 3 and 5 71.29 86.37 4 and 5 65.26 86.56
Supporting computations for Table 8 are placed in the Appendix Section (Tables 9 - 12). Based on Table 8, only the differences between (1) groups 1 and 5 (i.e., Monday and Friday) and (2) groups 2 and 5 (i.e., Tuesday and Friday) exceed their respective critical values. Thus, the medians of (1) Monday and Friday and (2) Tuesday and Friday are different from each other.
Hence, the research hypothesis is supported. The implication of the results suggests that even though the average return of the Philippine stock market generates a loss of 0.01845 percent, which may discourage potential investors, it may also be argued that since the Philippine stock market exhibits inefficiency, others may want to invest because there is money to be made. This latter point of view would probably be taken by practitioners and/or seasoned investors who have demonstrated their ability to make money on the stock market because of their timing and/or stock picking abilities.

Day-of-the-week effect in the Philippine Stock Market 21 November 2004
5. Conclusions and recommendations It was observed that the day-of-the-week effect exists in the Philippine stock market as confirmed by result of the Kruskal-Wallis H test. Therefore, the Philippine stock market exhibited some form of market inefficiency.
The Kruskal-Wallis test showed that at least one of the trading days is different from at
least one of the other trading days. Further analysis revealed that the medians of (1) Monday returns were significantly different from Friday returns and (2) Tuesday returns were significantly different from Friday returns. The results suggest that investors purchase securities either on Mondays or Tuesdays and sell securities on Fridays.
Some caveats: (1) although the day-of-the-week effect is present in the Philippine stock market, it does not automatically mean that this market anomaly will persist; (2) albeit knowledge of past (historical) performance is important it is not the only factor to consider when making investment decisions. The state of the economy, recent performance of the company, expected earnings of the firm, among other things, should also be taken into account; and (3) the question with regard to the generalizability of the results, at least in the Philippine setting, still remains to be answered. The time frame for this study happens to be when the stock market has generally not been doing well. Other studies, using different time frames (say, when the market is doing well) or sub-periods should be performed. Future research could also involve different samples, say the use of the All Shares Index or other indices instead of the PHISIX, studying each firm listed in the PSE to determine the presence of the day-of-the-week effect, etc. These would address the generalizability issues discussed earlier.

Day-of-the-week effect in the Philippine Stock Market 22 November 2004
References Al-Rjoub (n.d.). The daily return pattern in the amman stock exchange & the weekend effect.
Working paper. Retrieved June 20, 2004, from http://ssrn.com/abstract=484782. Albert, J. R. G. (2004). Unpublished handouts for multivariate statistics with time series
methods. Aly, H., Mehdian, S., & Perry, M. J. (2004). An analysis of the day-of-the-week effects in the
egyptian stock market. International journal of business, 9(3). Retrieved June 20, 2004 from, http://ssrn.com/abstract=551101.
Bildik, R. (1999). Day-of-the-week effects in turkish stock & money markets. Working paper. Retrieved June 20, 2004, from http://ssrn.com/abstract=259222.
Fama, E. F. (1965). Random walks in stock market prices. Financial analysts journal. Retrieved August 28, 2004, from EBSCO host (Business Source Premier).
French, K. R. (1980). Stock returns and the weekend effect. Journal of financial economics, 8(1). Retrieved August 28, 2004, from EBSCO host (Business Source Premier).
Gitman, L. J. (2003). Principles of managerial finance: Tenth edition. Boston, Massachusetts, USA: Addison-Wesley.
Higgins, R. C. (1992). Analysis for financial management: 3rd edition. Retrieved August 22, 2004, from http://www.investorhome.com/emh.htm.
Hirt, G. A. & Block, S. B. (2003). Fundamentals of investment management: Seventh edition. New York, NY, USA: McGraw-Hill/Irwin.
Lyroudi, K., Subeniotis, D., & Komisopoulos, G. (2002). Market anomalies in the a.s.e.: The day of the week effect. Working paper. Retrieved June 20, 2004, from http://ssrn.com/abstract=314394.
Philippine Stock Exchange (2001). Philippine stock exchange fact book 1999-2000. Pasig City, Philippines: Research and International Affairs Department, Philippine Stock Exchange, Inc.
Philippine Stock Exchange (2001). Stock market jargon. Retrieved August 22, 2004, from http://www.pse.com.ph/.
Philippine Stock Exchange (2004). Draft of the philippine stock exchange fact book 2003. Pasig City, Philippines: Research and International Affairs Department, Philippine Stock Exchange, Inc.
Platev, P., Lyroudi, K., & Kanaryan, N. (n.d.). The day of the week effect in the central european transition stock markets. Working paper. Retrieved June 20, 2004, from http://ssrn.com/abstract=434501.
Quantitative Micro Software, LLC (2004). EViews 5: User’s guide. Irvine, CA, USA: Quantitative Micro Software, LLC.
Siegel, S. & Castellan, N. J., Jr. (1988). Nonparametric statistics for the behavioral sciences: Second Edition. USA: McGraw-Hill.
Wong, K. A., Hui, T. K., & Chan C. Y. (1992). Day-of-the-week effects: Evidence from developing stock markets. Applied financial economics, 2. Retrieved August 28, 2004, from EBSCO host (Business Source Premier).
Day-of-the-week effect in the Philippine Stock Market 23 November 2004
Appendices Figure 6 Boxcox Transformation Output from Stata 8.0 Table 9 Supporting Computation for Number of Comparisons Table 10 Supporting Computation for Critical Value of z (a) Table 11 Supporting Computations for Differences Between the Average Rankings Table 12 Supporting Computations for Critical Difference

Day-of-the-week effect in the Philippine Stock Market 24 November 2004
Figure 6. Boxcox transformation output from Stata 8.0

Day-of-the-week effect in the Philippine Stock Market 25 November 2004
Table 9. Supporting computation for number of comparisons
Item Formula Solution Number of Comparisons
Number of Comparisons
( )2
1kk −
( )2
155 −
10
Table 10. Supporting computation for critical value of z (a)
Item Column Number of Comparisons or Row
Entries
Critical Value of z
Critical Value of z α = 0.05 10 2.807 a Used Table AII of Nonparametric Statistics for the Behavioral Sciences: Second Edition (1988) by Siegel and Castellan, Jr.
Table 11. Supporting computations for differences between the average rankings
Formula Solution Absolute Difference Between
the Average Group Rankings
21 RR − 52893.537 − 9.93
31 RR − 98.56193.537 − 24.05
41 RR − 01.56893.537 − 30.08
51 RR − 27.63393.537 − 95.34
32 RR − 98.561528 − 33.98
42 RR − 01.568528 − 40.01
52 RR − 27.633528 − 105.27
43 RR − 01.56898.561 − 6.03
53 RR − 27.63398.561 − 71.29
54 RR − 27.63301.568 − 65.26

Day-of-the-week effect in the Philippine Stock Market 26 November 2004
Table 12. Supporting computations for critical difference
Formula Solution Critical Difference
( )���
����
�++
−α21
)1k(k/ n1
n1
121NN
z ( )
��
���
� ++2311
2231
12111301130
807.2 85.99868662
( )���
����
�++
−α31
)1k(k/ n1
n1
121NN
z ( )
��
���
� ++2281
2231
12111301130
807.2 86.27614462
( )���
����
�++
−α41
)1k(k/ n1
n1
121NN
z ( )
��
���
� ++2261
2231
12111301130
807.2 86.46469886
( )���
����
�++
−α51
)1k(k/ n1
n1
121NN
z ( )
��
���
� ++2221
2231
12111301130
807.2 86.85076548
( )���
����
�++
−α32
)1k(k/ n1
n1
121NN
z ( )
��
���
� ++2281
2311
12111301130
807.2 85.1575486
( )���
����
�++
−α42
)1k(k/ n1
n1
121NN
z ( )
��
���
� ++2261
2311
12111301130
807.2 85.70777175
( )���
����
�++
−α52
)1k(k/ n1
n1
121NN
z ( )
��
���
� ++2221
2311
12111301130
807.2 86.09718211
( )���
����
�++
−α43
)1k(k/ n1
n1
121NN
z ( )
��
���
� ++2261
2281
12111301130
807.2 85.98616844
( )���
����
�++
−α53
)1k(k/ n1
n1
121NN
z ( )
��
���
� ++2221
2281
12111301130
807.2 86.37432371
( )���
����
�++
−α54
)1k(k/ n1
n1
121NN
z ( )
��
���
� ++2221
2261
12111301130
807.2 86.56266409