college of social work - the university of utah - evaluation of ......utah department of health,...
TRANSCRIPT

Evaluation of the Utah Supported Employment Transformation Project
(U-SETP) Project
Annual Report October 2018


Evaluation of the Utah Supported Employment Transformation Project (U-SETP)
Christian M. Sarver, M.S., M.S.W. Jess Shade, MDiv
Derek Mueller, M.S.
Annual Report October 2018
Utah Criminal Justice Center, University of Utah

{THIS PAGE INTENTIONALLY LEFT BLANK}

i
Table of Contents Table of Contents .................................................................................................................................. i Background and Introduction ............................................................................................... 1 Study Procedures ................................................................................................................................. 2
Results .............................................................................................................................................................. 2 Administrative Reporting ..................................................................................................................... 2 Consumer Characteristics ..................................................................................................................... 4 Services Provided by U-SETP ........................................................................................................... 20
Conclusion .................................................................................................................................................. 27
References .................................................................................................................................................. 29

ii

1
Background and Introduction
In a given year, 18% of U.S. adults have a diagnosed mental illness and four percent are classified as having a serious mental illness (SMI). A person’s mental illness is considered SMI if the disorder significantly impedes functioning in one or more major life areas (Center for Behavioral Health Statistics and Quality [CBHSQ], 2015). People with SMI have greater difficulty maintaining housing and employment (Substance Abuse and Mental Health Services Administration [SAMHSA], 2016). Luciano and Meara (2014) report that as severity of mental illness increases, employment decreases. Employment rates for persons with SMI are substantially lower than for the general workforce (Mechanic, Bilder, & McAlpine, 2002), even though many want to work (Hatfield, Huxley, & Mohamad, 1992; Kinoshita et al., 2013; Solar, 2015). The relationship between mental illness and unemployment may be reciprocal: that is, mental illness may foster difficulty finding and maintaining employment, and unemployment may exacerbate mental illness (Jefferis et al., 2011). Data suggest about 25,000 Utahns are both unemployed and have a mental illness, which is comparable to other states per capita (CBHSQ, 2014). Supported employment (SE) is a type of vocational rehabilitation that involves helping people with SMI apply for and maintain competitive, paid employment (Bond, 1992; Kinoshita et al., 2013). This contrasts with traditional vocational rehabilitation programs that emphasize pre-employment training. Rather, the goal in SE is to help people find work quickly, providing intensive support once they are employed (Kinoshita et al., 2013). The Individual Placement and Support (IPS) model is a well-delineated, evidence-based form of SE. In addition to helping consumers finding employment rapidly, key components of IPS include tailored services to consumers’ preferences for employment, collaboration with mental health providers, benefits counseling, and individualized support (Bond, 1998; Kinoshita et al., 2013). Across studies, IPS has been found more effective for persons suffering from SMI than traditional vocational models. More specifically, participants in IPS models exhibit fewer days to employment, higher rates of employment, increased job tenure, more total hours worked, and higher total wages (Bond, Campbell, & Drake, 2012; Kinoshita et al., 2013; Marshall et al., 2014). Participation in IPS is more than twice as likely to result in employment compared to other vocational approaches, and its impact remains over an extended period of time (Modini et al., 2016). In addition, IPS is effective for persons with various psychiatric maladies. Campbell, Bond, and Drake (2011) note, “IPS produces better competitive employment outcomes for persons with SMI than alternative vocational programs regardless of background demographic, clinical, and employment characteristics” (p. 370). Beginning in 2014, the State of Utah received funding via a grant from the Substance Abuse and Mental Health Services Administration (SAMHSA) to administer the Utah Supported Employment Transformation Project (U-SETP). Prior to that, types of vocational services to adults with SMI and co-occurring SUDs varied across the state and were administered inconsistently through various channels, government entities, and funding streams, resulting in a fragmented service delivery model. Because of this, a primary goal of U-SETP is the development of a supported employment coordinating committee (SECC) that will implement a sustainable plan to expand SE services throughout Utah. This project is first

2
being piloted via two local mental health authorities—WHS Human Services and SWBH Behavioral Health Center—under the supervision of DHS/DSAMH, with the goal of expanding it statewide. DHS/DSAMH has requested UCJC to assist in data collection, analysis, and reporting to evaluate, develop, and further implement the program. The U-SETP program will provide SE/IPS to individuals with mental illness and co-occurring mental health and substance use conditions. The project’s initial goal was to serve 50 individuals across two communities in the first year, and an additional 100 in each of the following four years, totaling 450 individuals in five years. Those initial goals were met and have been surpassed; to date the project has provided services to 970 individuals.
Study Procedures
The current quarterly report provides an overview of consumer characteristics, services, and outcomes, since project inception. Analyses in the current report are based on the following data sources:
Center for Mental Health Services National Outcome Measures (NOMs) Consumer-level Measures for Discretionary Programs Providing Direct Services to Adults (self-report)
Utah Department of Health, Division of Substance Abuse and Mental Health (DSAMH), behavioral health treatment records1
Utah Administrative Office of the Courts (AOC), court filing and disposition records for district and justice courts
Department of Public Safety, Bureau of Criminal Investigation (BCI), statewide arrest records
Results from administrative data sources are integrated alongside NOMs self-report data. Table headings as well as narrative descriptions clarify the data source.
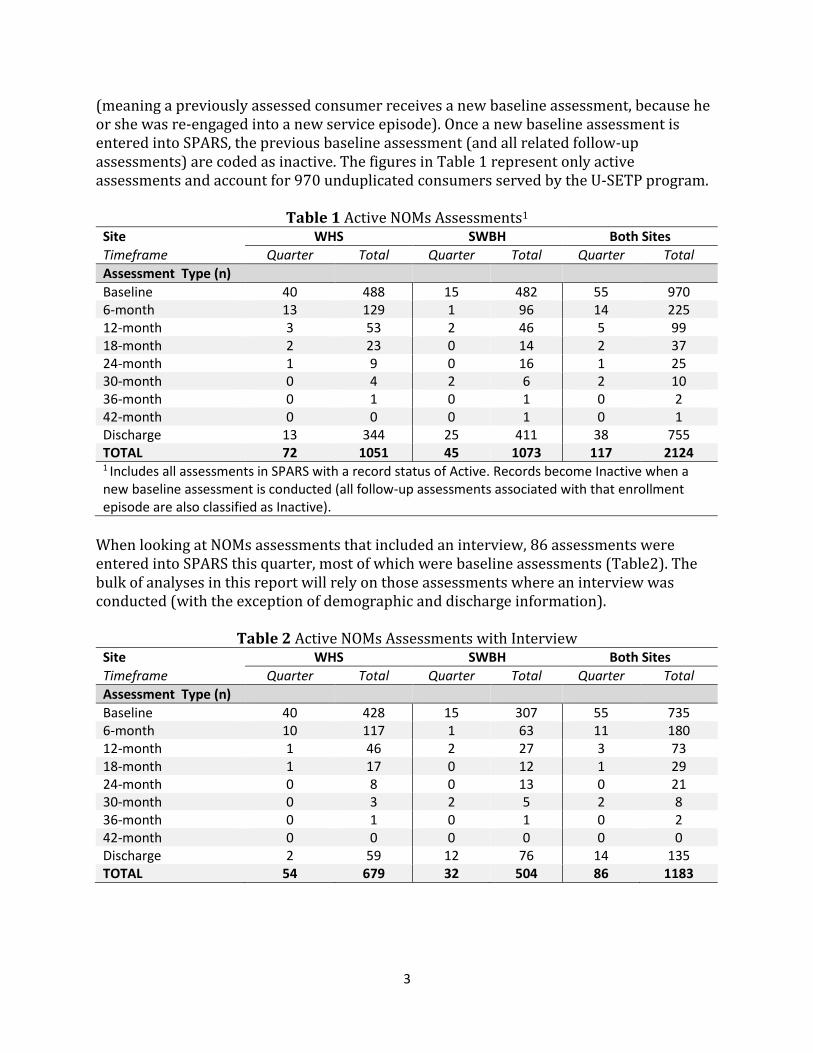
Results This annual report describes the U-SETP program since its inception through September 30, 2018. Administrative Reporting During the current reporting quarter, 117 NOMs assessments were created in SPARS (Table 1). The majority were either baseline (n=55) or discharge (n=38) assessments. Assessments are coded as active unless and until a second baseline assessment is entered
1 Eight hundred and thirty four consumer records were matched in DHS data (86%) of consumers. 382 consumers from WHS (78%) and 452 consumers from SWBH (94%) had treatment records identified in DHS data. The figures reflect available information as of September 30, 2018; as such, they differ from NOMs assessments. Requested data included mental health services (type and dosage for two years prior to U-SETP enrollment and all services subsequent to enrollment), funding source, and diagnostic information.
3
(meaning a previously assessed consumer receives a new baseline assessment, because he or she was re-engaged into a new service episode). Once a new baseline assessment is entered into SPARS, the previous baseline assessment (and all related follow-up assessments) are coded as inactive. The figures in Table 1 represent only active assessments and account for 970 unduplicated consumers served by the U-SETP program.
Table 1 Active NOMs Assessments1
Site WHS SWBH Both Sites
Timeframe Quarter Total Quarter Total Quarter Total
Assessment Type (n)
Baseline 40 488 15 482 55 970 6-month 13 129 1 96 14 225 12-month 3 53 2 46 5 99 18-month 2 23 0 14 2 37 24-month 1 9 0 16 1 25 30-month 0 4 2 6 2 10 36-month 0 1 0 1 0 2 42-month 0 0 0 1 0 1 Discharge 13 344 25 411 38 755 TOTAL 72 1051 45 1073 117 2124 1 Includes all assessments in SPARS with a record status of Active. Records become Inactive when a new baseline assessment is conducted (all follow-up assessments associated with that enrollment episode are also classified as Inactive).
When looking at NOMs assessments that included an interview, 86 assessments were entered into SPARS this quarter, most of which were baseline assessments (Table2). The bulk of analyses in this report will rely on those assessments where an interview was conducted (with the exception of demographic and discharge information).
Table 2 Active NOMs Assessments with Interview Site WHS SWBH Both Sites
Timeframe Quarter Total Quarter Total Quarter Total
Assessment Type (n)
Baseline 40 428 15 307 55 735 6-month 10 117 1 63 11 180 12-month 1 46 2 27 3 73 18-month 1 17 0 12 1 29 24-month 0 8 0 13 0 21 30-month 0 3 2 5 2 8 36-month 0 1 0 1 0 2 42-month 0 0 0 0 0 0 Discharge 2 59 12 76 14 135 TOTAL 54 679 32 504 86 1183

4
Across both sites, 735 consumers had at least one NOMs assessment with an interview recorded in SPARS. Given relatively few post 6-month follow-up assessments with interviews (Table 2), the current report will describe consumer characteristics at baseline, 6-months, and discharge (not the 12-42 month interviews). Consumer Characteristics
Demographics. Consumer demographics, collected on the baseline NOMs assessment, are presented in Table 3 and Table 4. Across both sites, just over half of consumers identified as male (51% for the current quarter; 43% overall). Additionally, the majority of consumers identified as white (91%) and heterosexual (89%).
Table 3 Demographics at Baseline1, NOMs Site WHS SWBH Both Sites
Timeframe Quarter Total Quarter Total Quarter Total Sample (n) 40 488 15 482 55 970
Male (%) 45 44 67 43 51 43 Hispanic (%) 18 15 20 6 18 11 Race (%) African American 5 4 7 3 6 4 Alaska Native 0 0 7 1 2 0 American Indian 3 3 13 7 6 5 Asian 0 1 7 1 2 1 Native Hawaiian 5 2 7 2 6 2 White 90 87 93 92 91 89 Sexual Identity (%)2 Heterosexual 92 94 80 52 89 73 Gay 0 2 7 1 2 2 Bi-sexual 8 3 13 4 9 3 1 Includes all active baseline assessments, with and without an interview. 2 Other responses include: other, don’t know, and refused.
When looking at consumers’ age at enrollment, the majority were between 26 and 54 years old (Table 4). Very few consumers older than 55 were enrolled in U-SETP.
Table 4 Age at Baseline1, 2, NOMs Site WHS SWBH Both Sites
Timeframe Quarter Total Quarter Total Quarter Total Sample (n) 40 488 15 482 55 970
Age group, in years (%)
13-15 0 0 7 3 2 1 16-25 10 16 20 32 13 24 26-34 35 28 13 24 29 26 35-44 30 28 13 21 26 24 45-54 13 19 40 13 20 16 55-64 13 9 7 6 11 8 65-74 0 1 0 0 0 1 1 Includes all active baseline assessments, with and without an interview. 2 Columns may not add to 100 due to missing data.

5
Military service. Very few U-SETP consumers reported ever having served in the
military (two percent; NOMs data). Of those that had served, all were in the Armed Forces; none were currently active duty and less than one percent had ever been deployed. Close to one-third of consumers (31%) had a family member or someone close to them who was currently on active duty or was retired from the military.
Health and well-being. At baseline and follow-up NOMs assessments, consumers
were asked to rate their overall health. Table 5 shows that over one-quarter of consumers (27%) rated their health as excellent or very good at baseline; a slightly larger percentage rated their health as fair or poor (32%). At discharge, 32% of consumers rated their health as excellent or very good, while 21% rated it as fair or poor.
Table 5 Overall Health1, NOMs Site WHS SWBH Both Sites
Assessment Baseline 6-mos Dx Baseline 6-mos Dx Baseline 6-mos Dx Sample (n) 428 117 59 307 63 76 735 180 135
How would you rate your overall health right now? (%)
Excellent 7 4 0 9 8 17 8 6 10 Very good 16 9 22 22 14 21 19 11 22 Good 45 56 66 34 29 34 40 46 48 Fair 27 22 9 24 40 20 26 28 15 Poor 4 6 3 9 5 8 6 6 6 1 Columns may not add to 100 due to missing data, including consumers who responded to question with “I don’t know.”
Consumers were also asked to rate their ability to manage their own health care (Table 6; NOMs data). At baseline, one-half of consumers (49%) indicated they could manage their health care needs on their own most of the time. At discharge, a similar percentage (47%) reported that they managed their health care needs on their own most of the time. Very few consumers reported they could never manage their own health care (two percent at follow-up assessments).
Table 6 Managing Health Care Needs1, 2, NOMs Site WHS SWBH Both Sites
Assessment Baseline 6-mos Dx Baseline 6-mos Dx Baseline 6-mos Dx Sample (n) 225 64 8 147 25 37 372 89 45
I feel capable of managing my health care needs (%)
On my own mostly 55 45 75 40 40 41 49 44 47 With some support 33 36 25 44 36 38 37 36 36 With support mostly
9 16 0 6 12 14 8 15 11
Rarely/never 0 0 0 0 8 3 0 2 2 1 Columns may not add to 100 due to missing data. 2 Smaller sample size because question was not asked on previous versions of NOMs.
6
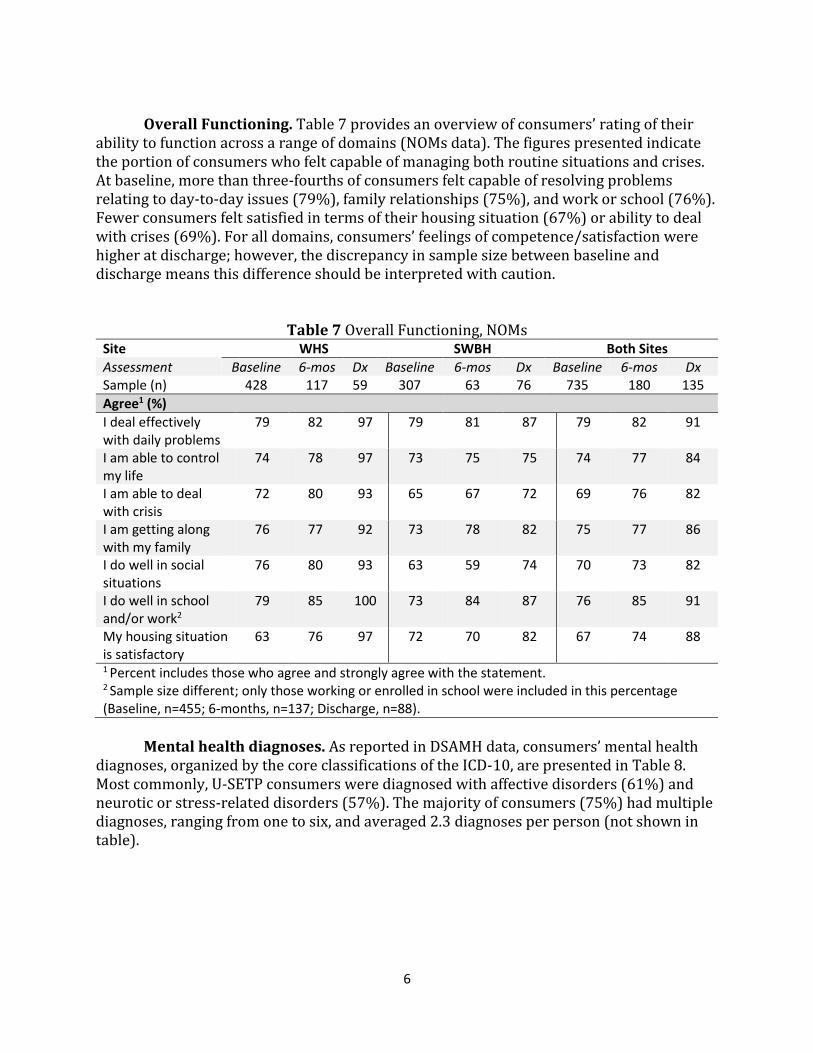
Overall Functioning. Table 7 provides an overview of consumers’ rating of their
ability to function across a range of domains (NOMs data). The figures presented indicate the portion of consumers who felt capable of managing both routine situations and crises. At baseline, more than three-fourths of consumers felt capable of resolving problems relating to day-to-day issues (79%), family relationships (75%), and work or school (76%). Fewer consumers felt satisfied in terms of their housing situation (67%) or ability to deal with crises (69%). For all domains, consumers’ feelings of competence/satisfaction were higher at discharge; however, the discrepancy in sample size between baseline and discharge means this difference should be interpreted with caution.
Table 7 Overall Functioning, NOMs Site WHS SWBH Both Sites
Assessment Baseline 6-mos Dx Baseline 6-mos Dx Baseline 6-mos Dx Sample (n) 428 117 59 307 63 76 735 180 135
Agree1 (%)
I deal effectively with daily problems
79 82 97 79 81 87 79 82 91
I am able to control my life
74 78 97 73 75 75 74 77 84
I am able to deal with crisis
72 80 93 65 67 72 69 76 82
I am getting along with my family
76 77 92 73 78 82 75 77 86
I do well in social situations
76 80 93 63 59 74 70 73 82
I do well in school and/or work2
79 85 100 73 84 87 76 85 91
My housing situation is satisfactory
63 76 97 72 70 82 67 74 88
1 Percent includes those who agree and strongly agree with the statement. 2 Sample size different; only those working or enrolled in school were included in this percentage (Baseline, n=455; 6-months, n=137; Discharge, n=88).
Mental health diagnoses. As reported in DSAMH data, consumers’ mental health
diagnoses, organized by the core classifications of the ICD-10, are presented in Table 8. Most commonly, U-SETP consumers were diagnosed with affective disorders (61%) and neurotic or stress-related disorders (57%). The majority of consumers (75%) had multiple diagnoses, ranging from one to six, and averaged 2.3 diagnoses per person (not shown in table).

7
Table 8 Mental Health Diagnoses, DSAMH Site SWBH WHS Both Sites
Sample Size (n) 452 382 834
ICD-10 Category1 (% (n))
Affective2 56 (255) 66 (252) 60 (507) Neurotic, stress-related, somatoform3 53 (239) 62 (235) 57 (474) Personality4 27 (120) 28 (105) 27 (225) Schizophrenia, delusional5 28 (126) 28 (105) 28 (231) Substance use6 31 (139) 39 (150) 35 (289) Other7 20 (92) 17 (65) 19 (157) 1 Percent of consumers ever diagnosed with at least one disorder in the category 2 Mood disorders, including bipolar affective disorder, depressive disorder, and manic and depressive episodes 3 Includes anxiety disorders, obsessive disorders, stress and adjustment disorders, dissociative disorders, and somatoform disorders. 4 Includes disorders of personality, including personality changes not attributable to brain damage and disease, and habit and impulse disorders. 5 Includes schizophrenia, schizotypal disorder, schizoaffective disorder, delusional disorders, and psychotic disorders. 6 Mental and behavioral disorders due to psychoactive substance use 7 Other includes disorders with onset in childhood or adolescence, mental retardation, organic disorders, and disorders of psychological development.
Prevalence and impact of psychiatric symptoms. At baseline, follow-up, and
discharge, consumers were asked to characterize the prevalence and impact of psychiatric symptoms (NOMs data). Results are presented in Table 9. At baseline, as shown on the first row of Table 9, nearly half of consumers were actively experiencing symptoms that impacted daily life (48%); at discharge, one-third of consumers (32%) described their symptoms this way. The psychiatric symptoms assessed included nervousness, hopelessness, restlessness, depression, effort expended to accomplish everyday tasks, and worthlessness. Most commonly, at baseline, consumers reported recent experiences of nervousness (86%), restlessness (78%), and feeling like everything was an effort (68%). At discharge, nervousness (57%) and restlessness continued to be the most commonly experienced symptoms (56%). The last row of Table 9 shows 28% of consumers were substantially bothered by their symptoms at baseline.

8
Table 9 Psychiatric Symptoms, NOMs Site WHS SWBH Both Sites
Assessment Baseline 6-mos Dx Baseline 6-mos Dx Baseline 6-mos Dx Sample (n) 428 117 59 307 63 76 735 180 135
My symptoms are NOT bothering me (% Strongly Agree or Agree)
53 60 86 50 48 54 52 56 68
In the past 30 days, felt the following at any time (%)
Nervous 84 65 22 87 94 84 86 75 57 Hopeless 58 50 9 61 56 59 60 52 37 Restless 76 63 27 81 76 78 78 68 56 Depressed 49 41 5 51 48 45 50 43 27 Lethargic 65 53 10 72 71 63 68 59 40 Worthless 45 39 9 51 43 42 47 41 27 Bothered by psych problems1, 2
28 19 25 29 20 14 28 19 16
1 Sample size different because question was not asked on earlier versions of NOMs (Baseline n=372; 6-month n=89; Discharge n=45). 2 Percent of clients who indicated they were Extremely or Considerably bothered by symptoms in the preceding 30 days.
History of violence and trauma. At baseline, consumers were asked to
characterize their lifetime experience of violence and trauma (NOMs data). Results are presented in Table 10 and show that nearly three-fourths (72%) of consumers had a lifetime history of trauma. Of those who had a history of trauma, the majority reported ongoing psychological stress because of the incident(s), including avoidant behaviors such as not thinking about the experience (81%). Consumers were also asked about any recent experience of physical violence; at baseline, five percent reported they had at least one episode in the past 30 days (not in table).
Table 10 Violence and Trauma, NOMs
Site WHS SWBH Both Sites
Assessment1 Sample (n) 428 307 735
Have you ever experienced violence or trauma in any setting (%)
Yes 73 70 72
If yes, have you experienced the following as a result? (%)
Nightmares/intrusive thoughts
75 81 78
Avoidant behavior 80 84 81 Constantly on guard 71 76 73 Numb/detached 66 76 70 1 Figures represent baseline assessment only.
Quality of life. At baseline, follow-up, and discharge, consumers were asked to rate
their recent quality of life, including satisfaction with health and relationships (NOMs). Results are presented in Table 11. At baseline, consumers were most satisfied in the

9
domains of overall quality of life (65% rated Good or Very Good) and performing the activities of daily living (63% rated Good or Very Good). Across most timeframes, consumers rated satisfaction with their health relatively lower than other domains.
Table 11 Quality of Life, NOMs Site WHS SWBH Both Sites
Assessment Baseline 6-mos Dx Baseline 6-mos Dx Baseline 6-mos Dx Sample (n)2 205 64 8 147 25 37 372 89 45
In the past 4 weeks, how would you rate your satisfaction with (% Satisfied)1
Quality of life 75 63 75 61 64 73 65 63 73 Energy level 54 55 75 52 40 54 52 54 58 Daily living activities 74 66 75 56 60 59 63 64 62 Health 60 55 75 48 32 49 52 48 53 Self 65 69 88 48 64 62 55 67 67 Relationships 65 70 50 52 60 62 56 67 60 1 Percent based on those who answered Good/Very Good or Satisfied/Very Satisfied to question. 2 Sample sizes smaller because questions were not asked on earlier version of NOMs.
Recent substance use. At each assessment, consumers were asked to describe their
recent substance use (NOMs). Results are presented in Table 12, which shows the percent of consumers who endorsed using legal or illegal substances in the previous month. At baseline, almost half of incoming consumers (49%) reported daily use of tobacco products. Fewer consumers reported recent alcohol consumption (17%) or illegal drug use (21%; not in table). Consumers were also asked about binge drinking (five or more drinks in a day for those that identify as male and four or more for those that identify as female). At the baseline assessment, almost half of males who reported any alcohol consumption (n=53) endorsed binge drinking at least once in the previous 30 days (47%; not in table). Among those who identified as female and endorsed some alcohol consumption (n=62), nearly two-fifths (39%) reported at least one episode of binge drinking. While relatively few consumers endorsed recent use of illegal substances (excluding alcohol and tobacco) at baseline, 16% indicated daily use of the substance(s) (not in table). Those figures were smaller at follow-up (8% endorsed daily use) and discharge (7% endorsed daily use). The most commonly used substances were cannabis (9% of consumers at baseline) and sedatives (4% of consumers at baseline). For all substances, fewer consumers endorsed recent use at follow-up interviews when compared to baseline.
Table 12 Recent Substance Use,1 NOMs data
Site WHS SWBH Both Sites
Assessment Baseline 6-mos Dx Baseline 6-mos Dx Baseline 6-mos Dx Sample (n) 428 117 59 307 63 76 735 180 135
In the past 30 days substance use, at any time (%)
Tobacco 54 39 42 41 46 37 49 42 39 Alcohol 19 18 7 13 11 7 17 16 7 Cannabis 11 7 3 6 2 4 9 5 4 Cocaine 1 1 0 1 0 1 1 1 1

10
Site WHS SWBH Both Sites
Assessment Baseline 6-mos Dx Baseline 6-mos Dx Baseline 6-mos Dx Sample (n) 428 117 59 307 63 76 735 180 135
In the past 30 days substance use, at any time (%) Stimulants 0 2 0 4 2 3 2 2 2 Meth 4 1 0 1 2 3 3 1 2 Inhalants 1 1 0 0 0 0 0 1 0 Sedatives 1 0 0 9 2 4 4 1 2 Hallucinogens 1 1 0 0 0 3 0 1 2 Street Opioids 2 0 0 1 0 1 1 0 1 Rx Opioids 1 3 0 5 2 1 3 2 1 1 Figures include any use in the previous 30 days (daily, weekly, and once or twice).
Housing stability. At every assessment, consumers were asked to characterize
their recent housing stability, including any nights spent homeless or institutionalized (NOMs data). Results are presented in tables 13 and 14. At baseline, less than one-tenth of consumers spent at least one night homeless in the preceding month (8%; Table 13), hospitalized for mental health care (5%), in a residential substance abuse facility (5%), or in a correctional facility (2%). Seven percent reported going to the emergency room at least once in the past month for mental health reasons at baseline.
Table 13 Housing Stability, NOMs
Site WHS SWBH Both Sites
Assessment Baseline 6-mos Dx Baseline 6-mos Dx Baseline 6-mos Dx Sample (n) 428 117 59 307 63 76 735 180 135
In the last 30 days have you spent any nights? (%)1
Homeless 8 2 0 8 6 4 8 3 2 Hospital/MH 6 1 2 5 0 0 5 1 1 Facility/SA 5 0 0 6 0 0 5 0 0 Correctional facility 1 3 0 4 2 0 2 2 0 ER/MH1 7 3 2 6 3 3 7 3 2 1 Percent who reported at least one trip to the ER for mental health reasons in the past 30 days.
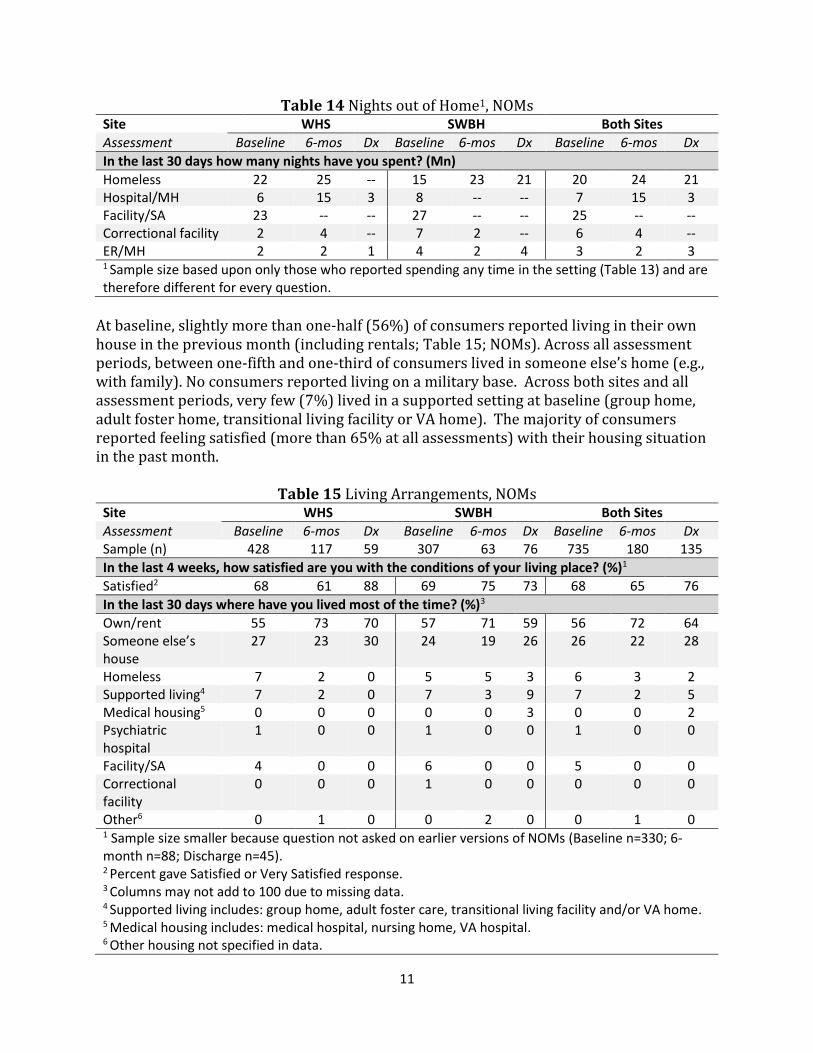
Table 14 provides an overview of the average number of nights that consumers spent out of their home, according to self-report in NOMs assessments. Given that the majority of consumers were never out of their home, the figures in Table 14 offer insight into housing instability experienced by a small percentage of U-SETP consumers. For example, at baseline for both sites, only 8% of consumers reported being homeless; of those, however, the average number of nights spent homeless was 20 (Table 14 ) and ranged from one to 30 (not in table).
11
Table 14 Nights out of Home1, NOMs Site WHS SWBH Both Sites
Assessment Baseline 6-mos Dx Baseline 6-mos Dx Baseline 6-mos Dx
In the last 30 days how many nights have you spent? (Mn)
Homeless 22 25 -- 15 23 21 20 24 21 Hospital/MH 6 15 3 8 -- -- 7 15 3 Facility/SA 23 -- -- 27 -- -- 25 -- -- Correctional facility 2 4 -- 7 2 -- 6 4 -- ER/MH 2 2 1 4 2 4 3 2 3 1 Sample size based upon only those who reported spending any time in the setting (Table 13) and are therefore different for every question.
At baseline, slightly more than one-half (56%) of consumers reported living in their own house in the previous month (including rentals; Table 15; NOMs). Across all assessment periods, between one-fifth and one-third of consumers lived in someone else’s home (e.g., with family). No consumers reported living on a military base. Across both sites and all assessment periods, very few (7%) lived in a supported setting at baseline (group home, adult foster home, transitional living facility or VA home). The majority of consumers reported feeling satisfied (more than 65% at all assessments) with their housing situation in the past month.
Table 15 Living Arrangements, NOMs
Site WHS SWBH Both Sites
Assessment Baseline 6-mos Dx Baseline 6-mos Dx Baseline 6-mos Dx Sample (n) 428 117 59 307 63 76 735 180 135
In the last 4 weeks, how satisfied are you with the conditions of your living place? (%)1
Satisfied2 68 61 88 69 75 73 68 65 76
In the last 30 days where have you lived most of the time? (%)3
Own/rent 55 73 70 57 71 59 56 72 64 Someone else’s house
27 23 30 24 19 26 26 22 28
Homeless 7 2 0 5 5 3 6 3 2 Supported living4 7 2 0 7 3 9 7 2 5 Medical housing5 0 0 0 0 0 3 0 0 2 Psychiatric hospital
1 0 0 1 0 0 1 0 0
Facility/SA 4 0 0 6 0 0 5 0 0 Correctional facility
0 0 0 1 0 0 0 0 0
Other6 0 1 0 0 2 0 0 1 0 1 Sample size smaller because question not asked on earlier versions of NOMs (Baseline n=330; 6-month n=88; Discharge n=45). 2 Percent gave Satisfied or Very Satisfied response. 3 Columns may not add to 100 due to missing data. 4 Supported living includes: group home, adult foster care, transitional living facility and/or VA home. 5 Medical housing includes: medical hospital, nursing home, VA hospital. 6 Other housing not specified in data.
12
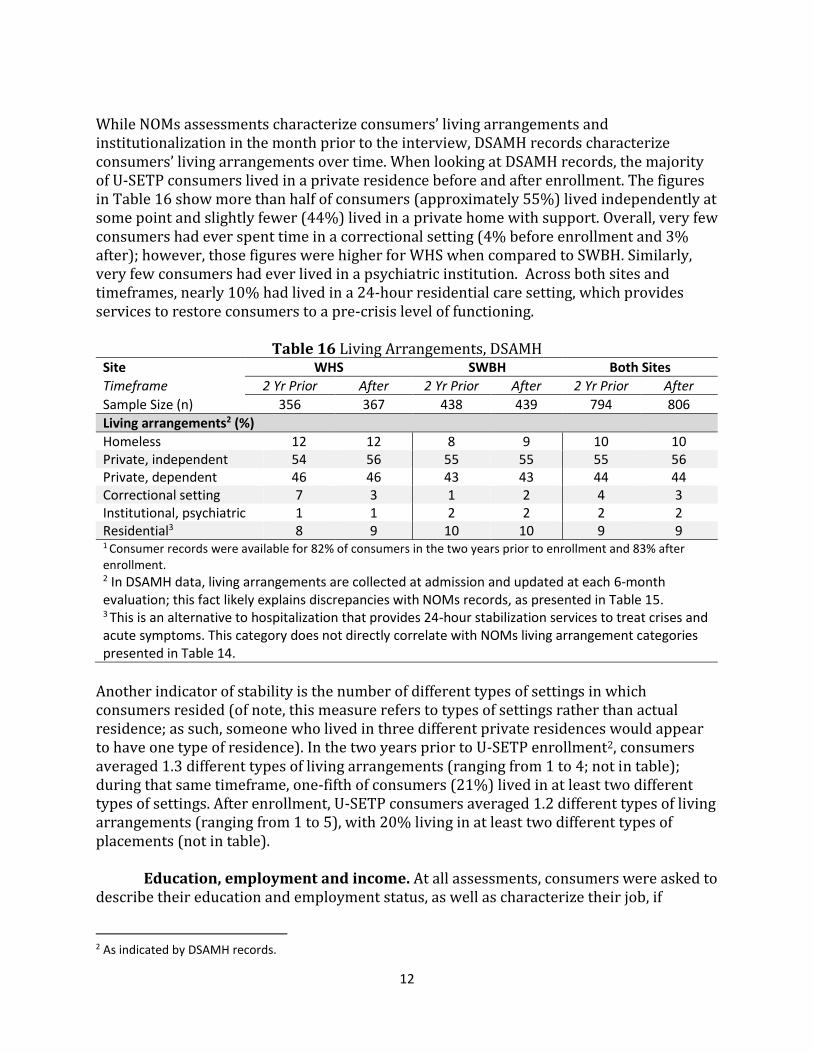
While NOMs assessments characterize consumers’ living arrangements and institutionalization in the month prior to the interview, DSAMH records characterize consumers’ living arrangements over time. When looking at DSAMH records, the majority of U-SETP consumers lived in a private residence before and after enrollment. The figures in Table 16 show more than half of consumers (approximately 55%) lived independently at some point and slightly fewer (44%) lived in a private home with support. Overall, very few consumers had ever spent time in a correctional setting (4% before enrollment and 3% after); however, those figures were higher for WHS when compared to SWBH. Similarly, very few consumers had ever lived in a psychiatric institution. Across both sites and timeframes, nearly 10% had lived in a 24-hour residential care setting, which provides services to restore consumers to a pre-crisis level of functioning.
Table 16 Living Arrangements, DSAMH Site WHS SWBH Both Sites
Timeframe 2 Yr Prior After 2 Yr Prior After 2 Yr Prior After
Sample Size (n) 356 367 438 439 794 806
Living arrangements2 (%)
Homeless 12 12 8 9 10 10 Private, independent 54 56 55 55 55 56 Private, dependent 46 46 43 43 44 44 Correctional setting 7 3 1 2 4 3 Institutional, psychiatric 1 1 2 2 2 2 Residential3 8 9 10 10 9 9 1 Consumer records were available for 82% of consumers in the two years prior to enrollment and 83% after enrollment. 2 In DSAMH data, living arrangements are collected at admission and updated at each 6-month evaluation; this fact likely explains discrepancies with NOMs records, as presented in Table 15. 3 This is an alternative to hospitalization that provides 24-hour stabilization services to treat crises and acute symptoms. This category does not directly correlate with NOMs living arrangement categories presented in Table 14.
Another indicator of stability is the number of different types of settings in which consumers resided (of note, this measure refers to types of settings rather than actual residence; as such, someone who lived in three different private residences would appear to have one type of residence). In the two years prior to U-SETP enrollment2, consumers averaged 1.3 different types of living arrangements (ranging from 1 to 4; not in table); during that same timeframe, one-fifth of consumers (21%) lived in at least two different types of settings. After enrollment, U-SETP consumers averaged 1.2 different types of living arrangements (ranging from 1 to 5), with 20% living in at least two different types of placements (not in table).
Education, employment and income. At all assessments, consumers were asked to describe their education and employment status, as well as characterize their job, if
2 As indicated by DSAMH records.

13
employed (NOMs data). Results are presented in tables 17 through 19. Relatively few consumers were enrolled in an education program at any point (9-13% for both sites; Table 17). However, enrollment in education programs was more prevalent among consumers at SWBH (ranging from 17-20%) when compared to WHS (ranging from 3-9%) over all three reporting periods. Consumers’ employment status ranged from 13%, at baseline, to 47% at the 6-month follow-up. Consumers who were employed tended to work in competitive jobs, as indicated by the fact that they were paid directly by employers, worked in positions for which anyone could apply, and made at least minimum wage (across reporting periods).
Table 17 Education and Employment, NOMs Site WHS SWBH Both Sites
Assessment Baseline 6-mos Dx Baseline 6-mos Dx Baseline 6-mos Dx Sample (n) 428 117 59 307 63 76 735 180 135
Education (%)
No HS diploma 16 16 19 27 22 18 20 18 19 HS diploma 38 44 63 30 30 33 35 39 46 Voc/Tech diploma 14 5 2 8 8 5 11 6 4 Some college 29 28 14 27 32 37 28 29 27 BA/BS 3 6 3 4 5 4 3 6 4 Graduate work 1 1 0 2 3 1 1 2 1 Currently enrolled 3 9 5 17 19 20 9 12 13
Employment (%)
Full-time 4 11 22 4 18 22 4 13 22 Part-time 9 31 14 9 41 24 9 34 20 Looking for work 80 50 39 74 27 16 78 42 26 Disabled/retired 4 5 0 2 3 4 3 5 2 Not looking for work 1 1 22 5 8 26 3 3 24 Volunteer 2 2 3 1 2 7 2 2 5
Employment Type1 (% Yes)
Pays min wage 95 100 100 97 100 100 96 100 100 Pays you directly 95 98 100 94 97 97 95 98 98 Anyone could apply 84 98 100 89 97 97 86 98 98 1 Of those with any employment (Baseline n=92; 6-month n=84; Discharge n=55).
DSAMH records show similar results: a higher percentage of consumers at both sites were employed or receiving supported employment after U-SETP enrollment (Table 18). Unlike the NOMs data, DSAMH records show employment at some point pre- and post-enrollment, not a specific point in time (e.g., baseline, 6-mo, 12-mo, etc.). Therefore these percentages represent consumers who had any episode of employment in the two years prior to U-SETP enrollment and the time following enrollment.

14
Table 18 Employment Status, DSAMH Site WHS SWBH Both Sites
Timeframe 2 Yr Prior After 2 Yr Prior After 2 Yr Prior After
Sample Size (n) 356 367 438 439 794 806
Age (%)
Employed1 21 27 34 56 28 43 Seeking employ 35 39 55 52 46 46 Not seeking employ 43 22 20 19 30 20 Disabled 35 37 25 11 29 23 Supported employ 12 34 24 33 19 33 1 Includes full- and part-time.
At baseline NOMs assessments, close to one-third of consumers reported substantial economic stress (29%; Table 19), indicating they did not have enough money to meet their needs. Those figures were lower at discharge; however, at any given time, only one-half of consumers indicated that they had enough income to completely meet their needs (ranging from 30-56%). This was true even though the previous tables show more consumers were employed post-enrollment, suggesting some portion of consumers were not working enough hours or receiving a high enough wage to eliminate economic stress.
Table 19 Income1, NOMs
Site WHS SWBH Both Sites
Assessment Baseline 6-mos Dx Baseline 6-mos Dx Baseline 6-mos Dx Sample (n) 205 64 8 147 25 37 372 89 45
In the last 4 weeks, do you have enough money to meet your needs (%)
Completely2 30 48 63 33 36 54 30 45 56 Moderately3 43 28 25 31 48 30 36 34 29 Not at All 34 19 13 26 12 11 29 17 11 1 Sample sizes smaller because question was not asked on earlier version of NOMs. Columns may not add to 100% due to missing data. 2 Includes responses Completely and Mostly. 3 Includes responses Moderately and A Little.
Social connectedness. At baseline, follow-up, and discharge NOMs assessments,
consumers were asked to rate the quality of their personal relationships; results are presented in Table 20. When looking satisfaction with all types of relationships, consumers tended to report the strongest positive feelings with respect to having people with whom they do enjoyable things, having support during a crisis, and having family and friends who were supportive of their recovery. Across all three assessment periods, consumers expressed the least satisfaction with respect to feeling a sense of belonging in their community (63% felt a sense of belonging at baseline). Of note, lower ratings on this domain were more prevalent in SWBH when compared to WHS and may reflect relative isolation, or fewer available services, in a rural community.

15
Table 20 Social Connectedness, NOMs Site WHS SWBH Both Sites
Assessment Baseline 6-mos Dx Baseline 6-mos Dx Baseline 6-mos Dx Sample (n) 428 117 59 307 63 76 735 180 135
Agree1 (%)
Happy with friends 76 84 95 72 78 79 74 82 86 Have people with whom do enjoyable things
76
87
93
80
87
83
77
87
87
I feel I belong to my community
66 74 98 59 64 67 63 70 81
In a crisis, I have the support I need
80 80 95 79 84 80 79 82 87
I have family and friends that are supportive of my recovery2
94
83
100
82
92
84
84
85
87
I generally accomplish what I set out to do2
80
81
88
65
88
81
70
83
82
Criminal justice involvement. Both self-report data (NOMS) and administrative
records were collected to characterize consumers’ criminal justice involvement, including statewide arrests (Bureau of Criminal Investigation (BCI) and court cases (Administrative Office of the Courts (AOC). Results are presented in tables 21-24.
Self-reported criminal justice involvement. At all NOMs assessments, consumers
were asked to identify their recent arrest history. Results are presented in Table 21. Overall, very few consumers had been recently arrested (less than 5% across all reporting periods). Among those who did have a recent arrest, the highest number of average arrests occurred at the 6-month follow-up assessment (Mn=3).
Table 21 Recent Arrests, NOMs Site WHS SWBH Both Sites
Assessment Baseline 6-mos Dx Baseline 6-mos Dx Baseline 6-mos Dx Sample (n) 428 117 59 307 63 76 735 180 135
In the last 30 days have you ever been arrested? (% ) Yes (at least once) 2 3 0 3 0 1 2 2 1 In the last 30 days how many times have you been arrested? (Mn1) Times 1 3 -- 1 -- 1 1 3 1 1 Among those with any arrest.
1 Percent who responded Agree or Strongly Agree with the listed statements. 2 Sample size smaller because question not asked on previous NOMs assessments (Baseline n=372; 6-month n=89; Discharge n=45).

16
Statewide arrests. BCI records, presented in Table 22, provide an overview of consumers’ arrest history in the two years prior to, and after, enrollment. The figures in Table 22 show that one-fourth of consumers (28%) were arrested at least once during the 24 months prior to U-SETP, with an average of Mn=.51 arrests during that timeframe. When looking at arrests by charge type3, the most common arrests were for drug (12%) and property (14%) crimes. Subsequent to enrollment, 14% of consumers had any arrests, most commonly for drug (5%) and property (7%) crimes. Of note, the majority of consumers had no arrests at either period. The average number of days post-enrollment was Mn=690 days, which shows that the pre- and post-enrollment periods were relatively similar.
Table 22 Arrests by Type, BCI
Site WHS SWBH Both Sites
Timeframe Before After Before After Before After
Sample (n) 477 480 957
Consumer arrests
Arrest (%) 29 13 27 15 28 14 (Mn)2 0.50 0.22 0.55 0.29 0.51 0.25 Drug 12 5 12 5 12 5 (Mn)2 0.16 0.07 0.16 0.16 0.16 0.07 DUI 3 1 3 1 3 1 (Mn)2 0.03 0.01 0.03 0.01 0.03 0.01 Obstruction 6 3 5 3 5 3 (Mn)2 0.08 0.04 0.06 0.03 0.07 0.04 Person 10 4 12 5 11 4 (Mn)2 0.12 0.05 0.17 0.08 0.14 0.06 Property 14 6 14 8 14 7 (Mn)2 0.19 0.08 0.2 0.13 0.21 0.11 Public Order 6 3 7 5 7 4 (Mn)2 0.09 0.03 0.10 0.06 0.10 0.05 Traffic/non-DUI 1 0 1 1 1 1 (Mn)2 0.01 0.00 0.02 0.01 0.02 0.01 1 Average number of arrests
Civil and criminal court involvement. In addition to self-report, AOC4 records
characterize consumers’ court involvement. Results are presented in tables 23 and 24 and show that close to half of consumers (46%) had at least one criminal case prior to U-SETP
3 Consumers can have multiple charges during a single arrest. In this case, the arrest is counted only once; however, each charge type is recorded in the appropriate category. 4 Sample sizes for BCI and AOC records are smaller than the full sample, recorded in SPARS (N=970), because of time needed to pull data; some consumer records had not yet been entered into SPARS and were not part of the data request. Those consumers will be included in the next data request and included in the next report.

17
enrollment (this captures any court case, based on filing date5; the earliest case reflected here dates from 1989). Those figures were higher for WHS (51%) compared to SWBH (40%); however the mean number of cases was similar at both sites (Mn=1.5 for WHS and Mn=1.9 for SWBH). When looking at civil cases, WHS consumers again had more court involvement (20% for WHS and 12% for SWBH)). Fewer consumers had court involvement, for both criminal and civil cases, after U-SETP enrollment (46% vs 30%). Because the pre- and post-enrollment periods capture different timeframes, these comparisons provide an overview of court involvement rather than an indicator of program impact.
Table 23 Court Cases by Type, AOC
Site WHS SWBH Both Sites
Timeframe Before After Before After Before After
Sample (n) 477 480 957
Consumer who have at least one
Civil case1 (%) 20 13 12 8 15 10 Number (Mn)2 .33 .17 .16 .11 .25 .14 Criminal case (%) 51 28 40 31 46 30 Number (Mn)2 1.5 .61 1.9 .78 1.7 .69 1 Includes civil cases related to overall stability, including small claims, debt collection, evictions, and Department of Workforce Services liens. 2 Average number of cases for the whole sample
Table 24 further characterizes U-SETP consumers’ court involvement by charge type. The figures in Table 23 show that 27% of U-SETP consumers had misdemeanor cases before enrollment; the average number of cases was Mn=.67. One-quarter of consumers (29%) had court cases related to infractions (non-DUI traffic citations are included in this category). Relatively few consumers had any felony cases at either timeframe (14% and 7%). The Stability category refers to civil cases related to issues of financial or economic instability: evictions, small claims court, debt collection, and liens. Other civil matters—such as divorce or child custody—were not included.
5 Because of the delay between arrest date and filing date, for arrests in which charges are filed, these figures represent consumers’ involvement with the courts pre- and post-enrollment; arrest records (BCI) provide a more accurate profile of behavior at a given point in time.

18
Table 24 Court Cases by Charge Type, AOC
Site WHS SWBH Both Sites
Timeframe Before After Before After Before After
Sample (n) 477 480 957
Consumer who have at least case involving
Felony (%) 12 4 16 9 14 7 Number (Mn)1 .18 .05 .31 .14 .25 .10 Infraction 34 17 23 17 29 17 Number (Mn)1 1.4 .29 2.7 .28 .79 .28 Misdemeanor 28 13 27 17 27 15 Number (Mn)1 .60 .26 .73 .36 .67 .31 Stability 20 13 10 8 15 10 Number (Mn)1 .33 .17 .16 .11 .25 .14 1 Average number of cases for the whole sample
Services Provided by U-SETP Program
Perception of care. Table 24 describes consumers’ perception of the care they
received from the U-SETP program, as assessed on follow-up and discharge NOMs assessments. Overwhelmingly, consumers reported satisfaction with their care and indicated that they would recommend the agency to others.
Table 24 Perception of Care, NOMs
Site WHS SWBH Both Sites
Assessment 6-mos Dx 6-mos Dx 6-mos Dx Sample (n) 1 117 59 63 76 180 135
Rate your agreement with the following statements (%)2
Staff here believe that I can recover 93 98 92 96 93 97 I feel free to complain 96 100 89 86 93 92 I was given information about my rights
92 100 86 91 89 95
Staff encourage me to take responsibility for my life
95 100 91 92 93 96
Staff told me about side effects 83 100 88 89 85 91 Staff respect my wishes about sharing treatment information
96 93 91 96 94 95
Staff sensitive to my cultural background
94 100 92 90 93 94
Staff help me obtain information I need to manage illness3
95 92 91 93 94 93

19
Site WHS SWBH Both Sites
Assessment 6-mos Dx 6-mos Dx 6-mos Dx Sample (n) 1 117 59 63 76 180 135
Rate your agreement with the following statements (%)2
Encouraged to use consumer-run programs
92 97 87 88 91 92
Comfortable asking questions about treatment and meds4
95 100 95 88 95 89
I decided my treatment goals 90 97 89 88 89 92 I like the services I received 97 100 98 92 98 96 I would choose this agency to receive services
94 100 94 86 94 92
I would recommend this agency to others
95 100 97 87 96 93
1 Questions only asked on follow-up assessments. 2 Includes Strongly Agree and Agree. 3 N=149 at 6-mos; n=87 at discharge; only asked of those consumers for whom question was relevant. 4 N=147 at 6-mos; n=82 at discharge; only asked of those consumers for whom question was relevant.
Program status. Consumers’ program status, with respect to current receipt of
services and discharge type, is described in tables 25 and 26.
Reassessment status. Across both sites, nearly all consumers were still receiving
services at the 6-month NOMs assessment (Table 25; includes assessments with and without an interview). In addition, nearly all consumers had had at least one contact with program staff in the previous three months.
Table 25 Reassessment Status, NOMs data Site WHS SWBH Both Sites
6-month assessment only Sample (n) 129 96 225
Consumer’s status (% Yes)
Has had program contact within 90 days of last encounter
97 96 96
Is still receiving services from project 98 94 96
Clinical discharge status. Table 26 characterizes consumers’ discharge status
(includes NOMs assessments with and without an interview). At SWBH, the most frequently reported status was mutually-agreed upon termination of treatment (51%). At WHS, the most frequently reported status was the consumer withdrawing from or refusing services (35%). When looking at the number of days between first service date and discharge date, consumers were enrolled in the program for an average of 198 days

20
(ranging from 0 to 1,339 days). The average number of days enrolled for consumers at WHS was 202 days; for consumers at SWBH the average was 195 days.
Table 26 Discharge Status, NOMs data
Site WHS SWBH Both Sites
Discharge assessment only Sample (n) 1 344 411 755
Status (%)
Mutually agreed cessation of treatment 23 51 39 Withdrew/refused treatment 35 21 27 No contact within 90 days 15 17 16 Clinically referred out 4 2 3 Death 1 1 1 Other2 22 8 14 1 Includes those with and without an interview. 2 Other includes: consumer relocated; consumer unable to participate due to medical reasons; consumer incarcerated or institutionalized; consumer could not be reached; and client was discharged from mental health agency and therefore no longer eligible for services.
Services. Services provided by the U-SETP program, reported on follow-up and
discharge NOMs assessments, are described in Table 27 (includes assessments with and without an interview). As would be expected, given the program’s employment focus, the most frequently provided services were employment-related, across both sites and all reporting periods (78-95%). The majority of consumers also received services related to screening, assessment, and treatment planning. Of note, consumers at SWBH received comparatively more clinical services (psychopharmacological services, mental health treatment, co-occurring services, and trauma specific care) than those at WHS. However, consumers at WHS received comparatively more case management than those at SWBH.
Table 27 Services Provided, NOMs Site WHS SWBH Both Sites
Timeframe 6-mos Dx 6-mos Dx 6-mos Dx Sample (n) 129 344 96 411 225 755
Since last interview has consumer received? (% Yes)
CORE SERVICES
Screening 92 93 37 42 68 65 Assessment 90 93 74 60 83 75 Treatment planning 93 94 62 51 80 71 Psychopharmacological services 9 3 37 33 21 19 Mental health 12 5 72 65 38 37 Co-occurring 6 3 28 25 16 15 Case management 94 94 37 29 69 59 Trauma specific services 2 0 13 14 6 8 Referral for above core services 2 1 13 4 6 3

21
Site WHS SWBH Both Sites
Timeframe 6-mos Dx 6-mos Dx 6-mos Dx Sample (n) 129 344 96 411 225 755
OTHER SUPPORTIVE SERVICES
Medical care 5 2 35 24 18 14 Employment 95 95 94 78 95 86 Family 2 0 8 9 4 5 Child care 0 0 2 2 0 1 Transportation 9 2 35 24 20 14 Education 3 1 28 18 14 10 Housing 5 1 21 11 12 6 Social and recreational 5 0 9 6 7 3 Consumer operated 5 0 3 3 4 2 HIV testing 0 0 1 1 0 0 Referral for above support services 2 1 15 9 7 5
In order to better characterize consumers’ receipt of services before and during U-SETP, mental health treatment records (DSAMH) were analyzed to determine type and dosage of services received. Table 28 characterizes services by type (according to the mandated service codes used for Medicaid billing).
Table 28 Mental Health Service Descriptions, DSAMH Mandated Service Category
Description
Assessment Face to face assessment to determine existence, nature, and extent of a mental illness or disorder.
Case management Care services to support daily needs or assistance helping consumer acquire needed or wanted services.
Inpatient Inpatient psychiatric hospitalization Medication management Prescription, administration, observation, evaluation, alteration,
continuance, or termination of neuroleptic medication Peer support Services provided by a Certified Peer Support Specialist Psychosocial rehabilitation Services intended to train a consumer to function, in the areas of:
social interaction, physical mobility, skills in the activities of daily living, and other
Residential Residential care, including highly-structured, 24-hour services to transition consumer from inpatient care to the community. Also includes residential care provided in a moderately-structured setting, such as group homes or therapeutic foster homes.
Respite Temporary care for purpose of providing relief to caregiver. Supported housing Treatment support provided in consumer’s home to maintain
ability to live in community or teach independent living skills. Low-level of structure.
Testing Specialized testing for diagnostic or treatment purpose Therapy Includes individual, family, and group therapy

22
In the two years prior to U-SETP enrollment, according to DSAMH records, more than three-fourths of consumers received services related to assessment (82%) and therapy (89%; Table 29). The average number of treatment services was highest for supported housing (Mn=174 nights); however, very few consumers received supported housing. The average number of treatment services was lowest for assessment (Mn=3). After enrollment into U-SETP, nearly all consumers received services related to medication management (91%) and therapy (87%). Discrepancies between Table 27, which showed services as reported by U-SETP program staff, and Table 29, suggest consumers were receiving services from multiple providers. For example, less than half of consumers were identified as receiving psychopharmacological services in Table 27 (21%). In contrast, nearly all consumers (91%) were identified in DSAMH data as receiving medication management post-enrollment.
Table 29 Mental Health Services, Both Sites1, DSAMH Timeframe 2 Yr Pre-Enroll U-SETP Enroll
Sample Size (n) 794 806
Mandated Service Category %1 Mn (min, max)2 %1 Mn (min, max)2
Assessment 82 3 (1, 31) 35 3 (1, 20) Case management 53 19 (1, 285) 60 22 (1, 547) Inpatient5 12 14 (1, 238) 6 8 (1, 79) Medication management 62 16 (1, 522) 91 19 (1, 507) Peer support 16 25 (1, 420) 16 19 (1, 399) Psychosocial rehabilitation 57 30 (1, 497) 58 36 (1, 780) Residential 13 55 (1, 306) 10 38 (1, 412) Respite 3 17 (1, 126) 2 8 (1, 41) Supported housing 8 174 (1, 729) 9 116 (10, 1127) Testing 5 4 (1, 8) 4 4 (1, 9) Therapy 89 30 (1, 312) 87 27 (1, 293) Individual therapy3 99 19 (1, 179) 98 19 (1, 179) Family Therapy3 24 5 (1, 34) 16 4 (1, 74) Group Therapy3 41 22 (1, 229) 38 20 (1, 186) Behavior management3 2 3 (1, 24) 1 5 (1, 16) 1 Percent of consumers who received service at least once during timeframe (2 years prior to U-SETP enrollment or after U-SETP enrollment) 2 Average number of events, by type and timeframe (Mn), and minimum and maximum number of events by type and timeframe. For inpatient treatment, residential care, and supported housing and event is a single day in the setting. 3 Percent of those who received any therapy. N=710 pre-enrollment; n=699 post-enrollment.

23
In order to characterize treatment dosage more specifically, the total number of hours (or days, depending on service type) were summed and averaged across the full sample (Table 30). When looking at service dosage in the two years prior to U-SETP, consumers received the most hours of service in psychosocial rehabilitation (Mn=47 hours per consumer).
Table 30 Mental Health Service Dosage, Both Sites, DSAMH
Timeframe 2 Yr Pre-Enroll U-SETP Enroll
Sample Size (n) 794 806
Mandated Service Category Mn (min, max)1 Mn (min, max)1
Assessment 4 (.25, 18) 3 (.08, 14) Case management 18 (.01, 427) 19 (.01, 665) Inpatient2 14 (1, 238) 8 (1, 79) Medication management 6 (.01, 140) 14 (.03, 427) Peer support 23 (.08, 600) 12 (.25, 247) Psychosocial rehabilitation 47 (.25, 1131) 66 (.25, 2134) Residential2 55 (1, 306) 38 (1, 412) Supported housing2 174 (1, 729) 166 (10, 1127) Testing 6 (.33, 13) 7 (.58, 14) Therapy 34 (.25, 837) 29 (.03, 633) 1 For those with any service, average hours of services provided by type (Mn); minimum and maximum hours of service provided by type (min, max). 2 Reflects days rather than hours.
Southwest Behavioral Health. Prior to enrollment in U-STEP, the majority of SWBH consumers received assessments (82%; Table 31) and therapy (90%). Following U-STEP enrollment, the percent of consumers receiving an assessment dropped to 34% while the percent receiving medication management increased to 88%. Of note, while relatively few consumers received inpatient hospitalization, the mean number of days hospitalized decreased from 14 to seven.
Table 31 Mental Health Services, SWBH, DSAMH
Timeframe 2 Yr Pre-Enroll U-SETP Enroll
Sample Size (n) 438 439
Mandated Service Category %1 Mn (min, max)2 %1 Mn (min, max)2
Assessment 82 2 (1, 11) 34 2 (1, 14) Case management 57 23 (1, 285) 71 25 (1, 547) Inpatient 10 14 (1, 80) 6 7 (2, 32) Medication management 49 10 (1, 74) 88 17 (1, 213) Peer support 20 33 (1, 420) 17 27 (1, 399) Psychosocial rehabilitation 56 35 (1, 347) 59 47 (1, 780) Residential 10 94 (3, 306) 9 56 (2, 412) Respite 5 17 (1, 126) 3 8 (1, 41) Supported housing 9 193 (6, 729) 9 219 (16, 1127) Testing 7 4 (1, 8) 5 4 (1, 9)

24
Timeframe 2 Yr Pre-Enroll U-SETP Enroll
Sample Size (n) 438 439
Mandated Service Category %1 Mn (min, max)2 %1 Mn (min, max)2
Therapy 90 29 (1, 312) 91 27 (1, 293) Individual therapy3 99 18 (1, 83) 98 19 (1, 160) Family Therapy3 28 4 (1, 34) 15 5 (1, 74) Group Therapy3 40 24 (1, 229) 37 20 (1, 186) Behavior management3 3 3 (1, 24) 2 5 (1, 16) 1 Percent of consumers who received service at least once during timeframe (2 years prior to U-SETP enrollment or after U-SETP enrollment) 2 Average number of events, by type and timeframe (Mn), and minimum and maximum number of events by type and timeframe. 3 Percent of those who received any therapy. N=394 pre-enrollment; n=398 post-enrollment.
When looking at treatment dosage at SWBH prior to enrollment in U-SETP, consumers received the greatest number of treatment hours for psychosocial rehabilitation (Mn=55 hours; Table 32). Following enrollment, the highest-dosage services were psychosocial rehabilitation (Mn=93 hours), therapy (Mn=30 hours), and case management (Mn=23 hours). With respect to day services, consumers received, on average, 56 days in a 24-hour residential setting.
Table 32 Mental Health Service Dosage, SWBH, DSAMH
Timeframe 2 Yr Pre-Enroll U-SETP Enroll
Sample Size (n) 438 439
Mandated Service Category Mn (min, max)1 Mn (min, max)1
Assessment 3 (.33, 15) 3 (.25, 11) Case management 21 (.01, 427) 23 (.01, 665) Inpatient2 14 (1, 80) 7 (2, 32) Medication management 6 (.01, 42) 14 (.03, 427) Peer support 31 (.08, 600) 17 (.25, 247) Psychosocial rehabilitation 55 (.25, 1021) 93 (.25, 2134) Residential2 94 (3, 306) 56 (2, 412) Supported housing2 193 (6, 729) 219 (16, 1127) Testing 6 (.33, 8) 6 (.58, 11) Therapy 39 (.5, 837) 30 (.4, 633) 1 For those who received any service, average hours of services provided by type (Mn); minimum and maximum hours of service provided by type (min, max). For those who received any service. 2 Reflects days rather than hours.
Weber Human Services. In the two years prior to U-SETP, over three-fourths of WHS consumers received assessment, medication management, and therapy (84%, 79%, and 89%, respectively; Table 33). After enrollment in U-SETP, the percent of consumers receiving an assessment decreased while the percent receiving medication management increased. The percentage of consumers who received inpatient hospitalization decreased from 15% to 7% and the mean number of hospitalization days decreased from 13 to nine.

25
Table 33 Mental Health Services, WHS, DSAMH
Timeframe 2 Yr Pre-Enroll U-SETP Enroll
Sample Size (n) 356 367
Mandated Service Category %1 Mn (min, max)2 %1 Mn (min, max)2
Assessment 84 5 (1, 31) 38 3 (1, 20) Case management 47 14 (1, 175) 47 15 (1, 193) Inpatient 15 13 (1, 238) 7 9 (1, 79) Medication management 79 22 (1, 522) 94 22 (1, 507) Peer support 11 7 (1, 52) 14 8 (1, 65) Psychosocial rehabilitation 59 23 (1, 497) 56 22 (1, 438) Residential 17 27 (1, 131) 12 23 (1, 137) Respite 0 --- 0 --- Supported housing 7 145 (1, 709) 8 93 (10, 418) Testing 3 3 (1, 6) 4 4 (1, 6) Therapy 89 31 (1, 246) 82 28 (1, 188) Individual therapy3 99 21 (1, 179) 99 21 (1, 179) Family Therapy3 20 5 (1, 26) 17 2 (1, 10) Group Therapy3 42 21 (1, 163) 39 19 (1, 83) Behavior management3 1 1 (1, 1) 1 6 (1, 10) 1 Percent of consumers who received service at least once during timeframe (2 years prior to U-SETP enrollment or after U-SETP enrollment) 2 For those who received any services, average number of events, by type and timeframe (Mn), and minimum and maximum number of events by type and timeframe. 3 Percent of those who received any therapy. N=316 pre-enrollment; n=301 post-enrollment.
Similar to SWBH, consumers at WHS received the greatest dosage in the form of psychosocial rehabilitation (Mn=37 hours; Table 34). Post-enrollment, the highest dosage services were psychosocial rehabilitation (Mn=32 hours), therapy (Mn= 28 hours) and medication management (Mn=14 hours).
Table 34 Mental Health Service Dosage, WHS, DHS data
Timeframe 2 Yr Pre-Enroll U-SETP Enroll
Sample Size (n) 356 367
Mandated Service Category Mn (min, max)1 Mn (min, max)1
Assessment 4 (.25, 18) 3 (.08, 14) Case management 12 (.08, 139) 12 (.25, 186) Inpatient2 13 (1, 238) 9 (1, 79) Medication management 7 (.25, 140) 14 (.25, 182) Peer support 5 (.25, 35) 5 (.5, 41) Psychosocial rehabilitation 37 (.25, 1131) 32 (.25, 1051) Residential2 27 (1, 131) 23 (1, 137) Supported housing2 145 (1, 709) 93 (10, 418) Testing 7 (2, 13) 8 (1, 14) Therapy 32 (.25, 338) 28 (.03, 201) 1 For those with any services, average hours of services provided by type (Mn); minimum and maximum hours of service provided by type (min, max). 2 Reflects days rather than hours.

26
Funding Behavioral Health Services
In the two years prior to enrollment in U-SETP, 85% of consumers were enrolled in Medicaid at some point in time (Table 35; determined because at least one service was paid for by Medicaid during the timeframe). After enrollment, 81% of consumers were enrolled in Medicaid at some point. The percentage of consumers who received services from another insurance carrier as well as those who received unfunded services remained relatively stable pre- to post-enrollment. Of note, 15% of consumers who had Medicaid were also classified as unfunded prior to enrollment (not in table). After enrollment, 11% of consumers were classified as both having Medicaid and being unfunded.
Table 35 Healthcare Funding, Both Sites, DSAMH Timeframe 2 Yr Pre-Enroll U-SETP Enroll
Sample Size (n) 794 806
Payment Type %1 %1
Medicaid 85 81 Insurance 22 23 Unfunded 26 24 1 Percent of consumers with at least one service paid by Medicaid, insurance, or unfunded respectively.
When examining service payment by site, similar numbers of consumers received Medicaid services at SWBH and WHS. This was the case both pre- and post-enrollment (86% and 84% of consumers at SWBH; and 84% and 80% of consumers at Weber, respectively; Table 36). A higher percentage of WHS consumers received at least one unfunded service both pre- and post-enrollment.
Table 36 Healthcare Funding, By Site, DSAMH
Site SWBH WHS
Timeframe 2 Yr Pre-Enroll U-SETP Enroll 2 Yr Pre-Enroll U-SETP Enroll
Sample Size (n)
438 439 356 367
Payment Type %1 %1 %1 %1
Medicaid 86 82 84 80 Insurance 19 26 26 19 Unfunded 22 19 30 30
1 Percent of consumers with at least one service paid by Medicaid, insurance, or unfunded respectively.
Conclusion
This annual report provides an overview of U-SETP client characteristics and services received since project inception. The results show the majority of U-SETP consumers had been diagnosed with mood or neurotic disorders; nearly one-third had been diagnosed with schizophrenia or delusional disorders and one-third had been diagnosed with personality disorders. Prior to enrollment, close to one-half of consumers had a prior criminal court case; however, closer to one-third had a recent arrest. Across a range of

27
domains related to functioning and well-being, consumers reported improvement on follow-up assessments when compared to baseline6. Similarly, administrative records show declines in criminal justice system contact post-enrollment. Results also show a sub-population of consumers continued to struggle in some areas, even after enrollment. While relatively few consumers demonstrated substantial housing instability, between one-third and one-fourth expressed dissatisfaction with housing, across reporting periods. In terms of overall quality of life, consumers expressed the greatest dissatisfaction in terms of their health status; nearly half were unsatisfied at all reporting periods. This may, in part, reflect the fact that one-half to one-third of consumers indicated being bothered by mental health symptoms across reporting periods. As would be expected, given the program’s intent, more consumers were employed (in either supported or other settings) after U-SETP enrollment; however, some still expressed difficulty meeting their needs financially. Of note, the majority of consumers appeared to be enrolled in Medicaid both before and after enrollment. NOMs data indicate the vast majority of consumers received services related to screening, assessment, treatment planning, case management and employment support; DSAMH records also show most clients received medication management, though not necessarily through U-SETP. Nearly all consumers indicated a high level of satisfaction with the services they received through the U-SETP program.
6 Because of SAMHSA delays with SPARS implementation, most consumer assessments conducted during the first five quarters of the project did not include interviews (86% during the first five quarters had no interview while 33% of those conducted after Q5 had no interview). As such, assessments conducted during that time did not provide data related to consumer characteristics and outcomes. The resulting small sample sizes in follow-up assessments mean that the figures presented here cannot be interpreted as proof of program impact and may instead reflect systematic differences in the reporting samples.

28
References
Bond, G. R. (1998). Principles of the Individual Placement and Support model: Empirical
support. Psychiatric Rehabilitation Journal, 22, 11-23. http://dx.doi.org.ezproxy.
lib.utah.edu/10.1037/h0095271
Bond, G. R. (1992). Vocational rehabilitation. In R. P. Liberman (Ed.), Handbook of
Psychiatric Rehabilitation (pp. 73-94). Elmsford, NY: Pergamon.
Bond, G. R., Campbell, K., & Drake, R. E. (2012). Standardized measures in four domains of
employment outcomes for Individual Placement and Support. Psychiatric Services,
63, 751-757.
Campbell, K., Bond, G. R., Drake, R. E. (2011). Who benefits from supported employment: A
meta-analytic study. Schizophrenia Bulletin, 37, 370-380.
Center for Behavioral Health Statistics and Quality (2015). Behavioral health trends in the
United States: Results from the 2014 National Survey on Drug Use and Health (HHS
Publication No. SMA 15-4927, NSDUH Series H-50). Retrieved from http://www.
samhsa.gov/data/
Center for Behavioral Health Statistics and Quality (2014). The NSDUH report: 3.1 million
adults with mental illness were unemployed. Retrieved from
http://www.samhsa.gov/ data/
Division of Substance Abuse and Mental Health (2013). Annual report. Retrieved from
https://dsamh.utah.gov/pdf/Annual%20Reports/Annual%20report%202013%
20Final%20web%20version%202-5.pdf
Hatfield, B., Huxley, P., & Mohamad, H. (1992). Accommodation and employment: A survey

29
into the circumstances and expressed needs of users of mental health services in a
Northern town. The British Journal of Social Work, 22, 61-73.
Jefferis, B. J., Nazareth, I., Marston, L., Moreno-Kustner, B., Bellón, J. A., Svab, I., . . . King, M.
(2011). Association between unemployment and major depressive disorder:
Evidence from an international, prospective study (the predict cohort). Social
Science & Medicine, 73, 1627-1634. doi:10.1016/j.socscimed.2011.09.029
Kinoshita, Y., Furuwaka, T. A., Kinoshita, K., Honyashiki, M., Omori, I. M., Marshall, M., . . .
Kingdon, D. (2013). Supported employment for adults with severe mental illness.
Cochrane Database of Systematic Reviews, 2013(9), 1-102. doi:10.1002/14651858.
CD008297.pub2
Luciano, A., & Meara, E. (2014). The employment status of people with mental illness:
National survey data from 2009 and 2010. Psychiatric Services, 65, 1201-1209.
Mechanic, D., Bilder, S., & McAlpine D. D. (2002). Employing persons with serious mental
illness. Health Affairs, 21, 242-253.
Modini, M., Tan, L., Brinchmann, B, Wang, M., Killackey, E., Glozier, N., . . . Harvey, S. B.
(2016). Supported employment for people with severe mental illness: Systematic
review and meta-analysis of the international evidence. The British Journal of
Psychiatry, 209, 14-22. doi:10.1192/bjp.bp.115.165092
Solar, A. (2015). A supported employment linkage intervention for people with
schizophrenia who want to work: A survey of patients’ views. Australasian
Psychiatry, 23, 163-165.
Substance Abuse and Mental Health Services Administration (2016). Mental and substance
use disorders. Retrieved from http://www.samhsa.gov/disorders