collision avoidance w-band fmcw radars in an altimeter application · 2011-05-14 · clasification....
TRANSCRIPT
C L A S I F I C A T I O N
Collision Avoidance W-Band FMCW Radars in an Altimeter Application
H. J. Hansen, R. Lindop and D. Majstorovic
Electronic Warfare and Radar Division Defence Science and Technology Organisation
DSTO-TR-1939
ABSTRACT
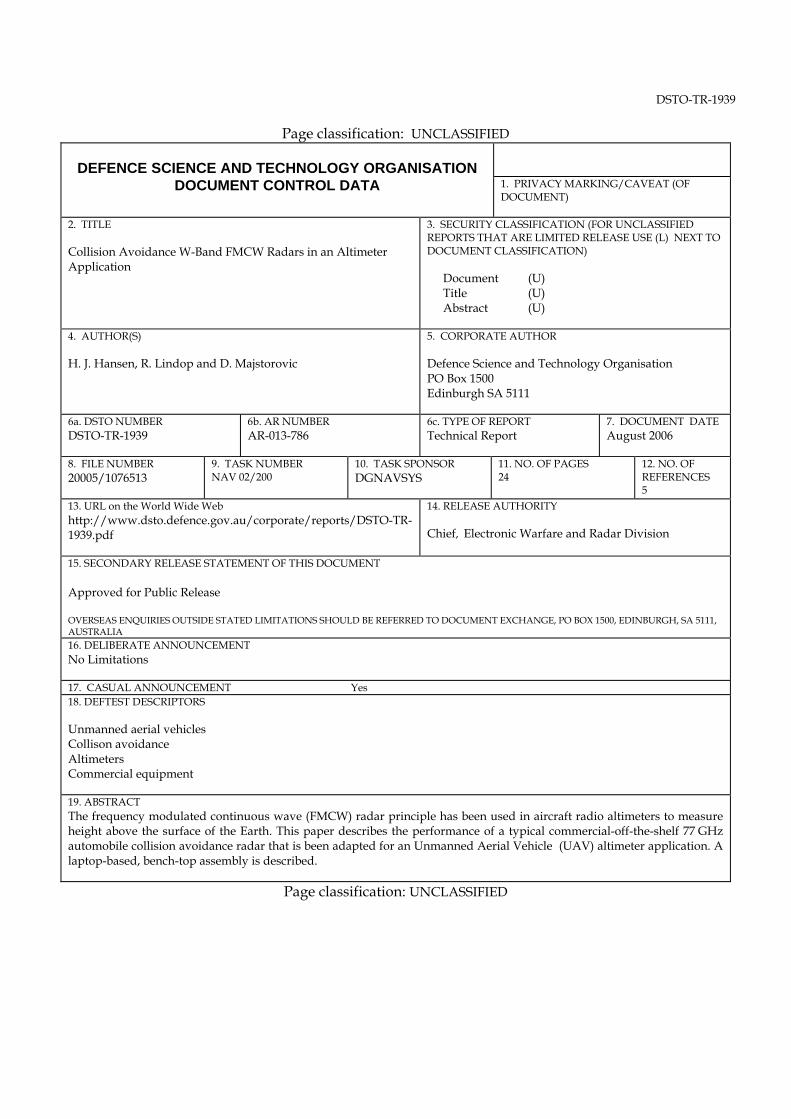
The frequency modulated continuous wave (FMCW) radar principle has been used in aircraft radio altimeters to measure height above the surface of the Earth. This paper describes the performance of a typical commercial-off-the-shelf 77 GHz automobile collision avoidance radar that is been adapted for an Unmanned Aerial Vehicle (UAV) altimeter application. A laptop-based, bench-top assembly is described.
APPROVED FOR PUBLIC RELEASE
DSTO-TR-1939
Published by
Defence Science and Technology Organisation PO Box 1500 Edinburgh South Australia 5111
Telephone: (08) 8259 5555 Fax: (08) 8259 6567
© Commonwealth of Australia 2006 AR-013-786 August 2006
APPROVED FOR PUBLIC RELEASE
DSTO-TR-1939
Collision Avoidance W-Band FMCW Radars in an Altimeter Application
EXECUTIVE SUMMARY
Millimetre wave sensing (20–110 GHz) has been of interest to the military sector since its advantages/capabilities have been recognised. Propagating mm-waves are less affected by adverse weather conditions than propagating infrared and visible emissions giving mm-wave systems intrinsic operating advantages in fog, cloud, dust and other obscurants. In use, the niche applications for mm-wave radar include tactical surveillance, fire control and missile seekers.
The recent commercialisation of Monolithic Microwave Integrated Circuit (MMICs) and Radio Frequency Integrated Circuit (RFIC) technology is leading not only to a price drop in RF transceiver front-ends but the prospect of mass production of these devices is leading to the development of several potential applications in the civilian sector. The radar system requirements for small size, high resolution and modest range performances have made 77 GHz radars ideal for automobile collision avoidance and cruise control operations. These sensors are also providing the conformal miniaturized solutions necessary for many robotic applications. It has also been demonstrated that mm-wave radars could be useful for measuring the range of ore-passes and for imaging rock structures in underground mining applications. Potentially, a small low–powered downward looking aerial radar employing Frequency Modulated Continuous Wave (FMCW) ranging can provide a continuous precise reading of altitude.
The paper describes the development of a laptop Personal Computer (PC) controlled 77 GHz FMCW radar that has been considered for UAV (<200 m) altimeter operation. The activity formed the basis of final year student projects held within the Departments of Electrical Engineering at the University of Adelaide and Flinders University. Acquisition is achieved via the PC sound card with Mathworks software and consequently the effective cost of the system is that of the wave-guide based transceiver front-end. The structure of the paper is as follows: Section 2 outlines the principle of FMCW ranging, Section 3 describes the front end of the Epsilon Lambda FMCW radar system, Section 4 provides the design specification for altimeter operation and finally Section 5 describes the operation of the assembled system.
DSTO-TR-1939
Authors
Hedley H Hansen Electronic Warfare and Radar Division
H J. Hansen (M’98) was born in Port Elizabeth South Africa in 1957. He obtained his BSc(Hons) (’80), his MSc (‘83) and his PhD (’88) from the University of Natal, Durban. His PhD research was concerned with magnetospheric wave particle interaction processes that give rise to the optical aurora. In 1988, he joined the Space Plasma Waves Group at the University of Newcastle, NSW as a post-doctoral research associate. The group maintained arrays of induction magnetometers in Australian Antarctic Territory and across the Australian Mainland. He moved to RF Technology Group, Electronic Warfare and Radar Division, Defence Science and Technology Organisation in 1996 as a senior research scientist. His professional interests lie in RF remote sensing at millimetre and sub-millimetre wavelengths, in microstrip antenna design and in phased array and miniaturized radar technology. Dr Hansen currently chairs the AP&MTT Chapter (South Australian section) of the IEEE. He is member of both the American Geophysical Union (AGU) and the Australian Institute of Physics (AIP).
DSTO-TR-1939
Richard Lindop Electronic Warfare and Radar Division
Until recently Richard Lindop was Head of RF Technologies Group (RFT) in Electronic Warfare & Radar Division at the Defence Science & Technology Organisation (DSTO), Edinburgh, South Australia. He joined DSTO in 1984 and became head of RFT group in 1993. Before joining DSTO he worked for three years as senior hybrid circuit design engineer at Philips Hendon, South Australia and prior to that for twenty two years at Philips Research Laboratories, Redhill Surrey, UK where he was involved in the early research into solid state radar systems and designed and built the prototype FMCW radar that preceded the development of the Philips “Pilot” Low Probability of Intercept radar.
D Majstorovic Electronic Warfare and Radar Division
D. Majstorovic was born in Port Lincoln South Australia in 1978. he obtained the B.E. degree in electrical and electronic engineering from the Flinders University, Adelaide, Australia in 2001. In 2001, he joined the Defence Science and Technology Organisation, Edinburgh, Australia. His research work there involved the development of various systems operating at millimetre-wave frequencies including radiometry and spectroscopy systems, remote sensing systems, superheterodyne receivers, and FMCW radars. His current research interests are in the field of RFIC design and the modelling of RF components.
5. THE DESCRIPTION OF LABORATORY BASED ALTIMETER SYSTEM 12
DSTO-TR-1939
Contents
1. 1 INTRODUCTION
2. FMCW RADAR PRINCIPLE 1
3. THE EPSILON LAMBDA FMCW RADAR SYSTEM: MODEL ELF171-1A 3
4. ALTIMETER OPERATION 4 4.1 Detectability of FM Transmitter Signals 8
6. DISCUSSION AND CONCLUSION 18
7. REFERENCES 18
Table 1: Front End Specifications [2]. 4
Figure 1: FMCW Radar [1]. 2
Figure 2: Generation of FMCW intermediate frequency [1]. 3 Figure 3: Epsilon Lambda ELF 171-1A radar. Model and System block diagram [2]. 4
Figure 4: Beam limited resolution cell (after [3]). 6 Figure 5: (black curves) Projected SNR variation of clutter return with range for ELF
171-1A type system in different weather conditions. Clutter-to-rain ratios (dB) for 1 mm/hr rain. (light-blue curves) and 4 mm/hr (dark-blue curves). 7
Figure 6: Scenario for detecting transmissions from T with dedicated receiver R. 9 Figure 7: Target detectability of receiver at standoff distance from transmitter a) power
density for ERP=10 W signals, b) signal level Gr=1 and Gr=50. The blue line shows receiver system noise level ~-75 dBm. 10
DSTO-TR-1939
Figure 8: Main Beam Sea Scattered Signal as Seen by ESM. 11 Figure 9: Altimeter Block diagram. 13 Figure 10: The radar set-up in the DSTO Atrium. 14 Figure 11a: (top): Dynamic frequency (range)-time spectrogram associated with 23.2 s
data recorded in association with the set-up described in Figure 10. 1500 intervals of 2048 FFT is performed on the 1024000 samples, i.e., the running FFT was performed stepping 683 points through the data, 11b:(below): Static power spectrum for the final 2048 points of the data set. 16
Figure 12: The atrium roof. 17 Figure 13: Dynamic frequency (range) time spectrogram. Transmissions directed
towards atrium roof. 17
DSTO-TR-1939
1
1. Introduction W-band (75-110 GHz) millimetre wave radars are poised to form an important component of autonomous vehicle operations. Propagating mm-waves are less affected by adverse weather conditions than infrared and visible emissions, giving mm-wave systems intrinsic operating advantages in fog, cloud, dust and other obscurants [1]. Existing off-the-shelf automobile collision avoidance systems, operating at 77 GHz, have antenna apertures near 10 cm in length and they promise to provide the conformal miniaturized solutions necessary for many robotic applications.
An important part of navigational control of Unmanned Aerial Vehicles (UAVs) is the measurement of altitude. A small, low-powered downward-looking continuous-wave radar, employing FM ranging can provide a continuous precise reading of altitude.
This report firstly provides performance projections for a commercial-off-the-shelf automobile 77 GHz radar collision-avoidance system in an aerial altimeter application. For the purposes of this report, a hovering air platform is considered. The paper then addresses the detectability of the radar emissions. Finally the assembly of a laptop PC based driven prototype altimeter system is presented and its operation described.
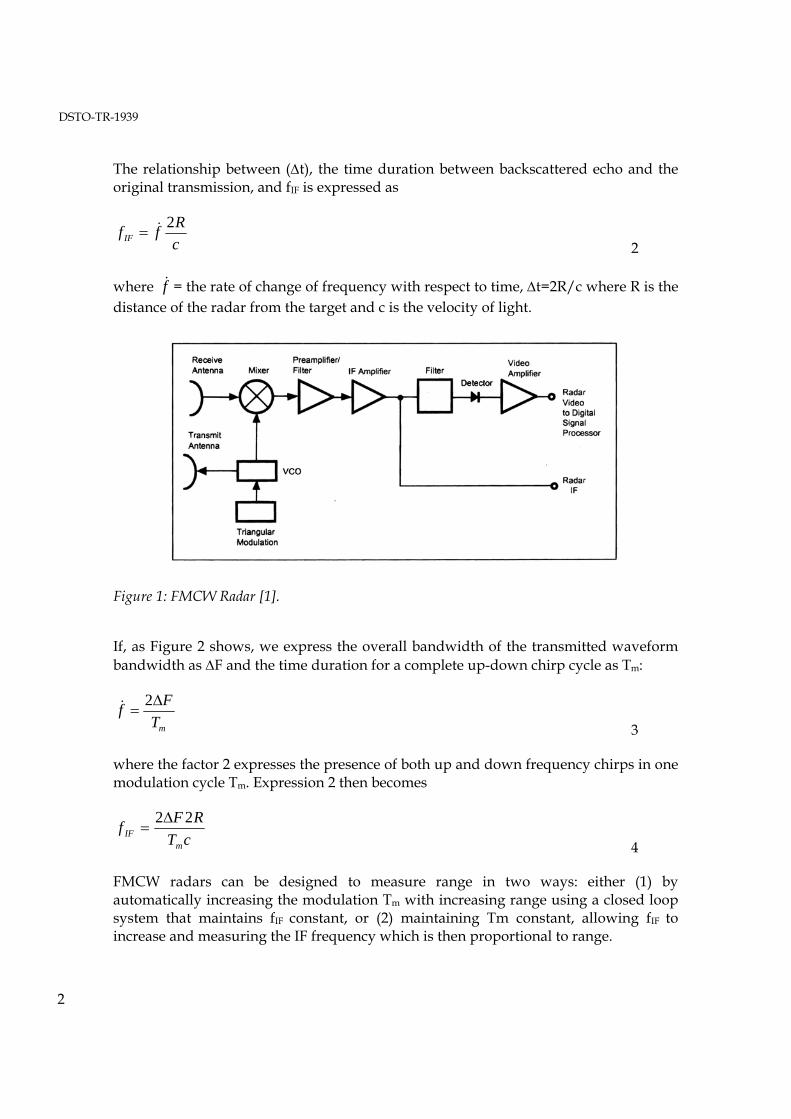
2. FMCW Radar Principle Frequency-Modulated Continuous Wave (FMCW) radars are used to measure ranges to targets at a closer distance than pulsed radars can typically operate. Figure 1 [1] shows a typical FMCW architecture. The same antenna can be employed for both transmit and receive functions when a circulator is used to provide isolation between transmitted and received signals. The heart of the system is a Voltage Controlled Oscillator (VCO) that allows linearized voltage modulation of the output for transmission and acts as the Local Oscillator (LO) of the mixer, generating the Intermediate Frequency (IF) from the received echo.
The IF FMCW radar signal contains the radar-to-target range information. At the mixer, the IF output is written as
}{}{ tfttff IF −Δ+= 1
where f{t+Δt} is the output frequency of the VCO at the time the backscattered echo reaches the receive antenna and f{t} represents the frequency of the VCO at the time t when the FMCW signal is originally transmitted.
DSTO-TR-1939
2
The relationship between (Δt), the time duration between backscattered echo and the original transmission, and fIF is expressed as
cRff IF
2&= 2
where = the rate of change of frequency with respect to time, Δt=2R/c where R is the distance of the radar from the target and c is the velocity of light.
f&
Figure 1: FMCW Radar [1].
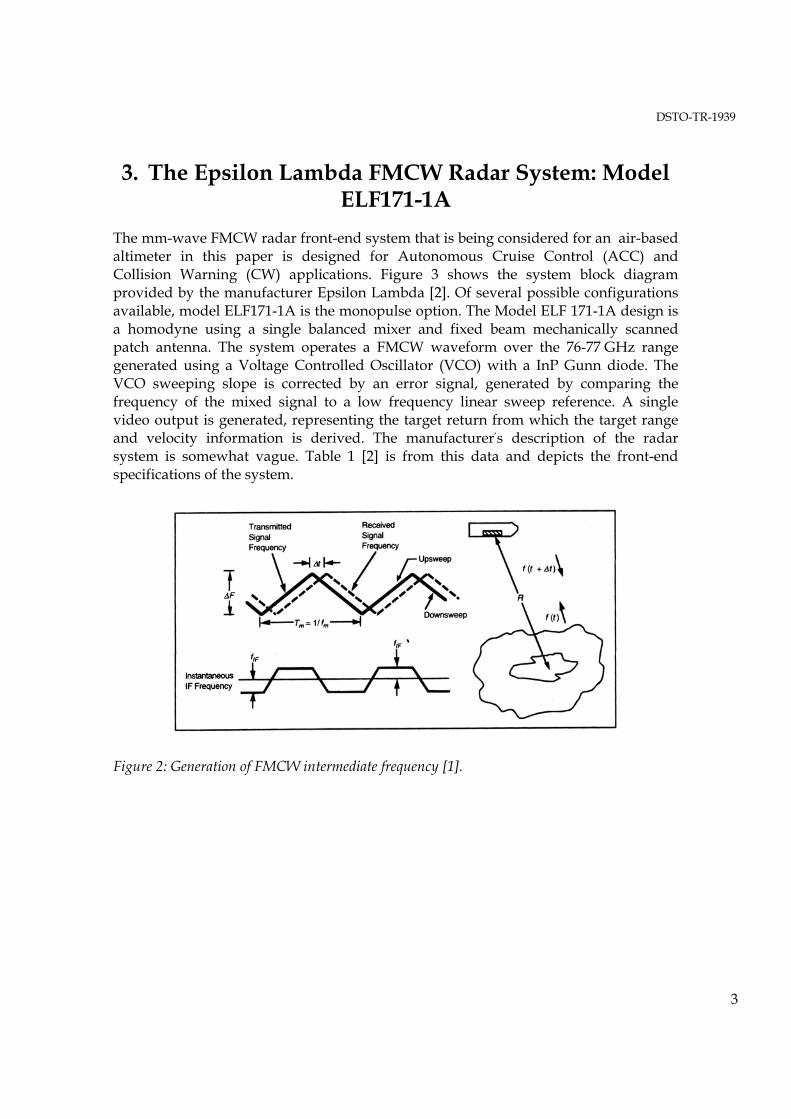
If, as Figure 2 shows, we express the overall bandwidth of the transmitted waveform bandwidth as ΔF and the time duration for a complete up-down chirp cycle as Tm:
mTFf Δ
=2&
3
where the factor 2 expresses the presence of both up and down frequency chirps in one modulation cycle Tm. Expression 2 then becomes
cTRFf
mIF
22Δ=
4
FMCW radars can be designed to measure range in two ways: either (1) by automatically increasing the modulation Tm with increasing range using a closed loop system that maintains fIF constant, or (2) maintaining Tm constant, allowing fIF to increase and measuring the IF frequency which is then proportional to range.
DSTO-TR-1939
3
3. The Epsilon Lambda FMCW Radar System: Model ELF171-1A
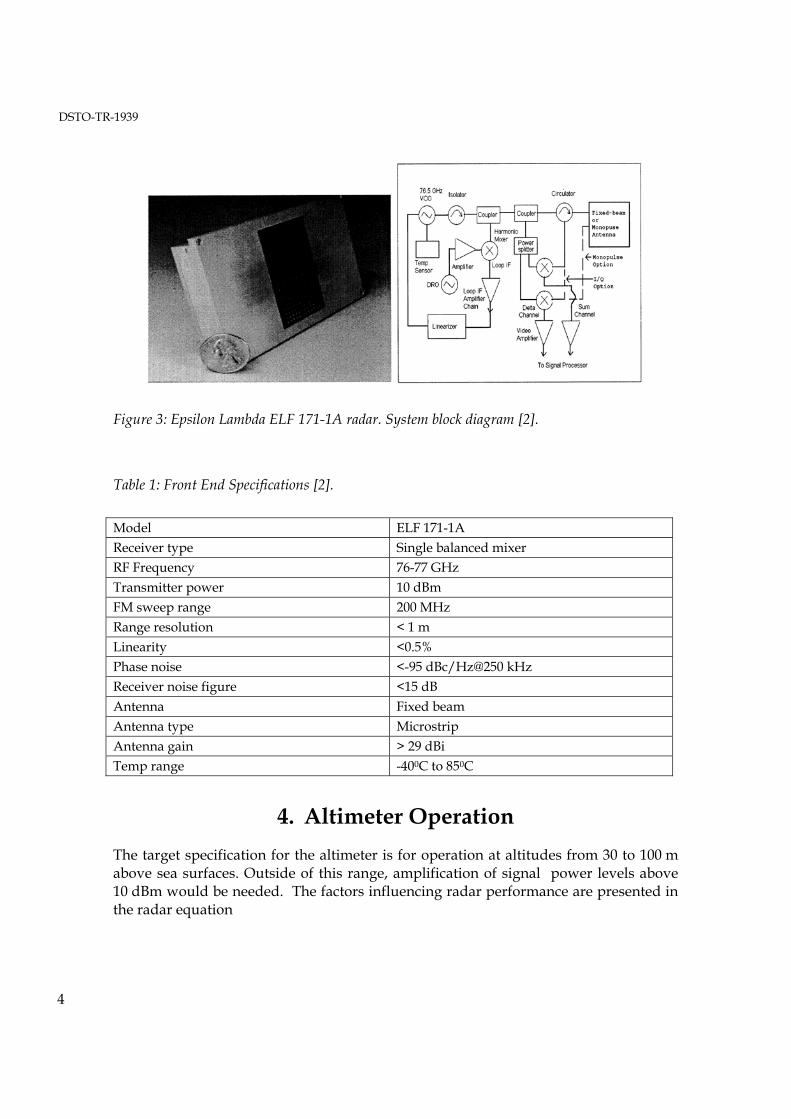
The mm-wave FMCW radar front-end system that is being considered for an air-based altimeter in this paper is designed for Autonomous Cruise Control (ACC) and Collision Warning (CW) applications. Figure 3 shows the system block diagram provided by the manufacturer Epsilon Lambda [2]. Of several possible configurations available, model ELF171-1A is the monopulse option. The Model ELF 171-1A design is a homodyne using a single balanced mixer and fixed beam mechanically scanned patch antenna. The system operates a FMCW waveform over the 76-77 GHz range generated using a Voltage Controlled Oscillator (VCO) with a InP Gunn diode. The VCO sweeping slope is corrected by an error signal, generated by comparing the frequency of the mixed signal to a low frequency linear sweep reference. A single video output is generated, representing the target return from which the target range and velocity information is derived. The manufacturer’s description of the radar system is somewhat vague. Table 1 [2] is from this data and depicts the front-end specifications of the system.
Figure 2: Generation of FMCW intermediate frequency [1].
DSTO-TR-1939
4
Figure 3: Epsilon Lambda ELF 171-1A radar. System block diagram [2].
Table 1: Front End Specifications [2].
Model ELF 171-1A Receiver type Single balanced mixer RF Frequency 76-77 GHz Transmitter power 10 dBm FM sweep range 200 MHz Range resolution < 1 m Linearity <0.5% Phase noise <-95 dBc/Hz@250 kHz Receiver noise figure <15 dB Antenna Fixed beam Antenna type Microstrip Antenna gain > 29 dBi Temp range -400C to 850C
4. Altimeter Operation The target specification for the altimeter is for operation at altitudes from 30 to 100 m above sea surfaces. Outside of this range, amplification of signal power levels above 10 dBm would be needed. The factors influencing radar performance are presented in the radar equation
DSTO-TR-1939
5
( ) s
rttr LR
GGPP
43
2
4πσλ
= 5
and ( ) ns
rtt
kTBFLRGGP
NS43
2
4/
πσλ
= 6
where Pr= Received power, Pt=Transmitted power, Gt= Transmitter antenna gain, Gr= Receiver antenna gain, σ= Radar cross-section, λ= Free space wavelength, R= Detect distance, and kTBFn=system noise where k=Boltzmann’s constant T=Reference temperature Ls= System loss including atmospheric effects Fn=Noise Figure
Inserting appropriate parameters from Table 1 ( λ=3.92 mm, Pt =10 mW, Gt= Gr=30 dB) allows the received target return power, backscattered from the sea (for a given RCS of σ) in given atmospheric conditions (Ls), to be determined at varying distances (R).The effect of pitch and roll of the UAV on altimeter performance is ignored.
The average value of RCS (σc), appropriate for relevant sea state backscatter at the close-to-perpendicular incidence required for an altimeter, can be found in remote sensing literature. For this report, we have adopted a typical measured reflectivity coefficient value (ς) associated with sea surfaces and the surface area (A) illuminated by the antenna mainbeam at shallow grazing angles (<60). The typical value that has been assumed for ς=0.001=-30dB [3] is considered to be conservative so the following design is based on worst-case conditions.
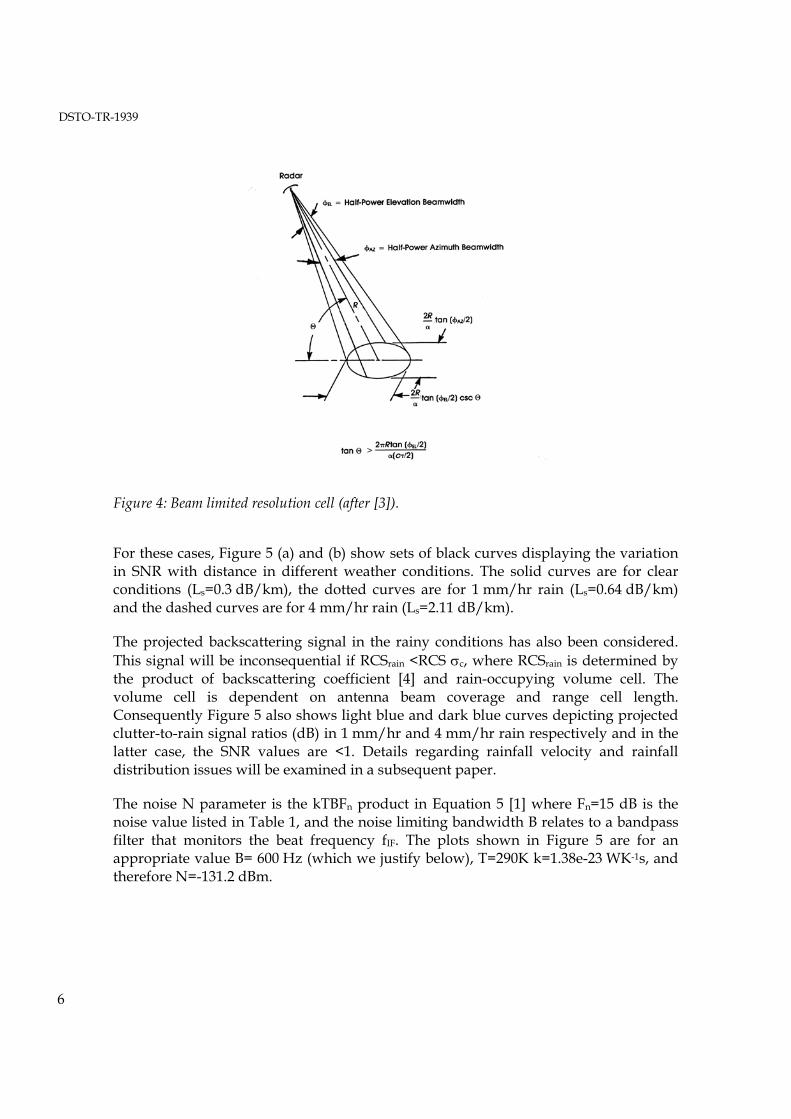
Two scenarios are considered, those at normal incidence, θ=900 and at θ=600, where illuminated surface area
2
2
33.1
)2tan()2tan(1 azelR
SinA
φφπ
θ= [3] 7
relates to the geometry shown in Figure 4.
DSTO-TR-1939
6
Figure 4: Beam limited resolution cell (after [3]).
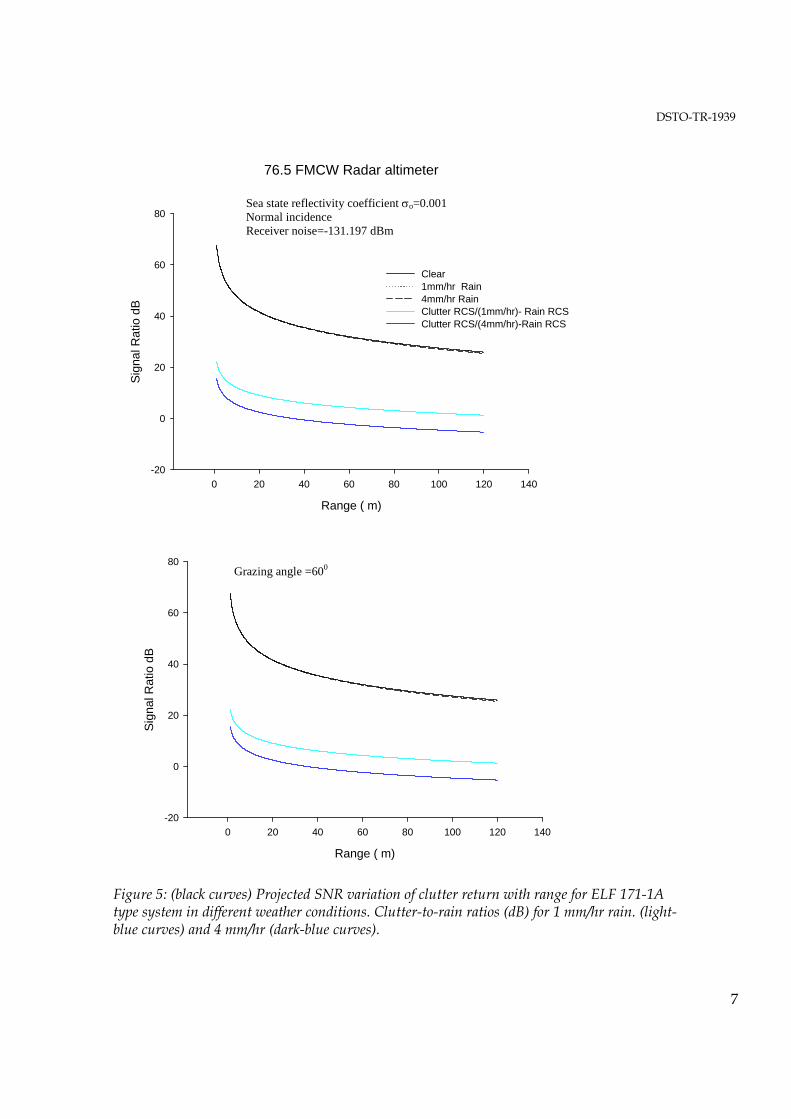
For these cases, Figure 5 (a) and (b) show sets of black curves displaying the variation in SNR with distance in different weather conditions. The solid curves are for clear conditions (Ls=0.3 dB/km), the dotted curves are for 1 mm/hr rain (Ls=0.64 dB/km) and the dashed curves are for 4 mm/hr rain (Ls=2.11 dB/km).
The projected backscattering signal in the rainy conditions has also been considered. This signal will be inconsequential if RCSrain <RCS σc, where RCSrain is determined by the product of backscattering coefficient [4] and rain-occupying volume cell. The volume cell is dependent on antenna beam coverage and range cell length. Consequently Figure 5 also shows light blue and dark blue curves depicting projected clutter-to-rain signal ratios (dB) in 1 mm/hr and 4 mm/hr rain respectively and in the latter case, the SNR values are <1. Details regarding rainfall velocity and rainfall distribution issues will be examined in a subsequent paper.
The noise N parameter is the kTBFn product in Equation 5 [1] where Fn=15 dB is the noise value listed in Table 1, and the noise limiting bandwidth B relates to a bandpass filter that monitors the beat frequency fIF. The plots shown in Figure 5 are for an appropriate value B= 600 Hz (which we justify below), T=290K k=1.38e-23 WK-1s, and therefore N=-131.2 dBm.
DSTO-TR-1939
7
76.5 FMCW Radar altimeter
Range ( m)
0 20 40 60 80 100 120 140
Sign
al R
atio
dB
-20
0
20
40
60
80
Clear1mm/hr Rain4mm/hr Rain Clutter RCS/(1mm/hr)- Rain RCS Clutter RCS/(4mm/hr)-Rain RCS
Sea state reflectivity coefficient σo=0.001 Normal incidence Receiver noise=-131.197 dBm
Range ( m)
0 20 40 60 80 100 120 140
Sign
al R
atio
dB
-20
0
20
40
60
80 Grazing angle =600
Figure 5: (black curves) Projected SNR variation of clutter return with range for ELF 171-1A type system in different weather conditions. Clutter-to-rain ratios (dB) for 1 mm/hr rain. (light-blue curves) and 4 mm/hr (dark-blue curves).
DSTO-TR-1939
8
Over a 30<R<100 m range of heights the overhead case (θ=00) projects SNR values ≥30dB. Over a similar range of distances the θ=600 grazing angle case projects slightly lower SNR values (~3dB down). These SNRs satisfy the altimeter operational requirements as they are higher than the typical ~7dB requirement [2] for collision avoidance operation specified by commercial manufacturers.
If we suppose the Epsilon Lambda ELF 171-1A system, as an altimeter, was operating such that the beat frequency fIF is constant, the B=600 Hz filter would provide an appropriate filter of Q=fIF/B=200 in the operating environment. The maximum operating frequency of the system’s linearizer is 1.5 kHz [2]. Consequently, since the minimum operational altitude is R= 30 m, setting Tm =1/1500 s as the complete up-down cycle of a chirp, allows Equation 4 (with ΔF=200 MHz) to provide an appropriate frequency fIF= 120 kHz for altimeter operations. At larger operational heights (up to 100 m), the operating frequency of the linearizer could be slowed in order to maintain this constant beat frequency [1].
The backscattered radiation gives rise to a spread of fIF corresponding to different path lengths ΔR between scatter points within the mainbeam illuminated sea surface and the receiver. This causes a spread ΔfIF which bandwidth B must cover, i.e., ΔfIF< B. Simple trigonometry shows that the mainbeam antenna beamwidth determines ΔRmax, allowing Equation 4 to be used to convert the parameter to a value of frequency spread ΔfIF [5]. The 29-30dB gain antenna provides a mainbeam antenna beamwidth φ=3.5o and this converts to a frequency spread ΔfIF=448 Hz at all heights which indeed is less than chosen B=600 Hz.
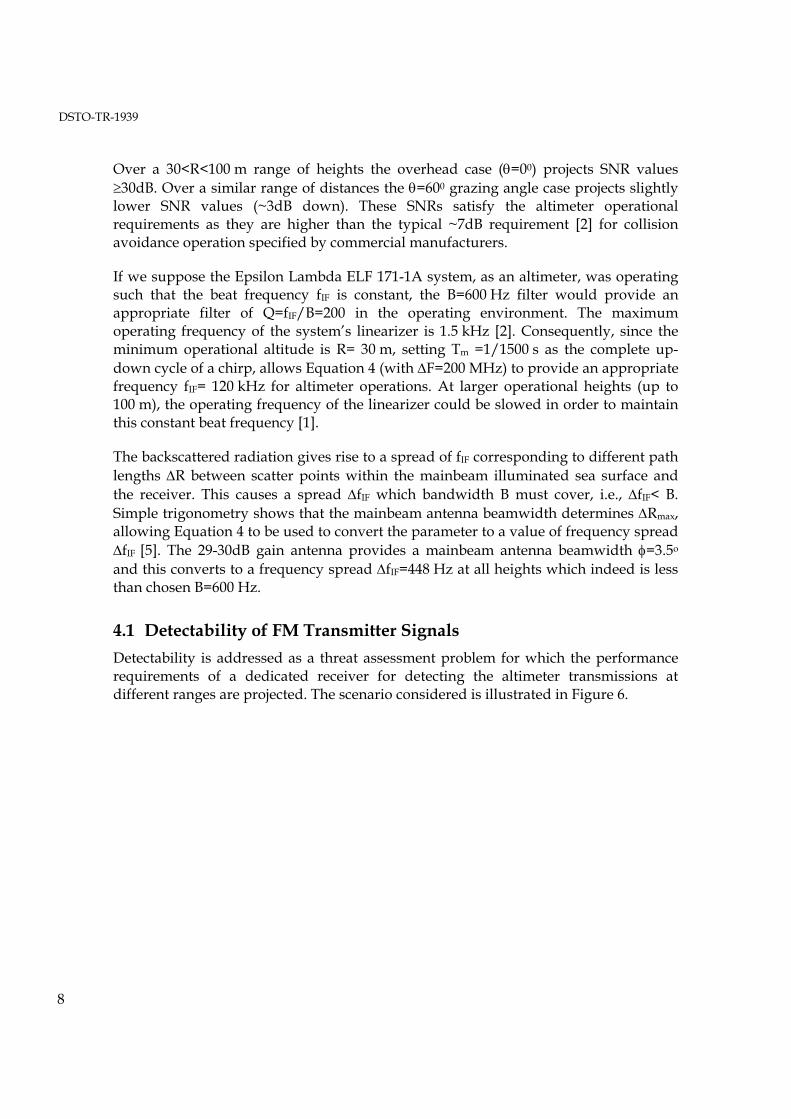
4.1 Detectability of FM Transmitter Signals Detectability is addressed as a threat assessment problem for which the performance requirements of a dedicated receiver for detecting the altimeter transmissions at different ranges are projected. The scenario considered is illustrated in Figure 6.
DSTO-TR-1939
9
Td
RF Waves
R
A =Gλ2
4ΠA =
Gλ2
4Π
Td
RF Waves
R
A =Gλ2
4ΠA =
Gλ2
4Π
Figure 6: Scenario for detecting transmissions from T with dedicated receiver R.
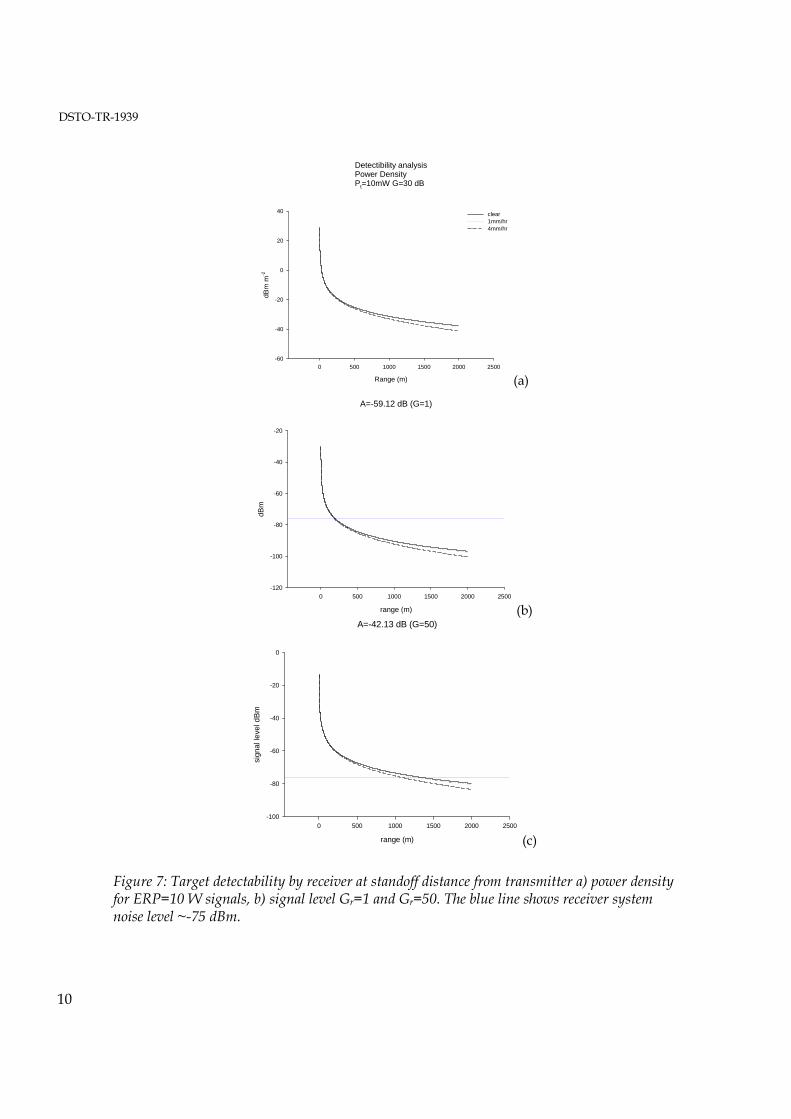
The receiver’s signal level is determined by the product of the power density of the altimeter’s radiation at the receiver’s location, and the effective aperture of the receiver’s antenna. Figure 7 shows (a) projected power density variation with range curves that are relevant to the ELF 171-1A system type radiation described above. The figure then shows the signal level requirements for any receiver detecting the radiation at different ranges, using (b) G=1 and (c) G=50 (~15dB) receiving antennas.
DSTO-TR-1939
10
Detectibility analysisPower DensityPt=10mW G=30 dB
Range (m)
0 500 1000 1500 2000 2500
dBm
m-2
-60
-40
-20
0
20
40 clear1mm/hr4mm/hr
(a) A=-59.12 dB (G=1)
range (m)
0 500 1000 1500 2000 2500
dBm
-120
-100
-80
-60
-40
-20
(b) A=-42.13 dB (G=50)
range (m)
0 500 1000 1500 2000 2500
sign
al le
vel d
Bm
-100
-80
-60
-40
-20
0
(c)
Figure 7: Target detectability by receiver at standoff distance from transmitter a) power density for ERP=10 W signals, b) signal level Gr=1 and Gr=50. The blue line shows receiver system noise level ~-75 dBm.
DSTO-TR-1939
11
The projected signal levels of the received radiation, are undetectable beyond 1200 m using current typical ESM receivers because of the noise floor associated with a wide instantaneous spectral coverage. The signal noise level is determined by the noise figure F (F= 15 dB is acceptable for ESM Rf front-ends at mm-wave frequencies [1]) and RF front-end bandwidth B. The receiver bandwidth must cover the chirp, and setting B=200 MHz sets a signal noise level at ~-75 dBm, which is depicted in Figure 7 by blue lines. Figure 7 (c) shows that the projected signal levels of radiation are below this beyond 1200 m for the G=15dB receiver.
Conventional altimeters operating at lower frequencies (4.3 GHz) transmit similar power levels and they can be detected at tactically significant ranges, well beyond 1200 m with specialized EW equipment. This mm-wave radar is therefore inherently covert and in practice one can argue it would perform better than the simple assessment just outlined. This assessment has assumed a mainbeam G= 30dB antenna is responsible for the detected transmissions. Since sidelobe levels will be present, it is pertinent to consider the ranges at which a detection device could detect the presence of the altimeter. Sidelobes at levels 12dB down from the mainbeam would give rise to signal levels at 0.25 of the ranges depicted in Figure 7 ((b) and (c)). This is because the power density of radiation drops off as 1/R2, and consequently, the signal level at four times the distance will be smaller by 42=16≡12dB.
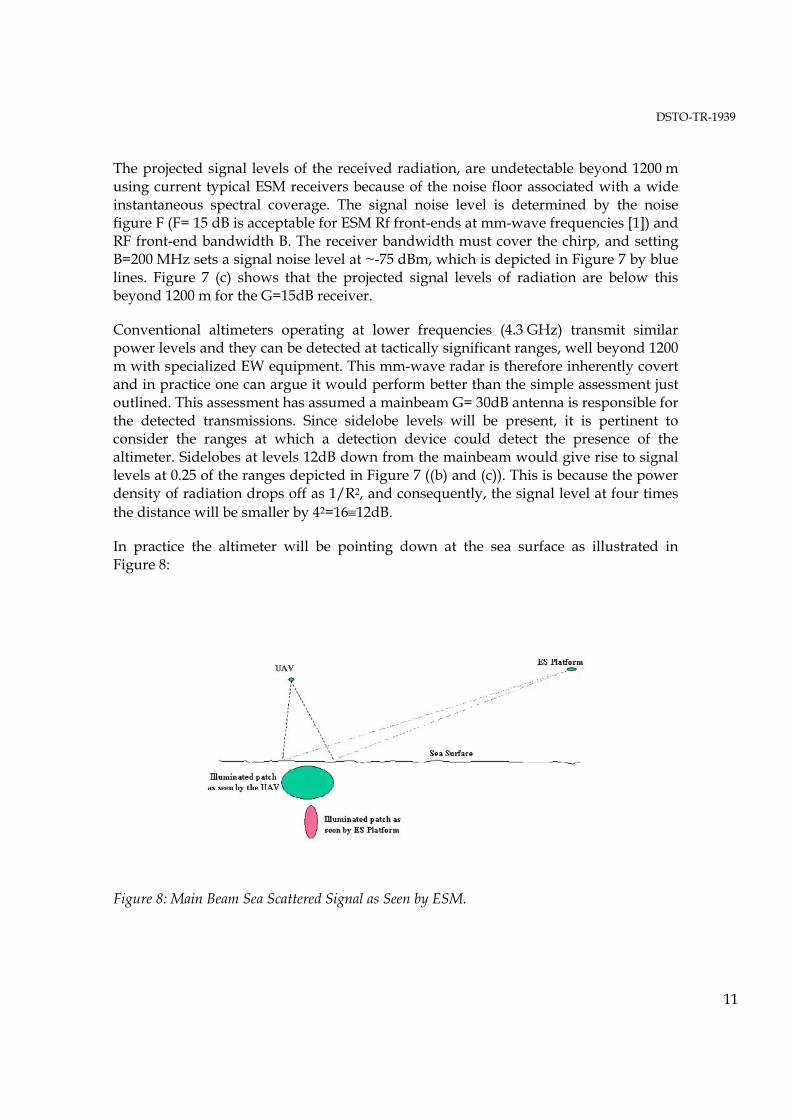
In practice the altimeter will be pointing down at the sea surface as illustrated in Figure 8:
Figure 8: Main Beam Sea Scattered Signal as Seen by ESM.
DSTO-TR-1939
12
The receiver on an adversary’s platform can potentially see the same patch of illuminated sea as the radar itself but in general will be seeing it from a much shallower angle so that the patch area will be less. It follows that the detectability of the real system will be substantially lower than the scenario of Figure 6 which is the absolute worst case.
The low clutter-to-rain ratios in 4 mm/hr rain suggest that in inclement weather, the operation of a 77 GHz operating altimeter will be compromised. It should be noted though that the rain RCS values used rely on a small set [4] of backscattering coefficient values and more detailed assessment of rain behaviour at W-band frequencies, may be required.
Finally, it should be mentioned that this analysis has ignored any signal-processing gain that would be associated with the system. Computer-based processing gain following Analogue to Digital Conversion (ADC) can be expected to improve SNR by ~16dB and therefore the projected estimates described are conservative.
5. The Description of Laboratory based Altimeter System
An FMCW mode involves transmitting a chirp waveform and mixing the received signal associated with the backscattered returning radiation with the transmission signal. The frequency exhibited by the mixed beating signal is dependent on the time delay of the returning echo and is therefore range dependent. Consequently, altimeter operation is achieved using Fourier analysis of the digitally converted analogue IF signal from the mixer because the spectrum of frequencies present relates to the location of objects scattering radiation back to the receiver.
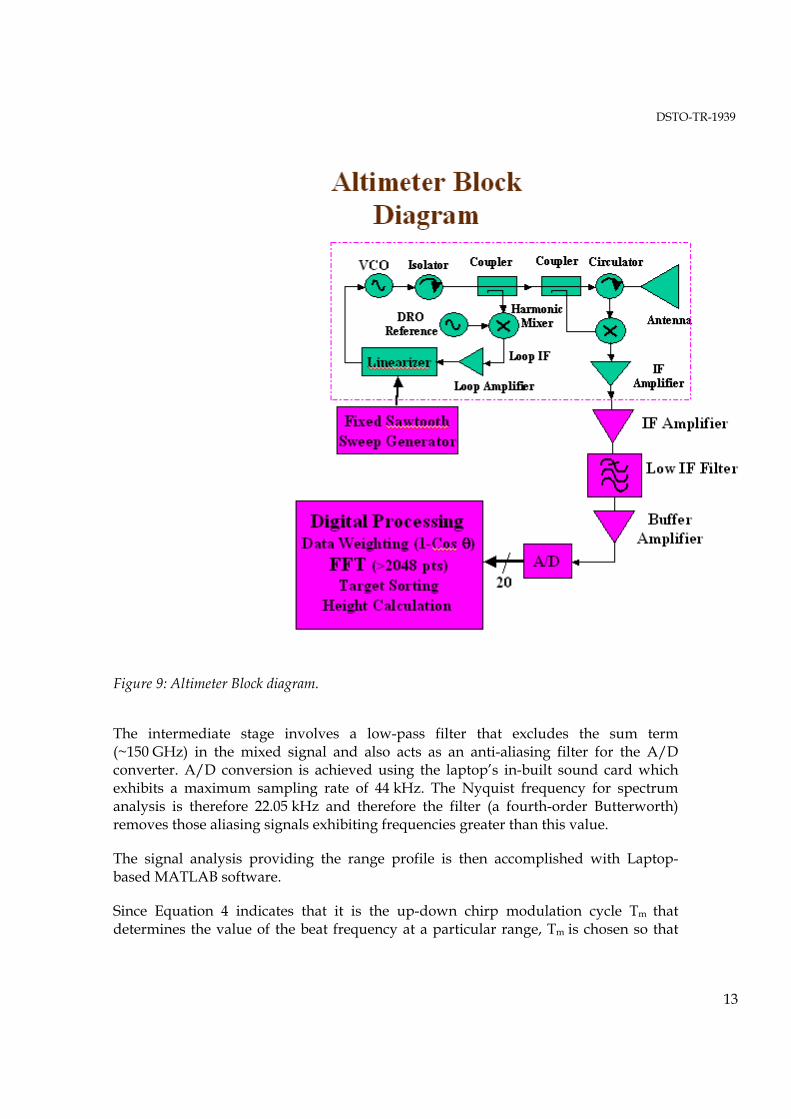
Figure 9 shows a block diagram of the Epsilon Lambda transceiver assembled as part of a bench-top altimeter-type system. The initial stage enclosed within the dotted rectangle is the COTS front-end. Then follows the intermediate stage that prepares the mixed signal for A/D conversion. The final Fourier signal processing stage is performed on laptop computer.
DSTO-TR-1939
13
Figure 9: Altimeter Block diagram.
The intermediate stage involves a low-pass filter that excludes the sum term (~150 GHz) in the mixed signal and also acts as an anti-aliasing filter for the A/D converter. A/D conversion is achieved using the laptop’s in-built sound card which exhibits a maximum sampling rate of 44 kHz. The Nyquist frequency for spectrum analysis is therefore 22.05 kHz and therefore the filter (a fourth-order Butterworth) removes those aliasing signals exhibiting frequencies greater than this value.
The signal analysis providing the range profile is then accomplished with Laptop-based MATLAB software.
Since Equation 4 indicates that it is the up-down chirp modulation cycle Tm that determines the value of the beat frequency at a particular range, Tm is chosen so that
DSTO-TR-1939
14
the signals exhibiting the Nyquist frequency would be associated with radiation coming from the maximum range (100 m). The radar manufacturer tested the radar front-end using an up-down 1 kHz chirp modulation rate. For radiation from 100 m, this would give rise to 270 kHz which is unsuitable for the Laptop sound card A/D conversion operation. Calculations indicate that signals from 5.6 to 18.6 kHz would be associated with 30 to 100 m ranges for modulation rate Tm = 0.014 s (70 Hz), and therefore this modulation rate was applied for the results described here.
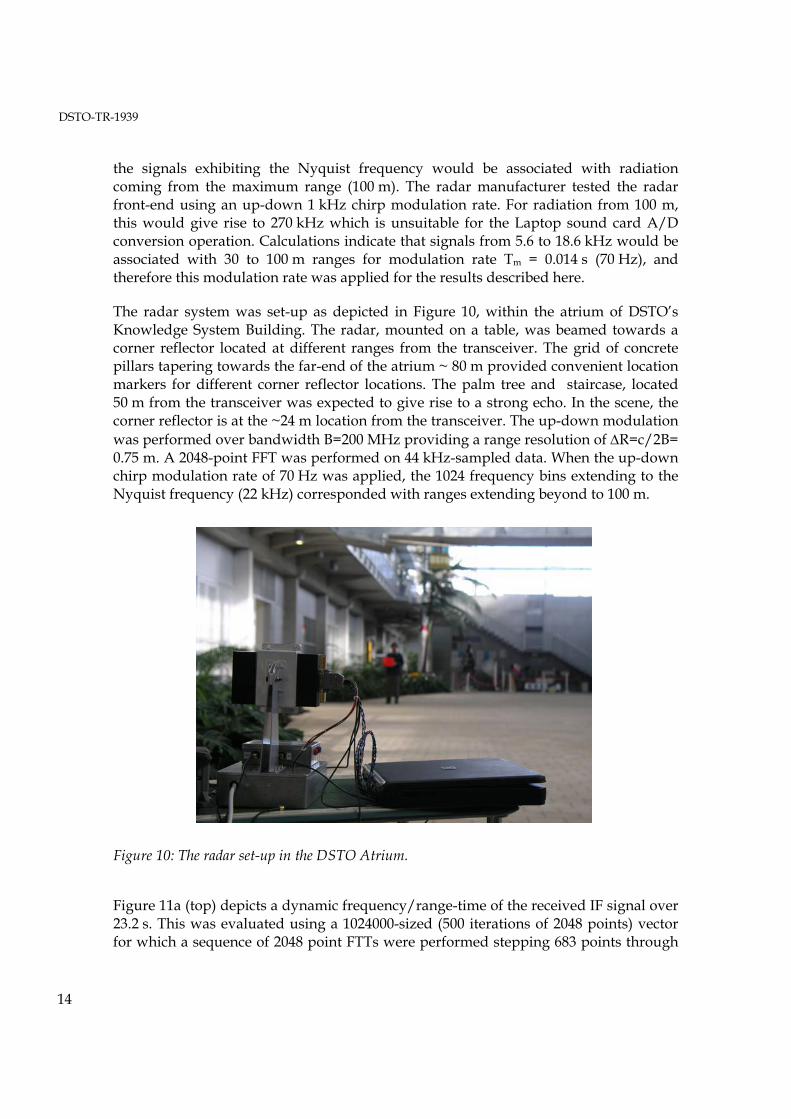
The radar system was set-up as depicted in Figure 10, within the atrium of DSTO’s Knowledge System Building. The radar, mounted on a table, was beamed towards a corner reflector located at different ranges from the transceiver. The grid of concrete pillars tapering towards the far-end of the atrium ~ 80 m provided convenient location markers for different corner reflector locations. The palm tree and staircase, located 50 m from the transceiver was expected to give rise to a strong echo. In the scene, the corner reflector is at the ~24 m location from the transceiver. The up-down modulation was performed over bandwidth B=200 MHz providing a range resolution of ΔR=c/2B= 0.75 m. A 2048-point FFT was performed on 44 kHz-sampled data. When the up-down chirp modulation rate of 70 Hz was applied, the 1024 frequency bins extending to the Nyquist frequency (22 kHz) corresponded with ranges extending beyond to 100 m.
Figure 10: The radar set-up in the DSTO Atrium.
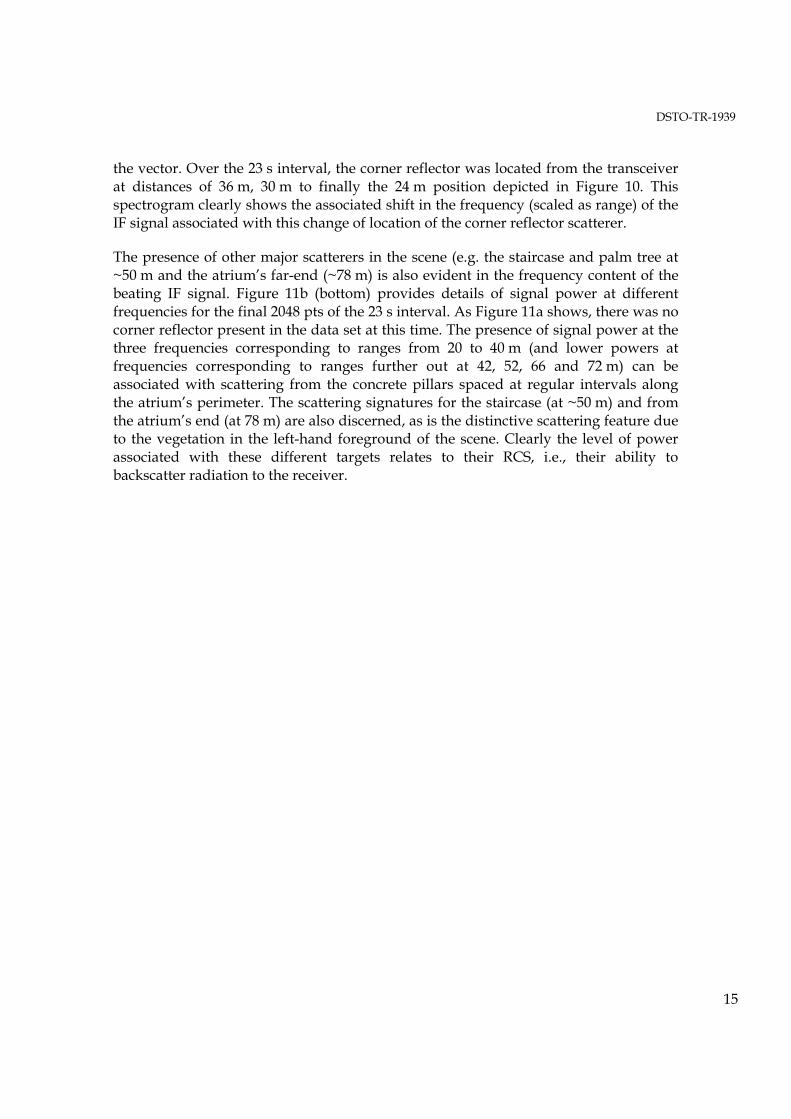
Figure 11a (top) depicts a dynamic frequency/range-time of the received IF signal over 23.2 s. This was evaluated using a 1024000-sized (500 iterations of 2048 points) vector for which a sequence of 2048 point FTTs were performed stepping 683 points through
DSTO-TR-1939
15
the vector. Over the 23 s interval, the corner reflector was located from the transceiver at distances of 36 m, 30 m to finally the 24 m position depicted in Figure 10. This spectrogram clearly shows the associated shift in the frequency (scaled as range) of the IF signal associated with this change of location of the corner reflector scatterer.
The presence of other major scatterers in the scene (e.g. the staircase and palm tree at ~50 m and the atrium’s far-end (~78 m) is also evident in the frequency content of the beating IF signal. Figure 11b (bottom) provides details of signal power at different frequencies for the final 2048 pts of the 23 s interval. As Figure 11a shows, there was no corner reflector present in the data set at this time. The presence of signal power at the three frequencies corresponding to ranges from 20 to 40 m (and lower powers at frequencies corresponding to ranges further out at 42, 52, 66 and 72 m) can be associated with scattering from the concrete pillars spaced at regular intervals along the atrium’s perimeter. The scattering signatures for the staircase (at ~50 m) and from the atrium’s end (at 78 m) are also discerned, as is the distinctive scattering feature due to the vegetation in the left-hand foreground of the scene. Clearly the level of power associated with these different targets relates to their RCS, i.e., their ability to backscatter radiation to the receiver.
DSTO-TR-1939
16
Figure 11a: (top): Dynamic frequency (range)-time spectrogram associated with 23.2 s data recorded in association with the set-up described in Figure 10. 1500 intervals of 2048 FFT is performed on the 1024000 samples, i.e., the running FFT was performed stepping 683 points through the data, 11b:(below): Static power spectrum for the final 2048 points of the data set.
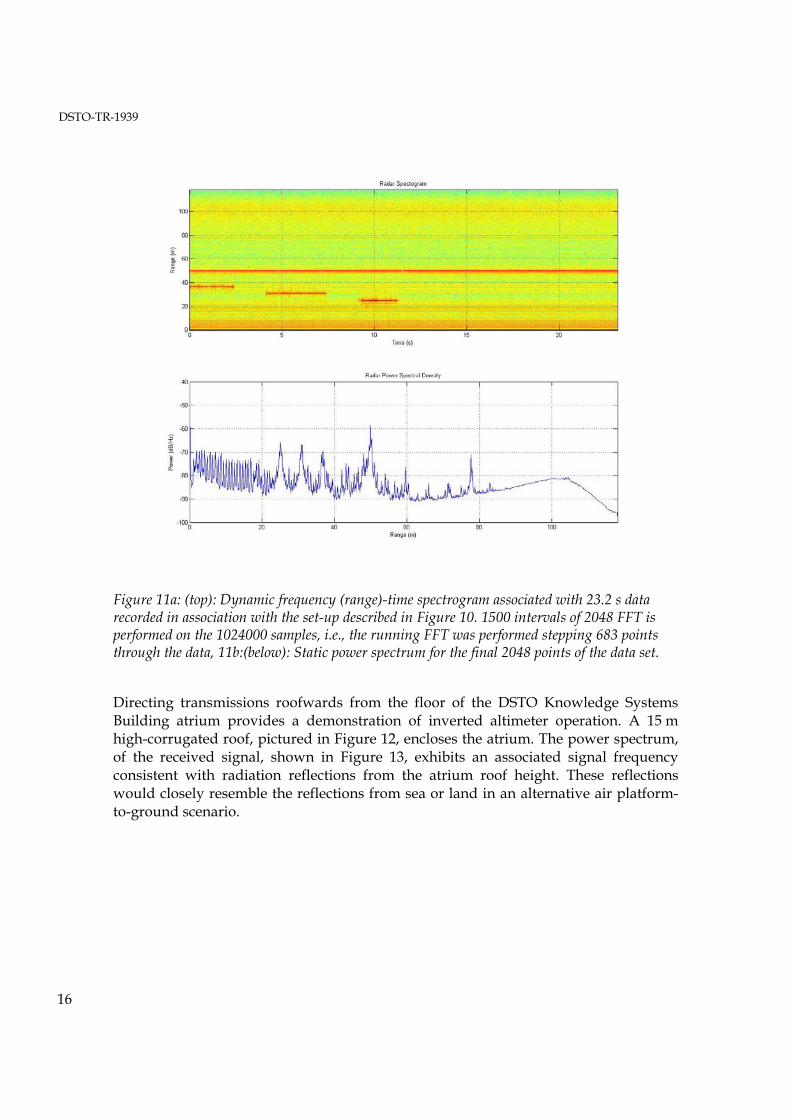
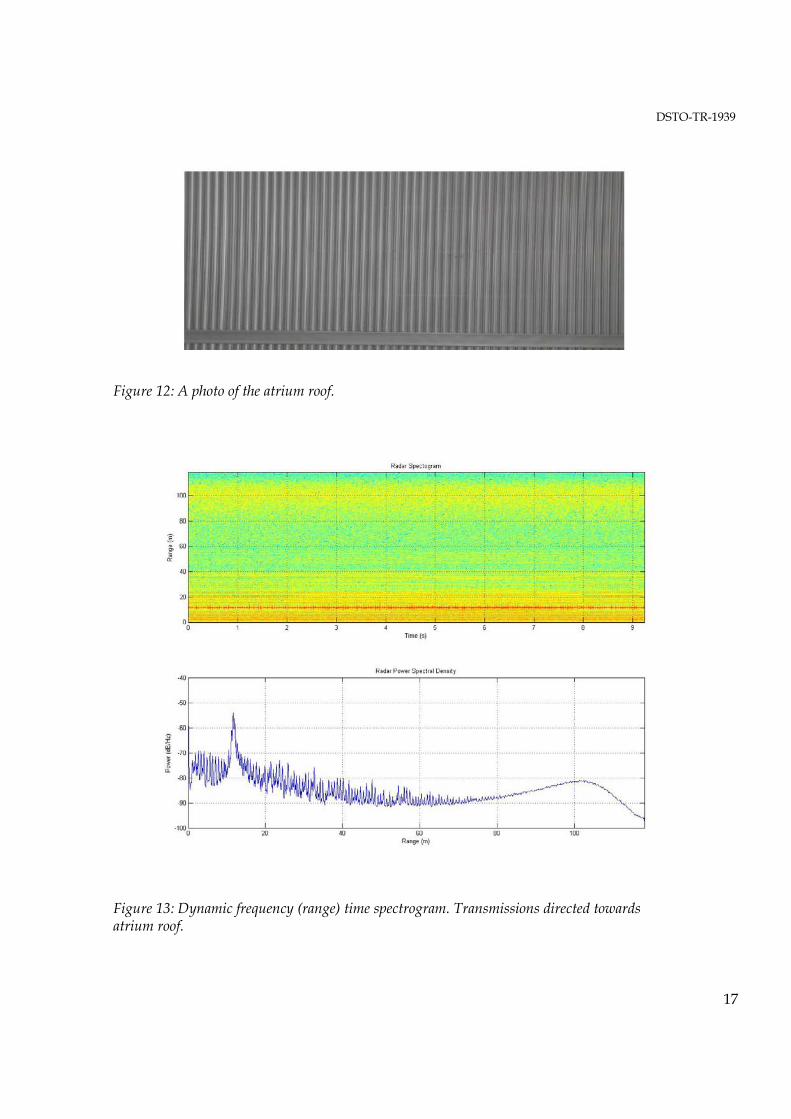
Directing transmissions roofwards from the floor of the DSTO Knowledge Systems Building atrium provides a demonstration of inverted altimeter operation. A 15 m high-corrugated roof, pictured in Figure 12, encloses the atrium. The power spectrum, of the received signal, shown in Figure 13, exhibits an associated signal frequency consistent with radiation reflections from the atrium roof height. These reflections would closely resemble the reflections from sea or land in an alternative air platform-to-ground scenario.
DSTO-TR-1939
17
Figure 12: A photo of the atrium roof.
Figure 13: Dynamic frequency (range) time spectrogram. Transmissions directed towards atrium roof.
DSTO-TR-1939
18
6. Discussion and Conclusion It has been demonstrated that the inbuilt audio and media facility of commercially available laptop PC computers provides the capability for the processing of FMCW radar signals.
The investigations reported show within ranges <200 m millimetre waves transmissions are expected to be insensitive to atmospheric absorption. It has also been shown that characteristic spectral features are provided in measurements associated with different objects at different ranges with reflection from an overhead roof demonstrating altimeter type operation. The development of replacement integrated circuit transceivers for waveguide-based units is the focus for future millimetre wave car sensor research. Integrated circuit systems are smaller, lighter and cheaper because they are readily mass produced using standard IC fabrication processes [6]. Until recently, millimetre wave integrated circuits operating above 40 GHz have relied on InP GaAS based MMIC (monolithic microwave integrated circuit components) for which no digital integration is provided and for which flip chip assembly is complicated. However the SiGe 0.17 μm BICMOS fabrication process is now realising radar-on-chip generation of 77 GHz collision car radars and this offers the advantages of not requiring high precision microwave interconnects and of readily facilitating integration with digital CMOS based processes [7]. Commercially driven CMOS foundries provide circuitry for < 10 GHz signals and once they develop the ~0.1 μm (or smaller) process necessary for millimetre wave circuitry design, the radars described here will become as expendable and as accessible as PC plug-in cards and mobile phones. Such systems will satisfy the requirements for future UAV payload operations.
7. Acknowledgements The technical support of students A. Rust S. Bauer (U. of Adelaide) and S. Maya (Flinders University) is gratefully acknowledged.
8. References [1] Klein L. A., Chapter 4 from “Millimetre-wave and infrared multi-sensor design
and signal processing”, Artech House Inc, Norwood MA, 1997.
[2] Li D. D., Luo S. C.,Knox R., Millimetre Wave FMCW FLR Transceiver/Antenna for automotive applications, Int Rept: Epsilon Lambda Electronics Corp.
[3] Ed: Currie N. C. C. and Brown C. E., Chapt 5 from “Principles and applications of mm-wave radar”, Artech House Inc, Norwood MA, 1987.
DSTO-TR-1939
19
[4] Currie N. C. C., Hayes R. D. and Trebits R. N., Chapt 4 from “Millimetre-wave Clutter, Artech House Inc, Norwood MA, 1992.
[5] Currie N. C. C., Hayes R. D. and Trebits R. N., Chapt 1 from “Millimetre-wave Clutter, Artech House Inc, Norwood MA, 1992.
[6] Polychronopoulas A., Amditas A., Floudas N. and Lind H., Integrated object and road border tracking using 77 GHz automotive radars, IEE Proc.-Radar Sonar Navig., 151, 375-381, 2004.
[7] Lim K., Pinel S., Davis M., Sutano A., Lee C.,Heo D., Obatoynbo A., Lasker J. Tantzeris E. M. and Tummala R. System on package for wireless communications, IEEE Microwave Magazine, March, 88-99, 2002

21
Collision Avoidance W-Band FMCW Radars in an Altimeter Application
H. J. Hansen, R. Lindop and D. Majstorovic
(DSTO-TR-1939)
AUSTRALIA DEFENCE ORGANISATION No. of copies
Task Sponsor, DGNAVSYS 1 printed
S&T Program Chief Defence Scientist FAS Science Policy AS Science Corporate Management Director General Science Policy Development
1 1 1 1
Counsellor Defence Science, London Doc Data Sheet Counsellor Defence Science, Washington Doc Data Sheet Scientific Adviser to MRDC, Thailand Doc Data Sheet Scientific Adviser Joint 1 Navy Scientific Adviser 1 Scientific Adviser – Army 1 AirForce Scientific Adviser 1 Scientific Adviser to the DMO 1
Chief of EWRD Doc Data Sht & Dist List Research Leader Maritime EW Doc Data Sht & Dist List Head RFT, EWRD 1 printed H. J. Hansen, EWRD 1 printed R. Lindop, EWRD 1 printed D. Majstorovic, EWRD 1 printed EWSTIS 1
DSTO Library and Archives
Library Edinburgh 2 printed Defence Archives 1 printed
Capability Development Group
Director General Maritime Development Doc Data Sheet Director General Integrated Capability Development 1 Director General Capability and Plans Doc Data Sheet Assistant Secretary Investment Analysis Doc Data Sheet Director Capability Plans and Programming Doc Data Sheet Director General Australian Defence Simulation Office Doc Data Sheet
DSTO-TR-1939
22
Chief Information Officer Group
Director General Australian Defence Simulation Office Doc Data Sheet Director General Information Policy and Plans Doc Data Sheet AS Information Strategy and Futures Doc Data Sheet AS Information Architecture and Management Doc Data Sheet Director General Information Services Doc Data Sheet
Strategy Group
Director General Military Strategy Doc Data Sheet Assistant Secretary Strategic Policy Doc Data Sheet Assistant Secretary Governance and Counter-Proliferation Doc Data Sheet
Navy
Maritime Operational Analysis Centre, Building 89/90 Garden Island Sydney NSW
Deputy Director (Operations) Deputy Director (Analysis)
Doc Data Sht & Dist List
Director General Navy Capability, Performance and Plans, Navy Headquarters
Doc Data Sheet
Director General Navy Strategic Policy and Futures, Navy Headquarters
Doc Data Sheet
Air Force SO (Science) - Headquarters Air Combat Group, RAAF Base,
Williamtown NSW 2314 Doc Data Sht & Exec Summ
Army ABCA National Standardisation Officer
Land Warfare Development Sector, Puckapunyal Doc Data Sheet
SO (Science) - Land Headquarters (LHQ), Victoria Barracks NSW Doc Data Sht & Exec Summ SO (Science), Deployable Joint Force Headquarters (DJFHQ) (L), Enoggera QLD
Doc Data Sheet
Joint Operations Command Director General Joint Operations Doc Data Sheet Chief of Staff Headquarters Joint Operations Command Doc Data Sheet Commandant ADF Warfare Centre Doc Data Sheet Director General Strategic Logistics Doc Data Sheet COS Australian Defence College Doc Data Sheet
Intelligence and Security Group AS Concepts, Capability and Resources 1 DGSTA , DIO 1 Manager, Information Centre, Defence Intelligence Organisation 1 Assistant Secretary Capability and Systems Doc Data Sheet

DSTO-TR-1939
23
Defence Materiel Organisation Deputy CEO Doc Data Sheet Head Aerospace Systems Division Doc Data Sheet Head Maritime Systems Division Doc Data Sheet Head Electronic and Weapon Systems Division Doc Data Sheet Program Manager Air Warfare Destroyer Doc Data Sheet
Defence Libraries Library Manager, DLS-Canberra Doc Data Sheet
OTHER ORGANISATIONS National Library of Australia 1 NASA (Canberra) 1 Library of New South Wales 1 State Library of South Australia 1
UNIVERSITIES AND COLLEGES
Australian Defence Force Academy Library Head of Aerospace and Mechanical Engineering
1 1
Serials Section (M list), Deakin University Library, Geelong, VIC 1 Hargrave Library, Monash University Doc Data Sheet Librarian, Flinders University 1
OUTSIDE AUSTRALIA
INTERNATIONAL DEFENCE INFORMATION CENTRES
US Defense Technical Information Center 1 UK Dstl Knowledge Services 1 Canada Defence Research Directorate R&D Knowledge & Information Management (DRDKIM)
1
NZ Defence Information Centre 1
ABSTRACTING AND INFORMATION ORGANISATIONS Library, Chemical Abstracts Reference Service 1 Engineering Societies Library, US 1 Materials Information, Cambridge Scientific Abstracts, US 1 Documents Librarian, The Center for Research Libraries, US 1

DSTO-TR-1939
24
INFORMATION EXCHANGE AGREEMENT PARTNERS
National Aerospace Laboratory, Japan 1 National Aerospace Laboratory, Netherlands 1
SPARES
5 printed
Total number of copies: 45 Printed: 12 PDF: 34
DSTO-TR-1939
Page classification: UNCLASSIFIED
DEFENCE SCIENCE AND TECHNOLOGY ORGANISATION
DOCUMENT CONTROL DATA 1. PRIVACY MARKING/CAVEAT (OF DOCUMENT)
2. TITLE Collision Avoidance W-Band FMCW Radars in an Altimeter Application
3. SECURITY CLASSIFICATION (FOR UNCLASSIFIED REPORTS THAT ARE LIMITED RELEASE USE (L) NEXT TO DOCUMENT CLASSIFICATION)
Document (U) Title (U) Abstract (U)
4. AUTHOR(S) H. J. Hansen, R. Lindop and D. Majstorovic
5. CORPORATE AUTHOR Defence Science and Technology Organisation PO Box 1500 Edinburgh SA 5111
6a. DSTO NUMBER DSTO-TR-1939
6b. AR NUMBER AR-013-786
6c. TYPE OF REPORT Technical Report
7. DOCUMENT DATE August 2006
8. FILE NUMBER 20005/1076513
9. TASK NUMBER NAV 02/200
10. TASK SPONSOR DGNAVSYS
11. NO. OF PAGES 24
12. NO. OF REFERENCES 5
13. URL on the World Wide Web http://www.dsto.defence.gov.au/corporate/reports/DSTO-TR-1939.pdf
14. RELEASE AUTHORITY Chief, Electronic Warfare and Radar Division
15. SECONDARY RELEASE STATEMENT OF THIS DOCUMENT Approved for Public Release OVERSEAS ENQUIRIES OUTSIDE STATED LIMITATIONS SHOULD BE REFERRED TO DOCUMENT EXCHANGE, PO BOX 1500, EDINBURGH, SA 5111, AUSTRALIA 16. DELIBERATE ANNOUNCEMENT No Limitations 17. CASUAL ANNOUNCEMENT Yes 18. DEFTEST DESCRIPTORS Unmanned aerial vehicles Collison avoidance Altimeters Commercial equipment 19. ABSTRACT The frequency modulated continuous wave (FMCW) radar principle has been used in aircraft radio altimeters to measure height above the surface of the Earth. This paper describes the performance of a typical commercial-off-the-shelf 77 GHz automobile collision avoidance radar that is been adapted for an Unmanned Aerial Vehicle (UAV) altimeter application. A laptop-based, bench-top assembly is described.
Page classification: UNCLASSIFIED