collusive alliances and intercontinental competition hubert horan airneth/european aviation club den...
TRANSCRIPT

Collusive Alliances and
Intercontinental Competition
Hubert HoranAirneth/European Aviation Club
Den Haag 8 December 2011Brussels 9 December 2011

Horan Airline Transactions Forum 1 March 2011 Page 2
My perspective on consolidation
Developed original NW/KL alliance network Also managed from European (SR/SN) side Shut down multiple unprofitable alliances
Consolidation via Alliance Antitrust ImmunityConsolidation via Alliance Antitrust Immunity
Direct experience with economic plans, results
Direct experience with true Cross-Border mergers Congressional and DOT testimony
recent Transportation Law Journal article
Consolidation via MergerConsolidation via Merger
Active involvement with current consolidationActive involvement with current consolidation
Horan Airline Transactions Forum 1 March 2011 Page 3
Counter-revolution against liberal international airline competition
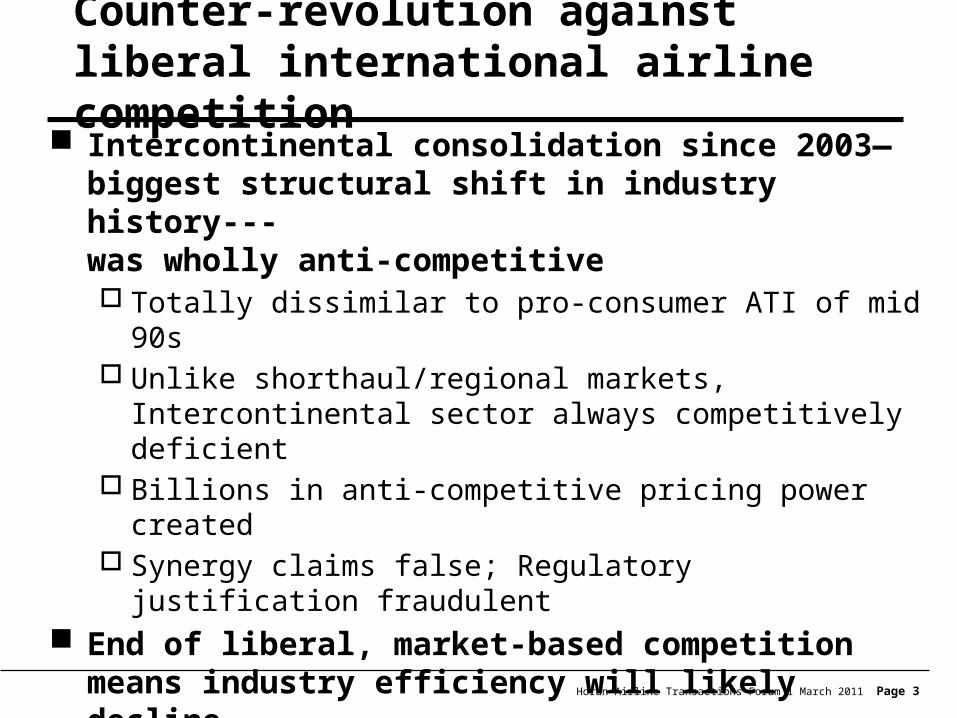
Intercontinental consolidation since 2003—biggest structural shift in industry history---was wholly anti-competitive Totally dissimilar to pro-consumer ATI of mid 90s Unlike shorthaul/regional markets, Intercontinental
sector always competitively deficient Billions in anti-competitive pricing power created Synergy claims false; Regulatory justification
fraudulent End of liberal, market-based competition
means industry efficiency will likely decline Legal protections gone; Cartelization spreading
globally Growing threat of cross-border regulatory arbitrage

Horan Airline Transactions Forum 1 March 2011 Page 4
Issue is role of alliances in consolidation, (not alliances per se)
Alliances
And Global
Competition
Alliances
And Global
Competition
Collusive Alliances(with antitrust immunity—same competitive impact as merger)
Not “Branded” Alliances(no one objects to Star Alliance frequent flyer reciprocity, lounge sharing)
Intercontinental(longhaul)markets—55% of global revenue—exclusive focus of consolidation movement
Not regional/ shorthaul markets—45% of global revenue—no calls for consolidation
Alliances driving high concentration and Cartelizationindustry structure impact
Not original 1990s alliance interline codesharing links
Horan Airline Transactions Forum 1 March 2011 Page 5
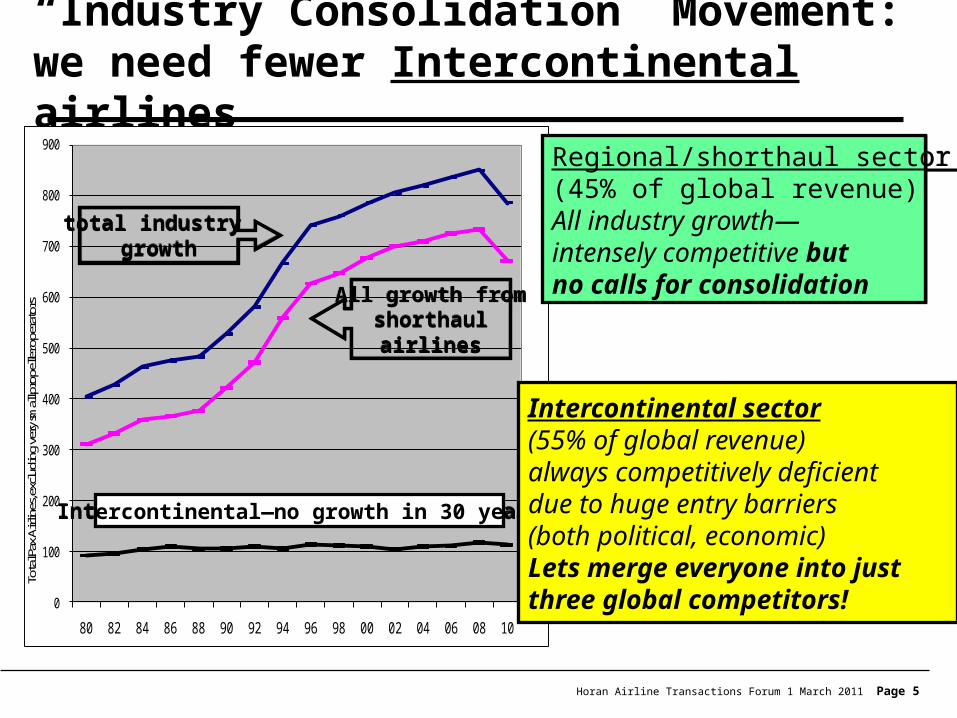
“Industry Consolidation” Movement: we need fewer Intercontinental airlines
0
100
200
300
400
500
600
700
800
900
80 82 84 86 88 90 92 94 96 98 00 02 04 06 08 10
Tota
l Pax
Airl
ines
, exc
ludi
ng ve
ry sm
all p
rope
ller o
pera
tors
total industry growth
total industry growth
Intercontinental—no growth in 30 yearsIntercontinental—no growth in 30 years
All growth fromshorthaulairlines
All growth fromshorthaulairlines
Regional/shorthaul sector (45% of global revenue)All industry growth—intensely competitive butno calls for consolidation
Regional/shorthaul sector (45% of global revenue)All industry growth—intensely competitive butno calls for consolidation
Intercontinental sector(55% of global revenue)always competitively deficientdue to huge entry barriers(both political, economic)Lets merge everyone into just three global competitors!
Intercontinental sector(55% of global revenue)always competitively deficientdue to huge entry barriers(both political, economic)Lets merge everyone into just three global competitors!

Horan Airline Transactions Forum 1 March 2011 Page 6
IC consolidation strictly North Atlantic; First (mid 90s) phase was pro-consumer Original mid-90s ATI did create Consumer BenefitsOriginal mid-90s ATI did create Consumer Benefits
Thousands of markets got online service, discount fares for the first time
AMSZRHAMSZRH
DTWATLDTWATL
original alliance benefits KL-NW (92) and SR-DL (95):
fully exhausted by 1999
original alliance benefits KL-NW (92) and SR-DL (95):
fully exhausted by 1999
Original Collusive Alliances—still robust competitionOriginal Collusive Alliances—still robust competition
Alliance connections totally displaced traditional interline connections
Consumer benefits only on North Atlantic markets; not pursued elsewhere
1991 1993 1995 1997 1999 2001Concentration-total North Atlantic market (55 million annual pax)
top 3 share 35% 42% 42% 45% 47% 47%number of US-EU competitors with minimum departure share of 2%
15 15 13 13 11 11
Horan Airline Transactions Forum 1 March 2011 Page 7
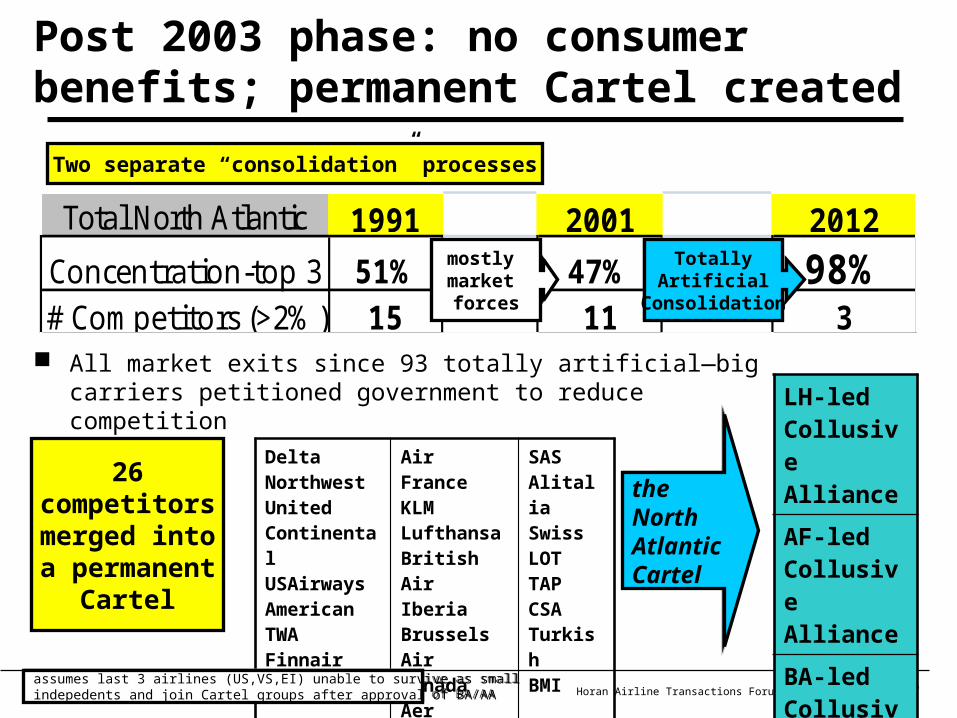
Post 2003 phase: no consumer benefits; permanent Cartel created
DeltaNorthwestUnitedContinentalUSAirwaysAmericanTWAFinnairAustrian
Air FranceKLMLufthansaBritish AirIberiaBrusselsAir CanadaAer Lingus Virgin
SASAlitaliaSwissLOTTAPCSATurkishBMI
LH-ledCollusive Alliance
AF-led Collusive Alliance
BA-ledCollusive Alliance
26competitorsmerged intoa permanent
Cartel
26competitorsmerged intoa permanent
Cartel
the NorthAtlanticCartel
the NorthAtlanticCartel
Total North Atlantic 1991 2001 2012
Concentration-top 3 51% 47% 98%# Competitors (>2%) 15 11 3
TotallyArtificial
Consolidation
TotallyArtificial
Consolidation
mostly market forces
mostly market forces
assumes last 3 airlines (US,VS,EI) unable to survive as small indepedents and join Cartel groups after approval of BA/AAassumes last 3 airlines (US,VS,EI) unable to survive as small indepedents and join Cartel groups after approval of BA/AA
Two separate “consolidation” processesTwo separate “consolidation” processes
All market exits since 93 totally artificial—big carriers petitioned government to reduce competition
Horan Airline Transactions Forum 1 March 2011 Page 8
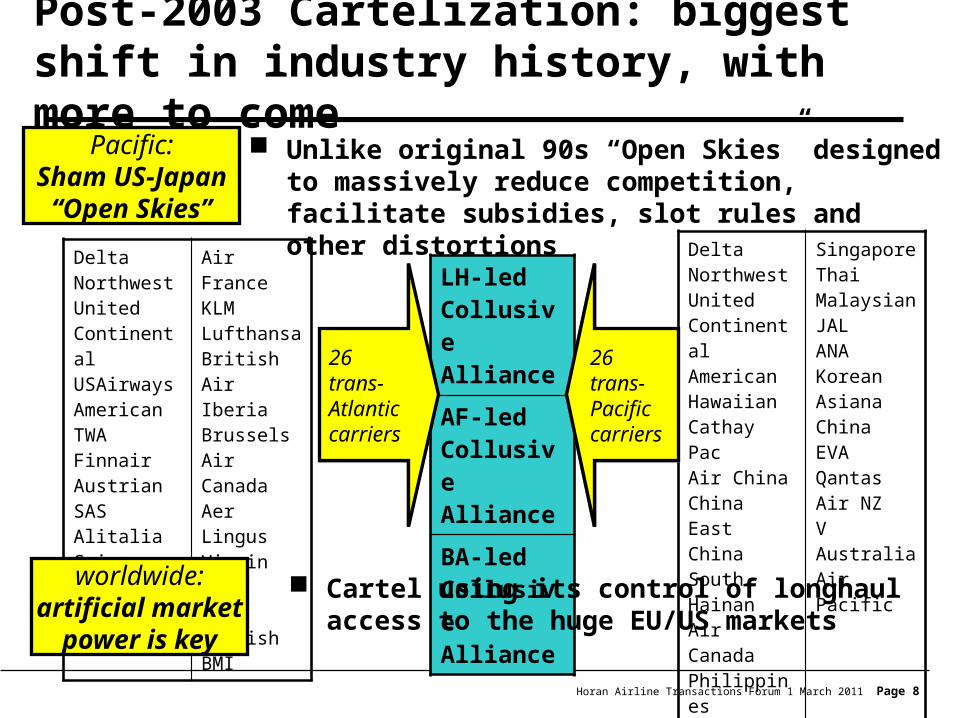
Post-2003 Cartelization: biggest shift in industry history, with more to come
DeltaNorthwestUnitedContinentalUSAirwaysAmericanTWAFinnairAustrianSASAlitaliaSwissLOT
Air FranceKLMLufthansaBritish AirIberiaBrusselsAir CanadaAer Lingus VirginTAPCSATurkishBMI
LH-ledCollusive Alliance
AF-led Collusive Alliance
BA-ledCollusive Alliance
26trans-Atlanticcarriers
26trans-Atlanticcarriers
DeltaNorthwestUnitedContinentalAmericanHawaiianCathay PacAir ChinaChina EastChina SouthHainanAir CanadaPhilippines
SingaporeThaiMalaysianJALANAKoreanAsianaChinaEVAQantasAir NZV AustraliaAir Pacific
26trans-Pacificcarriers
26trans-Pacificcarriers
Pacific:Sham US-Japan
“Open Skies”
Pacific:Sham US-Japan
“Open Skies”
Unlike original 90s “Open Skies” designed to massively reduce competition, facilitate subsidies, slot rules and other distortions
Cartel using its control of longhaul access to the huge EU/US markets
worldwide:artificial market
power is key
worldwide:artificial market
power is key

Horan Airline Transactions Forum 1 March 2011 Page 9
BUT TRULY LIBERAL CONDITIONS NEVER
ESTABLISHED IN INTERCONTINENTAL MARKETS
Pricing/market entry freedom
Access to capital markets
No artificial competitive barriers
Transparent financial reporting
Open corporate control market
Strong antitrust rules, enforcement
Efficient bankruptcy process
No political barriers to exit—no carriers “Too Big To Fail”
Objective: Maximum consumer/efficiency gains economy-wide (not interests of specific companies/employees)
Intercon: conditions to let the market decide “how many airlines” don’t exist
LIBERAL COMPETITIVE CONDITIONS CAREFULLY
ENGINEERED IN MOST DOMESTIC/SHORTHAUL
MARKETS
Pricing/market entry freedom
Access to capital markets
No artificial competitive barriers
Transparent financial reporting
Open corporate control market
Strong antitrust rules, enforcement
Efficient bankruptcy process
No political barriers to exit—no carriers “Too Big To Fail”
Objective: Maximum consumer/efficiency gains economy-wide (not interests of specific companies/employees)
??
Consumers, investors decide“how many airlines”
Consumers, investors decide“how many airlines”
Governments, entrenched incumbentsdecide “how many airlines”
Governments, entrenched incumbentsdecide “how many airlines”

Horan Airline Transactions Forum 1 March 2011 Page 10
Claims of big “scope/scale synergies” from consolidation are false
82—CO/TI
86—TW/OZ
86—NW/RC
87—BA/BR
89—AF/UT/IT
79—PA/NA 88—CO/EA
85—PE/FL 88—US/PI
86—AA/OC 98—SR/SN
87—DL/WA 98—KL/AZ
87—CO/PE 00—AA/TW
87—US/PS 00—UA/US
Hub City Synergybut all 20 years ago
Hub City Synergybut all 20 years ago
”Scope+Scale Synergy” MergersAll failed—few synergies, huge costs
”Scope+Scale Synergy” MergersAll failed—few synergies, huge costs
Also some successesin bankruptcy cases
(HP/US, LH/LX)
Also some successesin bankruptcy cases
(HP/US, LH/LX) Recent mergers (KL-AF, DL-NW, UA-CO) claiminghuge efficiencies not found in any previous merger
--and provided no evidence to support merger claims
Recent mergers (KL-AF, DL-NW, UA-CO) claiminghuge efficiencies not found in any previous merger
--and provided no evidence to support merger claims

Horan Airline Transactions Forum 1 March 2011 Page 11
Post-2003 Consolidation has createdhuge anti-competitive market power
Top 3 Concentration 03->09total Continent 67%-> 98%total No.Atlantic 54%-> 92%
Top 3 Concentration 03->09total Continent 67%-> 98%total No.Atlantic 54%-> 92%
80
90
100
110
120
130
140
150
160
1993 1994 1995 1996 1997 1998 1999 2000 2001 2002 2003 2004 2005 2006 2007 2008
Form
41
Pax
Reve
nue/
Empl
anem
ent
--in
dex
1993
=100 North Atlantic Passenger Fares Have Risen 3X Faster Than US
Domestic Fares since Extreme Consolidation began in 2003
ATLANTIC rev/pax
DOMESTIC rev/pax
Total North Atlantic 1991 2001 2010
Concentration-top 3 51% 47% 98%# Competitors (>2%) 15 11 3

Horan Airline Transactions Forum 1 March 2011 Page 12
Biggest shift in industry history in less than 10 years----three key drivers
#1-EU shift from liberal to “managed” competitionpurely anti-competitive 2003 KL/AF merger
#1-EU shift from liberal to “managed” competitionpurely anti-competitive 2003 KL/AF merger
#2—staged sequence of follow-on ATI/mergers;DOT willingness to disobey law, use fraudulent evidence
#2—staged sequence of follow-on ATI/mergers;DOT willingness to disobey law, use fraudulent evidence
Brussels proactively driving consolidation Rig markets to favor “National Champions” (LH/AF),
weaken LCCs; subsidies for weak (AZ, OS, OA, LX) totally different merger rules for AF, FR US Open Skies delayed 5 years—wanted more mergers
KL/AF: no synergies/consumer benefits; ends EU longhaul competition, establishes Cartel; forces USA consolidation
#3—huge “Consolidation is Inevitable” PR campaign#3—huge “Consolidation is Inevitable” PR campaign

Horan Airline Transactions Forum 1 March 2011 Page 13
All ATI Consumer Benefits findings based on willful DOT regulatory fraud
Falsely claims that physical barriers force interline carriers to always set fares $200-300 higher than online/ATI connecting fares
Falsely claims that ATI always and automatically cut connecting fares $200-300 regardless of market/competitive conditions “Double Marginalization” violates laws of supply and demand
False “rule” that reducing competition always reduces prices designed to nullify both the law and rules of evidence Every ATI application automatically justified; no need for case-specific
evidence False claims fabricated by one UAL consultant in one paper;
DOT claims “rule” justified by multiple, independent researchers based on regression of 1990s data that is totally unrelated to the pricing
claim No evidence of any pricing benefits from any ATI grant since
90s No actual consumer pricing evidence submitted in any recent ATI case DOT uses fraudulent “rule” as basis for rejecting evidence of higher prices
“Double Marginalization”—ATI automatically reduces fares 15-25%--sole basis of $90 million annual Oneworld consumer benefits claim
“Double Marginalization”—ATI automatically reduces fares 15-25%--sole basis of $90 million annual Oneworld consumer benefits claim

Horan Airline Transactions Forum 1 March 2011 Page 14
All recent Star/Skyteam/Oneworld ATI depended on DOT’s disregard for the law DOT disobeyed Clayton Act requirement for market power test
No ATI decision had any of the pricing data, entry barrier or market contestability evidence needed to show ATI would not create market power
DOT disobeyed legal requirement that ATI cannot be granted without proof of “public benefits” Private benefits to applicant (i.e. consolidation benefits Star Alliance) used by
DOT as demonstration of “public benefits” DOT accepted “improved frequent flyer program” claims as proof of “public
benefits” even though frequent flyer benefits decreased DOT public benefits “findings” not based on any objective data or analysis;
just “copy/pasted” applicants unsubstantiated claims Newest DOT regulatory fraud—”metal neutrality” designed to
extend collusion to large overlapping nonstop O&Ds Previous ATI cases had carve-outs, given pricing risks in LHR-ORD type
markets DOT established new “rule” based on false claim that “metal neutral”
alliances cannot function if any routes excluded Rule based on paper by same consultant who fabricated “Double
Marginalization”
Horan Airline Transactions Forum 1 March 2011 Page 15
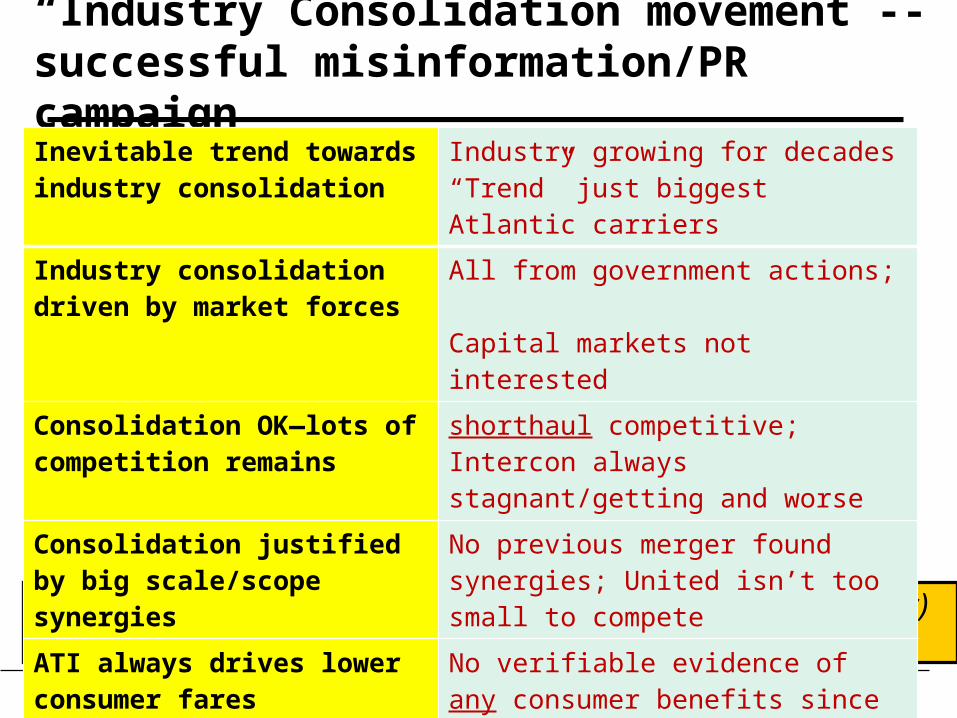
“Industry Consolidation movement”-- successful misinformation/PR campaign
There has been no independent (regulatory, media, academic)scrutiny of these “Industry Consolidation” claims
There has been no independent (regulatory, media, academic)scrutiny of these “Industry Consolidation” claims
Inevitable trend towards industry consolidation
Industry growing for decades“Trend” just biggest Atlantic carriers
Industry consolidation driven by market forces
All from government actions; Capital markets not interested
Consolidation OK—lots of competition remains
shorthaul competitive; Intercon always stagnant/getting and worse
Consolidation justified by big scale/scope synergies
No previous merger found synergies; United isn’t too small to compete
ATI always drives lower consumer fares
No verifiable evidence of any consumer benefits since 1999
Alliances create FF and other consumer benefits
Branded alliance benefits falsely attributed to Collusive Alliances
Horan Airline Transactions Forum 1 March 2011 Page 16
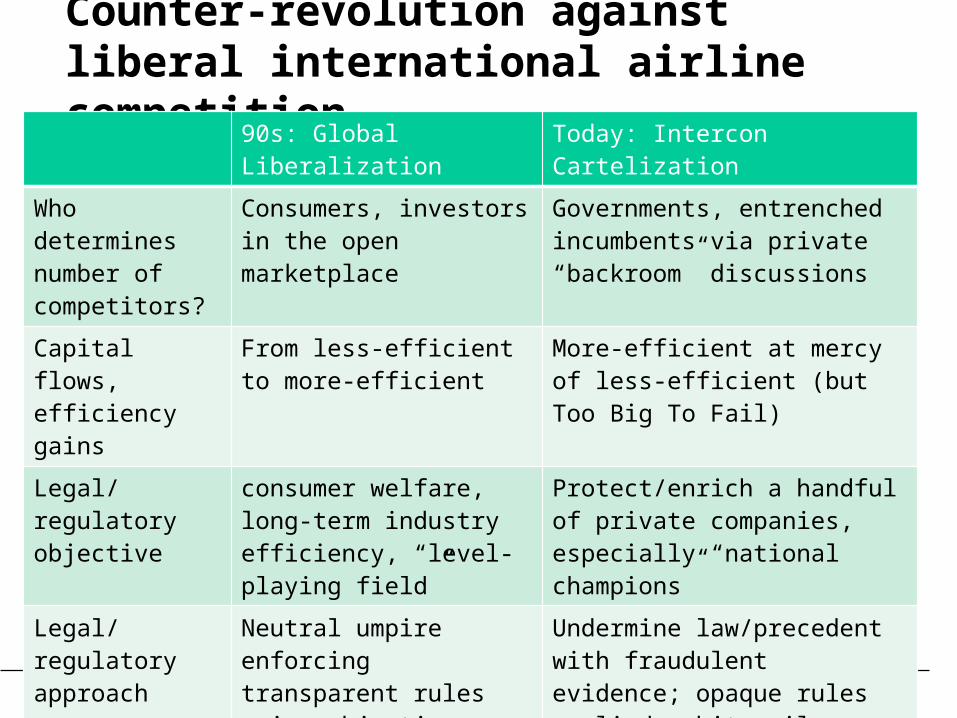
Counter-revolution against liberal international airline competition90s: Global
LiberalizationToday: Intercon Cartelization
Who determines number of competitors?
Consumers, investors in the open marketplace
Governments, entrenched incumbents via private “backroom” discussions
Capital flows, efficiency gains
From less-efficient to more-efficient
More-efficient at mercy of less-efficient (but Too Big To Fail)
Legal/regulatory objective
consumer welfare, long-term industry efficiency, “level-playing field”
Protect/enrich a handful of private companies, especially “national champions”
Legal/regulatory approach
Neutral umpire enforcing transparent rules using objective data/evidence
Undermine law/precedent with fraudulent evidence; opaque rules applied arbitrarily
Role of “Open Skies”
Facilitate new entry, reduce cross-border and artificial barriers
Facilitate reduced competition and regulatory arbitrage; increased protection of weak;
Driver of airline success
Efficiency, service quality, network strength
Ability to capture regulators; control of alliance access

Horan Airline Transactions Forum 1 March 2011 Page 17
Looking forward given tomorrow’s highly illiberal environment
reducing trans-Pacific from 26 to 3 competitors BA acquiring BMI; only 4 carriers for entire USA crude Canadian/German anti-EK protectionism
Competition weakens further—3 alliance competition unsustainable
LHR-based Oneworld uncompetitive with continental duopoly squeeze of small alliance members and domestic LCCs
UAL IAD-MAD precedent; Qantas offshoring; Tiger safety lapses
Continuing, artificial consolidation--many moves unthinkable 10 years ago
Continuing, artificial consolidation--many moves unthinkable 10 years ago
Negative outlook for markets and industry--stagnant competition means declining efficiency
Negative outlook for markets and industry--stagnant competition means declining efficiency
growth of cross-border regulatory arbitragethreatens financial/consumer/safety protections
growth of cross-border regulatory arbitragethreatens financial/consumer/safety protections

Horan Airline Transactions Forum 1 March 2011 Page 18
Horan Airline Transactions Forum 1 March 2011 Page 19

Horan Airline Transactions Forum 1 March 2011 Page 20
Current Branded/Collusive Alliance models evolved 15+ years ago
“Branded” Alliances 90-Global Excellence
97-Star98-Oneworld00-Skyteam
“Branded” Alliances 90-Global Excellence
97-Star98-Oneworld00-Skyteam
Collusive Alliances on the North Atlantic
92-KL-led alliance(NW)95-SR-led alliance (DL)97-LH-led alliance (UA)00-AF led alliance (DL)09-BA led alliance (AA)
Collusive Alliances on the North Atlantic
92-KL-led alliance(NW)95-SR-led alliance (DL)97-LH-led alliance (UA)00-AF led alliance (DL)09-BA led alliance (AA)
Alliances categories pre-1990Alliances categories pre-1990
Frequent Flyer partnersforeign airlines join United’s Mileage Plus program or American’s Aadvantage program
No anti-competitive risks
Narrow route-extention codesharingforeign airlines codeshare on US domestic flights, providing connecting service to points it would (could) not otherwise serve
No anti-competitive risks
Route-revenue pooling with codesharingPan Am/Saudia pool revenues, profits from each other’s flights in a specific market
Obvious risksvery rare in US markets since 70s; but still common outside US
new post-1990 Alliancesnew post-1990 Alliances
Horan Airline Transactions Forum 1 March 2011 Page 21
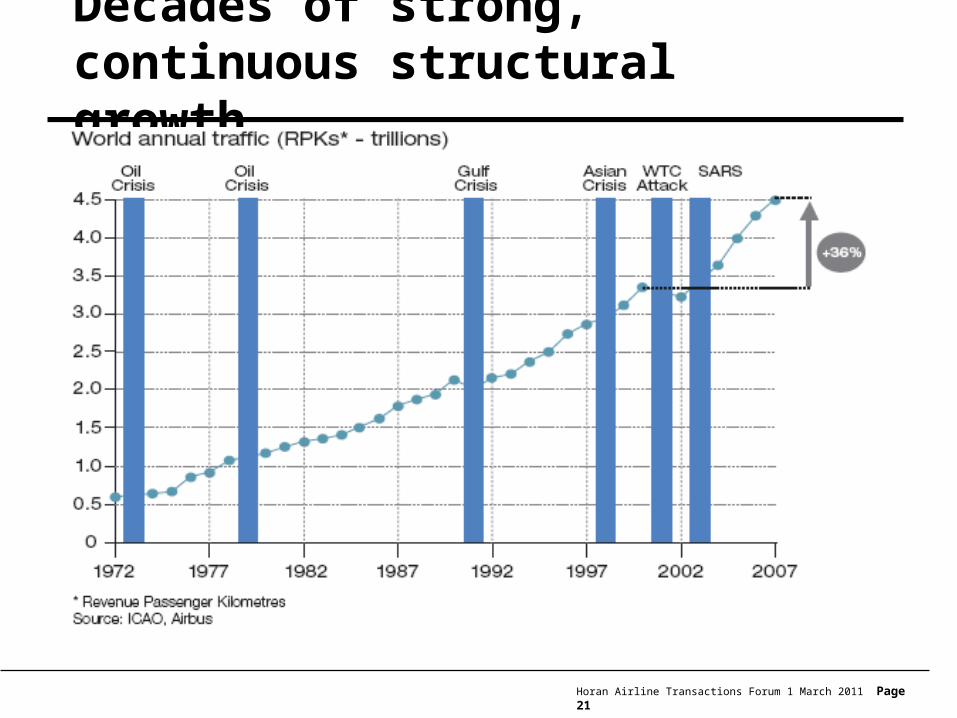
Decades of strong, continuous structural growth

Horan Airline Transactions Forum 1 March 2011 Page 22
Driving structural growth>dynamic competitive “churn”
Competitive “churn”-- active entry and exit—reallocation of capital from weak to strong
Churn (exit) since 1980:77%--USA56%--W. Europe/rest of Western Hemisp.40%--rest of world
Churn (exit) since 1980:77%--USA56%--W. Europe/rest of Western Hemisp.40%--rest of world
Innovation/productivity driven by both serious threat of failure/entry and real opportunity to grow
If weak carriers don’t exit, strong incumbents, entrants can’t grow

Horan Airline Transactions Forum 1 March 2011 Page 23
Alliance Public Benefits: 30% of North Atlantic seriously underserved in 1990
JFKJFK LHRLHR
CDGFRACDGFRA
ORDATLORDATL
Nonstop Big Gateway New York to top 20 EU cities London to top 20 US cities
One-stop Big Gateway cities to Interior citiestop 5-6 EU cities to hundreds of US cities (via US hubs)top 5-6 US cities to hundreds of EU cities (via EU hubs)
USA Interior cities to EU Interior cities (i.e. St. Louis-Brussels, Milwaukee-Munich)
no online or coordinated schedules; passengers forced to change airlines and terminals; only highest
fares availableprevious solution (PA/TW hubs in Europe) had
failed
70% of market had good online schedules, full range of discount fares70% of market had good online schedules, full range of discount fares
but 30% of market had poor service and very few discount faresbut 30% of market had poor service and very few discount fares
Horan Airline Transactions Forum 1 March 2011 Page 24
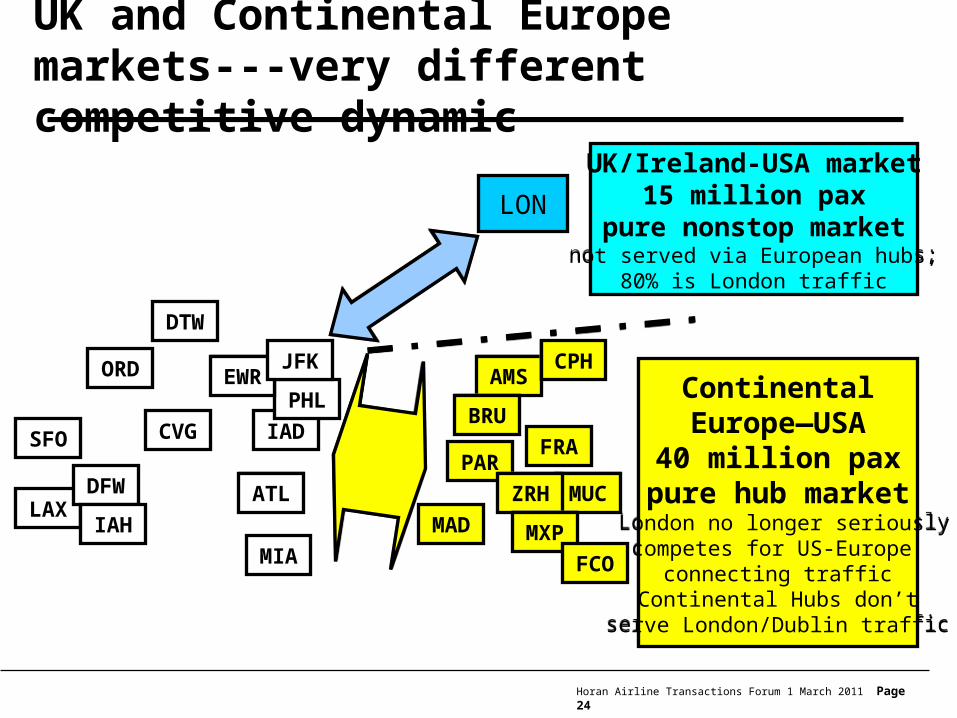
UK and Continental Europe markets---very different competitive dynamic
UK/Ireland-USA market15 million pax
pure nonstop marketnot served via European hubs;
80% is London traffic
UK/Ireland-USA market15 million pax
pure nonstop marketnot served via European hubs;
80% is London traffic
ContinentalEurope—USA40 million pax
pure hub market London no longer seriously
competes for US-Europe connecting traffic
Continental Hubs don’tserve London/Dublin traffic
ContinentalEurope—USA40 million pax
pure hub market London no longer seriously
competes for US-Europe connecting traffic
Continental Hubs don’tserve London/Dublin traffic
AMSAMS
PARPAR
LONLON
SFOSFO
LAXLAXDFWDFW
IAHIAH
CVGCVG
ORDORD
DTWDTW
MIAMIA
ATLATL
IADIAD
PHLPHLEWREWR
JFKJFK
BRUBRU
MUCMUC
CPHCPH
MADMAD
FRAFRA
ZRHZRH
MXPMXP
FCOFCO

Horan Airline Transactions Forum 1 March 2011 Page 25
Huge risk to consumers with Cartel, 95%+ concentration in place
1995 1997 1999 2001 2003 2005 2007 2009Concentration levels of US-Continental Europe market (40 million annual pax)
top 3 share 47% 55% 56% 61% 67% 85% 88% 97%Concentration levels of total North Atlantic market (55 million annual pax)
top 3 share 42% 45% 47% 47% 54% 68% 66% 97%number of total North Atlantic competitors with minimum departure share of 2%
13 13 11 11 9 7 6 3
RapidlyIncreasing
Concentrationafter 2004
RapidlyIncreasing
Concentrationafter 2004
PermanentCartelwith huge
entry barriers
PermanentCartelwith huge
entry barriers
Healthy, Profitable Competition,
even with Alliances
Healthy, Profitable Competition,
even with Alliances
SeriousSerious HUGEHUGEvery lowvery low
concentrationconcentration
Risks toConsumers
Risks toConsumers

Horan Airline Transactions Forum 1 March 2011 Page 26
North Atlantic competitors,concentration and departure shares 1991-200819 91 19 93 19 95 19 97 19 99 20 01 20 03 20 05 20 06 20 07 20 08
top2 23.8% top2 31.1% top2 29.0% top2 31.5% top2 34.6% top2 36.1% top2 41.0% top2 55.6% top2 54.1% top2 54.2% top2 55.5%top 3 34.6% top 3 42.3% top 3 42.4% top 3 45.0% top 3 47.5% top 3 47.3% top 3 54.0% top 3 67.9% top 3 66.2% top 3 65.8% top 3 67.2%top4 44.0% top4 50.2% top4 51.3% top4 53.2% top4 59.1% top4 58.0% top4 65.2% top4 79.4% top4 77.6% top4 76.5% top4 78.1%CA% 0.0% CA% 0.0% CA% 7.3% CA% 25.6% CA% 42.0% CA% 43.6% CA% 48.6% CA% 55.6% CA% 54.1% CA% 54.2% CA% 55.5%number of competitors with minimum departure share of:0.5% 24 0.5% 25 0.5% 22 0.5% 19 0.5% 19 0.5% 18 0.5% 14 0.5% 9 0.5% 9 0.5% 9 0.5% 92% 15 2% 15 2% 13 2% 13 2% 11 2% 11 2% 9 2% 7 2% 6 2% 6 2% 65% 6 5% 6 5% 7 5% 6 5% 6 5% 7 5% 6 5% 5 5% 5 5% 5 5% 5
19 91 19 93 19 95 19 97 19 99 20 01 20 03 20 05 20 06 20 07 20 081 BA 12.0% DL 16.5% DL 14.5% SR 17.9% SR 17.3% SR 18.1% LH 20.7% AF 28.7% AF 28.4% AF 28.3% AF 28.9% 12 PA 11.8% AA 14.6% AA 14.4% BA 13.5% LH 17.3% LH 18.0% AF 20.3% LH 26.8% LH 25.6% LH 25.9% LH 26.6% 23 TW 10.7% BA 11.2% BA 13.4% AA 13.5% BA 12.9% BA 11.2% BA 12.9% BA 12.3% BA 12.2% BA 11.6% BA 11.7% 34 AA 9.4% UA 7.9% UA 9.0% UA 8.2% AA 11.7% AA 10.8% AA 11.2% AA 11.5% AA 11.4% CO 10.7% CO 10.8% 45 LH 8.7% LH 6.5% KL 7.3% KL 7.7% KL 7.4% KL 7.5% KL 7.6% CO 8.4% CO 10.1% AA 10.4% AA 10.5% 56 DL 6.4% TW 5.8% LH 5.9% LH 6.1% CO 6.3% CO 6.6% CO 7.2% VS 4.8% VS 4.7% VS 4.9% VS 5.0% 67 AF 4.9% AF 4.1% TW 5.1% AF 4.4% AF 4.6% AF 5.6% VS 4.6% EI 2.0% EI 2.0% EI 1.8% EI 1.8% 78 KL 4.3% KL 3.9% AF 4.3% CO 3.9% VS 4.3% VS 4.5% US 4.5% IB 1.5% IB 1.3% IB 1.4% IB 1.4% 89 SR 3.5% NW 3.7% VS 3.5% VS 3.9% US 3.3% US 4.2% SR 2.8% SU 0.7% SU 0.6% SU 0.5% SU 0.6% 9
10 SK 3.4% CO 3.4% CO 3.0% TW 3.6% TW 2.4% AZ 2.6% EI 1.9% TK 0.5% MP 0.5% E0 0.5% E0 0.5% 1011 NW 3.3% SR 2.7% AZ 2.8% AZ 2.9% AZ 2.0% EI 2.0% IB 1.6% MP 0.4% TK 0.4% TK 0.4% MY 0.4% 1112 UA 2.6% SK 2.5% SR 2.5% US 2.8% EI 1.7% IB 1.6% LO 0.9% AY 0.3% OA 0.3% MY 0.4% GJ 0.3% 1213 AZ 2.4% AZ 2.5% SK 2.0% SK 2.1% IB 1.4% TW 1.2% SU 0.7% OA 0.3% AY 0.3% MP 0.4% OA 0.3% 1314 CO 2.2% VS 2.5% SN 1.7% EI 1.7% SU 1.1% LO 0.9% TK 0.5% MA 0.2% MA 0.2% GJ 0.3% AY 0.2% 1415 VS 2.2% US 2.3% EI 1.3% IB 1.2% LO 0.9% OK 0.8% TP 0.4% VV 0.2% E0 0.2% OA 0.3% MA 0.2% 1516 IB 1.8% IB 1.5% IB 1.2% LO 1.1% OK 0.8% SU 0.7% MP 0.4% A7 0.0% MY 0.2% AY 0.2% VV 0.2% 1617 SN 1.7% SN 1.0% US 1.1% SU 1.0% MP 0.8% TK 0.6% AY 0.3% VV 0.2% MA 0.2% Y2 0.2% 1718 US 1.2% EI 0.9% LO 0.8% OK 0.9% TP 0.6% MP 0.6% OA 0.3% A7 0.1% VV 0.2% A0 0.1% 1819 EI 1.1% SU 0.8% SU 0.8% TP 0.5% TK 0.5% TP 0.5% MA 0.2% GJ 0.1% A0 0.1% Y7 0.1% 1920 LO 0.8% LO 0.7% OS 0.8% AY 0.5% AY 0.4% OA 0.4% RO 0.2% Y7 0.1% 2021 TP 0.7% OS 0.7% OK 0.8% TK 0.4% OA 0.3% AY 0.3% VV 0.0% A7 0.1% 2122 SU 0.7% OK 0.7% AY 0.6% AI 0.4% MA 0.3% JK 0.3% A7 0.0% 2223 AY 0.6% TP 0.7% TP 0.5% OA 0.4% H2 0.3% MA 0.3% 2324 JU 0.5% AY 0.6% OA 0.4% MA 0.3% RO 0.2% UX 0.2% KL indicates Collusive Alliance group 2425 OA 0.4% OA 0.5% MA 0.4% UX 0.2% JK 0.2% RO 0.1% CA% total Collusive Alliance departure share 2526 OS 0.4% TK 0.4% TK 0.3% RO 0.2% FF 0.2% H2 0.0% USDOT Form 41 T100 data 2627 OK 0.4% NG 0.2% RO 0.3% FF 0.2% UX 0.1% for 12 months ending 2nd Q of year shown 27

Horan Airline Transactions Forum 1 March 2011 Page 27
Liberal competition drove decades of profitable industry growth
LIBERAL AIRLINE COMPETITION—ECONOMIC REQUIREMENTS
Pricing/market entry freedom Transparent financial reporting
Access to capital markets Strong antitrust rules, enforcement
No artificial competitive barriers
Efficient bankruptcy process
Open corporate control market
No political barriers to exitLIBERAL AIRLINE COMPETITION—POLITICAL
REQUIREMENTS
Let Consumers/Capital Markets pick winners (level-playing field)
Focus on Maximum Gains Economy-Wide (not favored companies)
Objectives of Airline Deregulation and US Open Skies treatiesObjectives of Airline Deregulation and US Open Skies treatiesConsumers:More serviceat lower fares
Consumers:More serviceat lower faresInnovation/productivity gains
continuously improve industry capital allocation—better airlines prosper/grow
bad airlines shrink/exit market
Innovation/productivity gainscontinuously improve
industry capital allocation—better airlines prosper/grow
bad airlines shrink/exit market
pressure fromLiberal AirlineCompetition
pressure fromLiberal AirlineCompetition
Industry:Profits, capital
for growth
Industry:Profits, capital
for growth

Horan Airline Transactions Forum 1 March 2011 Page 28
Consolidation: recent, artificial, and not driven by market competitiveness In 21 of the 22 cases competition reduced artificially--
petitioning governments for approval to merge or join a collusive alliance
Consolidation used to protect small/weak airlines
competitive exit of
Large/MediumNorth Atlantic
carrierssince 1993
competitive exit of
Large/MediumNorth Atlantic
carrierssince 1993
PA 1993 market forcesNW 1993 artificial joined KL, then AF-led collusive allianceDL 1995 artificial joined SR, then AF-led collusive allianceSN 1995 artificial joined SR-led collusive allianceOS 1995 artificial joined SR, then LH-led collusive allianceUA 1997 artificial joined LH-led collusive allianceSK 1997 artificial joined LH-led collusive allianceBD 2001 artificial joined LH-led collusive allianceTW 2002 artificial acquired by AAAZ 2002 artificial joined AF-led collusive allianceOK 2002 artificial joined AF-led collusive allianceUS 2004 artificial joined LH-led collusive allianceKL 2004 artificial acquired by AFSR-LX 2005 artificial joined LH-led collusive allianceLO 2005 artificial joined LH-led collusive allianceTP 2005 artificial joined LH-led collusive allianceTK 2008 artificial joined LH-led collusive allianceCO 2009 artificial petitioned to join LH-led collusive allianceAA 2009 artificial petitioned to join BA-led collusive allianceVS 2009 artificial considering joining LH-led collusive allianceIB 2009 artificial petitioned to join BA-led collusive allianceAY 2009 artificial petitioned to join BA-led collusive alliance
Horan Airline Transactions Forum 1 March 2011 Page 29
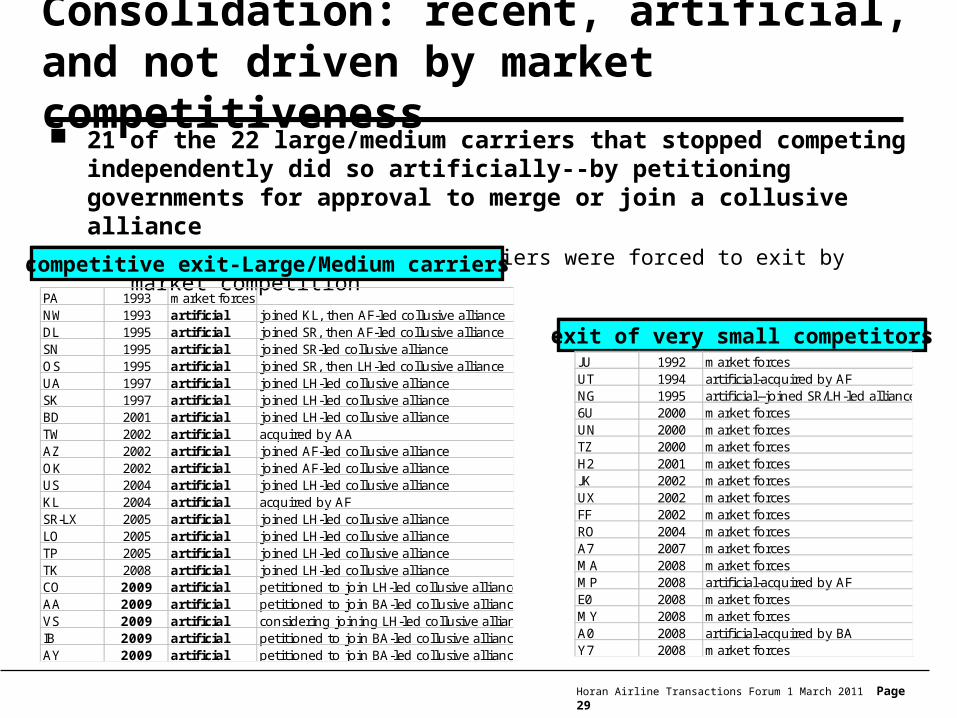
Consolidation: recent, artificial, and not driven by market competitiveness 21 of the 22 large/medium carriers that stopped competing
independently did so artificially--by petitioning governments for approval to merge or join a collusive alliance since 93 only very small carriers were forced to exit by market
competitioncompetitive exit-Large/Medium carrierscompetitive exit-Large/Medium carriers
exit of very small competitorsexit of very small competitors
PA 1993 market forcesNW 1993 artificial joined KL, then AF-led collusive allianceDL 1995 artificial joined SR, then AF-led collusive allianceSN 1995 artificial joined SR-led collusive allianceOS 1995 artificial joined SR, then LH-led collusive allianceUA 1997 artificial joined LH-led collusive allianceSK 1997 artificial joined LH-led collusive allianceBD 2001 artificial joined LH-led collusive allianceTW 2002 artificial acquired by AAAZ 2002 artificial joined AF-led collusive allianceOK 2002 artificial joined AF-led collusive allianceUS 2004 artificial joined LH-led collusive allianceKL 2004 artificial acquired by AFSR-LX 2005 artificial joined LH-led collusive allianceLO 2005 artificial joined LH-led collusive allianceTP 2005 artificial joined LH-led collusive allianceTK 2008 artificial joined LH-led collusive allianceCO 2009 artificial petitioned to join LH-led collusive allianceAA 2009 artificial petitioned to join BA-led collusive allianceVS 2009 artificial considering joining LH-led collusive allianceIB 2009 artificial petitioned to join BA-led collusive allianceAY 2009 artificial petitioned to join BA-led collusive alliance
JU 1992 market forcesUT 1994 artificial-acquired by AFNG 1995 artificial--joined SR/LH-led alliances6U 2000 market forcesUN 2000 market forcesTZ 2000 market forcesH2 2001 market forcesJK 2002 market forcesUX 2002 market forcesFF 2002 market forcesRO 2004 market forcesA7 2007 market forcesMA 2008 market forcesMP 2008 artificial-acquired by AFE0 2008 market forcesMY 2008 market forcesA0 2008 artificial-acquired by BAY7 2008 market forces

Horan Airline Transactions Forum 1 March 2011 Page 30
Almost every merger since deregulation has been a dismal financial failure80: Pan Am/National 1-Post Dereg FAILURE—largely liquidated
82: Texas Intl/Continental
1-Post Dereg FAILURE—quickly bankrupt
85: Southwest/Muse 2-Quasi-BK Profitable—cheap acquisition
85: People Exp/Frontier 4-Synergy/Scope
FAILURE—soon bankrupt
86: TWA/Ozark 1-Post Dereg Profitable—Restructured STL
86: Northwest/Republic 1-Post Dereg Profitable—Restructured DTW/MSP
86: American/Aircal 4-Synergy/Scope
FAILURE—totally liquidated
87: Continental/PE/NY/FL
4-Synergy/Scope
FAILURE—soon bankrupt
87: Delta/Western 4-Synergy/Scope
FAILURE—largely liquidated
87: Continental/Eastern
4-Synergy/Scope
FAILURE—soon bankrupt
88: USAir/PSA 4-Synergy/Scope
FAILURE—largely liquidated
88: USAir/Piedmont 4-Synergy/Scope
FAILURE—soon bankrupt
94: Southwest/Morris 3-Small Acquis Profitable—easy fit with SWA
99: American/Reno 4-Synergy/Scope
FAILURE—largely liquidated
00: American/TWA 4-Synergy/Scope
FAILURE—largely liquidated
00: United/USAir (plan) 4-Synergy/Scope
FAILURE—quickly bankrupt
05: America West/USAir
2-Quasi-BK Jury Out—low asset cost
5 categoriesof mergers:1—Post Deregulation Hub Restructuring2—Bankruptcy-type Asset restructuring3—Small Acquisition easily integrated4—Cost Synergies/ Network Scope5—Anti-Competitive; exploit dominance, entry barriers
5 categoriesof mergers:1—Post Deregulation Hub Restructuring2—Bankruptcy-type Asset restructuring3—Small Acquisition easily integrated4—Cost Synergies/ Network Scope5—Anti-Competitive; exploit dominance, entry barriers

Horan Airline Transactions Forum 1 March 2011 Page 31
Anti-competitive impacts confirmed by preliminary 2010 pricing data
1999 2000 2001 2002 2003 2004 2005 2006 2007 2008 2009 201080
90
100
110
120
130
140
150
160
Artificial Market Power on North Atlantic drove rapid 2010 price recovery not seen in Domestic or Other International markets
DOMESTIC rev/pax
ATLANTIC rev/pax
INTexclATL rev/pax
Form
41 P
ax R
evenue/E
mpla
nem
ent-
-index 1
999=
100
post 2004 market power defied laws of supply and demandDomestic fares +15% because seats only + 1%
Atlantic fares +46% despite seats +45%
post 2004 market power defied laws of supply and demandDomestic fares +15% because seats only + 1%
Atlantic fares +46% despite seats +45%

Horan Airline Transactions Forum 1 March 2011 Page 32
Post-2003 consolidation required gutting all key antitrust tests
Evidence must be significant, market-wide Evidence must be market/case specific and
linked to competitive advantage in these markets
Evidence of comparable benefits in similar cases
Need objective, verifiable evidence to meet testsNeed objective, verifiable evidence to meet tests
Does consolidation increase risks of sustainable anti-competitive market power? Are markets contestable? Entry barriers large?
Does consolidation create significant, market-wide consumer benefits (lower prices/increased output)? Clearly large enough to offset competitive risks?
Two Tests—Central to all Competition LawTwo Tests—Central to all Competition Law

Horan Airline Transactions Forum 1 March 2011 Page 33