colombia: 2011 article iv consultation--staff report ... · staff is of the view that fiscal policy...
TRANSCRIPT
IMF Country Report No. 11/224
Colombia 2011 ARTICLE IV CONSULTATION COVER 2011 Article IV Consultation—Staff Report; Public Information Notice on the Executive Board Discussion; and Statement by the Executive Director for Colombia Under Article IV of the IMF’s Articles of Agreement, the IMF holds bilateral discussions with members, usually every year. In the context of the 2011 Article IV consultation with Colombia, the following documents have been released and are included in this package: The staff report for the 2011 Article IV consultation, prepared by a staff team of the
IMF, following discussions that ended on June 23, 2011, with the officials of Colombia on economic developments and policies. Based on information available at the time of these discussions, the staff report was completed on July 7, 2011. The views expressed in the staff report are those of the staff team and do not necessarily reflect the views of the Executive Board of the IMF.
A Public Information Notice (PIN) summarizing the views of the Executive Board as expressed during its July 20, 2011 discussion of the staff report that concluded the Article IV consultation.
A statement by the Executive Director for Colombia.
The policy of publication of staff reports and other documents allows for the deletion of market-sensitive information.
Copies of this report are available to the public from
International Monetary Fund Publication Services 700 19th Street, N.W. Washington, D.C. 20431
Telephone: (202) 623-7430 Telefax: (202) 623-7201 E-mail: [email protected] Internet: http://www.imf.org
International Monetary Fund Washington, D.C.
July 2011

COLOMBIA STAFF REPORT FOR THE 2011 ARTICLE IV CONSULTATION
KEY ISSUES
Near term policy stance. The economic recovery is well-entrenched, with growth projected
for this year at somewhat above potential. Inflation pressurges are contained, the financial
system is solid, international reserves are strong, the sovereign debt rating has been raised
this year to investment grade by all three ratings agencies, and the FCL appears to have
bolstered market confidence. Monetary policy is moving toward a more neutral position, but
staff is of the view that fiscal policy remains stimulative. With the output gap projected to
close in early 2012 and the balance of risks tilted toward overheating, staff cautioned that the
burden of dampening potential demand pressures in the near term would fall too much on
monetary policy.
Strengthening of the fiscal framework. Colombia’s fiscal institutions are very strong and
will be further strengthened by recently approved fiscal reforms, including a fiscal rule to
support existing fiscal responsibility legislation, inclusion of fiscal sustainability as a
constitutional criterion, and a revamping of the allocation and use of royalty payments that
will generate important savings. Still, staff underscored that revenue collections are relatively
low compared with regional peers and welcomed the authorities’ plans (presently under
discussion) to reduce distortions in the tax system and promote formal sector activity that, in
turn, would increase revenue and, in staff’s view, facilitate compliance with the fiscal rule.
Financial sector oversight. Financial system supervision is very strong and is being
strengthened further through initiatives to bolster cross-border and consolidated
supervision. Assessing capital adequacy under Basel III terms is just beginning, and staff
urged that the timetable for assessing the impact of its requirements be accelerated. An
FSAP update is scheduled for early 2013.
Labor markets. High rates of structural unemployment and poverty and widespread labor
informality constitute longstanding policy challenges.
July 7, 2011

2011 ARTICLE IV REPORT COLOMBIA
2 INTERNATIONAL MONETARY FUND
Approved By Miguel A. Savastano and Lorenzo Giorgianni
Discussions took place in Bogotá during June 13−23. Staff representatives comprised A. Wolfe (Chief), V. Cerra, M. García-Escribano, and C. Faircloth (all WHD), D. Mendoza (MCM), and T. Miyoshi (SPR). Ms. Arbeláez (OED) attended the meetings.
CONTENTS
BACKGROUND ____________________________________________________________________________________ 4
RECENT DEVELOPMENTS _________________________________________________________________________ 5
OUTLOOK _________________________________________________________________________________________ 8
POLICY DISCUSSIONS __________________________________________________________________________ 18
A. Near-Term Policy Stance ______________________________________________________________________ 18
B. Strengthening the Medium-Term Fiscal Framework___________________________________________ 21
C. Monetary, Exchange Rate, and Reserve Management Policies ________________________________ 24
D. Financial Sector Oversight ____________________________________________________________________ 27
E. Improving Labor Market Performance _________________________________________________________ 28
STAFF APPRAISAL ______________________________________________________________________________ 29
TABLES
1. Selected Economic and Financial Indicators __________________________________________________ 32
2. Summary Balance of Payments _______________________________________________________________ 33
3a. Operations of the Central Government ______________________________________________________ 34
3b. Operations of the Central Government ______________________________________________________ 35
4a. Operations of the Combined Public Sector __________________________________________________ 36
4b. Operations of the Combined Public Sector __________________________________________________ 37
5. Monetary Indicators __________________________________________________________________________ 38
6. Financial Soundness Indicators Total Banking System ________________________________________ 39
7. Medium-Term Outlook _______________________________________________________________________ 40
8. External Debt Sustainability Framework, 2006-2016 __________________________________________ 41
9. Public Sector Debt Sustainability Framework, 2006-2016 _____________________________________ 43
FIGURES
1. Recent Economic Developments ______________________________________________________________ 12
2. Labor Market Developments and Challenges _________________________________________________ 13
COLOMBIA 2011 ARTICLE IV REPORT
INTERNATIONAL MONETARY FUND 3
3. Financial Markets Developments _____________________________________________________________ 14
4. Financial Soundness Indicators: Colombia and Other Emerging Markets _____________________ 15
5. External Sector Developments ________________________________________________________________ 16
6. Reserve Coverage in International Perspective _______________________________________________ 25
7. External Debt Sustainability: Bound Tests _____________________________________________________ 42
8. Public Debt Sustainability: Bound Tests _______________________________________________________ 44
BOXES
1. Capital Inflows to Colombia ____________________________________________________________________ 9
2. Colombia’s Foreign Exchange (FX) Intervention in the Latin American Context ______________ 10
3. Labor Market Issues and Challenges __________________________________________________________ 11
4. Macroprudential Policies ______________________________________________________________________ 20
5. Exchange Rate Assessment ___________________________________________________________________ 26
2011 ARTICLE IV REPORT COLOMBIA
4 INTERNATIONAL MONETARY FUND
BACKGROUND
1. The Colombian economy exhibited
resilience during the global financial crisis
and is undergoing a solid recovery.
Colombia’s strong policy frameworks,
including its inflation-targeting regime and
medium-term fiscal framework, provided the
authorities with policy space to undertake
timely and effective countercyclical measures
in response to the 2008-09 global crisis.
Following a short-lived contraction, economic
activity started to recover in the second half of
2009, supported by fiscal and monetary
stimulus, which helped keep real GDP growth
in positive territory. The central bank lowered
the policy rate by 600 basis points (to
3.5 percent) over the course of 2009, and the
combined public sector deficit widened to
2.7 percent of GDP (compared with near
balance in 2008).
2. The presidential elections of 2010
had little effect on macroeconomic policies
or investors’ risk perceptions. Elections took
place in May and June 2010, and a new
administration (of President Santos) took office
in early August. The central bank governor
remained in his position (as stipulated by the
central bank law), and the new Minister of
Finance launched initiatives that supported his
predecessor’s efforts to strengthen the fiscal
framework (e.g., by adopting a fiscal package
that included rationalizing tax incentives and
submitting to congress important structural
fiscal reforms). In addition, the new
government completed the negotiation of a
free-trade agreement with the United States
that had started in 2006.1
3. In concluding the 2010 Article IV
consultation, Executive Directors
commended the Colombian authorities for
their sound macroeconomic management
and strong institutional framework.
Directors advised that, with inflation
expectations within the target range, the
monetary stance could be kept
accommodative until there was clear evidence
of a sustained recovery. They also noted that
the deterioration of the fiscal position in 2009,
including through a modest fiscal stimulus,
had not compromised medium-term
sustainability. Directors welcomed the
authorities' strategy of using the exchange rate
as the first line of defense to large capital
inflows, but pointed out that other instruments
may have to be considered if those inflows
were to persist. Directors also advised the
authorities to develop a strategy to minimize
medium-term fiscal risks, including those
resulting from tax incentives, special tax
regimes, and pension spending, and noted
that higher oil-related revenues over the
medium term would provide the opportunity
to build up international reserves and continue
lowering external vulnerabilities.
1 To enter into effect, the agreement has to be approved by the United States Congress.

COLOMBIA 2011 ARTICLE IV REPORT
INTERNATIONAL MONETARY FUND 5
4. Exchange system and data.
Colombia’s exchange rate (both de jure and de
facto) is a floating rate. There have been no
changes in Colombia’s exchange restrictions
since the last Article IV consultation. Colombia
maintains: (i) a multiple currency practice and
an exchange restriction arising from a tax on
outward remittances of nonresident profits
earned before 2007 and that have been
retained in the country for less than five years;
and (ii) an exchange restriction arising from
the special regime for the hydrocarbon sector,
in which branches of foreign corporations are
required to either surrender their export
proceeds to the authorities or agree to a
government limitation on their access to the
foreign exchange market. Data provision is
adequate for surveillance.
5. On May 6, 2011, the Executive Board
approved a two-year FCL arrangement for
500 percent of quota, which the authorities
are treating as precautionary. In approving
Colombia’s request (the third FCL since 2009),
Directors agreed that Colombia continued to
meet the qualification criteria for access to FCL
resources, noting especially the country’s very
strong policy frameworks and economic
fundamentals and the excellent track record of
policy implementation. Directors also agreed
that, despite the very favorable outlook,
uncertainties about the world recovery and
global liquidity conditions were key risks to the
medium-term outlook.
RECENT DEVELOPMENTS
6. In 2010 macroeconomic policies
remained supportive of the economic
recovery.
Activity gained further momentum during
the year, and real GDP grew by 4.3 percent
(despite output disruptions associated with
Venezuela’s decision to suspend bilateral
trade with Colombia and severe floods in
the latter part of the year). Growth was led
by domestic demand, which increased by
6¾ percent, reflecting robust consumption
and investment, including significant
inventory restocking. The broad-based
recovery of domestic demand was linked
to strong growth in most sectors (except
the labor-intensive sectors of agriculture,
construction, and light manufactures
linked to trade with Venezuela).
-6-4-202468
101214
Agr
icul
ture
and
live
stoc
k
Min
ing
and
hydr
ocar
bons
Man
fact
urin
g
Elec
tric
ity a
nd w
ater
Cons
truc
tion
Com
mer
ce
Tran
spor
tatio
n an
d co
m.
Oth
er s
ervi
ces
GD
P
2009
2010
Colombia: Sectoral GDP growth(in percent)
Sources: Staff estimates.
2011 ARTICLE IV REPORT COLOMBIA
6 INTERNATIONAL MONETARY FUND
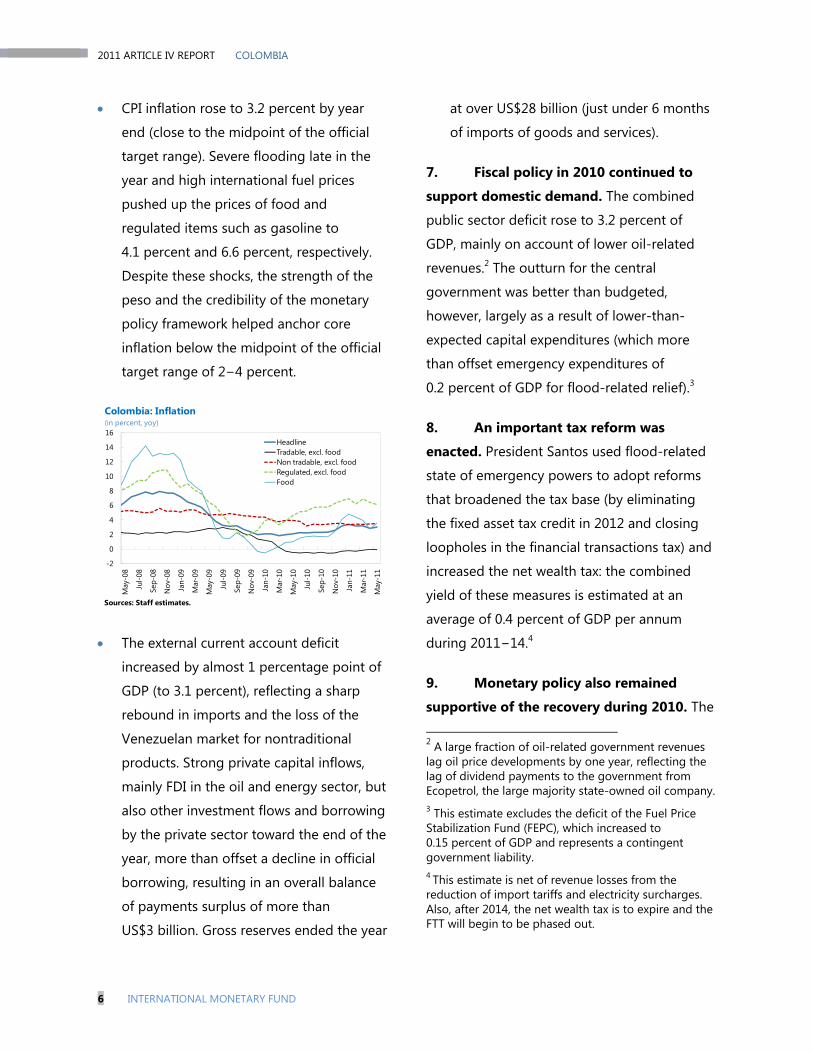
CPI inflation rose to 3.2 percent by year
end (close to the midpoint of the official
target range). Severe flooding late in the
year and high international fuel prices
pushed up the prices of food and
regulated items such as gasoline to
4.1 percent and 6.6 percent, respectively.
Despite these shocks, the strength of the
peso and the credibility of the monetary
policy framework helped anchor core
inflation below the midpoint of the official
target range of 2−4 percent.
The external current account deficit
increased by almost 1 percentage point of
GDP (to 3.1 percent), reflecting a sharp
rebound in imports and the loss of the
Venezuelan market for nontraditional
products. Strong private capital inflows,
mainly FDI in the oil and energy sector, but
also other investment flows and borrowing
by the private sector toward the end of the
year, more than offset a decline in official
borrowing, resulting in an overall balance
of payments surplus of more than
US$3 billion. Gross reserves ended the year
at over US$28 billion (just under 6 months
of imports of goods and services).
7. Fiscal policy in 2010 continued to
support domestic demand. The combined
public sector deficit rose to 3.2 percent of
GDP, mainly on account of lower oil-related
revenues.2 The outturn for the central
government was better than budgeted,
however, largely as a result of lower-than-
expected capital expenditures (which more
than offset emergency expenditures of
0.2 percent of GDP for flood-related relief).3
8. An important tax reform was
enacted. President Santos used flood-related
state of emergency powers to adopt reforms
that broadened the tax base (by eliminating
the fixed asset tax credit in 2012 and closing
loopholes in the financial transactions tax) and
increased the net wealth tax: the combined
yield of these measures is estimated at an
average of 0.4 percent of GDP per annum
during 2011−14.4
9. Monetary policy also remained
supportive of the recovery during 2010. The
2 A large fraction of oil-related government revenues lag oil price developments by one year, reflecting the lag of dividend payments to the government from Ecopetrol, the large majority state-owned oil company. 3 This estimate excludes the deficit of the Fuel Price Stabilization Fund (FEPC), which increased to 0.15 percent of GDP and represents a contingent government liability. 4 This estimate is net of revenue losses from the reduction of import tariffs and electricity surcharges. Also, after 2014, the net wealth tax is to expire and the FTT will begin to be phased out.
-2
0
2
4
6
8
10
12
14
16
May
-08
Jul-0
8
Sep-
08
Nov
-08
Jan-
09
Mar
-09
May
-09
Jul-0
9
Sep-
09
Nov
-09
Jan-
10
Mar
-10
May
-10
Jul-1
0
Sep-
10
Nov
-10
Jan-
11
Mar
-11
May
-11
HeadlineTradable, excl. foodNon tradable, excl. foodRegulated, excl. foodFood
Colombia: Inflation (in percent, yoy)
Sources: Staff estimates.
COLOMBIA 2011 ARTICLE IV REPORT
INTERNATIONAL MONETARY FUND 7
policy rate was kept at an historic low of
3 percent (from April 2010 to February 2011),
helping to reduce lending spreads and
facilitating a recovery in bank credit.
Commercial and consumer credit, which had
been broadly stable in 2009, began to rebound
strongly around mid-year.
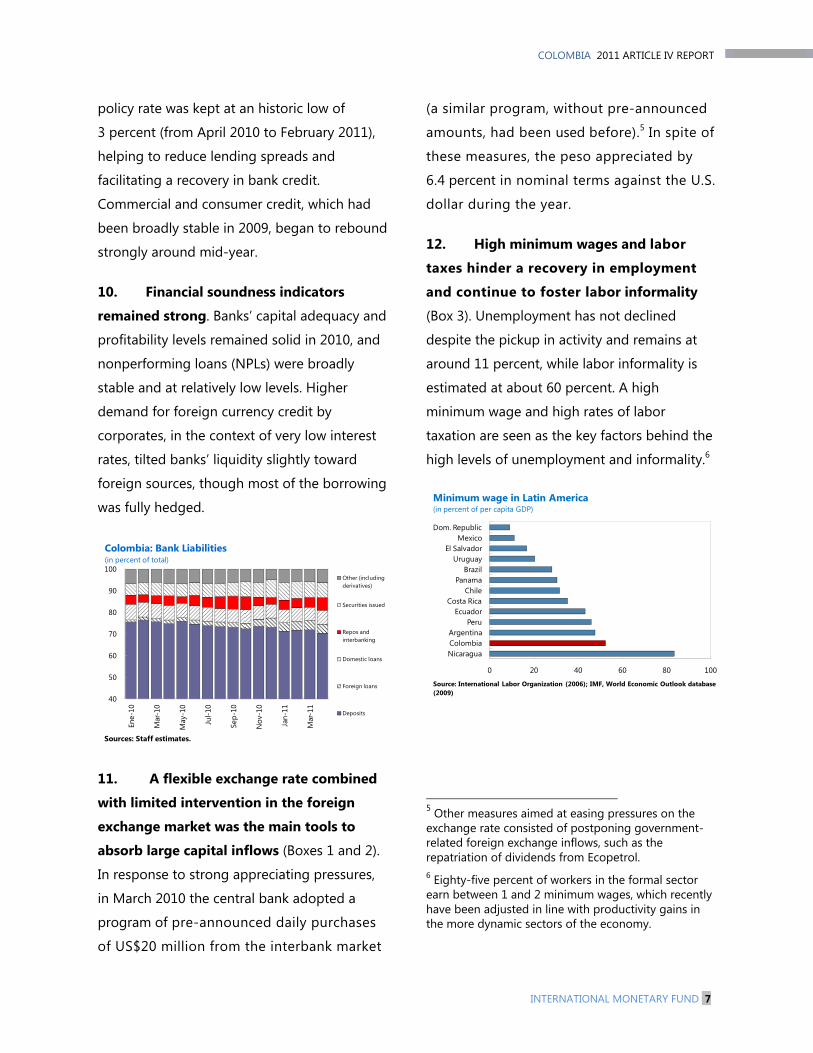
10. Financial soundness indicators
remained strong. Banks’ capital adequacy and
profitability levels remained solid in 2010, and
nonperforming loans (NPLs) were broadly
stable and at relatively low levels. Higher
demand for foreign currency credit by
corporates, in the context of very low interest
rates, tilted banks’ liquidity slightly toward
foreign sources, though most of the borrowing
was fully hedged.
11. A flexible exchange rate combined
with limited intervention in the foreign
exchange market was the main tools to
absorb large capital inflows (Boxes 1 and 2).
In response to strong appreciating pressures,
in March 2010 the central bank adopted a
program of pre-announced daily purchases
of US$20 million from the interbank market
(a similar program, without pre-announced
amounts, had been used before).5 In spite of
these measures, the peso appreciated by
6.4 percent in nominal terms against the U.S.
dollar during the year.
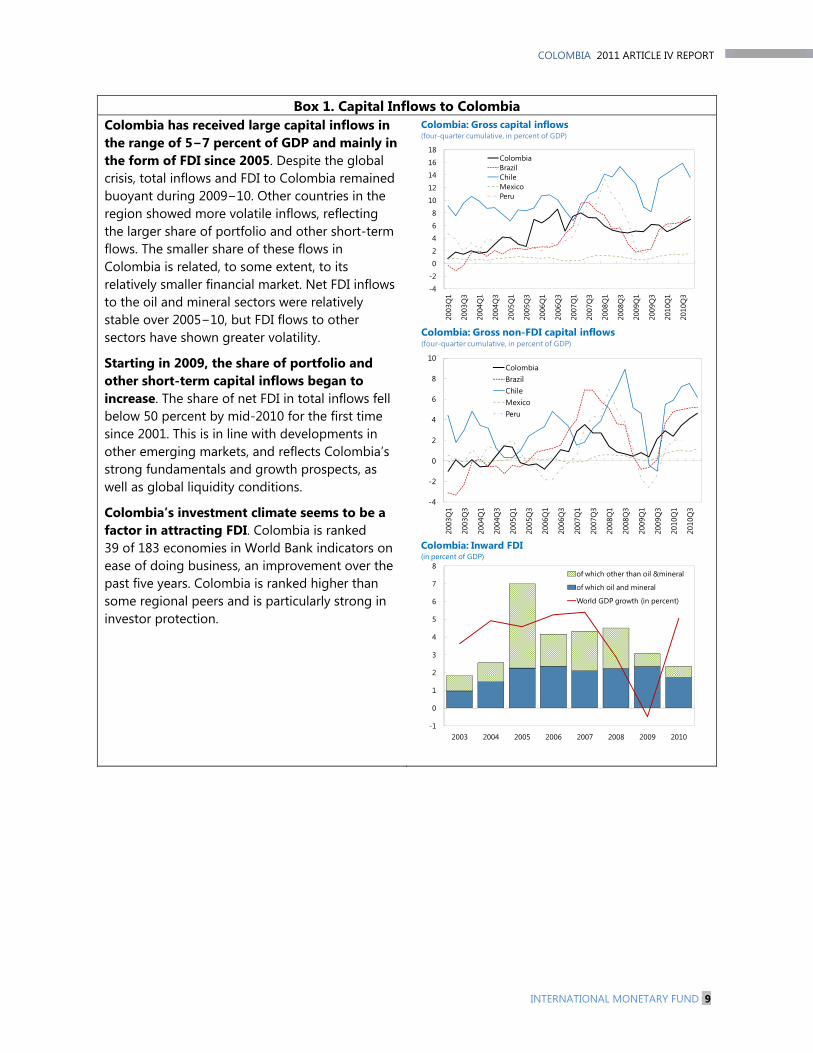
12. High minimum wages and labor
taxes hinder a recovery in employment
and continue to foster labor informality
(Box 3). Unemployment has not declined
despite the pickup in activity and remains at
around 11 percent, while labor informality is
estimated at about 60 percent. A high
minimum wage and high rates of labor
taxation are seen as the key factors behind the
high levels of unemployment and informality.6
5 Other measures aimed at easing pressures on the exchange rate consisted of postponing government-related foreign exchange inflows, such as the repatriation of dividends from Ecopetrol. 6 Eighty-five percent of workers in the formal sector earn between 1 and 2 minimum wages, which recently have been adjusted in line with productivity gains in the more dynamic sectors of the economy.
40
50
60
70
80
90
100
Ene-
10
Mar
-10
May
-10
Jul-1
0
Sep-
10
Nov
-10
Jan-
11
Mar
-11
Other (including derivatives)
Securities issued
Repos and interbanking
Domestic loans
Foreign loans
Deposits
Colombia: Bank Liabilities(in percent of total)
Sources: Staff estimates.
0 20 40 60 80 100
NicaraguaColombiaArgentina
PeruEcuador
Costa RicaChile
PanamaBrazil
UruguayEl Salvador
MexicoDom. Republic
Minimum wage in Latin America(in percent of per capita GDP)
Source: International Labor Organization (2006); IMF, World Economic Outlook database (2009)

2011 ARTICLE IV REPORT COLOMBIA
8 INTERNATIONAL MONETARY FUND
OUTLOOK
13. The outlook for 2011 and the
medium term is generally positive.
The output gap is expected to close in
early 2012. Real GDP growth in 2011 is
expected to be somewhat below
5 percent and broadly balanced (with
solid growth in both private consumption
and investment). The contained
consumption growth outlook reflects
slower projected growth in labor-intensive
sectors such as agriculture (where adverse
weather conditions remain), construction,
and industries linked to nontraditional
exports to Venezuela. Starting in 2012,
real GDP growth is to stabilize at around
the potential rate of growth (estimated at
4½ percent per year).
Non-Wage Labor Costs in Colombia
Earmarked Programs Percent of Wage
Pensions 16.0
Contributory Health Regime 12.5
Severance Fund 8.3
Paid Vacation 4.2
Mandatory Bonuses 8.3
Severance payment for Unjust Dismissals 1/ 4.2
Special Funds
SENA (Training) 2.0
ICBF (Family and Child Welfare) 3.0
CCF (Family Compensation) 4.0
Total 62.5
1/ Varies according to the type of contract and time employed
with a minimum value of around 4.23 percent in the case of defined
contract (after labor reform of 2002).
Colombia: Medium-Term Outlook
Prel. Projections2010 2011 2012 2013 2014 2015 2016
Real GDP growth (in percent) 4.3 4.9 4.5 4.5 4.5 4.5 4.5Inflation, end of period (in percent) 3.2 3.1 3.1 3.0 3.0 3.0 3.0External current account balance -3.1 -2.6 -2.5 -2.1 -2.3 -2.2 -2.0Central government overall balance -3.8 -3.8 -3.0 -2.6 -2.3 -2.3 -2.1Nonfinancial public sector overall balance -3.3 -3.0 -1.5 -1.2 -1.0 -0.9 -0.9Total public gross debt (excluding Ecopetrol) 35.2 34.5 33.2 32.3 31.6 31.0 30.2Total public net debt 28.5 29.2 28.4 27.5 27.0 26.6 26.1
(in percent of GDP, unless otherwise indicated)
COLOMBIA 2011 ARTICLE IV REPORT
INTERNATIONAL MONETARY FUND 9
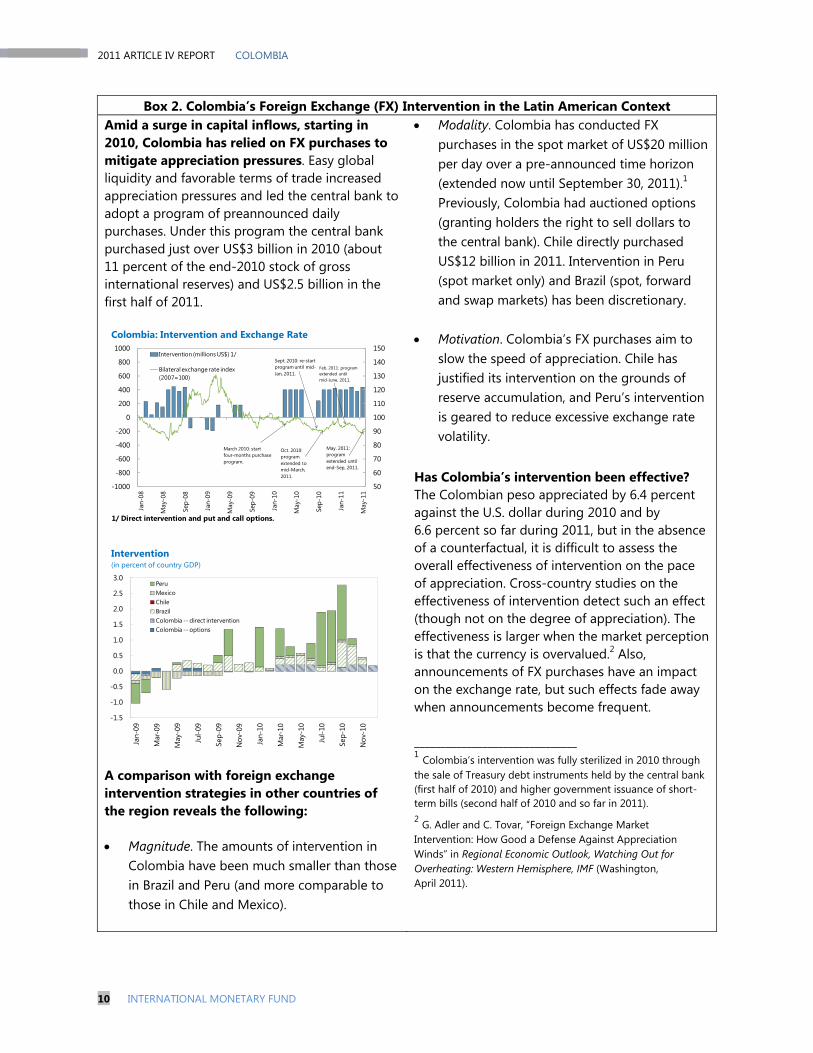
Box 1. Capital Inflows to Colombia Colombia has received large capital inflows in the range of 5−7 percent of GDP and mainly in the form of FDI since 2005. Despite the global crisis, total inflows and FDI to Colombia remained buoyant during 2009−10. Other countries in the region showed more volatile inflows, reflecting the larger share of portfolio and other short-term flows. The smaller share of these flows in Colombia is related, to some extent, to its relatively smaller financial market. Net FDI inflows to the oil and mineral sectors were relatively stable over 2005−10, but FDI flows to other sectors have shown greater volatility.
Starting in 2009, the share of portfolio and other short-term capital inflows began to increase. The share of net FDI in total inflows fell below 50 percent by mid-2010 for the first time since 2001. This is in line with developments in other emerging markets, and reflects Colombia’s strong fundamentals and growth prospects, as well as global liquidity conditions.
Colombia’s investment climate seems to be a factor in attracting FDI. Colombia is ranked 39 of 183 economies in World Bank indicators on ease of doing business, an improvement over the past five years. Colombia is ranked higher than some regional peers and is particularly strong in investor protection.
-4
-2
0
2
4
6
8
10
12
14
16
18
2003
Q1
2003
Q3
2004
Q1
2004
Q3
2005
Q1
2005
Q3
2006
Q1
2006
Q3
2007
Q1
2007
Q3
2008
Q1
2008
Q3
2009
Q1
2009
Q3
2010
Q1
2010
Q3
ColombiaBrazilChileMexicoPeru
Colombia: Gross capital inflows(four-quarter cumulative, in percent of GDP)
-4
-2
0
2
4
6
8
10
2003
Q1
2003
Q3
2004
Q1
2004
Q3
2005
Q1
2005
Q3
2006
Q1
2006
Q3
2007
Q1
2007
Q3
2008
Q1
2008
Q3
2009
Q1
2009
Q3
2010
Q1
2010
Q3
ColombiaBrazilChileMexicoPeru
Colombia: Gross non-FDI capital inflows (four-quarter cumulative, in percent of GDP)
-1
0
1
2
3
4
5
6
7
8
2003 2004 2005 2006 2007 2008 2009 2010
of which other than oil &mineral
of which oil and mineral
World GDP growth (in percent)
Colombia: Inward FDI(in percent of GDP)
2011 ARTICLE IV REPORT COLOMBIA
10 INTERNATIONAL MONETARY FUND
Box 2. Colombia’s Foreign Exchange (FX) Intervention in the Latin American ContextAmid a surge in capital inflows, starting in 2010, Colombia has relied on FX purchases to mitigate appreciation pressures. Easy global liquidity and favorable terms of trade increased appreciation pressures and led the central bank to adopt a program of preannounced daily purchases. Under this program the central bank purchased just over US$3 billion in 2010 (about 11 percent of the end-2010 stock of gross international reserves) and US$2.5 billion in the first half of 2011.
A comparison with foreign exchange intervention strategies in other countries of the region reveals the following: Magnitude. The amounts of intervention in
Colombia have been much smaller than those in Brazil and Peru (and more comparable to those in Chile and Mexico).
Modality. Colombia has conducted FX purchases in the spot market of US$20 million per day over a pre-announced time horizon (extended now until September 30, 2011).1 Previously, Colombia had auctioned options (granting holders the right to sell dollars to the central bank). Chile directly purchased US$12 billion in 2011. Intervention in Peru (spot market only) and Brazil (spot, forward and swap markets) has been discretionary.
Motivation. Colombia’s FX purchases aim to slow the speed of appreciation. Chile has justified its intervention on the grounds of reserve accumulation, and Peru’s intervention is geared to reduce excessive exchange rate volatility.
Has Colombia’s intervention been effective? The Colombian peso appreciated by 6.4 percent against the U.S. dollar during 2010 and by 6.6 percent so far during 2011, but in the absence of a counterfactual, it is difficult to assess the overall effectiveness of intervention on the pace of appreciation. Cross-country studies on the effectiveness of intervention detect such an effect (though not on the degree of appreciation). The effectiveness is larger when the market perception is that the currency is overvalued.2 Also, announcements of FX purchases have an impact on the exchange rate, but such effects fade away when announcements become frequent. _______________________________ 1 Colombia’s intervention was fully sterilized in 2010 through the sale of Treasury debt instruments held by the central bank (first half of 2010) and higher government issuance of short-term bills (second half of 2010 and so far in 2011). 2 G. Adler and C. Tovar, “Foreign Exchange Market Intervention: How Good a Defense Against Appreciation Winds” in Regional Economic Outlook, Watching Out for Overheating: Western Hemisphere, IMF (Washington, April 2011).
50
60
70
80
90
100
110
120
130
140
150
-1000
-800
-600
-400
-200
0
200
400
600
800
1000
Jan-
08
May
-08
Sep-
08
Jan-
09
May
-09
Sep-
09
Jan-
10
May
-10
Sep-
10
Jan-
11
May
-11
Intervention (millions US$) 1/
Bilateral exchange rate index (2007=100)
Feb. 2011: program extended until mid-June, 2011.
Colombia: Intervention and Exchange Rate
1/ Direct intervention and put and call options.
Sept. 2010: re-start program until mid-Jan, 2011.
May. 2011: program extended until end-Sep, 2011.
March 2010: start four-months purchase program.
Oct. 2010: program extended to mid-March, 2011.
-1.5
-1.0
-0.5
0.0
0.5
1.0
1.5
2.0
2.5
3.0
Jan-
09
Mar
-09
May
-09
Jul-0
9
Sep-
09
Nov
-09
Jan-
10
Mar
-10
May
-10
Jul-1
0
Sep-
10
Nov
-10
PeruMexicoChileBrazilColombia -- direct interventionColombia -- options
Intervention (in percent of country GDP)

COLOMBIA 2011 ARTICLE IV REPORT
INTERNATIONAL MONETARY FUND 11
Box 3. Labor Market Issues and Challenges
High levels of unemployment and labor informality are longstanding policy challenges in Colombia. In the last decade, marked by sustained output growth and substantial policy reform, unemployment fell only modestly from 17 percent in 1999 to about 12 percent in 2010. Unemployment remains high by regional standards; in addition, Colombia’s labor informality is estimated at 58 percent, also relatively high for Latin American countries. Colombia’s labor market segmentation complicates poverty reduction by creating a poverty trap—where informal laborers, who are predominantly poor, tend to be employed in lower-quality jobs and face barriers to access higher productivity formal-sector job opportunities.1
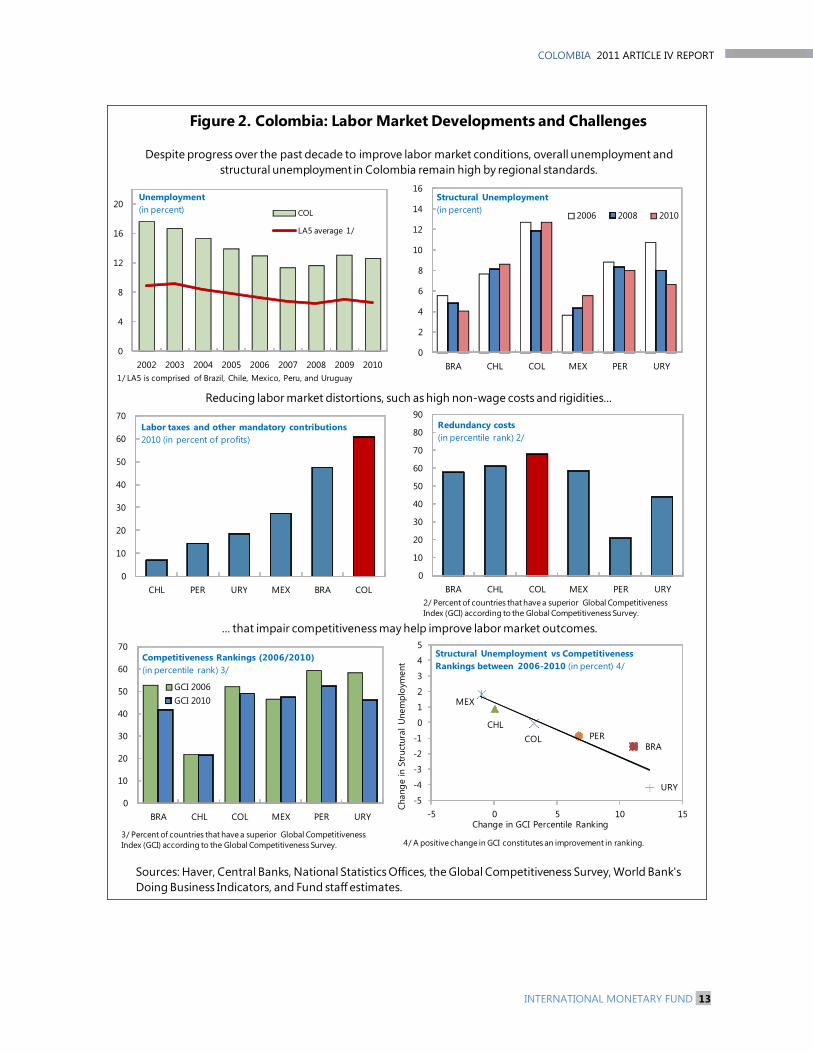
Labor market distortions are a key factor behind Colombia’s elevated levels of unemployment and informality. Findings across a broad set of empirical studies suggest that labor market regulations and laws have impeded the creation of employment and created incentives towards greater informality. Key among these is
_______________________________ 1 World Bank (2009), Non-Lending Technical Assistance: Colombia Poverty and Jobs, Washington, D.C.
Colombia’s high-nonwage costs, which rose sharply in the 1990’s, partly to help finance the health and pension systems mandated by the 1991 constitution. Colombia’s high and constitutionally protected minimum wage (which as of end-2010 was equivalent to 52 percent of GDP per capita, the second highest in the region) is another factor. Non-wage costs in the formal sector (in addition to payroll tax contributions to fund health and pension schemes) include taxes to fund training and set asides for severance payments, paid vacations, and mandatory bonuses. Colombia’s labor taxes and other mandatory contributions amount to over 60 percent of profits—the highest among large Latin American countries. In addition, some studies have linked the expansion of publicly provided health services in the early 1990’s to higher informality, as it has given workers the opportunity to enjoy health services without having to participate in a contributory regime. This has raised concerns about the potential for further informality pressures from health reforms now under consideration to equalize benefits across the subsidized and contributory schemes.
05
101520253035404550
BRA CHL COL MEX PER URU
Informality 1/
Poverty rate (2009) 2/
Informality and poverty in major Latin American countries(in percent)
1/ Vuletin, Guillermo, Measuring the Informal Economy in Latin America and the Caribbean, IMF Working Paper, Washington DC, 2008.2/ Reports national poverty statistics which are not comparable across countries. 2008 poverty data is reported for Mexico and Uruguay.
0
5
10
15
20
25
30
35
40
45
50
BRA CHL COL MEX PER URU
Labor rigidity Tax burden Other
Size and causes of the informal economy in Latin America1/ (in percent)
1/ Vuletin, Guillermo, Measuring the Informal Economy in Latin America and the Caribbean, IMF Working Paper, Washington DC, 2008.
2011 ARTICLE IV REPORT COLOMBIA
12 INTERNATIONAL MONETARY FUND
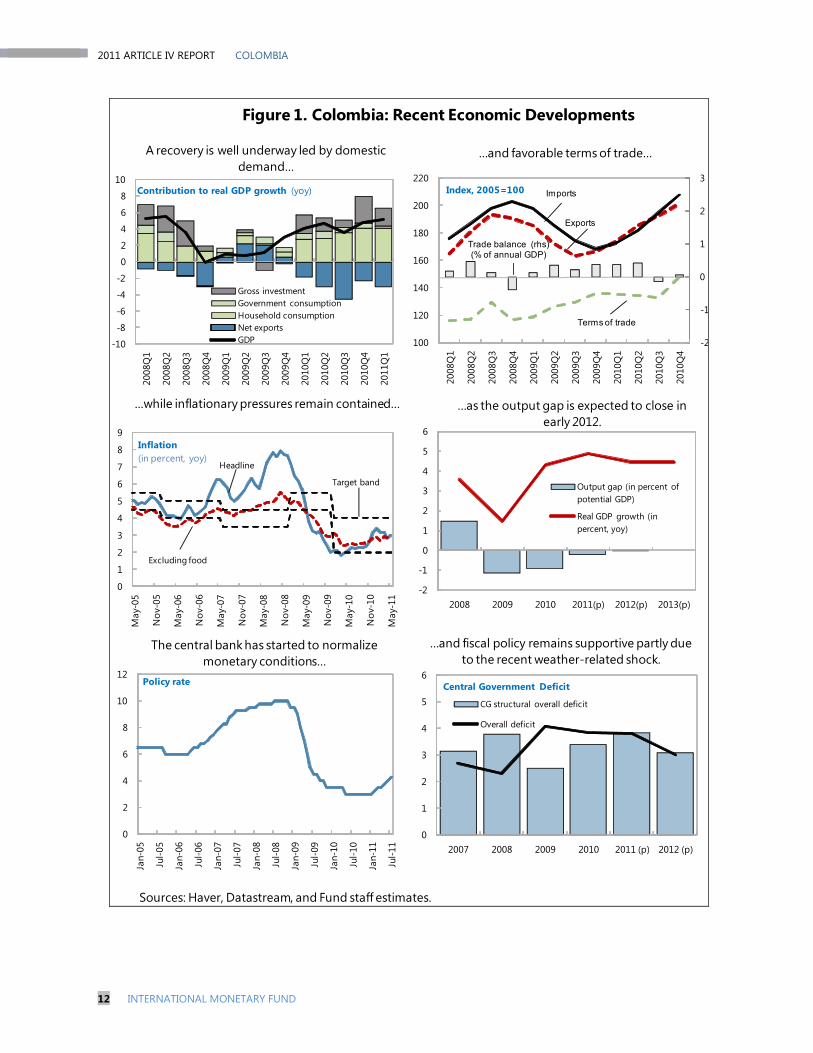
Figure 1. Colombia: Recent Economic Developments
Sources: Haver, Datastream, and Fund staff estimates.
-10
-8
-6
-4
-2
0
2
4
6
8
10
2008
Q1
2008
Q2
2008
Q3
2008
Q4
2009
Q1
2009
Q2
2009
Q3
2009
Q4
2010
Q1
2010
Q2
2010
Q3
2010
Q4
2011
Q1
Gross investmentGovernment consumptionHousehold consumptionNet exportsGDP
Contribution to real GDP growth (yoy)
-2
-1
0
1
2
3
100
120
140
160
180
200
220
2008
Q1
2008
Q2
2008
Q3
2008
Q4
2009
Q1
2009
Q2
2009
Q3
2009
Q4
2010
Q1
2010
Q2
2010
Q3
2010
Q4
Exports
Imports
Trade balance (rhs)(% of annual GDP)
Terms of trade
Index, 2005=100
0
1
2
3
4
5
6
7
8
9
May
-05
Nov
-05
May
-06
Nov
-06
May
-07
Nov
-07
May
-08
Nov
-08
May
-09
Nov
-09
May
-10
Nov
-10
May
-11
Headline
Excluding food
Target band
Inflation (in percent, yoy)
-2
-1
0
1
2
3
4
5
6
2008 2009 2010 2011(p) 2012(p) 2013(p)
Output gap (in percent of potential GDP)
Real GDP growth (in percent, yoy)
0
2
4
6
8
10
12
Jan-
05
Jul-0
5
Jan-
06
Jul-0
6
Jan-
07
Jul-0
7
Jan-
08
Jul-0
8
Jan-
09
Jul-0
9
Jan-
10
Jul-1
0
Jan-
11
Jul-1
1
Policy rate
0
1
2
3
4
5
6
2007 2008 2009 2010 2011 (p) 2012 (p)
CG structural overall deficit
Overall deficit
Central Government Deficit
A recovery is well underway led by domestic demand…
…and favorable terms of trade…
…as the output gap is expected to close in early 2012.
...while inflationary pressures remain contained…
The central bank has started to normalize monetary conditions…
…and fiscal policy remains supportive partly due to the recent weather-related shock.
COLOMBIA 2011 ARTICLE IV REPORT
INTERNATIONAL MONETARY FUND 13
Figure 2. Colombia: Labor Market Developments and Challenges
Sources: Haver, Central Banks, National Statistics Offices, the Global Competitiveness Survey, World Bank's Doing Business Indicators, and Fund staff estimates.
Despite progress over the past decade to improve labor market conditions, overall unemployment and structural unemployment in Colombia remain high by regional standards.
Reducing labor market distortions, such as high non-wage costs and rigidities...
... that impair competitiveness may help improve labor market outcomes.
0
2
4
6
8
10
12
14
16
BRA CHL COL MEX PER URY
2006 2008 2010
Structural Unemployment (in percent)
0
10
20
30
40
50
60
70
BRA CHL COL MEX PER URY
GCI 2006GCI 2010
3/ Percent of countries that have a superior Global Competitiveness Index (GCI) according to the Global Competitiveness Survey.
Competitiveness Rankings (2006/2010) (in percentile rank) 3/
BRA
CHLCOL
MEX
PER
URY-5
-4
-3
-2
-1
0
1
2
3
4
5
-5 0 5 10 15
Chan
ge in
Str
uctu
ral U
nem
ploy
men
t
Change in GCI Percentile Ranking
4/ A positive change in GCI constitutes an improvement in ranking.
Structural Unemployment vs Competitiveness Rankings between 2006-2010 (in percent) 4/
0
4
8
12
16
20
2002 2003 2004 2005 2006 2007 2008 2009 2010
COL
LA5 average 1/
Unemployment (in percent)
1/ LA5 is comprised of Brazil, Chile, Mexico, Peru, and Uruguay
0
10
20
30
40
50
60
70
CHL PER URY MEX BRA COL
Labor taxes and other mandatory contributions 2010 (in percent of profits)
0
10
20
30
40
50
60
70
80
90
BRA CHL COL MEX PER URY
Redundancy costs (in percentile rank) 2/
2/ Percent of countries that have a superior Global Competitiveness Index (GCI) according to the Global Competitiveness Survey.
2011 ARTICLE IV REPORT COLOMBIA
14 INTERNATIONAL MONETARY FUND
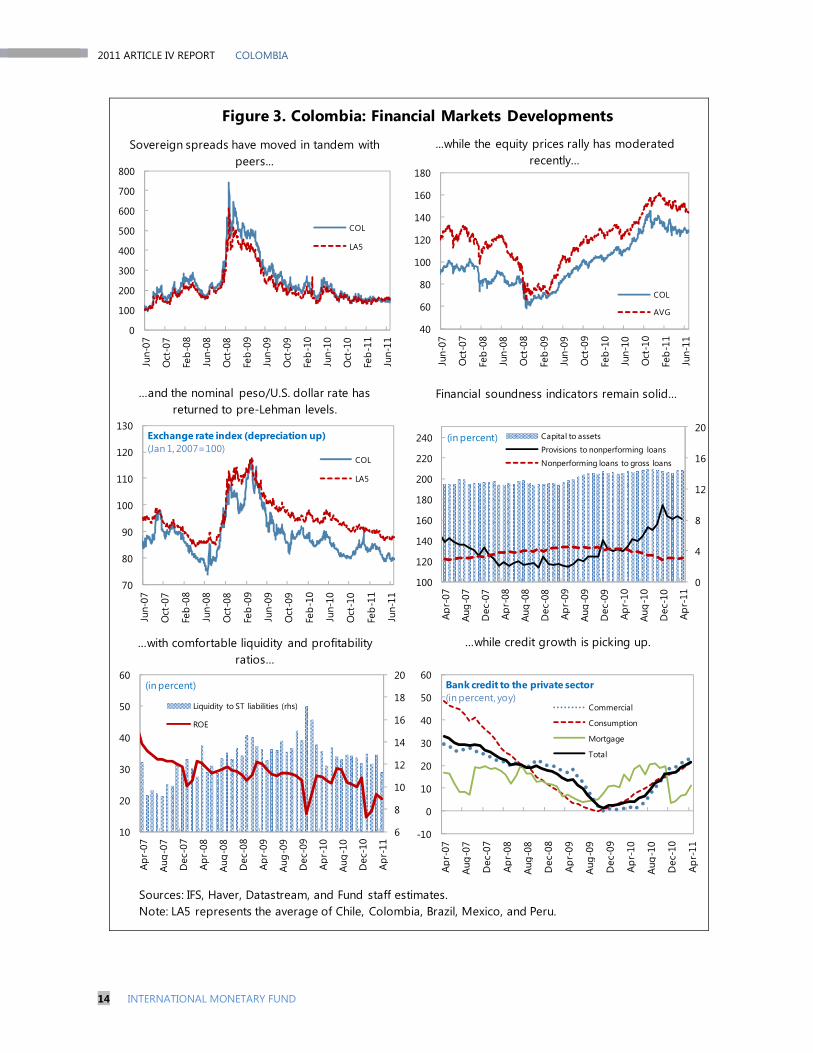
Figure 3. Colombia: Financial Markets Developments
Sources: IFS, Haver, Datastream, and Fund staff estimates.Note: LA5 represents the average of Chile, Colombia, Brazil, Mexico, and Peru.
0
100
200
300
400
500
600
700
800
Jun-
07
Oct
-07
Feb-
08
Jun-
08
Oct
-08
Feb-
09
Jun-
09
Oct
-09
Feb-
10
Jun-
10
Oct
-10
Feb-
11
Jun-
11
COL
LA5
40
60
80
100
120
140
160
180
Jun-
07
Oct
-07
Feb-
08
Jun-
08
Oct
-08
Feb-
09
Jun-
09
Oct
-09
Feb-
10
Jun-
10
Oct
-10
Feb-
11
Jun-
11
COL
AVG
70
80
90
100
110
120
130
Jun-
07
Oct
-07
Feb-
08
Jun-
08
Oct
-08
Feb-
09
Jun-
09
Oct
-09
Feb-
10
Jun-
10
Oct
-10
Feb-
11
Jun-
11
COL
LA5
Exchange rate index (depreciation up) (Jan 1, 2007=100)
0
4
8
12
16
20
100
120
140
160
180
200
220
240Ap
r-07
Aug-
07
Dec
-07
Apr-
08
Aug-
08
Dec
-08
Apr-
09
Aug-
09
Dec
-09
Apr-
10
Aug-
10
Dec
-10
Apr-
11
Capital to assets
Provisions to nonperforming loans
Nonperforming loans to gross loans
(in percent)
6
8
10
12
14
16
18
20
10
20
30
40
50
60
Apr-
07
Aug-
07
Dec
-07
Apr-
08
Aug-
08
Dec
-08
Apr-
09
Aug-
09
Dec
-09
Apr-
10
Aug-
10
Dec
-10
Apr-
11
Liquidity to ST liabilities (rhs)
ROE
(in percent)
Sovereign spreads have moved in tandem with peers...
...while the equity prices rally has moderated recently…
…and the nominal peso/U.S. dollar rate has returned to pre-Lehman levels.
Financial soundness indicators remain solid…
…with comfortable liquidity and profitability ratios…
…while credit growth is picking up.
-10
0
10
20
30
40
50
60
Apr-
07
Aug-
07
Dec
-07
A pr-
08
Aug-
08
Dec
-08
A pr-
09
Aug-
09
Dec
-09
A pr-
10
Aug-
10
Dec
-10
A pr-
11Commercial
Consumption
Mortgage
Total
Bank credit to the private sector (in percent, yoy)

COLOMBIA 2011 ARTICLE IV REPORT
INTERNATIONAL MONETARY FUND 15
Figure 4. Financial Soundness Indicators: Colombia and Other Emerging Markets
Source: April 2011 GFSR Statistical Appendix.
0
5
10
15
20
25
Braz
il
Chile
Colo
mbi
a
Mex
ico
Peru
Uru
guay
Latin
Am
eric
a
Emer
ging
Eur
ope
Dev
elop
ing
Asia
Mid
dle
East
2009 2010
Regulatory Capital to Risk-Weighted Assets(in percent)
0
4
8
12
16
20
Braz
il
Chile
Colo
mbi
a
Mex
ico
Peru
Uru
guay
Latin
Am
eric
a
Emer
ging
Eur
ope
Dev
elop
ing
Asia
Mid
dle
East
2009 2010
Bank Capital to Assets(in percent)
0
1
2
3
4
5
Braz
il
Chile
Colo
mbi
a
Mex
ico
Peru
Uru
guay
Latin
Am
eric
a
Emer
ging
Eur
ope
Dev
elop
ing
Asia
Mid
dle
East
2009 2010
Bank Return on Assets(in percent)
0
5
10
15
20
25
30
35
40Br
azil
Chile
Colo
mbi
a
Mex
ico
Peru
Uru
guay
Latin
Am
eric
a
Emer
ging
Eur
ope
Dev
elop
ing
Asia
Mid
dle
East
2009 2010
Bank Return on Equity(in percent)
0
50
100
150
200
250
Braz
il
Chile
Colo
mbi
a
Mex
ico
Peru
Uru
guay
Latin
Am
eric
a
Emer
ging
Eur
ope
Dev
elop
ing
Asia
Mid
dle
East
2009 2010
Bank Provisions to Nonperforming Loans(in percent)
0
2
4
6
8
10
12
14
Braz
il
Chile
Colo
mbi
a
Mex
ico
Peru
Uru
guay
Latin
Am
eric
a
Emer
ging
Eur
ope
Dev
elop
ing
Asia
Mid
dle
East
2009 2010
Bank Nonperforming Loans to Total Loans(in percent)
Colombian banks weathered the crisis with strengthened capitalization...
and robust profitability.
Nonperforming loans have remained moderate and are well covered by provisions.

2011 ARTICLE IV REPORT COLOMBIA
16 INTERNATIONAL MONETARY FUND
Figure 5. Colombia: External Sector Developments
Sources: Banco de la República; Haver; IFS and INS databases; and Fund staff estimates.
60
70
80
90
100
110
120
Mar
-99
Jan-
00
Nov
-00
Sep-
01
Jul-0
2
May
-03
Mar
-04
Jan-
05
Nov
-05
Sep-
06
Jul-0
7
May
-08
Mar
-09
Jan-
10
Nov
-10
Real effective exchange rate (2008=100)
(Index, 2008=100)
0
5000
10000
15000
20000
25000
30000
35000
40000
45000
2001
2002
2003
2004
2005
2006
2007
2008
2009
2010
Total exports
Commodity exports
Nontraditional exports
Exports to Venezuela
(in billions of U.S. dollars)
0
2
4
6
8
10
12
14
16
18
Dec
-03
Jun-
04
Dec
-04
Jun-
05
Dec
-05
Jun-
06
Dec
-06
Jun-
07
Dec
-07
Jun-
08
Dec
-08
Jun-
09
Dec
-09
Jun-
10
Dec
-10
ColombiaBrazilChileMexicoPeru
(gross; four-quarter cumulative, in percent of GDP)
The peso has been appreciating in real effective terms since 2004…
Capital inflows were relatively stable during 2008-10 ...
…while nontraditional exports doubled in size (until the Venezuela shock).
…resulting in strong balance of paymentssurpluses.
5000
10000
15000
20000
25000
30000
35000
1997
1998
1999
2000
2001
2002
2003
2004
2005
2006
2007
2008
2009
2010
Gross International Reserves
(in millions of U.S. dollars)
COLOMBIA 2011 ARTICLE IV REPORT
INTERNATIONAL MONETARY FUND 17
Notwithstanding the shock to
commodity prices, inflation is expected
to stay within the (2−4 percent) official
target range. Inflation expectations are
well anchored by the strong credibility of
the central bank and the expectation of
continued peso appreciation. Over the
medium term, inflation is expected to
remain well within the target range.
The external current account deficit is
expected to decline, and the overall
balance of payments is expected to
remain in surplus. Exports of oil and other
mineral products, as well as manufacturing,
are expected to result in sizeable trade
surpluses, although they will be more than
offset by large profit repatriation flows.
The resulting current account deficits,
however, will be more than financed by
large capital flows (especially FDI).
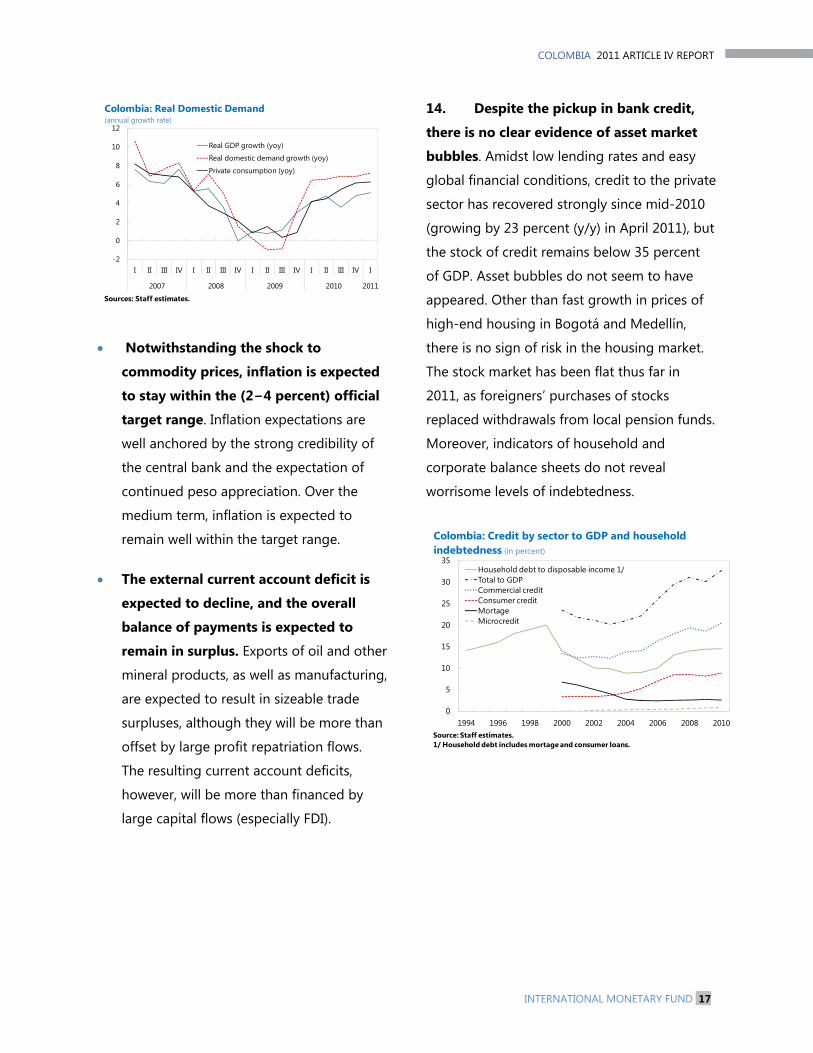
14. Despite the pickup in bank credit,
there is no clear evidence of asset market
bubbles. Amidst low lending rates and easy
global financial conditions, credit to the private
sector has recovered strongly since mid-2010
(growing by 23 percent (y/y) in April 2011), but
the stock of credit remains below 35 percent
of GDP. Asset bubbles do not seem to have
appeared. Other than fast growth in prices of
high-end housing in Bogotá and Medellín,
there is no sign of risk in the housing market.
The stock market has been flat thus far in
2011, as foreigners’ purchases of stocks
replaced withdrawals from local pension funds.
Moreover, indicators of household and
corporate balance sheets do not reveal
worrisome levels of indebtedness.
-2
0
2
4
6
8
10
12
I II III IV I II III IV I II III IV I II III IV I
2007 2008 2009 2010 2011
Real GDP growth (yoy)
Real domestic demand growth (yoy)
Private consumption (yoy)
Colombia: Real Domestic Demand (annual growth rate)
Sources: Staff estimates.
0
5
10
15
20
25
30
35
1994 1996 1998 2000 2002 2004 2006 2008 2010
Household debt to disposable income 1/Total to GDPCommercial creditConsumer credit MortageMicrocredit
Colombia: Credit by sector to GDP and household indebtedness (in percent)
Source: Staff estimates.1/ Household debt includes mortage and consumer loans.
2011 ARTICLE IV REPORT COLOMBIA
18 INTERNATIONAL MONETARY FUND
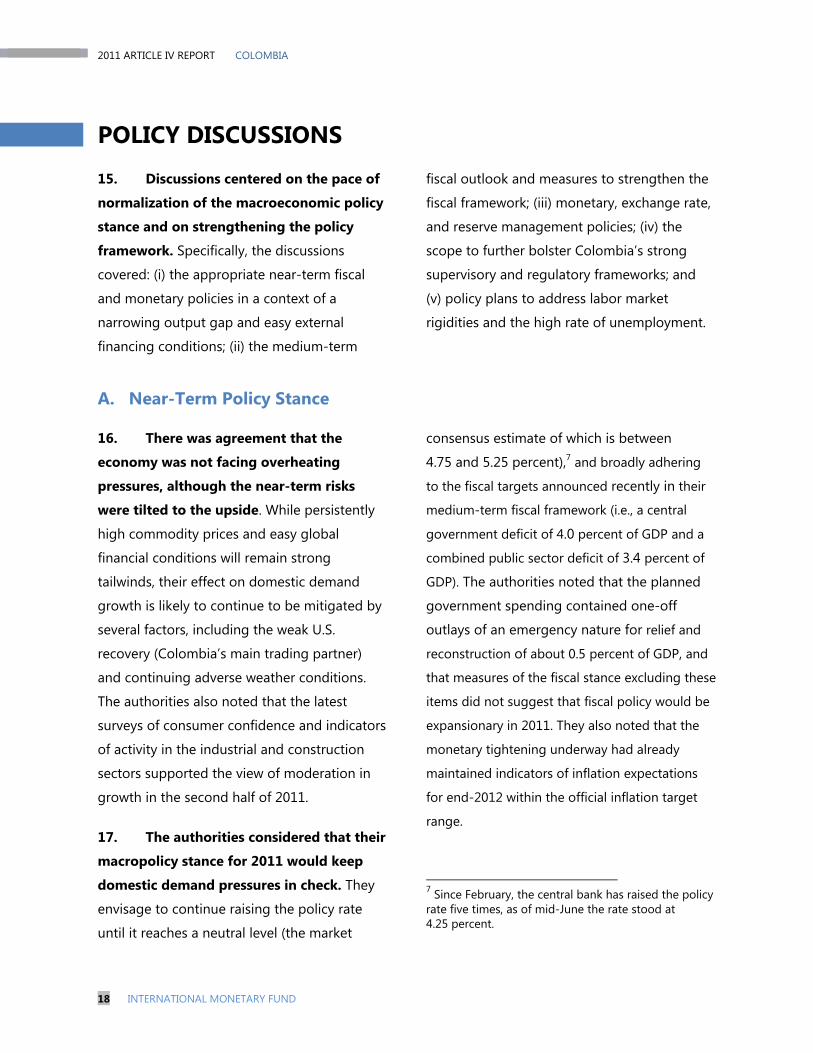
POLICY DISCUSSIONS 15. Discussions centered on the pace of
normalization of the macroeconomic policy
stance and on strengthening the policy
framework. Specifically, the discussions
covered: (i) the appropriate near-term fiscal
and monetary policies in a context of a
narrowing output gap and easy external
financing conditions; (ii) the medium-term
fiscal outlook and measures to strengthen the
fiscal framework; (iii) monetary, exchange rate,
and reserve management policies; (iv) the
scope to further bolster Colombia’s strong
supervisory and regulatory frameworks; and
(v) policy plans to address labor market
rigidities and the high rate of unemployment.
A. Near-Term Policy Stance
16. There was agreement that the
economy was not facing overheating
pressures, although the near-term risks
were tilted to the upside. While persistently
high commodity prices and easy global
financial conditions will remain strong
tailwinds, their effect on domestic demand
growth is likely to continue to be mitigated by
several factors, including the weak U.S.
recovery (Colombia’s main trading partner)
and continuing adverse weather conditions.
The authorities also noted that the latest
surveys of consumer confidence and indicators
of activity in the industrial and construction
sectors supported the view of moderation in
growth in the second half of 2011.
17. The authorities considered that their
macropolicy stance for 2011 would keep
domestic demand pressures in check. They
envisage to continue raising the policy rate
until it reaches a neutral level (the market
consensus estimate of which is between
4.75 and 5.25 percent),7 and broadly adhering
to the fiscal targets announced recently in their
medium-term fiscal framework (i.e., a central
government deficit of 4.0 percent of GDP and a
combined public sector deficit of 3.4 percent of
GDP). The authorities noted that the planned
government spending contained one-off
outlays of an emergency nature for relief and
reconstruction of about 0.5 percent of GDP, and
that measures of the fiscal stance excluding these
items did not suggest that fiscal policy would be
expansionary in 2011. They also noted that the
monetary tightening underway had already
maintained indicators of inflation expectations
for end-2012 within the official inflation target
range.
7 Since February, the central bank has raised the policy rate five times, as of mid-June the rate stood at 4.25 percent.
COLOMBIA 2011 ARTICLE IV REPORT
INTERNATIONAL MONETARY FUND 19
18. Staff argued that a more ambitious
fiscal target for 2011 would be advisable to
rebalance the policy mix and guard against
possible overheating pressures in the latter
part of the year. Staff noted that normal lags
in the operation of fiscal policy implied that
government spending would continue to
support domestic demand until the first part of
2012, and thus would put undue pressure on
monetary policy if private demand growth
were to exceed expectations or if capital
inflows were to intensify in the coming
months. The authorities did not think that the
lags in fiscal policy would have a material
effect in light of the balance of risks facing
Colombia, but they noted that investment
spending so far in 2011 was below budgeted
levels and saw a possibility that the year-end
deficit for the central government would be
below 3.8 percent of GDP. They also saw scope
for saving any overperformance in central
government revenues that may arise in the
remainder of the year.
19. The authorities indicated that their
policy response to a possible surge in
capital inflows would be geared at
mitigating risks to financial stability. They
emphasized that the bulk of the inflows in the
current episode had been related to large FDI
projects and noted that their program of pre-
announced daily purchases of foreign
exchange had helped contain appreciating
pressures and massive portfolio inflows
without creating balance sheet vulnerabilities.
They also underscored, however, that if capital
inflows were to endanger financial stability
through, for example, excessive leveraging,
they would consider tightening
macroprudential measures (Box 4) and
reintroducing capital flow management (CFMs)
tools used in previous episodes of large capital
inflows.8 Staff noted that the current coverage
of macroprudential measures was broad and
adequate and that CFMs could be useful as
part of a transitory response to an unexpected
surge in inflows. Staff emphasized, however,
that a tighter fiscal stance would have to be
the main element of the policy response in
that scenario.
20. The authorities agreed on the need
to remain vigilant of credit market
developments to keep balance sheet risks
under control. They noted that they were
supervising closely the financial system,
particularly individual banks’ loan portfolios
and liquidity and asset markets, to detect and
prevent large exposures. Staff underscored the
need to monitor corporate and household
balance sheets, especially for any currency
mismatches stemming from the pickup in
8 In 2007, in the context of large capital inflows and rapid credit growth, the central bank introduced marginal reserve requirements on domestic deposits and increased loan provisioning requirements. In addition, it placed unremunerated reserve requirements (URR) on foreign borrowing and portfolio inflows of all maturities. The URRs were successful in altering the composition of capital inflows (reducing foreign borrowing and non-resident portfolio inflows), though they did not appear to have had a significant impact on the volume of total inflows.

2011 ARTICLE IV REPORT COLOMBIA
20 INTERNATIONAL MONETARY FUND
Box 4. Macroprudential Policies Colombia has in place a broad set of macroprudential tools that is more extensive than in their regional peers. For the most part, the authorities have used micro-prudential tools to control macroprudential risks. These include those aimed at limiting the exposure of financial intermediaries to specific risks (e.g., loan-to-value ratio limits) to increase resilience to shocks and those geared towards reducing the overall amplitude of financial cycles (e.g., dynamic provisioning) that would provide for a more stable credit supply. A legal mandate for macroprudential policy has not been established, which is the current practice in many countries in the region. Four institutions constitute the financial stability
committee—the central bank, the Superintendencia Financiera (SF), the Ministry of Finance and the Deposit Insurance Agency. The Ministry of Finance is the regulator for the entire financial system, and the SF is the primary supervisor for the financial system. The central bank adheres to a financial stability mandate (although this is not codified in the law); regulates the foreign exchange system and is the lender of last resort. The deposit insurance agency implements decisions taken by the SF on intervened deposit-taking institutions. This committee has recently redoubled efforts to coordinate and facilitate information exchange. Each of the four institutions retains its micro-prudential responsibility to: identify risk, implement and enforce policies, and report to Congress.
Macroprudential Tools in Latin America
Tool / Country Brazil Chile Colombia Mexico Peru Cap on loan to value ratio Debt to income limit Ceiling on credit growth Limit on FX net open position Limit on maturity mismatch Countercyclical capital requirement Dynamic provisioning Restriction on banks’ profit distribution
Macroprudential Tools in Colombia
Tool Introduced Details Loan-to-value ratio limits 1999 Applies to mortgage borrowers; set at 70 percent.
Debt-to-income limits 1999 Applies to mortgage borrowers; monthly debt service limited to 30 percent of disposable income.
Real credit growth caps 1992 Applies to banks; limited to 20 percent; usage limited to 120 days per year.
Foreign-currency position limits in cash
1999 Limit is 50 percent of capital plus reserves and cannot be negative.
Foreign-currency position limits
1999 Long (short) limit is 20 percent (-5 percent) of capital plus reserves.
Dynamic Provisioning 2007 Introduced for commercial (2007) and consumption (2008) loans. Application to mortgage and micro-credit loans is pending.
Restriction on banks’ profit distribution
2008 At end-2008, banks reached agreement with the SF to retain a portion of their 2008 profits as an additional capital buffer. Amounts determined for each institution were based on systemic importance.
Limit on off balance sheet positions
2007 Applies to banks. Gross open positions in derivative products is 550 percent of capital plus reserves.

COLOMBIA 2011 ARTICLE IV REPORT
INTERNATIONAL MONETARY FUND 21
capital inflows to these sectors. There was
agreement that changes observed in banks’
funding sources and liquidity composition in
recent months deserved special attention.
B. Strengthening the Medium-Term Fiscal Framework
21. Discussions focused on the key
elements of the government’s strategy to
strengthen further Colombia’s sound fiscal
framework and on the medium-term fiscal
path. The centerpiece of the authorities’
strategy is a fiscal rule for the central
government that was approved by Congress in
June 2011. The rule aims at enhancing fiscal
discipline to reduce the nation’s debt burden
and facilitate countercyclical fiscal policy,
mainly through improved management of
windfall commodity revenues.9 The main
features of the rule are:
Set a path for fiscal consolidation that
lowers the structural deficit to 2.3 percent
of GDP in 2014, and keeps it below
1 percent of GDP from 2022 onwards.
Allow fiscal expansion when the expected
output growth rate is at least two
9 The plan to adopt a fiscal rule was formulated by the previous government and discussed during the 2010 Article IV Consultation. At that time, staff recommended that the fiscal rule cover the consolidated public sector to better anchor the overall debt target, and that the government set an ambitious fiscal target to create fiscal space quickly. The authorities opted for a fiscal rule focused on the central government on the grounds that it was preferable to define the targets on variables that were under the direct control of the government.
percentage points lower than the long-
term growth rate.10
Create a national sovereign wealth fund
(SWF) to save windfall revenue from
natural resources.
22. The fiscal framework was further
strengthened by constitutional
amendments approved in June. These
included: (i) adding fiscal sustainability as a
“constitutional criterion” (to limit the impact of
fiscally costly rulings of the constitutional
court); and (ii) reforming the system of
royalties to achieve a more equitable
distribution of royalty payments across regions
and to save a portion of such royalties in a
sub-national savings and stabilization fund.
23. The authorities noted their
commitment to undertake significant fiscal
consolidation during the next three years to
lower the central government deficit below
2½ percent of GDP. The bulk of the
consolidation is expected to come from
expenditure restraint mainly through:
(i) control over goods and services
10 The rule also allows for countercyclical fiscal policy in cases of emergencies and/or large shocks to macroeconomic stability.
2011 ARTICLE IV REPORT COLOMBIA
22 INTERNATIONAL MONETARY FUND
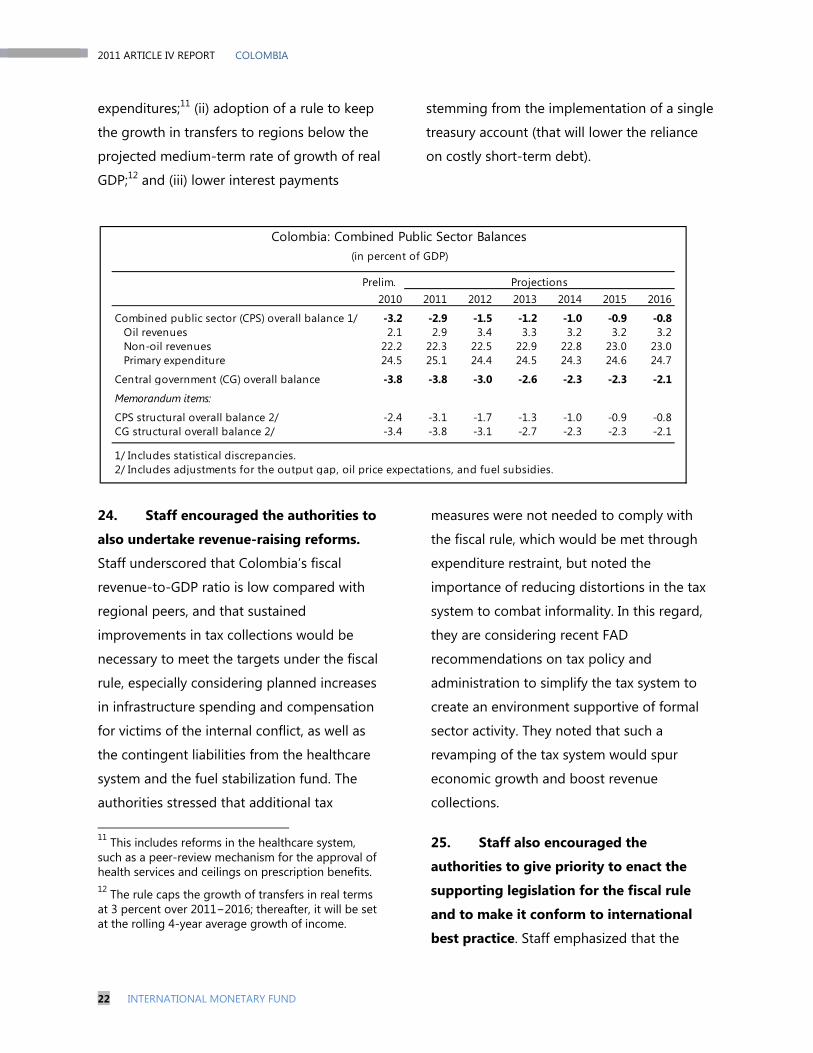
expenditures;11 (ii) adoption of a rule to keep
the growth in transfers to regions below the
projected medium-term rate of growth of real
GDP;12 and (iii) lower interest payments
stemming from the implementation of a single
treasury account (that will lower the reliance
on costly short-term debt).
24. Staff encouraged the authorities to
also undertake revenue-raising reforms.
Staff underscored that Colombia’s fiscal
revenue-to-GDP ratio is low compared with
regional peers, and that sustained
improvements in tax collections would be
necessary to meet the targets under the fiscal
rule, especially considering planned increases
in infrastructure spending and compensation
for victims of the internal conflict, as well as
the contingent liabilities from the healthcare
system and the fuel stabilization fund. The
authorities stressed that additional tax
11 This includes reforms in the healthcare system, such as a peer-review mechanism for the approval of health services and ceilings on prescription benefits. 12 The rule caps the growth of transfers in real terms at 3 percent over 2011−2016; thereafter, it will be set at the rolling 4-year average growth of income.
measures were not needed to comply with
the fiscal rule, which would be met through
expenditure restraint, but noted the
importance of reducing distortions in the tax
system to combat informality. In this regard,
they are considering recent FAD
recommendations on tax policy and
administration to simplify the tax system to
create an environment supportive of formal
sector activity. They noted that such a
revamping of the tax system would spur
economic growth and boost revenue
collections.
25. Staff also encouraged the
authorities to give priority to enact the
supporting legislation for the fiscal rule
and to make it conform to international
best practice. Staff emphasized that the
Colombia: Combined Public Sector Balances(in percent of GDP)
Prelim. Projections2010 2011 2012 2013 2014 2015 2016
Combined public sector (CPS) overall balance 1/ -3.2 -2.9 -1.5 -1.2 -1.0 -0.9 -0.8Oil revenues 2.1 2.9 3.4 3.3 3.2 3.2 3.2Non-oil revenues 22.2 22.3 22.5 22.9 22.8 23.0 23.0Primary expenditure 24.5 25.1 24.4 24.5 24.3 24.6 24.7
Central government (CG) overall balance -3.8 -3.8 -3.0 -2.6 -2.3 -2.3 -2.1
Memorandum items:
CPS structural overall balance 2/ -2.4 -3.1 -1.7 -1.3 -1.0 -0.9 -0.8CG structural overall balance 2/ -3.4 -3.8 -3.1 -2.7 -2.3 -2.3 -2.1
1/ Includes statistical discrepancies.2/ Includes adjustments for the output gap, oil price expectations, and fuel subsidies.
COLOMBIA 2011 ARTICLE IV REPORT
INTERNATIONAL MONETARY FUND 23
oversight committees responsible for
developing and monitoring the
methodologies to be used in the computation
of the fiscal rule (e.g., the structural fiscal
balance and potential output) had to be
independent of the political process and
subject to strict requirements of transparency.
Staff also stressed that reforms to public
financial management and the budgetary
process were necessary to make the rule
operational (including integrating a medium-
term expenditure framework into the budget
process). The authorities underscored that the
supporting legislation will be ready in time for
the 2012 budget, and said that they were
confident that the decisions on key
parameters of the rule would be shielded
from political influences (noting that the
inclusion of congressional representatives on
the oversight committees was important for
consensus building on fiscal consolidation).
They also noted that they are seeking
assistance from the IMF to improve budgetary
processes.
26. Staff supported the royalty reform
recently passed in Congress and welcomed
plans to establish a national sovereign
wealth fund (SWF) to save windfall fiscal
revenues. Staff noted, however, that the
revenue projections underlying the fiscal
targets under the rule did not seem to leave
much room for windfalls. Staff underscored
that in order to accumulate resources in the
SWF in the next few years, the fiscal strategy
had to contemplate higher revenues and/or
stricter expenditure restraint than those
assumed in the government’s fiscal
consolidation path. The authorities considered
that a more ambitious fiscal consolidation was
not politically feasible and would delay the
investments necessary to reduce the country’s
infrastructure deficit.
27. Staff expressed concern about the
continued delays in developing a strategy
to address significant contingent liabilities
of the healthcare and pension systems.13
The authorities shared staff’s concern about
the long-run viability of the healthcare and
pension systems, but noted that reforming
those systems required time to build a social
consensus, and that more time was needed to
prepare Colombian society to concentrate on
this matter.
13 Unfunded liabilities from these systems are estimated to be in the order of 200 percent of GDP (in present value terms).
2011 ARTICLE IV REPORT COLOMBIA
24 INTERNATIONAL MONETARY FUND
C. Monetary, Exchange Rate, and Reserve Management Policies
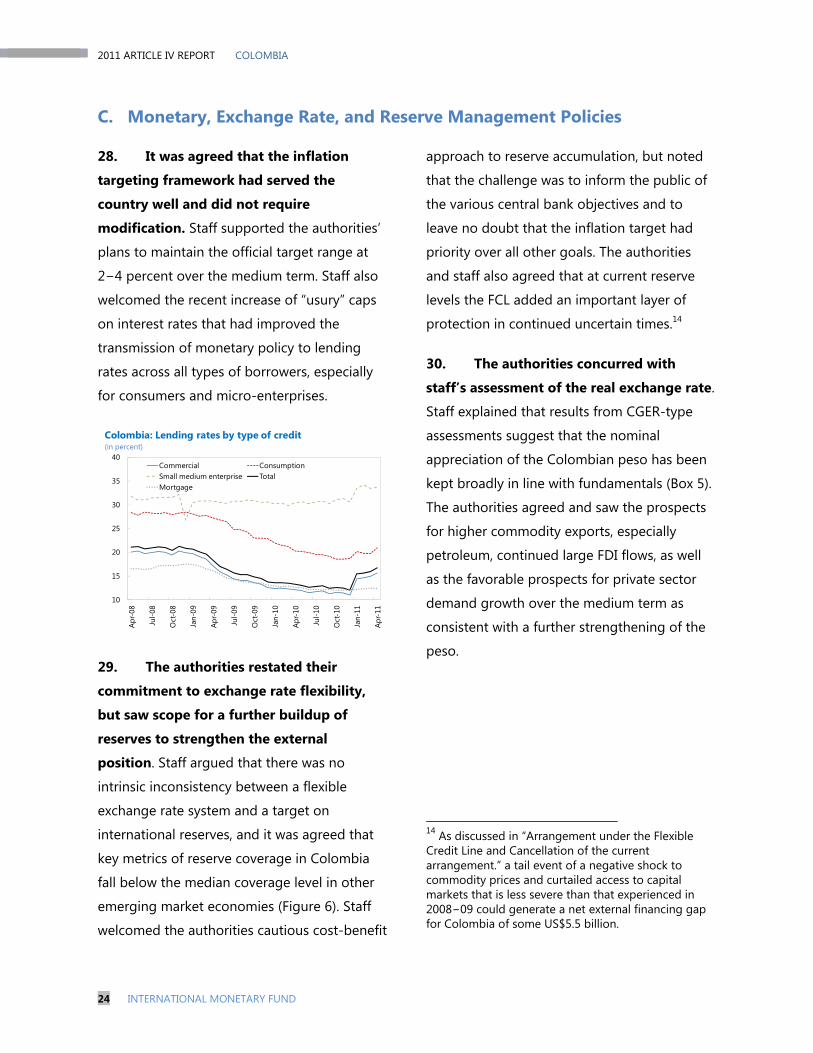
28. It was agreed that the inflation
targeting framework had served the
country well and did not require
modification. Staff supported the authorities’
plans to maintain the official target range at
2−4 percent over the medium term. Staff also
welcomed the recent increase of “usury” caps
on interest rates that had improved the
transmission of monetary policy to lending
rates across all types of borrowers, especially
for consumers and micro-enterprises.
29. The authorities restated their
commitment to exchange rate flexibility,
but saw scope for a further buildup of
reserves to strengthen the external
position. Staff argued that there was no
intrinsic inconsistency between a flexible
exchange rate system and a target on
international reserves, and it was agreed that
key metrics of reserve coverage in Colombia
fall below the median coverage level in other
emerging market economies (Figure 6). Staff
welcomed the authorities cautious cost-benefit
approach to reserve accumulation, but noted
that the challenge was to inform the public of
the various central bank objectives and to
leave no doubt that the inflation target had
priority over all other goals. The authorities
and staff also agreed that at current reserve
levels the FCL added an important layer of
protection in continued uncertain times.14
30. The authorities concurred with
staff’s assessment of the real exchange rate.
Staff explained that results from CGER-type
assessments suggest that the nominal
appreciation of the Colombian peso has been
kept broadly in line with fundamentals (Box 5).
The authorities agreed and saw the prospects
for higher commodity exports, especially
petroleum, continued large FDI flows, as well
as the favorable prospects for private sector
demand growth over the medium term as
consistent with a further strengthening of the
peso.
14 As discussed in “Arrangement under the Flexible Credit Line and Cancellation of the current arrangement.” a tail event of a negative shock to commodity prices and curtailed access to capital markets that is less severe than that experienced in 2008−09 could generate a net external financing gap for Colombia of some US$5.5 billion.
10
15
20
25
30
35
40
Apr-
08
Jul-0
8
Oct
-08
Jan-
09
Apr-
09
Jul-0
9
Oct
-09
Jan-
10
Apr-
10
Jul-1
0
Oct
-10
Jan-
11
Apr-
11
Commercial ConsumptionSmall medium enterprise TotalMortgage
Colombia: Lending rates by type of credit (in percent)

COLOMBIA 2011 ARTICLE IV REPORT
INTERNATIONAL MONETARY FUND 25
Figure 6. Colombia: Reserve Coverage in International Perspective 1/
Sources: World Economic Outlook and IMF staff estimates.1/ Estimates for 2010. Figures for Mexico and Poland do not include resources available under their FCL arrangements. The new reserve metric in "Assessing Reserve Adequacy" for Colombia stands at 181 percent, compared with a suggested adequacy range of 100-150 percent.2/ GIR at the end of 2010 in percent of ST debt at remaining maturity and current account deficit in 2011. The current account is set to zero if it is in surplus.
0
10
20
30
40
50
60
70
80
90
0
10
20
30
40
50
60
70
80
90LB
NTH
AJO
R ISL
MYS
BGN
SER
ISR
LVA
RUS
PHL
PER
ROM
UKR
TUN
CZE
MAR HR
VBI
HLT
YPO
LUR
YIN
DKA
ZEG
YJA
MCH
LBR
AAR
GES
TID
NGT
M CRI
VNM
SLV
MEX TUR
LKA
ZAF
VEN
COL
PAN
PAK
DOM
ECU
GIR 500 percent of IMF quota
Median
0
10
20
30
40
50
60
70
80
90
0
10
20
30
40
50
60
70
80
90
PER
SER
ROM
LVA
PHL
RUS
JAM
BGN ISR
URY
UKR
THA
ARG
POL
JOR
LTY
VEN
BIH
IDN
TUN
CHL
GTM
HRV
LKA
CZE
LBN
SLV
MYS
COL
CRI
PAK
MAR EG
YIN
DTU
RBR
ADO
MM
EX ZAF
ECU
PAN
VNM
GIR 500 percent of IMF quota
GIR to Broad Money, 2010(in percent)
Median
0
50
100
150
200
250
300
350
400
450
500
0
50
100
150
200
250
300
350
400
450
500
THA
JOR
PHL
RUS
PER
MYS EG
YM
AR PAK
LKA
MEX IND
KAZ
BRA
COL
VEN
IDN
SER
BIH
JAM
CHL
GTM
URY
VNM
ROM
TUN
CRI
BGN
SLV
POL
ZAF
UKR
PAN
HRV
LBN
LTY
TUR
ECU
LVA
ARG
DOM EST
GIR 500 percent of IMF quota
GIR to Short-term external debt at remaining maturity (2010) plus current account deficit (2011) 2/ (in percent)
Median
GIR to GDP, 2010(in percent)
2011 ARTICLE IV REPORT COLOMBIA
26 INTERNATIONAL MONETARY FUND
Box 5. Exchange Rate Assessment
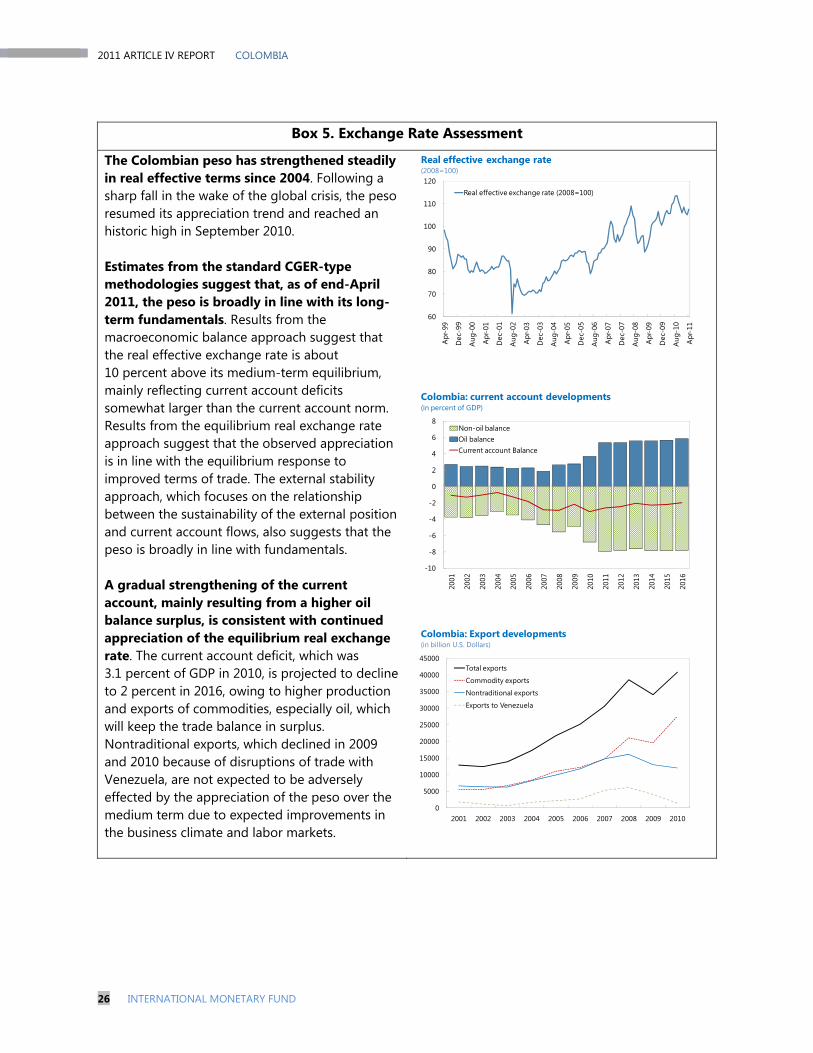
The Colombian peso has strengthened steadily in real effective terms since 2004. Following a sharp fall in the wake of the global crisis, the peso resumed its appreciation trend and reached an historic high in September 2010. Estimates from the standard CGER-type methodologies suggest that, as of end-April 2011, the peso is broadly in line with its long-term fundamentals. Results from the macroeconomic balance approach suggest that the real effective exchange rate is about 10 percent above its medium-term equilibrium, mainly reflecting current account deficits somewhat larger than the current account norm. Results from the equilibrium real exchange rate approach suggest that the observed appreciation is in line with the equilibrium response to improved terms of trade. The external stability approach, which focuses on the relationship between the sustainability of the external position and current account flows, also suggests that the peso is broadly in line with fundamentals. A gradual strengthening of the current account, mainly resulting from a higher oil balance surplus, is consistent with continued appreciation of the equilibrium real exchange rate. The current account deficit, which was 3.1 percent of GDP in 2010, is projected to decline to 2 percent in 2016, owing to higher production and exports of commodities, especially oil, which will keep the trade balance in surplus. Nontraditional exports, which declined in 2009 and 2010 because of disruptions of trade with Venezuela, are not expected to be adversely effected by the appreciation of the peso over the medium term due to expected improvements in the business climate and labor markets.
60
70
80
90
100
110
120
Apr
-99
Dec
-99
Aug
-00
Apr
-01
Dec
-01
Aug
-02
Apr
-03
Dec
-03
Aug
-04
Apr
-05
Dec
-05
Aug
-06
Apr
-07
Dec
-07
Aug
-08
Apr
-09
Dec
-09
Aug
-10
Apr
-11
Real effective exchange rate (2008=100)
Real effective exchange rate(2008=100)
-10
-8
-6
-4
-2
0
2
4
6
8
2001
2002
2003
2004
2005
2006
2007
2008
2009
2010
2011
2012
2013
2014
2015
2016
Non-oil balanceOil balance Current account Balance
Colombia: current account developments(in percent of GDP)
0
5000
10000
15000
20000
25000
30000
35000
40000
45000
2001 2002 2003 2004 2005 2006 2007 2008 2009 2010
Total exports
Commodity exports
Nontraditional exports
Exports to Venezuela
Colombia: Export developments (in billion U.S. Dollars)

COLOMBIA 2011 ARTICLE IV REPORT
INTERNATIONAL MONETARY FUND 27
31. Staff confirmed that there have
been no changes in Colombia’s exchange
restrictions since the last Article IV
consultation. The retention of the multiple
currency practice and exchange restriction
arising from a tax on outward remittances of
nonresident profits earned before 2007 has
been approved until December 31, 2011 and
the measure will be fully phased out on
January 1, 2012. Staff encouraged the
authorities to set a timetable for the removal
of the exchange restriction arising from the
special regime for the hydrocarbon sector. The
authorities said they will reassess this
restriction.
D. Financial Sector Oversight
32. Financial sector supervision is solid,
and will be strengthened by the recently
released Financial Superintendency
Roadmap. The roadmap (released in April)
covers the period 2011−14 and strengthens
the coordination for information exchange,
bank resolution, the design of financial and
macroprudential regulation among the
different entities with regulatory and
supervisory responsibilities, upgrades the
supervisory process, and improves
consolidated supervision (for example, by
increasing cross-border collaboration with
other supervisors).
Reference period Apr-11(deviations from
equilibrium, in percent)MethodologyMacrobalance 10External stability -1Equilibrium exchange rate 2Average 4
Change in exchange rateRef period to proj date 2.42010 average to ref period -0.62010 average to proj date 1.8
Source: Fund staff estimates
Colombian Peso: Equilibrium Assessments
Colombia 18.0 Uruguay 1.0 Mexico 200.7 Colombia 3.9 Colombia 27.2Brazil 17.8 Mexico 2.0 Colombia 2/ 174.0 Peru 2.4 Peru 24.3Mexico 16.9 Peru 2.6 Brazil 171.1 Brazil 2.1 Brazil 21.7Uruguay 15.2 Chile 2.7 Peru 141.9 Mexico 1.8 Chile 20.7Peru 14.4 Colombia 2/ 2.9 Chile 92.7 Chile 1.7 Mexico 16.8Chile 14.1 Brazil 3.1 Uruguay 72.2 Uruguay 1.2 Uruguay 12.1
Source: GFSR Statistical Appendix. December 2010 data. 1/ Bank regulatory capital to risk-weighted assets. 2/ NPL definition for Colombia is 30 days delinquent.
Financial Soundness Indicators, 2010 (in percent)Capital to RWA 1/ NPLs to Total Loans Provisions to NPL Return on Assets Return on Equity

2011 ARTICLE IV REPORT COLOMBIA
28 INTERNATIONAL MONETARY FUND
The roadmap also proposes to enhance the
independence and legal protection of financial
regulators, but progress on this front will
require legislative approval. An FSAP update is
planned for early 2013.16
33. Assessing financial soundness and
other steps needed for implementing
Basel III terms is in its early stages. The
authorities noted that Colombian banks’
solvency is strong and the quality of their
capital is good (as shown during the recent
global crisis), and that they are just beginning
to assess the quality of banks’ capital and
liquidity according to Basel III standards. Staff
urged the authorities to move ahead quickly
with their analysis to expedite a decision on
adopting Basel III. The authorities expressed
some concern that full adoption of Basel III
requirements could negatively affect financial
deepening in the country.
34. Colombia’s financial sector has
taken important steps in the area of
AML/CFT. Colombia is member of the
Financial Action Task Force of South America
(GAFISUD) and is characterized as having strict
AML/CFT practices in the financial sector. The
superintendency implements a risk-based
approach to AML/CFT supervision and
provides advice and assistance to the
Superintendencia de Economia Solidaria so that
cooperatives enhance compliance with AML
directives. A recently issued Circular aims to
increase the compliance of cooperatives with
regard to AML/CFT customer due diligence.
E. Improving Labor Market Performance
35. Labor market conditions have been
improving, but significant challenges
remain. The government has set a target of
reducing unemployment to 8.5 percent by
2014. To help attain this goal, legislation was
passed in December 2010 establishing a
temporary payroll tax break for small and
medium-term enterprises to promote
formalization and encourage youth
employment. Staff welcomed this initiative to
improve labor market flexibility, but
15 The last FSAP update was carried out in September–October 2004 and the FSSA was discussed by the Board in April, 2005 (“Colombia—Financial System Stability Assessment”).
underscored that the main hindrances to
formal employment are the relatively high
minimum wage and burdensome taxes and
charges levied on firms.
36. Staff recommended a sweeping
reform of labor tax legislation as part of the
broader reform of the tax system and
adopting mechanisms to ensure that
minimum wage adjustments do not exceed
target inflation. Staff argued that the
additional revenue from a tax reform should
be designed to be sufficient to cover the
special funds and programs (e.g., for
retraining) that are presently funded by
specific labor taxes. Staff also noted that the

COLOMBIA 2011 ARTICLE IV REPORT
INTERNATIONAL MONETARY FUND 29
current tax system and sharp rise of minimum
wages was hurting competitiveness. The
authorities agreed that reducing labor taxes
would be beneficial, but argued that larger
gains in competitiveness would stem from
improvements in infrastructure, policies to
develop the agriculture sector, free trade
agreements, and simplifying the tax burden for
firms.
STAFF APPRAISAL
37. The Colombian economy proved
resilient to the global financial crisis and a
solid recovery is underway. The recovery was
appropriately supported by expansionary
monetary and fiscal policies. However, the
output gap is expected to close in a matter of
months and, with the balance of risks tilted to
the upside, the normalization of macropolicies
has to become a priority.
38. The fiscal policy stance envisaged
for 2011 carries the risk of yielding
excessive stimulus in 2012. Staff recognizes
that budget rigidities and infrastructure needs,
in part related to flooding damage, limit the
scope to tighten the fiscal stance in the second
half of the year. Notwithstanding this,
domestic demand momentum in a context of
limited slack in the economy is a serious
concern, and the authorities are encouraged to
exercise the maximum expenditure restraint
feasible in the remainder of the year. The
authorities’ intention to save any revenue
overperformance is welcome, but may not be
sufficient to slow down demand in time.
39. The pace of monetary tightening
envisaged for 2011 strikes the right balance
between restraining credit growth and
mitigating incentives for further capital
inflows. Inflation expectations remain within
the official target range, and markets expect
that the policy rate will rise a few more basis
points to its neutral level before end 2011.
Staff welcomes the authorities’ unwavering
commitment to attaining the inflation target
and preserving financial stability.
40. Nonetheless there is a risk that a
sudden acceleration of domestic demand
places an additional burden on monetary
policy in the coming months. The strategy of
supplementing the flexible exchange rate with
an intervention program of pre-announced
purchases has worked reasonably well, but has
limitations. Staff welcomes the authorities’
0
200
400
600
800
1000
1200
1400
1990 1992 1994 1996 1998 2000 2002 2004 2006 2008 2010
Prices
Minimum Wage
Colombia: Minimum Wage and Inflation(Index 1990=100)
Sources: Staff estimates.

2011 ARTICLE IV REPORT COLOMBIA
30 INTERNATIONAL MONETARY FUND
plans to consider other policies (including
strengthened macroprudential regulations and
capital flow management policies) if capital
inflows are seen as likely to endanger financial
stability. Staff also underscores that a
tightening of the fiscal stance would have to
be part of the policy response to a possible
surge in capital inflows.
41. Colombia’s reserve position appears
adequate, but it could be somewhat larger.
Staff welcomes that the recent buildup in
reserves has been carried out in a transparent
fashion without compromising exchange rate
flexibility and monetary policy objectives.
Indicators of reserve adequacy suggest that
Colombia’s current level is comfortable, but a
larger reserve buffer could help mitigate costs
of unexpected financial or capital account
shocks.
42. Colombia’s fiscal framework will be
strengthened by the reforms taken in the
last year. The fiscal rule for the central
government, the incorporation of fiscal
sustainability as a constitutional criterion, and
the reform of the royalties system are all
positive steps for ensuring a sound fiscal
position going forward. In staff’s view the
necessary next step should consist of a
revenue reform focused on broadening the tax
base, including by eliminating exemptions and
lowering the number of rates of the VAT. Such
a reform will encourage formalization in the
economy and allow for more ambitious
medium-term fiscal targets and a faster build
up of resources in the new national sovereign
wealth fund. Staff encourages the authorities
to start developing a strategy to address
contingent liabilities stemming from
Colombia’s pension and healthcare systems.
43. Colombia’s financial sector oversight
is solid, and plans to strengthen cross-
border and consolidated supervision are
welcome. Staff recommends adopting a more
ambitious timetable for completing the
analysis of the composition of bank capital and
liquidity under Basel III. Close monitoring of
foreign borrowing activities by banks and
corporates is also necessary.
44. Steep taxation of labor and a
relatively high minimum wage are
significant hindrances to Colombia’s
competitiveness. Staff urges that the
authorities build on the recent labor market
reform for first-time employees to lower the
costs of formal employment and help to begin
reducing the high rate of informality. Staff also
supports the authorities’ plans to expand
business opportunities as a cornerstone of its
efforts to reduce informality. In addition, staff
recommends reducing the tax burden on labor
earmarked for special funds and to support
them through general budget allocations, as
well as establishing prudent limits to minimum
wage increases.
45. There have been no changes in
Colombia’s exchange restrictions since the
last Article IV consultation. Staff does not
recommend approval of the retention of the
COLOMBIA 2011 ARTICLE IV REPORT
INTERNATIONAL MONETARY FUND 31
restriction arising from the special regime for
the hydrocarbon sector, since there is no
timetable for its removal.
46. It is recommended that the next
Article IV consultation be held on the 12-
month cycle.

2011 ARTICLE IV REPORT COLOMBIA
32 INTERNATIONAL MONETARY FUND
Table 1. Colombia: Selected Economic and Financial Indicators
I. Social and Demographic Indicators
Population (millions), 2009 45.0 Physicians (per 100,000 people), 2008 143.0GDP, 2010 Adult illiteracy rate (ages 15 and older), 2007 6.9 per capita (US$) 4,943 Gross primary school enrollment rate, 2008 119.9 in billions of Col$ 546,951 Sustainable access to safe water, 2006 in billions of US$ 289.4 (percent of population) 93.0Unemployment rate, March 2011 (percent) 10.8 Gini index, 2009 57.8Life expectancy at birth (years), 2008 73.0 Poverty rate ($2 a day (PPP)), 2009 18.0Under 5 mortality rate (per 1,000 live births), 2008 20.6 Extreme poverty rate ($1 a day (PPP)), 2009 8.0
II. Economic Indicators
Prelim. Projections2007 2008 2009 2010 2011 2012
National income and pricesReal GDP 6.9 3.5 1.5 4.3 4.9 4.5GDP deflator 5.0 7.8 4.2 3.1 5.7 2.9Consumer prices (average) 5.5 7.0 4.2 2.3 3.3 2.9Consumer prices (end of period) 5.7 7.7 2.0 3.2 3.1 3.1
External sector (on the basis of US$)Exports (f.o.b.) 21.4 26.0 -11.7 19.8 34.5 5.5Imports (f.o.b.) 25.4 20.5 -16.2 22.7 25.8 5.9Terms of trade (deterioration -) 3.0 11.0 -30.7 14.7 17.1 -2.2Real effective exchange rate (depreciation -) 7.7 0.4 5.2 5.5 ... ...
Central governmentRevenue 14.8 16.0 2.8 -2.8 16.7 13.0Expenditure 9.9 12.9 13.6 -1.9 15.2 7.1
Money and credit Broad money 17.4 18.5 8.1 11.5 17.6 13.3Credit to the private sector 25.6 14.0 0.9 16.8 20.9 13.5Interest rate (90-day time deposits; percent per year) Nominal 9.0 10.1 4.1 3.5 … … Real 3.3 2.4 2.1 0.3 … …
Central government balance -2.7 -2.3 -4.1 -3.8 -3.8 -3.0Combined public sector balance 1/ -0.7 -0.1 -2.7 -3.2 -2.9 -1.5
Public debt 2/ 32.7 30.8 36.3 36.4 35.9 34.7Public debt, excluding Ecopetrol 32.7 30.8 35.3 35.2 34.5 33.2
Gross domestic investment 23.0 23.4 22.7 22.5 22.9 23.0Gross national savings 20.2 20.5 20.5 19.4 20.3 20.6Current account (deficit -) -2.9 -2.9 -2.2 -3.1 -2.6 -2.5
External debt 21.2 19.7 22.9 22.4 22.9 23.3 Of which: public sector 13.7 12.5 15.9 13.6 14.0 14.6GIR in percent of short-term debt 198.7 207.3 244.4 183.7 174.0 181.2
External debt service 39.2 32.0 37.9 30.2 32.7 35.2 Of which: public sector 15.6 12.7 11.7 11.0 8.9 9.5 Of which: Interest payments 9.2 7.7 8.1 7.6 7.4 6.5 Of which: public sector 6.4 5.5 5.7 5.4 4.8 4.2
Changes in GIR 5,498 3,065 1,321 3,086 3,725 1,948Exports (f.o.b.) 30,577 38,534 34,026 40,777 54,861 57,870 Of which: Petroleum products 7,318 12,204 10,254 16,483 25,679 27,319 Of which: Coffee 1,714 1,883 1,543 1,884 3,300 3,457Gross official reserves (US millions) 20,607 23,672 24,992 28,078 31,803 33,751
Share of ST debt at remaining maturity + CA deficit 119 143 130 119 119 129In months of imports of goods and services 5.5 7.4 6.4 5.8 6.2 6.2
1/ Includes the quasi-fiscal balance of Banco de la República, Fogafin balance, net cost of financial system restructuring, and statistical discrepancy.
2/ Includes Ecopetrol and Banco de la República's outstanding external debt.
(Percentage changes, unless otherwise indicated)
(In percent of GDP)
(In percent of exports of goods and services)
(In millions of U.S. dollars)
Sources: Colombian authorities; UNDP Human Development Report; World Development Indicators; and Fund staff estimates and projections.

COLOMBIA 2011 ARTICLE IV REPORT
INTERNATIONAL MONETARY FUND 33
Prelim.2007 2008 2009 2010 2011 2012 2013 2014 2015 2016
Current account balance -6,018 -6,923 -5,141 -8,944 -8,409 -8,377 -7,470 -8,737 -8,954 -8,499
Trade balance -584 971 2,546 2,136 6,256 6,421 7,375 6,446 6,267 7,132Exports, f.o.b. 30,577 38,534 34,026 40,777 54,861 57,870 62,315 65,063 68,300 73,438
Coffee 1,714 1,883 1,543 1,884 3,300 3,457 3,354 2,602 1,859 1,611Petroleum products 7,318 12,204 10,254 16,483 25,679 27,319 29,922 31,454 33,397 36,317Non-traditional 15,174 17,101 14,624 14,197 15,987 17,458 19,210 20,904 22,786 24,966Other 6,370 7,346 7,605 8,214 9,895 9,636 9,829 10,103 10,258 10,544
Imports, f.o.b. 31,161 37,563 31,479 38,641 48,605 51,450 54,941 58,617 62,033 66,305
Services (net) -2,647 -3,072 -2,809 -3,465 -4,026 -4,259 -4,506 -4,815 -5,123 -5,434
Income (net) -8,002 -10,333 -9,492 -12,096 -14,718 -14,913 -15,043 -15,427 -15,534 -16,038 Interest (net) -1,737 -2,067 -2,515 -2,991 -3,739 -3,206 -2,612 -2,286 -1,816 -1,324 Of which : public sector -1,284 -1,502 -1,779 -2,263 -2,500 -2,132 -1,848 -1,697 -1,452 -1,213 Other Income (net) -6,265 -8,266 -6,978 -9,105 -10,979 -11,708 -12,431 -13,140 -13,718 -14,714
Current transfers (net) 5,216 5,512 4,614 4,481 4,079 4,374 4,704 5,058 5,437 5,841
Financial account balance 10,347 9,492 6,254 11,879 12,134 10,325 9,355 10,495 10,649 10,433
Public sector (net) 2,198 -309 7,287 5,168 5,137 4,746 2,351 2,045 1,281 1,195Nonfinancial public sector 1,578 -45 6,512 5,039 4,745 4,740 2,097 1,948 1,313 1,274
Medium- and long-term (net) 1,298 998 6,383 1,338 5,305 4,749 2,105 1,957 1,321 1,282Disbursements 4,096 3,246 7,942 3,357 6,964 7,305 4,584 5,699 4,817 3,276Amortization 2,798 2,248 1,559 2,019 1,659 2,556 2,479 3,742 3,495 1,994
Other long-term flows -20 -1 -8 -8 -8 -8 -8 -8 -8 -8Short term 1/ 300 -1,042 138 3,709 -551 0 0 0 0 0
Financial public sector 620 -264 774 129 392 6 254 97 -32 -79
Private sector (net) 8,149 9,801 -1,033 6,711 6,997 5,579 7,004 8,450 9,368 9,238Nonfinancial private sector (net) 7,862 8,797 161 4,292 6,944 5,631 7,054 8,487 9,398 9,259
Direct investment 8,136 8,342 4,049 256 4,612 5,910 6,451 6,888 7,396 7,974Direct investment abroad 913 2,254 3,088 6,504 3,166 2,314 2,342 2,371 2,404 2,441Direct investment in Colombia 9,049 10,596 7,137 6,760 7,778 8,224 8,793 9,258 9,800 10,415o/w Gross inward direct investment … 17,798 16,324 18,133 20,863 22,060 23,587 24,835 26,286 27,937
Leasing finance 116 277 733 78 86 198 314 250 118 78Disbursements 656 1,004 1,797 1,025 810 853 913 974 1,021 1,089Amortization 540 726 1,064 946 725 655 599 725 904 1,011
Long-term loans 951 408 642 3,367 1,858 482 1,006 1,377 2,164 1,635Disbursements 3,031 2,263 3,365 6,433 5,574 5,307 6,036 8,262 12,987 9,808Amortization 2,080 1,854 2,724 3,065 3,716 4,825 5,030 6,885 10,822 8,173
Short term 2/ -1,342 -231 -5,263 590 388 -960 -717 -28 -281 -428
Financial private sector (net) 287 1,005 -1,194 2,419 53 -52 -50 -37 -29 -20
Valuation changes/Contribution to FLAR 3/ 800 442 -27 -50 0 0 0 0 0 0
Net errors and omissions 368 53 234 201 0 0 0 0 0 0
Changes in GIR 4/ 5/ 5,498 3,065 1,321 3,086 3,725 1,948 1,884 1,758 1,696 1,934
Memorandum Items: Current account balance (in percent of GDP) -2.9 -2.9 -2.2 -3.1 -2.6 -2.5 -2.1 -2.3 -2.2 -2.0Oil Price (Colombian mix) 66.2 90.2 56.6 73.1 98.4 97.4 94.2 92.1 91.4 91.1Gross international reserves (in US$ billion) 20.6 23.7 25.0 28.1 31.8 33.8 35.6 37.4 39.1 41.0Gross international reserves / (st debt at remaining maturity + ca deficit) 119.2 142.9 130.4 118.5 119.3 129.3 114.9 105.4 124.9 118.7Gross international reserves (months of imports of G&S) 5.5 7.4 6.4 5.8 6.2 6.2 6.1 6.1 6.0 6.3Nominal GDP (US$ billion) 210.6 235.7 234.2 289.4 321.5 339.9 363.4 382.9 405.3 430.7
Sources: Banco de la República; and Fund staff estimates and projections.
1/ Mainly deposit flows of public sector entities abroad.2/ Includes net portfolio investment.
5/ Figures for 2009 include SDR allocation to Colombia amounting to US$972 million.
Table 2. Colombia: Summary Balance of Payments
Projections
3/ FLAR is Fondo Latinoamericano de Reservas.
(In millions of U.S. dollars)
4/ IMF definition.

2011 ARTICLE IV REPORT COLOMBIA
34 INTERNATIONAL MONETARY FUND
Table 3a. Colombia: Operations of the Central Government 1/ (In percent of GDP)
Prel. Proj.2006 2007 2008 2009 2010 2011 2012 2013 2014 2015 2016
Total revenue 14.7 15.0 15.6 15.2 13.7 14.4 15.2 15.2 15.1 15.3 15.3
Current revenue 14.7 15.0 15.6 15.2 13.7 14.4 15.2 15.2 15.1 15.3 15.3Tax revenue 13.4 13.4 13.4 12.8 12.2 12.7 13.4 13.4 13.4 13.6 13.6
Net income tax and profits 2/ 5.5 5.6 5.1 5.5 4.9 5.1 5.7 5.7 5.7 5.5 5.5Goods and services 5.9 5.7 5.9 5.3 5.5 5.6 5.6 5.9 6.0 6.6 6.7
Value-added tax 5.6 5.4 5.6 5.1 5.2 5.4 5.3 5.7 5.8 6.4 6.4Gasoline tax 0.3 0.3 0.3 0.3 0.2 0.2 0.2 0.2 0.2 0.2 0.2
International trade 0.9 1.0 0.9 0.8 0.8 0.8 0.8 0.8 0.8 0.8 0.8Financial transaction tax 0.7 0.7 0.7 0.6 0.6 0.7 0.7 0.7 0.4 0.4 0.2Stamp and other taxes 0.3 0.5 0.8 0.5 0.4 0.4 0.6 0.3 0.5 0.2 0.4
Nontax revenue 1.3 1.6 2.2 2.4 1.5 1.7 1.7 1.7 1.7 1.7 1.7Property income 0.3 0.2 0.2 0.1 0.1 0.1 0.1 0.1 0.1 0.1 0.1Other 1.1 1.4 2.0 2.2 1.4 1.7 1.6 1.6 1.6 1.6 1.6
Total expenditure and net lending 18.1 17.7 17.9 19.2 17.5 18.2 18.2 17.8 17.4 17.5 17.4
Current expenditure 15.2 14.5 14.4 15.5 14.7 14.8 14.9 14.6 14.6 14.9 14.7Wages and salaries 2.1 2.0 2.0 2.1 2.1 2.1 2.1 2.0 1.9 1.9 1.8Goods and services 1.3 1.2 1.2 1.0 0.7 0.8 0.8 0.7 0.7 0.7 0.7Interest 3.6 3.7 3.2 3.0 2.7 2.9 2.7 2.6 2.4 2.2 2.1
External 1.0 0.9 0.8 0.8 0.7 0.8 0.6 0.5 0.5 0.4 0.4Domestic 2.6 2.8 2.4 2.2 2.0 2.1 2.1 2.1 1.9 1.8 1.7
Current transfers 8.2 7.6 8.0 9.4 9.2 9.0 9.2 9.3 9.5 10.1 10.1Of which : fuel subsidies 3/ 0.0 0.1 0.1 1.0 0.0 0.0 0.0 0.0 0.0 0.0 0.0
Capital expenditure 2.8 3.1 3.5 3.7 2.8 3.4 3.3 3.2 2.9 2.7 2.7Fixed capital formation 1.5 1.9 2.2 2.3 1.9 2.5 2.4 2.3 2.0 1.8 1.8Capital transfers 1.2 1.3 1.2 1.4 0.9 0.9 0.9 0.9 0.9 0.9 0.9
Net lending 0.1 0.1 0.0 0.0 0.0 0.0 0.0 0.0 0.0 0.0 0.0
Overall balance -3.4 -2.7 -2.3 -4.1 -3.8 -3.8 -3.0 -2.6 -2.3 -2.3 -2.1
Memorandum item: Oil-related revenues 4/ 0.9 1.1 1.2 2.3 0.7 1.0 1.5 1.6 1.5 1.5 1.5Overall structural balance 5/ -3.5 -3.1 -3.8 -2.5 -3.4 -3.8 -3.1 -2.7 -2.3 -2.3 -2.1Primary balance 0.2 1.0 0.9 -1.1 -1.1 -0.9 -0.3 0.0 0.1 0.0 0.1Nominal GDP (in COP billions) 383,898 431,072 481,037 508,532 546,951 606,418 652,062 710,157 759,410 814,051 875,075
Sources: Ministry of Finance; Banco de la República; and Fund staff estimates and projections.1/ Includes central administration only.2/ The increase in revenue of 0.8 percent of GDP in 2012 reflects almost entirely the elimination of the fixed asset tax credit, which was part of the end-2010 tax reform3/ Payments for fuel subsidies granted in 2007-08 were distributed across the 2007-2009 budgets. A fuel price stabilization fund was created at end-2008 to eliminate fuel subsidies.4/ Includes income tax payments and dividends from Ecopetrol corresponding to earnings from the previous year. 5/ Adjusts for the output gap, oil price projections, fuel subsidies, and one-off relief expenditures.

COLOMBIA 2011 ARTICLE IV REPORT
INTERNATIONAL MONETARY FUND 35
Prel. Proj.2006 2007 2008 2009 2010 2011 2012 2013 2014 2015 2016
Total revenue 56,350 64,705 75,059 77,156 74,957 87,467 98,839 107,800 114,659 124,236 134,065
Current revenue 56,350 64,705 75,059 77,156 74,957 87,467 98,839 107,800 114,659 124,236 134,065Tax revenue 51,278 57,866 64,349 65,196 66,781 76,873 87,582 95,411 101,640 110,495 119,180
Net income tax and profits 2/ 21,062 24,010 24,448 28,117 26,863 30,990 36,986 40,331 42,943 44,891 48,351Goods and services 22,750 24,589 28,352 27,202 30,039 33,955 36,460 41,823 45,655 54,067 58,210
Value-added tax 21,563 23,378 27,064 25,910 28,353 32,474 34,868 40,799 43,802 52,079 56,074Gasoline tax 1,187 1,212 1,288 1,291 1,335 1,480 1,592 1,734 1,854 1,987 2,136
International trade 3,493 4,260 4,292 4,001 4,265 5,016 5,399 5,873 6,360 6,816 7,369Financial transaction tax 2,672 2,990 3,200 3,121 3,390 4,487 4,824 5,254 2,885 3,092 1,749Stamp and other taxes 1,301 2,017 4,057 2,755 2,224 2,426 3,912 2,130 3,797 1,628 3,500
Nontax revenue 5,072 6,839 10,710 11,960 8,176 10,594 11,256 12,389 13,019 13,741 14,885Property income 977 766 986 758 527 584 628 684 731 784 842Other 4,095 6,074 9,724 11,201 7,649 10,010 10,628 11,705 12,288 12,957 14,043
Total expenditure and net lending 69,419 76,319 86,126 97,871 95,976 110,561 118,444 126,539 132,301 142,766 152,072
Current expenditure 58,366 62,501 69,360 78,899 80,186 89,600 96,842 103,954 110,562 121,100 128,782Wages and salaries 8,046 8,650 9,687 10,862 11,240 12,880 13,849 14,373 14,610 15,254 15,960Goods and services 5,026 5,304 5,723 5,296 3,775 4,559 4,903 5,162 5,520 5,714 5,923Interest 13,964 15,908 15,366 15,149 14,847 17,627 17,855 18,595 18,561 18,246 18,656
External 3,875 3,859 3,662 3,846 3,913 4,715 4,089 3,612 3,861 3,346 3,521Domestic 10,089 12,050 11,704 11,303 10,934 12,911 13,766 14,983 14,699 14,901 15,135
Current transfers 31,330 32,639 38,584 47,592 50,324 54,535 60,235 65,824 71,871 81,886 88,243Of which : fuel subsidies 3/ 0 220 660 4,906 0 0 0 0 0 0 0
Capital expenditure 10,640 13,560 16,601 18,796 15,576 20,659 21,439 22,585 21,739 21,666 23,290Fixed capital formation 5,917 7,991 10,734 11,536 10,473 15,214 15,583 16,207 14,920 14,356 15,432Capital transfers 4,723 5,570 5,867 7,260 5,103 5,446 5,856 6,377 6,820 7,310 7,858
Net lending 412 257 166 176 214 301 164 0 0 0 0
Overall balance -13,069 -11,614 -11,067 -20,715 -21,019 -23,094 -19,606 -18,739 -17,642 -18,531 -18,007
Memorandum item: Oil-related revenues 4/ 3,368 4,871 5,992 11,783 3,998 5,945 9,920 11,039 11,388 11,818 12,911Overall structural balance 5/ -13,555 -13,571 -18,268 -12,733 -18,651 -23,244 -20,177 -19,130 -17,842 -18,655 -18,105Primary balance 896 4,295 4,298 -5,566 -6,172 -5,467 -1,751 -144 919 -284 649
Sources: Ministry of Finance; Banco de la República; and Fund staff estimates and projections.1/ Includes central administration only.2/ The increase in revenue of 0.8 percent of GDP in 2012 reflects almost entirely the elimination of the fixed asset tax credit, which was part of the end-2010 tax reform3/ Payments for fuel subsidies granted in 2007-08 were distributed across the 2007-2009 budgets. A fuel price stabilization fund was created at end-2008 to eliminate fuel subsidies.4/ Includes income tax payments and dividends from Ecopetrol corresponding to earnings from the previous year. 5/ Adjusts for the output gap, oil price projections, fuel subsidies, and one-off relief expenditures.
Table 3b. Colombia: Operations of the Central Government 1/ (In COP Billions)
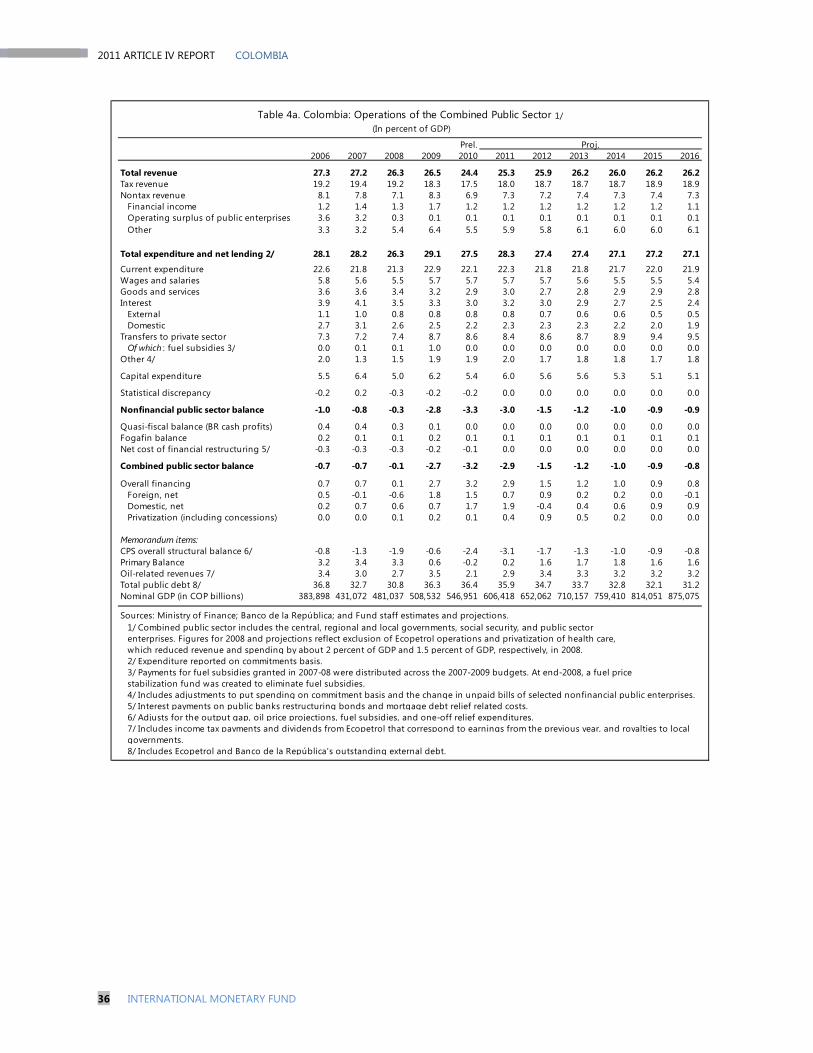
2011 ARTICLE IV REPORT COLOMBIA
36 INTERNATIONAL MONETARY FUND
Table 4a. Colombia: Operations of the Combined Public Sector 1/ (In percent of GDP)
Prel. Proj.2006 2007 2008 2009 2010 2011 2012 2013 2014 2015 2016
Total revenue 27.3 27.2 26.3 26.5 24.4 25.3 25.9 26.2 26.0 26.2 26.2Tax revenue 19.2 19.4 19.2 18.3 17.5 18.0 18.7 18.7 18.7 18.9 18.9Nontax revenue 8.1 7.8 7.1 8.3 6.9 7.3 7.2 7.4 7.3 7.4 7.3 Financial income 1.2 1.4 1.3 1.7 1.2 1.2 1.2 1.2 1.2 1.2 1.1 Operating surplus of public enterprises 3.6 3.2 0.3 0.1 0.1 0.1 0.1 0.1 0.1 0.1 0.1 Other 3.3 3.2 5.4 6.4 5.5 5.9 5.8 6.1 6.0 6.0 6.1
Total expenditure and net lending 2/ 28.1 28.2 26.3 29.1 27.5 28.3 27.4 27.4 27.1 27.2 27.1
Current expenditure 22.6 21.8 21.3 22.9 22.1 22.3 21.8 21.8 21.7 22.0 21.9Wages and salaries 5.8 5.6 5.5 5.7 5.7 5.7 5.7 5.6 5.5 5.5 5.4Goods and services 3.6 3.6 3.4 3.2 2.9 3.0 2.7 2.8 2.9 2.9 2.8Interest 3.9 4.1 3.5 3.3 3.0 3.2 3.0 2.9 2.7 2.5 2.4 External 1.1 1.0 0.8 0.8 0.8 0.8 0.7 0.6 0.6 0.5 0.5 Domestic 2.7 3.1 2.6 2.5 2.2 2.3 2.3 2.3 2.2 2.0 1.9Transfers to private sector 7.3 7.2 7.4 8.7 8.6 8.4 8.6 8.7 8.9 9.4 9.5
Of which : fuel subsidies 3/ 0.0 0.1 0.1 1.0 0.0 0.0 0.0 0.0 0.0 0.0 0.0Other 4/ 2.0 1.3 1.5 1.9 1.9 2.0 1.7 1.8 1.8 1.7 1.8
Capital expenditure 5.5 6.4 5.0 6.2 5.4 6.0 5.6 5.6 5.3 5.1 5.1
Statistical discrepancy -0.2 0.2 -0.3 -0.2 -0.2 0.0 0.0 0.0 0.0 0.0 0.0
Nonfinancial public sector balance -1.0 -0.8 -0.3 -2.8 -3.3 -3.0 -1.5 -1.2 -1.0 -0.9 -0.9
Quasi-fiscal balance (BR cash profits) 0.4 0.4 0.3 0.1 0.0 0.0 0.0 0.0 0.0 0.0 0.0Fogafin balance 0.2 0.1 0.1 0.2 0.1 0.1 0.1 0.1 0.1 0.1 0.1Net cost of financial restructuring 5/ -0.3 -0.3 -0.3 -0.2 -0.1 0.0 0.0 0.0 0.0 0.0 0.0
Combined public sector balance -0.7 -0.7 -0.1 -2.7 -3.2 -2.9 -1.5 -1.2 -1.0 -0.9 -0.8
Overall financing 0.7 0.7 0.1 2.7 3.2 2.9 1.5 1.2 1.0 0.9 0.8Foreign, net 0.5 -0.1 -0.6 1.8 1.5 0.7 0.9 0.2 0.2 0.0 -0.1Domestic, net 0.2 0.7 0.6 0.7 1.7 1.9 -0.4 0.4 0.6 0.9 0.9Privatization (including concessions) 0.0 0.0 0.1 0.2 0.1 0.4 0.9 0.5 0.2 0.0 0.0
Memorandum items:CPS overall structural balance 6/ -0.8 -1.3 -1.9 -0.6 -2.4 -3.1 -1.7 -1.3 -1.0 -0.9 -0.8Primary Balance 3.2 3.4 3.3 0.6 -0.2 0.2 1.6 1.7 1.8 1.6 1.6Oil-related revenues 7/ 3.4 3.0 2.7 3.5 2.1 2.9 3.4 3.3 3.2 3.2 3.2Total public debt 8/ 36.8 32.7 30.8 36.3 36.4 35.9 34.7 33.7 32.8 32.1 31.2Nominal GDP (in COP billions) 383,898 431,072 481,037 508,532 546,951 606,418 652,062 710,157 759,410 814,051 875,075
Sources: Ministry of Finance; Banco de la República; and Fund staff estimates and projections.
2/ Expenditure reported on commitments basis.
4/ Includes adjustments to put spending on commitment basis and the change in unpaid bills of selected nonfinancial public enterprises.5/ Interest payments on public banks restructuring bonds and mortgage debt relief related costs.6/ Adjusts for the output gap, oil price projections, fuel subsidies, and one-off relief expenditures.7/ Includes income tax payments and dividends from Ecopetrol that correspond to earnings from the previous year, and royalties to local governments.8/ Includes Ecopetrol and Banco de la República's outstanding external debt.
1/ Combined public sector includes the central, regional and local governments, social security, and public sector enterprises. Figures for 2008 and projections reflect exclusion of Ecopetrol operations and privatization of health care, which reduced revenue and spending by about 2 percent of GDP and 1.5 percent of GDP, respectively, in 2008.
3/ Payments for fuel subsidies granted in 2007-08 were distributed across the 2007-2009 budgets. At end-2008, a fuel price stabilization fund was created to eliminate fuel subsidies.
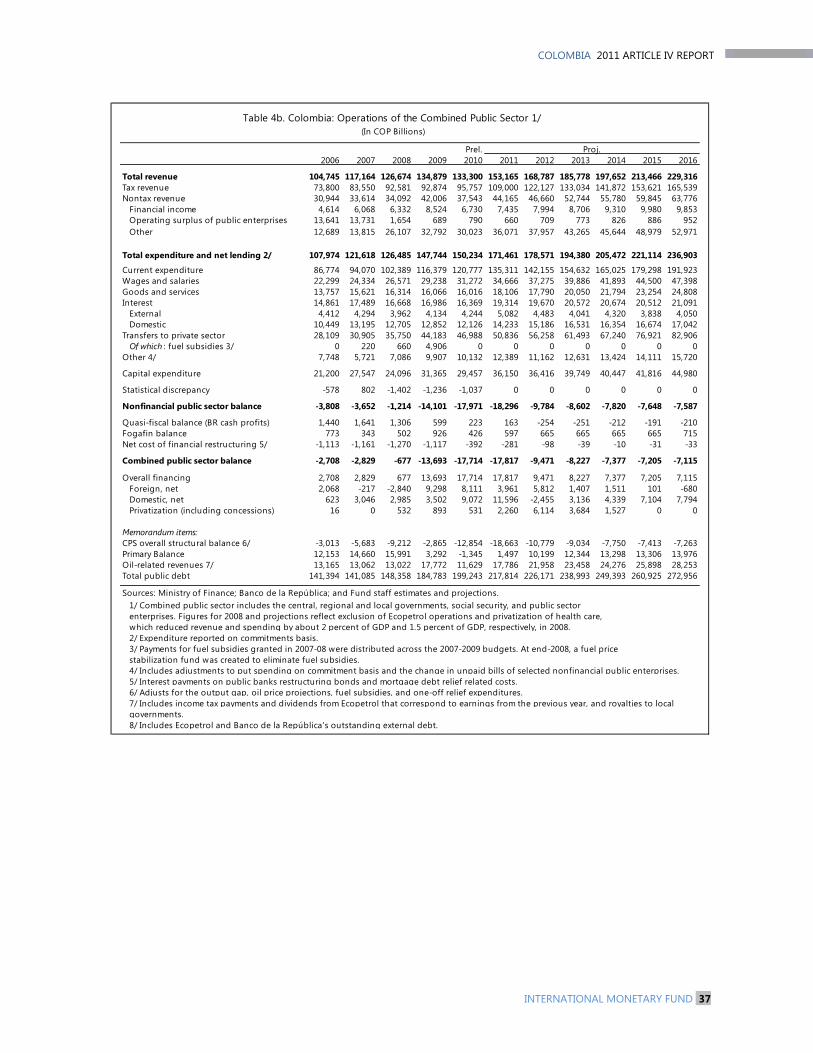
COLOMBIA 2011 ARTICLE IV REPORT
INTERNATIONAL MONETARY FUND 37
Table 4b. Colombia: Operations of the Combined Public Sector 1/ (In COP Billions)
Prel. Proj.2006 2007 2008 2009 2010 2011 2012 2013 2014 2015 2016
Total revenue 104,745 117,164 126,674 134,879 133,300 153,165 168,787 185,778 197,652 213,466 229,316Tax revenue 73,800 83,550 92,581 92,874 95,757 109,000 122,127 133,034 141,872 153,621 165,539Nontax revenue 30,944 33,614 34,092 42,006 37,543 44,165 46,660 52,744 55,780 59,845 63,776 Financial income 4,614 6,068 6,332 8,524 6,730 7,435 7,994 8,706 9,310 9,980 9,853 Operating surplus of public enterprises 13,641 13,731 1,654 689 790 660 709 773 826 886 952 Other 12,689 13,815 26,107 32,792 30,023 36,071 37,957 43,265 45,644 48,979 52,971
Total expenditure and net lending 2/ 107,974 121,618 126,485 147,744 150,234 171,461 178,571 194,380 205,472 221,114 236,903
Current expenditure 86,774 94,070 102,389 116,379 120,777 135,311 142,155 154,632 165,025 179,298 191,923Wages and salaries 22,299 24,334 26,571 29,238 31,272 34,666 37,275 39,886 41,893 44,500 47,398Goods and services 13,757 15,621 16,314 16,066 16,016 18,106 17,790 20,050 21,794 23,254 24,808Interest 14,861 17,489 16,668 16,986 16,369 19,314 19,670 20,572 20,674 20,512 21,091 External 4,412 4,294 3,962 4,134 4,244 5,082 4,483 4,041 4,320 3,838 4,050 Domestic 10,449 13,195 12,705 12,852 12,126 14,233 15,186 16,531 16,354 16,674 17,042Transfers to private sector 28,109 30,905 35,750 44,183 46,988 50,836 56,258 61,493 67,240 76,921 82,906
Of which : fuel subsidies 3/ 0 220 660 4,906 0 0 0 0 0 0 0Other 4/ 7,748 5,721 7,086 9,907 10,132 12,389 11,162 12,631 13,424 14,111 15,720
Capital expenditure 21,200 27,547 24,096 31,365 29,457 36,150 36,416 39,749 40,447 41,816 44,980
Statistical discrepancy -578 802 -1,402 -1,236 -1,037 0 0 0 0 0 0
Nonfinancial public sector balance -3,808 -3,652 -1,214 -14,101 -17,971 -18,296 -9,784 -8,602 -7,820 -7,648 -7,587
Quasi-fiscal balance (BR cash profits) 1,440 1,641 1,306 599 223 163 -254 -251 -212 -191 -210Fogafin balance 773 343 502 926 426 597 665 665 665 665 715Net cost of financial restructuring 5/ -1,113 -1,161 -1,270 -1,117 -392 -281 -98 -39 -10 -31 -33
Combined public sector balance -2,708 -2,829 -677 -13,693 -17,714 -17,817 -9,471 -8,227 -7,377 -7,205 -7,115
Overall financing 2,708 2,829 677 13,693 17,714 17,817 9,471 8,227 7,377 7,205 7,115Foreign, net 2,068 -217 -2,840 9,298 8,111 3,961 5,812 1,407 1,511 101 -680Domestic, net 623 3,046 2,985 3,502 9,072 11,596 -2,455 3,136 4,339 7,104 7,794Privatization (including concessions) 16 0 532 893 531 2,260 6,114 3,684 1,527 0 0
Memorandum items:CPS overall structural balance 6/ -3,013 -5,683 -9,212 -2,865 -12,854 -18,663 -10,779 -9,034 -7,750 -7,413 -7,263Primary Balance 12,153 14,660 15,991 3,292 -1,345 1,497 10,199 12,344 13,298 13,306 13,976Oil-related revenues 7/ 13,165 13,062 13,022 17,772 11,629 17,786 21,958 23,458 24,276 25,898 28,253Total public debt 141,394 141,085 148,358 184,783 199,243 217,814 226,171 238,993 249,393 260,925 272,956
Sources: Ministry of Finance; Banco de la República; and Fund staff estimates and projections.
2/ Expenditure reported on commitments basis.
4/ Includes adjustments to put spending on commitment basis and the change in unpaid bills of selected nonfinancial public enterprises.5/ Interest payments on public banks restructuring bonds and mortgage debt relief related costs.6/ Adjusts for the output gap, oil price projections, fuel subsidies, and one-off relief expenditures.7/ Includes income tax payments and dividends from Ecopetrol that correspond to earnings from the previous year, and royalties to local governments.8/ Includes Ecopetrol and Banco de la República's outstanding external debt.
1/ Combined public sector includes the central, regional and local governments, social security, and public sector enterprises. Figures for 2008 and projections reflect exclusion of Ecopetrol operations and privatization of health care, which reduced revenue and spending by about 2 percent of GDP and 1.5 percent of GDP, respectively, in 2008.
3/ Payments for fuel subsidies granted in 2007-08 were distributed across the 2007-2009 budgets. At end-2008, a fuel price stabilization fund was created to eliminate fuel subsidies.

2011 ARTICLE IV REPORT COLOMBIA
38 INTERNATIONAL MONETARY FUND
2006 2007 2008 2009 2010 April 2011
Central BankNet Foreign Assets 35,265 42,876 54,661 50,526 53,265 52,814
Gross official reserve assets 34,878 42,343 53,720 51,650 54,583 54,738in billions of US$ 15.7 21.0 23.9 25.3 28.5 31.0
Short-term foreign liabilities 326 136 613 562 844 1,379Other net foreign assets 1,257 1,161 2,106 1,955 1,865 1,724
Net domestic assets -8,215 -9,964 -18,403 -10,958 -8,373 -12,393Net credit to the public sector -284 -4,038 -1,792 622 -2,098 -17,769Net credit to the financial system 6,598 5,039 -143 -419 1,516 9,404Other -14,529 -10,965 -16,468 -11,160 -7,792 -4,028
Monetary base 27,032 32,415 36,195 39,547 44,878 40,409Currency in circulation 20,120 22,417 24,352 25,671 29,674 26,385Deposit money banks reserves 6,896 9,970 11,832 13,865 15,157 13,973Other deposits 16 29 12 10 47 52
Financial systemNet foreign assets 34,751 37,886 49,670 48,267 44,392 43,124
in billions of US$ 15.0 18.4 21.4 24.2 23.0 23.1Net domestic assets 88,469 106,762 121,706 136,915 162,008 163,313
Net credit to public sector 20,401 11,926 16,150 32,352 33,782 20,912Credit to private sector 104,290 130,986 149,366 150,766 176,020 188,076Other net -36,222 -36,150 -43,809 -46,203 -47,794 -45,674
Broad money 123,219 144,648 171,376 185,182 206,399 206,437
y-o-yCredit to private sector 35.6 25.6 14.0 0.9 16.8 22.6Currency 22.9 11.4 8.6 5.4 15.6 16.0Monetary base 18.5 19.9 11.7 9.3 13.5 16.2Broad money 18.0 17.4 18.5 8.1 11.5 12.2
in percent of annual GDPCredit to private sector 27.2 30.4 31.1 29.6 32.2 31.0
Currency 5.2 5.2 5.1 5.0 5.4 4.4Monetary base 7.0 7.5 7.5 7.8 8.2 6.7Broad money 32.1 33.6 35.6 36.4 37.7 34.0
Memorandum items:Central bank inflation target 4.0-5.0 3.5-4.5 3.5-4.5 4.5-5.5 2.0-4.0 2.0-4.0CPI inflation, eop 4.5 5.7 7.7 2.0 3.2 3.1Nominal GDP (COP billions) 383,898 431,072 481,037 508,532 546,951 606,418
Sources: Banco de la Republica; and Fund staff estimates.
Table 5. Colombia: Monetary Indicators
(In billions of Colombian pesos, unless otherwise indicated)
(Annual percentage change)
(In percent of GDP)

COLOMBIA 2011 ARTICLE IV REPORT
INTERNATIONAL MONETARY FUND 39
2006 2007 2008 2009 2010 April 2011
Capital AdequacyRegulatory capital to risk-weighted assets 15.4 16.0 15.4 17.2 17.3 17.9Regulatory Tier 1 capital to risk-weighted assets 11.8 12.5 12.0 13.4 13.0 14.1Capital (net worth) to assets 13.3 12.9 12.6 14.2 14.3 14.4
Asset Quality and DistributionNonperforming loans to gross loans 2.7 3.2 3.9 4.0 2.9 3.0Provisions to nonperforming loans 154.4 133.8 124.3 140.1 174.0 161.3Gross loans to assets 65.0 70.3 71.2 64.3 67.9 64.3
Earnings and ProfitabilityROAA 4.0 4.0 3.6 3.5 3.9 2.9ROAE 29.9 30.8 28.1 26.2 27.2 20.5Interest margin to gross income 45.8 52.1 54.0 54.0 55.5 49.1Noninterest expenses to gross income 53.3 45.1 46.1 43.2 47.0 52.9
LiquidityLiquid assets to total assets 6.0 7.5 8.2 9.2 7.5 7.0Liquid assets to short-term liabilities 9.2 11.6 12.8 14.2 12.1 11.3Deposit to loan ratio 101.4 94.7 94.9 98.8 93.5 91.0
OtherForeign-currency-denominated loans to total loans 4.4 6.3 6.6 4.2 6.9 7.0Foreign-currency-denominated liabilities to total liabilities 4.5 8.5 8.9 6.6 11.2 …Net open position in foreign exchange to capital 21.4 1.9 -0.1 1.7 -2.0 -3.1Sources: Superintendencia Financiera; and Creditedge (Moody's-KMV).1/ All deposit taking institutions.
(In percent, unless otherwise indicated; end-of-period values)
Total Banking System 1/Table 6. Colombia: Financial Soundness Indicators

2011 ARTICLE IV REPORT COLOMBIA
40 INTERNATIONAL MONETARY FUND
Table 7. Colombia: Medium-Term Outlook
Prelim. Projections2007 2008 2009 2010 2011 2012 2013 2014 2015 2016
I. Output and Prices
(Annual percentage changes)
Real GDP 6.9 3.5 1.5 4.3 4.9 4.5 4.5 4.5 4.5 4.5
Consumer pricesEnd of period 5.7 7.7 2.0 3.2 3.1 3.1 3.0 3.0 3.0 3.0
(In percent of GDP, unless indicated otherwise)
II. Saving and Investment
Gross national savings 20.2 20.5 20.5 19.4 20.3 20.6 21.0 20.8 20.8 21.0Private sector 15.5 15.7 17.2 17.3 17.4 16.6 16.7 16.5 16.6 16.8Public sector 1/ 4.7 4.8 3.3 2.1 2.9 4.0 4.3 4.2 4.1 4.2
Gross domestic investment 23.0 23.4 22.7 22.5 22.9 23.0 23.1 23.0 23.0 23.0Private sector 17.7 18.5 16.9 17.2 17.2 17.7 17.7 18.0 18.1 18.1Public sector 1/ 5.4 4.9 5.8 5.2 5.7 5.3 5.3 5.1 4.9 4.9
External current account balance -2.9 -2.9 -2.2 -3.1 -2.6 -2.5 -2.1 -2.3 -2.2 -2.0
III. Nonfinancial and Consolidated Public Sector
Nonfinancial public sector 2/Revenue 27.2 26.3 26.5 24.4 25.3 25.9 26.2 26.0 26.2 26.2Expenditure 28.2 26.3 29.1 27.5 28.3 27.4 27.4 27.1 27.2 27.1
Current expenditure 21.8 21.3 22.9 22.1 22.3 21.8 21.8 21.7 22.0 21.9Capital expenditure 6.4 5.0 6.2 5.4 6.0 5.6 5.6 5.3 5.1 5.1
Primary balance 3/ 3.2 3.2 0.6 -0.3 0.2 1.5 1.7 1.7 1.6 1.5Overall balance 3/ -0.8 -0.3 -2.8 -3.3 -3.0 -1.5 -1.2 -1.0 -0.9 -0.9
IV. Balance of Payments
External current account balance -2.9 -2.9 -2.2 -3.1 -2.6 -2.5 -2.1 -2.3 -2.2 -2.0Trade balance -0.3 0.4 1.1 0.7 1.9 1.9 2.0 1.7 1.5 1.7
Exports 14.5 16.3 14.5 14.1 17.1 17.0 17.1 17.0 16.9 17.1Imports 14.8 15.9 13.4 13.4 15.1 15.1 15.1 15.3 15.3 15.4
Capital and financial account balance 4.9 4.0 2.7 4.1 3.8 3.0 2.6 2.7 2.6 2.4Public sector 1.0 -0.1 3.1 1.8 1.6 1.4 0.6 0.5 0.3 0.3Private sector 3.9 4.2 -0.4 2.3 2.2 1.6 1.9 2.2 2.3 2.1
Net errors and omissions 0.2 0.0 0.1 0.1 0.0 0.0 0.0 0.0 0.0 0.0Overall balance 2.2 1.1 0.6 1.1 1.2 0.6 0.5 0.5 0.4 0.4
V. Public Debt
Total public gross debt 4/ 32.7 30.8 36.3 36.4 35.9 34.7 33.7 32.8 32.1 31.2Domestic debt 19.0 18.3 20.5 22.8 21.9 20.0 19.3 18.7 18.4 18.0External debt 13.7 12.5 15.9 13.6 14.0 14.6 14.3 14.2 13.7 13.2
Total public gross debt, excluding Ecopetrol 32.7 30.8 35.3 35.2 34.5 33.2 32.3 31.6 31.0 30.2
Total public net debt 5/ 22.7 21.0 27.4 28.5 29.2 28.4 27.5 27.0 26.6 26.1
Memorandum items:Nominal GDP (billions of COP) 431,072 481,037 508,532 546,951 606,418 652,062 710,157 759,410 814,051 875,075Crude oil, spot price 71.1 97.0 61.8 79.0 106.3 105.3 101.8 99.5 98.8 98.5Crude oil, spot price (Colombian mix) 66.2 90.2 56.6 73.1 98.4 97.4 94.2 92.1 91.4 91.1
Sources: Colombian authorities; and Fund staff estimates and projections.
1/ The definition of public savings and investment changes starting in 2006 and includes only the general government.2/ Excludes ECOPETROL for 2008-12. 3/ Includes statistical discrepancy. 4/ Includes debt of the non-financial public sector, including Ecopetrol, plus FOGAFIN and FINAGRO.5/ Defined as gross debt minus financial assets (public sector deposits in domestic and foreign financial institutions).
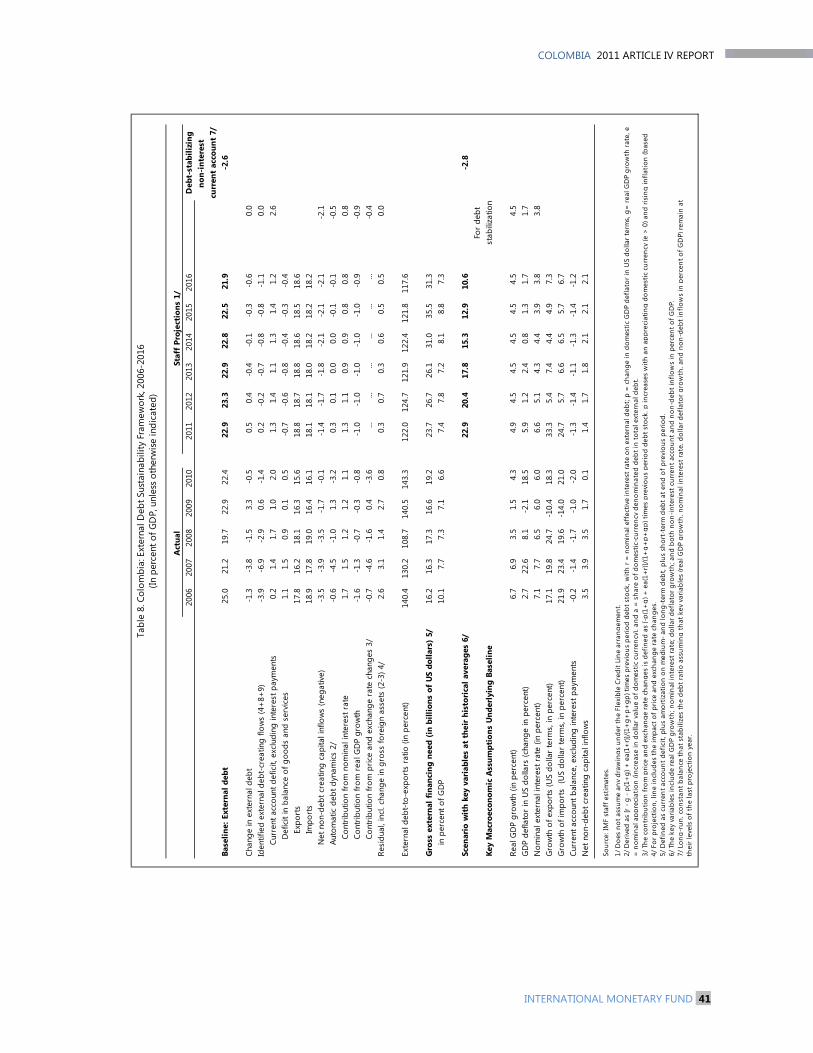
COLOMBIA 2011 ARTICLE IV REPORT
INTERNATIONAL MONETARY FUND 41
Staf
f Pr
ojec
tion
s 1/
20
0620
0720
0820
0920
1020
1120
1220
1320
1420
1520
16D
ebt-
stab
ilizi
ngno
n-in
tere
st
curr
ent
acco
unt
7/Ba
selin
e: E
xter
nal d
ebt
25.0
21.2
19.7
22.9
22.4
22.9
23.3
22.9
22.8
22.5
21.9
-2.6
Chan
ge in
ext
erna
l deb
t-1
.3-3
.8-1
.53.
3-0
.50.
50.
4-0
.4-0
.1-0
.3-0
.60.
0Id
entif
ied
exte
rnal
deb
t-cr
eatin
g flo
ws
(4+
8+9)
-3.9
-6.9
-2.9
0.6
-1.4
0.2
-0.2
-0.7
-0.8
-0.8
-1.1
0.0
Curr
ent a
ccou
nt d
efic
it, e
xclu
ding
inte
rest
pay
men
ts0.
21.
41.
71.
02.
01.
31.
41.
11.
31.
41.
22.
6D
efic
it in
bal
ance
of g
oods
and
ser
vice
s1.
11.
50.
90.
10.
5-0
.7-0
.6-0
.8-0
.4-0
.3-0
.4Ex
port
s17
.816
.218
.116
.315
.618
.818
.718
.818
.618
.518
.6Im
port
s 18
.917
.819
.016
.416
.118
.118
.118
.018
.218
.218
.2N
et n
on-d
ebt c
reat
ing
capi
tal i
nflo
ws
(neg
ativ
e)-3
.5-3
.9-3
.5-1
.7-0
.1-1
.4-1
.7-1
.8-2
.1-2
.1-2
.1-2
.1Au
tom
atic
deb
t dyn
amic
s 2/
-0.6
-4.5
-1.0
1.3
-3.2
0.3
0.1
0.0
0.0
-0.1
-0.1
-0.5
Cont
ribut
ion
from
nom
inal
inte
rest
rat
e1.
71.
51.
21.
21.
11.
31.
10.
90.
90.
80.
80.
8Co
ntrib
utio
n fr
om r
eal G
DP
grow
th
-1.6
-1.3
-0.7
-0.3
-0.8
-1.0
-1.0
-1.0
-1.0
-1.0
-0.9
-0.9
Cont
ribut
ion
from
pric
e an
d ex
chan
ge r
ate
chan
ges
3/
-0.7
-4.6
-1.6
0.4
-3.6
......
......
......
-0.4
Resi
dual
, inc
l. ch
ange
in g
ross
fore
ign
asse
ts (2
-3) 4
/2.
63.
11.
42.
70.
80.
30.
70.
30.
60.
50.
50.
0
Exte
rnal
deb
t-to
-exp
orts
rat
io (i
n pe
rcen
t)14
0.4
130.
210
8.7
140.
514
3.3
122.
012
4.7
121.
912
2.4
121.
811
7.6
Gro
ss e
xter
nal f
inan
cing
nee
d (i
n bi
llion
s of
US
dolla
rs)
5/16
.216
.317
.316
.619
.223
.726
.726
.131
.035
.531
.3in
per
cent
of G
DP
10.1
7.7
7.3
7.1
6.6
7.4
7.8
7.2
8.1
8.8
7.3
Scen
ario
wit
h ke
y va
riab
les
at t
heir
his
tori
cal a
vera
ges
6/22
.920
.417
.815
.312
.910
.6-2
.8Fo
r de
btKe
y M
acro
econ
omic
Ass
umpt
ions
Und
erly
ing
Base
line
stab
iliza
tion
Real
GD
P gr
owth
(in
perc
ent)
6.7
6.9
3.5
1.5
4.3
4.9
4.5
4.5
4.5
4.5
4.5
4.5
GD
P de
flato
r in
US
dolla
rs (c
hang
e in
per
cent
)2.
722
.68.
1-2
.118
.55.
91.
22.
40.
81.
31.
71.
7N
omin
al e
xter
nal i
nter
est r
ate
(in p
erce
nt)
7.1
7.7
6.5
6.0
6.0
6.6
5.1
4.3
4.4
3.9
3.8
3.8
Gro
wth
of e
xpor
ts (U
S do
llar
term
s, in
per
cent
)17
.119
.824
.7-1
0.4
18.3
33.3
5.4
7.4
4.4
4.9
7.3
Gro
wth
of i
mpo
rts
(US
dolla
r te
rms,
in p
erce
nt)
21.9
23.4
19.6
-14.
021
.024
.75.
76.
66.
55.
76.
7Cu
rren
t acc
ount
bal
ance
, exc
ludi
ng in
tere
st p
aym
ents
-0
.2-1
.4-1
.7-1
.0-2
.0-1
.3-1
.4-1
.1-1
.3-1
.4-1
.2N
et n
on-d
ebt c
reat
ing
capi
tal i
nflo
ws
3.5
3.9
3.5
1.7
0.1
1.4
1.7
1.8
2.1
2.1
2.1
Sour
ce: I
MF
staf
f est
imat
es.
4/ F
or p
roje
ctio
n, li
ne in
clud
es th
e im
pact
of p
rice
and
exch
ange
rate
cha
nges
.5/
Def
ined
as
curr
ent a
ccou
nt d
efic
it, p
lus
amor
tizat
ion
on m
ediu
m- a
nd lo
ng-t
erm
deb
t, pl
us s
hort
-ter
m d
ebt a
t end
of p
revi
ous
perio
d.
6/ T
he k
ey v
aria
bles
incl
ude
real
GD
P gr
owth
; nom
inal
inte
rest
rate
; dol
lar d
efla
tor g
row
th; a
nd b
oth
non-
inte
rest
cur
rent
acc
ount
and
non
-deb
t inf
low
s in
per
cent
of G
DP.
thei
r lev
els
of th
e la
st p
roje
ctio
n ye
ar.
7 / L
ong-
run,
con
stan
t bal
ance
that
sta
biliz
es th
e de
bt ra
tio a
ssum
ing
that
key
var
iabl
es (r
eal G
DP
grow
th, n
omin
al in
tere
st ra
te, d
olla
r def
lato
r gro
wth
, and
non
-deb
t inf
low
s in
per
cent
of G
DP)
rem
ain
at
Act
ual
1/ D
oes
not a
ssum
e an
y dr
awin
gs u
nder
the
Flex
ible
Cre
dit L
ine
arra
ngem
ent.
Tabl
e 8.
Col
ombi
a: E
xter
nal D
ebt S
usta
inab
ility
Fra
mew
ork,
200
6-20
16(In
per
cent
of G
DP,
unl
ess
othe
rwis
e in
dica
ted)
3/ T
he c
ontr
ibut
ion
from
pric
e an
d ex
chan
ge ra
te c
hang
es is
def
ined
as
[-p(1
+g)
+ e
a(1+
r)]/(1
+g+
p+gp
) tim
es p
revi
ous
perio
d de
bt s
tock
. p in
crea
ses
with
an
appr
ecia
ting
dom
estic
cur
renc
y (e
> 0
) and
risi
ng in
flatio
n (b
ased
2/ D
eriv
ed a
s [r
- g -
p(1+
g) +
ea(
1+r)]
/(1+
g+p+
gp) t
imes
pre
viou
s pe
riod
debt
sto
ck, w
ith r
= n
omin
al e
ffec
tive
inte
rest
rate
on
exte
rnal
deb
t; p
= c
hang
e in
dom
estic
GD
P de
flato
r in
US
dolla
r ter
ms,
g=
real
GD
P gr
owth
rate
, e
= n
omin
al a
ppre
ciat
ion
(incr
ease
in d
olla
r val
ue o
f dom
estic
cur
renc
y), a
nd a
= s
hare
of d
omes
tic-c
urre
ncy
deno
min
ated
deb
t in
tota
l ext
erna
l deb
t.
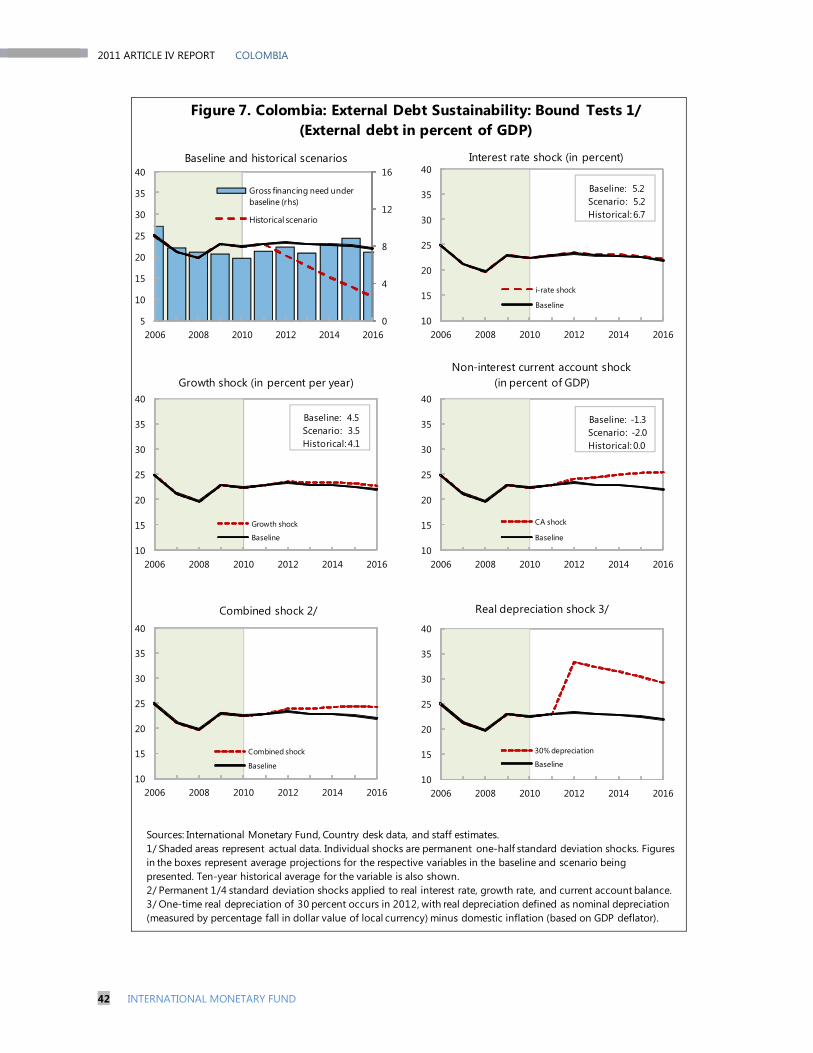
2011 ARTICLE IV REPORT COLOMBIA
42 INTERNATIONAL MONETARY FUND
Figure 7. Colombia: External Debt Sustainability: Bound Tests 1/(External debt in percent of GDP)
Sources: International Monetary Fund, Country desk data, and staff estimates.1/ Shaded areas represent actual data. Individual shocks are permanent one-half standard deviation shocks. Figures in the boxes represent average projections for the respective variables in the baseline and scenario being presented. Ten-year historical average for the variable is also shown. 2/ Permanent 1/4 standard deviation shocks applied to real interest rate, growth rate, and current account balance.3/ One-time real depreciation of 30 percent occurs in 2012, with real depreciation defined as nominal depreciation (measured by percentage fall in dollar value of local currency) minus domestic inflation (based on GDP deflator).
0
4
8
12
16
5
10
15
20
25
30
35
40
2006 2008 2010 2012 2014 2016
Gross financing need under baseline (rhs)
Historical scenario
10
15
20
25
30
35
40
2006 2008 2010 2012 2014 2016
i-rate shock
Baseline
Baseline: 5.2Scenario: 5.2Historical: 6.7
10
15
20
25
30
35
40
2006 2008 2010 2012 2014 2016
Growth shock
Baseline
Baseline: 4.5Scenario: 3.5Historical: 4.1
10
15
20
25
30
35
40
2006 2008 2010 2012 2014 2016
CA shock
Baseline
Baseline: -1.3Scenario: -2.0Historical: 0.0
10
15
20
25
30
35
40
2006 2008 2010 2012 2014 2016
Combined shock
Baseline
10
15
20
25
30
35
40
2006 2008 2010 2012 2014 2016
30% depreciation
Baseline
Baseline and historical scenarios Interest rate shock (in percent)
Growth shock (in percent per year)Non-interest current account shock
(in percent of GDP)
Combined shock 2/ Real depreciation shock 3/
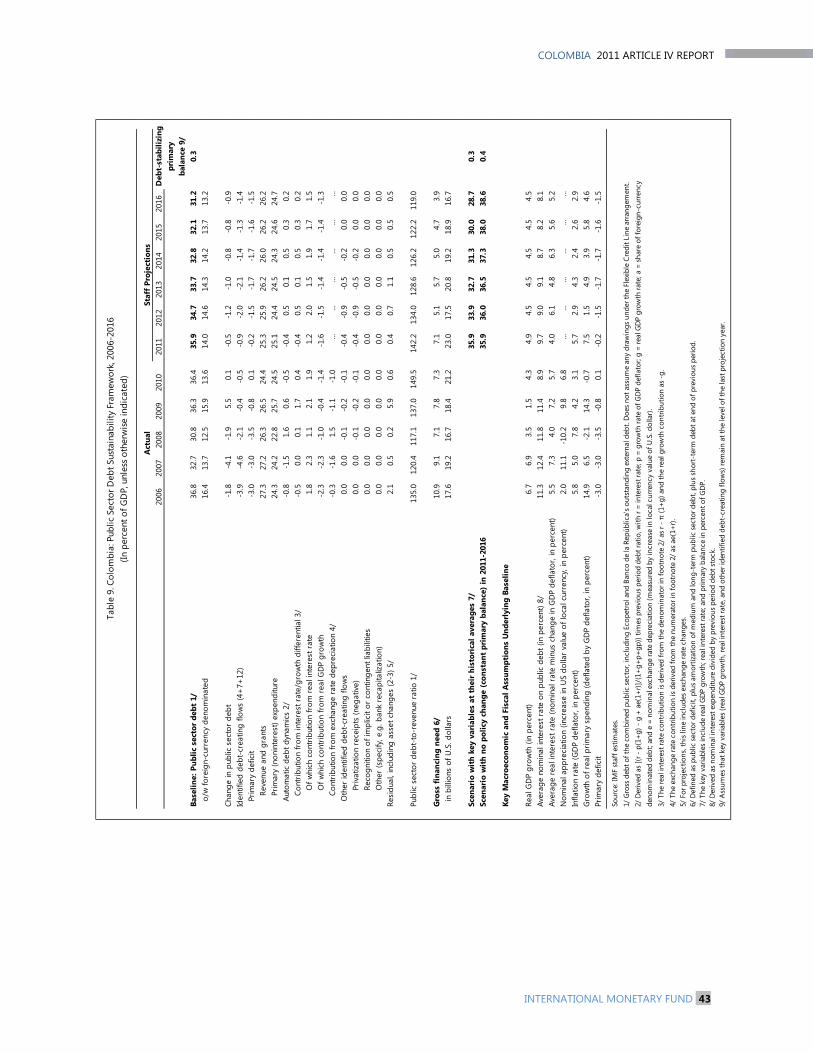
COLOMBIA 2011 ARTICLE IV REPORT
INTERNATIONAL MONETARY FUND 43
Staf
f Pr
ojec
tion
s20
0620
0720
0820
0920
1020
1120
1220
1320
1420
1520
16D
ebt-
stab
ilizi
ngpr
imar
yba
lanc
e 9/
Base
line:
Pub
lic s
ecto
r de
bt 1
/36
.832
.730
.836
.336
.435
.934
.733
.732
.832
.131
.20.
3o/
w fo
reig
n-cu
rren
cy d
enom
inat
ed16
.413
.712
.515
.913
.614
.014
.614
.314
.213
.713
.2
Chan
ge in
pub
lic s
ecto
r de
bt-1
.8-4
.1-1
.95.
50.
1-0
.5-1
.2-1
.0-0
.8-0
.8-0
.9Id
entif
ied
debt
-cre
atin
g flo
ws
(4+
7+12
)-3
.9-4
.6-2
.1-0
.4-0
.5-0
.9-2
.0-2
.1-1
.4-1
.3-1
.4Pr
imar
y de
ficit
-3.0
-3.0
-3.5
-0.8
0.1
-0.2
-1.5
-1.7
-1.7
-1.6
-1.5
Reve
nue
and
gran
ts27
.327
.226
.326
.524
.425
.325
.926
.226
.026
.226
.2Pr
imar
y (n
onin
tere
st) e
xpen
ditu
re24
.324
.222
.825
.724
.525
.124
.424
.524
.324
.624
.7Au
tom
atic
deb
t dyn
amic
s 2/
-0.8
-1.5
1.6
0.6
-0.5
-0.4
0.5
0.1
0.5
0.3
0.2
Cont
ribut
ion
from
inte
rest
rat
e/gr
owth
diff
eren
tial 3
/-0
.50.
00.
11.
70.
4-0
.40.
50.
10.
50.
30.
2O
f whi
ch c
ontr
ibut
ion
from
rea
l int
eres
t rat
e 1.
82.
31.
12.
11.
91.
22.
01.
51.
91.
71.
5O
f whi
ch c
ontr
ibut
ion
from
rea
l GD
P gr
owth
-2.3
-2.3
-1.0
-0.4
-1.4
-1.6
-1.5
-1.4
-1.4
-1.4
-1.3
Cont
ribut
ion
from
exc
hang
e ra
te d
epre
ciat
ion
4/-0
.3-1
.61.
5-1
.1-1
.0...
......
......
...O
ther
iden
tifie
d de
bt-c
reat
ing
flow
s0.
00.
0-0
.1-0
.2-0
.1-0
.4-0
.9-0
.5-0
.20.
00.
0Pr
ivat
izat
ion
rece
ipts
(neg
ativ
e)0.
00.
0-0
.1-0
.2-0
.1-0
.4-0
.9-0
.5-0
.20.
00.
0Re
cogn
ition
of i
mpl
icit
or c
ontin
gent
liab
ilitie
s0.
00.
00.
00.
00.
00.
00.
00.
00.
00.
00.
0O
ther
(spe
cify
, e.g
. ban
k re
capi
taliz
atio
n)0.
00.
00.
00.
00.
00.
00.
00.
00.
00.
00.
0Re
sidu
al, i
nclu
ding
ass
et c
hang
es (2
-3) 5
/2.
10.
50.
25.
90.
60.
40.
71.
10.
50.
50.
5
Publ
ic s
ecto
r de
bt-t
o-re
venu
e ra
tio 1
/13
5.0
120.
411
7.1
137.
014
9.5
142.
213
4.0
128.
612
6.2
122.
211
9.0
Gro
ss f
inan
cing
nee
d 6/
10.9
9.1
7.1
7.8
7.3
7.1
5.1
5.7
5.0
4.7
3.9
in b
illio
ns o
f U.S
. dol
lars
17.6
19.2
16.7
18.4
21.2
23.0
17.5
20.8
19.2
18.9
16.7
Scen
ario
wit
h ke
y va
riab
les
at t
heir
his
tori
cal a
vera
ges
7/35
.933
.932
.731
.330
.028
.70.
3Sc
enar
io w
ith
no p
olic
y ch
ange
(co
nsta
nt p
rim
ary
bala
nce)
in 2
011-
2016
35.9
36.0
36.5
37.3
38.0
38.6
0.4
Key
Mac
roec
onom
ic a
nd F
isca
l Ass
umpt
ions
Und
erly
ing
Base
line
Real
GD
P gr
owth
(in
perc
ent)
6.7
6.9
3.5
1.5
4.3
4.9
4.5
4.5
4.5
4.5
4.5
Aver
age
nom
inal
inte
rest
rat
e on
pub
lic d
ebt (
in p
erce
nt) 8
/11
.312
.411
.811
.48.
99.
79.
09.
18.
78.
28.
1Av
erag
e re
al in
tere
st r
ate
(nom
inal
rat
e m
inus
cha
nge
in G
DP
defla
tor,
in p
erce
nt)
5.5
7.3
4.0
7.2
5.7
4.0
6.1
4.8
6.3
5.6
5.2
Nom
inal
app
reci
atio
n (in
crea
se in
US
dolla
r va
lue
of lo
cal c
urre
ncy,
in p
erce
nt)
2.0
11.1
-10.
29.
86.
8...
......
......
...In
flatio
n ra
te (G
DP
defla
tor,
in p
erce
nt)
5.8
5.0
7.8
4.2
3.1
5.7
2.9
4.3
2.4
2.6
2.9
Gro
wth
of r
eal p
rimar
y sp
endi
ng (d
efla
ted
by G
DP
defla
tor,
in p
erce
nt)
14.9
6.5
-2.1
14.3
-0.7
7.5
1.5
4.9
3.9
5.8
4.6
Prim
ary
defic
it-3
.0-3
.0-3
.5-0
.80.
1-0
.2-1
.5-1
.7-1
.7-1
.6-1
.5
Sour
ce: I
MF
staf
f est
imat
es.
1/ G
ross
deb
t of t
he c
ombi
ned
publ
ic s
ecto
r, in
clud
ing
Ecop
etro
l and
Ban
co d
e la
Rep
úblic
a's
outs
tand
ing
exte
rnal
deb
t. D
oes
not a
ssum
e an
y dr
awin
gs u
nder
the
Flex
ible
Cre
dit L
ine
arra
ngem
ent.
2/ D
eriv
ed a
s [(
r - p
(1+
g) -
g +
ae(
1+r)
]/(1
+g+
p+gp
)) ti
mes
pre
viou
s pe
riod
debt
ratio
, with
r =
inte
rest
rate
; p =
gro
wth
rate
of G
DP
defla
tor;
g =
real
GD
P gr
owth
rate
; a =
sha
re o
f for
eign
-cur
renc
y de
nom
inat
ed d
ebt;
and
e =
nom
inal
exc
hang
e ra
te d
epre
ciat
ion
(mea
sure
d by
incr
ease
in lo
cal c
urre
ncy
valu
e of
U.S
. dol
lar)
.3/
The
real
inte
rest
rate
con
trib
utio
n is
der
ived
from
the
deno
min
ator
in fo
otno
te 2
/ as
r - π
(1+
g) a
nd th
e re
al g
row
th c
ontr
ibut
ion
as -
g.4/
The
exc
hang
e ra
te c
ontr
ibut
ion
is d
eriv
ed fr
om th
e nu
mer
ator
in fo
otno
te 2
/ as
ae(
1+r)
. 5/
For
pro
ject
ions
, thi
s lin
e in
clud
es e
xcha
nge
rate
cha
nges
.6/
Def
ined
as
publ
ic s
ecto
r def
icit,
plu
s am
ortiz
atio
n of
med
ium
and
long
-ter
m p
ublic
sec
tor d
ebt,
plus
sho
rt-t
erm
deb
t at e
nd o
f pre
viou
s pe
riod.
7/
The
key
var
iabl
es in
clud
e re
al G
DP
grow
th; r
eal i
nter
est r
ate;
and
prim
ary
bala
nce
in p
erce
nt o
f GD
P.8/
Der
ived
as
nom
inal
inte
rest
exp
endi
ture
div
ided
by
prev
ious
per
iod
debt
sto
ck.
9/ A
ssum
es th
at k
ey v
aria
bles
(rea
l GD
P gr
owth
, rea
l int
eres
t rat
e, a
nd o
ther
iden
tifie
d de
bt-c
reat
ing
flow
s) re
mai
n at
the
leve
l of t
he la
st p
roje
ctio
n ye
ar.
Tabl
e 9.
Col
ombi
a: P
ublic
Sec
tor D
ebt S
usta
inab
ility
Fra
mew
ork,
200
6-20
16(In
per
cent
of G
DP,
unl
ess
othe
rwis
e in
dica
ted)
Act
ual

2011 ARTICLE IV REPORT COLOMBIA
44 INTERNATIONAL MONETARY FUND
Figure 8. Colombia: Public Debt Sustainability: Bound Tests 1/ (Public debt in percent of GDP)
Sources: International Monetary Fund, country desk data, and staff estimates.1/ Shaded areas represent actual data. Individual shocks are permanent one-half standard deviation shocks. Figures in the boxes represent average projections for the respective variables in the baseline and scenario being presented. Ten-year historical average for the variable is also shown.2/ Permanent 1/4 standard deviation shocks applied to real interest rate, growth rate, and primary balance.3/ One-time real depreciation of 30 percent and 10 percent of GDP shock to contingent liabilities occur in 2012, with real depreciation defined as nominal depreciation (measured by percentage fall in dollar value of local currency) minus domestic inflation (based on GDP deflator).
28.7
31.2
3.0
4.0
5.0
6.0
7.0
8.0
9.0
10.0
11.0
12.0
25
30
35
40
45
50
55
60
65
2006 2008 2010 2012 2014 2016
Gross financial need under baseline (rhs)Historical scenario
Baseline
32.6
31.2
25
30
35
40
45
50
55
60
65
2006 2008 2010 2012 2014 2016
i-rate shock
Baseline
36.4
31.225
30
35
40
45
50
55
60
65
2006 2008 2010 2012 2014 2016
Growth shockBaseline 38.6
34.6
31.225
30
35
40
45
50
55
60
65
2006 2008 2010 2012 2014 2016
Scenario with no policy change PB shockBaseline
34.5
31.2
25
30
35
40
45
50
55
60
65
2006 2008 2010 2012 2014 2016
Combined shock
Baseline41.8
38.1
31.225
30
35
40
45
50
55
60
65
2006 2008 2010 2012 2014 2016
Combined liabilities shock30% depreciationBaseline
Baseline and historical scenarios Interest rate shock (in percent)
Interest rate shock (in percent)Primary balance shock (in percent of GDP) and
no policy change scenario (constant primary balance)
Real depreciation and contingent liabilities shocks 3/Combined shock 2/
Baseline: 5.6
Scenario: 6.5
Historical: 4.8
Baseline: 4.5
Scenario: 3.5
Historical: 4.1
Baseline: 1.6
Scenario: 0.9
Historical: 2.0

COLOMBIA STAFF REPORT FOR THE 2011 ARTICLE IV CONSULTATION—INFORMATIONAL ANNEX
Prepared By:
The Western Hemisphere Department (In collaboration with other departments)
ANNEX I. COLOMBIA: FUND RELATIONS _______________________________________________ 2
ANNEX II. COLOMBIA: WORLD BANK RELATIONS _____________________________________ 3
ANNEX III. COLOMBIA: INTER-AMERICAN DEVELOPMENT BANK RELATIONS _______ 6
ANNEX IV. COLOMBIA: STATISTICAL ISSUES ___________________________________________ 8
CONTENTS
July 07, 2011
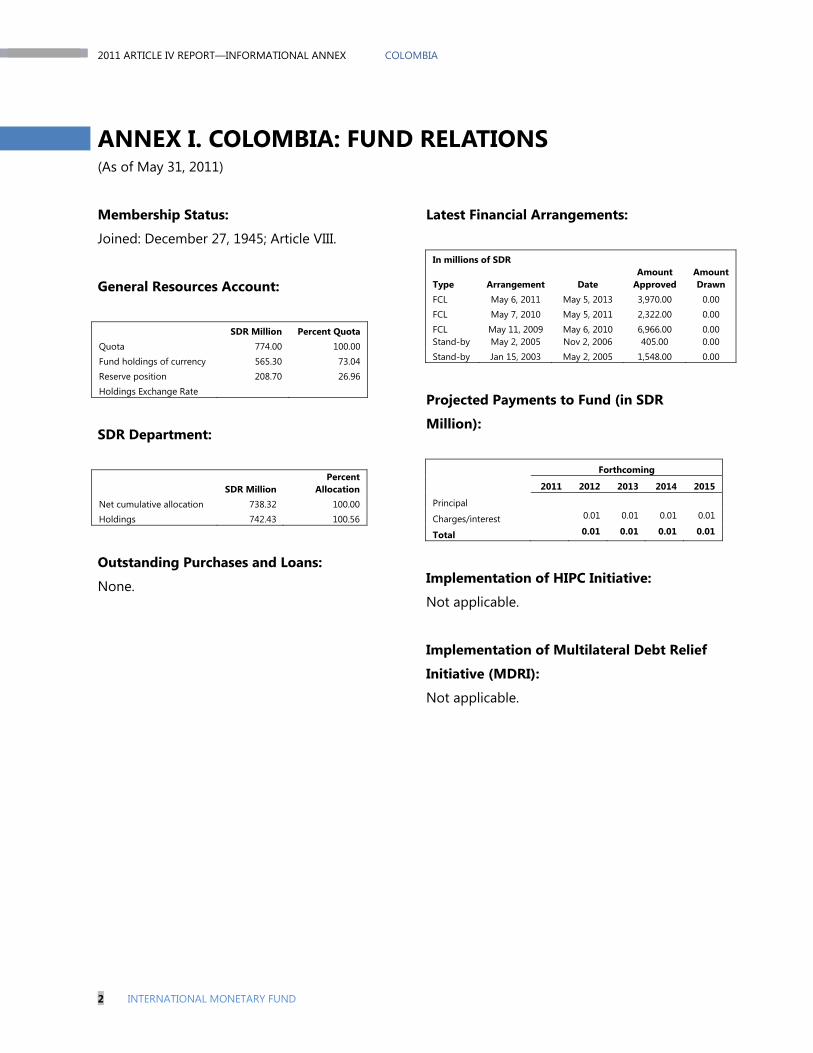
2011 ARTICLE IV REPORT—INFORMATIONAL ANNEX COLOMBIA
2 INTERNATIONAL MONETARY FUND
ANNEX I. COLOMBIA: FUND RELATIONS (As of May 31, 2011)
Membership Status:
Joined: December 27, 1945; Article VIII.
General Resources Account:
SDR Million Percent Quota Quota 774.00 100.00 Fund holdings of currency 565.30 73.04 Reserve position 208.70 26.96 Holdings Exchange Rate
SDR Department:
SDR Million Percent
Allocation Net cumulative allocation 738.32 100.00 Holdings 742.43 100.56
Outstanding Purchases and Loans:
None.
Latest Financial Arrangements:
In millions of SDR Type
Arrangement
Date
Amount Approved
Amount Drawn
FCL May 6, 2011 May 5, 2013 3,970.00 0.00 FCL May 7, 2010 May 5, 2011 2,322.00 0.00 FCL May 11, 2009 May 6, 2010 6,966.00 0.00 Stand-by May 2, 2005 Nov 2, 2006 405.00 0.00 Stand-by Jan 15, 2003 May 2, 2005 1,548.00 0.00
Projected Payments to Fund (in SDR
Million):
Forthcoming
2011 2012 2013 2014 2015
Principal
Charges/interest 0.01 0.01 0.01 0.01
Total 0.01 0.01 0.01 0.01
Implementation of HIPC Initiative:
Not applicable.
Implementation of Multilateral Debt Relief
Initiative (MDRI):
Not applicable.

COLOMBIA 2011 ARTICLE IV REPORT—INFORMATIONAL ANNEX
INTERNATIONAL MONETARY FUND 3
ANNEX II. COLOMBIA: WORLD BANK RELATIONS1
The IBRD lending program to Colombia
expanded faster than anticipated over the
past four years, partly as a result of the
global financial crisis. During the previous
Country Partnership Strategy (CPS) period
(FY 08–FY 11, i.e. July 2008 to June 2011), the
Executive Board approved 20 loans to
Colombia totaling US$3.7 billion. Moreover,
the Bank delivered an average of six analytical
and advisory activities per fiscal year, in topics
as diverse as climate change, education
quality, decentralization, financial sector
access, poverty measurement, social
protection, health system modernization and
extractive industries. Disbursements over the
four year-period reached around US$3.9 billion
(US$975 million per fiscal year, on average),
while overall exposure to Colombia rose to
approximately US$7.5 billion. As of May 31,
2011, the IBRD had 22 active projects in
Colombia, while the IFC had a total portfolio of
US$1.1 billion. Colombia is the 7th largest
client of the World Bank Group (the 3rd largest
in the Region).
A new Country Partnership Strategy
(FY 12 –16) will be presented to the World
Bank Executive Board on July 21, 2011.2 1 Prepared by World Bank staff.
2 For a comprehensive description of World Bank activities, please refer to the Country Partnership Strategy Board Document (FY 12-16), Report No. 60620-CO, published July 21, 2011.
The CPS is designed to support the National
Development Plan, entitled Prosperity for All
(Prosperidad para Todos) 2011–14. The
overarching goals of this Plan are to increase
employment, reduce poverty, and improve
security. The World Bank Group will carry out
activities either through financial, knowledge,
or convening services for which the
government or the private sector has
expressed explicit need. These activities are
combined as a results-focused package of
support grouped in the CPS under three
strategic themes: (1) Expanding Opportunities
for Social Prosperity; (2) Sustainable Growth
with Enhanced Climate Change Resilience; and
(3) Inclusive Growth with Enhanced
Productivity.
The indicative lending program is expected
to reach US$1.1 billion in FY 12 and range
between US$800 and 1.1 billion per year in
FY 13–16. In FY 12, the Bank is expected to
present six new projects to the Board,
including: a First Programmatic Fiscal
Sustainability and Growth Resilience
Development Policy Loan (US$300 million), a
Second Catastrophic Deferred Draw Down
Option Development Policy Loan
(US$150 million), an Urban Transport
investment loan (US$350 million), a
Subnational Institutional Strengthening
investment loan (US$150 million), a
Smallholder Agriculture Competitiveness

2011 ARTICLE IV REPORT—INFORMATIONAL ANNEX COLOMBIA
4 INTERNATIONAL MONETARY FUND
investment loan (US$150 million), and a
Sustainable Development technical assistance
loan (US$10 million).
Aside from financial support, the Bank will
also be providing an array of knowledge
and convening services to Colombia in
FY 12. Theme 1 activities cover areas such as
social promotion, education opportunities, and
improved social services. Theme 2 services
include urbanization reviews, support to the
infrastructure concession agency, low carbon
development, and strengthening
environmental institutions. Finally, within
Theme 3, there is planned and ongoing work
on financial sector development, poverty, labor
markets, monitoring and evaluation, public
sector strengthening, institutional and mineral
rights, productivity, competitiveness, and
entrepreneurship. One important aspect of this
work is its multi-year programmatic approach,
where the Bank is actively engaged in a
consistent manner over time, defining its work
program in each area, according to client
demand.
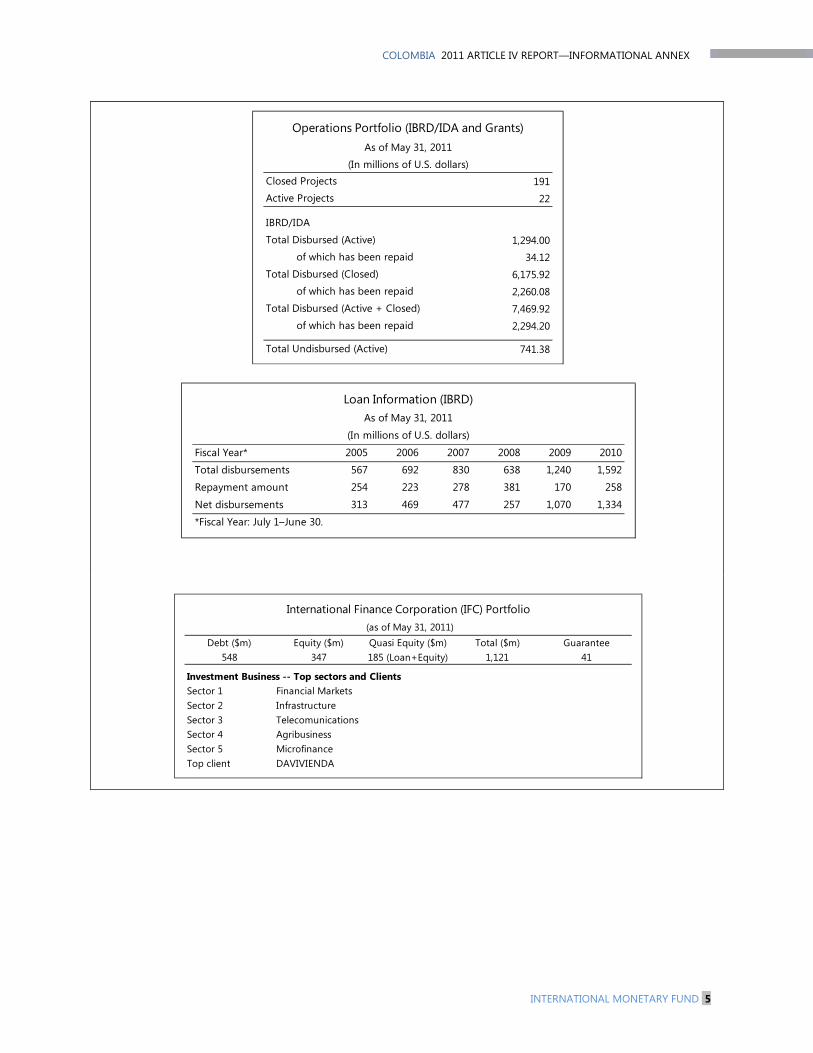
COLOMBIA 2011 ARTICLE IV REPORT—INFORMATIONAL ANNEX
INTERNATIONAL MONETARY FUND 5
Closed Projects 191Active Projects 22
IBRD/IDA
Total Disbursed (Active) 1,294.00 of which has been repaid 34.12Total Disbursed (Closed) 6,175.92 of which has been repaid 2,260.08Total Disbursed (Active + Closed) 7,469.92 of which has been repaid 2,294.20
Total Undisbursed (Active) 741.38
Operations Portfolio (IBRD/IDA and Grants)As of May 31, 2011
(In millions of U.S. dollars)
Fiscal Year* 2005 2006 2007 2008 2009 2010
Total disbursements 567 692 830 638 1,240 1,592
Repayment amount 254 223 278 381 170 258
Net disbursements 313 469 477 257 1,070 1,334
Loan Information (IBRD)As of May 31, 2011
(In millions of U.S. dollars)
*Fiscal Year: July 1–June 30.
Debt ($m) Equity ($m) Quasi Equity ($m) Total ($m) Guarantee548 347 185 (Loan+Equity) 1,121 41
Sector 1Sector 2Sector 3Sector 4Sector 5Top client DAVIVIENDA
International Finance Corporation (IFC) Portfolio (as of May 31, 2011)
Investment Business -- Top sectors and ClientsFinancial MarketsInfrastructureTelecomunicationsAgribusinessMicrofinance
2011 ARTICLE IV REPORT—INFORMATIONAL ANNEX COLOMBIA
6 INTERNATIONAL MONETARY FUND
ANNEX III. COLOMBIA: INTER-AMERICAN DEVELOPMENT BANK RELATIONS1
The Bank’s ongoing country strategy with
Colombia for 2007–2010 identifies the main
targets of engagement in the areas of
competitiveness, social development, and
governance and strengthening of the
State.2 These three areas are part of a
comprehensive vision for the development
process, aimed at creating a “virtuous circle”
between the objectives of increased growth,
and reduced poverty and inequality, by
contributing to the generation of mechanisms
that strengthen the bonds between these
objectives while having a direct effect on both.
There are cross-cutting requirements
associated with these areas, in order to
overcome conditions of poverty and inequity,
which are: (i) targeting actions and resources
to a balanced, multidimensional approach to
regional development in relation to public
management and competitiveness, and
(ii) recognizing both infrastructure
development, and human and social capital
development, as necessary factors for greater
competitiveness, stronger institutions and
better governance.
1 Prepared by Inter-American Development Bank staff. 2 The strategy for 2011–14 is currently under preparation and expected to be approved in August 2011.
Between 2007 and 2010, the Bank approved
US$3.5 billion to the sovereign sector, with
average annual disbursements of
US$833 million. The Bank portfolio is
currently composed of 23 operations totaling
US$2.1 billion, with a disbursed amount of
US$1.2 billion (58.2 percent). In relationship to
the three strategic areas, 15 of the 23
sovereign operations were in competitiveness
for US$240 million (66 of the portfolio), 5 were
in social development (32 percent) and 3 were
in governance (2 percent). The non-
reimbursable technical cooperation portfolio
includes 95 operations with an approved value
of US$48.7 million.
The current portfolio of private sector
initiatives (non-sovereign guarantee) in
Colombia consists of 3 loans, totaling
US$250.0 million. This portfolio supports
interventions in the transportation sector,
infrastructure financing, expanding low-
income families’ access to commercial credit
and the promotion of international trade. In
addition, the Multilateral Investment Fund has
a portfolio of 53 operations valued at
US$52.8 million that supports microfinance
institutions in underserved areas, provides
seed capital and helps to improve
management practices of small and medium
enterprises.
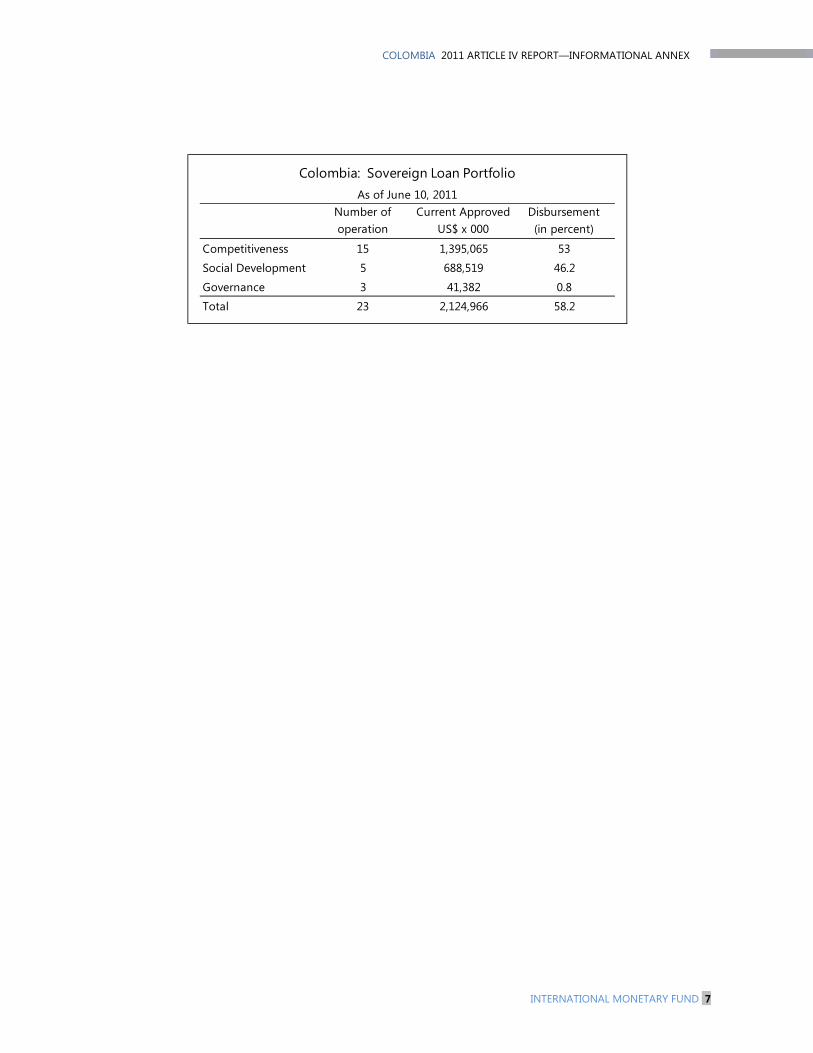
COLOMBIA 2011 ARTICLE IV REPORT—INFORMATIONAL ANNEX
INTERNATIONAL MONETARY FUND 7
Number of operation
Current Approved US$ x 000
Disbursement (in percent)
15 1,395,065 53
5 688,519 46.2
3 41,382 0.8
Total 23 2,124,966 58.2
Competitiveness
Social Development
Governance
Colombia: Sovereign Loan PortfolioAs of June 10, 2011

2011 ARTICLE IV REPORT—INFORMATIONAL ANNEX COLOMBIA
8 INTERNATIONAL MONETARY FUND
ANNEX IV. COLOMBIA: STATISTICAL ISSUES (as of June 15, 2011)
I. Assessment of Data Adequacy for Surveillance
Data provision is adequate for surveillance.
Real sector
The National Department of Statistics (DANE) is responsible for the compilation of the national accounts, although the Banco de la República (BdR) compiles the financial accounts. Estimates of GDP by the production and the expenditure approaches both use 2005 as their base year. GDP compilation conforms to the methodological recommendations of the System of National Accounts 1993 (1993 SNA). The rebasing of the national accounts’ base year included a change in the index formulae (historically it was a Laspeyres fixed-base index, but it is a Laspeyres chain index with the 2005 base year). The main implications of the rebasing are that the 2000 and 2005 are not comparable and the chain index is associated with non-additivity of the components. The rebasing also resulted in a revision of the nominal GDP reflecting improvements in source data.
Government finance statistics
The Ministry of Finance and Public Credit (MFPC) is responsible for the compilation of public revenue, expenditure, and financing data. While significant progress has been made, there is still a need to improve the timeliness and coverage of fiscal data, develop timely and reliable data on the finances of local governments, and improve monitoring of floating debts. Data cover the nonfinancial public sector (NFPS), but coverage of “above-the-line” operations of units outside the national administration is not exhaustive due to capacity constraints.
The General Accounting Office (GAO) has developed a single accounting database for the public sector. The GAO accounting classification is bridged to the GFSM 2001 framework to compile GFS on accrual and cash bases.
Financial sector statistics
The BdR is in charge of compiling data on the financial sector, while the Superintendency of Banks and the Superintendency of Securities compile data in their respective areas. Fund technical assistance missions have placed special emphasis on issues supportive of data quality, including interagency cooperation and procedures to ensure data consistency.
Balance of payments and external debt
The BdR is in charge of compiling and disseminating balance of payments statistics. Quarterly data have been produced since 1994, and the BdR adopted the BPM5 standard in 1998. Balance of payment statistics have been extended to cover transactions in the free trade zones. Improved surveys, particularly in the service sector, have enhanced coverage and consistency and financial account data are now based on actual disbursement rather than registers.
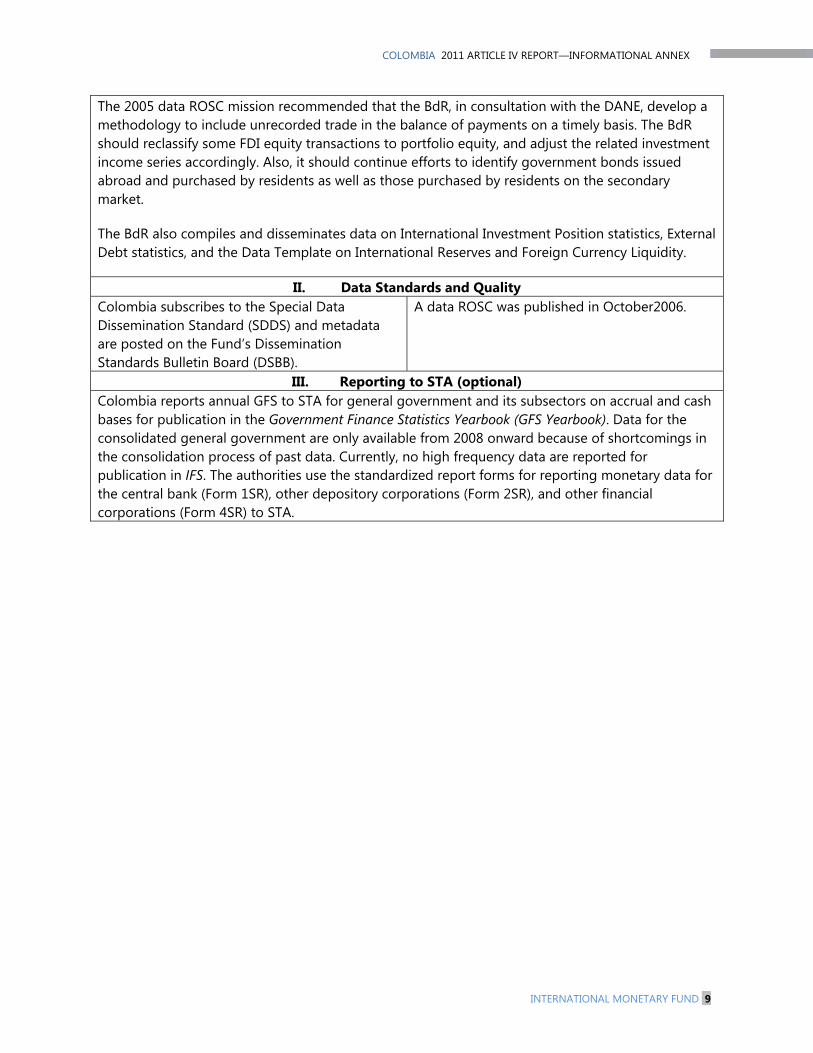
COLOMBIA 2011 ARTICLE IV REPORT—INFORMATIONAL ANNEX
INTERNATIONAL MONETARY FUND 9
The 2005 data ROSC mission recommended that the BdR, in consultation with the DANE, develop a methodology to include unrecorded trade in the balance of payments on a timely basis. The BdR should reclassify some FDI equity transactions to portfolio equity, and adjust the related investment income series accordingly. Also, it should continue efforts to identify government bonds issued abroad and purchased by residents as well as those purchased by residents on the secondary market.
The BdR also compiles and disseminates data on International Investment Position statistics, External Debt statistics, and the Data Template on International Reserves and Foreign Currency Liquidity.
II. Data Standards and Quality Colombia subscribes to the Special Data Dissemination Standard (SDDS) and metadata are posted on the Fund’s Dissemination Standards Bulletin Board (DSBB).
A data ROSC was published in October2006.
III. Reporting to STA (optional) Colombia reports annual GFS to STA for general government and its subsectors on accrual and cash bases for publication in the Government Finance Statistics Yearbook (GFS Yearbook). Data for the consolidated general government are only available from 2008 onward because of shortcomings in the consolidation process of past data. Currently, no high frequency data are reported for publication in IFS. The authorities use the standardized report forms for reporting monetary data for the central bank (Form 1SR), other depository corporations (Form 2SR), and other financial corporations (Form 4SR) to STA.

2011 ARTICLE IV REPORT—INFORMATIONAL ANNEX COLOMBIA
10 INTERNATIONAL MONETARY FUND
Colombia: Table of Common Indicators Required for Surveillance
As of June 15, 2011
Date of latest
observation
Date received
Frequency of
Data1
Frequency of
Reporting1
Frequency of
publication1
Memo Items: Data Quality –
Methodological soundness8
Data Quality – Accuracy and
reliability9
Exchange Rates May 2011 Jun. 1, 2011 D W D
International Reserve Assets and Reserve Liabilities of the Monetary Authorities2
Apr. 2011 May 23 2011 M M M
Reserve/Base Money Apr. 2011 May 17, 2011 D W W
LO, O, LO, LO O, O, O, O, O
Broad Money Mar. 2011 May 17, 2011 D W W
Central Bank Balance Sheet Apr. 2011 May 17, 2011 M M M
Consolidated Balance Sheet of the Banking System
Mar. 2011 May 17, 2011 M M M
Interest Rates3 May 2011 Jun. 7, 2011 D W D
Consumer Price Index Apr. 2011 May 17, 2011 M M M
Revenue, Expenditure, Balance and Financing Composition4 – General Government (GG)5
Q2 2009 Feb. 2010 Q Q Q
O, O, LO, O LO, O, O, O, NO Revenue, Expenditure, Balance and Composition of Financing4 – Central Government
2009 Apr. 2011 M M M
Stocks of Central Government and Central Government-Guaranteed Debt6
Q3 2009 Jan. 2010 Q Q Q
External Current Account Balance Q4 2010 Apr. 14, 2011 Q Q Q
O, LO, LO, LO O, O, O, O, LO Exports and Imports of Goods and Services
Q4 2010 Apr. 14, 2011 Q Q Q
GDP/GNP Q4 2010 Apr. 20, 2011 Q Q Q O, LO, O, O LO, O, LO, LO, NO
Gross External Debt Sep. 2009 Jan. 2010 M M M
International Investment Position7 Q4 2011 Apr. 14, 2011 Q Q Q
1 Daily (D); Weekly (W); Monthly (M); Bi-monthly (B); Quarterly (Q); Annually (A); Irregular (I); Not Available (NA). 2 Includes reserve assets pledged or otherwise encumbered as well as net derivative positions. 3 Both market-based and officially-determined, including discount rates, money market rates, rates on treasury bills, notes and bonds. 4 Foreign, domestic bank, and domestic nonbank financing. 5 The GG consists of the central government (budgetary funds, extra budgetary funds, and social security funds) and state and local governments. 6 Including currency and maturity composition. 7 Includes external gross financial asset and liability positions vis-à-vis nonresidents. 8 Reflects the assessment provided in the data ROSC published in October 2006 for the dataset corresponding to the variable in each row. The assessment indicates whether international standards concerning concepts and definitions, scope, classification/sectorization, and basis for recording are fully observed (O); largely observed (LO); largely not observed (LNO); not observed (NO); and not available (NA). 9 Same as footnote 8, except referring to international standards concerning (respectively) source data, assessment of source data, statistical techniques, assessment and validation of intermediate data and statistical outputs, and revision studies.
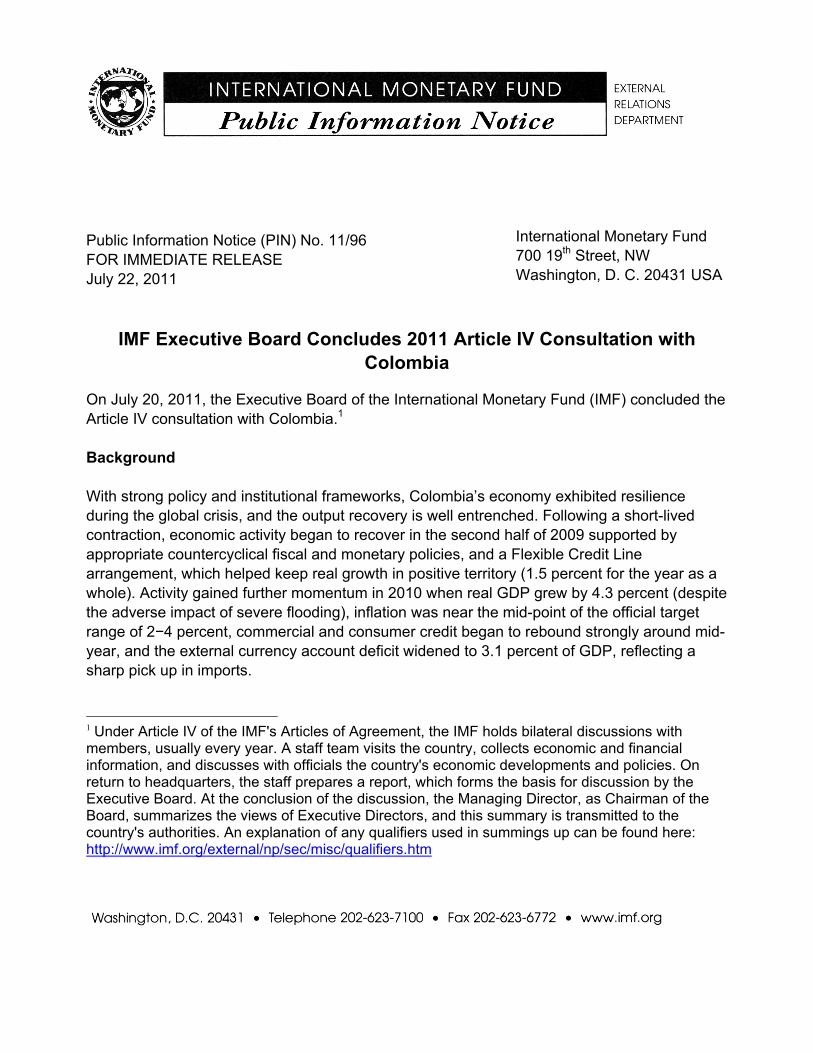
Public Information Notice (PIN) No. 11/96 FOR IMMEDIATE RELEASE July 22, 2011
IMF Executive Board Concludes 2011 Article IV Consultation with Colombia
On July 20, 2011, the Executive Board of the International Monetary Fund (IMF) concluded the Article IV consultation with Colombia.1 Background With strong policy and institutional frameworks, Colombia’s economy exhibited resilience during the global crisis, and the output recovery is well entrenched. Following a short-lived contraction, economic activity began to recover in the second half of 2009 supported by appropriate countercyclical fiscal and monetary policies, and a Flexible Credit Line arrangement, which helped keep real growth in positive territory (1.5 percent for the year as a whole). Activity gained further momentum in 2010 when real GDP grew by 4.3 percent (despite the adverse impact of severe flooding), inflation was near the mid-point of the official target range of 2−4 percent, commercial and consumer credit began to rebound strongly around mid-year, and the external currency account deficit widened to 3.1 percent of GDP, reflecting a sharp pick up in imports.
1 Under Article IV of the IMF's Articles of Agreement, the IMF holds bilateral discussions with members, usually every year. A staff team visits the country, collects economic and financial information, and discusses with officials the country's economic developments and policies. On return to headquarters, the staff prepares a report, which forms the basis for discussion by the Executive Board. At the conclusion of the discussion, the Managing Director, as Chairman of the Board, summarizes the views of Executive Directors, and this summary is transmitted to the country's authorities. An explanation of any qualifiers used in summings up can be found here: http://www.imf.org/external/np/sec/misc/qualifiers.htm
International Monetary Fund 700 19th Street, NW Washington, D. C. 20431 USA
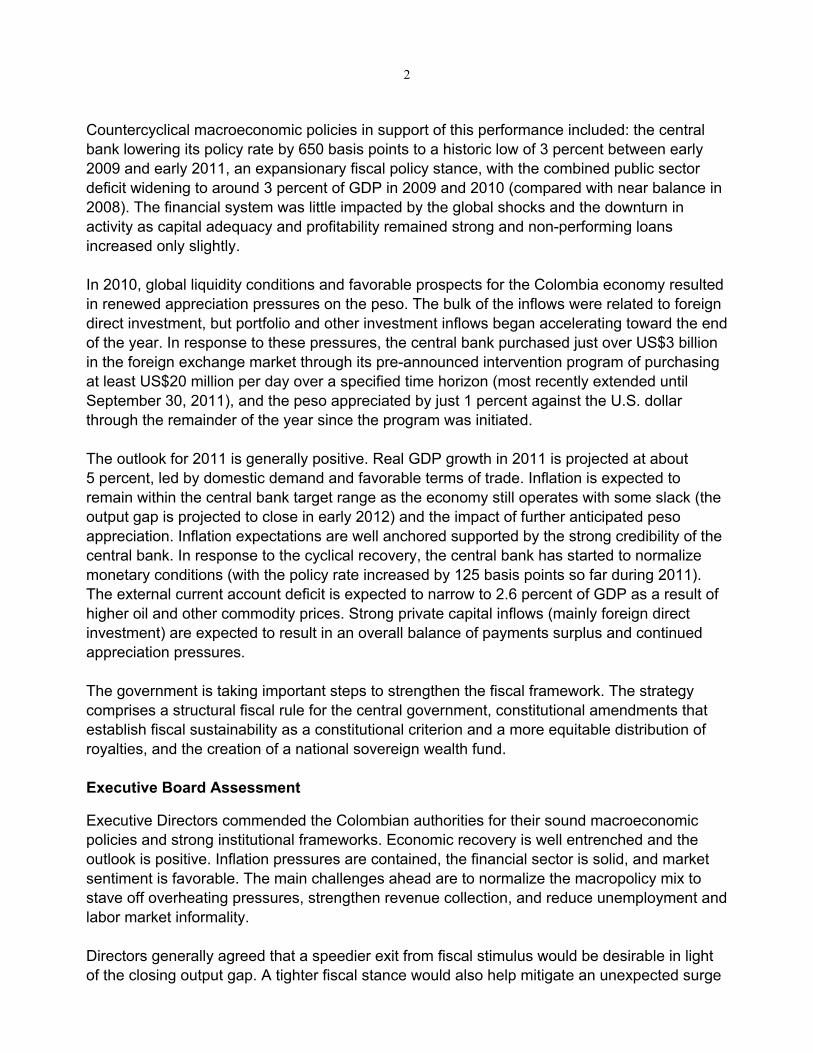
2
Countercyclical macroeconomic policies in support of this performance included: the central bank lowering its policy rate by 650 basis points to a historic low of 3 percent between early 2009 and early 2011, an expansionary fiscal policy stance, with the combined public sector deficit widening to around 3 percent of GDP in 2009 and 2010 (compared with near balance in 2008). The financial system was little impacted by the global shocks and the downturn in activity as capital adequacy and profitability remained strong and non-performing loans increased only slightly. In 2010, global liquidity conditions and favorable prospects for the Colombia economy resulted in renewed appreciation pressures on the peso. The bulk of the inflows were related to foreign direct investment, but portfolio and other investment inflows began accelerating toward the end of the year. In response to these pressures, the central bank purchased just over US$3 billion in the foreign exchange market through its pre-announced intervention program of purchasing at least US$20 million per day over a specified time horizon (most recently extended until September 30, 2011), and the peso appreciated by just 1 percent against the U.S. dollar through the remainder of the year since the program was initiated. The outlook for 2011 is generally positive. Real GDP growth in 2011 is projected at about 5 percent, led by domestic demand and favorable terms of trade. Inflation is expected to remain within the central bank target range as the economy still operates with some slack (the output gap is projected to close in early 2012) and the impact of further anticipated peso appreciation. Inflation expectations are well anchored supported by the strong credibility of the central bank. In response to the cyclical recovery, the central bank has started to normalize monetary conditions (with the policy rate increased by 125 basis points so far during 2011). The external current account deficit is expected to narrow to 2.6 percent of GDP as a result of higher oil and other commodity prices. Strong private capital inflows (mainly foreign direct investment) are expected to result in an overall balance of payments surplus and continued appreciation pressures. The government is taking important steps to strengthen the fiscal framework. The strategy comprises a structural fiscal rule for the central government, constitutional amendments that establish fiscal sustainability as a constitutional criterion and a more equitable distribution of royalties, and the creation of a national sovereign wealth fund. Executive Board Assessment
Executive Directors commended the Colombian authorities for their sound macroeconomic policies and strong institutional frameworks. Economic recovery is well entrenched and the outlook is positive. Inflation pressures are contained, the financial sector is solid, and market sentiment is favorable. The main challenges ahead are to normalize the macropolicy mix to stave off overheating pressures, strengthen revenue collection, and reduce unemployment and labor market informality. Directors generally agreed that a speedier exit from fiscal stimulus would be desirable in light of the closing output gap. A tighter fiscal stance would also help mitigate an unexpected surge

3
in capital inflows and avoid overburdening monetary policy. Directors encouraged the authorities to save any overperformance in government revenues this year and restrain expenditure where feasible. Directors welcomed the recent legislative reforms to strengthen further the medium-term fiscal framework, including the adoption of a fiscal rule for the central government. They noted that these reforms will bolster Colombia’s commitment to fiscal sustainability, and encouraged the authorities to make them operational in a timely manner. Directors supported the authorities’ plans to broaden the tax base and reduce distortions to spur formal sector activity. They welcomed the creation of a national Sovereign Wealth Fund to manage windfall fiscal gains. Directors stressed the importance of developing a strategy to address the large contingent liabilities in the pension and healthcare systems. Directors noted that the inflation targeting framework has served Colombia well. They supported the gradual normalization of the monetary stance to mitigate inflation pressures without exacerbating capital inflows. Directors underscored that exchange rate flexibility, alongside limited intervention in the foreign exchange market, should remain the primary tool for absorbing capital inflows. Additional tools, including strengthened macroprudential regulation and capital flow management policies, can play a role in the event that capital inflows threaten financial stability. Most Directors supported the policy intention to further improve reserve coverage. Directors noted that the financial system is sound. Credit and asset market developments however should be closely monitored for overheating risks. Directors welcomed improvements in financial supervision, particularly recent measures to improve the coordination of information exchange, bank resolution, and the design of macroprudential regulation. Directors encouraged the authorities to complete their analysis of the composition of bank capital and liquidity under Basel III. Directors urged the authorities to build on recent labor market reforms to lower unemployment and labor market informality. They welcomed the authorities’ measures to improve incentives for firms to operate in the formal sector, but stressed the need to tackle remaining structural impediments including by broadening cuts in the still high labor taxation and addressing the binding minimum wage.
Public Information Notices (PINs) form part of the IMF's efforts to promote transparency of the IMF's views and analysis of economic developments and policies. With the consent of the country (or countries) concerned, PINs are issued after Executive Board discussions of Article IV consultations with member countries, of its surveillance of developments at the regional level, of post-program monitoring, and of ex post assessments of member countries with longer-term program engagements. PINs are also issued after Executive Board discussions of general policy matters, unless otherwise decided by the Executive Board in a particular case.

4
Colombia: Selected Economic Indicators
Prel.
2006 2007 2008 2009 2010
(Annual percentage change, unless otherwise indicated)
National income and prices
Real GDP 6.7 6.9 3.5 1.5 4.3 Consumer prices (average) 4.3 5.5 7.0 4.2 2.3 Consumer prices (end-of-period) 4.5 5.7 7.7 2.0 3.2 Real effective exchange rate (depreciation -) -1.0 7.7 0.4 5.2 5.5
Money and credit
Broad money 18.0 17.4 18.5 8.1 11.5 Credit to the private sector 35.6 25.6 14.0 0.9 16.8 Interest rate (90-day time deposits; percent per year)
Nominal 6.8 9.0 10.1 4.1 3.5 Real 2.3 3.3 2.4 2.1 0.3
(In percent of GDP, unless otherwise indicated)
External sector
Current account (deficit-) -1.9 -2.9 -2.9 -2.2 -3.1 External debt 25.0 21.2 19.7 22.9 22.4 Of which: Public sector 16.4 13.7 12.5 15.9 13.6 GIR in percent of short-term debt 147.6 198.7 207.3 244.4 183.7
Savings and investment
Gross domestic investment 22.4 23.0 23.4 22.7 22.5 Gross national savings 20.5 20.2 20.5 20.5 19.4
Public finances
Combined public sector balance -0.7 -0.7 -0.1 -2.7 -3.2 Central government balance -3.4 -2.7 -2.3 -4.1 -3.8 Public debt 1/ 36.8 32.7 30.8 36.3 36.4
Sources: Colombian authorities; and IMF staff estimates and projections. 1/ Includes Ecopetrol and Banco de la República's outstanding external debt.
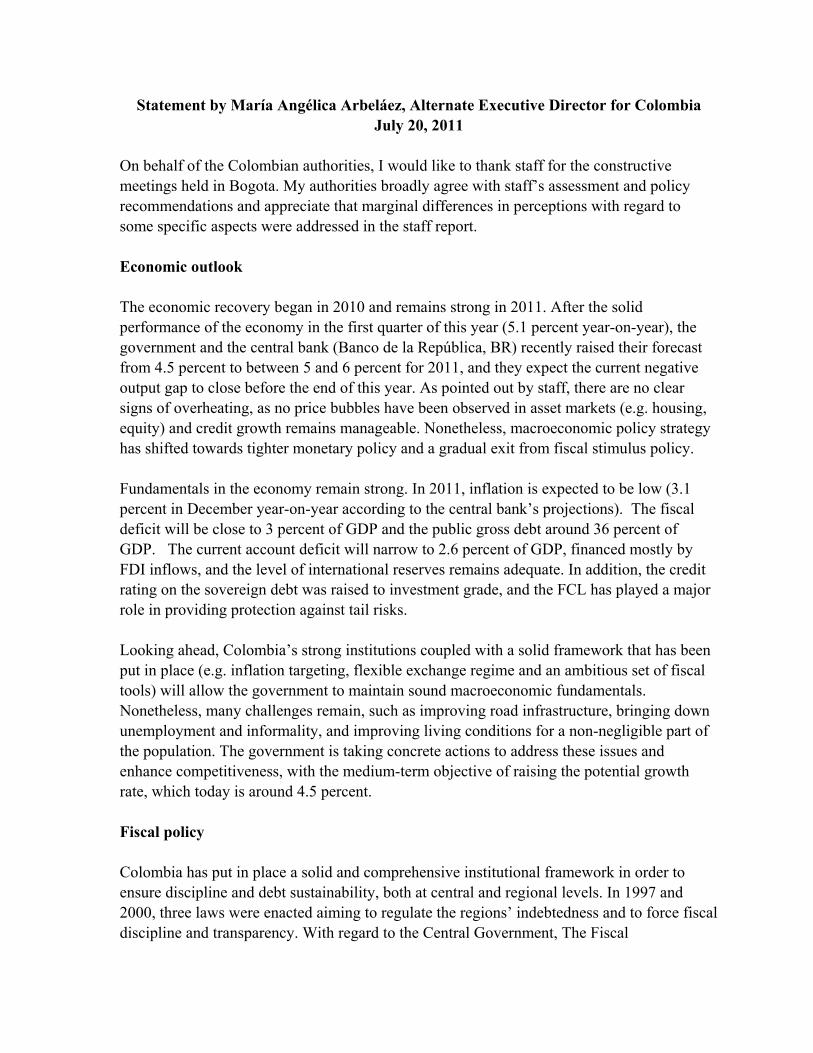
Statement by María Angélica Arbeláez, Alternate Executive Director for Colombia July 20, 2011
On behalf of the Colombian authorities, I would like to thank staff for the constructive meetings held in Bogota. My authorities broadly agree with staff’s assessment and policy recommendations and appreciate that marginal differences in perceptions with regard to some specific aspects were addressed in the staff report. Economic outlook The economic recovery began in 2010 and remains strong in 2011. After the solid performance of the economy in the first quarter of this year (5.1 percent year-on-year), the government and the central bank (Banco de la República, BR) recently raised their forecast from 4.5 percent to between 5 and 6 percent for 2011, and they expect the current negative output gap to close before the end of this year. As pointed out by staff, there are no clear signs of overheating, as no price bubbles have been observed in asset markets (e.g. housing, equity) and credit growth remains manageable. Nonetheless, macroeconomic policy strategy has shifted towards tighter monetary policy and a gradual exit from fiscal stimulus policy. Fundamentals in the economy remain strong. In 2011, inflation is expected to be low (3.1 percent in December year-on-year according to the central bank’s projections). The fiscal deficit will be close to 3 percent of GDP and the public gross debt around 36 percent of GDP. The current account deficit will narrow to 2.6 percent of GDP, financed mostly by FDI inflows, and the level of international reserves remains adequate. In addition, the credit rating on the sovereign debt was raised to investment grade, and the FCL has played a major role in providing protection against tail risks. Looking ahead, Colombia’s strong institutions coupled with a solid framework that has been put in place (e.g. inflation targeting, flexible exchange regime and an ambitious set of fiscal tools) will allow the government to maintain sound macroeconomic fundamentals. Nonetheless, many challenges remain, such as improving road infrastructure, bringing down unemployment and informality, and improving living conditions for a non-negligible part of the population. The government is taking concrete actions to address these issues and enhance competitiveness, with the medium-term objective of raising the potential growth rate, which today is around 4.5 percent. Fiscal policy Colombia has put in place a solid and comprehensive institutional framework in order to ensure discipline and debt sustainability, both at central and regional levels. In 1997 and 2000, three laws were enacted aiming to regulate the regions’ indebtedness and to force fiscal discipline and transparency. With regard to the Central Government, The Fiscal

2
Responsibility and Transparency Law adopted in 2003—which includes a Medium-Term Fiscal Framework and a Medium-Term Expenditure Plan—set specific ceilings of fiscal deficit and financing, and establishes maximum levels of spending. In addition to that, and with the purpose of creating mechanisms for additional savings during boom periods, three ambitious reforms were recently approved by Congress: a) The Fiscal Rule, which limits the structural deficit of the Central Government, creates mechanisms to increase savings from the expected large growth in hydrocarbon export related revenues, and develops rules to manage countercyclical fiscal policies; b) The Fiscal Sustainability Legislative Act, which incorporates fiscal sustainability as a general principle in the Constitution; and c) The Royalties Reform, an amendment to the Constitution that mandates that both regional and central governments save a large amount of hydrocarbon royalties (30 percent). It also directs ways to distribute royalties more fairly among the regions, and seeks to enhance the spending efficiency of such royalties. As staff has mentioned, the authorities are preparing the supporting legislation and are committed to passing it before 2012. In particular, concerning the Fiscal Rule, it is the highest priority for the Colombian government that the process of developing and monitoring key parameters for the rule is technically robust, transparent and independent, and is committed to acting accordingly. Moreover, the Fiscal Rule is perceived as an essential tool for fiscal discipline and the authorities will gradually reduce the Central Government’s deficit until reaching the target of below 1 percent of GDP from 2022 onwards—as established by the Rule, which will be met through significant spending cuts independent of new tax reforms. With respect to revenues, the authorities have acknowledged the need to improve the tax structure. Indeed, as mentioned in the staff report the new government enacted a tax reform in 2010, which eliminated some exemptions, broadened the tax base, and gradually dismounted distortionary taxes such as the financial transactions tax. Looking ahead, they see further room to improve the tax structure although through measures that stimulate private activity and reduce the informal economy. Tax adjustments could include broadening the tax base and reducing tariffs (the income tariff of 33 percent is extremely high compared to peers and competitors), and eliminating some VAT rebates. They expect significant results from such measures, as they will generate higher economic dynamism. The Colombian Ministry of Finance valued the recent Fund’s TA mission on tax reform and shares some of the recommendations, and is designing a tax package that will be presented to Congress when they consider conditions are appropriate. Over the short term, the fiscal adjustment in 2011 was delayed due to severe flooding in the country. The floods cost around 0.5 percent of GDP in 2011, and the total reconstruction costs are estimated to be between 2 and 3 percent of GDP. It must be noted that the authorities have tackled this negative shock by increasing taxes and reducing spending to ensure an unchanged fiscal stance, highlighting their commitment to fiscal stability.

3
Moreover, the budget for 2011 that was approved before the tax reform of 2010 was not modified according to the expected additional revenues. Therefore, the revenues driven by the reform—which have been higher than expected—combined with the spending lower than envisaged, will likely result in a lower deficit by around 0.4 percent of GDP than the one projected by the authorities (3.4 percent of GDP for the combined public sector). Should these circumstances materialized, and considering that the target for 2012 is a further significant reduction, the authorities perceive that the fiscal policy would not be pro-cyclical. Monetary policy The inflation targeting regime adopted in the late 1990s, has served the economy well, as it has brought down inflation significantly, has increased monetary policy credibility and has anchored inflation expectations, giving the authorities the flexibility and opportunity to react to the rapidly changing macroeconomic environment. After two years of an accommodative monetary stance, that helped the country to cope with the global financial crisis, the BR started tightening monetary policy in 2011. Since February, it has raised its benchmark interest rate by 25 basis points every month, with the double objective of keeping inflation low/stable and smoothing the business cycle. The path toward a neutral monetary stance remains a precautionary and medium-term policy: in circumstances of high commodity prices and higher hydrocarbons’ production, close vigilance is warranted in order to avoid overheating and potential financial imbalances. In the short run, despite contained inflation (3.2 percent year-on-year in June) and inflation expectations, the BR is carefully monitoring the evolution of asset prices and credit, and is prepared to act promptly should signs of overheating appear. Capital inflows Colombia is also fully committed to exchange rate flexibility. The authorities see the exchange rate as the most important shock absorber to mitigate the effects of the surge in capital inflows. As staff pointed out, capital inflows have continued to increase, mostly under the form of FDI, although recently portfolio flows have risen as well. The Colombian authorities believe this is a positive trend, but they recognize some potential effects associated with a surge in these inflows, such as financial instability and excess exchange rate appreciation. The main policy response that the central bank has used to contain excess appreciation in the currency has been the program of pre-announced daily purchases of foreign exchange (US$20 million per day). However, it is worth mentioning that besides correcting exchange rate misalignments, the main objective of interventions has been to build up international reserves. The central bank has found that this transparent, small and predictable intervention is more effective than a large-scale and unpredictable accumulation of international reserves. According to BR’s analyses, interventions have been effective, especially when the amounts were fixed and when the exchange rate was excessively low
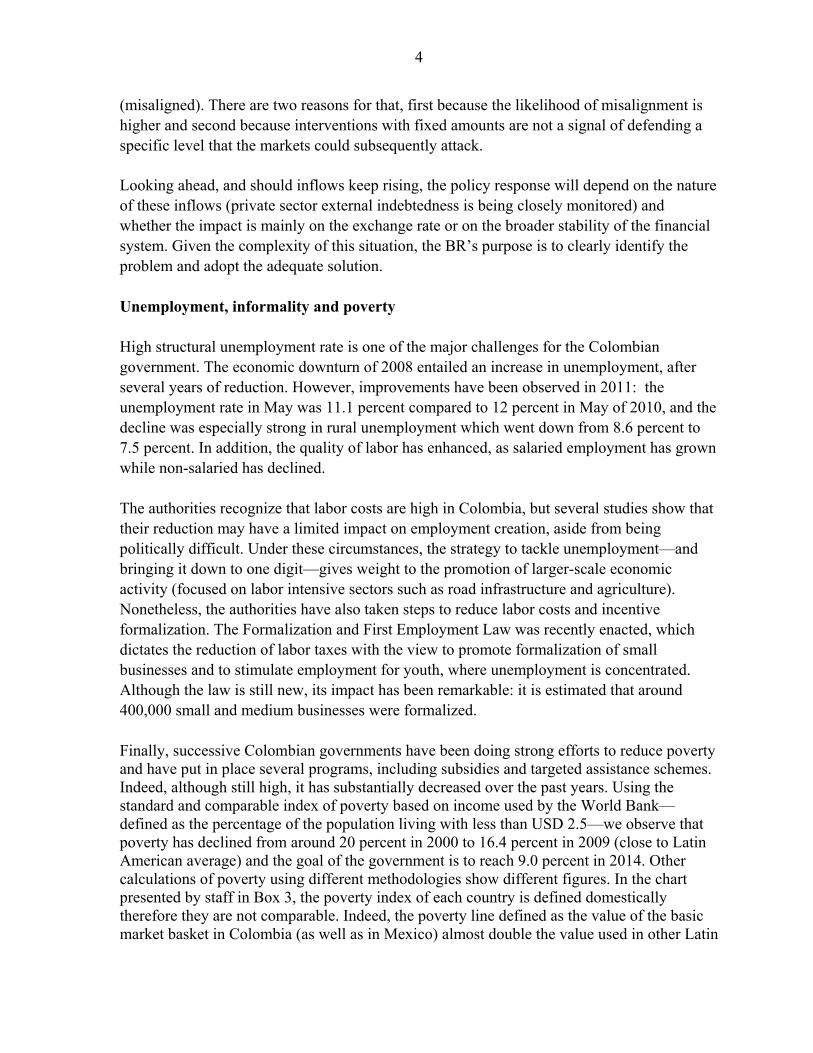
4
(misaligned). There are two reasons for that, first because the likelihood of misalignment is higher and second because interventions with fixed amounts are not a signal of defending a specific level that the markets could subsequently attack.
Looking ahead, and should inflows keep rising, the policy response will depend on the nature of these inflows (private sector external indebtedness is being closely monitored) and whether the impact is mainly on the exchange rate or on the broader stability of the financial system. Given the complexity of this situation, the BR’s purpose is to clearly identify the problem and adopt the adequate solution. Unemployment, informality and poverty High structural unemployment rate is one of the major challenges for the Colombian government. The economic downturn of 2008 entailed an increase in unemployment, after several years of reduction. However, improvements have been observed in 2011: the unemployment rate in May was 11.1 percent compared to 12 percent in May of 2010, and the decline was especially strong in rural unemployment which went down from 8.6 percent to 7.5 percent. In addition, the quality of labor has enhanced, as salaried employment has grown while non-salaried has declined. The authorities recognize that labor costs are high in Colombia, but several studies show that their reduction may have a limited impact on employment creation, aside from being politically difficult. Under these circumstances, the strategy to tackle unemployment—and bringing it down to one digit—gives weight to the promotion of larger-scale economic activity (focused on labor intensive sectors such as road infrastructure and agriculture). Nonetheless, the authorities have also taken steps to reduce labor costs and incentive formalization. The Formalization and First Employment Law was recently enacted, which dictates the reduction of labor taxes with the view to promote formalization of small businesses and to stimulate employment for youth, where unemployment is concentrated. Although the law is still new, its impact has been remarkable: it is estimated that around 400,000 small and medium businesses were formalized. Finally, successive Colombian governments have been doing strong efforts to reduce poverty and have put in place several programs, including subsidies and targeted assistance schemes. Indeed, although still high, it has substantially decreased over the past years. Using the standard and comparable index of poverty based on income used by the World Bank— defined as the percentage of the population living with less than USD 2.5—we observe that poverty has declined from around 20 percent in 2000 to 16.4 percent in 2009 (close to Latin American average) and the goal of the government is to reach 9.0 percent in 2014. Other calculations of poverty using different methodologies show different figures. In the chart presented by staff in Box 3, the poverty index of each country is defined domestically therefore they are not comparable. Indeed, the poverty line defined as the value of the basic market basket in Colombia (as well as in Mexico) almost double the value used in other Latin

5
American countries; therefore the rate of poverty appears to be much higher. Nonetheless the government acknowledges that poverty is still high and all efforts are focused on attaining a more balanced and pro-poor growth.