color reproduction of facial pattern … color reproduction of facial pattern and endoscopic image...
TRANSCRIPT
COLOR REPRODUCTION OF FACIAL
PATTERN AND ENDOSCOPIC IMAGE BASED
ON COLOR APPEARANCE MODELS
December 1996
Francisco Hideki Imai
Graduate School of Science and Technology
Chiba University, JAPAN

ii
Dedicated to my parentsDedicated to my parents

iii
COLOR REPRODUCTION OF FACIAL
PATTERN AND ENDOSCOPIC IMAGE BASED
ON COLOR APPEARANCE MODELS
A dissertation submitted to the Graduate School ofScience and Technology of Chiba University in partial
fulfillment of the requirements for the degree of
Doctor of Philosophy
by
Francisco Hideki Imai
December 1996

iv
Declaration
This is to certify that this work has been done by me and ithas not been submitted elsewhere for the award of anydegree or diploma.
Countersigned Signature of the student
___________________________________ _______________________________
Yoichi Miyake, Professor Francisco Hideki Imai

v
The undersigned have examined the dissertation entitled
COLOR REPRODUCTION OF FACIAL PATTERN AND ENDOSCOPIC IMAGE
BASED ON COLOR APPEARANCE MODELS
presented by _______Francisco Hideki Imai____________, a candidate for the degree of
Doctor of Philosophy, and hereby certify that it is worthy of acceptance.
______________________________ ______________________________
Date Advisor Yoichi Miyake, Professor
EXAMINING COMMITTEE
____________________________
Yoshizumi Yasuda, Professor
____________________________
Toshio Honda, Professor
____________________________
Hirohisa Yaguchi, Professor
____________________________
Atsushi Imiya, Associate Professor

vi
Abstract
In recent years, many imaging systems have been developed, and it became increasingly
important to exchange image data through the computer network. Therefore, it is required to
reproduce color independently on each imaging device. In the studies of device independent
color reproduction, colorimetric color reproduction has been done, namely color with same
chromaticity or tristimulus values is reproduced. However, even if the tristimulus values are
the same, color appearance is not always same under different viewing conditions. Therefore
we must introduce color appearance prediction for color reproduction of image.
In this dissertation, a new color reproduction method based on color appearance
prediction is introduced for color reproduction of facial pattern and endoscopic image.
First, spectral reflectance of skin color was analyzed by principal component analysis,
and it was shown that the spectral reflectance of skin can be estimated by three principal
components. On the basis of these experimental results, spectral reflectances of facial
pattern taken by HDTV camera was estimated, and computer simulation of colorimetric color
reproduction has been done using those obtained spectral reflectances.
Color appearance models of von Kries, Fairchild, LAB were also introduced to this
color reproduction algorithm. The image calculated by those models were compared with
the color hardcopies under various illuminants (“A”, “Day Light”, “Horizon”, and “Cool
White”) using memory matching technique. It was found that the Fairchild model is most
significant to estimate the color appearance of skin color chart under different illuminants.
However, the model was not significant to apply to estimation of color appearance in facial
pattern. Therefore, modified Fairchild model was introduced to estimate the color
appearance of facial pattern. It was shown in psychophysical experiments that the model can
estimate well the color appearance of facial pattern compared to other models.

vii
These experiments have been done in the dark environment. However, the practical
image on a CRT is usually watched under the environmental illuminant. We must apply
color appearance models to reproduce image on a CRT under various illuminants, specially
for remote diagnosis of endoscopic images. It is necessary to do a gamut-mapping for
image which cannot be reproduced in gamut of CRT. However, up to this time, there is not
any way to quantify how gamut-mapping affects the perceived color appearance. A
psychophysical metric based on Mahalanobis distance was introduced to evaluate the
influence of gamut-mapping in the color appearance instead of conventional color difference.
The distance is calculated by covariance matrix of metric lightness, chroma and hue angle
obtained by psychophysical experiments.

viii
ACKNOWLEDGMENTS
At first, I would like to thank Prof. Yoichi Miyake for his supervision, giving
the opportunity to work at his image processing laboratory. I also would like
to thank Dr. Hideaki Haneishi and Dr. Norimichi Tsumura for their fruitful
comments and advices. Special note of thanks goes to Prof. Hirohisa Yaguchi
for his collaboration.
I would like to express my gratitude to Dr. Nobutoshi Ojima of Kao
Corporation, for his cooperation and useful advice.
Thanks are also due to Kenji Koyama, Toshiki Saito and Takafumi
Horiuchi for many helps in the psychophysical experiments, and many thanks
to Reiko Fukumasu for her kindness and patience in being a model for the
pictures. I am also indebted to Mr. Yasuaki Yokoyama for many helps in
using the computers and devices at the laboratory, and to Mr. Kenji Hara for
his kind collaboration. Special thanks to everyone who participated in the
psychophysical experiments as observer.
I am deeply grateful to my parents, brother, sister for their love and
affection.
Finally, I would like to acknowledge the financial support given by Chiba
Prefecture Government from 1993 April to 1995 March and by Brazilian
Government, CNPq, Ministry for Science and Technology, for the scholarship
from 1996 September to the end of the course. I am also grateful to many
other people, whose names cannot be mentioned one by one, that in some
way have contributed for the accomplishment of this research.
Francisco Hideki Imai

ix
CONTENTS
Chapter Page
1 INTRODUCTION 1
1.1 Color reproduction on CRT and hardcopy 3
1.1.1 Colorimetric color reproduction 3
1.1.2 Color appearance models 4
1.1.3 Limitation of the traditional color reproduction methods 5
1.2 Purpose and approach of this research 6
1.3 Organization of this dissertation 7
2 PREDICTION OF SPECTRAL REFLECTANCE OF A FACIAL
PATTERN IMAGE TAKEN BY HDTV CAMERA 8
2.1 Introduction 8
2.2 Principal component analysis of the spectral reflectances of human skin and
their linear approximation 8
2.3 Estimation of the skin spectral reflectance 15
2.4 Characterization of HDTV camera 18
2.5 Conclusion 22
3 COLORIMETRIC COLOR REPRODUCTION OF FACIAL
PATTERN IMAGE ON CRT 23
3.1 Introduction 23
3.2 Tristimulus values of facial pattern image 24
3.3 Calibration of CRT 24
3.4 Experiments and their results 27
3.5 Conclusion 34
4 COLORIMETRIC COLOR REPRODUCTION OF FACIAL PATTERN
IMAGE ON HARDCOPY 36
4.1 Introduction 36
4.2 Color reproduction method for hardcopy under various illuminants 36
4.3 Multiple regression analysis using skin spectral reflectances 37
4.4 Experimental results 40
4.5 Conclusion 42

x
5 COLOR REPRODUCTION OF FACIAL PATTERN IMAGE BASED ON
COLOR APPEARANCE MODELS 43
5.1 Introduction 43
5.1.1 Chromatic adaptation models 43
5.1.2 Viewing techniques for cross-media comparison 49
5.2 Color appearance matching method 50
5.3 Psychophysical experiments 52
5.4 Experimental results 60
5.5 Conclusion 63
6 MODIFIED FAIRCHILD CHROMATIC ADAPTATION MODEL FOR
FACIAL PATTERN IMAGES 64
6.1 Introduction 64
6.2 Modified Fairchild chromatic adaptation model 64
6.3 Psychophysical experiments to tune color balance 65
6.4 Comparison of the modified Fairchild model with other color appearance
models. 67
6.5 Conclusion 76
7 COLOR REPRODUCTION OF ENDOSCOPIC IMAGES UNDER
ENVIRONMENTAL ILLUMINATION 77
7.1 Introduction 77
7.2 Color reproduction method for endoscopic images under environmental
illumination 78
7.3 Gamut-mapping of endoscopic image 83
7.3.1 Gamut-mapping in 1976 CIELUV L*C*h color space 83
7.3.2 Perceptual Mahalanobis distance 84
7.3.3 Psychophysical experiments 86
7.4 Analysis of gamut-mapping for endoscopic images 88
7.5 Conclusion 92
8 CONCLUSION 93
REFERENCES 95
LIST OF PRESENTATIONS AND PUBLICATIONS RELEVANT TO THE
PRESENT THESIS 107

xi
LIST OF TABLES
Table 1. Averaged spectral reflectance of the sampled human skin. 10
Table 2. The first, second and third principal components of the spectral reflectance of
human skin. 13
Table 3. Experimental setting of the CRTs. 27
Table 4. Coefficients obtained by quadratic curve fitting for CRTs (Nanao FlexScan
56T and AppleColor MO401) in a dark environment. 29
Table 5. Coefficients obtained by linear curve fitting for CRTs (Nanao FlexScan 56T
and AppleColor MO401) in a dark environment. 32
Table 6. The tristimulus values of six skin color patches under illuminant “A”. 53
Table 7. XL, YL, ZL tristimulus values of reflected light on CRT under various
illuminants. 82
Table 8. Variances and covariances of metric lightness, chroma and hue angle of
endoscopic image. 86
Table 9. Result of psychophysical experiments performed by Hara with the
collaboration of physicians. 88
Table 10. Variation of coefficients φ, ε, β, γ andα in the Eq. (7-10). 89

xii
LIST OF FIGURES
Figure 1. History of the color research. 1
Figure 2. Distribution of skin colors used in principal component analysis. 9
Figure 3. Averaged spectral reflectance of human skin. 9
Figure 4. Cumulative contribution ratio of principal components of the skin spectral
reflectance. 11
Figure 5. The first, second and third principal components of the spectral reflectance
of the skin. 12
Figure 6. Comparison between measured and predicted relative spectral reflectance of
human skin. 15
Figure 7. Diagram of the portrait image acquisition and the prediction of the spectral
reflectance of each pixel in the image. 19
Figure 8. Diagram of the proposed colorimetric color reproduction method to predict
the tristimulus values of facial pattern image under various illuminants on a CRT in a
dark environment. 23
Figure 9(a). The relationship between input levels of CRT (Nanao FlexScan 56T) and
luminance of phosphor. 28
Figure 9(b). The relationship between input levels of CRT display (AppleColor
MO401) and luminance of phosphor. 29
Figure 10(a). X-Y and Z-Y relationship for each RGB channel of the CRT (Nanao
FlexScan 56T). 30
Figure 10(b). X-Y and Z-Y relationship for each RGB channel of the CRT
(AppleColor MO401). 31
Figure 11. Relative spectral radiant power and chromaticities of four illuminants used
in the experiment. 33
Figure 12. A facial pattern image reproduced colorimetrically on CRT under four
illuminants; (a) “Horizon,” (b)“A,” (c)“Cool White,” (d)“Day Light,” illuminants.34
Figure 13. Diagram of the color reproduction method for hardcopy of skin color image
under various illuminants. 37
Figure 14. Diagram of the multiple regression analysis. 38
Figure 15. Averaged color differences ∆Eab between skin color patches displayed on CRT
and the corresponding hardcopies under four illuminants. 40
Figure 16. Printed facial pattern image under four different illuminants, (a) “Horizon”,
(b) “A”, (c) “Cool White”, (d) “Day Light” illuminants. 41

xiii
Figure 17. Comparison between averaged spectral reflectance of human skin and
printed skin color. 42
Figure 18. Diagram of color reproduction of facial pattern images on CRT based on
color appearance models. 51
Figure 19. Predicted color appearance of skin color patches under various illuminants;
(a) illuminant “A”, (b) “Horizon”, (c) “Cool White”, (d) “Day Light”. 54
Figure 20. Color appearance predictions of a facial pattern image under illuminant “A”;
(a) XYZ, (b) CIELAB, (c) von Kries, (d) Fairchild. 55
Figure 21. Color appearance predictions of a facial pattern image under “Horizon”;
(a) XYZ, (b) CIELAB, (c) von Kries, (d) Fairchild. 56
Figure 22. Color appearance predictions of a facial pattern image under “Cool White”;
(a) XYZ, (b) CIELAB, (c) von Kries, (d) Fairchild. 57
Figure 23. Color appearance predictions of a facial pattern image under “Day Light”;
(a) XYZ, (b) CIELAB, (c) von Kries, (d) Fairchild. 58
Figure 24. Arrangement of psychophysical experiment to compare skin color images
on a CRT with a hardcopy in a standard illumination booth using memory matching. 59
Figure 25. Percentage of selection of each color appearance model for skin color
patch reproduction. 61
Figure 26. Percentage of selection of each color appearance model for facial pattern
image reproduction. 62Figure 27(a). A number of selection when KM , KS are changed from 2.9 to 3.2 and
KL = 2.9. 65Figure 27(b). A number of selection when KM , KS are changed from 2.9 to 3.2 and
KL = 3.0. 66Figure 27(c). A number of selection when KM , KS are changed from 2.9 to 3.2 and
KL = 3.1. 66Figure 27(d). A number of selection when KM , KS are changed from 2.9 to 3.2 and
KL = 3.2. 67Figure 28. A facial pattern image reproduced on a CRT for illuminant “A”;
(a) XYZ, (b) Modified Fairchild (Custom model), (c) von Kries, (d) Fairchild. 68
Figure 29(a). Averaged interval scale of model performance for illuminant “A”. 69
Figure 29(b). Averaged interval scale of model performance for “Day Light”. 70
Figure 29(c). Averaged interval scale of model performance for “Cool White”. 70
Figure 30. A skin color patch reproduced on CRT for illuminant “A”; (a) RLAB 96,
(b) Modified Fairchild (Custom model), (c) von Kries, (d) LLAB models. 71
Figure 31. A facial pattern image reproduced on CRT for illuminant “A”; (a) RLAB 96,
(b) Modified Fairchild (Custom), (c) von Kries, (d) LLAB models. 72

xiv
Figure 32. Percentage of skin color patch that was selected on CRT as the best one
in 3 kind of illuminants. 73
Figure 33. Percentage of selection for reproduced facial pattern image chosen as the
best one on CRT display in 3 kind of illuminants. 74
Figure 34(a). Averaged interval scale of model performance for illuminant “A”. 75
Figure 34(b). Averaged interval scale of model performance for “Day Light”. 75
Figure 34(c). Averaged interval scale of model performance for “Cool White”. 76
Figure 35. Diagram of color reproduction method to reproduce the appearance of
endoscopic images on CRT under various illuminants. 78
Figure 36(a). Spectral reflectance of CRT without radiation from CRT under
illuminant “A”. 80
Figure 36(b). Spectral reflectance of CRT without radiation from CRT under
“Cool White”. 81
Figure 36(c). Spectral reflectance of CRT without radiation from CRT under “Day
Light”. 81
Figure 37. Relationship between L*u*v* and L*C*h color spaces. 84
Figure 38. Stomach endoscopic image. 89
Figure 39. Reproduced image on CRT under illuminant “A”. 90Figure 40. Reproduced stomach endoscopic image under illuminant “A”, for φ=0.95,
ε=3, β=1.0, γ=1 andα=0 of Eq. (7-10). 91

Chapter 1
1
CHAPTER 1
INTRODUCTION
Studies of color have been introduced in human life and culture since the beginning of
recorded history. Figure 1 shows a diagram of the history of color research.
Å@ Philosophicalspeculation on color
Greek and Chinese speculation on the nature of color
500 - 300 B.C.
Pre-scientific color studies
17th century
Physical approach to relate color with corresponding stimuli
Color Science
New challenge
Matching tristimulus values and appearance of original scene with the reproduced images and gamut-mapping
Cross-media color Å@reproduction
Matching tristimulus values and appearance of color images between devices
Color imaging
Physical Measurement
Color representation
15th century
Search for color organization and representation
C I E colorimetry
1931
Physical relationship between stimulus and color perception
Color appearance1976-1996
Pshychophysical relationship between stimulus and color sensation
Figure 1. History of the color research.
In the pre-scientific color studies, Chinese and Greek philosophers only
speculated on the nature of color. During the 15th century, color organization and
representation were searched.
The color science began with the establishment of a correspondence between
color and its physical stimuli in the 17th century. In the 19th century, the advance of

Chapter 1
2
sciences such as physics and chemistry1 contributed for the development of color
science. The color science also developed with the advances in the study of physiology
and psychophysics.2 CIE (Commission Internationale de l’Eclairage) specified the
colorimetry in 1931 giving a physical relationship between measured stimulus and color
response based on a standard observer. However, the CIE colorimetry cannot predict
the appearance of color well, because it is based on adapted eyes in pre-defined
laboratory conditions, unlike the environment where most colors are seen. The
specification3 and prediction4 of color appearance have been studied in the last 20 years.
The study of color appearance considers the influence of environmental factors in the
sensation of color.
The increasing speed of computing equipment and devices, scanner, digital
camera, printer and CRT display (CRT), allowed the development of techniques5 for
color imaging. The color science is applied to color imaging to produce cross-media
reproductions. It also gives new tools to the color scientists with which they can
improve the studies of human color vision.
A new challenge in color imaging systems is to match the color appearance of
original scene with reproduced images. In the area of multimedia where we can access
color images through the world wide network of computers, the WYSIWYG (what you
see is what you get) fidelity in the reproduction of color has become very important.
The traditional cross-media reproduction systems6,7 does not consider the original scene.
The reproduction of the colors in the original scene can be achieved considering original
spectral reflectances.8 The reproduction of the skin color appearance is also important to
the cosmetic industry.
The color appearance reproduction of the original scene is also very important in
the area of telemedicine such as diagnosis of electronic endoscopic image. The
endoscopic image is not always viewed in a dark environment, and viewing condition is

Chapter 1
3
dependent on the environment of the hospital. In remote diagnosis, however, the
endoscopic images are usually sent to physicians in various illuminated environments.
Therefore, we need to consider the outer illuminant condition in the color reproduction
system. Unfortunately, the processed endoscopic images cannot always be represented
inside the color gamut of CRT particularly due to the saturation in the red channel. In
such cases, gamut mapping is required. A new challenge in the endoscopic image
reproduction system is to evaluate the influence of gamut-mapping in the color
appearance of the reproduced image.
1.1 Color reproduction on CRT and hardcopy
The accurate reproduction on CRT and hardcopy has been studied by many
researchers.9-11 In the following subsections some types of color reproduction are
described.
1.1.1 Colorimetric color reproduction
The study of color science developed in the last century with the advance of physics and
physiology.12-21 These studies constituted the base of the colorimetry.22 The
colorimetry is obtained by measurement of chromatic properties of the objects by
instruments such as spectrophotometer and colorimeter.23
In colorimetric color reproduction, chromaticities and relative luminances of
reproduced color are equal to those of the original.24 It is possible to achieve device
independent color reproduction, in matching the chromaticities and relative luminances
of the original with the reproduced images.
1.1.2 Color appearance models
Colorimetric color reproduction works well to reproduce the appearance of colors if the
reproduction is viewed under the identical viewing condition of the original image.
Chapter 1
4
However, the use of colorimetric color reproduction is not enough to predict the
appearance of colors under various environmental conditions. There are many
environmental factors which give the influence upon the appearance of colors such as
the illuminant,25-27 effect of background and surround,28-32 and the size of the colored
area33 . One of the most significant factors affecting color appearance is the change of
visual color sensitivities corresponding to changes of the illumination. This
phenomenon is known as chromatic adaptation.34-37
There are two types of chromatic adaptation mechanisms: sensory and
cognitive.38 Sensory mechanisms are based on the sensitivity control in the
photoreceptors and neurons in the first stages of the visual system and considers
changes in the white point, luminance of illuminant and other aspects of the viewing
conditions. Many models have been proposed to measure the appearance of color.39-46
The first model of sensory chromatic adaptation was proposed by Johaness von
Kries.47,48 Subsequent models of chromatic adaptation proposed by C. J. Bartleson,49
K. Richter,50 R. W. G. Hunt,51-54 Y. Nayatani and coworkers,55-64 M. D. Fairchild,65,66
M. R. Luo and coworkers67-69. Color spaces such as CIELUV70 , CIELAB,70
RLAB,38,71,72 LLAB73,74 are also used to predict color appearance. There is also neural
models such as the ATD model proposed by S. L. Guth.75-77 Another color appearance
model is the Retinex theory proposed by E. Land that considers a spatial distribution of
all pixels in the field of view.78-80 On the other hand, cognitive mechanisms are
influenced by observers’ knowledge of image content. The quantification of the
cognitive mechanisms is very complex because its psychological nature. Then, no
model has been proposed for cognitive mechanisms.
Various color appearance models have been applied to color reproduction of
complex images81 and evaluated by RIT group.38,82-84 These experiments show that a

Chapter 1
5
perfect color appearance model is not available and each model has advantages and
disadvantages.
1.1.3 Limitation of the conventional color reproduction methods
The conventional color reproduction methods have three considerable limitations.
First, these methods cannot reproduce correctly the color appearance of the original
scene under various illuminants on CRT and hardcopy using only three input channels
due to the occurrence of metameric pairs24 of original and reproduced image. These
metameric pairs are stimuli that are visually identical but spectrally different. A method
to estimate the spectral composition of the color stimulus from the input signals is
required to predict the metamerism in the reproduction on CRT and hardcopy under
various illuminants.
Second, many reproduction methods using color appearance models have been
proposed. However, none of them has been applied specifically to skin color that is one
of the most important colors for the evaluation of reproduction quality. A comparative
experiment between color patches and complex images is also not available for
reproduction systems using color appearance models.
Third, some of these systems include gamut-mapping to reproduce images inside the
color gamut of CRT displays. However, these methods do not consider yet how gamut-
mapping actually modifies the color appearance of the reproduced image. It is desirable
to minimize the effect of gamut-mapping in the color appearance reproduction. Then, a
perceptual metric based on psychophysical experiments is required to quantify the effect
of gamut-mapping on the color appearance of reproduced images.

Chapter 1
6
1.2 Purpose and approach of this research
The purpose of this dissertation is to match the color appearance of an original scene
under various illuminants with its reproductions on CRT and hardcopy. In this
dissertation, facial pattern and endoscopic image are considered as original scene.
Particularly, this study examines the performance of chromatic adaptation models for
facial pattern image. This study also investigates the evaluation of gamut mapping
influence on the color appearance of endoscopic image reproduced on a CRT under
environmental illumination. The gamut-mapping is required in endoscopic images
because these images generally have saturation of the red channel on CRT due to their
reddish nature.
As a first approach to this color appearance matching, the spectral reflectance of
original scene is estimated using the principal component analysis. Then, the estimated
spectral reflectance is used to predict the tristimulus values of the original scene under
various illuminants. The predicted tristimulus values are reproduced on hardcopy by a
printer calibration using a database of spectral reflectance. Chromatic adaptation models
are introduced to reproduce the color appearance of hardcopy on CRT.
Next, reproduction on CRT of skin color patches and facial pattern images using
various color appearance models are compared by psychophysical experiments. The
performance of color appearance models is compared for various illuminants and
differences between reproduction of skin color patches and facial pattern image are
examined to find an effective model for facial pattern reproduction.
A perceptual distance using covariance matrix for CIELUV metric lightness,
chroma and hue angle is defined based on Mahalanobis distance. This distance is
applied to evaluate various gamut-mapping techniques required to reproduce endoscopic
image on CRT under environmental illumination.
Chapter 1
7
1.3 Organization of this dissertation
In Chapter 2, a technique for two-dimensional prediction of the spectral reflectance of
facial pattern from the RGB three channel image taken by HDTV camera is proposed
based on principal component analysis. Chapter 3 shows a method to reproduce
colorimetrically facial pattern images under various illuminants on CRT in a dark
environment, and Chapter 4 describes a method to reproduce colorimetrically facial
pattern images as hardcopy. Chapter 5 presents a color reproduction based on color
appearance models and psychophysical experiments are performed to evaluate various
color appearance models. In Chapter 6, a modified Fairchild chromatic adaptation
model for facial pattern images is introduced. In Chapter 7, a color appearance
reproduction of endoscopic images on a CRT under various illuminants is described and
a perceptual color distance based on Mahalanobis distance is introduced to evaluate
gamut-mapping. In Chapter 8, the conclusion and the summary of the proposed color
reproduction methods are presented.

Chapter 2
8
CHAPTER 2
PREDICTION OF SPECTRAL REFLECTANCE OF A FACIAL
PATTERN IMAGE TAKEN BY HDTV CAMERA
2.1 Introduction
Spectral reflectance of the object should be measured to predict the color of object under
various illuminants. The spectral reflectance can be represented in a multidimensional
space. Generally, we can obtain only three-channel data from input devices. The
estimation from three-dimensional space to multi-dimensional space can be achieved
using principal components of spectral reflectance.85-89 In this chapter, a method to
predict the spectral reflectance of a portrait image taken by a HDTV camera is described.
2.2 Principal component analysis of the spectral reflectances of human skin and
their linear approximation
Ojima and his coworkers measured one hundred eight spectral reflectances of skin in
human face for 54 Mongolians (Japanese women) who are between 20 and 50 years
old.90 The Munsell values of the skins had a range as follows; H=2YR-8YR, V=5-7,
C=2-5, and the distribution of these skin colors in CIE 1976 L*a*b* color space is
shown in Fig. 2.

Chapter 2
9
B
B
B
B
BB
B
B
BBB
B
B
B
BB
B
BB
B
B
B
B
B
B
BB
B
B
B
B
B
B
BB
B
B
BB
B
B
BB
B
B
BB
B
B
B
B
B
B
B
B
B
B
BB
B
BB
B
B
B
B
B
B
B
BB
BB
B
B
B
B
B
B
B
B
B
B
B B
BB
BB
BB
BB
BB
B
B
BB
B
B
B
B
B
B
B
B
B
10
15
20
25
0 5 10 15
BB
B
B BBB
B
BB
B
B
BBB
B B
B
B
B
BB
B
B
BBB
BB
B
B
B
B
B
B
B B
B
B
BBB
B
B BBB
B
B
B
B
B
BBB
B
B B
B
B
BBB
BB
BB
B
B
BB
B
BB
B
BB
BB
BBB
B
B
BBB
B
B
B
B
B BBB
B
BBB
B BBBB
BB
B
B
50
60
70
80
0 5 10 15
a* a*
L* b*Figure 2. Distribution of skin colors used in principal component analysis.
The spectral reflectances were measured at intervals of 5 nm between 400 nm
and 700 nm. Therefore, the spectral reflectance is described as vectors o in 61-
dimensional vector space. Figure 3 shows the averaged spectral reflectance of human
skin, and these values are given in Table 1.
0
10
20
30
40
50
60
400 500 600 700
Wavelength (nm)
Ave
rage
d sp
ectr
al r
efle
ctan
ce (
%)
Figure 3. Averaged spectral reflectance of human skin.

Chapter 2
10
Table 1. Averaged spectral reflectance of the sampled human skin.
Wavelength (nm) Relative spectral reflectance (%)
400 15.98 405 16.20 410 16.41 415 16.62 420 16.83 425 17.35 430 17.86 435 18.93 440 19.99 445 21.16 450 22.33 455 23.22 460 24.11 465 24.77 470 25.41 475 25.94 480 26.46 485 27.07 490 27.68 495 28.43 500 29.18 505 29.88 510 30.57 515 30.87 520 31.16 525 31.11 530 31.05 535 31.03 540 31.00 545 31.26 550 31.51
Wavelength (nm) Relative spectral reflectance (%)
555 31.88 560 32.24 565 32.46 570 32.67 575 33.36 580 34.05 585 36.23 590 38.41 595 40.80 600 43.19 605 44.79 610 46.38 615 47.32 620 48.26 625 48.82 630 49.38 635 49.87 640 50.35 645 50.78 650 51.21 655 51.53 660 51.84 665 52.18 670 52.51 675 52.86 680 53.20 685 53.54 690 53.88 695 54.12 700 54.35
The covariance matrix of the spectral reflectance was calculated for the principal
component analysis. The eigenvectors of the covariance matrix are named as principle
component vectors. Then, the spectral reflectance of human skin can be expressed as a
linear combination of the principle component vectors as follows:
o = o + α iuii =1
61
∑ , (2-1)
Chapter 2
11
where o is the averaged spectral reflectance, ui (i=1...61) are the eigenvectors and αi
(i=1...61) are the eigenvalues corresponding to the eigenvectors ui (i=1...61)
respectively. The eigenvectors are combined in order of magnitude of the eigenvalues.
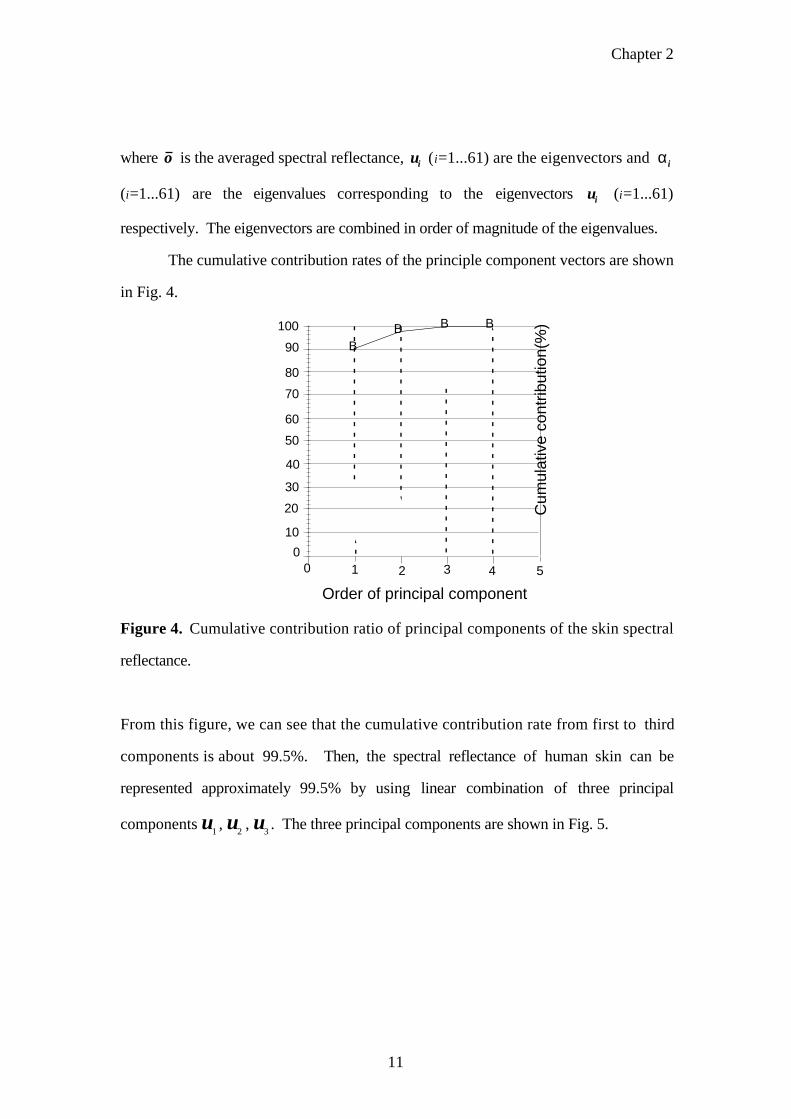
The cumulative contribution rates of the principle component vectors are shown
in Fig. 4.
Order of principal component
BBB
B
0
10
20
30
40
50
60
70
80
90
100
0 1 2 3 4 5
Cum
ulat
ive
cont
ribut
ion(
%)
Figure 4. Cumulative contribution ratio of principal components of the skin spectral
reflectance.
From this figure, we can see that the cumulative contribution rate from first to third
components is about 99.5%. Then, the spectral reflectance of human skin can be
represented approximately 99.5% by using linear combination of three principal
components u1, u
2, u
3. The three principal components are shown in Fig. 5.

Chapter 2
12
-2
-1
0
1
2
3
4
400 450 500 550 600 650 700
First
Third
Second
Wavelength (nm)
Rel
ativ
e sp
ectr
al r
efle
ctan
ce
Figure 5. The first, second and third principal components of the spectral reflectance of
skin.
The values of the principal components are given in Table 2. Therefore the Eq. (2-1)
can be represented approximately as follows:
o ≅ o + α ii=1
3∑ ui = o + u1 u2 u3( )
α1
α2
α 3
. (2-2)

Chapter 2
13
Table 2. The first, second and third principal components of the spectral reflectance of
human skin.
WavelengthÅ@ 1st PrincipalÅ@2nd PrincipalÅ@ 3rd Principal (nm) Component Component Component
Å@Å@400 Å@2.258 Å@0.326 Å@-0.514Å@Å@405 Å@2.232 Å@0.306 Å@-0.506Å@Å@410 Å@2.207 Å@0.284 Å@-0.497Å@Å@415 Å@2.177 Å@0.267 Å@-0.491Å@Å@420 Å@2.149 Å@0.250 Å@-0.486Å@Å@425 Å@2.184 Å@0.242 Å@-0.488Å@Å@430 Å@2.218 Å@0.234 Å@-0.488Å@Å@435 Å@2.326 Å@0.198 Å@-0.488Å@Å@440 Å@2.435 Å@0.161 Å@-0.510Å@Å@445 Å@2.527 Å@0.102 Å@-0.533Å@Å@450 Å@2.619 Å@0.041 Å@-0.557Å@Å@455 Å@2.665 Å@0.000 Å@-0.572Å@Å@460 Å@2.711 -0.040 Å@-0.588Å@Å@465 Å@2.735 -0.064 Å@-0.589Å@Å@470 Å@2.758 -0.086 Å@-0.592Å@Å@475 Å@2.767 -0.112 Å@-0.590Å@Å@480 Å@2.776 -0.138 Å@-0.589Å@Å@485 Å@2.800 -0.158 Å@-0.572Å@Å@490 Å@2.824 -0.177 Å@-0.554Å@Å@495 Å@2.878 -0.192 Å@-0.508Å@Å@500 Å@2.933 -0.208 Å@-0.461Å@Å@505 Å@2.983 -0.251 Å@-0.390Å@Å@510 Å@3.033 -0.294 Å@-0.321Å@Å@515 Å@3.044 -0.410 Å@-0.225Å@Å@520 Å@3.056 -0.526 Å@-0.130Å@Å@525 Å@3.045 -0.682 Å@-0.018Å@Å@530 Å@3.035 -0.837 Å@ 0.094Å@Å@535 Å@3.019 -0.942 Å@ 0.172Å@Å@540 Å@3.003 -1.047 Å@ 0.250Å@Å@545 Å@2.971 -1.087 Å@ 0.266Å@Å@550 Å@2.940 -1.129 Å@ 0.283Å@Å@555 Å@2.915 -1.173 0.307Å@Å@560 Å@2.891 -1.213 Å@ 0.330Å@Å@565 Å@2.897 -1.335 0.424Å@Å@570 Å@2.902 -1.453 Å@ 0.517Å@Å@575 Å@2.927 -1.477 Å@ 0.564Å@Å@580 Å@2.950 -1.500 0.611Å@Å@585 Å@3.028 -1.202 Å@ 0.526Å@Å@590 Å@3.107 -0.903 Å@ 0.441Å@Å@595 Å@3.154 -0.455 Å@ 0.319Å@Å@600 Å@3.202 -0.006 0.199

Chapter 2
14
WavelengthÅ@1st Principal 2nd Principal 3rd Principal (nm) Component Component Component
Å@Å@605 Å@3.195 Å@0.285 Å@ 0.158Å@Å@610 Å@3.188 Å@0.576 Å@ 0.117Å@Å@615 Å@3.152 Å@0.711 Å@ 0.130Å@Å@620 Å@3.117 Å@0.846 Å@ 0.142Å@Å@625 Å@3.062 Å@0.899 Å@ 0.165Å@Å@630 Å@3.006 Å@0.952 Å@ 0.186Å@Å@635 Å@2.944 Å@0.978 Å@ 0.209Å@Å@640 Å@2.882 Å@1.004 Å@ 0.231Å@Å@645 Å@2.816 Å@1.019 Å@ 0.257Å@Å@650 Å@2.751 Å@1.034 Å@ 0.284Å@Å@655 Å@2.694 Å@1.040 Å@ 0.307Å@Å@660 Å@2.639 1.046 Å@ 0.331Å@Å@665 Å@2.585 1.057 Å@ 0.359Å@Å@670 Å@2.530 1.069 Å@ 0.386Å@Å@675 Å@2.469 1.083 Å@ 0.416Å@Å@680 Å@2.407 1.098 Å@ 0.445Å@Å@685 Å@2.354 1.106 Å@ 0.471Å@Å@690 Å@2.302Å@ 1.114 Å@ 0.497Å@Å@695 Å@2.253 1.119 Å@ 0.524Å@Å@700 Å@2.202 1.124 Å@ 0.550
Figure 6 shows a comparison between measured and predicted relative spectral
reflectance of human skin by principal component analysis. From this figure it is
possible to conclude that the linear approximation of the spectral reflectance using three
principal components works well.
Then, the spectral reflectance of each pixel of image can be predicted from the
tristimulus values of each pixel and the spectral radiance of the illuminant, as is
performed in electronic endoscopic images91 .

Chapter 2
15
0
10
20
30
40
50
60
400 500 600 700
Wavelength (nm)
( ) Measured spectral reflectance of human skin
( ) Predicted spectral reflectance of human skin by three principal components
Spe
ctra
l ref
lect
ance
(%
)
Figure 6. Comparison between measured and predicted spectral reflectance of human
skin.
2.3 Estimation of the skin spectral reflectance
Considering the result of above principal component analysis, we can estimate the
spectral reflectance of skin using the tristimulus values. The tristimulus values can be
easily measured by a colorimeter. The spectral reflectance of skin is estimated as
follows. As well known, the tristimulus values X, Y, Z can be calculated by Eq. (2-3).
X = K E(λ)x (λ)O(λ )λ = 400
700
∑ , (2-3a)
Y = K E(λ )y (λ)O(λ)λ = 400
700
∑ , (2-3b)
Z = K E(λ )z (λ)O(λ )λ = 400
700
∑ , (2-3c)
Chapter 2
16
where λ is the wavelength, O(λ) is the spectral reflectance, E(λ) is the spectral radiance
of the illuminant, x (λ) , y (λ) , z (λ ) are color matching functions and K is a coefficient
given by Eq. (2-4).
K =1
E(λ) y (λ)dλλ= 400
700
∫(2-4)
By vector notations, Eq. (2-3) can be expressed as follows:
X= Ket X o, (2-5a)
Y = Ke tY o, (2-5b)
Z= Ke tZ o, (2-5c)
where .[ ]t represents the transpose of .[ ], the vectors e, o are vector notations of E(λ)
and O(λ) respectively, and the matrixes X , Y , Z are represented as follows:
x λ( ) → X =
x 1 λ1( ) O
x 2 λ2( )O
O x n λ n( )
, (2-6a)
y λ( ) → Y =
y 1 λ1( ) O
y 2 λ2( )O
O y n λ n( )
, (2-6b)
z λ( ) → Z =
z 1 λ1( ) O
z 2 λ2( )O
O z n λn( )
. (2-6c)

Chapter 2
17
From Eq. (2-2), the Eq. (2-5) can be written as,
X ≅ Ket X o + u1 u2 u3( )α 1
α2
α 3
, (2-7a)
Y ≅ KetY o + u1 u2 u3( )α 1
α2
α 3
, (2-7b)
Z ≅ Ket Z o + u1 u2 u3( )α 1
α2
α 3
. (2-7c)
The Eq. (2-7) can be rewritten as follows:
X ≅ Ke t X o + Ke t X u1 X u2 X u3( )α1
α2
α3
, (2-8a)
Y ≅ KetY o + Ket Y u1 Y u2 Y u3( )α1
α2
α3
, (2-8b)
Z ≅ Ke tZ o + Ke t Z u1 Z u2 Z u3( )α1
α2
α3
. (2-8c)
We can consider the first term of Eq. (2-8) as a contribution of the averaged spectral
reflectance to the tristimulus values, and the second term as a contribution of three
eigenvectors. Then, we can rewrite the Eq. (2-8) as follows:
XYZ
≅
X
Y
Z
+
X1 X2 X3
Y1 Y2 Y3
Z1 Z2 Z3
α1
α2
α3
, (2-9)

Chapter 2
18
where X , Y , Z are the averaged tristimulus values and Xi ,Yi , Zi (i=1,2,3) are the
tristimulus values corresponding to the three eigenvectors of skin spectral reflectance.
Then, the eigenvalues α1 , α2 , and α3 are given by
α1
α2
α3
=
X1 X2 X3
Y1 Y2 Y3
Z1 Z2 Z3
−1X
Y
Z
−
X
Y
Z
. (2-10)
The spectral reflectance of human skin can be estimated by above eigenvalues and three
principal components by Eq. (2-2).
2.4 Characterization of HDTV camera
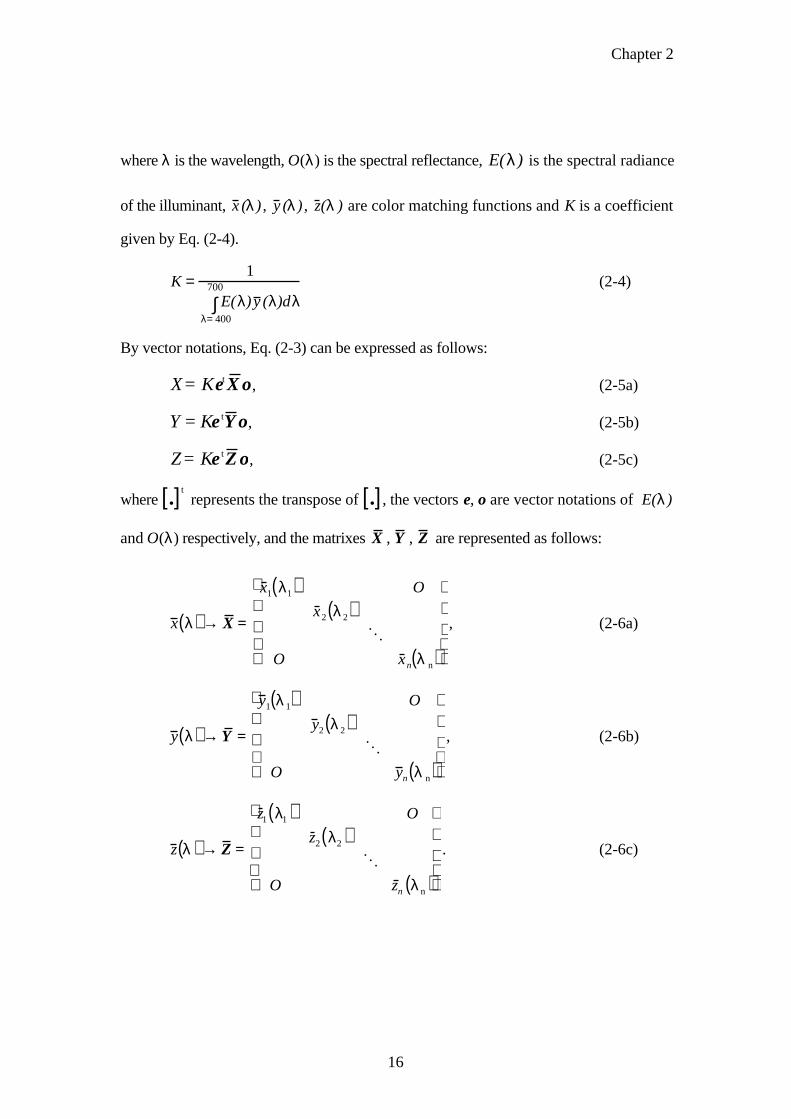
Figure 7 shows the schematic diagram of the image acquisition and the estimation of the
spectral reflectance in each pixel of the image based on the characterization of the
HDTV camera. In the previous sections, it was shown how spectral reflectances of
human face can be estimated from the device independent tristimulus values X, Y, Z
using Eqs. (2-2) and (2-10). In this section, X, Y, Z in each pixel of original scene is
calculated from the R, G, B three color channels of the HDTV camera.
The output color channel values Ro, Go, Bo of an ideal HDTV camera can be
given by the Eq. (2-11),
Ro = E(λ )r (λ)O(λ )λ = 400
700
∑ , (2-11a)
Go = E(λ)g (λ)O(λ)λ =400
700
∑ , (2-11b)
Bo = E(λ )b (λ)O(λ)λ =400
700
∑ , (2-11c)
where r (λ ), g (λ) , b (λ) are the spectral sensitivities of the camera, E(λ) is the spectral
radiance of the illuminant and O(λ) is the spectral reflectance of the object.
Chapter 2
19
( R, G, B )
( X, Y, Z )
O(λ)=O(λ)+α1u1(λ)+α2u2(λ)+α3u3(λ)
First, second and third principal componentsof the spectral reflectance of human skin
M1
HDTVcamera
Figure 7. Diagram of the portrait image acquisition and the prediction of the spectral
reflectance of each pixel of the image.
However, the actual output color channel values R’, G’, B’ of a HDTV camera is given
by Eq. (2-12);
′ R =K r . fr (Ro) , (2-12a)
′ G = Kg . fg(Go) , (2-12b)
′ B = Kb . fb (Bo ), (2-12c)

Chapter 2
20
where f r , fg , fbare non-linear functions, and Kr , Kg , Kb are white balance constants.
The non-linearity between R, G, B level and luminance was linearized using the
following quadratic equations;92
′ R = −5.50 + 4.26 × 10⁻¹ Ro + 2.04 × 10⁻³ Ro2 , (2-13a)
′ G = −6.06 ×10⁻¹ + 2.90 × 10⁻¹Go + 2.66 ×10⁻³ Go2 , (2-13b)
′ B = −7.37 ×10⁻¹ + 2.31 ×10⁻¹ Bo + 3.11× 10⁻³Bo2 . (2-13c)
Generally the r (λ ), g (λ) , b (λ) are different from visual color matching
functions. Then, it is necessary to find a color transformation function that gives the
device independent tristimulus values X, Y, Z from the HDTV camera output channels
R’, G’, B’. Ojima and his coworkers showed that a color transformation matrix M1
shown in Eq. (2-14) gives sufficient accuracy for the HDTV camera calibration,92
X
Y
Z
= M1
′ R
′ G
′ B
1
(2-14)
This matrix M1 can be determined by the following technique. The tristimulus values of
a series of color patches are measured by a colorimeter and are digitized by HDTV
camera. The values of R’, G’, B’ channels in Eq. (2-13) are calculated from the output
values R, G, B of the HDTV camera. The matrix M1 can be determined by the multiple
regression analysis of measured X, Y, Z tristimulus values and calculated R’, G’, B’
color channel values of digitized color patches.
The tristimulus values X, Y, Z of thirty-nine selected patches of Japanese skin
color were measured by a spectrophotometer (Minolta CM1000). The Munsell values
of the patches have a range as follows; H=0YR-10YR, V=5-8, C=2-5.

Chapter 2
21
The skin color patches were digitized under Metal halide lamp (RDS, with color
temperature of 5,700 K) illumination at 2o field of view by a HDTV camera (Nikon
HQ1500C). The calculated color transform matrix M1 is shown in Eq. (2-15).
M1 =2.09 × 10⁻¹ 5.37 × 10⁻² 5.09 × 10⁻² −2.41
1.17 × 10⁻¹ 2.07 ×10− 1 −4.80 × 10⁻³ −2.05
7.69 ×10⁻⁴ 7.67 ×10− 3 3.65 ×10− 1 −0.827
(2-15)
The accuracy of this color transformation is verified by ∆E*ab color
difference93,94 between the tristimulus values Xm, Ym, Zm, and Xe, Ye, Ze. Xm, Ym, Zm are
measured using a spectrophotometer (Minolta CM1000) and Xe, Ye, Ze, are estimated
using the matrix M1 in Eq. (2-15). The color difference is calculated as shown in Eq.
(2-16)
∆E*ab = Lm* − Le
*( )2+ am
* − ae*( )2
+ bm* − be
*( )2, (2-16)
where ( Lm* , am
* , bm* ) and ( Le
* , ae* , be
* ) are the CIELAB 1976 metric lightness and the
coordinates calculated from Xm, Ym, Zm and Xe, Ye, Ze, respectively.
The averaged color difference ∆E*ab was 1.0 and the maximum color difference
∆E*abmax was 2.3. This result shows that the color transformation by matrix M1 in Eq.
(2-14) has sufficient accuracy to calculate the X, Y, Z necessary to estimate the spectral
reflectance.

Chapter 2
22
2.5 Conclusion
In this chapter, a method to predict the spectral reflectance of a portrait image digitized
by a HDTV camera is described. Spectral reflectance of Japanese women’s skin was
estimated with 99.5% accuracy using the first, second and third principal components of
the spectral reflectance of skin. The obtained color difference less than 2.30 indicates
that the camera calibration was performed with sufficient accuracy to calculate the
tristimulus values.

Chapter 3
23
CHAPTER 3
COLORIMETRIC COLOR REPRODUCTION OF FACIAL PATTERN
IMAGE ON CRT
3.1 Introduction
Figure 8 shows a schematic diagram of colorimetric color reproduction for facial pattern
image on CRT in a dark environment. A facial pattern image is taken by a HDTV
camera under illuminant with spectral radiance E1(λ).
HDTV
( R, G, B )
( X, Y, Z )
CRT display
(Rc, G
c, B
c )
X',Y' Z',( )
(
(
E1(λ) E2(λ)
M2
M1
O(λ)
O(λ)
(
(
camera
Figure 8. Diagram of the proposed colorimetric color reproduction method to predict
the tristimulus values of facial pattern image under various illuminants on a CRT in a
dark environment.

Chapter 3
24
The tristimulus values X, Y, Z of the portrait image is calculated from three
channels R, G, B values of the HDTV camera using transformation matrix M1 as shown
in the previous chapter. In the proposed method, the two-dimensional spectral
reflectance of the object in the scene is calculated using the tristimulus values of the
digitized image based on the principal component analysis of the spectral reflectance of
human skin. Then, the tristimulus values of the image under a new illuminant with
spectral radiance E2(λ) can be predicted from the estimated spectral reflectance. The Rc,
Gc, Bc input values of CRT is calculated by color transform matrix M2 obtained by the
colorimetric calibration of the CRT.
3.2 Tristimulus values of facial pattern image
The tristimulus values X', Y', Z' of skin color under a selected illuminant can be easily
calculated from the estimated spectral reflectance O(λ) and the spectral radiance E2(λ)
of the illuminant.95 The tristimulus values X’, Y’, Z’ are calculated as follows:
X' = K O(λ )E2 (λ)λ = 400
700
∫ x (λ)dλ (3-1a)
Y' = K O(λ)E2(λ)λ = 400
700
∫ y (λ)dλ (3-1b)
Z' = K O(λ)E2(λ)λ = 400
700
∫ z (λ )dλ (3-1c)
3.3 Calibration of CRT
Many methods to calibrate a computer controlled color monitor have been proposed.96-
101 In general cases, it is possible to define a two-stage model for CRT to transform Rc,
Gc, Bc input values to the tristimulus values X’, Y’, Z’.102,103 The first stage is a nonlinear
transformation from Rc, Gc, Bc values to phosphor luminances produced by digital-to-

Chapter 3
25
analog converter. The second stage is a linear transformation where the monitor
phosphor luminances are transformed to the X’, Y’, Z’ values. The calculation of the
transformation M2 in the schematic diagram of Fig. 8 was performed as follows.
A steady CRT with fixed luminance, contrast, white point, and gamma is used.
Color patches are displayed on the CRT in a dark environment to avoid interference with
external light sources. The luminance L and the tristimulus values X, Y, Z were
measured at the displayed color patches in each channel. The luminance colorimeter is
adjusted at the position of the observer eyes because the angle of incidence of the beams
can influence the measurements.104
The relationship between the input level and luminance is plotted and the Eq. (3-
2) can be derived from curve fitting for quadratic curves.
LR = a0 Rc2 + a1Rc + a2 (3-2a)
LG = b0G c2 + b1Gc + b2 (3-2b)
LB = c0 Bc2 + c1Bc + c2 (3-2c)
These equations show the relationship between the luminance and input levels, where
LR , LG , LB are the luminance of red, green, and blue phosphors respectively, and ai , bi ,
ci (i = 0 to 2) are coefficients.
The tristimulus values X, Y, Z on CRT can be decomposed as follows:
X
Y
Z
=
XR + XG + XB
YR + YG + YB
ZR + ZG + ZB
, (3-3)
where Xi , Yi , Zi (i = R, G, B) are the tristimulus values corresponding to the emission of
red, green, blue phosphor, respectively. A theoretical relationship between X-Y, Z-Y for
each phosphor is given by
XR = xR
yR
YR , (3-4a)

Chapter 3
26
XG = xG
yG
YG , (3-4b)
XB = xB
yB
YB , (3-4c)
ZR = zR
yR
YR , (3-4d)
ZG = zG
yG
YG , (3-4e)
ZB = zB
yB
YB . (3-4f)
However the linear curve fitting introduces an offset error in the Eq. (3-4). This error is
considered in the following linear equations:
XR = aRYR + bR (3-5a)
XG = aGYG + bG (3-5b)
XB = aBYB + bB (3-5c)
ZR = cRZR + dR (3-5d)
ZG = cGZG + dG (3-5e)
ZB = cBZB + dB (3-5f)
where ai , bi , ci , di (i = R, G, B) are coefficients.
From Eqs. (3-3) and (3-5), the following equation is obtained;
X
Y
Z
=
aRYR + aGYG + aBYB + bR + bG + bB
YR + YG + YB
cRYR + cGYG + cBYB + dR + dG + dB
. (3-6)
The Eq. (3-6) can be rewrited as follows;
X
Y
Z
= A
YR
YG
YB
+
bR + bG + bB
0.0
dR + dG + dB
, (3-7)

Chapter 3
27
where
A=
aR aG aB
1.0 1.0 1.0
cR cG cB
. (3-8)
The luminance can be calculated from the Eq. (3-9) as follows;
LR
LG
LB
=
YR
YG
YB
= A-1
X − bR − bG − bB
Y
Z − dR − dG − dB
. (3-9)
Then, using the Eqs. (3-3) and (3-8), the transformation from the tristimulus values X, Y,
Z to the input levels Rc, Gc, Bc can be achieved.
3.4 Experiments and their results
Two CRTs (Nanao Flex Scan56T Monitor and AppleColor High-Resolution RGB
Monitor Model MO401) with fixed luminance, contrast, white point, and gamma were
calibrated. These CRTs will also be used in the experiments of Chapter 7. The setting
of the CRTs is shown in Table 3.
Table 3. Experimental setting of the CRTs.
CRT Luminance (cd/m2) Contrast White point gamma
Nanao Flex Scan56T 93.3 Maximum D65 1.80
Apple MO401 71.5 Maximum D65 1.80
Twenty-six color patches were displayed on each CRT in a dark environment.
The luminance L and the tristimulus values X, Y, Z of the displayed color patches in
each channel were measured by a luminance colorimeter (TOPCOM BM-7).
Figures 9(a) and 9(b) show the relationship between input levels of CRT and
luminance of phosphor for Nanao Flex Scan56T CRT and AppleColor MO401 CRT

Chapter 3
28
respectively. From Figs. 9(a) and 9(b) it is possible to determine the coefficients shown
in Table 4 of the quadratic equation (3-2).
Fig. 4 Monitor output luminance.
BBBBBBBBBBBBBBBBBBBBBBBBBBB
JJJJ
JJ
J
JJJJJJJJJJJJJJJJJJJJ
HHHHHHH
HHHHHHHHHHHHHHHHHHHH0
10
20
30
40
50
60
70
0 50 100 150 200 250 300
B
G
R
Input Level (8 bits)
Lum
inan
ce o
f pho
spho
r (c
d/m
2 )Figure 9(a). The relationship between input levels of CRT (Nanao Flex Scan56T) and
luminance of phosphor.
Figures 10(a) and 10(b) show the X-Y and Z-Y relationship for each RGB
channel of Nanao Flex Scan56T CRT and AppleColor MO401 CRT respectively.

Chapter 3
29
BBBBBBBBBBBBBBBBBBBBBBBBBBB
JJJJJJJJJJJJJJJJJ
JJJJJJJJJJ
HHHHHHHHHHHHHHHHHHHHHHHHHHH0
10
20
30
40
50
60
0 50 100 150 200 250 300
Input levels (0-255)
G
R
BLum
inan
ce o
f pho
spho
r (c
d/m
)2
Figure 9(b). The relationship between input levels of CRT (AppleColor MO401) and
luminance of phosphor.
Table 4. Coefficients obtained by quadratic curve fitting for CRTs (Nanao FlexScan
56T and AppleColor MO401) in a dark environment.
Monitor Nanao Flex Scan56T Apple MO401
a0 1.216 × 10⁻⁴ 1.536 × 10⁻⁴
a1 6.212 × 10⁻² 1.482 × 10⁻³
a2 − 5.592 × 10⁻¹ −1.745 ×10⁻¹
b0 3.270 × 10⁻⁴ 4.339 × 10⁻⁴
b1 1.863 × 10⁻¹ 9.552 × 10⁻²
b2 −1.714 ×100 −7.855 ×10⁻¹
c0 6.138 × 10⁻⁵ 5.225 × 10⁻⁵
c1 6.782 × 10⁻³ 8.492 × 10⁻³
c2 − 1.122 × 10⁻¹ −9.007 × 10⁻²

Chapter 3
30
BBBBB
BB
BBBBBBBBBBBB
0
5
10
15
20
25
30
35
40
0 5 10 15 20 25
YR
XR
BBBB
BBB
BBBBBBBBBBBB
0 5 10 15 20 25
YR
ZR
1.6
1.4
1.2
1.0
0.8
0.6
0.4
0.2
0
a) R channel ( X-Y) b) R channel ( Z-Y)BBBBBB
BBBBBBBBBBBBBBB
0
5
10
15
20
25
30
35
0 10 20 30 40 50 60 70
YG
XG
BBBBBB
BBBB
BBBBBBBBBBB
0
2
4
6
8
10
12
14
0 10 20 30 40 50 60 70Y
YG
ZG
c) G channel ( X-Y) d) G channel ( Z-Y)
BBBBBBBBBBBBBBBBBBBBBBB
B0
2
4
6
8
10
12
14
16
0 1 2 3 4 5 6 7
YB
XB
BBBBBBBBBBBBBBBBBBBBBBBB0
10
20
30
40
50
60
70
80
0 1 2 3 4 5 6 7
YB
ZB
e) B channel ( X-Y) f) B channel ( Z-Y)
Figure 10(a). X-Y and Z-Y relationship for each RGB channel of the CRT (Nanao Flex
Scan56T).

Chapter 3
31
YRa) R channel ( X-Y)
XR
YRb) R channel ( Z-Y)
ZR
YGc) G channel ( X-Y)
XG
YGd) G channel ( Z-Y)
ZG
YBe) B channel ( X-Y)
XB
YBf) B channel ( Z-Y)
ZB
BBBBBB
BBBBBBBBBBBBBBBBBBBBB0
2
4
6
8
10
12
14
0 1 2 3 4 5 6
BBBBBB
BBBBBBBBBBBB
BBBBBBBBB0
10
20
30
40
50
60
70
80
0 1 2 3 4 5 6
BBBBBBBBBBBBBBBBBBBBBBBBBBB0
5
10
15
20
25
0 10 20 30 40 50 60
BBBBBBBBBBBBBBBBBBBBBBBBBBB0
2
4
6
8
10
12
0 10 20 30 40 50 60
BB
BB
BBBBB
BB
BBBBBBBBB
BBBBBBB0
5
10
15
20
25
0 2 4 6 8 10 12 14
BB
BBBB
BBB
BB
BBBBBBBB
BBBBBBBB0
0.2
0.4
0.6
0.8
1
1.2
0 2 4 6 8 10 12 14
Figure 10(b). X-Y and Z-Y relationship for each RGB channel of the CRT
(AppleColor MO401).

Chapter 3
32
From Figs. 10(a) and 10(b) it is possible to determine the coefficients shown in
Table 5 for linear Eq. (3-7).
Table 5. Coefficients obtained by linear curve fitting for CRTs (Nanao FlexScan 56T
and AppleColor MO401) in a dark environment.
Monitor Nanao Flex Scan56T AppleColor MO401
aR 1.773 × 100 1.791× 100
aG 4.882 × 10⁻¹ 4.867 × 10⁻¹
aB 2.429 × 100 2.420 × 100
bR 1.372 × 10⁻¹ 4.909 × 10⁻²
bG 3.714 × 10⁻² 1.020 × 10⁻²
bB −2.258 ×10⁻² 2.220 × 10⁻³
cR 7.242 × 10⁻² 7.719 ×10 -2
cG 1.934 × 10⁻¹ 1.967 × 10 -1
cB 1.314 × 101 1.293×101
dR 6.663 × 10⁻³ 2.238 × 10 −4
dG −5.807 × 10⁻² −4.334 × 10⁻²
dB −1.391 × 10⁻¹ 3.079 × 10⁻²
Five facial pattern images with 1920 by 1035 pixels were taken by a HDTV
camera under the same conditions used for camera calibration. The model is a Japanese
young woman. The tristimulus values X’, Y’, Z’ were calculated using the estimated

Chapter 3
33
spectral reflectance under four illuminants; “Day Light”, “A”, “Cool White”, and
“Horizon”. Those spectral radiances and chromaticities are shown in Fig. 11. The
calculated tristimulus values were converted to Rc, Gc, Bc values and they are displayed
on CRT.
"Horizon"
"Day Light"
"Cool White"
Wavelength (nm)
"A"x=0.46 y=0.42
x=0.50 y=0.42
x=0.32 y=0.34
x=0.39 y=0.41
Rel
ativ
e ra
dian
t pow
er
Figure 11. Relative spectral radiant power and chromaticities of four illuminants used in
the experiment.
Figure 12 shows the hardcopy of the predicted facial pattern printed directly
from the input levels Rc, Gc, Bc without any preprocessing or color correction. Actually,
these images should be observed on CRT. We can see that the portrait images under
"A" and "Horizon" illuminants seem reddish, because longer wavelength components
are predominant in these illuminants as shown in Fig. 11.

Chapter 3
34
(a)“Horizon” (b)“A”
(c)“Cool White” (d)“Day Light”
Figure 12. A facial pattern image reproduced colorimetrically on CRT under four
illuminants; (a) “Horizon,” (b) “A,” (c) “Cool White,” (d) “Day Light” illuminants.

Chapter 3
35
3.5 Conclusion
In this chapter, a colorimetric color reproduction method for portrait image on CRT in a
dark environment was proposed. In this method, the tristimulus values of each pixel of
the image were calculated using the estimated spectral reflectance, the spectral radiance
of the illuminant and the color matching functions. The calculated tristimulus values
were transformed to R, G, B values of CRT. A portrait image under various illuminants
was reproduced on CRT. The portrait images under “Horizon” and illuminant “A”
seem very reddish because the predominance of the long-wavelength components in
such illuminants. However, the portrait images under “Horizon” and illuminant “A”
do not seem actually so reddish when viewed under such illuminants because the
chromatic adaptation is not considered yet in this reproduction method.

Chapter 4
36
CHAPTER 4
COLORIMETRIC COLOR REPRODUCTION OF FACIAL
PATTERN IMAGE ON HARDCOPY
4.1 Introduction
Color correction is necessary to match the tristimulus values of hardcopies with those in
the original scene. The colorimetric calibration of printers for color correction is
difficult because this calibration depends on the observing environment and specially on
the illuminants. Various color transform corrections have been proposed for
colorimetric calibration.6,105,106 In this chapter, the printer calibration is achieved by
making color transformation function during the printing process, using the data base of
input values to printer and spectral reflectances, measured before the printing.
4.2 Color reproduction method for hardcopy under various illuminants
Figure 13 shows the schematic diagram of the colorimetric color reproduction of facial
pattern image on hardcopy under various illuminants. In this reproduction method, the
tristimulus values X'', Y'', Z'' of a printed skin color image under an illuminant with
spectral radiance E3(λ) were matched to the tristimulus values X', Y', Z' calculated using
principal components of the spectral reflectance of the skin. To achieve the matching,
the matrix M3 was used to transform the CRT input levels Rc , Gc , Bc to printer input
levels Rp , Gp , Bp . The matrix M3 is a function of the spectral radiance E3(λ) of the
illuminant for viewing of hardcopy and this matrix is calculated by multiple regression
analysis using a data base of input values to the printer and measured spectral

Chapter 4
37
reflectances. It is noted that we do not need to measure the tristimulus values of the
color patches under each illuminant for calibration.
HDTV
( R, G, B )
( X, Y, Z )
CRT display
Hardcopy
Printer
(Rc, Gc, Bc ) (Rp, Gp, Bp )
(X", Y", Z" )X', Y' Z',( ) =
(
(
E1(λ ) E2(λ ) E3(λ )
M3(E3(λ ))
((
(
M2
M1
O(λ)
O(λ)
(
(
Figure 13. Diagram of the color reproduction method for hardcopy of skin color image
under various illuminants.
4.3 Multiple regression analysis using skin spectral reflectances
Figure 14 shows a schematic diagram of the multiple regression analysis using the
database. One hundred eight skin color patches were printed using a laser thermal
development and transfer printer (Fujix Pictrography 3000) with printer input level Rpn ,
Gpn , Bp
n . The spectral reflectance On λ( ) of each patch was measured by a
spectrophotometer (Datacolor Spectraflash 500).
In the on-line calibration, the tristimulus values X n" ,Yn ", Zn " were calculated
under a selected illuminant E3(λ) using the data base. The tristimulus values X n" , Yn ",

Chapter 4
38
Zn " for each patch were transformed to Rcn , Gc
n , Bcn CRT input levels using the
transformation matrix M2. The coefficients (ai,j ) (i=1...3, j=1...11) of matrix M3 in the
Eq. (4-1) were determined by multiple regression analysis107.
M2
(n=1 to 108)
E3 (λ)Input: Spectral radiance
M3(E3 (λ))
X Y Zn )( , ,n n" " "
Gnn
R )( , , Bn
p p p
B cnn
cR )( , ,Gn
c
nO λ( )X Y Z'n )( , ,
n n' '
Multiple regression analysis
Database
Measured once
Output:
Printedoff-l ine
Off- l ineOn-l ine
CRT displayHardcopy
Figure 14. Diagram of the multiple regression analysis.
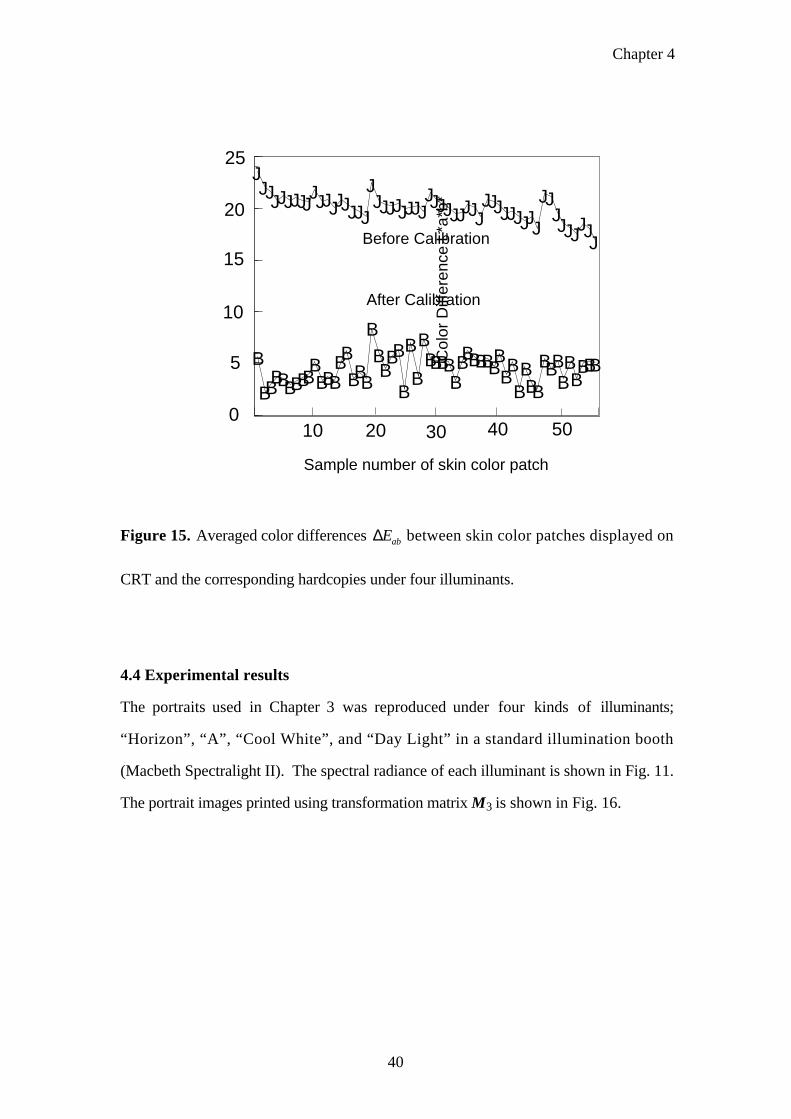
The accuracy of this colorimetric color reproduction was evaluated by averaged
color differences of fifty-five skin color patches used in the multiple regression analysis.
The color difference was calculated between CRT and hardcopy, with and without color
transformation.

Chapter 4
39
RP
GP
BP
=
a1,1 a1,2 ... a1,11
a2,1 a2,2 ... a2,11
a3,1 a3,2 ... a3,11
RC
GC
BC
RC2
GC2
BC2
RCGC
GCBC
RCBC
RCGC BC
1
(4-1)
As shown in Fig. 15, the averaged color difference ∆E*ab was 19.9 without the color
transformation, and 4.5 with the color transformation. Thereafter, fifty-five skin color
patches, not used in multiple regression analysis, were printed with color transformation
by M3. The averaged color difference ∆E*ab was 4.9. We can conclude that the
proposed color transformation is effective to match the skin color between displayed
image and hardcopy. The matrix M3 was calculated using a workstation (SPARC
station II; Sun micro system Inc.) in an average time of 25 seconds.
Chapter 4
40
B
BBBBBBBBBBBBBB
BBB
B
BBBB
B
B
B
BBBBBBBBBBBB
BBB
BBBB
BBBBBBBBB
JJJJJJJJJ
JJJJJJJJJ
JJJJJJJJJ
JJJJJJJJJJJJJJJJJJ
JJJJJJJJJ
10 20 30 40 500
5
10
15
20
25
Before Calibration
After Calibration
Sample number of skin color patch
Col
or D
iffer
ence
L*a
*b*
Figure 15. Averaged color differences ∆Eab between skin color patches displayed on
CRT and the corresponding hardcopies under four illuminants.
4.4 Experimental results
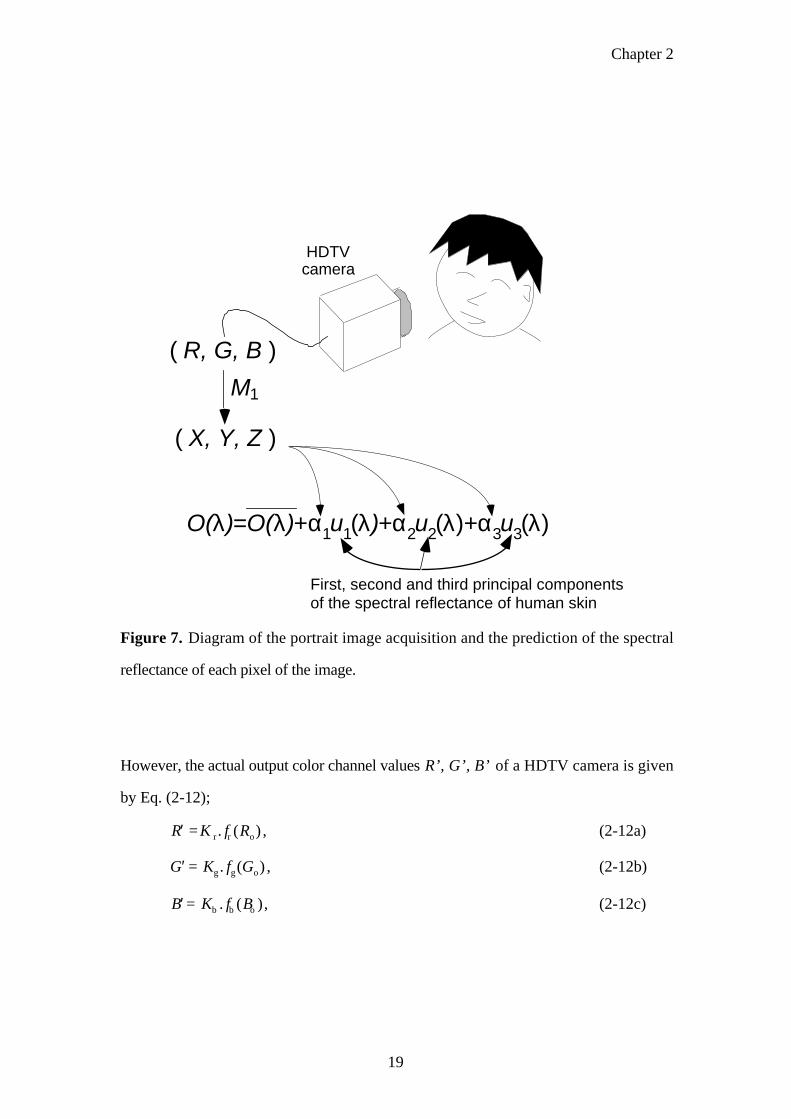
The portraits used in Chapter 3 was reproduced under four kinds of illuminants;
“Horizon”, “A”, “Cool White”, and “Day Light” in a standard illumination booth
(Macbeth Spectralight II). The spectral radiance of each illuminant is shown in Fig. 11.
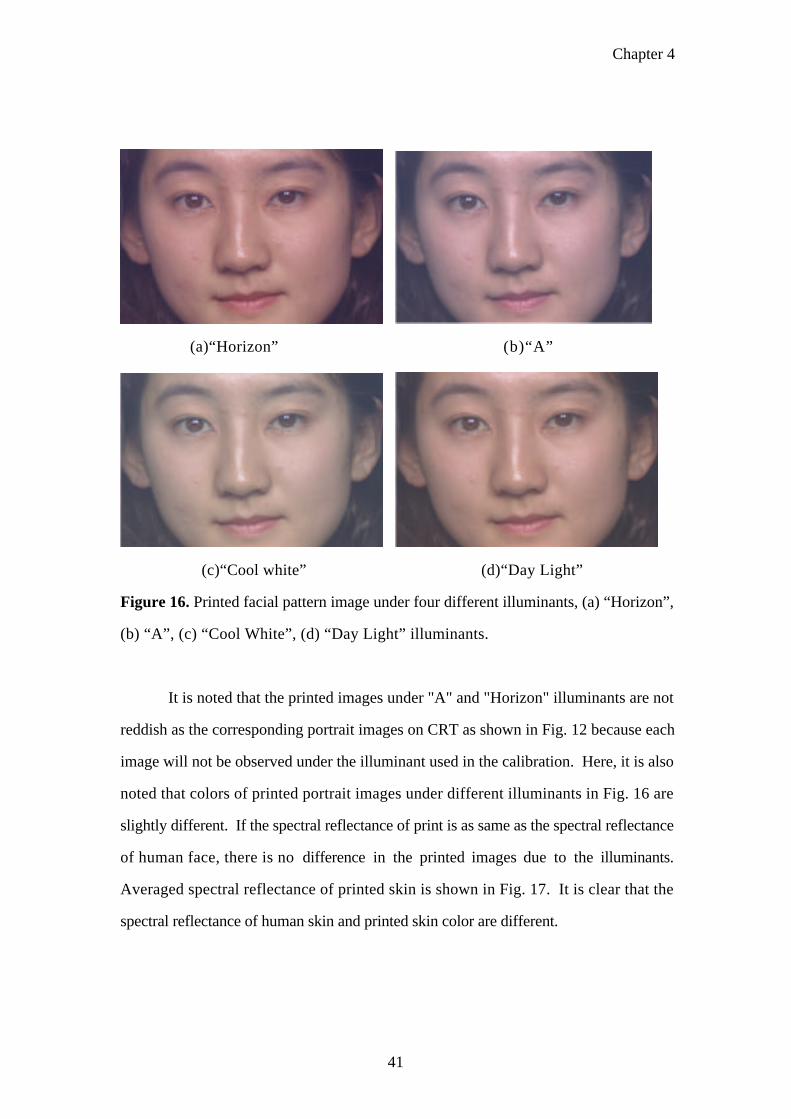
The portrait images printed using transformation matrix M3 is shown in Fig. 16.
Chapter 4
41
(a)“Horizon” (b)“A”
(c)“Cool white” (d)“Day Light”
Figure 16. Printed facial pattern image under four different illuminants, (a) “Horizon”,
(b) “A”, (c) “Cool White”, (d) “Day Light” illuminants.
It is noted that the printed images under "A" and "Horizon" illuminants are not
reddish as the corresponding portrait images on CRT as shown in Fig. 12 because each
image will not be observed under the illuminant used in the calibration. Here, it is also
noted that colors of printed portrait images under different illuminants in Fig. 16 are
slightly different. If the spectral reflectance of print is as same as the spectral reflectance
of human face, there is no difference in the printed images due to the illuminants.
Averaged spectral reflectance of printed skin is shown in Fig. 17. It is clear that the
spectral reflectance of human skin and printed skin color are different.

Chapter 4
42
0
10
20
30
40
50
60
400 450 500 550 600 650 700
Averaged spectral reflectanceof skin
Averaged spectral reflectanceof printed skin color
Wavelength (nm)
Spe
ctra
l re
flect
ance
(%
)
Figure 17. Comparison between averaged spectral reflectance of human skin and
printed skin color.
4.5 Conclusion
In this chapter, skin color images are reproduced colorimetrically on hardcopy under
various illuminants. The averaged color difference of 4.9 between the measured and
predicted tristimulus values shows sufficient accuracy of the proposed colorimetric color
reproduction.
It is noticed that the color reproduction of portrait on CRT is different from the
hardcopy under various illuminants because the chromatic adaptation is not considered
yet in the reproduction on CRT.
The color reproduction described in this paper is not applicable to the lips, hair,
eyes and so on, because only the spectral reflectance of human skin was considered
here.

Chapter 5
43
CHAPTER 5
COLOR REPRODUCTION OF FACIAL PATTERN IMAGE BASED ON
COLOR APPEARANCE MODELS
5.1 Introduction
Experimental methods to predict the tristimulus values of skin color under various
illuminants on CRT and hardcopy were described in Chapters 3 and 4. In this chapter a
method of color reproduction based on color appearance models is described. This
reproduction can be made matching the appearance of CRT with the reproduction on
hardcopy under various illuminants.
Some color appearance models are introduced in the colorimetric color
reproduction on CRT. However, there is not a standard color appearance model to
match the skin color appearance. Then, a comparison between color appearance models
is required to select a suitable model for skin color appearance reproduction. In this
chapter an outline of some color appearance models and viewing techniques for
psychophysical experiments are also presented.
5.1.1 Chromatic adaptation models
A) von Kries model
The von Kries coefficient law is based on the complete adaptation of human color visual
system to the white point of the illuminant. The cone fundamental tristimulus values L,
M, S are simply multiplicated by constant values, respectively. The constant values are
taken to be the inverses of the respective cone responses for the maximum signal of the

Chapter 5
44
illuminant. Then, the responses at new adapting field, La , Ma , and Sa can be written as
follows:
La = kLL , kL =LNa
LNo
, (5-1a)
Ma = kMM , kM =MNa
MNo
, (5-1b)
Sa = kSS , kS =SNa
SNo
, (5-1c)
where, L, M, and S are the excitations of cones on retina at original adapting field, k L ,
k M , and kS are multiplicative factors, LNa , MNa , and SNa are cone excitations for the
white point of new adapting illuminant, and LNo , MNo , and SNo are the cone excitations
for the white point of original illuminant.
B) CIELAB (LAB) color space
In 1976, CIE recommended CIELAB color space for color-difference metric which also
incorporates a modified form of the von Kries model, X/ XN , Y/YN , and Z/ ZN as shown
in Eq. (5-2),
L* = 116Y
YN
13
−16 , (5-2a)
a* = 500X
XN
13
−Y
YN
13
, (5-2b)
b* = 200Y
YN
13
−Z
ZN
13
, (5-2c)
where XN , YN , and ZN are the tristimulus values of the illumination white point.
Chapter 5
45
The tristimulus values Xa , Ya , Za at the new adapting field can be calculated as
follows:
Xa =a*
500+
L* +16
116
3
′ X N , (5-3a)
Ya =L* + 16
116
3
′ Y N , (5-3b)
Za =L* +16
116
−
b*
200
3
′ Z N , (5-3c)
where ′ X N , ′ Y N , and ′ Z N are the tristimulus values of the white point of the adapting
illuminant. CIELAB was not standardized to be a color appearance model. However it
provides a good approximation for color appearance in near-daylight conditions.
C) Fairchild color appearance model
The Fairchild color appearance model uses incomplete chromatic adaptation of cones to
the white point. This model is based on von Kries coefficient law, with an introduction
of a functional expression proposed by Hunt46 for incomplete levels of adaptation as
shown in Eq. (5-4).
′ L = ρLL/L
N, (5-4a)
′ M = ρM M/MN , (5-4b)
′ S = ρS S/SN , (5-4c)
where L’, M’, and S’ are the cone excitations considering a certain degree of chromatic
adaptation, ρL
,ρM , and ρS are parameters to represent degree of chromatic adaptation of
cones, respectively. LN
, MN , SN are respectively the L, M, S cone responses to the white
Chapter 5
46
point of the illuminant. Equation (5-4) can be expressed in matrix form as shown in Eq.
(5-5).
L'
M'
S'
= A
L
M
S
, (5-5)
The matrix A is
aL 0 0
0 aM 0
0 0 aS
, (5-6)
where
aL = ρL /LN , (5-7a)
aM = ρM/MN , (5-7b)
aS = ρS/SN . (5-7c)
The degree of chromatic adaptation can be calculated as follows:
ρL =
1 + YNυ + lE( )
1+ YNυ + 1/lE( ) , (5-8a)
ρM =1 + YN
υ + mE( )1+ YN
υ + 1/mE( ) , (5-8b)
ρS =1+ YN
υ + sE( )1+ YN
υ + 1/sE( ) , (5-8c)
where YN is the luminance of the illuminant, υ is an exponent that defines the shape of
the degree of the adaptation function and lE , mE , and sE are the fundamental
chromaticity coordinates of the adapting stimulus. Originally, Fairchild used the
exponent υ equal to 0.22 as suggested for a dark environment. This exponent value

Chapter 5
47
was set equal to 0.29 in the refinement of RLAB model by Fairchild.72 The lE , mE , and
sE values are calculated as follows:
lE =
3LN
LN + MN + SN
, (5-9a)
mE =3MN
LN + MN + SN
, (5-9b)
sE =3SN
LN + MN + SN
, (5-9c)
From the Eqs. (5-4) to (5-9), we can see that the adaptation will be less complete
for increasing values of the saturation of the adapting stimulus. The equations above
also show that the adaptation will be more complete for increasing values of the
luminance of the adapting stimulus.
The final step in the calculation of adaptation cone signals is a transformation
considering interaction among cones given by Eq. (5-10). This transformation allows
the model to predict increases of the perceived colorfulness called Hunt effect. This
transformation also allows the prediction of the increases of contrast with increasing
luminance, called Stevens effect.108
La
Ma
Sa
=1 c c
c 1 c
c c 1
′ L
′ M
′ S
, (5-10)
where c is calculated as follows:
c = 0.2190 − 0.0784log10
(YN
) . (5-11)
The entire model to predict the tristimulus values XA , YA , ZA in a second adapting
condition from the tristimulus values X, Y, Z in a first adapting condition can be
expressed by a single matrix equation as follows,

Chapter 5
48
XA
YA
ZA
= M−1A2−1C2
−1C1A1M
X
Y
Z
, (5-12)
where matrix M is the transformation from tristimulus values to cone fundamental
primaries. Matrix A1 and C1 respectively the matrices of Eqs. (5-6) and (5-10) for
adapting condition 1. Matrix A2 and C2 are respectively the matrices of Eqs. (5-6) and
(5-10) for adapting condition 2.
Fairchild and Berns incorporate this chromatic adaptation model into CIE 1976
(L*, a*, b*) color space in the RLAB color appearance model.38 This color space can
determine the required colors for reproduction across changes in media and viewing
conditions. This model can also be used for calculating metrics of lightness, chroma,
hue and color difference.
D) LLAB color appearance model.
In the model proposed by Luo and coworkers,73,74 the Rr , Gr ,Br cone responses at new
adapting field is calculated from the Rs , Gs , Bs cone at original adapting field using the
following equations;
Rr = D(Ror
Ros
) +1 − D
Rs , (5-13a)
Gr = D(Gor
Gos
) +1 − D
Gs , (5-13b)
Br = D(Bor
Bos
) +1 − D
Bsβ , for Bs ≥ 0 (5-13c)
Br = − D(Bor
Bos
) +1 − D
Bsβ , for Bs < 0 (5-13d)

Chapter 5
49
where β = (Bos
Bor
)0.0834 , Ros , Gos , Bos are the cone responses for the white point under
original adapting field; Ror , Gor Bor are the cone responses for the white point in the
environment in which the image will be reproduced; D value is 1.0 for hardcopies and
0.7 for CRT in dim surround.
5.1.2 Viewing techniques for cross-media comparison
The comparison of color appearance models is based on the recommendations of many
technical committees such as CIE Technical Committee 1-34, “Testing Colour-
Appearance Models in order to establish standard guideline for coordinated research on
evaluation of color appearance models for hardcopy and image on CRT”. 109-111 The
recommended methods use psychophysical experiments to select a suitable color
appearance model for cross-media reproduction. The psychophysical experiments for
the comparison of color appearance models are based on many viewing techniques such
as successive-binocular, simultaneous-binocular, simultaneous-haploscopic, successive-
Ganzfeld haploscopic, and memory matching technique. In the memory matching
technique, the illumination booth with the hardcopy and the CRT are placed at 90
degrees from each other ensuring that observers can not see both images on CRT and
the hardcopy at the same time. In this technique observers are asked to observe the
image in the booth before observing the image on CRT to compare images under
different conditions. In this technique observers are allowed to look at both hardcopy
and CRT only once. The successive-binocular viewing is equal to the memory
technique except that observers are allowed to look at both hardcopy and CRT as much
time as necessary to compare images. In the simultaneous-binocular technique, the
hardcopy in the illumination booth and the image on CRT are place side by side and the
observer is instructed to see the hardcopy and image on CRT with both eyes. In the
Chapter 5
50
simultaneous-haploscopic technique observers are instructed to observe the hardcopy
with one eye and the image on CRT with the other eye. This technique allows that each
eye adapts to a different white point while comparing the images. The successive-
Ganzfeld haploscopic viewing technique112 is similar to the simultaneous-haploscopic
viewing technique except that observers are not allowed to view both the hardcopy and
image on CRT at the same time. In this technique covers with a neutral field switches
over each eye allowing adaptation while the other eye is observing the image.
These viewing techniques have been compared by psychophysical methodology
such as the experiments performed by Braun and Fairchild.113 The binocular
matching114 was more preferred than haploscopic matching. It happens because the
binocular viewing is more natural way of viewing, and it is easier (it is accomplished
without the necessity of any special device) and more comfortable for the observer than
haploscopic viewing. These experiments also show that a successive color viewing was
preferred than a simultaneous color viewing because successive matching yielded the
shorter matching times115 and interocular interactions can be controlled116. Based on the
considerations above, the memory matching that combines easiness, successive color
matching and binocular color matching is preferred than other viewing techniques117 to
compare reproduced images using various color appearance models. Therefore,
memory matching technique will be used in the psychophysical experiments.
5.2 Color appearance matching method
Figure 18 shows a schematic diagram of the skin color reproduction method based on
color appearance model. Using color appearance models, the tristimulus values
Xa, Ya , and Za after the chromatic adaptation can be calculated from the tristimulus
values X’, Y’, Z’ obtained by colorimetric color reproduction. At first, X’, Y’, Z’ are
transformed to cone fundamental tristimulus values L, M, and S. The Hunt-Pointer-

Chapter 5
51
Estévez transformation are used to calculate L, M, S values, as shown in Eqs. (5-14) and
(5-15).38 This transformation is normalized to CIE Illuminant D65.
CRT display
(La, Ma, Sa )
-1
M
(Xa, Ya, Za )
Color Transform Matrix
E(λ )
PrincipalComponents
( L, M, S )
O(λ)
Colorimetric prediction
Calculatedtristimulus values
( Color appearance models
(X', Y', Z' )
(X', Y', Z' )
M
Figure 18. Diagram of color reproduction of facial pattern images on CRT based on
color appearance models.
L
M
S
= M
′ X
′ Y
′ Z
(5-14)
M =0.40 0.71 −0.08
−0.23 1.17 0.05
0.00 0.00 0.92
(5-15)

Chapter 5
52
Thereafter, the calculated L, M, and S values are used to estimate fundamental
tristimulus values La , Ma , and Sa corresponding to the cone responses after the
chromatic adaptation using color appearance models. The predicted values La , Ma , and
Sa were calculated using von Kries, and Fairchild models. Next, Xa, Ya , and Za
considering chromatic adaptation are calculated by the inverse of matrix M . Finally, the
predicted tristimulus values Xa, Ya , and Za are reproduced on CRT using color
transform matrix.
5.3 Psychophysical experiments
Psychophysical experiments were performed to select a suitable color appearance model
for the reproduction of skin color images on CRT in a dark environment. The images
on CRT were compared with a hardcopy illuminated in a standard illumination booth
(Macbeth Spectralight II). The booth contains four illuminants; “Horizon”, “A”,
“Cool White”, and “Day Light”. The spectral radiances of these illuminants are
shown in Fig. 11. We reproduced five facial pattern images of a Japanese woman and
six skin color patches. The chromaticities of skin color patches are extracted from the
facial pattern images and the tristimulus values of the six color patches under “ A ”
illuminant are shown in Table 6.

Chapter 5
53
Table 6. The tristimulus values of the six skin color patches under illuminant “A”.
Patch X Y Z
1 105 90 20
2 72 66 18
3 75 70 19
4 38 37 12
5 47 45 13
6 72 61 14
Four images were generated on CRT for each illuminant; an image generated by
X’, Y’ and Z’ without considering chromatic adaptation, named XYZ image; an image
generated by von Kries color appearance model, von Kries image; an image generated
by Fairchild model, Fairchild image; and an image generated by CIELAB model,
CIELAB image. Figure 19 shows an example of predicted color appearance for the skin
color patches under various illuminants. The reproduction for each color appearance
model is shown in Figs. 20, 21, 22 and 23 respectively, under illuminant “A”,
“Horizon”, “Cool white”, and “Day Light”.

Chapter 5
54
XYZ CIELAB XYZ CIELAB
von Kries Fairchild von Kries Fairchild
(a) illuminant “A” (b) “Horizon”
XYZ CIELAB XYZ CIELAB
von Kries Fairchild von Kries Fairchild
(c) “Cool White” (d) “Day Light”
Figure 19. Predicted color appearance of skin color patches under various
illuminants; (a) illuminant “A”, (b) “Horizon”, (c) “Cool White”, (d) “Day Light”.

Chapter 5
55
(a) XYZ (c) CIELAB
(c) von Kries (d) Fairchild
Figure 20. Color appearance predictions of a facial pattern image under
illuminant “A”; (a) XYZ, (b) CIELAB, (c) von Kries, (d) Fairchild.

Chapter 5
56
(a) XYZ (c) CIELAB
(c) von Kries (d) Fairchild
Figure 21. Color appearance predictions of a facial pattern image under
“Horizon”; (a) XYZ, (b) CIELAB, (c) von Kries, (d) Fairchild.
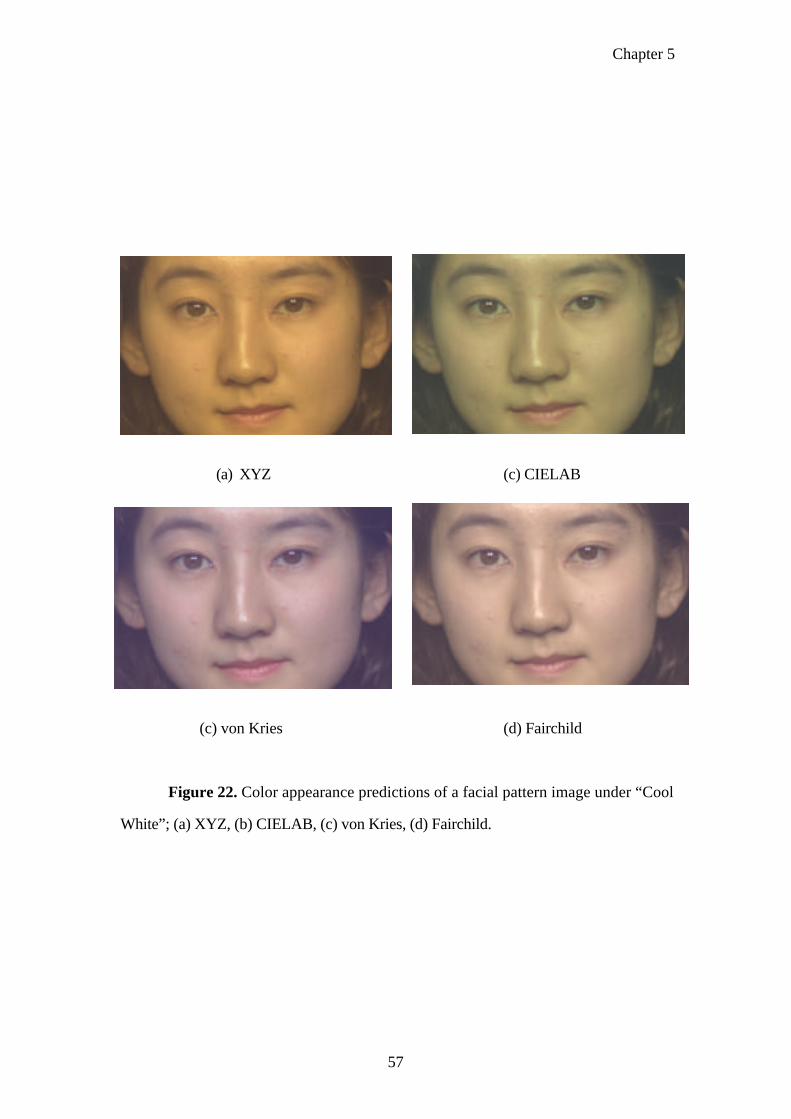
Chapter 5
57
(a) XYZ (c) CIELAB
(c) von Kries (d) Fairchild
Figure 22. Color appearance predictions of a facial pattern image under “Cool
White”; (a) XYZ, (b) CIELAB, (c) von Kries, (d) Fairchild.
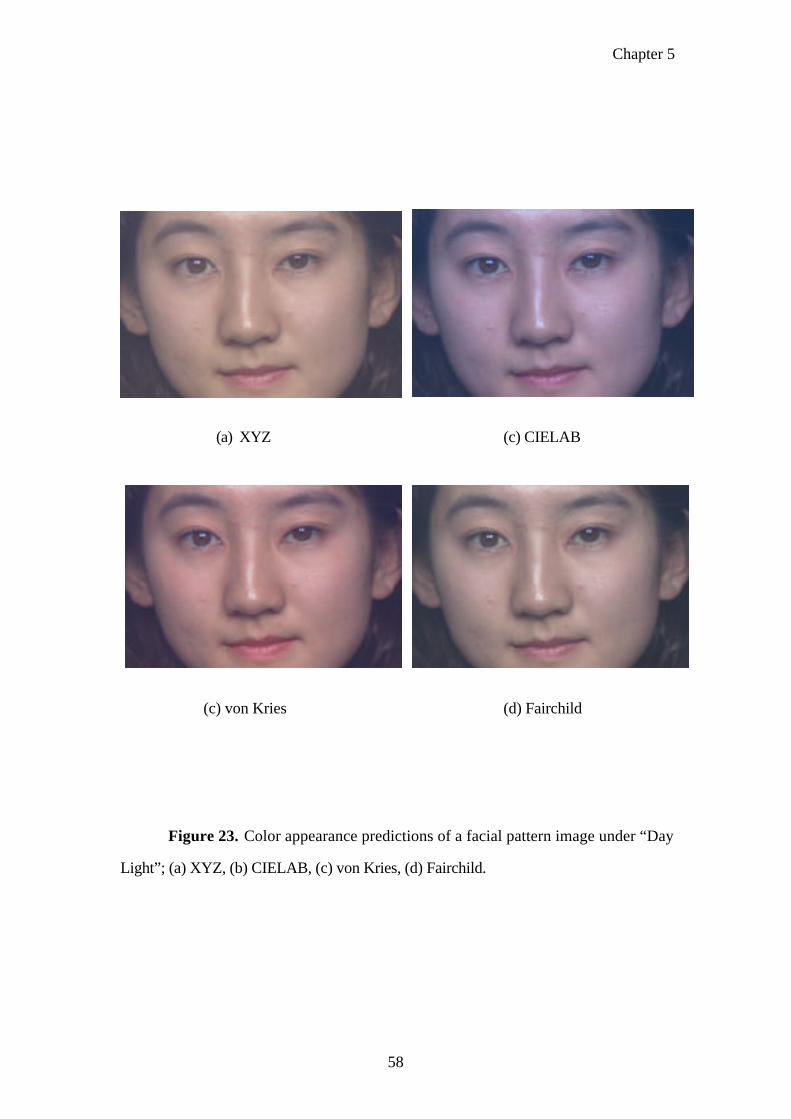
Chapter 5
58
(a) XYZ (c) CIELAB
(c) von Kries (d) Fairchild
Figure 23. Color appearance predictions of a facial pattern image under “Day
Light”; (a) XYZ, (b) CIELAB, (c) von Kries, (d) Fairchild.

Chapter 5
59
Figure 24 shows a viewing technique using memory matching that was used to
select a suitable color appearance model to reproduce skin color images on CRT.
90o
Standard Illumination Booth
Observer
1 m
1 m
CRT Display
w=10 cm for facial pattern imagew=5 cm for skin color patchh=6 cm for facial pattern imageh=5 cm for skin color patch
w
w
h
h
Figure 24. Arrangement of psychophysical experiment to compare skin color images
on a CRT with a hardcopy in a standard illumination booth using memory matching.
Both CRT and hardcopy were arranged at an equal viewing distance of approximately 1
m from the observer. The images, whether it is on the CRT or in the illumination booth,
would be observed with both eyes. The observer can see the CRT and the hardcopy
only once to obtain a comparative judgment.
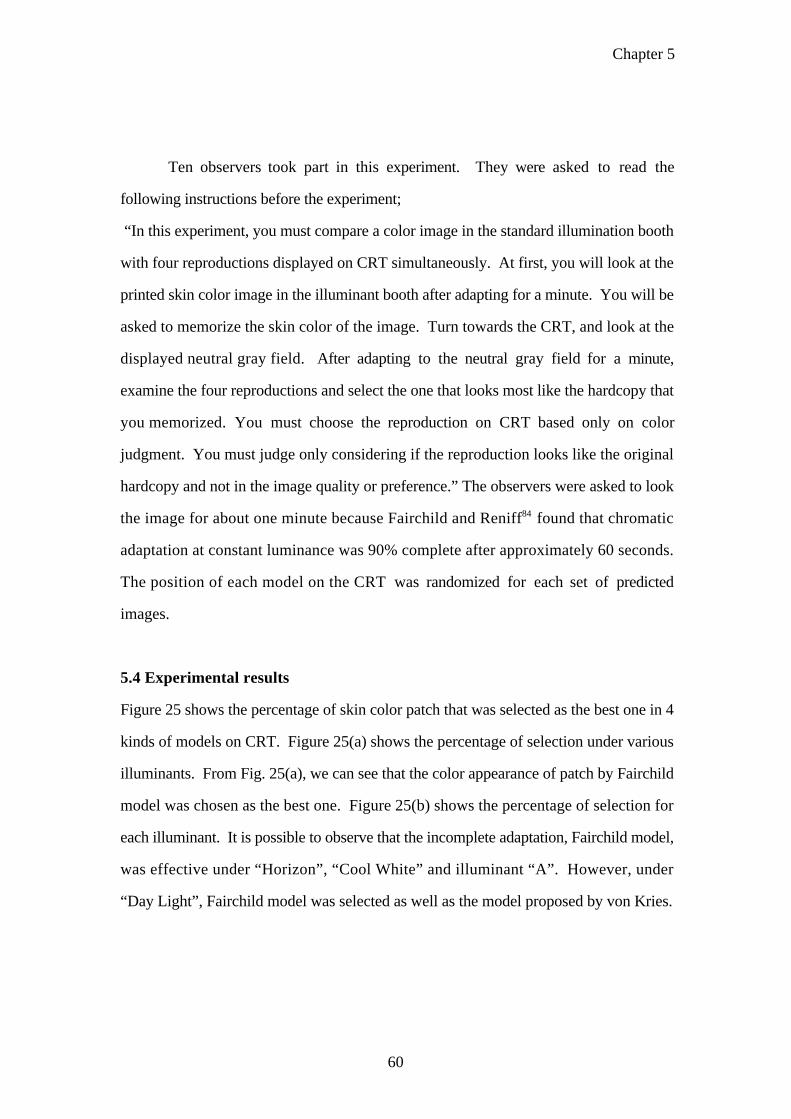
Chapter 5
60
Ten observers took part in this experiment. They were asked to read the
following instructions before the experiment;
“In this experiment, you must compare a color image in the standard illumination booth
with four reproductions displayed on CRT simultaneously. At first, you will look at the
printed skin color image in the illuminant booth after adapting for a minute. You will be
asked to memorize the skin color of the image. Turn towards the CRT, and look at the
displayed neutral gray field. After adapting to the neutral gray field for a minute,
examine the four reproductions and select the one that looks most like the hardcopy that
you memorized. You must choose the reproduction on CRT based only on color
judgment. You must judge only considering if the reproduction looks like the original
hardcopy and not in the image quality or preference.” The observers were asked to look
the image for about one minute because Fairchild and Reniff84 found that chromatic
adaptation at constant luminance was 90% complete after approximately 60 seconds.
The position of each model on the CRT was randomized for each set of predicted
images.
5.4 Experimental results
Figure 25 shows the percentage of skin color patch that was selected as the best one in 4
kinds of models on CRT. Figure 25(a) shows the percentage of selection under various
illuminants. From Fig. 25(a), we can see that the color appearance of patch by Fairchild
model was chosen as the best one. Figure 25(b) shows the percentage of selection for
each illuminant. It is possible to observe that the incomplete adaptation, Fairchild model,
was effective under “Horizon”, “Cool White” and illuminant “A”. However, under
“Day Light”, Fairchild model was selected as well as the model proposed by von Kries.

Chapter 5
61
(a) Selected model under various illuminants.
0102030405060
708090
100
XYZ von Kries FairchildCIELAB
Per
cent
age
chos
en Illuminant "A"
"Day Light"
"Horizon"
"Cool White"
(b) Selected model under each illuminant.
Figure 25. Percentage of selection of each color appearance model for skin color patch
reproduction.
On the other hand, Fig. 26 shows the percentage of selection of each color
appearance model for reproduced facial pattern image. Figure 26(a) shows the
percentage of selected models under various illuminants. It is clear that Fairchild model

Chapter 5
62
was chosen as well as the color patches. Figure 26(b) shows the percentage of selected
model for each illuminant.
0102030405060
708090
100
CIELAB von Kries FairchildXYZ
Per
cent
age
chos
en
Face1
Face2
Face3
Face4
Face5
(a) Selected model under various illuminants.
XYZ CIELAB Fairchild0
102030405060
708090
100
von Kries
Per
cent
age
chos
en
Illuminant "A"
"Day Light"
"Horizon"
"Cool White"
(b) Selected model under each illuminant.
Figure 26. Percentage of selection of each color appearance model for facial pattern
image reproduction.

Chapter 5
63
It is clear that, there is no significant difference among illuminants for each model for
facial pattern images.
The comparison of the results obtained in Figs. 25 and 26 shows that the
performance of Fairchild model was not so good for facial pattern images as in the case
of skin color patches. The model proposed by Fairchild was applied well to skin color
patches but it was not effective for facial pattern images as skin color patches. Facial
skin color is one of the human memorized colors. We can believe that this difference in
the performance of Fairchild model is due to the memorized colors118.
5.5 Conclusion
A color reproduction method based on color appearance models was used to match the
appearance of skin color on CRT with hardcopy under various illuminants. The
colorimetric color reproduction was compared with images reproduced using color
appearance models proposed by von Kries, Fairchild and CIELAB color space. The
results of psychophysical experiments using memory matching showed that the
incomplete chromatic adaptation model proposed by Fairchild is a better model than
CIELAB or von Kries. It confirms that an incomplete chromatic adaptation model is
effective for complex image.119 However, the model proposed by Fairchild does not be
applied to facial pattern image as well as skin color patches. These results show that
more studies of the influence of memorized facial skin color are necessary.
The effect of surround on CRT120 and the effect of individual variation of color
matching functions121,122, could also be applied to skin color reproduction.

Chapter 6
64
CHAPTER 6
MODIFIED FAIRCHILD CHROMATIC ADAPTATION MODEL
FOR FACIAL PATTERN IMAGES
6.1. Introduction
The incomplete chromatic adaptation model proposed by Fairchild could be applied well
for skin color patches as shown in a previous chapter. However this model could not
apply to facial pattern image as well as for skin color patches. Therefore, I tried to
modify Fairchild model for facial pattern images.
6.2. Modified Fairchild chromatic adaptation model
Coefficients KL, KM, KS, were introduced in Eq. (5-9) as follows,
lE =
KLLN
LN + MN + SN
, (6-1a)
mE =K
MMN
LN + MN + SN
, (6-1b)
sE =K
SSN
LN + MN + SN
. (6-1c)
In the Fairchild model, the coefficients KL , KM, KS are defined as 3.0. These color
coefficients provide adjustment of the degree of color balance for facial pattern images.
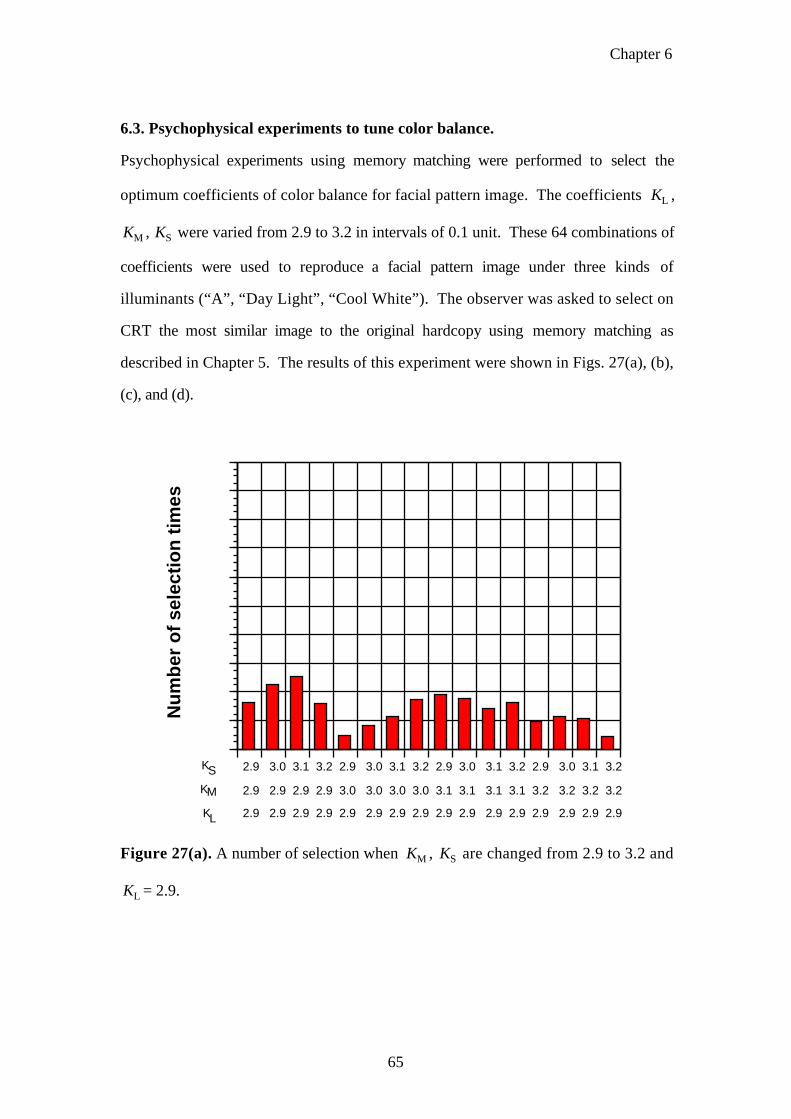
Chapter 6
65
6.3. Psychophysical experiments to tune color balance.
Psychophysical experiments using memory matching were performed to select the
optimum coefficients of color balance for facial pattern image. The coefficients KL ,
KM , KS were varied from 2.9 to 3.2 in intervals of 0.1 unit. These 64 combinations of
coefficients were used to reproduce a facial pattern image under three kinds of
illuminants (“A”, “Day Light”, “Cool White”). The observer was asked to select on
CRT the most similar image to the original hardcopy using memory matching as
described in Chapter 5. The results of this experiment were shown in Figs. 27(a), (b),
(c), and (d).
2.9 3.0 3.1 3.2 2.9 3.0 3.1 3.2 2.9 3.0 3.1 3.2 2.9 3.0 3.1 3.2
2.9 2.9 2.9 2.9 3.0 3.0 3.0 3.0 3.1 3.1 3.1 3.1 3.2 3.2 3.2 3.2
2.9 2.9 2.9 2.9 2.9 2.9 2.9 2.9 2.9 2.9 2.9 2.9 2.9 2.9 2.9 2.9
Nu
mb
er o
f se
lect
ion
tim
es
KS
KM
KL
Figure 27(a). A number of selection when KM , KS are changed from 2.9 to 3.2 and
KL = 2.9.

Chapter 6
66
Nu
mb
er o
f se
lect
ion
tim
es
2.9 3.0 3.1 3.2 2.9 3.0 3.1 3.2 2.9 3.0 3.1 3.2 2.9 3.0 3.1 3.2
2.9 2.9 2.9 2.9 3.0 3.0 3.0 3.0 3.1 3.1 3.1 3.1 3.2 3.2 3.2 3.2
3.0 3.0 3.0 3.0 3.0 3.0 3.0 3.0 3.0 3.0 3.0 3.0 3.0 3.0 3.0 3.0
KSKM
KL
Figure 27(b). A number of selection when KM , KS are changed from 2.9 to 3.2 and
KL = 3.0.
Nu
mb
er o
f se
lect
ion
tim
es
2.9 3.0 3.1 3.2 2.9 3.0 3.1 3.2 2.9 3.0 3.1 3.2 2.9 3.0 3.1 3.2
2.9 2.9 2.9 2.9 3.0 3.0 3.0 3.0 3.1 3.1 3.1 3.1 3.2 3.2 3.2 3.2
3.1 3.1 3.1 3.1 3.1 3.1 3.1 3.1 3.1 3.1 3.1 3.1 3.1 3.1 3.1 3.1
KS
KM
KL
Figure 27(c). A number of selection when KM , KS are changed from 2.9 to 3.2 and
KL = 3.1.

Chapter 6
67
Nu
mb
er o
f se
lect
ion
tim
es
2.9 3.0 3.1 3.2 2.9 3.0 3.1 3.2 2.9 3.0 3.1 3.2 2.9 3.0 3.1 3.2
2.9 2.9 2.9 2.9 3.0 3.0 3.0 3.0 3.1 3.1 3.1 3.1 3.2 3.2 3.2 3.2
3.1 3.1 3.1 3.1 3.1 3.1 3.1 3.1 3.1 3.1 3.1 3.1 3.1 3.1 3.1 3.1
KSKMKL
Figure 27(d). A number of selection when KM , KS are changed from 2.9 to 3.2 and
KL = 3.2.
From Figs. 27(a), (b), (c), and (d), it is decided to choose KL =3.1, KM =2.9,
KS =3.1 as optimum coefficients of color balance for facial pattern image.
6.4. Comparison of the modified Fairchild model with other color appearance
models.
A) Experiment A (Modified Fairchild, XYZ, von Kries, Fairchild)
The coefficients of color balance in the modified Fairchild incomplete chromatic
adaptation equations were set as KL =3.1, KM =2.9, KS =3.1 and the performance of this
modified model was compared with colorimetric color reproduction and other color
appearance models (von Kries, Fairchild) by psychophysical experiments. The
reproduced images under illuminant “A” are shown in Fig. 28.

Chapter 6
68
(a) XYZ (b) Custom
(c)von Kries (d) Fairchild
Figure 28. A facial pattern image reproduced on a CRT for illuminant “A”; (a) XYZ,
(b) Modified Fairchild (Custom model), (c) von Kries, (d) Fairchild.
Psychophysical experiments were performed using memory matching. A
hardcopy in a standard illuminant booth was compared with a pair of reproductions on
CRT in a dark environment. Ten observers were asked to select the reproduction on
CRT that provides the best match in color appearance with the hardcopy. The choices of
reproduction on CRT were converted to an interval scale of color reproduction quality
for various models using Thurstone’s law of comparative judgments123. Using
statistical procedures described by Torgeson124 the averaged z-scores for each model
were calculated. These z-scores give interval scale values of each model indicating their

Chapter 6
69
performance in the reproduction of the original hardcopy. A confidence interval of 95%
for the averaged value is calculated in Eq. (6-2).
±1.960.707
N M, (6-2)
where N is the number of observation for a sample, M is the number of tested models.
In our experiment, the confidence interval around each scale value was 0.283, where
N=15 and M=4. The performances of two models are considered as equivalent if the
average of one model falls within the error bar of another model. The results of these
experiments are shown in Figs. 29(a), (b), and (c), where “Custom” indicates the
modified Fairchild model for facial pattern image. The central bar in each plot of Figs.
29(a), (b), and (c) indicate the averaged interval scale value and the bars indicate the error
in 95% confidence interval. In the case of the XYZ image under “Day Light”
illuminant it was not possible to calculate the z-score because XYZ reproduction was not
selected at all.
Figure 29(a). Averaged interval scale of model performance for illuminant “A”.

Chapter 6
70
Figure 29(b). Averaged interval scale of model performance for “Day Light”.
Figure 29(c). Averaged interval scale of model performance for “Cool White”.
The statistical result of these comparisons showed that the modified Fairchild
model (Custom model) had the best averaged z-scores for all kind of illuminants. The
XYZ image showed the worst results because this reproduction does not consider
chromatic adaptation.

Chapter 6
71
B) Experiment B (Modified Fairchild, von Kries, RLAB 96, LLAB)
XYZ and Fairchild reproductions were replaced by the RLAB refinement
published in 1996 (RLAB 96),72 and LLAB model73,74 to refine and update the
psychophysical experiments. These models were tested for both skin color patches and
facial pattern images. Figure 30 shows a reproduced skin color patch under illuminant
“A”. Figure 31 shows the reproduced facial pattern image under illuminant “A”.
(a) RLAB 96 (b) Custom
(c)von Kries (d) LLAB
Figure 30. A skin color patch reproduced on CRT display for illuminant “A”; (a)
RLAB 96, (b) Modified Fairchild (Custom model), (c) von Kries, (d) LLAB models.
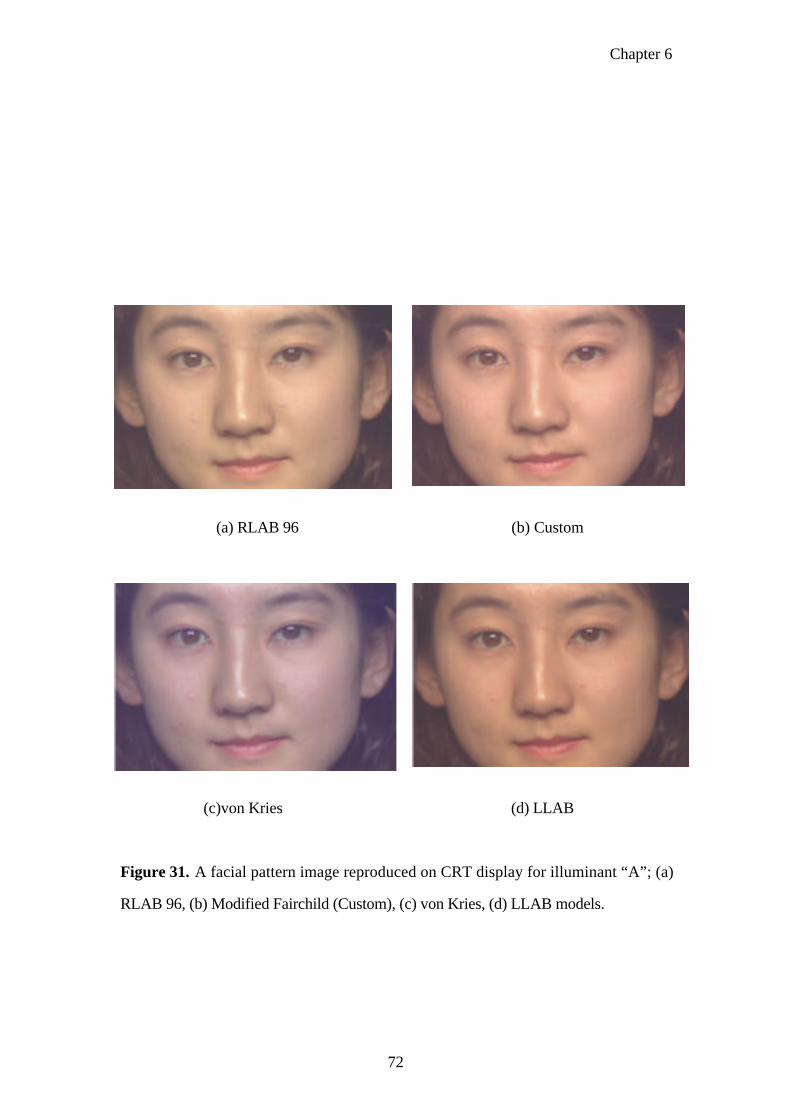
Chapter 6
72
(a) RLAB 96 (b) Custom
(c)von Kries (d) LLAB
Figure 31. A facial pattern image reproduced on CRT display for illuminant “A”; (a)
RLAB 96, (b) Modified Fairchild (Custom), (c) von Kries, (d) LLAB models.
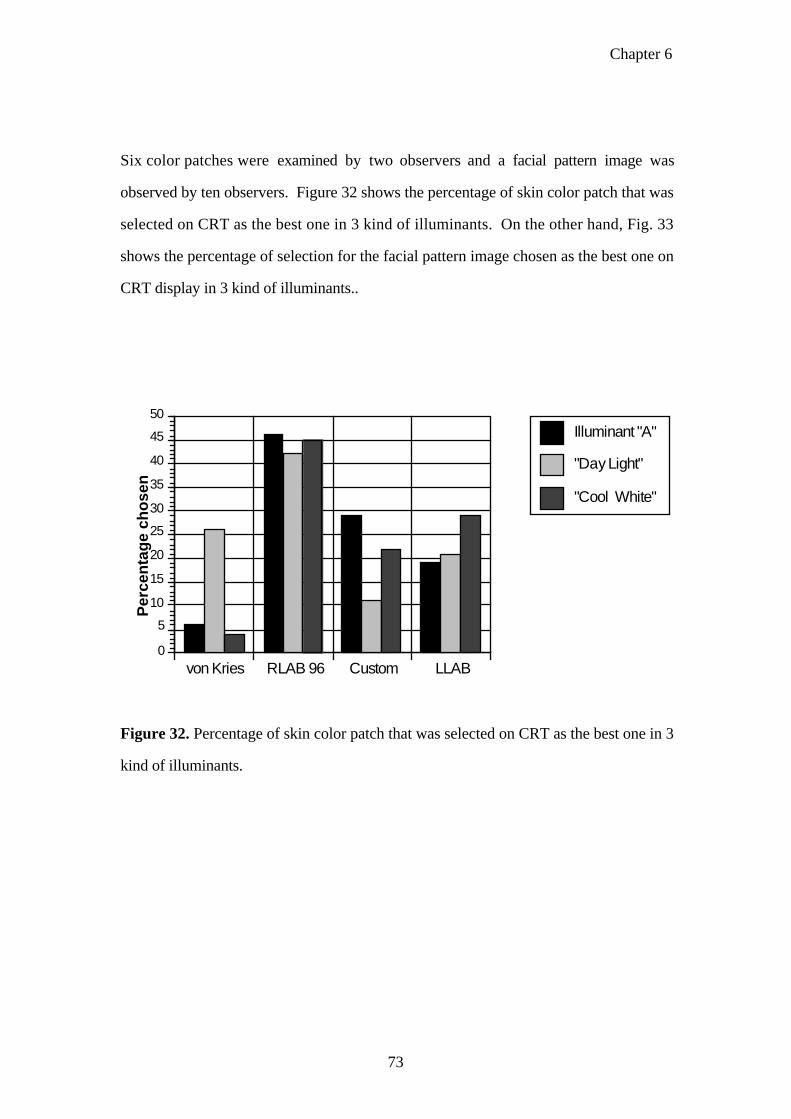
Chapter 6
73
Six color patches were examined by two observers and a facial pattern image was
observed by ten observers. Figure 32 shows the percentage of skin color patch that was
selected on CRT as the best one in 3 kind of illuminants. On the other hand, Fig. 33
shows the percentage of selection for the facial pattern image chosen as the best one on
CRT display in 3 kind of illuminants..
von Kries RLAB 96 Custom LLAB0
5
10
15
20
25
30
35
40
45
50Illuminant "A"
"Day Light"
"Cool White"
Per
cen
tag
e ch
ose
n
Figure 32. Percentage of skin color patch that was selected on CRT as the best one in 3
kind of illuminants.

Chapter 6
74
von Kries RLAB 96 Custom LLAB0
5
10
15
20
25
30
35
40
Illuminant "A"
"Day Light"
"Cool White"
Per
cen
tag
e ch
ose
n
Figure 33. Percentage of selection for reproduced facial pattern image chosen as the
best one on CRT display in 3 kind of illuminants.
From Fig. 32, it is clear that the color appearance of patch by RLAB 96 model
was chosen as the best one. In this case the modified Fairchild model did not perform
well as RLAB 96 model because the coefficients of color balance were adjusted for
facial pattern image and not for skin color patches. From Fig. 33 it is possible to see
that LLAB model performed well for illuminant “A” but it could not predict well other
illuminants used in the experiment. On the other hand, von Kries model performed well
for “Day Light“ and “Cool White” but it presented poor results for illuminant “A”.
RLAB 96 model performed relatively well, however the modified Fairchild model
(Custom model) presented the overall best result under all kind of illuminants.
The result was also analyzed statistically. Figures 34(a), (b), and (c) show the
averaged interval scale values for each reproduced facial pattern image under various
illuminants.

Chapter 6
75
Figure 34(a). Averaged interval scale of model performance for illuminant “A”.
Figure 34(b). Averaged interval scale of model performance for “Day Light”.

Chapter 6
76
Figure 34(c). Averaged interval scale of model performance for “Cool White”.
From Figs. 34(a) and (b) it is clear that von Kries and RLAB 96 models are
approximately same in statistical values for facial pattern image reproduction under “A”
and “Day Light” illuminants. From Fig. 34(c) it can be also found that von Kries and
LLAB models are approximately same in statistical values for reproduction under “Cool
white” illuminant. It is also possible to see from Fig. 34(c) that RLAB 96 and Custom
models are approximately same in statistical values for reproduction under “Cool
white” illuminant.
6.5. Conclusion
It was found from the psychophysical experiments that the performance of color
appearance models for facial pattern depends on the illuminant. The modified Fairchild
color appearance model (custom model) performed well for facial pattern images and
showed the best averaged z-scores for all kind of illuminants. We can conclude that the
proposed modified Fairchild model can be performed well to reproduce facial pattern
images.

Chapter 7
77
Chapter 7
COLOR REPRODUCTION OF ENDOSCOPIC IMAGES UNDER
ENVIRONMENTAL ILLUMINATION
7.1 Introduction
In recent years, electronic endoscope has been widely used for diagnosis of various
kinds of diseases. The color of stomach and intestine mucosa gives significant
information for diagnosis of many diseases such as gastritis, cancer and so on.
Sometimes the physician needs to ask another specialist for the diagnosis. The process
of sending and receiving images from one hospital to another has been possible with the
advance of telecommunication systems. However, in these systems the viewing
conditions and devices vary case-by-case. Then, it is necessary to consider the influence
of the environmental conditions on the appearance of reproduced image. The
endoscopic images are generally viewed by physician in dark environment of an
operation room. However, when the images are viewed in another room, such as
meeting room, it is necessary to consider the influence of environmental illuminant on
the appearance of endoscopic images. It is necessary to do gamut-mapping for image
which cannot be reproduced in the gamut of CRT. However, there is not any way to
quantify how gamut-mapping affects the perceived color appearance.
In this chapter, a perceptual color difference is defined to evaluate gamut-
mapping for endoscopic image reproduced on CRT under environmental illumination
instead of the traditional color difference. The perceptual color difference is defined by
Mahalanobis distance which is calculated using the covariance matrix of metric
lightness, chroma and hue angle.

Chapter 7
78
7.2 Color reproduction method for endoscopic images under environmental
illumination
Figure 35 shows a schematic diagram of a color reproduction method to reproduce the
appearance of endoscopic images on CRT under various illuminants.
RGBCRT 1
ChromaticAdaptation
CRT 2
CRTCalibration
Gamut- mapping
O(λ)
E(λ)
Substractionof reflectedlight on CRT
I l luminant CRT1 White point CRT2 White pointÅ@ Illuminant
White point
Adaptationto CRT andilluminant
X'Y'Z'
L'C'h
R'G'B'
XYZ
X"Y"Z" XLYLZL
LCh
Figure 35. Diagram of color reproduction method to reproduce the appearance of
endoscopic images on CRT under various illuminants.

Chapter 7
79
In Fig. 35, the R, G, B original endoscopic image is transformed to X, Y, Z using the
characteristics of the CRT in the dark environment. The color appearance is calculated
from X, Y, Z values and represented in CIELUV L*, C*, and h values. The gamut-
mapping was performed to adjust the L*, C*, h values on CRT 1 to the L*’, C*’, h’
values on CRT 2 under various illuminants. The inverse chromatic adaptation is
performed to get X’, Y’, Z’. The XL YL, ZL tristimulus values of the reflected light on
CRT surface are subtracted from X’, Y’, Z’ to give X”, Y”, Z” tristimulus values of
emitted light on CRT surface. Finally, the X”, Y”, Z” was transformed to the device
dependent R,’ G ’, B’ that are displayed on CRT. XL, YL, ZL can be calculated from the
spectral reflectance of the CRT surface ρ(λ) using the following equations;
XL = K E(λ )ρ(λ)400
700
∫ x (λ)dλ , (7-1a)
YL = K E(λ )ρ(λ)400
700
∫ y (λ)dλ , (7-1b)
ZL = K E(λ )ρ(λ)400
700
∫ z (λ)dλ , (7-1c)
K =100/ E(λ )400
700
∫ y (λ)dλ , (7-1d)
where E(λ) is the spectral radiance of the illuminant.
The measurement of spectral reflectance ρ(λ) of the CRT depends on the
viewing angle, so it was assumed that the endoscopic images are displayed on the center
of the CRT and the observer watched the images in a fixed position in front of the CRT.
The spectral reflectance ρ (λ) of the CRT was obtained dividing the amount of radiant
power reflected on CRT by the amount of radiant power reflected on the white perfect
diffuser. The amounts of radiant power of three illuminants (“A”, “Cool white” and
“Day Light” whose relative spectral radiances are given in Fig. 11) were measured on a

Chapter 7
80
white diffuser with reflectance of approximately 90%. Eventual scattering of light inside
the CRT was ignored. The spectral reflectance was calculated for three kinds of
illuminants to examine the illuminant dependence of the spectral reflectance as shown in
Figs. 36(a), (b) and (c), respectively under “A”, “Cool white” and “Day Light.” As
expected, the spectral reflectance has approximately the same shape for these three kinds
of illuminants.
0
2
4
6
8
12
14
16
18
20
400 450 500 550 600 650 700
Wavelength (nm)
10
Spe
ctra
l ref
lect
ance
(%
)
Figure 36(a). Spectral reflectance of CRT without radiation from CRT under illuminant
“A”.
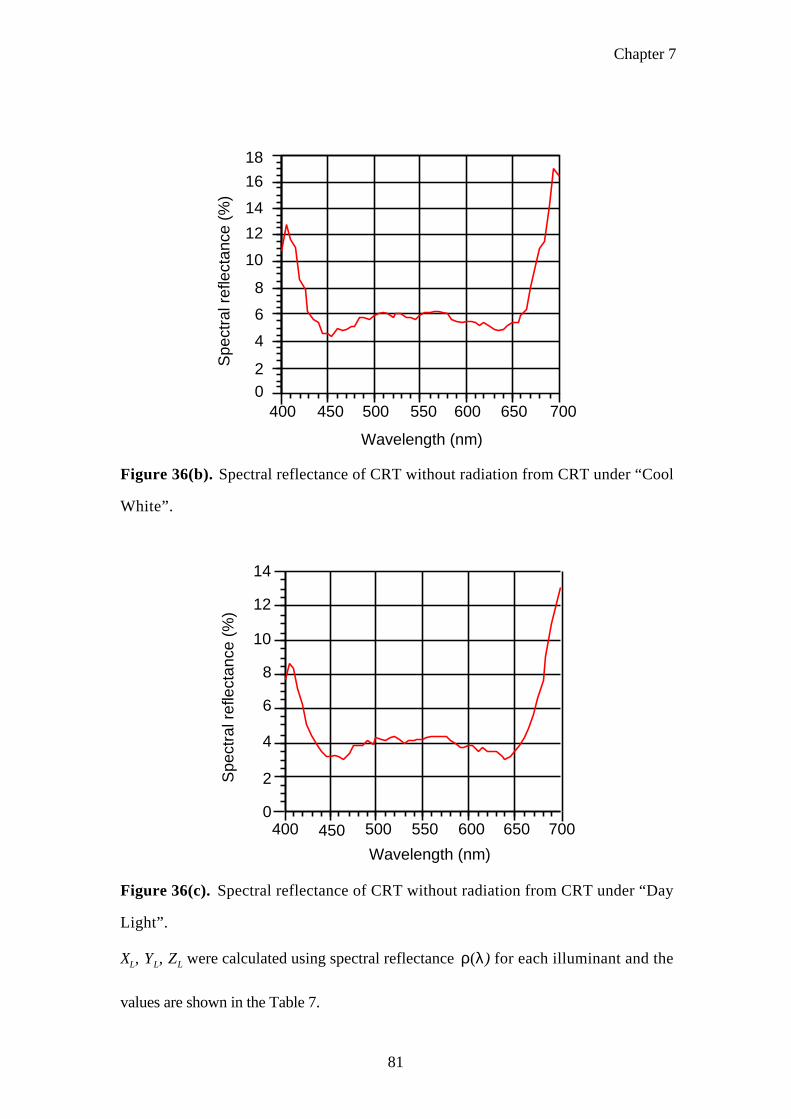
Chapter 7
81
02
4
6
8
10
12
14
16
18
400 450 500 550 600 650 700
Wavelength (nm)
Spe
ctra
l ref
lect
ance
(%
)
Figure 36(b). Spectral reflectance of CRT without radiation from CRT under “Cool
White”.
0
2
4
6
8
10
12
14
400 450 500 550 600 650 700
Wavelength (nm)
Spe
ctra
l ref
lect
ance
(%
)
Figure 36(c). Spectral reflectance of CRT without radiation from CRT under “Day
Light”.
XL, YL, ZL were calculated using spectral reflectance ρ(λ) for each illuminant and the
values are shown in the Table 7.
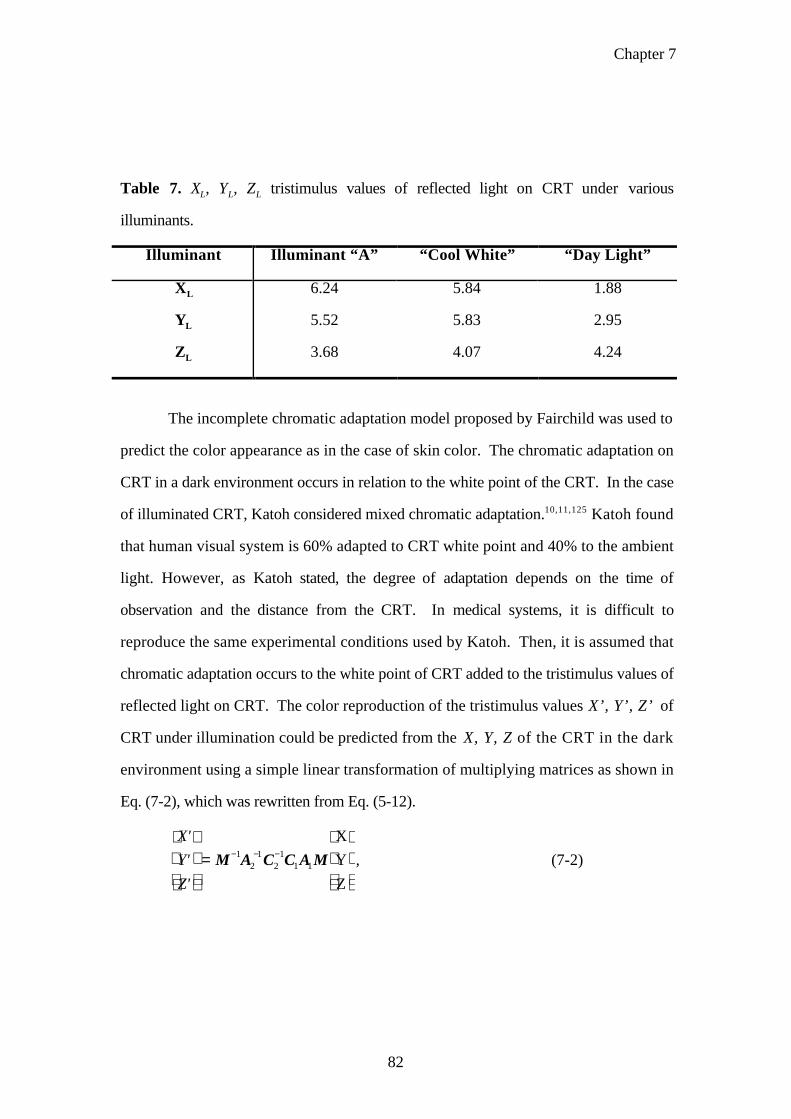
Chapter 7
82
Table 7. XL, YL, ZL tristimulus values of reflected light on CRT under various
illuminants.
Illuminant Illuminant “A” “Cool White” “Day Light”
XL 6.24 5.84 1.88
YL 5.52 5.83 2.95
ZL 3.68 4.07 4.24
The incomplete chromatic adaptation model proposed by Fairchild was used to
predict the color appearance as in the case of skin color. The chromatic adaptation on
CRT in a dark environment occurs in relation to the white point of the CRT. In the case
of illuminated CRT, Katoh considered mixed chromatic adaptation.10,11,125 Katoh found
that human visual system is 60% adapted to CRT white point and 40% to the ambient
light. However, as Katoh stated, the degree of adaptation depends on the time of
observation and the distance from the CRT. In medical systems, it is difficult to
reproduce the same experimental conditions used by Katoh. Then, it is assumed that
chromatic adaptation occurs to the white point of CRT added to the tristimulus values of
reflected light on CRT. The color reproduction of the tristimulus values X’, Y’, Z’ of
CRT under illumination could be predicted from the X, Y, Z of the CRT in the dark
environment using a simple linear transformation of multiplying matrices as shown in
Eq. (7-2), which was rewritten from Eq. (5-12).
X'
Y'
Z'
= M−1A2−1C2
−1C1A1M
X
Y
Z
, (7-2)

Chapter 7
83
7.3 Gamut-mapping of endoscopic image
7.3.1 Gamut-mapping in 1976 CIELUV L*C*h color space
The objective of gamut-mapping is to find a way to display the processed colors that are
out of color gamut in CRT. The gamut-mapping should ensure that the appearance of
the reproduction is as close to the original as possible.73 This appearance fidelity of the
reproduced image to the original is very important in remote diagnosis for endoscopic
images, because diagnosis of physicians is mainly based on the appearance of color.
The Luv*, Cuv*, huv metric lightness, chroma, and hue angle respectively were
used for gamut-mapping because these color attributes have a psychophysical meaning.
The relationship between the tristimulus values and the L*, u*, v* are given by Eq. (7-3)
and the relationship between L*, u*, v* and Luv*, Cuv*, huv is shown in Fig. 37.
L* = 116Y
Yn
1
3
−16 forY
Yn
> 0.008856 , (7-3a)
L* = 903.3Y
Yn
forY
Yn
≤ 0.008856 , (7-3b)
Cuv* = (u*)2 + (v* )2 , (7-3c)
huv = tan−1 u*
v*
, (7-3d)
where
u* = 13L* (u' −un' ) , (7-3e)
v* = 13L*(v' −vn ' ) , (7-3f)
u' =4X
X +15Y + 3Z, (7-3g)
un' =4 Xn
Xn + 15Yn + 3Zn
, (7-3h)
v' =9Y
X +15Y + 3Z, (7-3i)

Chapter 7
84
vn' =9Yn
Xn + 15Yn + 3Zn
, (7-3j)
C*
h0 v *
u*
v *
u*
h = 0o
h = 90o
h = 180o
h = 270o
L*Yellow
Green
Blue Red
Figure 37. Relationship between L*u*v* and L*C*h color spaces.
7.3.2 Perceptual Mahalanobis distance
The gamut-mapping algorithms are evaluated using psychophysical techniques,
as performed by Katoh126,127 considering differences in metric lightness (∆L), chroma
(∆C ), and hue angle (∆h). However, the weighted color difference ∆E which was
proposed by Katoh, as shown in Eq. (7-4), does not consider the correlation between the
lightness, chroma and hue angle.
∆E =∆L*
Kl
2
+∆Cab
*
Kc
2
+∆Hab
∗
Kh
2
12
, (7-4)
where ∆L* , ∆Cab* , ∆Hab
* are differences in lightness, chroma, and hue respectively. Kl ,
KC , Kh are mapping coefficients for each attribute of color.
Chapter 7
85
The CIE 1994 total color-difference128 shown in Eq. (7-5) uses correlation
between hue and chroma in the estimation of weighting functions. However, it does not
consider the correlations between lightness and hue, lightness and chroma.
∆E94* =
∆L*
kL SL
2
+∆Cab
*
kCSC
2
+∆Hab
*
kHSH
2
12
(7-5)
where kL , kC , kH are parametric factors, SL , SC , SH are weighting functions. SL =1;
SC =1+0.045Cab* ; SH =1+0.015Cab
* are currently recommended by CIE.
A perceptual color distance based on Mahalanobis distance is defined using
covariance matrix of perceptually equivalent metric lightness, chroma and hue angle of
endoscopic images. The Mahalanobis distance129 makes uniform the influence of the
distribution of each attribute and is defined as follows;
d = ∆L ∆C ∆h[ ]VLL VLC VLh
VCL VCC VCh
VhL VhC Vhh
−1∆L
∆C
∆h
1
2
, (7-6)
where VLL, VCC , Vhh are the variances of metric lightness, chroma, hue angle, respectively.
On the other hand, VLC(VCL ), VLh (VhL ), VCh (VhC ) are the covariances between metric
lightness and chroma, lightness and hue angle, and chroma and hue angle, respectively.
This perceptual distance can be used to evaluate gamut-mapping. The gamut-mapping
that provides the shortest perceptual Mahalanobis distance is considered as the best
reproduction.
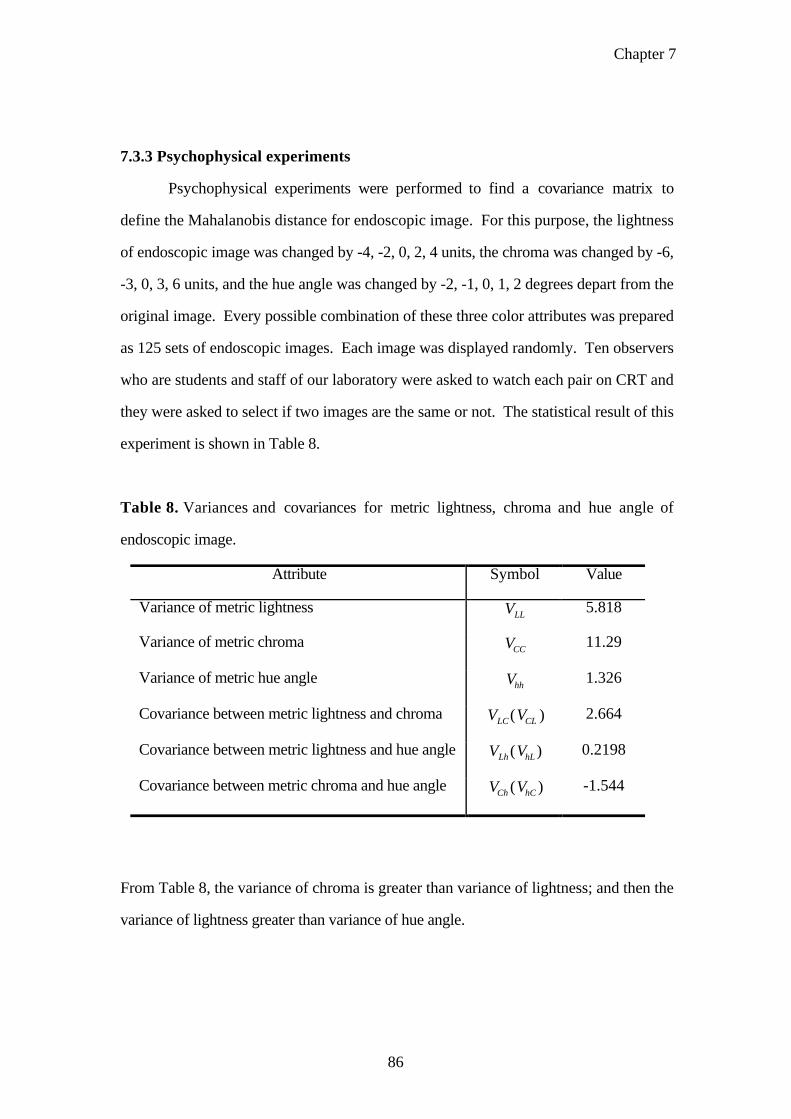
Chapter 7
86
7.3.3 Psychophysical experiments
Psychophysical experiments were performed to find a covariance matrix to
define the Mahalanobis distance for endoscopic image. For this purpose, the lightness
of endoscopic image was changed by -4, -2, 0, 2, 4 units, the chroma was changed by -6,
-3, 0, 3, 6 units, and the hue angle was changed by -2, -1, 0, 1, 2 degrees depart from the
original image. Every possible combination of these three color attributes was prepared
as 125 sets of endoscopic images. Each image was displayed randomly. Ten observers
who are students and staff of our laboratory were asked to watch each pair on CRT and
they were asked to select if two images are the same or not. The statistical result of this
experiment is shown in Table 8.
Table 8. Variances and covariances for metric lightness, chroma and hue angle of
endoscopic image.
Attribute Symbol Value
Variance of metric lightness VLL5.818
Variance of metric chroma VCC11.29
Variance of metric hue angle Vhh1.326
Covariance between metric lightness and chroma VLC(VCL ) 2.664
Covariance between metric lightness and hue angle VLh (VhL ) 0.2198
Covariance between metric chroma and hue angle VCh (VhC ) -1.544
From Table 8, the variance of chroma is greater than variance of lightness; and then the
variance of lightness greater than variance of hue angle.

Chapter 7
87
The perceptual Mahalanobis distance can be calculated by Eq. (7-7),
d = ∆L ∆C ∆h[ ]0.2047 −0.0630 −0.1071
−0.0630 0.1247 0.1556
−0.1071 0.1556 0.9530
∆L
∆C
∆h
1
2
. (7-7)
The presence of negative non-diagonal terms in the matrix of Eq. (7-7) is corresponding
to the correlation of lightness and chroma, and lightness and hue angle, and it suggests
to decrease the perceptual color distance when ∆Γ × ∆Θ > 0 , where Γ and Θ are L, C,
h. On the other way, the positive non-diagonal terms are corresponding to the
correlation between metric chroma and hue angle and it indicates to decrease the
perceptual color distance when ∆Γ × ∆Θ < 0 .
Hara and coworkers carried out psychophysical experiment,130,131 with
collaboration of five physicians. They changed the metric lightness, chroma and hue
angle in order to reproduce a preferred endoscopic image on CRT. In this experiment,
they only examined variance of metric lightness, chroma, hue angle and covariance
between metric chroma and hue angle as shown in Table 9. Unfortunately, it is not
possible to calculate the perceptual Mahalanobis distance using the result of Hara’s
experiment.

Chapter 7
88
Table 9. Result of psychophysical experiments performed by Hara with the
collaboration of physicians.
Statistical value of color attribute Symbol Value
Variance of metric lightness VLL23.56
Variance of metric chroma VCC34.08
Variance of metric hue angle Vhh7.44
Covariance between metric chroma and hue angle VCh VhC( ) -8.97
However, they found that the variance of metric chroma was greater than that of
lightness, the variance of lightness was greater than that of hue angle, and covariance
between chroma and hue angle have a negative value like the results of the
pshychophysical experiments shown in Table 8.
7.4 Analysis of gamut-mapping for endoscopic images
Scaling and translation of metric hue angle, chroma and lightness were done for
gamut-mapping as shown in Eq. (7-8);
h' = h + α , (7-8 a)
C'= βC + γ , (7-8 b)
L' =φ L + ε , (7-8 c)
where h, C, L are the hue angle, chroma and lightness respectively before the mapping,
the h’, C’, L’ are the mapped hue angle, chroma and lightness respectively, and α , γ, β,
ε and φ are coefficients of hue angle, chroma translation, chroma scaling, lightness
translation , and chroma scaling, respectively. Only one coefficient was used for hue
angle since both scaling and translation of hue angle produces rotation of mapped points
around lightness axis. The parameters were varied in intervals as described in Table 10.

Chapter 7
89
Table 10. Variation of coefficients φ, ε, β, γ andα in the Eqs. (7-10).
Coefficient Initial value Final value Interval unit
φ 0.95 1.00 0.05
ε -3 3 1
β 1.0 1.0 0
γ -10 10 1
α -1 1 1
A stomach endoscopic image was reproduced from a CRT (Nanao FlexScan
56T) in a dark environment (corresponding to CRT 1 in Fig. 35) to a CRT (AppleColor
High-Resolution RGB Model MO401) under illuminant “A” (CRT 2 in Fig. 35). The
characteristics of CRT were described in Chapter 3. Figure 38 shows the endoscopic
image to be displayed on a CRT in a dark environment.
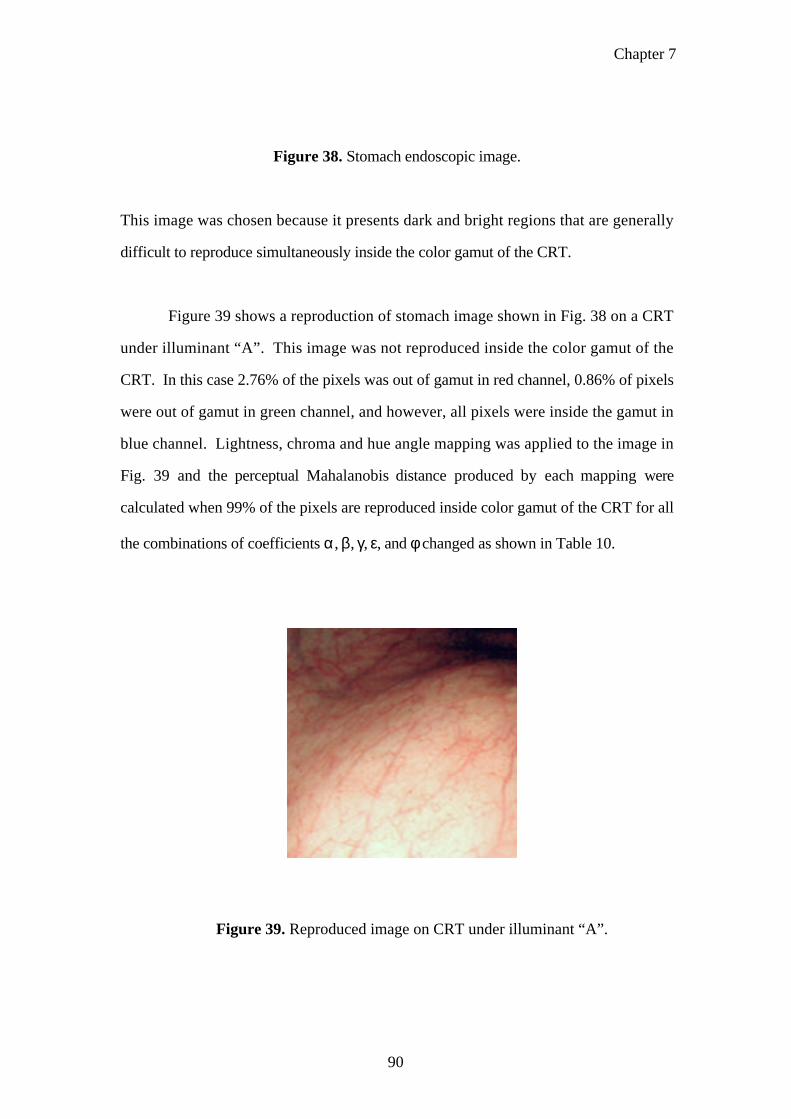
Chapter 7
90
Figure 38. Stomach endoscopic image.
This image was chosen because it presents dark and bright regions that are generally
difficult to reproduce simultaneously inside the color gamut of the CRT.
Figure 39 shows a reproduction of stomach image shown in Fig. 38 on a CRT
under illuminant “A”. This image was not reproduced inside the color gamut of the
CRT. In this case 2.76% of the pixels was out of gamut in red channel, 0.86% of pixels
were out of gamut in green channel, and however, all pixels were inside the gamut in
blue channel. Lightness, chroma and hue angle mapping was applied to the image in
Fig. 39 and the perceptual Mahalanobis distance produced by each mapping were
calculated when 99% of the pixels are reproduced inside color gamut of the CRT for all
the combinations of coefficients α, β, γ, ε, and φ changed as shown in Table 10.
Figure 39. Reproduced image on CRT under illuminant “A”.

Chapter 7
91
The minimum averaged perceptual Mahalanobis distance was 1.357 for φ=0.95, ε=3,
β=1.0, γ=1 and α=0, coefficients of Eq. (7-8). The Eq. (7-8) can be rewritten as
follows;
h' = h , (7-9 a)
C' = C +1 , (7-9 b)
L' = 0.95L + 3, (7-9 c)
The image was reproduce inside the color gamut of the CRT for 99.17% in red channel,
99.99% in the green channel, and 100.00% in the blue channel. The reproduced
endoscopic image for these coefficients is shown in Fig. 40.
Figure 40. Reproduced stomach endoscopic image under illuminant “A”, for φ=0.95,
ε=3, β=1.0, γ=1 and α=0 of Eq. (7-8).

Chapter 7
92
This result shows that it is better to adjust metric lightness and chroma
simultaneously and maintain the hue angle unchanged to minimize changes in the color
appearance. The hue angle is the appearance attribute that can be distinguished with the
highest precision and the psychophysical experiments showed that human visual system
is very sensitive for changes in hue.
7.5 Conclusion
A method to reproduce endoscopic images on illuminated CRT was proposed. This
color reproduction method uses color appearance models and gamut-mapping. Gamut-
mapping was performed in 1976 CIELUV L*C*h color space by scaling and
translation of the color attributes. A perceptual Mahalanobis distance was defined to
evaluate the proposed gamut-mapping techniques. This perceptual distance is calculated
using covariance matrix of perceptually equivalent metric lightness, chroma and hue
angle and indicates how the color appearance of reproduced endoscopic image is
affected by gamut-mapping. Experiments using this perceptual color distance showed
that a mapping that minimizes changes in color appearance was obtained for φ=0.95,
ε=3, β=1.0, γ=1 and α=0, coefficients of Eq. (7-8). Therefore, it is better to map
lightness and chroma simultaneously and maintain hue angle unchanged.

Chapter 8
93
CHAPTER 8
CONCLUSION
Many aspects and problems involving color reproduction of original scene under
various illuminants have been studied, specially for skin color and endoscopic images.
At first, spectral reflectance of facial pattern images taken by HDTV camera was
estimated using three principal components of skin spectral reflectance. Computer
simulation of colorimetric color reproduction was done using those obtained spectral
reflectance. The predicted images were reproduced colorimetrically on CRT and
hardcopy. Color appearance models were also introduced into colorimetric color
reproduction method to predict the color appearance of skin colors under various
illuminants on CRT. Computer simulations of Fairchild, von Kries and LAB
chromatic adaptation models were compared with the color hardcopies by
psychophysical experiments using memory matching technique. These experiments
showed that the incomplete chromatic adaptation model proposed by Fairchild can be
used for a suitable prediction for color appearance of skin color patches. However,
Fairchild model was not so effective for facial pattern images as skin color patches.
Coefficients of Fairchild model were adjusted to reproduce facial pattern images by
psychophysical experiments. The modified Fairchild model showed the best overall
performance compared to the other color appearance models under various
illuminants.
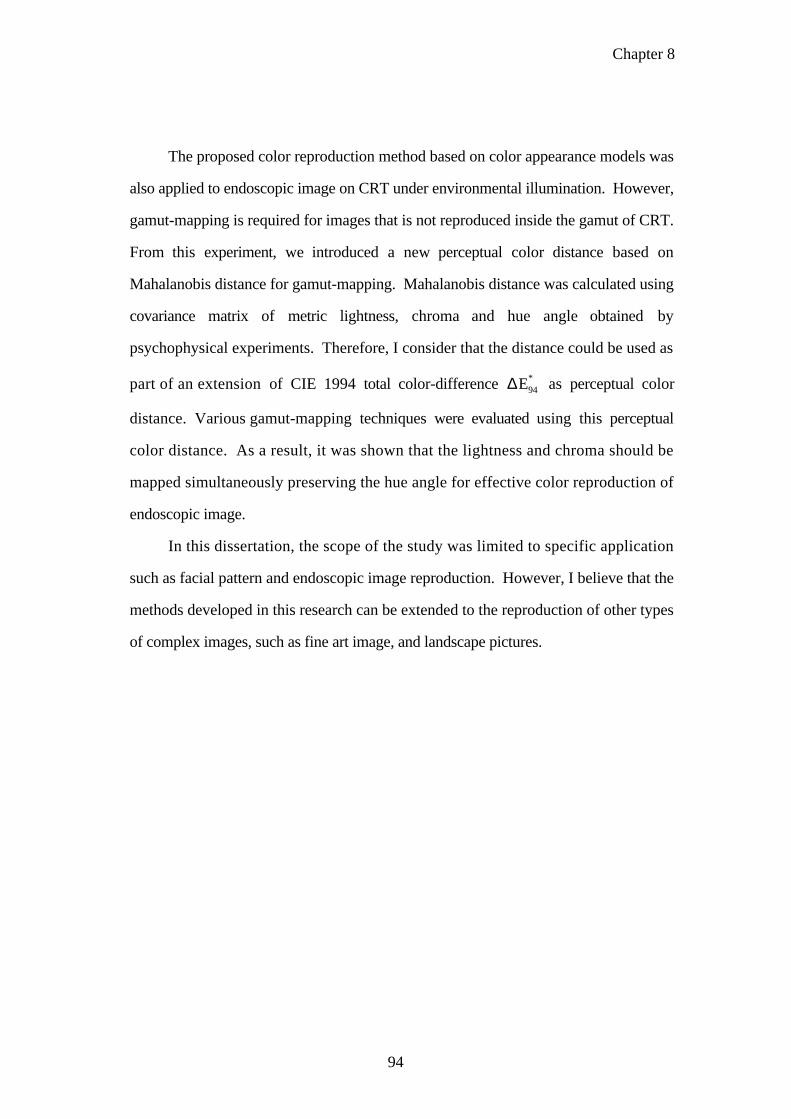
Chapter 8
94
The proposed color reproduction method based on color appearance models was
also applied to endoscopic image on CRT under environmental illumination. However,
gamut-mapping is required for images that is not reproduced inside the gamut of CRT.
From this experiment, we introduced a new perceptual color distance based on
Mahalanobis distance for gamut-mapping. Mahalanobis distance was calculated using
covariance matrix of metric lightness, chroma and hue angle obtained by
psychophysical experiments. Therefore, I consider that the distance could be used as
part of an extension of CIE 1994 total color-difference ∆E94* as perceptual color
distance. Various gamut-mapping techniques were evaluated using this perceptual
color distance. As a result, it was shown that the lightness and chroma should be
mapped simultaneously preserving the hue angle for effective color reproduction of
endoscopic image.
In this dissertation, the scope of the study was limited to specific application
such as facial pattern and endoscopic image reproduction. However, I believe that the
methods developed in this research can be extended to the reproduction of other types
of complex images, such as fine art image, and landscape pictures.

References
95
REFERENCES
(1) Nassau, K., “The fifteen causes of color: the physics and chemistry of color,”
Color Res. Appl. 12, 4-26 (1987).
(2) Gouras, P., The Perception of colour, MacMillan Press, London, 1991.
(3)Hunt, R. W. G., “Chromatic adaptation in image reproduction,” Color Res. Appl. 7,
46-49 (1982).
(4)Hunt, R. W. G., “A model of colour vision for predicting colour appearance,” Color
Res. Appl. 7, 95-118 (1982).
(5) Robertson A. R., “The future of color science,” Color Res. Appl. 7, 16-18 (1982).
(6) Haneishi, H., Miyata, K., Yaguchi, H., and Miyake, Y., “A new method for color
correction in hardcopy from CRT images,” Journal of Imaging Science and
Technology 37, 30-36 (1993).
(7) Fairchild, M. D., Lester, A. A., and Berns, R. S., “Accurate Color Reproduction of
CRT-Displayed image as projected 35 mm slides,” Journal of Electronic Imaging 5,
87-96, (1993).
(8) Wandell, B. A., “The synthesis and analysis of color images,” IEEE Transactions
on Pattern Analysis and Machine Intelligence, PAMI-9, 2-13 (1987).
(9) Choi, K. F., “Comparison of Color difference perception on soft-display versus
hardcopy,” Proc. of IS&T/SID’s 2nd Color Imaging Conference: Color Science,
Systems and Applications, 18-21, (1994).
(10) Katoh, N., “Appearance match between soft copy and hard copy under mixed
chromatic adaptation,” Proc. of the IS&T/SID Color imaging conference: Color
science, systems and applications, 22-25, (1995).
(11) Katoh, N., “Appearance match between soft copy and hard copy (III),” Proc. of
Color Forum Japan ‘95, 33-36, (1995) (in Japanese).
References
96
(12) Tonnquist, G., “25 years of color with the AIC - and 25,000 without,” Color Res.
Appl. 18, 353-365 (1993).
(13) Maxwell J. C., “On the theory of compound colours, and the relations of the
colours of the spectrum,” (first published in Philosophical Transactions in 1860),
Color Res. Appl. 18, 270-287 (1993).
(14) Helmholtz, H. von, Handbuk der physiologischen Optik, 2nd ed., Voss, Hamburg
& Leipzig, 1896.
(15) Hering, E., Outlines of a theory of the light sense [English translation, L. M.
Hurvich and D. Jameson (Harvard U. Press, Cambridge, Mass., 1964)].
(16) Munsell, A. H., A color notation, Munsell Color Co., Boston, 1905.
(17) Schrödinger, E., “On the relationship of four-color theory to three-color theory,”
(translation by National translation center, commentary by Qasim Zaidi), Color Res.
Appl. 19, 37-47 (1994).
(18) Judd, D. B., “Hue saturation and lightness of surface colors with chromatic
illumination,” J. Opt. Soc. Am. 27, 2-32 (1940).
(19) Wright, W. D., Researches on normal and defective colour vision , Kimpton,
London, 1946.
(20) Wyszecki, G., and Stiles, W. S., Color science: Concepts and Methods,
Quantitative Data and Formulae, 2nd Edition, Wiley Sons, New York, 1982.
(21) MacAdam, D. L., Color measurement. Theme and Variations, Springer-Verlag,
Berlin & Heidelberg, 1981.
(22) Richter, M., “The development of color metrics,” Color Res. and Application 9,
69-83 (1984).
(23) Hunter, R. S., The measurement of appearance, Wiley, New York, 1975.
(24) Hunt, R. W. G., The reproduction of colour, Fountain Press, Kingston-upon-
Thames, 226, 1995.
References
97
(25) Helson, H., Judd, D. B., Warren, M. H., “Object-color changes from daylight to
incandescent filament illumination,” Illumin. Eng. 47, 221-233 (1952).
(26) Macdonald, L. W., Luo, M. R., Scrivener, S. A. R., “Factor affecting the
appearance of coloured images on a video display monitor,” The Journal of
Photographic Science 38, 177-186 (1990).
(27) Ives, H. E., “The relation between the color of the illuminant and the color of the
illuminated object,” Color Res. Appl. 20, 70-76 (1995).
(28) Hunt, R. W. G., Winter, L. M., “Colour adaptation in picture-viewing situations,”
The Journal of photographic science 23, 112-115 (1975).
(29) Werner, J. S., Walraven J., “Effect of chromatic adaptation on the achromatic
locus: the role of contrast, luminance and background color,” Vis. Research 22, 929-
943 (1982).
(30) Jacobson, A. R., “The effect of background luminance on color recognition”,
Color Res. Appl. 11, 263-269 (1986).
(31) Fairchild, M. D., “Considering the surround in device-independent color
imaging,” Color Res. Appl. 20, 352-363 (1995).
(32) Mihashi, T., Okajima, K., “An effect of surround condition in cross-media color
reproduction,” Proc. of Color Forum Japan’ 96, 25-28 (1996) (in Japanese).
(33) Blackwell, K. T., Buchsbaum, G., “The effect of spatial and chromatic parameters
on chromatic induction,” Color Res. Appl. 13, 166-173 (1988).
(34) MacAdam, D. L., “Chromatic adaptation,” J. Opt. Soc. Am. 46, 500-513 (1956).
(35) Loomis, J. M., Berger, T., “Effects of chromatic adaptation on color discrimination
and color appearance,” Vis. Research 19, 891-901 (1979).
(36) Bartleson, C. J., “On chromatic adaptation and persistence,” Color Res. Appl. 6,
153-160 (1981).

References
98
(37) Wei J., Shevell, S. K., “Color appearance under chromatic adaptation varied along
theoretically significant axes in color space,” J. Opt. Soc. Am. A 12, 36-46 (1995).
(38) Fairchild, M. D., Berns, R. S., “Image color-appearance specification through
extension of CIELAB,” Color Res. Appl. 18, 178-190 (1993).
(39) Bartleson, C. J., “Prediction corresponding colors with changes in adaptation,”
Color Res. Appl. 4, 143-155 (1979).
(40) Indow, T., “Global color metrics and color-appearance systems,” Color Res. Appl.
5, 5-12 (1980).
(41) Billmeyer, Jr., F. W., “Quantifying color appearance visually and instrumentally,”
Color Res. Appl. 13, 140-145 (1988).
(42) Wright, W. D., “Why and how chromatic adaptation has been studied,” Color
Res. Appl. 6, 147-152 (1981).
(43) Beretta, G. B. , Color appearance in computer applications - Some background
information on perceptual color matching, Technical report NTIS PB94-102167,
Canon Information systems, Inc., 1993.
(44) Hunt, R. W. G., “Measures of colour appearance in colour reproduction,” Color
Res. Appl. 4, 39-43 (1979).
(45) Hunt, R. W. G., “Chromatic adaptation in image reproduction,” Color Res. Appl.
7, 46-49 (1982).
(46) Hunt, R. W. G., Measuring Colour, 2nd Edition, Ellis Horwoo, London, 1991.
(47) von Kries, J. A., “Die Gesichtsempfindungen,“ in W. Nagel, Ed., Die Physiologie
der Sinne III, Vieweg, Braunschweig, 109-282, 1904.
(48) von Kries, J. A., “Chromatic adaptation,” in Festschrift der Albrecht-Ludwig-
Universität, Fribourg (1902). [Translation: D. L. MacAdam, Sources of Color
Science, MIT Press, Cambridge, (1970)], 109-119.

References
99
(49) Bartleson, C. J., “Changes in color appearance with variations in chromatic
adaptation,” Color Res. Appl. 4, 119-138 (1979).
(50) Richter, K., “Cube-root color spaces and chromatic adaptation,” Color Res. Appl.
5, 25-43 (1980).
(51) Hunt, R. W. G., “A model of colour vision for predicting colour appearance,”
Color. Res. Appl. 7, 95-118 (1982).
(52) Hunt, R. W. G., “A model of colour vision for predicting colour appearance in
various viewing conditions,” Color. Res. Appl. 12, 297-314 (1987).
(53) Hunt, R. W. G., “Revised colour-appearance model for related and unrelated
colours,” Color Res. Appl. 16, 146-165 (1991).
(54) Hunt, R. W. G., “An improved predictor of colourfulness in a model of colour
vision,” Color Res. Appl. 19, 23-33 (1994).
(55) Takahama, K., Sobagaki, H., Nayatani, Y., “Analysis of chromatic-adaptation effect
by a linkage model,” J. Opt. Soc. Am. 67, 651-656 (1977).
(56) Nayatani, Y., Takahama, K., and Sobagaki, H., “Formulation of a Nonlinear Model
of Chromatic Adaptation,” Color Res. Appl. 6, 161-171 (1981).
(57) Nayatani, Y., Takahama, K., Sobagaki, H., and Hirono, J., “On exponents of a
nonlinear model of chromatic adaptation,” Color Res. Appl. 7, 34-45 (1982).
(58) Takahama, K., Sobagaki, H., and Nayatani, Y., “Formulation of a nonlinear model
of chromatic adaptation for a light-gray background,” Color Res. Appl. 9, 106-115
(1984).
(59) Nayatani, Y., Takahama, K., and Sobagaki, H., “Prediction of color appearance
under various adapting conditions,” Color Res. Appl. 11, 62-71 (1986).
(60) Nayatani, Y., Hashimoto, K., Takahama, K., and Sobagaki, H., “Whiteness-
blackness and brightness response in a nonlinear color appearance model,” Color
Res. Appl. 12, 121-127 (1987).

References
100
(61) Nayatani, Y., Hashimoto, K., Takahama, K., and Sobagaki, H., “A nonlinear color-
appearance model using Estévez-Hunt-Pointer primaries,” Color Res. Appl. 12, 231-
242 (1987).
(62) Nayatani, Y., Takahama, K., Sobagaki, H., and Hashimoto, K., “Color-appearance
model and chromatic-adaptation transform,” Color Res. and Appl. 15, 210-221
(1990).
(63) Nayatani, Y., “Revision of the chroma and hue scales of a nonlinear color-
appearance model,” Color Res. Appl. 20, 143-155 (1995).
(64) Nayatani, Y., Sobagaki, H., Hashimoto K., and Yano, T., “Lightness dependency of
chroma scales of a nonlinear color-appearance model and its latest formulation,”
Color Res. Appl. 20, 156-167 (1995).
(65) Fairchild, M. D., “Formulation and testing of an incomplete-chromatic-adaptation
model,” Color Res. Appl. 16 243-250 (1991).
(66) Fairchild, M. D., “A model of incomplete chromatic adaptation,” Proc. of CIE
22nd Session, 33-34, (1991).
(67) Luo, M. R., Clarke, A. A., Rhodes, P. A., Schapppo, A., Scrivener, S. A. R. , Tait, C.
J., “Quantifying colour appearance. Part I. LUTCHI Colour appearance data,” Color
Res. Appl. 16 166-180, (1991).
(68) Luo, M. R., Clarke, A. A., Rhodes, P. A., Schapppo, A., Scrivener, S. A. R. , Tait,
C. J., “Quantifying colour appearance. Part II. Testing colour models performance
using LUTCHI colour appearance data,” Color Res. Appl. 16, 181-197 (1991).
(69) Luo, M. R., Gao, X. W., Rhodes, P. A., Xin, H. J. , Clarke, A. A., Scrivener, S. A.
R., “Quantifying colour appearance. Part III. Supplementary LUTCHI colour
appearance data,” Color Res. Appl. 16, 98-113 (1993).
(70) Colorimetry, 2nd ed., CIE Publication No. 15.2, Central Bureau of the CIE, Vienna,
1986.

References
101
(71) Fairchild, M. D., “Visual Evaluation and evolution of the RLAB color space,”
Proc. of IS&T and SID’s 2nd Color Imaging Conference: Color Science, Systems
and Applications, 9-12, (1994).
(72) Fairchild, M. D., “Refinement of the RLAB color space, Color Res. Appl. 21, 338-
346 (1996).
(73) Luo, M. R., “Two unsolved issues in colour management color appearance and
gamut mapping,” Proc. of World Techno Fair in Chiba ‘96: Imaging science and
technology, evolution and promise, 136-147, (1996).
(74) Luo, M. R., Lo, M., Kuo, W., “The LLAB(I:c) colour model,” Color Res. Appl.
21, 412-429 (1996).
(75) Guth, S. L., “Model for color vision and light adaptation,” J. Opt. Soc. Am. A 8,
976-993 (1991).
(76) Guth, S. L., “Further applications of the ATD model for color vision,” Proc. of
SPIE Vol. 2414, 12-26, (1994).
(77) Guth, S. L., “ATD model for color vision I: background,” Proc. of SPIE Vol.
2170, 149-162, (1995).
(78) McCann, J. J., McKee, S. P., Taylor, T. H., “Quantitative studies in Retinex
theory,” Vis. Research 15, 445-458 (1976).
(79) Land, E., “The Retinex theory of color vision,” Scientific American 237, 108-128
(1977).
(80) Land, E. H., McCann, J. J., “Lightness and Retinex theory,” J. Opt. Soc. Am. 61,
1-11 (1977).
(81) McCann, J. J., “Color sensations in complex images,” Proc. of IS&T and SID’s
Color Imaging Conference: transforms & transportability of color, 16-23, (1993).

References
102
(82) Kim, T. G., Berns, R. S. , Fairchild, M. D., “Comparing appearance models using
pictorial images,” Proc. of IS&T and SID’s Proc. of Color Imaging Conference:
transforms & transportability of color, 72-77, (1993).
(83) Braun, K. M., Fairchild, M. D., “Evaluation of five color-appearance transforms
across changes in viewing conditions and media,” Proc. of the IS&T/SID 1995 Color
Imaging conference: Color science and applications, 93-96, (1995).
(84) Fairchild, M. D., Reniff, L., “Time course of chromatic adaptation for color-
appearance judgments,” J. Opt. Soc. Am. A 12, 824-833 (1995).
(85) Sato, T., Nakano, Y., Iga, T., Nakauchi, S., Usui, S., “Color reproduction based on
low dimensional spectral reflectances using the principal component analysis,” Proc.
of Color Forum Japan ‘96, 45-48, (1996).
(86) Vhrel, M. J., Gershon, R., Iwan, L. S., “Measurement and analysis of object
reflectance spectra,” Color Res. Appl. 19, 4-9 (1994).
(87) Vhrel, M. J., Trussel, H. J., “Color correction using principal components,” Color
Res. Appl. 17, 328-338 (1992).
(88) Tominaga, S., Wandell, B. A., “Standard surface-reflectance model and illuminant
estimation,” J. Opt. Soc. Am. A 6, 576-584 (1989).
(89) Marimont, D. H., Wandell, B. A., “Linear models of surface and illuminant
spectra,” J. Opt. Soc. Am. A 9, 1905-1913 (1992).
(90) Ojima, N., Haneishi, H., and Miyake, Y., “The Appearance of Skin with Make-up
(III): Estimation for spectral reflectance of skin with the HDTV color image,” J.
SPSTJ, 57, 78-83 (1994) (in Japanese).
(91) Shiobara, T., Zhou, S., Haneishi, H., and Miyake, Y., “Improved Color
Reproduction of Electronic Endoscopes,” Proc. of the IS&T/SID’s 1995 Color
Imaging Conference: Color Science, Systems and Applications, 186-189, (1995).
References
103
(92) Ojima, N., Basic research on the quality analysis of make-up skin, Ph.D. thesis,
Chiba University, 1994 (in Japanese).
(93) Robertson, A. R., “The CIE 1976 color-difference formulae,” Color Res. Appl. 2,
7-11 (1977).
(94) Robertson, A. R., “Historical development of CIE recommended color difference
equations,” Color Res. Appl. 15, 167-170 (1990).
(95) Billmeyer, Jr., F. W., Fairman, H. S., ”CIE method for calculating tristimulus
values,” Color Res. Appl. 12, 27-36 (1987).
(96) Cowan, W. B., “An inexpensive scheme for calibration of a colour monitor in
terms of CIE standard coordinates,” Computer Graphics 17, 315-321 (1983).
(97) Barco, J. L. del, Lee, Jr., “Colorimetric calibration of a video digitizing system:
algorithm and applications,” Color Res. Appl. 13, 180-186 (1988).
(98) Barco, J. L. del, Diaz, J. A., Jimenez, J. R., Rubino, M., “Considerations on the
calibration of color displays assuming constant channel chromaticity,” Color Res.
Appl. 20, 377-387 (1995).
(99) Brainard, D. H., “Calibration of a computer controlled color monitor,” Color Res.
Appl. 14, 23-34 (1989).
(100) Post, D. L., Calhoun, C. S., “An evaluation of methods for producing desired
colors on CRT monitors,” Color Res. Appl. 14, 172-186 (1989).
(101) Rich, D. C. , Alston, D. L. , Allen, L. H. , ”Psychophysical verification of the
accuracy of color and color-difference simulations of surface samples on a CRT
display,” Color Res. Appl. 17, 45-61 (1992).
(102) Berns, R. S., Motta, R. J., Gorzynski, R. J., “CRT Colorimetry. Part I: Theory
and practice,” Color Res. Appl. 18, 299-314 (1993).
(103) Berns, R. S., Motta, R. J., Gorzynski, M. E., “CRT Colorimetry. Part II:
Metrology,” Color Res. Appl. 18, 315-325 (1993).

References
104
(104) Alpern, M., Kitahara, H., Fielder, G. H., “The change in color matches with retinal
angle of incidence of the colorimetric beams,” Vis. Research 27, 1763-1778 (1987).
(105) Balasubramanian, R., “Color transformation for printer color correction,” Proc.
of IS&T and SID’s Color Imaging Conference: Color Science, Systems and
Applications, 62-64, (1994).
(106) Tominaga, S., Iritani, T., “Color specification conversion for CMYK printer,”
Proc. of Color Forum JAPAN’ 96, 13-16, (1996).
(107) Miyata, K., On the color reproduction and evaluation of image quality in
hardcopy, Master Thesis, Chiba University, 1991 (in Japanese).
(108) Stevens, J. C., Stevens, S. S., “Brightness Function: Effects of Adaptation,” J.
Opt. Soc. Am. 53, 375-385 (1963).
(109) Alessi, P. J., “CIE guidelines for coordinated research on evaluation of colour
appearance models for reflection print and self-luminous display image
comparisons,” Color Res. Appl. 19, 48-58 (1994).
(110) Fairchild, M. D., Alvin, R. L., “Precision of color matches and accuracy of color-
matching functions in cross-media color reproduction,” Proc. of the IS&T/SID’s
1995 color Imaging conference: Color science, systems and applications, 18-21,
(1995).
(111) Fairchild, M. D., “Testing colour appearance models: guidelines for coordinated
research,” Color Res. Appl. 20, 262-267 (1995).
(112) Fairchild, M. D., Pirrotta, E., Kim, T., “Successive-Ganzfeld haploscopic viewing
technique for color-appearance research,” Color Res. Appl. 19, 214-221 (1994).
(113) Braun, K., Fairchild, M. D., “Viewing environments for cross-media image
comparisons,” Proc. of IS&T 47th Annual conference/ICPS, 391-396, (1994).
(114) Brewer, W. L., “Fundamental response functions and binocular color matching,”
J. Opt. Soc. Am. 44, 207-212 (1953).
References
105
(115) Newhall, S. M., Burham, R. W., Clark, J. R., “Comparison of successive with
simultaneous color matching,” J. Opt. Soc. Am. 47, 43-56 (1957).
(116) Eastman, A. A., Brecher, G. A., “The subjective measurement of color shifts with
and without chromatic adaptation,” Journal of IES 1, 239-246 (1972).
(117) Braun, K., Fairchild, M. D., “Viewing techniques for cross-media image
comparisons,” Color Res. Appl. 21, 6-17 (1996).
(118) Bolles, R., Mackintosh, I., Hanly, B., “Colour judgment as a function of stimulus
conditions and memory colour,” Canad. J. Psychol. 13, 175-185 (1959).
(119) Breneman, E. J., “Corresponding chromaticities for different states of adaptation
to complex visual fields,” J. Opt. Soc. Am. A 4, 1115-1129 (1987).
(120) Satoh, C., “The appearance of face color as contrasted with object color,” Proc.
of Color Forum Japan ‘96, 53-56, (1996).
(121) Smith V. C., Pokorny J., “Chromatic-discrimination axes, CRT phosphor spectra,
and individual variation in color vision”, J. Opt. Soc. Am. A 12, 27-35 (1995).
(122) Nayatani, Y., Hashimoto, K., Takahama, K., Sobagaki, H., “Physiological causes
of individual variations in color-matching functions,” Color Res. Appl. 13, 298-306
(1988).
(123) Thurstone, L. L., “A law of comparative judgment,” Psych. Rev. 34, 273-286
(1927).
(124) Torgeson, W. S., “The Law of Comparative Judgment,“ Theory and Methods of
Scaling, Chapter 9, Wiley, New York, 1967.
(125) Katoh N., “Practical method for appearance match between soft copy and hard
copy (II),” Advance printing of papers “Workshop ~ Electronic Photography
“94~”, STSPJ, 55-58, (1994) (in Japanese).
(126) Itoh, M., Katoh, N., “Gamut compression for computer graphic images,”
Proceedings of Symposia on Fine Imaging, 85-88, (1995) (in Japanese).

References
106
(127) Katoh, M., Itoh, M., Gamut mapping for computer generated images (II), Proc. of
IS&T and SID Fourth Color Imaging Conference: Color Science, Systems and
Applications, 126-129, (1996).
(128) Schanda, J., “CIE Colorimetry and Colour Displays,” Proc. of IS&T and SID
Fourth Color Imaging Conference: Color Science, Systems and Applications, 230-
234, (1996).
(129) Takagi, M., Shimoda, H., Handbook of image analysis, The Tokyo University,
652-654, 1995 (in Japanese).
(130) Hara, K., Evaluation of preferred color and analysis of mucous with electric
endoscope, Master Thesis, Chiba University, 1992 (in Japanese).
(131) Hara, K., Haneishi, H., Yaguchi, H., Miyake, Y., “On the preferred color
reproduction of electric endoscopic images,” Proc. of 23rd Engineering Image
conference, 119-122, (1992) (in Japanese).

Papers
107
LIST OF PUBLICATIONS AND PRESENTATIONS
RELEVANT TO THE PRESENT THESIS
PAPERS IN JOURNALS
1) Imai, F. H., Tsumura, N., Haneishi, H., Miyake, Y., “Principal component analysis of
skin color and its application to colorimetric color reproduction on CRT display and
hardcopy,” J. Imaging Sci. Technol. 40, 422-430 (1996).
2) Imai, F. H., Tsumura, N., Haneishi, H., Miyake, Y., “Prediction of color reproduction
for skin color under different illuminants based on the color appearance models,” J.
Imaging Sci. Technol 41, 166-173 (1997).
3) Miyake, Y., Imai, F. H. , “Image reproduction in multimedia age,” Kagaku Kougyo 47,
45-51 (1996), (in Japanese).
4) Imai, F. H., Tsumura, N., Haneishi, H., Miyake, Y., “Improvement of Incomplete
Chromatic Adaptation Model for Facial Pattern Images”, ,” J. Imaging Sci. Technol
42, 264-268 (1998).

Papers
108
PAPERS IN CONFERENCES
1) Imai, F. H., Tsumura, N., Haneishi, H., Miyake, Y., “Color reproduction of human skin
based on a color appearance model,” Proc. of Color Forum Japan ‘95, (1995).
2) Koyama, K., Imai, F. H., Tsumura, N., Haneishi, H., Miyake, Y., “Color reproduction
of human skin based on a color appearance model (II),” Proc. of The 43rd Spring
meeting, 1996: The Japan Society of Applied Physics and Related Society, 938, (1996).
3) Imai, F. H., Tsumura, N., Haneishi, H., Miyake, Y., “Principal component analysis of
skin color and its application to portrait color reproduction,” Proc. of World Techno
Fair in Chiba ‘96, Imaging Science and Technology, Evolution and Promise, 254-261,
(1996).
4) Imai, F. H., Tsumura, N., Haneishi, H., Miyake, Y., “Color reproduction of human skin
under different illuminants using color appearance models,” Proc. of SPSTJ
Symposium on Digital Photography ‘96, 35-38, (1996).
5) Imai, F. H., Tsumura, N., Haneishi, H., Miyake, Y., “Color reproduction of human skin
under various illuminants based on chromatic adaptation models,” Proc. of The Korean
Printing Society, Vol. 14. 2, 14-18, (1996).
6) Imai, F. H., Tsumura, N., Haneishi, H., Miyake, Y., “Spectral reflectance of skin color
and its applications to color appearance modeling,” Proc. of IS&T/SID Fourth Color
Imaging Conference, 121-124, (1996).
7) Horiuchi, T., Imai, F. H., Tsumura, N., Haneishi, H., Miyake, Y., “Color reproduction
of human skin based on color appearance model (III) - Customized Incomplete
Adaptation Model,” Proc. of The 44th Spring meeting, 1997: The Japan Society of
Applied Physics and Related Societies, 876 (1997).

Papers
109
8) Saito, T., Imai, F. H., Tsumura, N., Haneishi, H., Miyake, Y., “Color reproduction of
electronic endoscope image under different illuminant (II),” Proc. of The 44th Spring
meeting, 1997: The Japan Society of Applied Physics and Related Societies, 909
(1997).
9) Imai, F. H., Tsumura, N., Haneishi, H., Miyake, Y., “Modified Fairchild’s color
appearance model for facial pattern images under various illuminants,” Proc. of AIC
Color 97 Kyoto, The 8th congress of the International Colour Association, 578 (1997).
10)Tsumura, N., Imai, F.H., Saito, T., Haneishi, H., Miyake, Y., “Color Gamut Mapping
based on Mahalanobis Distance for Color Reproduction of Electronic Endoscope
Image under Different Illuminant”, Proc. of IS&T/SID Fifth Color Imaging
Conference, 158-162 (1997).