colorado agriculture renewable heating & cooling roadmap
TRANSCRIPT

Colorado Agriculture Renewable Heating & Cooling Roadmap
For the Colorado Department of Agriculture December 15, 2013
Leslie Martel Baer, MS MA [email protected]
303.377.5006
Samuel J. Anderson [email protected]
720.336.3351
Becky English [email protected]
303.733.4064

Colorado Department of Agriculture Renewable Heating & Cooling Roadmap December 15, 2013
Energy Intersections: Energy Strategy + Cross-‐Sector Collaboration 303.377.5006 • www.energyintersections.com Page 2 of 104
Table of Contents List of Figures .............................................................................................................................................. 3 List of Tables ............................................................................................................................................... 4 List of Acronyms ......................................................................................................................................... 4
Executive Summary ....................................................................................................................... 5 Introduction ................................................................................................................................... 8
Project Background and Goals .................................................................................................................... 8 Estimating the Economic Potential of RH&Cs in Colorado Agriculture ...................................................... 9
Colorado’s Renewable Heating & Cooling Resource ........................................................................... 9 Estimates of Colorado Agricultural Thermal Loads and Costs .......................................................... 10 Numbers of Colorado Producers in Relevant Sectors ........................................................................ 11 Estimated Scale of RH&C Opportunity ................................................................................................ 12
Identification of RH&C-‐Applicable Agricultural Sectors ............................................................................ 13 Beef Cattle and Livestock: Low-‐Tech RH&C Opportunity ................................................................. 14 Dairies and Dairy Processing: Advanced RH&C Opportunity ............................................................ 14 Pork: Advanced RH&C Opportunity ................................................................................................... 14 Egg & Meat Poultry Production: Low-‐Tech & Advanced RH&C Opportunities ................................ 14 Sheep: Low-‐Tech RH&C Opportunity .................................................................................................. 15 Greenhouses & Nurseries: Advanced RH&C Opportunities ............................................................... 15 Fruit/Orchards & Other Produce: Low-‐Tech & Advanced RH&C Opportunities ................................ 15 Grains, Seeds, Beans, Hay & Forage Production & Processing: Limited Advanced RH&C Opps ...... 15 Potatoes: Low-‐Tech & Advanced RH&C Opportunities ..................................................................... 16 Sugar Beets: No RH&C Opportunities ................................................................................................ 16 Wineries, Breweries & Other Food Processing: Advanced RH&C Technologies .............................. 16
Other States Offer Good RH&C Programs but Lack Clear Best Practices for Agriculture .......................... 17 Results from Association Interviews and Producer Questionnaires ........................................ 19
Agricultural Sectors with High Perceived Heating and Cooling Demands ................................................. 19 How Much Do Producers Know about RH&Cs? .......................................................................................... 19 How Much Are Producers Using RH&Cs? ................................................................................................... 20 How Interested Are Producers in RH&Cs? ................................................................................................. 20 What Help Do Producers Want in Deploying RH&Cs? ............................................................................... 20
Potential RH&C Applications for Colorado Agriculture, with Energy & Economic Analysis ... 21 Low-‐Tech RH&C Energy Solutions ............................................................................................................. 23
Passive Design (Heating and Cooling) ................................................................................................ 23 Geothermal Tempering ....................................................................................................................... 26 Thermal Siphoning for Air Heating ..................................................................................................... 26 Solar Thermal Assisted Ventilation ..................................................................................................... 27 Solar Tempered Loafing Shelter ......................................................................................................... 28
Advanced RH&C Energy Solutions ............................................................................................................ 29 Dairy Farm Applications ...................................................................................................................... 29 Feed Mill Applications ......................................................................................................................... 32 Greenhouse Applications .................................................................................................................... 36 Beer Brewing Applications .................................................................................................................. 41 Food & Beverage Storage Applications ............................................................................................. 41
Proposed Colorado Agricultural Renewable Heating & Cooling (RH&C) Program ................ 42 Program Elements .................................................................................................................................... 44
Awareness & Education Campaigns ................................................................................................... 44 Demonstration Projects ...................................................................................................................... 47

Colorado Department of Agriculture Renewable Heating & Cooling Roadmap December 15, 2013
Energy Intersections: Energy Strategy + Cross-‐Sector Collaboration 303.377.5006 • www.energyintersections.com Page 3 of 104
Technology Selection with Design & Engineering Support ............................................................... 50 Financing Matchmaking & Application Support ................................................................................ 52 Deployment ......................................................................................................................................... 54 Reporting & Continuous Improvement .............................................................................................. 54
Program Benefits ...................................................................................................................................... 54 Program Costs ........................................................................................................................................... 55
2014 Colorado Agricultural RH&C Program Plans ..................................................................... 56 Overview of 2014 Program Plans .............................................................................................................. 56 Draft Agenda for Colorado Agricultural RH&C Planning Meeting, with Target Organizations ................ 56
Target Organizations ........................................................................................................................... 56 Draft Outline for an RH&C Technology Selection Tool .............................................................................. 57
Overview of Technologies to Watch in the Future ................................................................... 59 Biomass Combustion, Digestion or Pyrolysis for Heat Production ........................................................... 59 Solar (PV and Thermal) Combination Systems ......................................................................................... 60
Conclusions .................................................................................................................................... 61 Bibliography ................................................................................................................................. 63 Appendices ................................................................................................................................... 66
Appendix A: Dairy Case Study Models ...................................................................................................... 66 Profile of Average Dairy Operations & Energy Use ........................................................................... 66 Flat-‐Plate Solar Hot Water System ..................................................................................................... 67 Ground Source Heat Pump ................................................................................................................. 72
Appendix B: Feed Mill Case Study Models ................................................................................................. 81 Flat-‐Plate Solar Hot Water System ..................................................................................................... 81 Concentrating Solar Hot Water System ............................................................................................. 87 Ground Source Heat Pump ................................................................................................................. 88
Appendix C: Beer Brewing/Storage Case Study Model ............................................................................. 90 Solar Heat Pump System with Ammonia Absorption Chiller ............................................................ 90
Appendix D: Greenhouse Hydronic Case Study ......................................................................................... 92 Ground Source Heat Pump Driven Cold & Hot Hydronic System ...................................................... 92
Appendix E: Statewide Organizations Serving RH&C Applicable Sectors of Interest, Etc. ....................... 93 Appendix F: Survey of Producers’ Heating & Cooling Needs & Knowledge .............................................. 95
About Your Operation ......................................................................................................................... 95 Background on Renewable Heating & Cooling .................................................................................. 98 Using Renewable Heating & Cooling (RH&Cs) in Colorado Agriculture ......................................... 100 Permission .......................................................................................................................................... 103 Renewable Heating & Cooling Survey Complete. Thank you! ........................................................ 104
List of Figures Figure 1. Cows in a Colorado milking parlor ............................................................................................... 5 Figure 2. Stacks of bagged product at a Colorado feed mill ..................................................................... 7 Figure 3. Under-‐bench fin tube heaters in a Colorado greenhouse .......................................................... 8 Figure 4. U.S. solar water heating performance ....................................................................................... 9 Figure 5. Solar water heating schematic .................................................................................................... 9 Figure 6. Ground source heat pumps leverage solar energy absorbed by the earth ............................ 10 Figure 7. Small-‐scale Colorado poultry producer (100–200 birds) ........................................................... 15 Figure 8. A passive solar heated stock tank ............................................................................................. 19

Colorado Department of Agriculture Renewable Heating & Cooling Roadmap December 15, 2013
Energy Intersections: Energy Strategy + Cross-‐Sector Collaboration 303.377.5006 • www.energyintersections.com Page 4 of 104
Figure 9. Ground source heat pumps in the mechanical room of an industrial facility .......................... 21 Figure 10. Schematic of passive solar small-‐scale Colorado poultry house ............................................ 23 Figure 11. Schematic of a geothermal tempered stock tank ................................................................... 26 Figure 12. Schematic of a variation on a thermal siphon ......................................................................... 27 Figure 13. Thermal siphon for a small outbuilding using a compost pile as a heat source .................... 27 Figure 14. GSHP system peak fraction for an economically feasible system (closed loop) ................... 39 Figure 15. GSHP system peak fraction for economically feasible system (open loop) .......................... 40 Figure 16. Elements and flow of 2014 Colorado Agriculture RH&C Program ......................................... 43 Figure 17. Installation of rooftop solar thermal panels ............................................................................ 50
List of Tables Table 1: Relative fuel costs for conventional fuels .................................................................................... 13 Table 2: Relative fuel costs for conventional fuels .................................................................................. 23 Table 3. Dairy technical energy characteristics ........................................................................................ 29 Table 4. Proposed dairy liquid-‐based solar thermal system for water pre-‐heating ............................... 30 Table 5. Proposed dairy ground source heat pump for water heating and cooling ............................... 31 Table 6. Feed mill technical energy characteristics ................................................................................. 32 Table 7. Proposed feed mill solar thermal system for steam cooking preheating ................................. 34 Table 8. Proposed feed mill ground source heat pump for steam cooking preheating ........................ 35 Table 9. Illustration of GSHP system energy savings over VAV ventilation system alone ..................... 37 Table 10. Operational features that identify three tiers of RH&C installation opportunities ................ 48
List of AcronymsACRE: Advancing Colorado’s Renewable Energy (a CDA program)
API: American Petroleum Institute
CDA: Colorado Department of Agriculture
CEO: Colorado Energy Office
COP: coefficient of performance
DOE: Department of Energy
EERE: U.S. DOE’s Office of Energy Efficiency and Renewable Energy
EI: Energy Intersections, CDA contractor
EIA: Energy Information Administration
ESCO: energy service company
GSHP: ground source heat pump
ITC: investment tax credit
kW: kilowatt (unit of power)
kWth: thermal equivalent of kilowatt (thermal system capacity)
kWh: kilowatt hour (unit of energy)
kWhth: thermal equivalent of a kilowatt hour (thermal energy produced or used)
PPA: power purchase agreement
RH&Cs: renewable heating and cooling technologies
ROI: return on investment
TREs: thermal renewable energy technologies (same as RH&Cs)
USDA: U.S. Department of Agriculture
VAV: variable air volume (fans)

Colorado Department of Agriculture Renewable Heating & Cooling Roadmap December 15, 2013
Energy Intersections: Energy Strategy + Cross-‐Sector Collaboration 303.377.5006 • www.energyintersections.com Page 5 of 104
Executive Summary While research into the consumption and costs of energy used for heating and cooling applications —or thermal energy consumption—in Colorado agriculture is not definitive, it is clear that the state’s agriculture industry spends millions of dollars on these expenditures annually. These costs can be mitigated by investment in a range of Renewable Heating & Cooling (RH&C) technologies—technologies that meet the thermal energy requirements of an operation with minimal reliance on conventional energy resources. When deployed appropriately, these technologies can reduce operating costs and buffer producers from volatile fossil fuel prices.
RH&Cs include low-‐tech solutions such as geothermal tempering of stock water tanks. They also include advanced technologies. For example, active liquid-‐based solar thermal systems can heat a structure or boost process heating. Ground source heat pumps can provide heating and cooling for space, domestic water, and process conditioning.
Several sectors in Colorado agriculture are positioned to leverage these technologies.
Cattle and other livestock sectors can leverage Low-‐Tech RH&C solutions for preventing the freezing of stock water as well as for improving temperature maintenance in loafing sheds and other livestock facilities.
Dairies have simultaneous heating and cooling loads that present an ideal application of ground source heat pumps. These systems simplify operations by addressing both heating and cooling while eliminating the need for added heat recovery systems. For dairies with site limitations that make a ground source system impractical, liquid-‐based solar thermal systems can economically reduce dependence on fossil fuels.
Pork and other operations with requirements for frequently sterilizing equipment and housing structures are good candidates for solar thermal systems, including flat-‐plate, mid-‐temperature systems or concentrating, high-‐temperature systems. In these situations, the high demand for heated water can be largely met with RH&C systems.
Poultry operations for egg and meat production are good candidates for either liquid-‐based or air-‐based solar heating systems, coupled with appropriate ventilation. One Canadian firm has already installed hundreds of solar air heating systems for poultry producers, signaling the maturity of this technology for this sector.
Feed mills—both independent businesses and operations internal to large livestock operations—can benefit from liquid-‐based solar thermal systems to reduce conventional fuel use while also reducing wear and tear on boiler systems used for cooking grains.
Figure 1. Cows in a Colorado milking parlor

Colorado Department of Agriculture Renewable Heating & Cooling Roadmap December 15, 2013
Energy Intersections: Energy Strategy + Cross-‐Sector Collaboration 303.377.5006 • www.energyintersections.com Page 6 of 104
Small greenhouse operations can benefit from appropriate passive design, Low-‐Tech RH&Cs and solar thermal systems or ground source heat pump systems. Large operations benefit most from dual heating and cooling in the form of conditioned water delivery (hydronic) systems rather than forced-‐air systems.
Fruit operations, vegetable operations, and operations such as food processing (including meat processing, breweries, and wineries) typically have extensive cooling requirements for storage. These operations also may have considerable heating loads for process heat (as in the example of cider pressing or brewing) or domestic water and occupant heating. Producers with dual-‐process situations are good candidates for ground source heat pumps.
The type of fuel used in an agricultural operation is an important preliminary indicator of whether RH&C technologies will be a good fit. While low natural gas prices make RH&C technologies economically non-‐competitive in some situations, those producers using propane or electricity to meet heating and cooling requirements will see good economic returns for RH&C technologies today. And, in some situations where natural gas is employed, certain conditions can make RH&Cs economical; for example, year-‐round heating or cooling processes or operations in which margins are particularly sensitive to fuel price volatility are good candidates for replacing natural gas consumption with RH&C technologies.
Energy efficiency measures also should be identified and evaluated before considering any RH&C technologies. Efficiency measures that can be achieved practically and economically should be pursued first while avoiding redundancy with RH&Cs that may provide greater benefits than the efficiency measures alone.
Producers currently face considerable barriers in pursuing RH&C technologies:
a lack of awareness and detailed knowledge of the options;
a lack of demonstration projects to help producers better understand the opportunities;
engineering time and costs;
securing financing, including navigating the challenging pathways to many subsidies; and
understanding permitting for RH&C systems (permitting is a formidable challenge in some Colorado jurisdictions and a trivial matter in others).
Based on information gained from technology experts, agricultural producers and their associations, and the case studies developed for this report, Energy Intersections recommends that CDA create a program with these components to develop RH&Cs for the benefit of Colorado producers.
The education component of the RH&C program serves agricultural associations, farmers unions, co-‐ops, service and supplier companies, and bankers. Rolled out in the first year as a simple, inexpensive awareness campaign targeting all of the sectors with potential for projects, this campaign would raise the awareness of RH&Cs in much of the agricultural community through low-‐cost methods (primarily email and web distributed information with a few conference calls or meetings). This initial phase would address (1) technology basics, (2) how to select the right technology for different operations, and (3) subsidy and financing basics. At the same time, the awareness phase of the education campaign could share the progress of highly targeted demonstration projects as they progress in the first year, while also reaching thousands of smaller producers with guidance for implementing their own low-‐tech projects.

Colorado Department of Agriculture Renewable Heating & Cooling Roadmap December 15, 2013
Energy Intersections: Energy Strategy + Cross-‐Sector Collaboration 303.377.5006 • www.energyintersections.com Page 7 of 104
Concurrent with the awareness campaign, demonstration projects provide on-‐the-‐ground examples of both the low-‐tech and advanced technologies.
o Low-‐Tech
2 or more geothermal tempering projects for stock water (livestock)
1 or more solar thermal assisted loafing shed structures (livestock)
2 or more thermal siphon installations on outbuildings or shelters (sector neutral)
1 or more passive nighttime cooling installations (sector neutral)
o Advanced Technology
1 ground source heat pump installation in a dual-‐process (heating and cooling) application (e.g., dairy, greenhouse or food storage facility)
1 solar thermal system installation (e.g., feed mill or pork)
1 solar air ventilation system installation (e.g., egg or meat poultry or drying)
Engineering support moves producers interested in investing in advanced systems toward the goal of implementation.
Assist producers and lenders in their navigation of subsidies and financing options through a matchmaking service.
Continuous improvement of the program increases the quality of the effort through project performance measurement and reporting for any subsidized RH&C projects and periodic debriefings.
It is important to appreciate that, while CDA can target specific sectors such as dairy, pork, poultry, produce, and food processing for delivering RH&C programs, the Department can also welcome equally worthwhile “situational” opportunities. While certain sectors tend to have conspicuous heating and cooling issues, CDA will find that achievable opportunities exist in less obvious sectors. Welcoming these situational opportunities into the program will allow CDA to serve more producers and will enhance program success.
Such a CDA program would move producers in relevant sectors past the barriers and help them secure RH&C benefits, including reduced fuel expenses and reduced exposure to fuel price volatility, leading to greater energy security. The program would also provide ancillary benefits by creating jobs in rural areas, creating local financial multiplier effects for communities, reducing greenhouse gas emissions, and contributing substantially to the maturation of RH&C industries in Colorado.
Figure 2. Stacks of bagged product at a Colorado feed mill
Colorado Department of Agriculture Renewable Heating & Cooling Roadmap December 15, 2013
Energy Intersections: Energy Strategy + Cross-‐Sector Collaboration 303.377.5006 • www.energyintersections.com Page 8 of 104
Introduction
Project Background and Goals In 2012, the Colorado Department of Agriculture (CDA) issued a policy statement announcing the newly revamped goals of its Advancing Colorado’s Renewable Energy (ACRE) Program. To best leverage its resources, the ACRE program focuses on a few themes regarding energy use in Colorado agriculture: small hydropower electricity generation, energy efficiency, and renewable heating and cooling (RH&C) technologies. To meet the RH&C goals, Energy Intersections has developed this Roadmap to guide CDA in administering the ACRE program with respect to agricultural heating and cooling technologies. As a secondary consideration, the Roadmap touches on the role of energy efficiency in these sectors and suggests how these two types of technologies may be deployed in an integrated fashion.
According to a 2013 report commissioned by the Colorado Energy Office (CEO) on energy use in the state’s agricultural sectors (Naranjo, et al. 2013), Colorado agriculture incurs direct energy expenses of more than $400 million annually. According to the study, a total of 21.3% of agricultural energy expenditures in the state are for the purchase of natural gas, propane, and heating oil. These figures suggest that over $80 million of energy expenses in Colorado agriculture are due to heating requirements. However, for a variety of reasons, those figures only tell part of a very important energy story in this $7.3 billion Colorado industry.
Colorado Agricultural Renewable Heating & Cooling (RH&C) Roadmap has the following goals:
to enable deeper understanding of the heating and cooling required in various agricultural sectors;
to identify sectors best suited to the adoption of a range of RH&C technologies;
to identify any best practices used in other states to induce the implementation of RH&Cs in appropriate agricultural sectors; and
to describe a programmatic approach based on the identified information that will allow the Colorado Department of Agriculture to induce greater deployment of RH&Cs in the most cost-‐effective, achievable, and impactful manner, for the benefit of Colorado producers and processors.
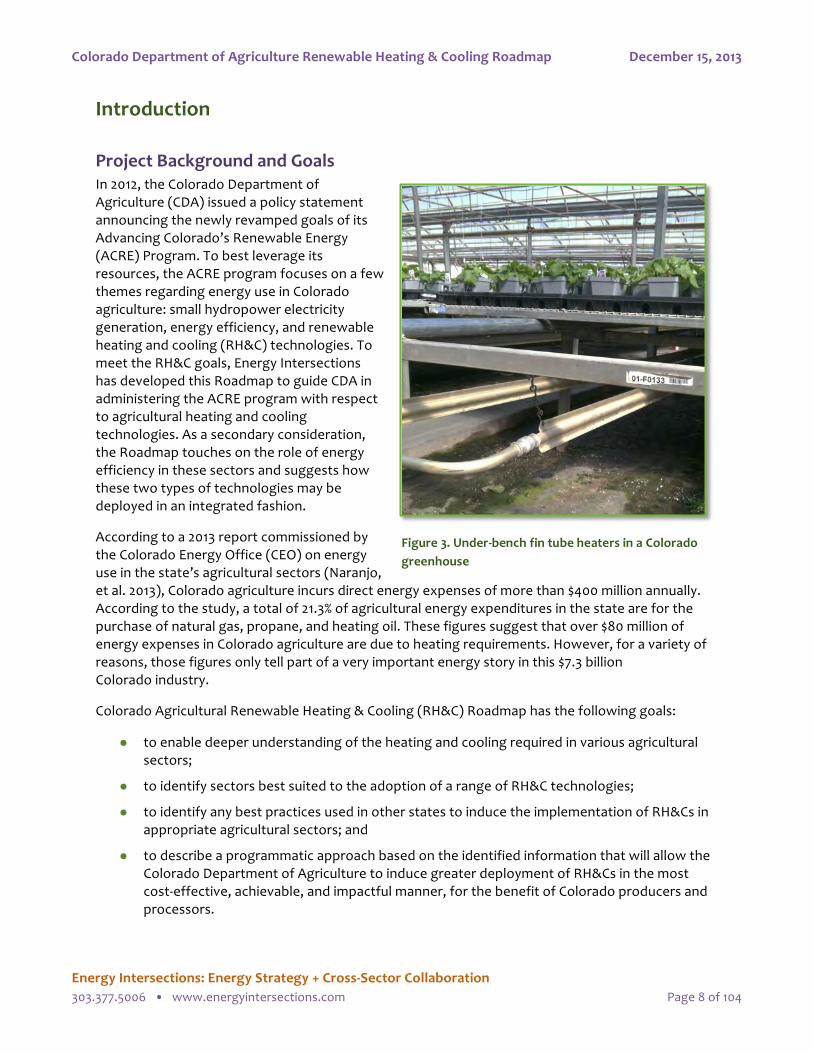
Figure 3. Under-‐bench fin tube heaters in a Colorado greenhouse

Colorado Department of Agriculture Renewable Heating & Cooling Roadmap December 15, 2013
Energy Intersections: Energy Strategy + Cross-‐Sector Collaboration 303.377.5006 • www.energyintersections.com Page 9 of 104
Estimating the Economic Potential of RH&Cs in Colorado Agriculture
Colorado’s Renewable Heating & Cooling Resource Research indicates that Colorado is at the center of the North American resource for liquid-‐based solar thermal systems (see Figure 4 (Merrigan and Parker 2010)). The solar thermal resource is robust throughout the state. Similarly, ground source heat pumps operate equally well anywhere in the state.
Active liquid-‐based solar thermal systems simply capture the energy from the sun and transport that energy, as heat, to the desired space or process by means of pumping the heated liquid to the appropriate location (see Figure 5). Because the energy is captured, transported, and used as heat (rather than converted to another form of energy, such as electricity), these systems are highly efficient, converting 70–80% of the energy captured into working energy (Kingston 2013, Meillon 2013). By comparison, solar photovoltaic (PV) systems typically convert 20% or less of the sun’s energy into usable electricity. Also unlike PV systems, solar thermal systems typically include 24 hours of energy storage in the form of a water tank or similar device.
Solar air heating works in a similar fashion: a collector on a south facing wall uses the sun’s energy to heat air, which is then circulated through a building or process to provide heat where needed. Solar air technology can also be used to vent excess heat when nighttime outdoor temperatures are lower than the target temperature, as is often the case in Colorado (Marron and Felske 2013).
Geothermal systems function similarly. Nearly half of the sun’s energy that hits the planet every day is absorbed by the earth. That
�
��������� ������������������������
���������������������� ���� ���Figure 4. U.S. solar water heating performance (kWh/year) (Merrigan and Parker 2010)
Figure 5. Solar water heating schematic

Colorado Department of Agriculture Renewable Heating & Cooling Roadmap December 15, 2013
Energy Intersections: Energy Strategy + Cross-‐Sector Collaboration 303.377.5006 • www.energyintersections.com Page 10 of 104
energy—and the fact that a lot of excess energy can be transferred to the earth—is what drives ground source heat pump heating and cooling (see Figure 6).
Rather than having tubing placed in the sun to capture energy, ground source heat pump systems have tubes in the earth and move heat energy back and forth between the earth and a structure or process. These systems also typically include an energy storage device.
It is compelling to note that there are strong resources for both solar thermal and ground source technologies, including low-‐tech approaches, available to Colorado agricultural producers of all sizes. There are also opportunities worth exploring for future deployment of biomass energy. These resources and technologies have the potential to reduce sizable cost centers for Colorado agricultural producers.
Estimates of Colorado Agricultural Thermal Loads and Costs Neither national statistics agencies nor Colorado producer associations monitor and collect heating and cooling energy demand, usage, or related trends on a sector basis. Fundamentally, thermal energy uses have been studied far less in the U.S.—including in agriculture—than electricity use has been studied (Miranowski 2013). As a result, there are no direct aggregated data about these metrics in Colorado agriculture as a whole or in specific agricultural sectors.
From federal sources, we know that nearly 36,000 Colorado farms report spending over $250 million on gasoline and other petroleum products, while nearly 20,000 farms report spending over $140 million on utility expenses, largely for electricity (USDA 2009). These figures are supported by the Colorado Agricultural Statistics 2012 (National Agricultural Statistics Service Colorado Field Office 2012). However, these numbers provide only an oblique view of the thermal (heating and cooling) energy demands and consumption on farms in Colorado.
The CEO report Colorado Agricultural Energy Market Research suggests that agricultural producers face approximately $80 million in heating expenses (Naranjo, et al. 2013). However, the report lacks examination of several important pieces of Colorado agriculture’s thermal energy picture.
It does not include cooling requirements at all, which is an important thermal energy load that can be met by some RH&C technologies.
It does not account for heating and cooling performed by electricity.
Figure 6. Ground source heat pumps leverage the fact that the earth absorbs large amounts of energy from the sun—and can absorb additional energy from buildings and processes

Colorado Department of Agriculture Renewable Heating & Cooling Roadmap December 15, 2013
Energy Intersections: Energy Strategy + Cross-‐Sector Collaboration 303.377.5006 • www.energyintersections.com Page 11 of 104
It does not include some of the agricultural sectors in the state that have the highest heating and cooling loads (such as dairies, greenhouses, and orchards)—representing some of the most achievable opportunities for implementing RH&Cs—due to insufficient response from those producers (Naranjo, et al. 2013).
As a result, it is likely that the CEO study materially underestimates the burden of heating and cooling costs on Colorado’s producers and, therefore, the size of the opportunity for achievable implementation of RH&Cs.
The American Petroleum Institute (API) estimated that Colorado agriculture averaged approximately 2 million gallons of propane consumption annually in 2010 and 2011 (API Statistics Department 2013). At the current average retail price of approximately $1.50/gallon (Kingston 2013, Wallace 2013), that finding represents an annual expenditure of approximately $3 million. That figure is important because it represents the most achievable opportunity for RH&C technology switching in Colorado agriculture. However, the API figure also is an estimate, and differs from our team’s estimate of propane consumption (based on Energy Information Administration (EIA) data) by an order of magnitude. The actual propane consumption in Colorado agriculture probably lies between the two estimates.
Ultimately, it is clear that costs for heating and cooling functions have not been deeply researched and are not well understood. The best that we can say is that some portion of Colorado producers’ expenditures on petroleum products and electricity is for heating and cooling functions, and that portion is likely to be in the tens or hundreds of millions of dollars annually.
Numbers of Colorado Producers in Relevant Sectors We can look at the opportunity for RH&Cs in terms of the scale of the Colorado agricultural sectors most relevant to RH&C deployment (USDA 2009).
Number of Colorado Farms: 37,054
Colorado Farms by Sector:
o with beef cows: 11,627 735,014 head
o with milk cows: 449 126,944 head
o selling hogs/pigs: 1,230 2,376,709 animals sold
o with layer inventory: 3,018 3,902,950 animals1
o selling meat chickens: 146 17,729 animals sold
o with greenhouse crops: 564
o orchards: 877 6,986 acres
1 The Colorado Egg Producers stated that they have only six members and there are only four “big” layer operations in the state with a total of approximately 4 million animals. These data indicate the existence of a few large producers who would benefit from Advanced RH&Cs, while there are thousands of small-‐scale producers who would benefit from instructions on installing Low-‐Tech RH&Cs (see “Poultry Houses” below).

Colorado Department of Agriculture Renewable Heating & Cooling Roadmap December 15, 2013
Energy Intersections: Energy Strategy + Cross-‐Sector Collaboration 303.377.5006 • www.energyintersections.com Page 12 of 104
Colorado Related RH&C Farm Production Expenses
o Gasoline, Fuels and Oils: 35,901 farms purchased $252,730,000
o Utilities: 19,465 farms purchased $141,173,000
Colorado On-‐Farm Energy Production
o Farms generating energy or electricity: 969
o Farms with solar thermal systems: 117
Although the reported figures do not specify exact numbers of systems, we also know from this report and from Colorado Division of Water Resources records that there are a number of anaerobic digesters and ground source heat pumps currently installed in Colorado agricultural operations (USDA 2009, Colorado Division of Water Resources 2013).
Clearly, then, there is considerable opportunity to justify action toward greater deployment of RH&C technology in Colorado agriculture, due to three considerations:
the large number of producers with operations potentially well suited to Low-‐Tech and Advanced RH&C;
the considerable size of the opportunities for large producers; and
the number of sectors with large economic opportunities for technology switching.
Estimated Scale of RH&C Opportunity Those situations where propane is used to meet heating or cooling requirements are good candidates today for switching to RH&Cs; typically, the payback time is under 5 years with a good return on investment (ROI). However, producers can usually only access this opportunity if they can secure financing, which is often challenging. Similarly prudent investment opportunities exist for producers using electricity for these purposes. Even for producers using currently inexpensive natural gas to meet heating and cooling requirements, technology switching makes economic sense under certain conditions:
if heating and cooling loads can be met simultaneously;
if there is high volume or steady (e.g., not seasonal) demand for heating or cooling;
if there is high excess heat that can be captured and used to meet cooling needs through either ground source heat pumps or through use of solar thermal cooling systems (see “Solar Heat Pump System with Ammonia Absorption Chiller” below); or
if the producer is concerned that spikes in energy prices or demand charges could be damaging to the operation’s margins.
For all industry in Colorado (which includes agriculture, by federal definition (EIA 2013)), natural gas consumption has risen 5% since 2007, while total expenditure on natural gas has dropped by 49%, due to the drop in market price. In contrast, propane use has fallen by 13%, yet total Colorado industry expenditure on propane has risen by 1% over that same period (EIA 2011, EIA 2011). As a result, those producers relying on propane have felt more of a squeeze in energy prices in recent years than their counterparts using natural gas. Propane users are seeking ways to reduce and smooth out their energy costs. Producers relying on electricity for heating and cooling do not face such drastic price volatility, but they are facing similar costs (see Table 1 below).

Colorado Department of Agriculture Renewable Heating & Cooling Roadmap December 15, 2013
Energy Intersections: Energy Strategy + Cross-‐Sector Collaboration 303.377.5006 • www.energyintersections.com Page 13 of 104
At the same time, those producers using natural gas are enjoying low prices today but may be hurt by the ongoing volatility of gas prices in the future, if they do not diversify the energy sources on which they rely for heating and cooling. Volatility carries its own costs that drag on economic value.
Table 1: Relative fuel costs for conventional fuels
Fuel Unit Btu/Unit Efficiency Cost/Unit Net Cost
Gross Net $/MMBTU
Electricity kWh 3,412 3,344 98% $0.075 $22.43
Natural Gas therm 100,000 80,000 80% $0.650 $8.13
Propane gallon 91,300 72,127 79% $1.50 $20.80
Heating Oil gallon 138,800 115,204 83% $2.50 $21.70
Wood pellets ton 16,400,000 13,612,000 83% $224.00 $16.46
If natural gas prices rise to a level that is approximately double what it is today, RH&C technologies will become economically competitive with natural gas heating and cooling (see Table 1). Natural gas prices have already tripled what they were five years ago; further, a doubling of price in the next five years would be well within the range of historical natural gas price volatility (Kingston 2013, Wallace 2013).
Although it would be desirable to map the Colorado areas where propane and electricity consumption for heating and cooling purposes are highest, those data are simply not available. While many producers operating in rural electric association territories use these more expensive resources to heat and cool, some are served by the natural gas utilities operating in the state. Moreover, some producers may reside in a natural gas utility service area but natural gas services may not have been installed yet. As a result, the most effective way to learn what producers are using is to ask them directly.
Therefore, while we cannot precisely gauge the economic opportunity of deploying more Low-‐Tech and Advanced RH&C technologies, we can make valid observations about the magnitude of this opportunity.
Colorado producers spend tens to hundreds of millions of dollars each year on heating and cooling for their operations.
Thousands of small, medium, and large producers would benefit economically from implementing Low-‐Tech RH&C solutions, such as geothermal tempering of stock water.
Hundreds of larger producers and processors would benefit economically from installing Advanced RH&Cs.
Identification of RH&C-‐Applicable Agricultural Sectors Energy Intersections used a variety of methods to identify the agricultural sectors in which RH&C would be most achievable in Colorado:
Structured interviews with staff at state agriculture associations;
Interviews with agriculture specialists from federal and state agencies and universities;
Structured interviews with individual producers;

Colorado Department of Agriculture Renewable Heating & Cooling Roadmap December 15, 2013
Energy Intersections: Energy Strategy + Cross-‐Sector Collaboration 303.377.5006 • www.energyintersections.com Page 14 of 104
Site visits with individual producers;
A survey of producers in the state regarding their heating and cooling needs; and
Models developed by subject matter experts who have experience with hundreds of RH&C systems and who were working with energy data from Colorado producers.
Beef Cattle and Livestock: Low-‐Tech RH&C Opportunity Based on communications with livestock producers, most heating and cooling is applied to human-‐occupied spaces and a few buildings for tending to sick or injured calves and cows. The greatest thermal energy challenge these producers face is a need for frost-‐free watering in some settings at feedlots and on remote rangeland, where off-‐grid and especially low-‐tech water heating would be worthwhile and cost-‐effective (Midcap 2013, Hammerich 2013). Such installations can benefit other livestock operations as well (Potter and Bowman 2013). See “Geothermal Tempering” and other “Low-‐Tech RH&C Energy Solutions” below. There are over 12,000 producers with cattle in the state, and additional livestock operations including sheep raising.
Dairies and Dairy Processing: Advanced RH&C Opportunity The Western Dairy Association has an Innovation Center committed to fostering environmental sustainability in dairies. The Innovation Center has produced case studies of dairies that use solar thermal systems and anaerobic digesters, and has developed a Roadmap to Reduce Greenhouse Gas Emissions and Increase Business Value, a Stewardship and Sustainability Guide, and other tools and resources. The Innovation Center also has produced a documentary film, Cow Power, demonstrating how dairy manure can be converted into energy. The most of these cases are based in Vermont, Maine, and other areas of New England; none takes place in Colorado (Western Dairy Association 2013). Based on this information, conversations with producers, and models developed by our subject matter experts, clear opportunities exist for deploying ground source heat pumps in dairies. Where ground source heat pumps are not practical (e.g., due to site limitations), active liquid-‐based solar thermal systems provide a cost-‐effective alternative (Wallace 2013, Kingston 2013). Because 75–80% of dairy producers use propane as a heating resource, there are many potential RH&C projects with very good economics today in Colorado (Sorensen 2013). See “Dairy Farm Applications” below. Colorado is home to over 400 operations with dairy cows.
Pork: Advanced RH&C Opportunity Although our study did not examine pork operations in detail, it is clear that because the operations use high volumes of heated water, they would benefit from the installation of active liquid-‐based solar thermal systems. Identification of interested producers should be pursued (Dever 2013). See “Active Liquid-‐Based Solar Thermal for Boosting Steam Flashing of Grain” for a similar application. Note that applications that require lower temperature water (e.g., 150–200° F) may see higher efficiency from solar thermal systems and, therefore, better economic opportunities than the feed mill case. There are over 1,200 producers raising swine for pork in Colorado.
Egg & Meat Poultry Production: Low-‐Tech & Advanced RH&C Opportunities Solar air heating has been very successful for Canadian poultry producers. While specific data are not yet available, it seems likely that Colorado’s large layer operations would benefit from advanced forms of this technology, while small layer operations would benefit from low-‐tech, passive designs for poultry houses. Further, as Colorado has fewer than 200 farms with meat poultry operations selling fewer than 20,000 animals each year, these operations also should be targeted with simple

Colorado Department of Agriculture Renewable Heating & Cooling Roadmap December 15, 2013
Energy Intersections: Energy Strategy + Cross-‐Sector Collaboration 303.377.5006 • www.energyintersections.com Page 15 of 104
low-‐tech temperature maintenance solutions (Blinde 2013, Marron and Felske 2013, Gilbert 2013). Colorado hosts 4 major layer operations and over 3,000 very small operations.
Sheep: Low-‐Tech RH&C Opportunity While wool production requires extensive washing, all of the wool produced in Colorado is shipped out of state for that process, eliminating the advanced technology opportunity in this sector to deploy RH&Cs (Brown 2013). However, the geothermal tempering of stock tanks can be applied in this sector as it can with cattle.
Greenhouses & Nurseries: Advanced RH&C Opportunities The large-‐scale greenhouse operations along Colorado’s Front Range participate in a joint natural gas purchasing contract (Harris 2013). However, because these operations have slim margins that are impacted by energy prices, this sector is vulnerable to natural gas price volatility. Greenhouse sector producers continue to seek diversification in their heating and cooling portfolios (Gerace 2013).
Because these large operations have sizable thermal demands, and because they switch between heating and cooling functions, dual (hot and cool) hydronic systems represent a good fit for reducing their fuel consumption (Wallace 2013). These systems circulate warm or cool water as needed directly to the soil underneath the area where plants are set. As a result, these systems are much more efficient than fan ventilation cooling or fin-‐tube heating systems are (although some fan ventilation may still be required to draw enough fresh air into a greenhouse). These systems can obtain their warm and cool water from conventional sources, or from renewable sources such as ground source heat pumps. Smaller operations, particularly those that rely on propane for thermal management, are good candidates for more standard Advanced RH&C systems, such as solar hot water heating (Meillon 2013, Swenson 2013). Over 500 greenhouses operate in Colorado.
Fruit/Orchards & Other Produce: Low-‐Tech & Advanced RH&C Opportunities Produce (fruit and vegetable) operations typically run sizable coolers in the fall and winter months—the same times at which their heating demand increases for occupied spaces and for processes such as cider-‐making. These usages represent prime opportunities for ground source heat pump installations (Potter and Bowman 2013, Wallace 2013). There also may be opportunities for solar air heating to be used to dehydrate crop residues before they are sold for compost or energy production (Marron and Felske 2013), although these are not explored in detail in this study. Given today’s high-‐tech controllers, performance of produce coolers also can be enhanced with HVAC “economizers” that bring outside air into coolers when the outside air is colder than the target temperatures. Nearly 900 orchards operate in Colorado.
Grains, Seeds, Beans, Hay & Forage Production & Processing: Limited Advanced RH&C Opportunities After extensive conversations with the Colorado Dry Bean Association, the Colorado Wheat Administrative Committee, the Colorado Seed Growers Association, the CSU Extension, and other
Figure 7. Small-‐scale Colorado poultry producer (100–200 birds)

Colorado Department of Agriculture Renewable Heating & Cooling Roadmap December 15, 2013
Energy Intersections: Energy Strategy + Cross-‐Sector Collaboration 303.377.5006 • www.energyintersections.com Page 16 of 104
technical specialists, we have determined that there are no appreciable opportunities for Advanced RH&Cs in the grains, seeds, beans, and hay/forage sectors (Schork 2013, Hanavan 2013). Because the few heating and drying requirements are highly variable—in some cases not even required every year—RH&C capital investments are generally uneconomic. It may well be feasible for these operations to employ basic passive solar designs to enhance their drying and storage operations, but these techniques were not explored for these sectors in this study.
The one type of opportunity to which RH&Cs apply in the grain sector is for feed mills that use heat to cook grains. These operations can benefit from using a liquid-‐based solar thermal system to boost the temperature on their steam production. There are at least five large and five medium-‐sized feed mills in Colorado, with numerous small operations and several feed mills that are vertically integrated with large feedlot operations.
Potatoes: Low-‐Tech & Advanced RH&C Opportunities The executive director of the Colorado Potato Administrative Committee indicated that some space heating (for product storage and to prevent freezing) is performed with propane and electric heat in this sector, which may, with regard to RH&C approaches, call for either low-‐tech passive design approaches or solar air heating. Process hot water also plays a role for these producers, a need that could be met through RH&C via active liquid-‐based solar thermal systems. Some producers do have simultaneous heating and cooling loads, although the nature of these loads is not entirely clear. Four potato producers responded to the EI survey and may be candidates for future projects (see “Results from Association Interviews and Producer Questionnaires”) (Ehrlich 2013).
Sugar Beets: No RH&C Opportunities Because the heating requirements for this sector occur only with processing of the sugar beets and there is only one sugar beet processor in the state, we recommend not pursuing projects in this sector at this time. High-‐temperature solar thermal systems may be economic for such operations in the future.
Wineries, Breweries & Other Food Processing: Advanced RH&C Technologies Dr. Stephen Menke, State Enologist based at Colorado State University, reports that Garfield Estate in Palisade uses solar thermal technology in its growing and winery operation. He and the Colorado Wine Industry Development Board state that refrigerating grapes after harvest, chilling wine as it ferments, heating water for steam cleaning equipment, and moving air through vineyards during frost events are the main thermal uses of energy.
As with other produce and processing sectors, ground source heat pumps can reduce reliance on more expensive energy resources in the wine sector, while serving both heating and cooling needs. Solar thermal systems could be used to boost steam production where simultaneous heating and cooling are not deployed during enough months of the year to justify ground source heat pump systems. In these cases, an economizer could improve performance of coolers.
Dr. Menke also sees potential for applying principles of passive solar design to winery structures, as well as appreciable untapped potential for community biomass energy projects, in which winery residues could be pooled to fuel a central plant. One winery responded to our survey (Menke 2013, Caskey 2013).

Colorado Department of Agriculture Renewable Heating & Cooling Roadmap December 15, 2013
Energy Intersections: Energy Strategy + Cross-‐Sector Collaboration 303.377.5006 • www.energyintersections.com Page 17 of 104
Colorado beer brewers have considerable awareness of RH&C technologies. As outlined by the executive director of the Colorado Brewers Guild, the brewing process involves a lot of heating and cooling. The key heating applications are heating of the wort (liquid from the mash process) and hot water heating for cleaning and sterilization. The main cooling process is cooling of water to cycle through heat exchangers. Cooling buildings in summer and heating them in winter are also considerations (Carlson 2013).
Except for the largest operations, most beer sector heating processes are performed with electric boilers operating from utility-‐provided electric service. Some brewers do attempt to design their plants to use heated or chilled water for multiple purposes along the process chain. Generally, however, they have not attempted to integrate RH&Cs into their systems, largely due to the initial costs. Identification of a number of feasible projects could result from CDA’s educating brewers about the economic benefits of some technologies, such as ground source heat pumps, for breweries’ simultaneous heating and cooling requirements (Carlson 2013). However, because brewing operations are complex, it was not realistic to obtain data to analyze all of the brewing processes for this study. In some cases, both high-‐temperature solar thermal (for steam) and ground source heat pumps (to serve simultaneous heating and cooling loads) may be economically feasible.
The Department of Energy’s (DOE) Office of Energy Efficiency and Renewable Energy (EERE) includes an Advanced Manufacturing Office tasked with a Clean Energy Manufacturing Initiative. The focus of this initiative is combined heat and power (CHP), an approach that can serve simultaneous heating and cooling needs. A library of CHP project case studies can be explored by market sector. Relevant sectors include Animal and Dairy Farms, Breweries, Ethanol Plants, and Wineries. Most of the featured animal and dairy farms are in Wisconsin and California. The featured businesses include Colorado’s MillerCoors and New Belgium breweries. There are over 300 breweries in Colorado.
Ultimately, every food processor in the state with simultaneous heating and cooling processes or high-‐temperature processes is a potential candidate for either ground source heat pumps or solar thermal—or, in some cases, both.
Other States Offer Good RH&C Programs but Lack Clear Best Practices for Agriculture A thorough examination of state incentives for agricultural use of RH&Cs shows that many states have suites of policies in place to implement these technologies effectively. Indeed, the lesson from reviewing the broad range of states with policies directly affecting RH&C technologies is that a combination of approaches is the most effective method of getting systems installed. This paradigm may be characterized as a “systems approach.” Arizona, California, and Oregon lead the way in terms of numbers of policies that impact a variety of different technologies used in agricultural applications. Vermont and Wisconsin have programs that explicitly include agriculture (DOE EERE 2013). However, these states fold these offerings into their general renewable energy programs, and do not approach or market these RH&C offerings separately for the agriculture market.
These policy suites have several elements that systematically support each other (DOE EERE 2013):
Technology and Energy Neutrality. States that support the implementation of RH&Cs are careful to make their policies applicable to all commercially viable technologies, and to make

Colorado Department of Agriculture Renewable Heating & Cooling Roadmap December 15, 2013
Energy Intersections: Energy Strategy + Cross-‐Sector Collaboration 303.377.5006 • www.energyintersections.com Page 18 of 104
them apply more broadly to energy generated or energy offset, rather than strictly to electricity generated.
Tax Programs
Tax Exemptions. In most states with any RH&C programs, there are no sales or property taxes levied against the equipment and installation of these systems.
Tax Incentives. In some cases, states also offer a tax credit that is parallel to the Federal Investment Tax Credit for these technologies, which immediately improves the economics of the systems for those operators with a state tax burden. Such incentives also encourage third-‐party investment.
Financing Support
C-‐PACE (Commercial Property Assessed Clean Energy) Financing. Several states—now including Colorado—allow commercial operations to invest in RH&C technologies and pay back the investment on their property tax bills over an extended period; the loan stays with the property if the property sells, and the loan payment is typically lower than the energy savings from the installed system. The result is an immediate improvement in cash flow.
Revolving Loan Funds or Public Benefit Funds. Both of these financial structures allow states to have a consistently available pool of low-‐cost capital to loan to operators for the implementation of these technologies.
Education. Education about the availability and applicability of these technologies, and the availability of support in implementing them, appears to be crucial for the successful deployment of these suites of solutions in all states.
While no state offers a clear set of intentionally developed best practices for incentivizing renewable heating and cooling technologies specifically for agriculture, it is obvious that this multipronged systems approach is highly effective: the more of these components that a state offers, the more of these systems are deployed in that state. Colorado already offers tax exemptions and C-‐PACE financing as described above. The addition of awareness and education programs—and possibly installation incentives—from CDA will carry the state further along a growth trajectory in the implementation of RH&Cs in agriculture.

Colorado Department of Agriculture Renewable Heating & Cooling Roadmap December 15, 2013
Energy Intersections: Energy Strategy + Cross-‐Sector Collaboration 303.377.5006 • www.energyintersections.com Page 19 of 104
Results from Association Interviews and Producer Questionnaires
Agricultural Sectors with High Perceived Heating and Cooling Demands The Energy Intersections (EI) team identified 60 member associations representing most of the agricultural producers across the state, filtering out 11 associations that were clearly not impacted by thermal-‐energy-‐intensive activities. Using a structured script reviewed by CDA and others, the team members conducted interviews with representatives of the remaining 49 organizations. Interviewees included executive directors of industry associations and highly experienced board members or association members. While the data collected through these methods are in no way representative of these sectors or statistically significant, they do point to situations and trends that add to our understanding of heating and cooling needs in Colorado agriculture.
Between these interviews and responses to the survey instrument sent to association members (yielding 31 respondents representing 15 discrete agricultural sectors), it became apparent that the highest perceived heating and cooling loads in Colorado derive from the following sectors:
Cattle
Dairy
Pork
Poultry
Feed mills
Greenhouses
Produce (fruits, vegetables, orchards)
Food and beverage processing and storage
This list is not a ranked listing, as load characteristics vary widely from one producer to another.
How Much Do Producers Know about RH&Cs? The EI team wanted to understand which Colorado agricultural sectors have operators who consider heating and/or cooling among their top operational considerations, and what specific awareness of thermal energy issues exists among agricultural operators within those sectors. Respondents from the cattle industry, for example, are clearly aware of a thermal issue critical to the well being of their livestock: freezing water in stock tanks is a major concern.
We learned that energy costs represent one of the top five costs of doing business. However, producers are not always certain about which energy resources are providing heating and cooling as opposed to electrical functions such as lighting. Nevertheless, over 90% of survey respondents indicated mid-‐level or greater familiarity regarding Renewable Heating & Cooling technologies. All respondents answering the technology-‐specific questions were already familiar with geothermal
Figure 8. An isolated, passive solar heated stock tank offering benefits similar to a geothermal tempered stock tank

Colorado Department of Agriculture Renewable Heating & Cooling Roadmap December 15, 2013
Energy Intersections: Energy Strategy + Cross-‐Sector Collaboration 303.377.5006 • www.energyintersections.com Page 20 of 104
heat pump technology, and most were familiar with solar thermal technologies. Respondents were generally not knowledgeable about biomass RH&Cs.
How Much Are Producers Using RH&Cs? Based on familiarity with the technologies, it is not surprising that the most widespread RH&C technology already in service among the surveyed Colorado agricultural producers is ground source heat pumps. Solar thermal technologies came in second for air heating, cooling, and ventilation applications.
How Interested Are Producers in RH&Cs? Eight survey respondents had already identified potential heating and cooling applications for their operations, some of which were quite detailed, such as the following:
barn cooling;
heating greenhouses;
solar drying for stable, extended-‐storage vegetable production such as potato, tomato, root crops, and other products;
large warehouses that provide good locations for various types of solar collectors;
solar thermal systems to support aquaculture, fish raising, and processing (cleaning, packing and cooling); and
heating and cooling office, shop, and residential spaces.
Across respondents, cost and financing were seen as the biggest barriers to adopting RH&Cs. Most respondents and association representatives did not have a high level of familiarity with the U.S. Department of Agriculture (USDA) Rural Energy for America Program (REAP), which offers grants and loans for projects, including RH&C technologies. Respondents and interviewees were similarly unfamiliar with the Federal Investment Tax Credits available for these technologies.
Other barriers identified included: the challenges of dealing with permitting, applying for incentives such as rebates, technical barriers, uncertainty, and perceived risks. These secondary barriers were perceived to be nearly as challenging as cost and financing barriers.
What Help Do Producers Want in Deploying RH&Cs? The majority of survey respondents said they would like CDA to provide training or education about RH&Cs. They also want engineering support, demonstration project incentives, and help locating financing. From producer surveys and from interviews with sector association leaders, together with input from energy and agricultural consultants, it is clear that CDA’s greatest lever in supporting RH&C implementation for producer benefit is to provide training on these technologies and associated implementation issues, including facilitating the acquisition of incentives for Colorado producers, along with demonstration projects. CDA can also educate bankers and help navigate permitting in order to optimize RH&C deployment.
One specialty crop producer said it well: “[What’s needed is] support for on-‐farm research, development, and demonstrations; to allow practical methods to be used widely and cooperatively.”

Colorado Department of Agriculture Renewable Heating & Cooling Roadmap December 15, 2013
Energy Intersections: Energy Strategy + Cross-‐Sector Collaboration 303.377.5006 • www.energyintersections.com Page 21 of 104
Potential RH&C Applications for Colorado Agriculture, with Energy & Economic Analysis To identify more specifically the achievable applications of Renewable Heating & Cooling (RH&C) technologies and opportunities in Colorado’s agricultural sector, Energy Intersections (EI) visited several facilities where agricultural products are produced and/or processed. EI worked with the owners and operators of the facilities to identify specific energy-‐intensive processes where RH&C technologies may be a good fit, and which may be characteristic of the types of applications that may be found in that field of agricultural production. These facilities included:
a dairy operation,
a feed mill,
a large greenhouse operation,
a small poultry operation that produces eggs and birds for meat, and
a large brewery with extensive process heating and cooling and cold storage facilities.
In addition to these facility visits, our team worked with a large food processing facility, a beef processing facility, an orchard, a large juicing operation, and several wine producers to discuss energy-‐intensive processes and potential applications of RH&Cs within their operations.
Wherever possible, Energy Intersections obtained actual utility billing data, including monthly energy consumption and costs, as well as relevant information about boiler and chiller unit capacities, boiler water flow rates, and other information used to characterize the energy intensity of production processes. We analyzed these data and worked with technology experts to develop high-‐level case studies that highlight the opportunities and challenges of deploying RH&C technologies in these agricultural operations.
The results of the case studies are presented in this section. They are not intended as feasibility studies; rather, they are intended to represent the types of opportunities that occur within these industries. Energy Intersections strongly recommends that CDA or producers retain qualified professionals or energy services companies to perform thorough, detailed feasibility studies, including thermal energy efficiency audits, before implementing projects like these.
Figure 9. Ground source heat pumps in the mechanical room of an industrial facility

Colorado Department of Agriculture Renewable Heating & Cooling Roadmap December 15, 2013
Energy Intersections: Energy Strategy + Cross-‐Sector Collaboration 303.377.5006 • www.energyintersections.com Page 22 of 104
Heating and cooling applications are characterized by three application types.
Water heating and cooling
Space heating and cooling
Process heating and cooling
Within these application types, a process or operation is considered “thermally light” if heating and cooling loads vary according to seasonal weather patterns, and “thermally heavy” if heating and cooling loads are largely independent of seasonal weather patterns. For example, a year-‐round greenhouse operation that has high heating loads in the winter and cooling loads in the summer is a thermally light operation, while a year-‐round steam flaking process at a feed mill is a thermally heavy process. Process heating and cooling loads are often heavier and more energy intensive than other applications. Consequently, EI paid particular attention to industrial processes when identifying and evaluating opportunities and applications for RH&C technologies.
Energy Intersections has also characterized appropriate types of applications of RH&C technologies according to the application scenario. For example, the application may be characterized as fuel switching or fuel offsetting, demand reduction, load shifting, or load leveling. Moreover, appropriate application scenarios may be characterized as new construction, retrofits of existing systems, or replacement of old systems.
Each of these scenarios has an important effect on the potential economic performance of the project and the deciding factors regarding investment in RH&C. For example, the incremental costs of installing and operating a solar hot water system with a downsized natural gas boiler in a replacement or new construction scenario is very different from the full cost of installing and operating the same solar hot water system as a retrofit with an existing, full-‐sized boiler system.
In general terms, opportunities for the deployment of RH&C technologies are more attractive in new construction and replacement scenarios, where incremental costs, rather than full costs, can be evaluated accurately. Fuel-‐switching or fuel-‐offsetting scenarios are often unappealing today if currently inexpensive natural gas is in use, unless large efficiency gains can be achieved. Other fuels, such as propane and electricity, are currently two to three times more expensive than natural gas, making fuel-‐switching scenarios more attractive. Furthermore, if large electric demand charges based on high peak demand are being incurred, then demand reduction, load shifting, or load leveling with RH&C technologies are often very attractive scenarios. It should also be noted that the intermittent and variable nature of solar energy might represent a barrier for fuel switching, so hybrid systems (involving more than one heating and cooling resource) may be better options in some cases.
Table 2 below summarizes the relative fuel values and costs used in the case studies, except where other fuel price data were available. The column on the far right represents the normalized delivered cost of energy based on the typical efficiencies of energy appliances.

Colorado Department of Agriculture Renewable Heating & Cooling Roadmap December 15, 2013
Energy Intersections: Energy Strategy + Cross-‐Sector Collaboration 303.377.5006 • www.energyintersections.com Page 23 of 104
Table 2: Relative fuel costs for conventional fuels
Fuel Unit Btu/Unit Efficiency Cost/Unit Net Cost
Gross Net $/MMBTU
Electricity kWh 3,412 3,344 98% $0.075 $22.43
Natural Gas therm 100,000 80,000 80% $0.650 $8.13
Propane gallon 91,300 72,127 79% $1.50 $20.80
Heating Oil gallon 138,800 115,204 83% $2.50 $21.70
Wood pellets ton 16,400,000 13,612,000 83% $224.00 $16.46
Low-‐Tech RH&C Energy Solutions
Passive Design (Heating and Cooling) Passive heating and cooling designs leverage the basic physics of any situation in which a temperature differential exists. Passive design also incorporates basic insulation and efficiency principles.
For example, with Colorado’s dry air and clear nights, passive radiant heat transfer is a feasible way to remove excess heat from a building during the nighttime hours and to chill water for purposes of cooling during the day. Radiant heat transfer can cool water below ambient air temperature; this phenomenon is the reason we sometimes see frost on cars even when the low temperature was not at or below freezing. Water chilled by passive radiant heat transfer can then be circulated to cool a structure, to cool produce coolers, or to otherwise meet cooling needs that are normally met with compressor chillers. Non-‐potable water can be used in these closed-‐loop applications.
Slightly more involved passive design principles can be applied to specific situations, including agricultural settings. Following are detailed descriptions of how to apply these principles to small-‐scale poultry houses and greenhouses—which would meet the needs of thousands of producers across the state. However, many of these principles would apply to any operation with outbuildings that need to be kept above freezing temperatures and in which no mechanical systems are installed.
Poultry Houses Because there are thousands of very small poultry egg and meat producers across the state, CDA has an opportunity to positively impact many producers at a very low cost. CDA can accomplish this task by providing simple training materials (print/PDF guides, short online videos, conference calls, or webinars) to guide small-‐scale poultry Figure 10. Schematic of passive solar small-‐scale
Colorado poultry house

Colorado Department of Agriculture Renewable Heating & Cooling Roadmap December 15, 2013
Energy Intersections: Energy Strategy + Cross-‐Sector Collaboration 303.377.5006 • www.energyintersections.com Page 24 of 104
producers through the implementation of basic passive principles in their poultry houses. By employing these principles, small-‐scale producers can maintain their poultry houses at higher temperatures (in most cases, above freezing) in the winter while still enabling adequate cooling in the summer. Doing so will increase production, thereby improving these producers’ revenue streams. Even small revenue stream increases can be meaningful in such operations, which tend to have small margins.
A basic poultry house can be constructed with a metal tubing frame and white vinyl sheeting. This structure is easy and inexpensive to build and allows natural light to filter through the sheeting. Ranging in size from 800 to 1,600 square feet, it is appropriate for 100–200 birds.
Straw bales can be used to insulate the exterior of the East, North, and West walls of the poultry house. Stacking bales directly against the walls of the structure provides some insulation value and breaks most prevailing winds, thereby reducing heat loss in the winter. The South wall is kept clear of bales so that the solar energy striking that side of the structure is absorbed by the interior of the structure and so that a flap in the South wall sheeting can be easily raised when ventilation is needed.
In summer and winter, an energy blanket can be hung across the ceiling, effectively creating a thermal barrier between the workspace and the roof. This reduces heat transfer and traps warm air in the winter and cool air in the summer closer to the ground, near the birds and nest boxes. This blanket can be removed as needed to improve ventilation of the structure.
A thermal mass can be buried beneath the floor of the structure to retain solar heat absorbed through the earth. Quite simply, the floor is dug out to accommodate a layer of metal or plastic drums (often available free at car wash operations). These drums are then lowered into the hole, filled with water (which retains heat well) and sealed shut again. The area is repacked with dirt, with a layer of just a few inches packed down on top of the drums. The water in the drums retains heat absorbed from the sun during the day and releases it gradually during nighttime hours, and provides seasonal tempering as well.
The floor should be isolated from the surrounding ground. By installing rigid board insulation to a depth of 4 feet immediately inside the walls of the poultry house, the ground containing the thermal mass (water-‐filled drums) is isolated from the surrounding ground. As a result, the thermal mass will transfer most of its heat to the space inside the poultry house at night and transfer less heat to the surrounding ground, improving seasonal performance.
By taking these inexpensive and relatively simple steps, small-‐scale poultry producers can dramatically change the heat retention of their poultry houses—thereby increasing their overall production and revenues. By training the thousands of small poultry producers in Colorado how to take these steps, CDA can meaningfully impact many small farms.
Greenhouses The same basic passive energy principles as described for poultry houses can be applied to small greenhouse operations, especially where heating is a greater concern than cooling. In addition, energy curtains can be used—both to block unwanted heat and to preserve heat. One small greenhouse operator who has installed a solar thermal system for heating said, “The solar panels definitely help. But the biggest bang for the buck has been energy curtains.”

Colorado Department of Agriculture Renewable Heating & Cooling Roadmap December 15, 2013
Energy Intersections: Energy Strategy + Cross-‐Sector Collaboration 303.377.5006 • www.energyintersections.com Page 25 of 104
The poultry house steps and the energy curtains are ideal for existing structures that cannot economically be changed radically. In addition, where cooling is a concern, passive radiant night cooling could be applied (see the beginning of this section).
For new construction, there are more principles to consider: orienting the longest side of the structure to the south is important, as well as incorporating a south-‐facing clerestory to ensure the entire floor receives solar radiation. South-‐facing glazing with north-‐facing insulation is also key, while modern temperature, humidity, and ventilation controls are also crucial.
With over 500 producers across the state operating greenhouses to produce crops, CDA has many opportunities to disseminate these basic principles and positively impact hundreds of producers.

Colorado Department of Agriculture Renewable Heating & Cooling Roadmap December 15, 2013
Energy Intersections: Energy Strategy + Cross-‐Sector Collaboration 303.377.5006 • www.energyintersections.com Page 26 of 104
Geothermal Tempering Colorado ranchers and other livestock producers face a chronic winter problem of freezing stock water tanks. Even a thin layer of ice can dissuade thirsty horses or cattle from breaking in to drink. A simple solution is a geothermal tempering installation under those water tanks. Commercial versions of zero-‐energy, frost-‐free stock tanks include the MiraFount® from Miraco® and livestock waterers from Cobett Company®.
The main benefit of such an installation is a dramatically reduced need for workers to visit stock water tanks—particularly remote stock tanks, which can require high quantities of fuel and labor to repeatedly check, break and thaw tank ice.
Do-‐it-‐yourself installations involve a 2-‐foot diameter hole dug vertically approximately 20 feet deep under the tank location. A hole of this depth easily reaches a subterranean zone that maintains a stable 50° F temperature year-‐round. The hole is then packed tightly with scrap metal to serve as a heat transfer material. At the surface, the hole is covered by a 2-‐foot diameter, aluminum heat transfer plate attached to a 1-‐foot spike driven into the packing material. The stock tank is then placed directly on the heat transfer plate. When the stock water temperature is below 50° F, heat is transferred naturally from the bottom of the hole, through the scrap metal packing, to the heat transfer plate and into the water in the tank.
On days cooler than 50° F, the water being heated at the bottom of the tank by the geothermal tempering installation will naturally rise to the top of the tank and push the cold water down to the bottom to be heated. To ensure that neither passive radiant heat transfer nor convection from wind (both occurring at the surface of the water) overpower the geothermal heat transfer and freeze the water, the tanks should be well insulated and covered with floating panel insulation with well-‐spaced, 1-‐foot diameter watering holes.
Introducing the idea of this type of installation to the nearly 12,000 beef producers and other livestock producers in the state would help them save significantly on fuel and labor expenses.
Thermal Siphoning for Air Heating Farm and ranch buildings—including outbuildings that require some minimum temperatures—are typically heated by natural gas, propane, electricity, and occasionally wood combustion. However, each of these fuels carries a cost and a certain amount of inconvenience. A thermal siphon instead relies upon the abundant natural solar energy in our state. It uses this energy to heat and circulate air in a building, using the simple principle that hot air rises.
Benefits of an air thermal siphon include reduced consumption of heating fuel without the installation of additional operating equipment. It can also improve indoor air quality in buildings by
Figure 11. Schematic of a geothermal tempered stock tank

Colorado Department of Agriculture Renewable Heating & Cooling Roadmap December 15, 2013
Energy Intersections: Energy Strategy + Cross-‐Sector Collaboration 303.377.5006 • www.energyintersections.com Page 27 of 104
preserving indoor humidity (which is valuable in Colorado’s dry climate). Also, the operable window can be automated thermostatically to draw in fresh air and to vent excess heat.
Simple thermal siphoning techniques include installing some type of glass or plastic glazing (for example, an old storm door) over a sheet of dark metal on the south-‐facing wall of the structure to be heated. This glazing-‐over-‐collector configuration requires a frame that is well sealed to the structure wall. On the inside of the building, openings through the building wall at the top and bottom of the glazed area allow air to circulate from the building and through the siphon, absorbing heat along the way.
Dampers on the openings allow the siphon to be closed at night
when the glazed space is not heating. A working window in the structure allows for natural ventilation and release of excess heat in the summer. The dampers and operating widows can be connected to thermostats and small motors to open and close them automatically, based upon target indoor temperatures.
Adding a thermal mass to the floor of such a structure as described in “Poultry Houses,” above, would allow heat to continue to be released in the evening, if temperatures are high enough during the day for the thermal mass to absorb some of that energy.
This type of system can be beneficial to many of Colorado’s nearly 36,000 farmers who may have unconditioned outbuildings.
Solar Thermal Assisted Ventilation Like a thermal siphon, solar thermal assisted ventilation is useful for livestock structures and other types of buildings. In these situations, a structure that is essentially a thermal siphon can provide some or all of the desired heated air circulation by adding an exterior inlet for fresh air. To provide cooled replacement air in the summer, that replacement air can be directed through long underground tubes placed in the ground around the outside of the building. In cases where
Figure 13. Thermal siphon for a small outbuilding using a compost pile as a heat source
Figure 12. Schematic of a variation on a thermal siphon

Colorado Department of Agriculture Renewable Heating & Cooling Roadmap December 15, 2013
Energy Intersections: Energy Strategy + Cross-‐Sector Collaboration 303.377.5006 • www.energyintersections.com Page 28 of 104
ventilation is required (e.g., to reduce ammonia levels), solar thermal assisted ventilation can be used in conjunction with active ventilation, thereby reducing demands on the active system and extending its life.
Other benefits of these types of systems include reduced fossil fuel consumption and costs. Of course, these systems would benefit many producers with livestock enclosures or outbuildings requiring both heating and ventilation.
Solar Tempered Loafing Shelter Livestock, like people, need to have locations to escape high and low temperatures as well as exposure to wind and precipitation. Loafing shelters provide respite from summer sun and winter wind. These structures can be oriented to block prevailing winter winds. The addition of a south-‐facing collector (plastic or glass glazing) transmits solar energy to the floor of the shed. The floor can then serve as a thermal mass (particularly if it is a dirt floor with insulation around the perimeter isolating it from the surrounding ground, and an installed thermal mass, or a properly constructed and insulated concrete floor), releasing heat during the cooler nighttime hours.
Structures configured to redirect prevailing summer breezes, and built with thermal siphoning, can cool livestock by circulating air through the structure. Such structures would benefit the thousands of livestock producers in Colorado by reducing stress on their animals.

Colorado Department of Agriculture Renewable Heating & Cooling Roadmap December 15, 2013
Energy Intersections: Energy Strategy + Cross-‐Sector Collaboration 303.377.5006 • www.energyintersections.com Page 29 of 104
Advanced RH&C Energy Solutions As mentioned previously, Energy Intersections pursued several case studies of Advanced RH&C technologies in agriculture with technical and economic models. Following are those case studies. Those with more detail show the most promising opportunities; those with less detail show situations either where a lack of data prevented a robust analysis or where the benefits of the Advanced RH&C technologies are questionable today in consideration of current fuel prices.
Note that these case studies only take existing incentives into account and do not assume any additional CDA incentives.
Dairy Farm Applications Dairies are thermally heavy operations with large demands for continuous heating of wash water and cooling of milk. This requirement makes dairies leading candidates for potential applications of RH&C technologies. Energy Intersections worked with several dairy operators and a dairy engineering and services company to evaluate opportunities and applications for RH&C technologies.
We found that the dairy operation profiled in this case study is typical of many dairy operations in Colorado. This dairy has 4,000 milking cows that each produces 100 pounds of milk per day for a total of 46,000 gallons of milk every day. Each cow is milked three times per day. The milk lines and milking facilities are washed every eight hours with water heated to 180° F. Each washing cycle consumes about 2,000 gallons of hot water. The milk comes from the cows at 100° F and is quickly chilled to about 38° F at a rate of 3,000 gallons per hour before it is transferred to refrigerated tanks or trucks. Incoming groundwater cools the milk to about 70° F and a chiller provides the remaining cooling of the milk. A Fre-‐Heater® heat recovery system collects some of the waste heat from the chiller unit to pre-‐heat the wash water.
This dairy uses a propane-‐fired boiler rated at 12 boiler horsepower and 83% stack efficiency. The estimated seasonal efficiency of the boiler is 59%. The boiler uses 92 gallons of propane per day at a current estimated cost of $138 per day.
Table 3. Dairy technical energy characteristics
Current Dairy Energy Profile
Production 46,000 gallons/day Milk
Application Cooling milk; heating wash water
Appliances Electric chiller; Boiler; Heat Recovery
Rating 12 BHP boiler; 83% efficiency
Schedule 6,000 gallons/day water @ 180° F
Fuel Propane (92 gallons/day)
Notes Heat recovery system uses chiller waste heat to pre-‐heat wash water

Colorado Department of Agriculture Renewable Heating & Cooling Roadmap December 15, 2013
Energy Intersections: Energy Strategy + Cross-‐Sector Collaboration 303.377.5006 • www.energyintersections.com Page 30 of 104
Active Liquid-‐Based Flat-‐Plate Solar Thermal System for Boosting Water Heating RE-‐Align Technology2 modeled the economic performance of a solar hot water system for the dairy, using flat-‐plate collectors with a 2,200-‐gallon hot water storage tank at atmospheric pressure (not pressurized). The new system would deliver hot water at a temperature of 180° F. The propane boiler would provide backup for the solar collectors.
Analysis of the dairy’s water and propane use showed that currently there is a year-‐round base load consumption of approximately 92 gallons of propane and 6,000 gallons of water per day. Up to 10% of energy consumption in the base load is assumed to be for activities other than wash water. We used an advanced solar thermal simulator, Polysun—which uses earth mapping and meteorological data along with independently evaluated solar thermal performance metrics to allow the user to create customized local solar thermal system performance designs—to model the overall system performance. The Polysun analysis showed that the solar thermal system would cost around $264,000 installed, and $95,000 after incentives and depreciation. As shown in Table 4, the system would reduce propane consumption by 57% and save $29,000 in first-‐year fuel costs at $1.50 per gallon of propane. This represents fuel cost savings of $7.22 per cow per year. Simple payback for this system is estimated to be 2.7 years.
Table 4. Proposed dairy liquid-‐based solar thermal system for water pre-‐heating
Proposed Dairy Solar Thermal System
Technology Flat-‐plate collectors
System Capacity 192 kWth
System Size/Rating 96 collectors, 4 foot X 8 foot each 180° F peak; 2,200 gal storage tank
Installed Cost $264,000
Out-‐of-‐Pocket $95,000
Energy Savings 57%
Fuel Savings $29,000 annual (1st year)
Payback 2.7 years
Ground Source Heat Pumps for Simultaneous Heating and Cooling Loads Energy Environmental Corporation modeled the economic performance of a ground source heat pump system for the dairy. The heat pump would assist the chiller in cooling the milk and would deliver pre-‐heated water to the boiler at a temperature of 140° F.
Analysis indicated that a 7-‐ton heat pump system would provide optimal performance by reducing the demand for water heating by the boiler. As an added benefit, the heat pump would simultaneously provide chilling for about 650 gallons of milk per hour.
The estimated cost of this system is $160,000 installed, with an out-‐of-‐pocket cost of $120,000. The ground source heat pump would reduce annual propane consumption by about 54%, with annual heating cost savings of $37,000 per year, calculated at $1.50 per gallon of propane. The heat pump would also reduce the electric operating costs of the chiller by 71% at no additional cost for the heat
2 Collaboration with and mention of specific firms within this report is not an endorsement of those firms’ services for any specific project or service. Energy Intersections greatly appreciates the collaboration of these firms and may have omitted some information inconsequential to this report to protect their intellectual property.

Colorado Department of Agriculture Renewable Heating & Cooling Roadmap December 15, 2013
Energy Intersections: Energy Strategy + Cross-‐Sector Collaboration 303.377.5006 • www.energyintersections.com Page 31 of 104
pump, resulting in cooling cost savings of $14,000 and total energy cost savings of almost $52,000 per year. This corresponds to energy cost savings of $12.91 per cow per year, and an estimated simple payback of 2.3 years.
Table 5. Proposed dairy ground source heat pump for water heating and cooling
Proposed Dairy Ground Source Heat Pump System
Technology Ground source heat pump
System Capacity 6 kW
System Size/Rating 7-‐ton3; COP: 3.4–6.9
Installed Cost $160,000
Out-‐of-‐Pocket $120,000
Percent Energy Savings
54% heating 71% chilling
Energy Savings Value $37,260 annual heating $14,400 annual chilling $51,660 annual total
Payback 2.3 year simple payback
As an added benefit, the ground source heat pump would eliminate the need for the Fre-‐Heater® heat recovery system, simplifying the overall complexity and cost of the heating and cooling system. Since the heat pump can only achieve a temperature of 140° F, a much smaller solar hot water system than described above could provide make-‐up heat to reach 180° F, as required for sanitation. Such a hybrid system would still require a boiler system for backup. Therefore, a careful analysis of the benefit of the increased capital of such a hybrid system would be required, as compared to either the GSHP or solar hot water systems separately. Further, timing will impact the analysis: the capital outlay of any of these systems will be more attractive if timed with a required equipment replacement.
3 Ground source heat pumps are specified in the same units as refrigeration equipment, as they are essentially the same technology.

Colorado Department of Agriculture Renewable Heating & Cooling Roadmap December 15, 2013
Energy Intersections: Energy Strategy + Cross-‐Sector Collaboration 303.377.5006 • www.energyintersections.com Page 32 of 104
Feed Mill Applications Many feed mills use heat for cooking grain and for heating space during winter months, but feed mills generally lack cooling loads. Despite many large electric motors and a high electric base load, most of the energy used in a typical feed mill goes to grain cooking processes year-‐round. This cooking or steam flaking improves the digestibility of corn, for example, by about 10%. Research indicates that the resulting improvement in animal growth rates provides good economic return on the added cost of steam flaking.
Feed production peaks in winter months when forage becomes scarce and demand for fodder increases. This peak in production coincides with peak demand for space heating for mill buildings. The production process is much more thermally intensive than the space heating of mill buildings. Although winter heating loads may double on an hourly basis, the additional heating load primarily comes from hourly increases in production rather than space heating. The vast majority of the increased heating demand, therefore, is due to the process rather than to winter heating requirements.
The Energy Intersections team visited a feed mill in northern Colorado with a mill production capacity of about 20 tons per hour. This operation uses two natural gas-‐fired steam generators to produce heat for a steam flaking process, as well as facility heat during winter months. The steam generators are each rated at 100 boiler horsepower and 81% stack efficiency. Both generators operate close to full capacity during the winter months and alternate service in the summer.
We obtained several years of energy utility data and the specifications for the steam generators to evaluate opportunities to deploy renewable heating and cooling technologies at the mill. Based on the utility data, the steam generators consume about 72% of the total energy used at the mill on an annual basis, but represent only about 36% of the total annual cost of energy, due to the current lower cost of natural gas relative to electricity. The utility data and service schedules indicated that the generators provide steam at an estimated seasonal efficiency of 42%.
Table 6. Feed mill technical energy characteristics
Current Feed Mill Energy Profile
Production 3,600 tons/month cooked feed
Application Grain cooker
Appliances (2) Steam Generators
Rating 100 BHP each; 81% stack efficiency
Schedule 40 hours per week
Fuel Natural Gas
Notes 72% of total energy use 36% of total energy cost
According to the mill’s operations director, profit margins have been decreasing at independent feed mill operations; many feed mills are experiencing reduced demand for their products because feedlot owners are building their own feed mills on-‐site. Reducing energy costs in the remaining independent feed mill operations can lower the embedded cost of energy in feed prices and improve profit margins. According to a local feed mill operator, there are 5 large feed mills in Colorado with production over 50,000 tons per year, five medium-‐sized mills with production of less than 25,000 tons per year, and numerous small mills (Szidon 2013).

Colorado Department of Agriculture Renewable Heating & Cooling Roadmap December 15, 2013
Energy Intersections: Energy Strategy + Cross-‐Sector Collaboration 303.377.5006 • www.energyintersections.com Page 33 of 104
Active Liquid-‐Based Solar Thermal for Boosting Steam Flashing of Grain Energy Intersections worked with RE-‐Align Technology and Abengoa Solar, Inc., to evaluate the feasibility of solar hot water applications based on the utility data from the feed mill case study. RE-‐Align Technology modeled the performance of a system with flat-‐plate, mid-‐temperature collectors, while Abengoa Solar evaluated a system using concentrating, high-‐temperature collectors. The mill’s existing hot water system raises cold water from a year-‐round average temperature of approximately 50° F to nearly 350° F prior to being released as low-‐pressure steam into the grain cooking process.
Solar thermal technologies can cost-‐effectively deliver pre-‐heated water to agricultural water heating environments such as this mill has, where incoming cold water is heated by the existing hot water system to low pressure and medium temperature ranges (100 psig and 350° F). In contrast to the existing pressurized hot water system, the solar thermal design can be based on either a pressurized or a non-‐pressurized design. The pressurized design would allow the solar collectors to contribute hot water at temperatures in excess of 200° F. However, pressurized hot water storage tanks are very costly.
RE-‐Align Technology modeled the economic performance of a solar hot water system using either flat-‐plate or evacuated tube collectors and a hot water storage tank at atmospheric pressure (unpressurized), which is noted for both its longevity and attractive economics. Only the heat exchanger, which works as a pre-‐heater for the existing system, operates under the high water pressures typical for this mill’s operations. Such a system can deliver pre-‐heated water at an upper temperature range of 180° F to 190° F.
Abengoa Solar modeled the performance of a concentrating solar hot water system that can deliver hot water temperatures up to 350° F and includes a pressurized solar storage tank at 100 psig, but the storage tank proved to be too costly in this situation for the system to provide an economic benefit. Abengoa also modeled a smaller concentrating solar system, similar in capacity to the RE-‐Align Technology system, with a payback period similar to that in RE-‐Align’s model (see Table 7 below).
The optimal solar thermal system is one that can serve the heating base load year-‐round. Analysis of this mill’s water and natural gas use showed that there is a year-‐round base load consumption of approximately 6,000 therms of gas per month and 1,750 gallons of water per day. The base load is approximately 50% of the peak load. Negligible heat recovery is expected in the base load, and up to 10% of energy consumption in the base load is assumed to be used for activities other than process heat for cooking grain. Both flat-‐plate solar collectors and evacuated-‐tube solar collectors were simulated using the Polysun simulator.
The analysis showed that there was considerable benefit to installing solar thermal technology, but that there is no discernible price or performance advantage between the different collector technologies. For this particular feed mill operation, a solar thermal system would cost around $150,000, installed (gross installation cost before federal tax credit, depreciation, and any other incentives). Either solar thermal system would produce 30% of the hot water needed for the mill’s year-‐round base load, and eliminate nearly 20,000 therms from their yearly natural gas load.
This system can be applied to other agricultural facilities where water is heated to nearly 350° F with a similar 30% solar contribution to the base load of the hot water system. Similar systems might operate at a lower temperature of 250° F. At this temperature, the solar contribution would increase

Colorado Department of Agriculture Renewable Heating & Cooling Roadmap December 15, 2013
Energy Intersections: Energy Strategy + Cross-‐Sector Collaboration 303.377.5006 • www.energyintersections.com Page 34 of 104
to over 40% of the base hot water demand, improving the economics and overall benefit of the system.
Energy Information Administration data for Colorado show that the industrial price for natural gas in Colorado has averaged $0.65 per therm in the 6 months ending August, 2013. While this price is above well-‐known Front Range prices, it represents the natural gas price that would be more likely in agricultural regions. At this price, the mill would save over $11,000 in natural gas in the first year, corresponding to a savings of about $0.26 per ton of production, or about 20% of the cost of natural gas. After Federal investment tax credit and depreciation, the out-‐of-‐pocket costs for the system would be $54,000, slightly over one-‐third of the total system installation cost. This cost does not factor in any other incentives, such as USDA grants, which may or may not be available. Simple payback for this system is estimated to be 4.8 years.
Table 7. Proposed feed mill solar thermal system for steam cooking preheating
Proposed Feed Mill Solar Thermal System
Technology Flat-‐plate or evacuated tube
System Capacity 110 kWth
System Size/Rating 44 collectors, 4' x 10' each (flat-‐plate) 190° F peak; 1,500 gal storage tank
Installed Cost $150,000
Out-‐of-‐Pocket $54,000
Energy Savings 30% annual
Fuel Savings $11,000 annual (1st year)
Payback 4.8 years
Ground Source Heat Pumps for Boosting Steam Flashing of Grain Energy Intersections worked with Energy Environmental Corporation to evaluate the feasibility of ground source heat pump applications at the mill. Based on the utility data, specifications for the steam generators, and the estimated seasonal efficiency, the steam generators were estimated to deliver hot water (as steam) at the rate of 2.3 gallons per minute per generator. This information was used to determine that a 7-‐ton heat pump could deliver pre-‐heated water at 140° F to serve the heating base load.
The estimated cost of this system is $160,000 installed, with an out-‐of-‐pocket cost of $120,000. At 2012 energy costs of $0.475 per therm and $0.075 per kilowatt-‐hour, the ground source heat pump will reduce annual gas consumption by about 8%. The net annual energy cost savings are estimated to be $802 per year, making this system unfeasible.
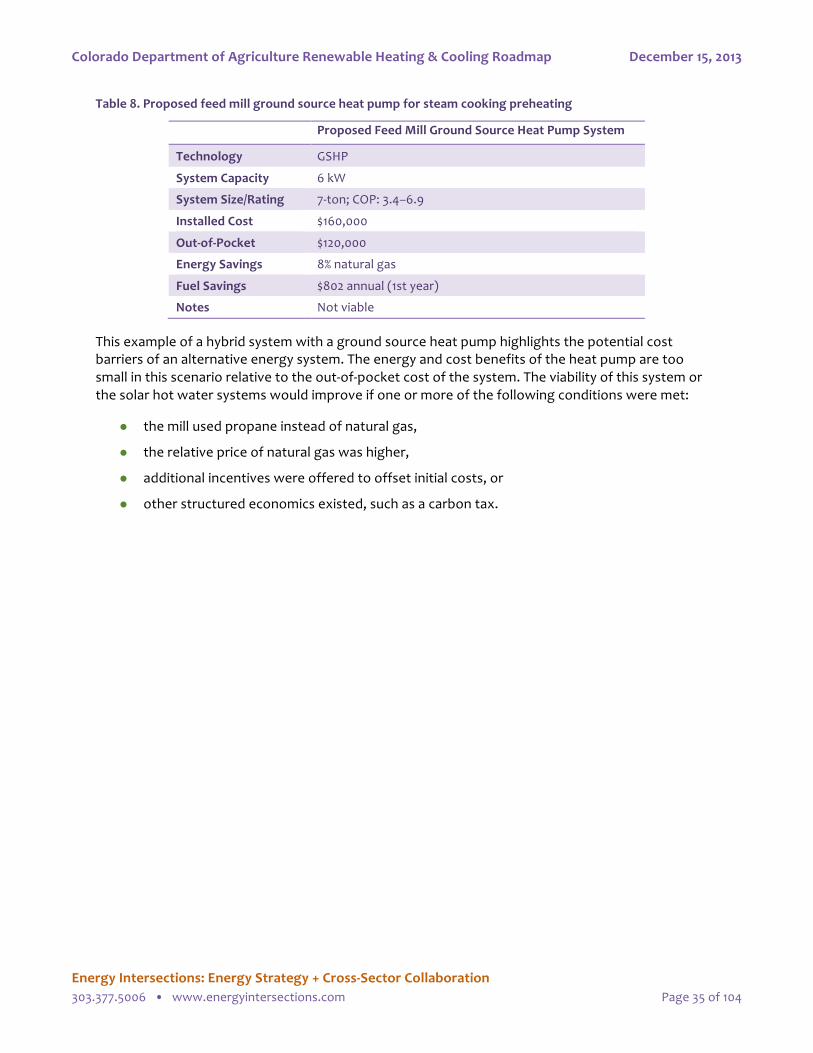
Colorado Department of Agriculture Renewable Heating & Cooling Roadmap December 15, 2013
Energy Intersections: Energy Strategy + Cross-‐Sector Collaboration 303.377.5006 • www.energyintersections.com Page 35 of 104
Table 8. Proposed feed mill ground source heat pump for steam cooking preheating
Proposed Feed Mill Ground Source Heat Pump System
Technology GSHP
System Capacity 6 kW
System Size/Rating 7-‐ton; COP: 3.4–6.9
Installed Cost $160,000
Out-‐of-‐Pocket $120,000
Energy Savings 8% natural gas
Fuel Savings $802 annual (1st year)
Notes Not viable
This example of a hybrid system with a ground source heat pump highlights the potential cost barriers of an alternative energy system. The energy and cost benefits of the heat pump are too small in this scenario relative to the out-‐of-‐pocket cost of the system. The viability of this system or the solar hot water systems would improve if one or more of the following conditions were met:
the mill used propane instead of natural gas,
the relative price of natural gas was higher,
additional incentives were offered to offset initial costs, or
other structured economics existed, such as a carbon tax.

Colorado Department of Agriculture Renewable Heating & Cooling Roadmap December 15, 2013
Energy Intersections: Energy Strategy + Cross-‐Sector Collaboration 303.377.5006 • www.energyintersections.com Page 36 of 104
Greenhouse Applications Greenhouses are thermally light operations with high seasonal heating and cooling costs. In fact, with little effective insulation and with high ventilation and humidity requirements, particularly in dry climates such as Colorado, greenhouses are thermally intensive operations. The requirement for effective humidity control means that a significant portion of the heating and cooling loads come from latent heat (the energy stored in water when it changes from liquid to vapor) as well as sensible heat (the energy we feel as temperature). Greenhouses are intrinsically designed to meet as much of their thermal load as possible through passive heating from the sun, and to meet their cooling requirements through passive thermal management, ventilation, and evaporative cooling. However, the nature of greenhouse design makes them very expensive to heat in the winter when the solar resource is minimal. Some greenhouse operators in Colorado cannot afford the high fuel costs to maintain production through the winter, so they shut down part or all of their operations for three to five months of the year. The Colorado Department of Agriculture has already funded several projects to evaluate energy efficiency measures for greenhouses, ranging from practical to radical in design.
Energy Intersections visited a large greenhouse operation on the Front Range that operates year-‐round with about 900,000 square feet of conditioned space and another 50,000 square feet of unconditioned space among three facilities. Total energy costs can exceed $1.50 per square foot per year, with natural gas costs ranging from $600,ooo to $1.2 million per year, and electricity costs exceeding $250,ooo per year. The facilities use a variety of heating technologies depending on the type of growing space, all of which use natural gas. Heating systems include 11 atmospheric boilers—ranging from 100 to 400 boiler horsepower—that use above-‐ground, finned-‐tube hydronic (hot water) distribution or underground steam distribution; a forced-‐air furnace; and overhead infrared heating. Of these, the forced-‐air furnace is the least efficient type of heating system and infrared is the most efficient, but the underground steam distribution system is the most problematic. A small amount of the boiler heat is used to preheat groundwater for irrigation. Evaporative cooling and ventilation provide all of the active cooling, with thermal blankets (overhead shading) providing occasional passive assistance with thermal management throughout the year. Fan-‐coil heating systems are also widely used in greenhouses, but not at this particular operation.
Ground Source Heat Pumps for Simultaneous and Seasonal Heating and Cooling Energy Intersections worked with the greenhouse to obtain one year of natural gas and electric utility data to model the performance of renewable heating and cooling systems. EI collaborated with RE-‐Align Technology and Energy Environmental Corporation (EEC) to evaluate the feasibility of solar hot water and ground source heat pumps for greenhouse applications.
At these facilities, solar hot water is a technically viable option since the boilers provide temperatures ranging from 180° F to 240° F, but the space required for the panels and the size and cost of the thermal storage tank present challenges. Ground source heat pumps present some opportunities if the system can be optimized for both heating and cooling applications. The presence of evaporative cooling, however, complicated the modeling and analysis of the performance of the heat pump. Moreover, the utility data prevented a breakout of energy use by the fans in the evaporative cooling and ventilation systems as opposed to other applications. In addition, more information is needed to estimate the effect of a heat pump on humidity control. Without additional research and data collection, EEC could not provide a comprehensive model, but did supply a narrative assessment of this promising ground source heat pump (GSHP) application.

Colorado Department of Agriculture Renewable Heating & Cooling Roadmap December 15, 2013
Energy Intersections: Energy Strategy + Cross-‐Sector Collaboration 303.377.5006 • www.energyintersections.com Page 37 of 104
GSHP can provide system benefits in a greenhouse application in four primary ways.
1. Switching from forced-‐air to hydronic heating and cooling reduces the cost of moving energy.
2. Implementing radiant floor thermal distribution allows dual functionality for seasonal heating and cooling through the same distribution system, where
a. greenhouses with predominately earthen floors can enjoy a minimally disruptive installation with lower costs and
b. the high moisture content in such earthen floors is an effective thermal energy conductor and, therefore, increases the efficiency of this type of system.
3. Using a ground loop field (underground tubing) as a high-‐mass thermal sink provides passive cooling with ground water.
4. Simultaneous loads for heating and cooling reduce the size of the loop field and double the efficiency of both processes.
Air is a poor heat transfer fluid compared to water: fans need to work much harder than pumps to transfer the same amount of energy. A hydronic pump can reduce the cost of operating the fans for the evaporative coolers and ventilation system by as much as 85%. A heat pump can operate in either heating or cooling mode, depending on the seasonal or daily loads, to improve thermal management and reduce electric costs. In addition to providing savings in electric energy, the heat pump can reduce demand charges from running the fan motors. The following table demonstrates the potential energy savings of radiant cooling over a forced-‐air system that uses energy-‐efficient variable air volume (VAV) fans. Radiant hydronic cooling can save more than 40% of energy costs over the VAV system.
Table 9. Illustration of GSHP system energy savings over VAV ventilation system alone
Item % Power in VAV % Power in Radiant Cooling Fan and motor 37.5% 1.5%
Load from lights 18.8% 9.4%
Air transport load 9.3% 1.9%
Other loads 34.4% 34.4%
Pumps — 1.5%
Total 100% 57.7%
When greenhouse cooling is required, the GSHP can be operated in a passive cooling mode, in which groundwater is circulated by the pump and the compressor is in standby mode. For example, operating a 25-‐gallon per minute circulating pump alone could use 2 amps at 240 volts (480 watts) to deliver 125,000 Btu per hour (assuming 50° F ground water and 10° F temperature rise). In contrast, a 10-‐ton heat pump operating with the compressor would deliver the same BTUs per hour using 70 amps at 240 volts (16,800 watts), yet consume 35 times more energy to operate the compressor.
Besides radiant floor cooling of the greenhouses in the summer, the heat pump could also provide cooling for on-‐site cold storage of vegetables or other stock. The rejected heat produced by the cooling would be used to preheat boiler water or irrigation water. This type of GSHP system is currently in use at a commercial greenhouse in Altura, Minnesota (Lewein 2011).

Colorado Department of Agriculture Renewable Heating & Cooling Roadmap December 15, 2013
Energy Intersections: Energy Strategy + Cross-‐Sector Collaboration 303.377.5006 • www.energyintersections.com Page 38 of 104
In addition to these benefits, a ground source heat pump can be combined with a solar hot water system to reduce the size and cost of the thermal storage tank, an element that typically comprises more than 50% of the cost of the solar system. A split ground loop in the loop field allows excess heat from the solar panels, which is a limiting design factor for hot summer days, to be dumped into the ground instead of into an oversized tank.
Based on these guidelines, EEC estimates that a properly integrated ground source heat pump system that optimizes heating and cooling load management could provide a commercial greenhouse up to 20% annual energy savings with a simple payback of five years or less. As a radiant floor technology, this option could achieve the best economic performance in new construction applications in terms of incremental costs. As a retrofit, the cost of implementation is mitigated by the earthen floors in many greenhouses and the relatively minimal need for disturbing existing concrete.
Andrew Chiasson, PE, conducted a study of greenhouse heating applications using GSHP through the Oregon Institute of Technology for several climate zones around the U.S., including Denver, Colorado. It is not clear if this study accounted for any of the system benefits described by EEC (see numbered list above), such as increased efficiency from combined heating and cooling functions. Inclusion of these factors—if they have been left out—would enhance the economics shown in the figures below. Chiasson found that a GSHP system sized to meet 50% of peak heating load could actually handle more than 90% of the annual heating load. He also found that closed-‐loop GSHP is only feasible if loop installation costs are very low (less than $6 per foot) and natural gas costs are high. In fact, closed-‐loop GSHP for greenhouse applications are not feasible for natural gas prices below $0.60 per therm, as indicated in Figure 14 (Chiasson 2005).
On the other hand, open-‐loop GSHP systems, which show better ground heat exchanger performance, are less dependent on loop installation costs, as shown in Figure 15 (Chiasson 2005). In open loop systems, in which the tubing is open to underground well structures, water consumption occurs; it can be negligible or measurable, and may be subject to additional permitting requirements not seen with closed-‐loop systems.

Colorado Department of Agriculture Renewable Heating & Cooling Roadmap December 15, 2013
Energy Intersections: Energy Strategy + Cross-‐Sector Collaboration 303.377.5006 • www.energyintersections.com Page 39 of 104
Figure 14. Fraction of a GSHP system peak design load relative to the total peak load and indication of what fraction represents an economically feasible system (closed loop)

Colorado Department of Agriculture Renewable Heating & Cooling Roadmap December 15, 2013
Energy Intersections: Energy Strategy + Cross-‐Sector Collaboration 303.377.5006 • www.energyintersections.com Page 40 of 104
Figure 15. Fraction of a GSHP system peak design load relative to the total peak load and indication of what fraction represents an economically feasible system (open loop)

Colorado Department of Agriculture Renewable Heating & Cooling Roadmap December 15, 2013
Energy Intersections: Energy Strategy + Cross-‐Sector Collaboration 303.377.5006 • www.energyintersections.com Page 41 of 104
Beer Brewing Applications
Solar Heat Pump System with Ammonia Absorption Chiller Absorption chillers are driven by heat rather than by the electric power that drives most chillers and refrigeration systems. By combining a high-‐temperature solar hot water system with an ammonia-‐water absorption chiller, it is possible to reduce energy costs in applications with simultaneous heating and cooling loads. The cost and complexity of a solar heat pump with an absorption chiller can be high relative to other options, and the quality and quantity of chilled and hot water delivered by the system must be a good fit for the application in order for the system to make economic sense. Solar heat pumps are typically economical only for systems that require more than 50 tons of refrigeration and that exhibit large heating loads. Moreover, the intermittent nature of solar energy means that a backup boiler system must be installed, which increases the overall cost and complexity of the system.
Energy Intersections visited a large brewery in northern Colorado that is looking at expanding its cooling capacity. This effort would require replacing the existing equipment with a larger system that can deliver 100 tons of refrigeration. Since breweries also have large heating loads, the incremental cost of a solar heat pump for heating and cooling may be cost effective compared to the cost of an electric chiller and a natural gas-‐fired boiler system.
Energy Intersections worked with Chromasun, Inc., a company that specializes in high-‐temperature, concentrating solar heat pumps with single-‐effect ammonia-‐water absorption chillers, to provide a case study of a 100-‐ton chiller in a brewery application. Chromasun has previously evaluated similar applications in breweries and other industrial settings.
Chromasun’s analysis showed that the installed cost of the modeled system would be $1.64 million ($633,000 out-‐of-‐pocket). The system would save $134,000 per year in fuel costs for an estimated simple payback of 5.0 years. A graphical summary of the system design and performance is provided in “Appendix C: Beer Brewing/Storage Case Study Model” of this report.
Food & Beverage Storage Applications Solar thermal represents an ideal solution for warehouse heating, such as required in our brewery sector case study. The solar thermal system works as a preheat system on the heating return to the warehouse boiler or furnace. The temperature of this return flow is typically no higher than 100° F and can be as low as 50° F when part of the warehouse is maintained at low temperatures for cold storage. One of the subject brewery warehouses uses this low temperature heating approach. The operating ranges of these warehouses allow solar thermal to contribute to preheating while operating the solar thermal system at a low, efficient temperature.
There are three benefits of solar thermal preheat:
lower use of natural gas or propane which reduces the cost of energy for the warehouse;
reduced workload for the boiler or furnace, resulting in reduced wear and providing maintenance savings and extended life on the existing conventional heating equipment; and
environmental benefits due to reductions in the burning of conventional fuels.
The two existing warehouses in the EI case study consume a total of 20,000 therms per year. The savings due to solar thermal preheating can be significant.

Colorado Department of Agriculture Renewable Heating & Cooling Roadmap December 15, 2013
Energy Intersections: Energy Strategy + Cross-‐Sector Collaboration 303.377.5006 • www.energyintersections.com Page 42 of 104
Proposed Colorado Agricultural Renewable Heating & Cooling (RH&C) Program A Colorado Agricultural Renewable Heating & Cooling Program could begin in 2014 in a pilot phase. The first year would focus on the following activities:
connecting with producers in relevant sectors;
providing simple and inexpensive informational materials that would begin to build broad awareness of RH&Cs among agricultural producers and their many potential applications; and
installing demonstration projects that would give those producers who are exposed to RH&C information the opportunity to see the technologies in action, including
o several low-‐tech demonstration projects, and
o three to four installed advanced technology demonstration projects.
At the end of this first year, the pilot program would be evaluated for increased producer awareness, producer acceptance and interest in RH&C, and successful installation of demonstration projects.
Program Goals. A new Colorado Agriculture Heating & Cooling (RH&C) Program would have straightforward goals:
to aid Colorado agriculture producers in understanding their heating and cooling options;
to assist Colorado producers in implementing appropriate and cost-‐effective technologies to address heating and cooling requirements in their situations; and
to increase the deployment of both Low-‐Tech and Advanced RH&C technologies to the benefit of Colorado agricultural operations and communities.
See “2014 Colorado Agricultural RH&C Program Plans” below for an outline of timelines and targets.
Program Structure. The elements and sequence of the program will be familiar, being consistent with many rural community outreach programs, as shown in Figure 16.

Colorado Department of Agriculture Renewable Heating & Cooling Roadmap December 15, 2013
Energy Intersections: Energy Strategy + Cross-‐Sector Collaboration 303.377.5006 • www.energyintersections.com Page 43 of 104
Figure 16. Elements and flow of 2014 Colorado Agriculture RH&C Program
EI recommends that CDA support RH&Cs in the state at a level adequate to approach critical mass for RH&C to become the best practice where applicable, but not at so generous a level as to set unrealistic expectations for producers, nor to cannibalize CDA’s other budget priorities. Conceptually, this process should include incentivizing projects at a payback that is motivating for participants but does not give away too much funding. We estimate this payback period to be 5 years or less.
The program should provide initial exposure to RH&C information both for potential demonstration project hosts and for producers generally, operating in relevant sectors across the state that can optimize the benefits of these technologies. However, CDA should continue to recognize throughout the program that situational opportunities exist that do not correspond to the specified sectors. EI recommends that CDA program managers maintain open minds about opportunities based on producers’ particular situations, rather than limiting assistance exclusively to opportunities in specific sectors, as it is likely there are worthy projects not mapped out in this report. In further support of this open perspective, demonstration projects should vary by location, resource, and application type to support the educational goals and serve producers of all operation sizes across the state.
In addition, CDA needs to develop a mechanism for positioning RH&C expertise across the state. Today, much of this expertise—although not all—is located in the Front Range. This process may include serving as a matchmaker to bring rural HVAC and equipment services companies together with Front Range RH&C providers. Because Colorado enjoys an overdeveloped market in terms of RH&C expertise, there is no need for rural service companies to go to the considerable time and expense of developing that expertise in-‐house. Rather, CDA could develop a matching service in which rural service companies identify partners from the existing pool of RH&C specialists. Firms and expertise will then organically migrate to rural opportunities.
Awareness & Education
Demo Projects
Engineering Support
Subsidies/ Financing Deployment
Continuous Improvement/
Reporting

Colorado Department of Agriculture Renewable Heating & Cooling Roadmap December 15, 2013
Energy Intersections: Energy Strategy + Cross-‐Sector Collaboration 303.377.5006 • www.energyintersections.com Page 44 of 104
Program Elements
Awareness & Education Campaigns Energy Intersections recommends that the Colorado Department of Agriculture launch its RH&C education campaign at the same time that it embarks on the demonstration projects (see below). In the first year, this portion of the program would be small and limited in both financial and resource expenditures, focusing on the building of awareness of these technologies among producers.
The reason for conducting a limited awareness campaign while the demonstration projects are still underway is that marketing best practices acknowledge that many—typically over 20—“touches” or exposures to a new technology are required before business operators will begin to pay attention to the newly introduced option. By spending 5–15% of the first year budget on these activities, CDA will have set the stage for a much more successful unveiling of demonstration projects—RH&C will already be “on-‐the-‐radar” in the agricultural community. This will give the program a full year jump-‐start in garnering interest in the program and technologies, rather than waiting a year for completion of demonstration projects.
Components in the first year’s awareness campaign could include the following items.
A web “home” for the RH&C program on the CDA website immediately (which is then marketed through CDA, partner organizations, and press releases)
Basic descriptions of each technology and its benefits on the website (1 page max each)
Meeting schedules and short (1–2 page) takeaways on the website
Periodic updates on demonstration projects and their schedules on the website
Simple instruction sheets for installing the low-‐tech RH&C technologies (this measure has the potential to positively impact thousands of producers with very little effort and will get communities talking about RH&Cs) (2-‐4 pages max each)
Simple RH&C technology selection tool (2-‐4 pages max); see “Draft Outline for an RH&C Technology Selection Tool” below
2–4 conference calls describing the benefits of the program and the technologies with program partners, with Q&A
2–4 regional meetings (seminars, workshops, or coffee shop talks) that describe the program and technology benefits; these would be designed to reach producers in target RH&C demonstration project sectors, but would include brief overviews of the technologies that could serve large numbers of producers outside of the target sectors to draw broad interest
A good foundation for these work products has been laid in the Roadmap. All but one of these could be put together very quickly and inexpensively. The meetings are the most expensive and time consuming; however, if they could be attached to other events, that would make them faster and less costly to develop.
In the following year, a more robust informational and education campaign would be released. In effect, the cycle would be an upward spiral between awareness, demonstration projects, and education—building toward the appropriate implementation of RH&C as the standard best practice in Colorado agriculture.

Colorado Department of Agriculture Renewable Heating & Cooling Roadmap December 15, 2013
Energy Intersections: Energy Strategy + Cross-‐Sector Collaboration 303.377.5006 • www.energyintersections.com Page 45 of 104
Audience With limited resources, it will be important for CDA to reach producers efficiently. Therefore, collaborating with key organizations that can facilitate message delivery will be essential. Program introductions should be made to these partners through a kickoff meeting. Subsequently, web-‐based and print/PDF materials as well as producers’ opportunities to attend conference calls, webinars, coffee shop talks, and regional seminars should be disseminated through the target audience organizations.
Colorado Department of Agriculture website and distributed materials
Colorado Energy Office website
CSU Extension website, offices and communication channels
Rocky Mountain Farmers Union
Interested agricultural and electric co-‐ops and the Colorado Rural Electric Association
10 to 15 Key Sector Associations (including cattle, dairy, poultry, pork, fruit/orchard, other produce, feed production, breweries and wineries)
Producer service companies
Banks
Although not the target audience, Colorado organizations that encourage the deployment of renewable heating and cooling technologies such as the Colorado Renewable Energy Society and the Colorado Solar Energy Industries Association would be valuable partners in developing the desired content and messaging approach.
Producer Associations, Unions & Co-‐ops. These organizations will be crucial in piquing the interest and gaining the trust of Colorado agricultural producers, the target audience. Materials disseminated through these channels should be written or presented in accessible language. For example, producer-‐participants could teach the presenter what the heating and cooling issues are in their operations. Then, the presenter could offer a small set of solutions for exploration by the group. Finally, the group would come to conclusions together about which technologies make sense. This approach will help to put these audiences at ease, although other formats including clearly written brochures with good diagrams, coffee shop talks, Q&A with RH&C specialists could work well. This audience requires a moderately technical understanding of the options.
Producer Services Companies. These firms are important links in the capital decision making process for many producers. When the service firms can see firsthand that a particular RH&C technology makes sense in given situations, they will begin to offer it to clients during equipment upgrades as a matter of course. This audience requires the most technical understanding of the options.
Bankers also are a critical audience. Because this audience often makes the final financing decisions, it is important that they understand the benefits of RH&C technologies for their clients’ operations. While they may not need a highly technical understanding of these systems, they do need to know the basics of the technologies and the benefits to their clients’ bottom lines.
Content The awareness and educational content will need to address four themes.

Colorado Department of Agriculture Renewable Heating & Cooling Roadmap December 15, 2013
Energy Intersections: Energy Strategy + Cross-‐Sector Collaboration 303.377.5006 • www.energyintersections.com Page 46 of 104
Understanding Technology Basics
Selecting Appropriate Technology
Navigating Subsidies and Financing
Considering Permitting Issues
How the basic concepts are addressed for each technology will vary depending upon the audience. For producer organizations and producer service companies, the information will be somewhat more technical than for the financing audience. Nonetheless, the basic principles of addressing energy efficiency first, then understanding how the technology captures energy, and finally how energy is distributed, should be addressed. Simple diagrams and basic narratives presented clearly in various media will serve this purpose.
Technology selection should be guided by the principles identified in this report (see “Draft Outline for an RH&C Technology Selection Tool” below). Conceptually, these tools should address five items:
size and seasonality of the demand;
the heating and cooling situation in the producer’s operation (including any simultaneous heating and cooling);
the current resource(s) and technology deployed to meet those needs;
the age and remaining productive life of the current equipment; and
space and other physical installation considerations.
These educational pieces can be distributed primarily online and within key listed sectors. Where broadband distribution via the web is problematic, presentations can be reduced to PDFs or to slide shows. Where animation or video is important in broadband-‐constrained communities, inexpensive distribution via thumb drives can reach key individuals and target organizations.
Awareness-‐raising materials will be required to help producers (and possibly their bankers) navigate the myriad grant and loan options for which RH&C technologies qualify (see “Financing Matchmaking & Application Support” below). Basic materials should introduce the fundamentals of the most practical options, and should guide producers to CDA for further support in identifying programs and applying for the most appropriate grants and loans. To achieve the adequate sharing of support for the program, CDA could consider retaining the administrative activities in-‐house while contracting out for content development, or devise another approach for sharing the workload.
Tracks Three distinct yet related tracks of educational content will guide these audiences to the appropriate next steps for their situations: Do-‐It-‐Yourself (Low-‐Tech); Individual Technology Selection; Demonstration Project Participation.
Do-‐It-‐Yourself. The Low-‐Tech RH&Cs can be deployed by producers on their own. CDA can facilitate implementation of these technologies by providing simple instructions in brochure/PDF form and by making these instructions readily available. Short (3–10 minute) videos can encourage producers to act on these opportunities. Furthermore, CDA can promote the ease of installing these low-‐tech options by providing brief reference to the availability of easy-‐to-‐follow instructions during conference calls, webinars, and workshops that are being conducted for other purposes, such as to offer training to prospective demonstration project participants. Finally, CDA can implement several

Colorado Department of Agriculture Renewable Heating & Cooling Roadmap December 15, 2013
Energy Intersections: Energy Strategy + Cross-‐Sector Collaboration 303.377.5006 • www.energyintersections.com Page 47 of 104
low-‐tech demonstration projects, document the installation through video and other means, and share testimonials from the project participants. Project descriptions, benefits, and testimonials can be shared through instructional brochures, the CDA website, press releases, local and mass media, and social media channels such as Facebook, LinkedIn, Twitter, Pinterest, and blogs.
Technology Selection. This track can begin with RH&C technology basics delivered through online brochures, webinars, or through planned, non-‐broadband distribution to pique the interest of a wide array of producers and their service companies. That experience can be followed by regional workshops (as formal seminars or as coffee shop talks) on how to identify the most appropriate RH&C technologies for a variety of operational situations. Producers should also be able to access tools online to walk through their own technology feasibility and selection process, or to do so with their bankers. This track can “prime the pump” for Demonstration Project Participants.
Demonstration Project Participation. CDA can issue a call for producers in relevant sectors (e.g., dairy or pork operations, feed production, fruits and orchards), in order to identify producers interested in and willing to host demonstration projects. These producers can be gathered together by region and trained on RH&C technology basics, feasibility, selection, financing and permitting issues. This process will help to disseminate information about RH&Cs, generally, and to facilitate the identification of good candidate sites for demonstration projects. This track can be dovetailed with overlapping portions of the Technology Selection Track where timing allows. This track also should include a detailed look at financing options. Training can take place with an initial conference call followed by webinars and/or workshops.
Demonstration Projects Having effective, functional projects deployed in Colorado agricultural sectors will be crucial for helping CDA disseminate information about RH&Cs and for generating broad interest in these technologies. These projects will be essential in helping producers to understand the potential of renewable heating and cooling in their own operations. Therefore, it will be most effective to have demonstration projects implemented in tandem with the awareness phase of the educational program.
While it is not realistic for this Roadmap to state an unequivocal list of priorities for funding demonstration projects or ongoing incentives for RH&C installations, it is possible to state operational features that make prospects particularly well suited to RH&Cs and, therefore, more desirable for support from CDA. The features and combinations of features to target in order of priority, identified as tiers, are shown in Table 10, below.

Colorado Department of Agriculture Renewable Heating & Cooling Roadmap December 15, 2013
Energy Intersections: Energy Strategy + Cross-‐Sector Collaboration 303.377.5006 • www.energyintersections.com Page 48 of 104
Table 10. Operational features that identify three tiers of RH&C installation opportunities (Tier 1 is typically most technically and economically feasible)
Operational Feature Tier 1 Tier 2 Tier 3
Construction Type New Construction Full Replacement Retrofit
Current Fuel Type Propane Electric Heating Oil Diesel
Natural Gas
Application Type Hydronic (circulating water) Steam (<240° F with unpressurized storage tank) Hot Water
Forced Air Radiant Steam (>240° F with pressurized storage tank)
Evaporative Other
Heating/Cooling Cycle Simultaneous heating & cooling year-‐round Heavy heating or cooling year-‐round
Simultaneous heating & cooling seasonally (4 months or more) Moderate heating or cooling year-‐round
Seasonal heating or cooling (4 months or more)
For the 2014 pilot program, the following demonstration projects are recommended.
Low-‐Tech
o 2 or more geothermal tempering projects for stock water in cattle operations; nearly 12,000 cattle operations with additional livestock producers in the state
o 1 or more solar thermal assisted loafing shed structure(s); nearly 12,000 cattle operations with additional livestock producers in the state
o 2 or more thermal siphon installations on unconditioned outbuildings or shelters; over 37,000 producers in the state with outbuildings
o 1 or more passive nighttime cooling installation(s); over 37,000 producers in Colorado with outbuildings or other summertime cooling needs
Advanced Technology
o 1 ground source heat pump installation in a simultaneous heating and cooling situation
First choice: mid-‐sized dairy operating on propane and due for an equipment upgrade in the next 5 years (natural gas operation and longer upgrade horizon would be acceptable); a firm such as Dairy Specialists operating in northeastern Colorado would be a good resource for identifying a dairy in the desired situation; Colorado has over 400 dairies

Colorado Department of Agriculture Renewable Heating & Cooling Roadmap December 15, 2013
Energy Intersections: Energy Strategy + Cross-‐Sector Collaboration 303.377.5006 • www.energyintersections.com Page 49 of 104
Second choice: hydronic heating and cooling system for a mid-‐sized greenhouse (new construction or facility with earthen floors and due for equipment replacement)
Third choice: produce (fruits or vegetables) operation with simultaneous cooling for produce storage and heating for produce processes or for occupied structures, including domestic hot water; there are nearly 900 orchards in Colorado
o 1 solar thermal hot water installation in an operation with high-‐volume demand for mid-‐ to high-‐temperature water or steam
First choice: independent or feedlot-‐owned feed mill with a year-‐round base load demand of 5,000 therms and an operating temperature of 180–350° F; there are 10 feed mills in the state that produce more than 5,000 tons/year
Second choice: pork operation with year-‐round, high-‐volume demand for hot water for sterilization; there are over 1,200 pork producers in the state
o 1 solar air heating/ventilation installation in an operation requiring moderate to high volumes of air/frequent air exchanges, with or without an existing ventilation system
First choice: egg or meat poultry with thousands of birds (as the large egg producers make the transition to less dense housing of their birds to increase production, they will be in a good position to install solar air heating/ventilation; Colorado is home to 6 major layer operations and nearly 150 meat poultry
Second choice: a drying operation that is drying agricultural residues such as manure or fruit pulp for use as a secondary product, such as fertilizer, compost or biomass energy feed stocks; these operations would be particularly attractive in an area where residuals could be pooled from throughout a community, and feed stocks to the drying operation could be supplied year-‐round; the number of drying operations is unknown
It will be critical that these demonstration projects operate as anticipated and produce the expected results with minimal unforeseen problems or maintenance. For the Low-‐Tech projects, therefore, it will be important that CDA oversee the installation and perhaps provide very modest financial support to ensure that the job is done well. For the Advanced Technologies, it will be essential to vet the design, engineering, and installation firms thoroughly. It will also be important for CDA to work closely with these firms to ensure that the feasibility analysis, performance modeling, and project installations are of the highest quality, that they are a good fit for the operations in question, that they target the key sectors of interest, and that they result in robust projects that produce outstanding results. It would be worthwhile for CDA to invest more in these first three Advanced Technology demonstration projects than it ultimately plans to invest in a broader incentive program, in order to ensure the high performance and optimal operator quality of experience for these initial projects.
Permitting Considerations for Demonstration Projects and Other RH&C Installations Permitting for RH&C technologies varies greatly by county and municipality. In many cases, the local jurisdiction has not seen enough installations of these technologies to build a robust, consistent approach to their permitting. Therefore, permitting requirements can range from no requirements

Colorado Department of Agriculture Renewable Heating & Cooling Roadmap December 15, 2013
Energy Intersections: Energy Strategy + Cross-‐Sector Collaboration 303.377.5006 • www.energyintersections.com Page 50 of 104
to the requirement of several permits costing thousands of dollars and taking several months to acquire. The requirements also can change rapidly as jurisdictions become more familiar with the technologies.
RH&C systems may or may not require construction permits, electrical and plumbing inspections, or health, safety, or environmental permits from various local, state, or federal agencies. Dairies, in particular, must adhere to very strict federal regulations that specify virtually every aspect of their design and operation. Agencies that offer financial incentives for the installation of RH&C systems, such as tax credits, tax exemptions, or rebates, usually require a review and approval of the engineering assessment as part of the incentive application process. Some gas or electric utilities may require approval before the system can be installed. This requirement may be more stringent for municipal utilities, such as Colorado Springs Utilities, or investor owned utilities, such as Xcel Energy, than they are for rural electric associations. Nevertheless, rural electric associations may subject members to additional rules and restrictions imposed by the energy provider, such as Tri-‐State Generation and Transmission.
Unfortunately, there is no clear mechanism to map out this patchwork of requirements. However, local producers and installers who have experience deploying RH&C systems in a particular jurisdiction are ideal resources for learning what may be involved. Asking the local permitting office about their approach to these technologies before identifying a demonstration project site is also useful. Although it is by no means a hard and fast guideline, it is generally true that rural and agricultural communities require less permitting than urban communities. Mountain communities can be highly restrictive or very flexible in their permitting.
Technology Selection with Design & Engineering Support Technology selection for the Low-‐Tech RH&Cs is a relatively simple matter. In most cases, producers will be able to identify the appropriate technology for their situation using a brief analytic tool provided by CDA, from watching a short video on each technology or after attending a brief phone conference or webinar. From there, most producers will be able to implement the technologies.
Selecting from among the Advanced RH&C Technologies is a
more challenging matter and will require some support. Again, producers can do the initial work by using a simple analytic tool, watching short videos, or attending a remote meeting. These steps should help them identify whether there is a good fit among these technologies for their operation and which technology is the most likely candidate. Next, RH&C specialists will need to determine if the selected technology is, indeed, the best fit. This decision requires modeling, design, and engineering studies. These steps can be both time-‐intensive and costly. CDA can consider offering human resources (e.g., a single point of contact, like a project coordinator) and dollars to help producers get past this engineering hurdle. Educating producers about the steps involved will be
Figure 17. Installation of rooftop solar thermal panels

Colorado Department of Agriculture Renewable Heating & Cooling Roadmap December 15, 2013
Energy Intersections: Energy Strategy + Cross-‐Sector Collaboration 303.377.5006 • www.energyintersections.com Page 51 of 104
beneficial, but ensuring that they follow up and move through subsequent steps through a coordinator and/or through applying for and being awarded financial incentives will be essential for getting the projects completed.
Like permitting requirements, engineering costs will vary widely by project. For the Low-‐Tech RH&C technologies, engineering will generally not be required. In cases where a producer wishes to add a low-‐tech option to an existing system (e.g., ventilation), producers should consult with their equipment installer or other specialist. The producer will need to provide the design for the low-‐tech installation with the installer.
For smaller Advanced RH&C installations—systems that are similar in size to residential or small commercial installations—most installers will provide a free preliminary analysis. If this initial analysis includes an appropriate energy performance assessment and if the project does not require engineering by local jurisdictions, further engineering may not be required. For those smaller systems that do require some level of engineering, installers will generally wrap those costs into the overall project costs.
For larger Advanced RH&C installations, engineering is a major component of determining the fitness of a given system or combination of systems in a particular operation. This process includes an assessment to identify the appropriate heating and cooling equipment and processes, as well as review of several years of process-‐specific energy data, if possible. The data of interest include energy consumption and costs, peak demand, equipment capacities and equipment operating schedules. Although some energy data can be obtained from utility bill analysis, it may be necessary to supplement these data with more detailed measurements of the performance of the existing heating and cooling systems or subsystems, especially if the meter data include unrelated loads, such as lighting and motors, or other heating and cooling subsystems.
Components of the engineering assessment process may include feasibility analysis; energy audits; sizing, design, and layout of the proposed system; specification of the equipment; permitting; and commissioning. It is reasonable to expect the engineering assessment process to cost approximately one to five percent of the installed cost of a smaller system, and up to 15% of the installed cost of more complex systems that require stamped engineered drawings, detailed testing and analysis, and more costly permitting and commissioning. A preliminary feasibility assessment may be included at no cost as part of the initial quote for a ground source heat pump or solar hot water system, but the preliminary feasibility assessment should be verified through more detailed data analysis and performance modeling.
The feasibility analysis should include technical and economic feasibility. The technical feasibility analysis ensures that the proposed system is an appropriate fit for the facility and application, and identifies any potential problems that may be encountered during installation or operation, such as insufficient space for the installation, excessive structural loads, or health or safety concerns. The economic feasibility analysis uses energy performance modeling to compare the economic performance of the proposed system to a baseline. The baseline model may use energy data from the existing system or, in a new construction scenario, the estimated energy costs for a proposed conventional system. The energy performance model forecasts the energy savings from the RH&C system relative to the baseline. The energy performance model may be very sophisticated and include many technical and economic assumptions to calculate the estimated internal rate of return or present worth of the proposed system over the discount period.

Colorado Department of Agriculture Renewable Heating & Cooling Roadmap December 15, 2013
Energy Intersections: Energy Strategy + Cross-‐Sector Collaboration 303.377.5006 • www.energyintersections.com Page 52 of 104
The engineering assessment process includes other engineering services:
Identifying and evaluating energy efficiency measures and optimizing the existing system;
Sizing the system for optimal energy and economic performance, which is typically included as part of the performance modeling process;
Specifying equipment, including controls, interconnections, and technology providers;
Specifying the design, location, and layout of the system, including structural and other engineering requirements;
Permitting, which may include engineered drawings stamped by a Professional Engineer; and
Commissioning, which may include measurement and verification of system performance.
Some installers may offer a program in which the producer only pays for engineering if the producer chooses not to proceed with the project after engineering is completed. Others will require up-‐front payment; in these situations, EI advises that CDA assist with financing of engineering services.
Financing Matchmaking & Application Support Generally, there should not be a need to finance Low-‐Tech RH&Cs beyond minor support for a few preliminary demonstration projects. For Advanced Technologies, there are many possibilities for financing. It is important to note that for technologies in some economically viable applications, the out-‐of-‐pocket expense may be prohibitive as a cash or customary credit outlay. Incentives that reach a payback period acceptable to the producer or on-‐bill financing that results in no net change to cash flow (or an improved cash flow) should be the target. The EI team estimates that a 5-‐year payback period should be acceptable to most producers who can secure financing.
Again, it is important to note that the previous case studies assumed only existing incentives and did not assume any incentives through CDA.
CDA may choose to use a portion of its ACRE funding to support engineering studies or to install demonstration projects.
The Federal Investment Tax Credit provides businesses that purchase RH&Cs with a tax credit of 10–30% and the potential for accelerated depreciation on their RH&C systems. In cases where RH&Cs are a good fit today (e.g., a dairy currently using propane), these tax incentives alone can move the payback of a system into the 2–5 year range. Currently, these tax credits are set to expire in 2016.
The USDA REAP (Rural Energy for America Program at http://www.rurdev.usda.gov/BCP_Reap.html) offers both grants and loans for which these technologies are eligible. There are three components to REAP:
o grants and loans for producers and rural small businesses,
o an energy audit and renewable energy grant program, and
o a feasibility studies grant program.
CDA could assist producers with applying for a REAP grant or loan. In addition, CDA itself could apply for a grant to promote these technologies to producers.

Colorado Department of Agriculture Renewable Heating & Cooling Roadmap December 15, 2013
Energy Intersections: Energy Strategy + Cross-‐Sector Collaboration 303.377.5006 • www.energyintersections.com Page 53 of 104
CDA can help producers identify programs offered by the producers’ local rural electric associations. In the past few years, Delta-‐Montrose Electric Association has used what is effectively a power purchase agreement (see below) to assist their customers in installing ground source heat pump systems. CDA can leverage such programs around the state on behalf of producers by requesting program descriptions from the state’s REAs and publishing that information relevant to RH&Cs.
In the 2013 legislative session, the Colorado General Assembly enacted C-‐PACE, a commercial property-‐assessed clean energy financing statute. This program allows businesses to finance a capital investment in a clean energy system like solar thermal or ground source heat pumps through their property tax bills. The systems are designed so that the increase in the property tax is offset by the energy savings achieved by the system.
The Rural Utility Service (RUS) rules regarding the current incentives to Rural Electric Associations (REA) for installing carbon emission reducing projects have just been revised. These rules open up loan funds to RH&C projects in REA territories, even if they do not produce or offset any electricity. This exciting new funding source provides access to low-‐cost capital for the very applications discussed in this report—to be delivered by rural electric associations in their own territories.
Banks already serving agricultural producers are, of course, a natural source of financing for these projects. However, as bankers are typically unfamiliar with these technologies, CDA will need to educate bankers who serve rural clients on the benefits of these systems to their clients’ operations. A few Colorado lenders, such as Sooper Credit Union, already emphasize green energy loans and could provide insight into both banker training and dissemination to client bases.
Power purchase agreements (PPAs) and similarly structured equity financing are well known in the world of wind and solar electricity generation. While PPAs are not commonplace for RH&C projects, some developers are beginning to use them. Under a PPA, the producers would have the capital costs of a system paid for by an investor (a bank or an equity investor). The system includes an energy meter to determine how much energy the system is producing for heating or cooling. The investor owns the system and the producer pays the investor for the energy produced by the system as it is produced. Typically, the producers would pay for the energy at rates slightly below their current energy rates, thereby providing small, immediate savings and a buffer against volatile and increasing energy rates over time.
A structure similar to PPAs is energy performance contracting. These contracts are executed by energy service companies (ESCOs). Again, these structures are common for energy efficiency and electricity generation technologies, but there is promise for RH&Cs to use them as well. Essentially, the ESCO would assess which efficiency and renewable technologies are most applicable to the producer’s operation. They would then install those technologies using a performance contract under which the ESCO would finance the cost of the installations, and the producer would pay back that cost with payments that are offset by reduced energy costs.

Colorado Department of Agriculture Renewable Heating & Cooling Roadmap December 15, 2013
Energy Intersections: Energy Strategy + Cross-‐Sector Collaboration 303.377.5006 • www.energyintersections.com Page 54 of 104
Clearly, many options could fit a producer’s need for financing. CDA can develop a service that offers several benefits:
guides producers through the financing selection process;
helps producers complete grant, tax credit, and/or Federal loan applications; and
matches producers with appropriate bankers to address any remaining out-‐of-‐pocket costs.
Deployment Once demonstration projects are designed, CDA will want to keep close tabs on their construction and completion. It will be imperative to ensure that these projects progress in a timely manner and to the design specifications.
In addition, for those producers who choose to pursue projects that are not designated as CDA demonstration projects, it would be helpful for CDA to provide some guidance to help producers monitor deployment. Such a service may include providing a list of third-‐party RH&C installers, as well as a list of third-‐party commissioning services that can inspect and certify the system before it is brought online.
Reporting & Continuous Improvement Reporting on the demonstration projects can be made a requirement of those producers CDA chooses to host these projects. The monitoring of energy production can be largely automated, with appropriate meters and data collection tools. Once the data have been collected, the producers will need to deliver them with historical baseline and current utility data to CDA for verification that the demonstration project is performing as expected.
This accountability exercise is essential for ensuring that CDA’s time and money is well spent, and will likely garner positive testimonials from project participants. Once producers see the results, they will be able to understand better the benefits they are receiving.
Continuous improvement for this program can be as basic as collecting simple surveys from participants (on their awareness of RH&Cs and their satisfaction with the program), reviewing data from demonstration projects, determining where the program has been successful, and advising on how the program should be modified, if at all. If these steps are taken in each phase and fed forward into the next phase and into the assessment for the next year, the program will evolve productively.
Program Benefits The goals of the 2014 pilot program inherently confer benefits to the state. By helping Colorado agriculture producers identify the right RH&C opportunities for their operations, the program will improve profit margins for those producers. However, the program will yield additional benefits.
Job creation; for example, every 80 kW thermal equivalent of solar thermal capacity installed generates one direct full-‐time job equivalent and almost two-‐and-‐a-‐half indirect jobs
Reduction of greenhouse gas emissions from producer operations
Reduced exposure for producers to the volatility and increasing prices of fossil fuels, by virtue of a more diversified energy portfolio
Colorado Department of Agriculture Renewable Heating & Cooling Roadmap December 15, 2013
Energy Intersections: Energy Strategy + Cross-‐Sector Collaboration 303.377.5006 • www.energyintersections.com Page 55 of 104
Most of the job creation and economic activity would occur in rural areas where the producers are located. These benefits continue after the systems are installed by reducing tax burdens and expenses for these operations, improving margins, and reducing fuel price risk—all of which retain and recirculate more dollars in the community, which is the well-‐understood economic multiplier effect.
Program Costs The costs of the program will be dependent upon the delivery channels chosen, the reach and effectiveness of the awareness campaign, and the number of demonstration projects pursued. The amount of ACRE, REAP and other Federal funds acquired will impact the overall cost to CDA. Other state agencies, such as the Colorado Energy Office (CEO), the Office of Economic Development and International Trade (OEDIT), and the Colorado State University (CSU) Extension offices may be interested in supporting particular aspects of the program as well. Additional partners include renewable energy associations such as the Colorado Renewable Energy Society (CRES) and the Colorado Solar Energy Industries Association (COSEIA), although these non-‐profit organizations are more likely to provide in-‐kind support than cash. Preliminary budget targets should be assembled prior to the kickoff meeting, with more detailed costs and funding resources determined by this collaborative group.

Colorado Department of Agriculture Renewable Heating & Cooling Roadmap December 15, 2013
Energy Intersections: Energy Strategy + Cross-‐Sector Collaboration 303.377.5006 • www.energyintersections.com Page 56 of 104
2014 Colorado Agricultural RH&C Program Plans
Overview of 2014 Program Plans Proposed timeline and targets for the first year of the program to support these goals are as follows.
• January–February: Kickoff meeting to announce the program, garner support, and identify partners for the awareness campaign and demonstration projects; attendees would include representatives from the target organizations (see below).
• February–March: Identify demonstration project partners and sites (look for sites with minimal permitting requirements to speed time-‐to-‐completion for demonstration projects)
• March–April: Develop awareness materials and set delivery schedules
• March–May: Design demonstration projects
• April–September: Install demonstration projects
• May–October: Deliver awareness materials
• November–December: Wrap up activities and assess program progress
Draft Agenda for Colorado Agricultural RH&C Planning Meeting, with Target Organizations The purpose of the kickoff meeting is to establish a collaborative approach to statewide implementation of appropriate Renewable Heating & Cooling technologies.
Target Organizations
Colorado Department of Agriculture
Colorado Energy Office
Colorado State University Extension offices
Rocky Mountain Farmers Union
Interested Co-‐ops (farmers and energy organizations)
Colorado Renewable Energy Society
Colorado Solar Energy Industries Association
USDA Regional Business and Cooperative Programs (REAP)
10 to 15 Key Sector Associations (including cattle, dairy, poultry, pork, greenhouses, fruit/orchard/other produce, feed production, breweries and wineries)
Producer Service Companies (e.g., Dairy Specialists)
Banks (e.g., CoBank, local credit unions)
State Senators and Representatives from regions with possible demonstration sites
Colorado Department of Agriculture Renewable Heating & Cooling Roadmap December 15, 2013
Energy Intersections: Energy Strategy + Cross-‐Sector Collaboration 303.377.5006 • www.energyintersections.com Page 57 of 104
Time Topic
8:00 AM Registration and Conversation
8:30 AM Welcome, Introductions and Agenda
9:00 AM Review of Key Opportunities for RH&C in Colorado Agriculture
9:30 AM Break
9:45 AM Breakout Groups to Discuss Different Sectors and Their Match with Different RH&C Technologies
10:45 AM Reconvene and Recommended Next Steps for a CDA RH&C Program
11:45 AM Wrap Up and Assignment of Follow Up Tasks
Draft Outline for an RH&C Technology Selection Tool 1. Assess current energy usage for heating and cooling
a. Review two years’ or more worth of process-‐specific energy data
i. Estimate amount of energy (e.g., therms) used for heating and cooling
ii. Estimate cost of energy for heating and cooling
iii. Estimate peak demand and demand charges
b. Identify variations in heating and cooling (is the requirement year-‐round or starkly seasonal)
i. Identify heating and cooling cycles and schedules
ii. Note equipment capacities
iii. Note equipment efficiencies
c. Does heating and cooling happen at the same time in buildings close to each other?
d. Is there a year-‐round demand for a lot of heat (e.g., hot water or steam) but not much cooling?
e. Is there a lot of excess heat (year-‐round) and nothing to do with it? Is there a moderate cooling requirement?
f. Is there a need for heated air, heated ventilation or drying? How about summertime air cooling?
g. Identify existing energy resources, equipment, and processes involved in heating and cooling
2. Can any of these costs reasonably be mitigated by energy efficiency measures not yet employed? If yes, install those measures first.
3. Will any of the Low-‐Tech RH&Cs mitigate these costs? If yes, install those next.

Colorado Department of Agriculture Renewable Heating & Cooling Roadmap December 15, 2013
Energy Intersections: Energy Strategy + Cross-‐Sector Collaboration 303.377.5006 • www.energyintersections.com Page 58 of 104
a. Passive design
b. Energy recovery
c. Economizers
d. Thermo-‐siphon
e. Other measures
4. Is there still a substantial heating and cooling load? If yes, then examine Advanced RH&Cs.
a. Were the therms and dollars identified in 1.a. in the thousands and tens of thousands respectively? If yes, there is a good case for exploring Advanced RH&Cs further.
b. Are heating and cooling required for at least half of the year (1.b.) ? If yes, continue the exploration.
c. If 1.c. is Yes, explore ground source heat pumps further.
d. If 1.d. is Yes, explore liquid-‐based solar thermal systems further.
e. If 1.e. is Yes, explore ground source heat pump or solar thermal cooling systems (the heat can be used to power cooling).
f. If 1.f. is Yes, explore solar air systems.
g. Review your list of energy resources, equipment, and processes against the attached evaluation list to further refine your RH&C technology selection.
5. Specific Opportunities: Technology Evaluation List
This section of the Selection Tool will offer a list of potential technologies (including low-‐tech and advanced options) paired with clearly matched sectors (e.g., GSHP with dairies and greenhouses; solar thermal with feed mills). This section offers a quick checklist for producers to use as a double check of their preliminary selection of a technology.

Colorado Department of Agriculture Renewable Heating & Cooling Roadmap December 15, 2013
Energy Intersections: Energy Strategy + Cross-‐Sector Collaboration 303.377.5006 • www.energyintersections.com Page 59 of 104
Overview of Technologies to Watch in the Future Renewable Heating & Cooling technologies such as liquid-‐based solar thermal, solar air heating and cooling, and ground source heat pumps are mature technologies struggling in immature industries. Programs like a Colorado Agriculture RH&C Program will help these industries to mature more quickly than they could without such activity. At the same time, technological advances will continue to improve existing technologies and bring new ones to the commercial marketplace. Following is an overview of just a few of the technologies we expect to advance in RH&C in agricultural settings over the next decade.
Biomass Combustion, Digestion or Pyrolysis for Heat Production Conceptually, there should be a synergistic relationship between agricultural production and the production of energy from biomass. Agriculture is an important source of biomass feed stocks, including corn and soybean oil for biofuels, corncobs and stover for pellet fuels, and manure for biogas. Although most legislative and public attention on biomass focuses on the production of biofuels for transportation, about 90% of bioenergy comes from the direct combustion of biomass for heat and power. Moreover, biomass is the only renewable source of carbon-‐based fuels and chemicals. In a report for the ACRE program entitled “Developing a Bioenergy Fuel from Manure and Other Agricultural Byproducts,” iCAST estimated that the harvestable amount of straw from winter wheat production in Colorado amounts to 2.9 million tons per year, and the harvestable amount of manure amounts to 2.7 million tons per year, enough combined biomass to offset 1.3 million tons of coal per year and generate almost 40o MW from biomass co-‐firing, in which biomass is combusted with conventional resources like coal to produce electricity (iCAST 2011).
The Colorado Department of Agriculture has already provided extensive funding of bioenergy research, feasibility studies, and participation projects through the ACRE program. Bioenergy technologies funded by the program range from developing new oilseed crops and algae reactors, to the construction of new biodiesel production facilities, biomass gasifiers, and utility-‐scale anaerobic digesters, to the production of torrefied wood and biochar from energy crops and agricultural residues. While this investment has produced valuable insight into the opportunities and potential for biomass development in Colorado, CDA has decided to focus ACRE program resources on the potential opportunities and impacts of other renewable energy technologies thus far.
At the federal level, funding and mandates have pushed corn ethanol production to a Renewable Fuels Standard target level of nearly 14 billion gallons per year (EIA 2013). Intensive research also has been focused on the production of advanced biofuels and biochemicals, including cellulosic ethanol and biobutanol. Development of commercially viable integrated biorefineries (IBRs) has been a longstanding goal of both the bioenergy industry and the DOE as a pathway for the sustainable, integrated production of heat and electric power, biofuels, and biochemicals from cellulosic biomass. Under the aegis of the Bioenergy Technologies Office, this goal has begun to materialize in recent years, resulting in more than 19 active integrated biorefineries in the U.S. as of July 2013 (DOE EERE 2013).
Several private companies involved in the development, construction, and operation of IBRs have located their headquarters in the Denver metro area. These companies include GeoSynFuels, LLC, which specializes in cellulosic ethanol and biochemicals; Gevo, Inc., which specializes in the production of the advanced biofuel, isobutanol; and Cool Planet Energy Systems, which specializes in

Colorado Department of Agriculture Renewable Heating & Cooling Roadmap December 15, 2013
Energy Intersections: Energy Strategy + Cross-‐Sector Collaboration 303.377.5006 • www.energyintersections.com Page 60 of 104
the production of green gasoline and biochar from lignocellulosic materials such as beetle-‐killed pine trees.
These companies appear to be well funded through private and public investors and do not need the support of funding from the ACRE program. Nonetheless, EI perceives an opportunity for the Colorado Department of Agriculture to facilitate relationships and the development of new markets between agricultural producers and companies like these. One potential pathway for this role is outreach and education through the ACRE program.
Beyond facilitating good relationships and agricultural markets for advanced biofuels production, EI suggests that CDA take advantage of its legacy of biomass research when appropriate. Mature biomass technologies that have shown the greatest potential viability in the past but are less viable in current market conditions, such as biodiesel and anaerobic digestion, may benefit from financial assistance through the ACRE program with the appropriate project partners and in consideration of evolving market conditions. One strategy that could promote the effective use of ACRE funds for RH&C projects would be to emphasize the use of ACRE funds to leverage other private, state, and especially federal funding sources, rather than as the primary source of project funding.
Solar (PV and Thermal) Combination Systems An innovative new product produces combined heat and power in one simple module: the PV-‐Therm combination module. This product will be an ideal solution for facilities that need high volumes of low-‐pressure hot water plus electricity in industries such as pork, food processing, and biofuel operations.
Designed with a photovoltaic laminate superimposed on a thin, flat, metallic heat exchanger, this technology simultaneously heats water to 130–150° F while removing heat from the PV cells to generate electricity more efficiently. A 200 W PV module can produce up to 715 W of thermal power as well, reaching up to 88% total module efficiency. As an added bonus in snow country, brief flow reversal can be applied to momentarily heat the panels to melt snow off of the modules, returning the system to operation in a matter of minutes rather than days.
Currently, only a few companies make these products, including one each in Germany, Turkey, Israel, and Spain, plus one in Osgood, Indiana, USA. The USA product from SolarZentrum North America is transferred from proven, award-‐winning German technology, carries industry-‐standard 5/25 year warranties, and is fully certified for US safety and performance. We expect these systems to begin appearing more frequently and to become industry standard equipment in relevant agricultural settings in the next 5 to 10 years.

Colorado Department of Agriculture Renewable Heating & Cooling Roadmap December 15, 2013
Energy Intersections: Energy Strategy + Cross-‐Sector Collaboration 303.377.5006 • www.energyintersections.com Page 61 of 104
Conclusions Colorado agricultural producers clearly face millions of dollars in heating and cooling costs. Further, despite the fact that Renewable Heating & Cooling (RH&C) technologies may offer cost savings and can buffer producers from energy price shocks, most producers in the state do not have a clear understanding of how these technologies can benefit their operations.
CDA is well positioned to deliver a program that achieves the following goals:
aids Colorado agriculture producers in understanding their heating and cooling options;
assists Colorado producers in implementing appropriate and cost-‐effective technologies to address heating and cooling requirements in their situations; and
increases the deployment of both Low-‐Tech and Advanced RH&C technologies to the benefit of Colorado agricultural operations and communities.
To achieve these goals, CDA can undertake a 2014 Colorado Agriculture Renewable Heating & Cooling Program. The program would include the components below.
An awareness campaign for producers, their service companies, and bankers on the technology basics (including benefits) and technology selection
Demonstration projects that support the awareness campaign
o several low-‐tech projects could quickly be installed in relevant sectors
o three Advanced RH&C projects would be pursued:
1 ground source heat pump installation in a simultaneous heating and cooling situation, such as a dairy, greenhouse, or produce operation with storage
1 solar thermal hot water installation in an operation with high-‐volume demand for mid-‐ to high-‐temperature water or steam, such as a feed mill or pork operation
1 solar air heating/ventilation installation in an operation requiring moderate to high volumes of air/frequent air exchanges, with or without an existing ventilation system, such as a poultry or drying operation
Engineering support to help producers overcome the significant design and engineering hurdle for advanced systems
Navigation of subsidies and financing
Producer monitoring and reporting, with continuous program improvement
While targeting efforts to specific sectors with clearly achievable RH&C opportunities will be the crux of the program, it is important maintain two other outlooks in the perspective on the Colorado Agriculture RH&C Program. First, building a broad awareness of the full spectrum of technologies through low-‐cost and easily accessible channels—such as Web-‐delivered instruction sheets, conference calls and coffee shop talks—will reinforce efforts to undertake bigger projects in specific sectors. When the groundwork is laid of establishing RH&Cs as an important topic and the whole community is discussing the opportunities within these technologies, it is easier to help a producer see the value in moving to the next step with a more advanced technology.

Colorado Department of Agriculture Renewable Heating & Cooling Roadmap December 15, 2013
Energy Intersections: Energy Strategy + Cross-‐Sector Collaboration 303.377.5006 • www.energyintersections.com Page 62 of 104
Second, these technologies have many achievable opportunities that are situation-‐driven rather than sector-‐driven. Good economic opportunities for Advanced RH&C technologies exist across Colorado in cases where heat and cooling occur simultaneously, where a lot of hot water or steam is required year round, or where high volumes of heated air are moved through an operation daily. While it will be important to focus on specific sectors in the pilot program to maximize resources, it will be equally important for CDA to keep an open mind about producers outside of those sectors who have situations that genuinely match the technologies.
With this approach and through drawing upon both expertise and financial resources from other federal and state organizations, CDA can assemble a program that will bring RH&Cs closer to a market transformation in Colorado and provide national leadership on the economic implementation of these technologies in agriculture. Most importantly, however, CDA will be helping a broad range of producers—in terms of scale, numbers, and sectors—to improve the economics of their operations. These efforts will dovetail with CDA’s concurrent efforts to increase the deployment of small hydro and energy efficiency technologies in Colorado agriculture. By approaching these seemingly disparate technologies as an integrated whole, the Colorado Department of Agriculture will contribute greatly to the economic competitiveness of Colorado’s agriculture.

Colorado Department of Agriculture Renewable Heating & Cooling Roadmap December 15, 2013
Energy Intersections: Energy Strategy + Cross-‐Sector Collaboration 303.377.5006 • www.energyintersections.com Page 63 of 104
Bibliography API Statistics Department. 2011 Sales of Natural Gas Liquids and Liquefied Refinery Gases. Bi-‐annual energy report, Statistics Department, American Petroleum Institute, Washington, DC: American Petroleum Institute, 2013.
Blinde, Bette, interview by Leslie Martel Baer. Staff, Colorado Egg Producers Personal communication by telephone., (Sep 11, 2013).
Bony, Paul, Al Wallace, and Joel Poppert, interview by Leslie Martel Baer, Samuel J. Anderson and Becky English. Personal communication by telephone., (Aug 09, 2013).
Brown, Bonnie, interview by Becky English. Executive Director, Colorado Wool Growers Association (Nov 2013).
Carlson, John, interview by Becky English. Executive Director, Colorado Brewers Guild Personal communication by telephone., (Sep 13, 2013).
Caskey, Doug, interview by Becky English. Executive Director Perosnal communication by telephone., (Sep 13, 2013).
Chiasson, PE, Andrew. Greenhouse Heating with Geothermal Heat Pump Systems. Klamath Falls, OR: Oregon Institute of Technology, 2005.
Colorado Division of Water Resources. "Records Search." Colorado Division of Water Resources. 2013. http://dwrweblink.state.co.us/dwrweblink/search.aspx?dbid=0 (accessed 2013).
Dever, Lauren, interview by Becky English. Executive Director, Colorado Pork Producers Council (Oct 2013).
DOE EERE. Integrated Biorefineries Map. 2013 йил 23-‐September. http://www1.eere.energy.gov/bioenergy/integrated_biorefineries.html (accessed 2013 йил 5-‐December).
—. Search. U.S. Department of Energy Office of Energy Efficiency & Renewable Energy. 2013. http://dsireusa.org/searchby/index.cfm?ee=1&re=1 (accessed 2013).
Dorminey, Bruce. "Are Beer and Cigarettes the New Bioenergy?" Renewable Energy World, Jul 13, 2013.
Ehrlich, Jim, interview by Becky English. Executive Director, Colorado Potato Administrative Committee Personal communications by telephone., (Sep 13, 2013).
EIA. "Colorado: State Profile and Energy Estimates: Table CT6. Industrial Sector Energy Consumption Estimates." U.S. Energy Information Administration. 2011. http://www.eia.gov/state/seds/data.cfm?incfile=/state/seds/sep_use/ind/use_ind_CO.html&sid=Colorado (accessed 2013).
—. "Colorado: State Profile and Energy Estimates: Table ET5. Industrial Sector Energy Price and Expenditure Estimates." U.S. Energy Information Administration (EIA). 2011. http://www.eia.gov/state/seds/data.cfm?incfile=/state/seds/sep_prices/ind/pr_ind_CO.html&sid=Colorado (accessed 2013).
—. "Glossary: Industrial Sector." U.S. Energy Information Administration (EIA). 2013. http://www.eia.gov/tools/glossary/index.cfm (accessed 2013).
—. Today in Energy: U.S. ethanol production and the Renewable Fuel Standard RIN bank. 2013 йил 5-‐June. http://www.eia.gov/todayinenergy/detail.cfm?id=11551 (accessed 2013 йил 9-‐December).
Gerace, Mark, interview by Samuel J. Anderson. CFO, Welby Gardens (Oct 2013).
Gilbert, Dallas, interview by Samuel J. Anderson. Owner, Eastern Plains Natural Foods (Nov 15, 2013).
Hammerich, Bill, interview by Becky English. Colorado Livestock Association (Oct 2013).
Hanavan, Darrell, interview by Becky English. Executive Director, Colorado Wheat Administrative Committee Personal communications by telephone., (Sep 05, 2013).

Colorado Department of Agriculture Renewable Heating & Cooling Roadmap December 15, 2013
Energy Intersections: Energy Strategy + Cross-‐Sector Collaboration 303.377.5006 • www.energyintersections.com Page 64 of 104
Harris, Sharon, interview by Leslie Martel Baer. Executive Director Personal communication by telephone., (Aug 05, 2013).
Hawkins, Grant, interview by Leslie Martel Baer, Samuel J. Anderson and Becky English. Proposal Manager Personal communication., (Aug 26, 2013).
iCAST. “Developing a Bioenergy Fuel from Manure and Other Agricultural Byproducts.” Lakewood, 2011.
Kingston, Bob, interview by Samuel J. Anderson. President, RE-‐Align Technology (Sep 2013).
Lewein, Jenna. No Winter at Whitewater Gardens Farm: Geothermal Greenhouse Project in Altura, MN. 2011 йил August. http://www.cleanenergyresourceteams.org/publication/no-‐winter-‐whitewater-‐gardens-‐farm-‐geothermal-‐greenhouse-‐project-‐altura-‐mn (accessed 2013 йил 6-‐December).
Marron, Todd, and Byron Felske, interview by Leslie Martel Baer. Conserval Engineering Personal communication by telephone., (Aug 13, 2013).
Meillon, Laurent, interview by Leslie Martel Baer, Samuel J Anderson and Becky English. Director Personal communication by telephone., (Aug 09, 2013).
Menke, Stephen, interview by Becky English. Colorado State Enologist, Colorado State University Personal communications by telephone., (Sep 11, 2013).
Merrigan, Tim, and Danny Parker. "Solar Thermal Technology. Presentation to the Colorado Public Utilities Commission, Denver, Colorado. ." National Renewable Energy Laboratory and Florida Solar Energy Center. July 08, 2010. https://www.dora.state.co.us/pls/efi/efi_p2_v2_demo.show_document?p_dms_document_id=52870.
Midcap, Bill, interview by Becky English. Director of External Affairs, Rocky Mountain Farmers Union (Sep 2013).
Miranowski, John, interview by Leslie Martel Baer. Professor of Economics, Iowa State University (Nov 08, 2013).
Naranjo, Robert D., Sarah Ruen Blanchard, Tony Frank, and Garrett Shields. Colorado Agricultural Energy Market Research. Colorado Energy Office, State of Colorado, Denver, CO: BCS Incorporated, 2013.
National Agricultural Statistics Service Colorado Field Office. Colorado Agricultural Statistics 2012. Government, Denver: NASS: National Agricultural Statistics Services, 2012.
Newton, Mona, interview by Becky English. Executive Director, Community Office for Resource Efficiency (CORE) Personal communication by telephone., (Sep 2013).
Potter, Tom, and Michael Bowman, interview by Leslie Martel Baer, Samuel J. Anderson and Becky English. Personal communication by telephone., (Aug 09, 2013).
Ruiz, Gerardo, interview by Leslie Martel Baer. Business Development Manager Personal communication by telephone., (Aug 07, 2013).
Schork, Robert, interview by Becky English. Executive Director, Colorado Dry Bean Association Personal communication by telephone., (Aug 2013).
Sorensen, Randy, interview by Samuel J. Anderson. Dairy Specialists (Nov 25, 2013).
Swenson, Scott, interview by Leslie Martel Baer. American Clay Supplies Personal communication by telephone., (Aug 07, 2013).
Szidon, Kim, interview by Sam Anderson. Ranch-‐Way Feeds General Manager (Dec 13, 2013).
U.S. DOE EERE. "Industrial Distributed Energy." U.S. Department of Energy Energy Efficiency and Renewable Energy. 2013. http://www1.eere.energy.gov/manufacturing/distributedenergy/projects_sector.html (accessed 2013).
USDA. 2007 Census of Agriculture. Census, Available at http://www.agcensus.usda.gov/index.php, Washington, D.C.: U.S. Department of Agriculture, 2009.

Colorado Department of Agriculture Renewable Heating & Cooling Roadmap December 15, 2013
Energy Intersections: Energy Strategy + Cross-‐Sector Collaboration 303.377.5006 • www.energyintersections.com Page 65 of 104
Vervier, Jennifer, interview by Becky English. Director of Strategy and Sustainability, New Belgium Brewery Personal communication by telephone., (Sep 11, 2013).
Wallace, Al, interview by Samuel J. Anderson. President, Energy Environmental (Oct 2013).
Western Dairy Association. Innovation Center for U.S. Dairy. 2013. http://www.usdairy.com/Sustainability/Pages/Home.aspx (accessed 2013).

Colorado Department of Agriculture Renewable Heating & Cooling Roadmap December 15, 2013
Energy Intersections: Energy Strategy + Cross-‐Sector Collaboration 303.377.5006 • www.energyintersections.com Page 66 of 104
Appendices
Appendix A: Dairy Case Study Models
Profile of Average Dairy Operations & Energy Use
Average dairy in Colorado: 1000 cows milked 3 times per day (4000 cows in this case study)
Milking Parlor operates 24 hrs/day
Milking time is approximately 7.25 hrs. and system wash is performed in 45 minutes. This happens 3 times per day.
The largest volume of hot water is used during the 45-‐minute wash time so water heating systems are typically designed with large storage tanks (750 to 1000 gallons) and smaller boilers—395,000 BTU/hr, generally around 85% efficient.
Most dairies have 4 to 6 Fre-‐Heaters® that preheat the water prior to the boiler system using the Freon from the milk cooling system. Each Fre-‐Heater® is 120 gallons.
The milking parlors are hard to heat and you really don’t want to warm the cows and send them back outside too warm, so parlor heating focuses on concrete floors under the milkers’ pit with in-‐floor radiant hot water heat.

Colorado Department of Agriculture Renewable Heating & Cooling Roadmap December 15, 2013
Energy Intersections: Energy Strategy + Cross-‐Sector Collaboration 303.377.5006 • www.energyintersections.com Page 67 of 104
Flat-‐Plate Solar Hot Water System
Solar System Financial ProformaSS Version: 1.1
Project InformationNortheast Colorado
Date: 12/2/2013 Version: Concept Prepared By: Bob Kingston
FALSE
Site Financial Metrics
Opty Cost of Captial: 7% After-Tax OCC: 4.2%
Csh Flo Discount Rate: 0% Finance Interest Rate: 5.5%
General Inflation Rate: 2% Performance Incentive: 0.00 $/kWHr
Income Tax Rate: 40% Local Incentive: $0
Yr 1 Fed Tax Credit: 30% Fed Dep Cost Basis %: 85.00%
State Tax Credit: 0% Fed Yr 1 Dep'n %: 34.00%
State Credit Prd (yr): 0 Fed Yr 2-5 Dep'n %: 12.75%
State Credit Cap: $0 Max Payback Period: 5 yr
USDA REAP Grant: 0% Std Equip Dep'n Prd: 5 yr
Site Fossel Fuel
Type: Propane Unit: Gallons BTU/Unit 91,000
CO2/Unit: 17.02 mt/BBTU Prsnt $/Unit: $1.50 Inflation %: 5%
Existing (Base) System Metrics
Est Purchase Price: $0 Financed Amount: $0
$66,573 Finance Term: 10 yr
Existing Salvage Value: $0 Salvage Year: 10 yr
Major Replacement: $25,000 Major Rplcmt Interval: 10 yrs
Annual Service Agrmt: $500 Present Fuel Use/Yr: 33,850 Gallons
Annual Fuel Cost: $50,775 Carbon Emission/Yr: 52.4 mt
Alternative System Metrics
Est Purchase Price: $264,000 Financed Amount: $0
New Salvage Value: $26,400 Finance Term: 10 yr Net Out-of-Pocket:$95,040
Cost Avoidance: -$2,000 Salvage Year: 20 Total Fed Tax Credit:$79,200
Annual Service Agrmt: $500 Cost Avoidance Interval: 1 yrs Renewable Sys Dep'n:$89,760
Annual kWHr Income: $0 Future Fuel Use/Yr: 14,566 Gallons Total State Tax Credit:$0
Annual Fuel Savings: $28,926 Annual kWHr Prod: 0 kWHr Local Incentive: $0
Annual Fuel Cost: $21,849 Carbon Emission/Yr: 22.6 mt USDA REAP Grant: $0
Total Fed Tax Credit: $79,200 Local Incentive: $0
Total State Tax Credit: $0 Renewable Sys Dep'n: $89,760
USDA REAP Grant: $0
Net Out-of-Pocket: $95,040
Proposed System Financial Performance
After-Tax Cash Flow Net 20 Year Net Present Value (NPV)
Existing (Base) System NPV (The Do Nothing Alt): ($19,729)
Alternative System NPV: $266,561
Alternative System Net Present Beneift: $286,290
After-Tax Cash Flow Internal Rate of Return (IRR)
Base System: 4.2%
Alternative System: 19.4%
Simple Income - Expence Paybk Base Alternative
Discounted At 0% 17.43 yrs 2.72 yrs
ATCF Based Payback Base Alternative
Discounted At 0%: 17.43 yrs 3.96 yrs
A Comparative Analysis
Location:Customer: Energy Intersections
($200,000)
$0
$200,000
$400,000
$600,000
$800,000
$1,000,000
Yr 1 Yr 2 Yr 3 Yr 4 Yr 5 Yr 6 Yr 7 Yr 8 Yr 9 Yr 10
Yr 11
Yr 12
Yr 13
Yr 14
Yr 15
Yr 16
Yr 17
Yr 18
Yr 19
Yr 20
Simple Income-Expense Analysis
Alternate Base
($200,000)
($100,000)
$0
$100,000
$200,000
$300,000
$400,000
$500,000
Yr 1 Yr 3 Yr 5 Yr 7 Yr 9 Yr 11 Yr 13 Yr 15 Yr 17 Yr 19
After-Tax Cash Flow Analysis
Alternative Base
$0.00
$0.50
$1.00
$1.50
$2.00
$2.50
$3.00
$3.50
$4.00
Yr 1 Yr 3 Yr 5 Yr 7 Yr 9 Yr 11 Yr 13 Yr 15 Yr 17 Yr 19
20 Year Per-Unit Fuel Price Projection
Propane
36%
30%
34%
0% 0%
Milking Building System Funding Breakdown
Net Out-of-Pocket: Total Fed Tax Credit: Renewable Sys Dep'n:
Total State Tax Credit: Local Incentive:
Propane
Incremental Alternative - Base Payback
1 of 1

Colorado Department of Agriculture Renewable Heating & Cooling Roadmap December 15, 2013
Energy Intersections: Energy Strategy + Cross-‐Sector Collaboration 303.377.5006 • www.energyintersections.com Page 68 of 104
Solar System Financial ProformaSS Version: 1.1
Project InformationNortheast Colorado
Date: 12/2/2013 Version: Concept Prepared By: Bob Kingston
FALSE
Site Financial Metrics
Opty Cost of Captial: 7% After-Tax OCC: 4.2%
Csh Flo Discount Rate: 0% Finance Interest Rate: 5.5%
General Inflation Rate: 2% Performance Incentive: 0.00 $/kWHr
Income Tax Rate: 40% Local Incentive: $0
Yr 1 Fed Tax Credit: 30% Fed Dep Cost Basis %: 85.00%
State Tax Credit: 0% Fed Yr 1 Dep'n %: 34.00%
State Credit Prd (yr): 0 Fed Yr 2-5 Dep'n %: 12.75%
State Credit Cap: $0 Max Payback Period: 5 yr
USDA REAP Grant: 0% Std Equip Dep'n Prd: 5 yr
Site Fossel Fuel
Type: Natural Gas Unit: Therms BTU/Unit 100,000
CO2/Unit: 14.47 mt/BBTU Prsnt $/Unit: $0.65 Inflation %: 4%
Existing (Base) System Metrics
Est Purchase Price: $0 Financed Amount: $0
$25,297 Finance Term: 10 yr
Existing Salvage Value: $0 Salvage Year: 10 yr
Major Replacement: $25,000 Major Rplcmt Interval: 10 yrs
Annual Service Agrmt: $500 Present Fuel Use/Yr: 30,803 Therms
Annual Fuel Cost: $20,022 Carbon Emission/Yr: 44.6 mt
Alternative System Metrics
Est Purchase Price: $264,000 Financed Amount: $0
New Salvage Value: $26,400 Finance Term: 10 yr Net Out-of-Pocket:$95,040
Cost Avoidance: -$2,000 Salvage Year: 20 Total Fed Tax Credit:$79,200
Annual Service Agrmt: $500 Cost Avoidance Interval: 1 yrs Renewable Sys Dep'n:$89,760
Annual kWHr Income: $0 Future Fuel Use/Yr: 13,256 Therms Total State Tax Credit:$0
Annual Fuel Savings: $11,406 Annual kWHr Prod: 0 kWHr Local Incentive: $0
Annual Fuel Cost: $8,616 Carbon Emission/Yr: 19.2 mt USDA REAP Grant: $0
Total Fed Tax Credit: $79,200 Local Incentive: $0
Total State Tax Credit: $0 Renewable Sys Dep'n: $89,760
USDA REAP Grant: $0
Net Out-of-Pocket: $95,040
Proposed System Financial Performance
After-Tax Cash Flow Net 20 Year Net Present Value (NPV)
Existing (Base) System NPV (The Do Nothing Alt): ($7,801)
Alternative System NPV: $48,897
Alternative System Net Present Beneift: $56,698
After-Tax Cash Flow Internal Rate of Return (IRR)
Base System: 4.2%
Alternative System: 7.6%
Simple Income - Expence Paybk Base Alternative
Discounted At 0% -1.00 yrs 5.23 yrs
ATCF Based Payback Base Alternative
Discounted At 0%: -1.00 yrs 8.86 yrs
A Comparative Analysis
Location:Customer: Energy Intersections
($200,000)
($100,000)
$0
$100,000
$200,000
$300,000
$400,000
Yr 1 Yr 2 Yr 3 Yr 4 Yr 5 Yr 6 Yr 7 Yr 8 Yr 9 Yr 10 Yr 11 Yr 12 Yr 13 Yr 14 Yr 15 Yr 16 Yr 17 Yr 18 Yr 19 Yr 20
Simple Income-Expense Analysis
Alternate Base
($200,000)
($150,000)
($100,000)
($50,000)
$0
$50,000
$100,000
$150,000
$200,000
Yr 1 Yr 3 Yr 5 Yr 7 Yr 9 Yr 11 Yr 13 Yr 15 Yr 17 Yr 19
After-Tax Cash Flow Analysis
Alternative Base
$0.00
$0.20
$0.40
$0.60
$0.80
$1.00
$1.20
$1.40
$1.60
Yr 1 Yr 3 Yr 5 Yr 7 Yr 9 Yr 11 Yr 13 Yr 15 Yr 17 Yr 19
20 Year Per-Unit Fuel Price Projection
Natural Gas
36%
30%
34%
0% 0%
Milking Building System Funding Breakdown
Net Out-of-Pocket: Total Fed Tax Credit: Renewable Sys Dep'n:
Total State Tax Credit: Local Incentive:
Natural Gas
Incremental Alternative - Base Payback
1 of 1

Colorado Department of Agriculture Renewable Heating & Cooling Roadmap December 15, 2013
Energy Intersections: Energy Strategy + Cross-‐Sector Collaboration 303.377.5006 • www.energyintersections.com Page 69 of 104
Professional Report!
1! /! 10!Vela Solaris AG, their distribution partners or SPF do not accept any liability for the correctness of the specifications and the results.!
Atmospheric Tank!
Simulated • 6000 Gallons Per Day with 3 Milking Cycles
and 3 Distinct Tank Wash Cycles • Four 119 Gallon Freeheaters • Separate Upper and Lower Roof Solar Arrays • Atmospheric Solar Tank
Professional Report!
2! /! 10!Vela Solaris AG, their distribution partners or SPF do not accept any liability for the correctness of the specifications and the results.!
Location of the system! !
Longitude: -104.696°!Latitude: 40.668°!Elevation: 5,039 ft!
This report has been created by:! !Mike Geocaris!RE-Align Technology!Denver, CO! !
Map section!
Photograph of property!Data • Site Climate Data for Pierce, Colorado • Independent Solar Collector Performance
Ratings • Polysun Model Created by Offshoot of European
Rating Agency

Colorado Department of Agriculture Renewable Heating & Cooling Roadmap December 15, 2013
Energy Intersections: Energy Strategy + Cross-‐Sector Collaboration 303.377.5006 • www.energyintersections.com Page 70 of 104
Current DHW System at Long’s Peak • 75% of dairy water must be
heated from incoming cold water
• Freeheater storage capacity is 25% of required dairy cycle volume
• Freeheaters raise cold water temp to approx. 115 degrees
• This simulation shows usage of 92 gallons of propane per day
• Energy Demand 1.6 Bbtu’s
• Waste Heat 1.9 Bbtu’s
Full Year Picture
Sample Month - October
Solar&System&Performance&&

Colorado Department of Agriculture Renewable Heating & Cooling Roadmap December 15, 2013
Energy Intersections: Energy Strategy + Cross-‐Sector Collaboration 303.377.5006 • www.energyintersections.com Page 71 of 104
Professional Report!
10! /! 10!Vela Solaris AG, their distribution partners or SPF do not accept any liability for the correctness of the specifications and the results.!
Energy flow diagram!
Solar Fraction • .742/(1.63 - .444) = 63%
Propane consumption reduced by almost 60%
Waste Heat reduced by over 50%
• 6 Collectors Per Array, tilted to 40 Degrees above the Horizon for Optimal Year Round Performance
• 96 4ft X 8ft collectors • Approx 192 Kilowatts (thermal)
• Collector Peaks are Below
the Roof Peak • Lower roof collectors are
positioned so that shading on the shortest day of the year is virtually non-existent
&Solar&System&&

Colorado Department of Agriculture Renewable Heating & Cooling Roadmap December 15, 2013
Energy Intersections: Energy Strategy + Cross-‐Sector Collaboration 303.377.5006 • www.energyintersections.com Page 72 of 104
Ground Source Heat Pump
Technical�Analysis�Ͳ�Conventional�Boiler�versus�Geothermal�Heat�Pump�for�PreheatDecember�1,�2013 Version�1
PROJECT�Ͳ�Application�Ͳ�NonͲcondensing�PROPANE�Boiler�Heating�Sanitization�Water�for�Milking�OperationWell�water�delivered�at�50�degrees�to�boiler�raising�water�to�target�temperature�of�180�degrees�(minimum�165�degrees)
Energy�Environmental�CorporationAlbert�Wallace,�CGD,�CEM�
Santitation�Water�Heating�Demand�is�1,800�gal�+�180�gal�ancillary�use�3�x�day�from�1900�gallons�uninsulated�hot�water�tanks.Milk�Cooling�Demand�is�3,000�gallons�reduced�from�80�to�40�degrees.��Current�system�uses�chillers�and�some�preͲcooling.
SUMMARY�OF�ANNUAL�SAVINGS�POTENTIAL�USING�GEO�HEAT�PUMP�IN�DUAL�PROCESS�APPLICATIONANNUAL�HEATING�Hybrid�System�Cost�Savings�with�GHP $37,260ANNUAL�CHILLING�Savings�GHP�in�Dual�Process�Application $14,400
Total�Annual�OPERATING�COST�Savings�Potential $51,660
CAPITAL�COSTS�Heat�Pumps�and�Infrastructure NotesGeo�Heat�Pumps�and�Piping�to�Existing�Infrastructure $110,000
Hi h Effi i S T k 2 000 G ll $24 000 h ff k ll
Milk�Cooling�Demand�is�3,000�gallons�reduced�from�80�to�40�degrees.��Current�system�uses�chillers�and�some�pre cooling.
High�Efficiency�Storage�Tanks�Ͳ�2,000�Gallons $24,000Stainless�Steel�Heat�Exchangers�Ͳ�Source�Side $26,000
CAPITAL�COSTS�TOTAL $160,000Energy�Tax�Credit�Incentives�@�25%�Capital�Costs ($40,000)
CAPITAL�INVESTMENT�AFTER�TAX�INCENTIVES $120,000
Simple�Payback�Ͳ�Years 2.32Return�on�Investment 43.1%
Estimated�Stainless�Steel�HEX�,�Health�Department�Compliance�Unknown
High�Efficiency�Storage�Tanks�Ͳ�2000�gallons
Internal�Rate�of�Return�(10�Years) 48.5%Internal�Rate�of�Return�(20�Years) 50.6%
Net�Present�Value�(10�years) $587,624Net�Present�Value�(20�years) $2,075,589
PROPANE�USAGE,�AND�UTILITY�COSTS
Average�Monthly�Therm�Usage�Ͳ�MMBTU Not�Used
IRR�uses�4%�discount�rate�on�capitaland�12%�inflation�rate�on�propane
Propane�Usage�Includes�Building�HeatingBoiler�Seasonal�Efficiency�Factor�(EF)��Ͳ�% 59.0%Two�Boiler�Rated�Output�MMBTU 1.0�������������������Propane�Cost�per�Gallon $1.50Propane�Ͳ�BTUs�per�Gallon�(Input) 91,502������������Propane�Ͳ�BTUs�per�Gallon�(Output)�Ͳ�Derated�for�EF 53,986������������ 1MMBTU/53,986�=�18.52x�conversionCost�per�DecaTherm�@��EF�Ͳ�$/MMBTU $27.78Cost�per�kiloWatt/hour�Ͳ�$/kWh $0.10Equivalent�Cost�of�Electricity�per�MMBTUH $29.31Electricity�is�XX�more�expensive�than�Natural�Gas 1.06 X
Analysis�is�Propane�Use�only
$1.50/53,986�BTUs
3412�BTU�per�1�kWh
Boiler�load�pumps�excluded�from�EF
Electricity�is�XX�more�expensive�than�Natural�Gas 1.06 XAverage�Monthly�Propane�Cost�Ͳ�dollars $5,778
PROCESS�ENERGY�USE�AND�COST�ANALYSIS Boilers Geo�HPs1�or�2�Active 3�Active
HEATING
Enter�Water�Temp�(EWT)�deg�F,�EST�Ͳ�Source�Temp 50 50Enter�PREHEAT�Load�Temp�(ELT)�deg�F 50Leave�PREHEAT�Load�Temp�(LLT)�deg�F 140
( )
Entering�water�temperature�Source�EWT�to�Process�ELT
Estimate�from�Process�Demand�Below
�GHP�Load�Flow�25�GPM�7�Ton�WaterFurnace�502W12�
GHP�Maximum�LLT�is�150�Degrees
PREHEAT�Delta�T�(LLTͲELT)�deg�F 90Enter�BOILER�Load�Temp�(ELT)�deg�F 50 140Leave�BOILER�Load�Temp�(LLT)�deg�F 180 180
BOILER�HEAT�Delta�T��(LLTͲELT)�deg�F 130 40
TOTAL�PROCESS�Delta�T�(LLTͲELT)�deg�F 130 130Process�Flow�Rate�Gallons�every�7.5�Hours 2,000�������������� 2,000��������������Process�Flow�Rate�GPM 4.44 4.44
/
gallons�per�minute
BTU/hr�=�Delta�T�(LLTͲELT)�x�Flow�Rate�x�500�
7.5�Hours�(three�shifts�@�8�hours)
GHP�PREHEAT�
PREHEAT�Process�Hourly�Demand�(140�deg�Ͳ�ELT)�BTU/hr 200,000���������� 200,000���������
Percentage�PREHEAT�as�Percentage�of�Total�Process 69.23% 69.23%BOILER�HEAT�Process�Demand�(140�deg�to�180�deg)�BTU/HR 88,889�������������� 88,889��������������
(water)�

Colorado Department of Agriculture Renewable Heating & Cooling Roadmap December 15, 2013
Energy Intersections: Energy Strategy + Cross-‐Sector Collaboration 303.377.5006 • www.energyintersections.com Page 73 of 104
Total�Process�Hourly�Demand�BTU/HR 288,889������������ 288,889�����������Hours�per�Month�Process�is�Active 720������������������ 720�����������������Total�Process�Hours/Year� 8,640�������������� 8,640��������������Total�Process�Annual�Demand�GHP�MMBTUs Ͳ������������������� 1,728��������������Total�Process�Annual�Demand�MMBTUs 2,496�������������� 2,496��������������
Hybrid�Process�Geothermal�Heat�Pump�Ͳ�MMBTU/HR 200,000�����������Energy�Use�Geothermal�Heat�Pump�Ͳ�kWh 12.4����������������
Hybrid Process MMBTU/HR Installed Boiler 288,889 88,889Hybrid�Process�MMBTU/HR�Installed�Boiler 288,889���������� 88,889������������Cost�Per�Hour�Ͳ�Geothermal�Heat�Pump�(GHP) n/a $1.24
Cost�Per�Hour�Ͳ�Boiler $8.03 $2.47
TOTAL�PROCESS�OPERATING�COST/hour $8.03 $3.71TOTAL�PROCESS�OPERATING�COST/month $5,778.24 $2,673.23TOTAL�PROCESS�OPERATING�COST/year $69,338.88 $32,078.72
REDUCTION�IN�PROCESS�COSTS�USING�GHP�PREHEAT 54%Hybrid�System�MONTHLY�Cost�Savings�with�GHP� $3,105.01ANNUAL HEATING Hybrid System Cost Savings with GHP $37 260 16ANNUAL�HEATING�Hybrid�System�Cost�Savings�with�GHP $37,260.16
Percentage�Process�Load�with�Geo 0% 69.2%Percentage�Process�Load�with�Boiler 100% 30.8%
HEATING�STAGES�TO�DETERMINE�GHP�EFFICIENCY,�LOADS,�AND�ENERGY�USE
Stage�1�PREHEAT�ELT�deg�F 50 50Stage�1�PREHEAT�LLT�deg�F 60 60 6.3 COP
GHP�Efficiency�is�based�on�50�deg�EWT.�COP�increases�with�Milk�as�Source�EST
GHP�COP/kWh
g g
Stage�1�Process�BTU/hr 22,222�������������� 22,222�������������� 1.03��� kWh
Stage�2�PREHEAT�ELT�deg�F 60 60Stage�2�PREHEAT�LLT�deg�F 80 80 6.9 COP
Stage�2�Process�BTU/hr 44,444�������������� 44,444�������������� 1.89��� kWh
Stage�3�PREHEAT�ELT�deg�F 80 80Stage�3�PREHEAT�LLT�deg�F 100 100 5.2 COP
Stage�3�Process�BTU/hr 44,444������������ 44,444������������ 2.50� kWhStage�3�Process�BTU/hr 44,444������������ 44,444������������ 2.50� kWh
Stage�4�PREHEAT�ELT�deg�F 100 100Stage�4�PREHEAT�LLT�deg�F 120 120 4.1 COP
Stage�4�Process�BTU/hr 44,444�������������� 44,444�������������� 3.18��� kWh
Stage�5�PREHEAT�ELT�deg�F 120 120Stage�5�PREHEAT�LLT�deg�F 140 140 3.4 COP
Stage�5�Process�BTU/hr 44,444�������������� 44,444�������������� 3.83��� kWh
Stage 6 Boiler Heat ELT deg F 140 140 Boiler Operation Only Stage 6Stage�6�Boiler�Heat�ELT�deg�F 140 140 Boiler�Operation�Only�Stage�6Stage�6�Boiler�Heat�LLT�deg�F 180 180
Stage�6�Process�BTU/hr 88,889�������������� 88,889��������������
TOTAL�PROCESS�HEAT�REQUIRED 288,889������������ 288,889�����������
CHILLING�Ͳ�MILK Chiller GHPEnter�Milk�Temp�(EWT)�deg�F,�EST�Ͳ�Source�Temp 80 80Enter�PRECHILL�Load�Temp�(ELT)�deg�F 80
Cooling�is�ByͲProduct�of�Source�Side�GHP�Operation�with�operating�costs�already�included�p ( ) g
Leave�PRECHILL�Load�Temp�(LLT)�deg�F 44
PRECHILL�Delta�T�(LLTͲELT)�deg�F Ͳ36Enter�CHILLER�Load�Temp�(ELT)�deg�F 80Leave�CHILLER�Load�Temp�(LLT)�deg�F 44
CHILLER�HEAT�Delta�T��(LLTͲELT)�deg�F Ͳ36 0
TOTAL�PROCESS�Delta�T�(LLTͲELT)�deg�F Ͳ36 Ͳ36Process�Flow�Rate�Gallons�every�7.5�Hours 5,000�������������� 5,000��������������Process�Flow�Rate�GPM 11.11 11.11
p p g yabove�Ͳ�No�Additional�Operating�Costs,�except�for�Source�Side�Cooling�Pumps.��The�pumping�energy�is�the�same�for�both�options,�so�these�costs�are�ignored�to�calculate�savings�potential.

Colorado Department of Agriculture Renewable Heating & Cooling Roadmap December 15, 2013
Energy Intersections: Energy Strategy + Cross-‐Sector Collaboration 303.377.5006 • www.energyintersections.com Page 74 of 104
PRECHILL�Process�Hourly�Demand��BTU/hr 200,000������������ 200,000�����������PRECHILL�Process�Hourly�Demand�Tons/Hour 16.7����������������� 16.7����������������Percentage�PRECHILL�as�Percentage�of�Total�Process 100.00% 100.00%Hours�per�Month�Process�is�Active 720������������������ 720�����������������Total�Process�Hours/Year� 8,640�������������� 8,640��������������Total�Process�Annual�Demand�MMBTUs 1,728�������������� 1,728�������������� Matches�BTU�Input�of�GHP�Heating�ProcessTotal�Process�Annual�Demand�Ͳ�Tons�of�Cooling 144,000���������� 144,000���������
Chiller��Efficiency�Ͳ�kWh/Ton 1.0 0.3������������������
Energy�Use�Chiller�or�Geothermal�Heat�Pump�Ͳ�kWh 16.7������������������� 4.8�������������������� Fouled�condenser�and�evaporator�tubes
Cost�Per�Hour�Ͳ�Chiller�or�Geothermal�Heat�Pump�(GHP) $1.67 $0.48 Refrigerant�leaks
TOTAL�PROCESS�OPERATING�COST/hour $1.67 $0.48 Air�or�nonͲcondensables�in�the�chiller
TOTAL�PROCESS�OPERATING�COST/month $1,200 $343 Water�flow�problems
TOTAL�PROCESS�OPERATING�COST/year $14,400 $4,114 Incorrect�set�points
REDUCTION IN PROCESS COSTS USING GHP PRECHILL 71%
Assume�15%�Chiller�Efficiency�Losses
REDUCTION�IN�PROCESS�COSTS�USING�GHP�PRECHILL 71%Dual�Process�System�MONTHLY�Cost�Savings�with�GHP� $857ANNUAL�Cost�Savings�with�GHP�Ͳ�Ground�Heat�Exchanger $10,286ANNUAL�CHILLING�Savings�GHP�in�Dual�Process�Application $14,400 GHP�Savings�using�GHP�with�Milk�HEX
GHP�Savings�using�GHP�with�Ground�HEX
Investment Analysis for Energy Efficiency and Geothermal Improvements
INVEST IN GEOTHERMAL DUAL PROCESS HEATING SANITATION AND MILK CHILLER, UPGRADE TANKS
Discount Rate 4.00% Contract Cost Turnkey $160,000Propane Inflation Rate 12.00%
Net Present Value 10 years $587,624 Tax Credits & Incentives ($40,000)IRR - 10 Years 48.51%
Net Present Value 20 years $2,075,589 Net Differential Cost $120,000IRR - 20 Years 50.61% Annual Savings $51,660
Monthly Savings $4,305Simple Payback in Years 2.3 Months/Year 12Simple Payback in Percent ROI 43.1%
Year Investment Annual Savings Net Cash Flow/Period Present Value0 Less 1st Cost of Propane System ($160,000) ($160,000)1 ($160,000) $0 $91,660 $88,1352 $40,000 $51,660 $57,859 $53,4943 $57,859 $64,802 $57,6094 $64,802 $72,579 $62,0405 $72,579 $81,288 $66,8136 $81,288 $91,043 $71,9527 $91,043 $101,968 $77,4878 $101,968 $114,204 $83,4489 $114,204 $127,908 $89,867
10 $127,908 $143,257 $96,77911 $143,257 $160,448 $104,22412 $160,448 $179,702 $112,24113 $179,702 $201,266 $120,87514 $201,266 $225,418 $130,17315 $225,418 $252,468 $140,18716 $252,468 $282,764 $150,97017 $282,764 $316,696 $162,58318 $316,696 $354,700 $175,09019 $354,700 $397,264 $188,55820 $397,264 $444,935 $203,063
$444,935 $0 $0Prepared By:
Al Wallace, President, CGD, CEMEnergy Environmental Corporation8295 S Krameria WayCentennial, CO 80112-3004Phone (303) 953-2346www.energyenvironmentalcorp.com
December 1, 2013

Colorado Department of Agriculture Renewable Heating & Cooling Roadmap December 15, 2013
Energy Intersections: Energy Strategy + Cross-‐Sector Collaboration 303.377.5006 • www.energyintersections.com Page 75 of 104
*HR/LQN�'HVLJQ�6WXGLR
3URMHFW�6XPPDU\3URMHFW�,QIRUPDWLRQ$QDO\VLV�3UHSDUHG�IRU�1DPH� 1DPH� (QHUJ\�(QYLURQPHQWDO
&RUSRUDWLRQ$GGUHVV� $GGUHVV� �����6�.UDPHULD�:D\
.HUVH\��&2� &HQWHQQLDO��&2�������3KRQH� 3KRQH� ���($57+��:RUN� )D[�1RWHV� &HOO�3KRQH� ����������3URMHFW��� �������� &RPPHQWV�
6\VWHP�'HVLJQ�'DWD'HVLJQ�'DWD� &RPIRUW� &RQGLWLRQV�+HDWLQJ�/RDG� ������ %WXK +HDWLQJ�6HWSRLQW� �� �)+HDWLQJ�7HPS�'LII� ���� �) &RROLQJ�6HWSRLQW� �� �)&RROLQJ�/RDG� � %WXK 6WDUW�&RROLQJ�7HPS� �� �)&RROLQJ�7HPS�'LII� ���� �) +:�7HPS�6HWWLQJ� ��� �)&RQVWDQW�)DQ� 1R +:�8VHUV� � SHRSOH'HVLJQ�&LW\� 75,1,'$'��&2 $QQXDO� /RDG�:LQWHU�'HVLJQ� � �) +HDWLQJ� ����� PLOOLRQ�%WX6XPPHU�'HVLJQ� �� �) &RROLQJ� ��� PLOOLRQ�%WX%OGJ�%DO�7HPS� ���� �) +RW�:DWHU� ��� PLOOLRQ�%WX,QWHUQDO�*DLQV� ������ %WXK +:�8VH���'DLO\� ���� JDOORQV
8WLOLW\�&RVWV5DWH 6XPPHU :LQWHU 5DWH 6XPPHU :LQWHU
(OHFWULF���*HR ��N:K ���� ���� 1DWXUDO�*DV ��&&) ���� ����
(OHFWULF���+HDW�3XPS ��N:K ���� ���� 3URSDQH ��JDO ���� ����
(OHFWULF���)XUQDFH ��N:K ���� ���� )XHO�2LO ��JDO ���� ����
2SHUDWLQJ�&RVWV6\VWHP�'HVFULSWLRQ (IILFLHQF\
+WJ�&OJ����+HDWLQJ&RVW
+\GURQLF&RVW
&RROLQJ&RVW
+RW:DWHU&RVW
&RQVWDQW)DQ
7RWDO2SHUDWLQJ&RVW
+9$&PRQWKO\
+L�7HPS�*+3�IRU�����WK7RWDO�/RDG
������ ���� �� �� �� ���� ���
([LVWLQJ�1RQ�&RQGHQVLQJ%RLOHU
��������� ������ �� �� �� �� ������ ����
1RWH��'XH�WR�YDULDELOLW\�LQ�ZHDWKHU��V\VWHP�LQVWDOODWLRQ��DQG�OLYLQJ�KDELWV��WKLV�DQDO\VLV�LV�WR�EH�FRQVLGHUHG�DQ�HVWLPDWH�RQO\
-RE�1DPH� �����3URMHFW�������������

Colorado Department of Agriculture Renewable Heating & Cooling Roadmap December 15, 2013
Energy Intersections: Energy Strategy + Cross-‐Sector Collaboration 303.377.5006 • www.energyintersections.com Page 76 of 104
*HR/LQN�'HVLJQ�6WXGLR
&RPSDULVRQ�&KDUW
+WJ�&RVW &OJ�&RVW +:�&RVW )DQ�&RVW 7RWDO�&RVW
'ROODUV���
�
���
���
���
���
����
����
����
����
����
����
����
����
����
����
����
����
����
����
/HJHQG
:DWHU)XUQDFH1+:�6HULHV�1+:������6((5�6LQJOH�6WDJH�5���96�ZLWK�%RLOHU�����3URSDQH�6SDUN
-RE�1DPH� �����3URMHFW�������������
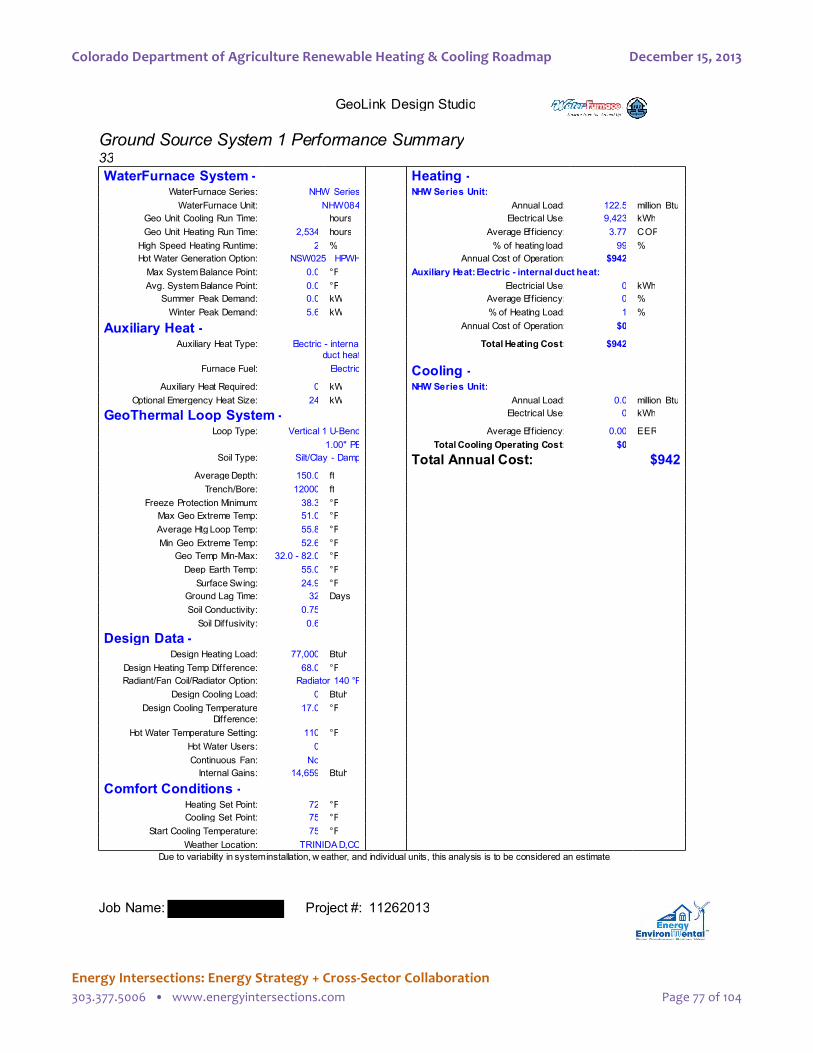
Colorado Department of Agriculture Renewable Heating & Cooling Roadmap December 15, 2013
Energy Intersections: Energy Strategy + Cross-‐Sector Collaboration 303.377.5006 • www.energyintersections.com Page 77 of 104
*HR/LQN�'HVLJQ�6WXGLR
*URXQG�6RXUFH�6\VWHP���3HUIRUPDQFH�6XPPDU\��:DWHU)XUQDFH�6\VWHP�� +HDWLQJ��
:DWHU)XUQDFH�6HULHV� 1+:�6HULHV 1+:�6HULHV�8QLW�:DWHU)XUQDFH�8QLW� 1+:��� $QQXDO�/RDG� ����� PLOOLRQ� %WX
*HR�8QLW�&RROLQJ�5XQ�7LPH� KRXUV (OHFWULFDO�8VH� ����� N:K*HR�8QLW�+HDWLQJ�5XQ�7LPH� ����� KRXUV $YHUDJH�(II LFLHQF\� ���� &23
+LJK�6SHHG�+HDWLQJ�5XQWLPH� � � ���RI�KHDWLQJ�ORDG� �� �+RW�:DWHU�*HQHUDWLRQ�2SWLRQ� 16:���� +3:+ $QQXDO�&RVW�RI�2SHUDWLRQ� ����0D[�6\VWHP�%DODQFH�3RLQW� ��� �) $X[LOLDU\�+HDW��(OHFWULF���LQWHUQDO�GXFW�KHDW�$YJ��6\VWHP�%DODQFH�3RLQW� ��� �) (OHFWULFLDO�8VH� � N:K
6XPPHU� 3HDN�'HPDQG� ��� N: $YHUDJH�(II LFLHQF\� � �:LQWHU�3HDN�'HPDQG� ��� N: ��RI�+HDWLQJ�/RDG� � �
$X[LOLDU\�+HDW�� $QQXDO�&RVW�RI�2SHUDWLRQ� ��
$X[LOLDU\�+HDW�7\SH� (OHFWULF���LQWHUQDOGXFW�KHDW
7RWDO�+HDWLQJ�&RVW� ����
)XUQDFH�)XHO� (OHFWULF &RROLQJ��$X[LOLDU\�+HDW�5HTXLUHG� � N: 1+:�6HULHV�8QLW�
2SWLRQDO�(PHUJHQF\�+HDW�6L]H� �� N: $QQXDO�/RDG� ��� PLOOLRQ� %WX
*HR7KHUPDO�/RRS�6\VWHP�� (OHFWULFDO�8VH� � N:K
/RRS�7\SH� 9HUWLFDO���8�%HQG $YHUDJH�(II LFLHQF\� ���� ((5�������3( 7RWDO�&RROLQJ�2SHUDWLQJ�&RVW� ��
6RLO�7\SH� 6LOW�&OD\���'DPS 7RWDO�$QQXDO�&RVW� ����$YHUDJH�'HSWK� ����� IW7UHQFK�%RUH� ����� IW
)UHH]H�3URWHFWLRQ�0LQLPXP� ���� �)0D[�*HR�([WUHPH�7HPS� ���� �)$YHUDJH�+WJ�/RRS�7HPS� ���� �)0LQ�*HR�([WUHPH�7HPS� ���� �)
*HR�7HPS�0LQ�0D[� ����������� �)'HHS�(DUWK�7HPS� ���� �)
6XUIDFH�6ZLQJ� ���� �)*URXQG�/DJ�7LPH� �� 'D\V6RLO�&RQGXFWLYLW\� ����6RLO�'LIIXVLYLW\� ���
'HVLJQ�'DWD��'HVLJQ�+HDWLQJ�/RDG� ������ %WXK
'HVLJQ�+HDWLQJ�7HPS�'LIIHUHQFH� ���� �)5DGLDQW�)DQ�&RLO�5DGLDWRU�2SWLRQ� 5DGLDWRU������)
'HVLJQ�&RROLQJ�/RDG� � %WXK'HVLJQ�&RROLQJ�7HPSHUDWXUH
'LIIHUHQFH����� �)
+RW�:DWHU�7HPSHUDWXUH�6HWWLQJ� ��� �)+RW�:DWHU�8VHUV� �&RQWLQXRXV�)DQ� 1R,QWHUQDO�*DLQV� ������ %WXK
&RPIRUW�&RQGLWLRQV��+HDWLQJ�6HW�3RLQW� �� �)&RROLQJ�6HW�3RLQW� �� �)
6WDUW�&RROLQJ�7HPSHUDWXUH� �� �):HDWKHU�/RFDWLRQ� 75,1,'$'�&2
'XH�WR�YDULDELOLW\�LQ�V\VWHP�LQVWDOODWLRQ��Z HDWKHU��DQG�LQGLYLGXDO�XQLWV��WKLV�DQDO\VLV�LV�WR�EH�FRQVLGHUHG�DQ�HVWLPDWH�
-RE�1DPH�� �����3URMHFW�������������

Colorado Department of Agriculture Renewable Heating & Cooling Roadmap December 15, 2013
Energy Intersections: Energy Strategy + Cross-‐Sector Collaboration 303.377.5006 • www.energyintersections.com Page 78 of 104
*HR/LQN�'HVLJQ�6WXGLR
*URXQG�6RXUFH�6\VWHP���/RRS�3UHVVXUH�'URS)UHH]H�3URWHFWLRQ�������(QYLURQRO����������GHJ��)�
5HFRPPHQGHG 0LQLPXP8QLW��� *30 3' *30 3'
1+:��� 'LD /HQJWK (OERZV �� ��� �� ���
8QLW� 3LSLQJ ���� � � �� ��� �� ���
6XSSO\�3LSLQJ � �� � �� ��� �� ���
5HWXUQ� 3LSLQJ � �� � �� ��� �� ���
2XWVLGH 'LD /HQJWK 1XPEHU *30 3' 5( *3' 3' 5(
6XSSO\�/LQH � �� �� ��� ���� �� ��� ����
5HWXUQ�/LQH � �� �� ��� ���� �� ��� ����
&LUFXLWV � ��� � ��� ��� ���� ��� ��� ����
6XE�&LUFXLWV ���� � � ��� ��� � ��� ��� �
6\VWHP�*30��3UHVVXUH�'URS �� ���� �� ����
)OXVKLQJ�5HTXLUHPHQWV
���*30�DW������IW�KHDG�DUH�QHHGHG�WR�IOXVK�WKH�DLU�URP�WKLV�ORRS��,*6+3$�JXLGHOLQHV�
/RRS�9ROXPH�DQG�$QWL)UHH]H
�����*DOORQV�(QYLURQRO������PL[HG�ZLWK
������*DOORQV�RI�ZDWHU�ZLOO�SURYLGH�SURWHFWLRQ�WR����GHJUHHV�)�
������*DOORQV�RI�PL[HG�IOXLG�UHTXLUHG�
-RE�1DPH�� ����3URMHFW�������������

Colorado Department of Agriculture Renewable Heating & Cooling Roadmap December 15, 2013
Energy Intersections: Energy Strategy + Cross-‐Sector Collaboration 303.377.5006 • www.energyintersections.com Page 79 of 104
*HR/LQN�'HVLJQ�6WXGLR
*URXQG�6RXUFH�6\VWHP���/RRS�3UHVVXUH�'URS)UHH]H�3URWHFWLRQ�������(QYLURQRO����������GHJ��)�
5HFRPPHQGHG 0LQLPXP*30 3' *30 3'
6\VWHP�*30��3UHVVXUH�'URS �� ���� �� ����
6\VWHP�&XUYH )&�
*DOORQV�SHU�0LQXWH� � � � � �� �� �� �� �� �� �� �� �� ��
3UHVVXUH'URS�)7+'�
�
�
��
��
��
��
��
��
��
��
��
��
��
��
3UHGLFWHG�)ORZ
�����*30�DW������IW�KHDG��IRU�)&�
-RE�1DPH�� �����3URMHFW�������������

Colorado Department of Agriculture Renewable Heating & Cooling Roadmap December 15, 2013
Energy Intersections: Energy Strategy + Cross-‐Sector Collaboration 303.377.5006 • www.energyintersections.com Page 80 of 104
*HR/LQN�'HVLJQ�6WXGLR
*URXQG�6RXUFH�6\VWHP���3HUIRUPDQFH�%LQ�'DWD+L�7HPS�*+3�IRU�����WK�7RWDO�/RDG
+HDWLQJ�/RDG�LV�������%WXK�#����)�GHOWD�7�����&RROLQJ�/RDG�LV���%WXK��#����)�GHOWD�7
:HDWKHU /RDGV :DWHU)XUQDFH�6\VWHP $X[ +:
2$7��) <UO\�+UV 6SDFH%WXK�KU
+:�%WXK�KU
$YJ�/RRS7HPS
*HR6SDFH%WXK�KU
*HR� +:%WXK�KU
*HR5XQ7LPH
*HR�7RWDON:K
$X[�(OHF�N:K
+:�(OHF�N:K
�� �� � � �� ������ ������ �� � � �
�� ��� � � �� � ������ �� � � �
�� ��� � � �� ������ ������ �� � � �
�� ��� � � �� ������ ������ �� � � �
�� ��� � � �� ������ ������ �� � � �
�� ��� � � �� � ������ �� � � �
�� ��� � � �� � ������ �� � � �
�� ��� � � �� � ������ �� � � �
�� ��� ������ � �� ������ ������ �� ��� � �
�� ��� ������ � �� ������ ������ ��� ��� � �
�� ��� ������� � �� ������ ������ ��� ��� � �
�� ��� ������� � �� ������ ������ ��� ���� � �
�� ��� ������� � �� ������ ������ ��� ���� � �
�� ��� ������� � �� ������ ������ ��� ���� � �
�� ��� ������� � �� ������ ������ ��� ���� � �
�� ��� ������� � �� ������ ������ ��� ���� � �
�� ��� ������� � �� ������ ������ ���� ��� � �
�� ��� ������� � �� ������ ������ ���� ��� � �
� �� ������� � �� ������ ������ ���� ��� � �
� �� ������� � �� ������ ������ ���� ��� � �
�� �� ������� � �� ������ ������ ���� �� � �
�� � ������� � �� ������ ������ ���� �� � �
��� � ������� � �� ������ ������ ���� �� � �
���� ���� � �7KLV�VRIWZ DUH�XVHV�DOJRULWKPV�EDVHG�XSRQ�WKH�ODWHVW�$6+5$(�HQJLQHHLQJ�PHWKRGV�����\HDUDYHUDJH�Z HDWKHU�GDWD��DQG�D�V\VWHP�LQVWDOOHG�DFFRUGLQJ�WR�WKH�PDQXIDFWXUHUV�JXLGOLQHV�
+RZHYHU��GXH�WR�WKH�YDULDELOLW\�RI�ZHDWKHU�V\VWHP�LQVWDOODWLRQ��DQG�OLYLQJ�KDELWV��WKLV�DQDO\VLVLV�WR�EH�FRQVLGHUHG�DQ�HVWLPDWH���$OO�DQDO\VLV�LV�EDVHG�RQ�:DWHU)XUQDFH�XQLW�SHUIRUPDQFH
DQG�PD\�QRW�EH�FRPSDUDEOH�IRU�RWKHU�PDQXIDFWXUHUV�HTXLSPHQW�
-RE�1DPH�� �����3URMHFW�������������

Colorado Department of Agriculture Renewable Heating & Cooling Roadmap December 15, 2013
Energy Intersections: Energy Strategy + Cross-‐Sector Collaboration 303.377.5006 • www.energyintersections.com Page 81 of 104
Appendix B: Feed Mill Case Study Models
Flat-‐Plate Solar Hot Water System
Solar System Financial ProformaSS Version: 1.1
Project Information
Ft Collins, Co
Date: 12/1/2013 Version: test-sunk costs Prepared By: Bob Kingston
FALSE
Site Financial Metrics
Opty Cost of Captial: 8% After-Tax OCC: 4.8%
Csh Flo Discount Rate: 0% Finance Interest Rate: 5.5%
General Inflation Rate: 2% Performance Incentive: 0.00 $/kWHr
Income Tax Rate: 40% Utility Incentive: $0
Yr 1 Fed Tax Credit: 30% Fed Dep Cost Basis %: 85.00%
State Tax Credit: 0% Fed Yr 1 Dep'n %: 34.00%
State Credit Prd (yr): 0 Fed Yr 2-5 Dep'n %: 12.70%
State Credit Cap: $0 Max Payback Period: 5 yr
USDA REAP Grant: 0% Std Equip Dep'n Prd: 7 yr
Site Fossel Fuel
Type: Natural Gas Unit: Therms BTU/Unit 100,000
CO2/Unit: 14.47 mt/BBTU Prsnt $/Unit: $0.65 Inflation %: 4%
Existing (Base) System Metrics
Est Purchase Price: $0 Financed Amount: $0
Recalc! $0 Finance Term: 10 yr
Existing Salvage Value: $0 Salvage Year: 20 yr
Major Replacement: $0 Major Rplcmt Interval: 20 yrs
Annual Service Agrmt: $2,000 Present Fuel Use/Yr: 0 Therms
Annual Fuel Cost: $0 Carbon Emission/Yr: 0.0 mt
Alternative System Metrics
Est Purchase Price: $150,000 Financed Amount: $0
New Salvage Value: $15,000 Finance Term: 10 yr Net Out-of-Pocket:$54,120
Major Maintenance: $5,000 Salvage Year: 25 Total Fed Tax Credit:$45,000
Annual Service Agrmt: $1,000 Major Maint Interval: 10 yrs Renewable Sys Dep'n:$50,880
Annual kWHr Income: $0 Future Fuel Use/Yr: -18,000 Therms Total State Tax Credit:$0
Annual Fuel Savings: $11,700 Annual kWHr Prod: 0 kWHr Utility Incentive: $0
Annual Fuel Cost: -$11,700 Carbon Emission/Yr: -26.0 mt USDA REAP Grant:$0
Total Fed Tax Credit: $45,000 Utility Incentive: $0
Total State Tax Credit: $0 Renewable Sys Dep'n: $50,880
USDA REAP Grant: $0
Net Out-of-Pocket: $54,120
Proposed System Financial Performance
After-Tax Cash Flow Net 20 Year Net Present Value (NPV)
Existing (Base) System NPV (The Do Nothing Alt): ($17,923)
Alternative System NPV: $51,268
Alternative System Net Present Beneift: $69,190
After-Tax Cash Flow Internal Rate of Return (IRR)
Base System: -60.0%
Alternative System: 10.5%
Simple Income - Expense Paybk Base Alternative
Discounted At 0% 0.00 yrs 4.80 yrs
ATCF Based Payback Base Alternative
Discounted At 0%: 0.00 yrs 7.37 yrs
A Comparative Analysis
Location:Customer:Energy Interections
($100,000)
($50,000)
$0
$50,000
$100,000
$150,000
$200,000
$250,000
$300,000
Yr 1 Yr 2 Yr 3 Yr 4 Yr 5 Yr 6 Yr 7 Yr 8 Yr 9 Yr 10 Yr 11 Yr 12 Yr 13 Yr 14 Yr 15 Yr 16 Yr 17 Yr 18 Yr 19 Yr 20
Simple Income-Expense Analysis
Alternate Base
($100,000)
($50,000)
$0
$50,000
$100,000
$150,000
Yr 1 Yr 3 Yr 5 Yr 7 Yr 9 Yr 11 Yr 13 Yr 15 Yr 17 Yr 19
After-Tax Cash Flow Analysis
Alternative Base
$0.00
$0.20
$0.40
$0.60
$0.80
$1.00
$1.20
$1.40
$1.60
Yr 1 Yr 3 Yr 5 Yr 7 Yr 9 Yr 11 Yr 13 Yr 15 Yr 17 Yr 19
20 Year Per-Unit Fuel Price Projection
Natural Gas
36%
30%
34%
0% 0%
Feed Processing System Funding Breakdown
Net Out-of-Pocket: Total Fed Tax Credit: Renewable Sys Dep'n:
Total State Tax Credit: Utility Incentive:
Natural Gas
Incremental Alternative - Base Payback
1 of 1

Colorado Department of Agriculture Renewable Heating & Cooling Roadmap December 15, 2013
Energy Intersections: Energy Strategy + Cross-‐Sector Collaboration 303.377.5006 • www.energyintersections.com Page 82 of 104
Professional Report!
1! /! 10! V5.10.13.17087 / 19.12.2012 / 16:21:32!Vela Solaris AG, their distribution partners or SPF do not accept any liability for the correctness of the specifications and the results.!
Simulated • 1,750 gal/day of 350F water • Existing steam tank assumed to be 240gal • Atmospheric Solar Tank
Professional Report!
2! /! 10! V5.10.13.17087 / 19.12.2012 / 16:21:32!Vela Solaris AG, their distribution partners or SPF do not accept any liability for the correctness of the specifications and the results.!
Location of the system! !
Longitude: -105.063°!Latitude: 40.584°!Elevation: 4,970 ft!
This report has been created by:! !Mike Geocaris!RE-Align Technology!Denver, CO! !
Map section!
Photograph of property!
Data • Site Climate Data Ft. Collins, Colorado • Independent Solar Collector Performance
Ratings • Polysun Model Created by Offshoot of European
Rating Agency

Colorado Department of Agriculture Renewable Heating & Cooling Roadmap December 15, 2013
Energy Intersections: Energy Strategy + Cross-‐Sector Collaboration 303.377.5006 • www.energyintersections.com Page 83 of 104
Current DHW System at Ranch Way Feeds • The yearly load was
calculated averaging low summer months from the energy bills, then extending that to the whole year. Economical solar thermal systems supplement a yearly base-load, not the peak load.
• 10% of return water can be recovered at 180F. This was taken into account in the overall load.
• Energy Demand 1.5 Bbtu’s
• Waste Heat 4.9 Bbtu’s
• Steam Generator is running at a system efficiency of 24%
Feed$Mill$Today$

Colorado Department of Agriculture Renewable Heating & Cooling Roadmap December 15, 2013
Energy Intersections: Energy Strategy + Cross-‐Sector Collaboration 303.377.5006 • www.energyintersections.com Page 84 of 104
1! /! 10! V5.10.13.17087 / 19.12.2012 / 16:21:32!Vela Solaris AG, their distribution partners or SPF do not accept any liability for the correctness of the specifications and the results.!
Flat Plate System: 44 4’x10’ collectors, 1500 gal tank Existing Hot Water
Storage Tank
Existing Steam Generator
Feed$Mill$–$Flat$Plate$Solar$Thermal$System$$
Full Year Picture
Sample Month - October
Feed$Mill$–$Flat$Plate$Solar$Thermal$System$$

Colorado Department of Agriculture Renewable Heating & Cooling Roadmap December 15, 2013
Energy Intersections: Energy Strategy + Cross-‐Sector Collaboration 303.377.5006 • www.energyintersections.com Page 85 of 104
Professional Report – Base System!
10! /! 10! V5.10.13.17087 / 19.12.2012 / 16:21:32!Vela Solaris AG, their distribution partners or SPF do not accept any liability for the correctness of the specifications and the results.!
Energy flow diagram!
Solar Fraction • .457/1.524 = 30%
Propane consumption reduced by almost 30%
Waste Heat reduced by almost 30%
1! /! 10! V5.10.13.17087 / 19.12.2012 / 16:21:32!Vela Solaris AG, their distribution partners or SPF do not accept any liability for the correctness of the specifications and the results.!
Evacuated Tube System: 36 30-tube collectors, 1500 gal tank
Feed$Mill$–$Evacuated$Tube$Solar$Thermal$System$$

Colorado Department of Agriculture Renewable Heating & Cooling Roadmap December 15, 2013
Energy Intersections: Energy Strategy + Cross-‐Sector Collaboration 303.377.5006 • www.energyintersections.com Page 86 of 104
Professional Report – High Performance System!
10! /! 10! V5.10.13.17087 / 19.12.2012 / 16:21:32!Vela Solaris AG, their distribution partners or SPF do not accept any liability for the correctness of the specifications and the results.!
Energy flow diagram!
Solar Fraction • .455/1.524 = 29.9%
Propane consumption reduced by almost 30%
Waste Heat reduced by almost 30%

Colorado Department of Agriculture Renewable Heating & Cooling Roadmap December 15, 2013
Energy Intersections: Energy Strategy + Cross-‐Sector Collaboration 303.377.5006 • www.energyintersections.com Page 87 of 104
Concentrating Solar Hot Water System This preliminary assessment is based on the thermal load from the adjusted figures for the most recent 12 months of water consumption and hours of operation per month. Operation is assumed to have been 5 days per week in most months, with a few of the peak months 6 or 7 days per week.
If our goal was to maximize the solar fraction, Abengoa would propose an 8-‐drive PT-‐1 system generating steam at the delivery spec: 350° F at 100 psig. Peak output at 900 W/m2 would be about 3.1 MMBtu/hr and it would generate about 3.8 billion Btu/yr. Based on the numbers above, about 4% of this would be lost to overshooting the thermal load in the summer months (this is an acceptable amount), and about 23% would be lost due to unusable weekend generation. A system of this size would cost about $900k installed and, including these weekly and seasonal losses, would generate about $41,500/year in revenue at $4.9/MMBtu. If we assume the Federal Investment Tax Credit (ITC) has been applied, accelerated depreciation and $100k from the CDA, payback period is 12-‐15 years.
The alternative approach would be to minimize the payback period. Here we would recommend a 1-‐drive PT-‐1 system (the smallest Abengoa offers) heating feed water to 200° F. Peak output would be about 0.4 MMBtu/hr and it would generate about 540 MMBtu/yr. Of this output, 8% would be lost in the summer months (though we may be able to eliminate this by increasing temperature at times), and the same 23% due to weekend generation. This system would cost about $225,000, generate about $5,600/yr in revenue, and have a payback period of 4-‐5 years with ITC, depreciation and $100k from CDA.
Additional considerations:
The low-‐hanging fruit at this site is the boiler efficiency. If they were in the 80% range, the payback period would be twice as long.
Obviously the cost of fuel here is very low. If the client was using propane or diesel, this would be a different conversation. In a financed project where Abengoa sells only energy to the client, it can be competitive with $15/MMBtu fuel with a 3 MMBtu/hr system.
If the 23% lost on the weekend could be eliminated, the revenue and payback would improve accordingly. As you can see, even with Abengoa’s smallest system, it is generating as much energy as they can use in the summer. A large storage tank would need to be pressurized to make a big difference. Unpressurized storage is relatively inexpensive, but pressurized would be cost-‐prohibitive at this scale. One solution to this would be to include the summer cleaning load in the analysis. If a weekends' worth of hot water was stored and used throughout the week for cleaning, we could recover that portion of revenue.

Colorado Department of Agriculture Renewable Heating & Cooling Roadmap December 15, 2013
Energy Intersections: Energy Strategy + Cross-‐Sector Collaboration 303.377.5006 • www.energyintersections.com Page 88 of 104
Ground Source Heat Pump
Technical�Analysis�Ͳ�Conventional�Boiler�versus�Geothermal�Heat�Pump�for�PreheatDecember�1,�2013 Version�1
PROJECT�ͲApplication�Ͳ�Flash�Steam�in�Vertical�Silo�for�Grain�ProcessingWater�provided�by�City�of�Fort�Collins�is�heated�to�100�psig�@�350�degrees�steamClayton�SigmaFire�100�BHP�4�Stage�boilers�fired�by�Natural�Gas,�Modeling�is�for�1�boiler�operation
Energy�Environmental�CorporationAlbert�Wallace,�CGD,�CEM�
UTILITY�COSTS�(NATURAL�GAS�AND�ELECTRICITY) Notes
Average�Monthly�Therm�Usage�Ͳ�MMBTU 984Boiler�Seasonal�Efficiency�Factor�(EF)��Ͳ�% 53.2%Actual�Monthly�BTU�Output�@�Seasonal�EF�MMBTU 523
Cost�per�DecaTherm�Ͳ�$/MMBTU $4.75
Two�year�average
Boiler�is�Modulating�in�4�Stages�Enthalpy�of�superheated�350�F�steam�at�100�psig�a�=�1196.7�Btu/lbEnthalpy of water at 0 psig and 53 deg
Cost�per�DecaTherm�@�53.2%�EF�Ͳ�$/MMBTU $8.94Cost�per�kiloWatt/hour�Ͳ�$/kWh $0.10Equivalent�Cost�of�Electricity�Expressed�in�DecaTherms $29.31Electricity�is�XX�more�expensive�than�Natural�Gas 3.28Average�Monthly�Natural�Gas�Cost�Ͳ�dollars $4,674
PROCESS�ENERGY�USE�AND�COST�ANALYSIS Boiler Geothermal1 Active Heat Pump
1,150�lb/hr�*�1,175.5�Btu/lb�/�(0.426�seasonal�efficiency)�/�(10^6�Btu/MMBTU)�=�3.17�MMBTUH
Enthalpy�of�water�at�0�psig�and�53�deg�F�=�21.2�Btu/lb2.3�GPM�water�=�1,150�lb/hour�water
1�Active Heat�Pump
Enter�Water�Temp�(EWT)�deg�F,�EST�Ͳ�Source�Temp 53 53Enter�Load�Temp�(ELT)�deg�F 53 53Leave�Load�Temp�(LLT)�deg�F 140 140Delta�T��(LLTͲELT)�deg�F 87 87Process�Flow�Rate�GPM 2.2 2.2
Single�State�Process�(LLTͲELT)�BTU/hr 95,700������������ 95,700������������
gallons�per�minute
Entering�water�temperature�Source�EWT�to�Process�ELT
BTU/hr�=�Delta�T�(LLTͲELT)�x�Flow�Rate�x�500�(water)�Single�State�Process�(LLT ELT)�BTU/hr 95,700������������ 95,700������������
Percentage�Single�State�as�Percentage�of�Total�Process 3.02% 3.02%Enthalpy�from�140�deg�Water�to�350�deg�F�Steam 3,074,300��������� 3,074,300��������
Total�Process�BTU/HR 3,170,000��������� 3,170,000��������Conversion�Ͳ�Hours�per�Month�Process�is�Active 165������������������ 165�����������������Total�Process�MMBTU/Month�with�Active�Hours/Month 523������������������ 523�����������������Total�Process�MMBTU/Year� 6,277��������������� 6,277��������������
H b id P G th l H t P MMBTU/HR 95 700 GHP L d Fl 25 GPM
x�500�(water)�
Hybrid�Process�Geothermal�Heat�Pump�Ͳ�MMBTU/HR 95,700������������Energy�Use�Geothermal�Heat�Pump�Ͳ�kWh 6.0������������������
Hybrid�Process�MMBTU/HR�Installed�Boiler 3,170,000������� 3,074,300������
Cost�Per�Hour�Ͳ�Geothermal�Heat�Pump�(GHP) n/a $0.60
Cost�Per�Hour�Ͳ�Boiler $28.33 $27.47
TOTAL�PROCESS�OPERATING�COST/hour $28.33 $28.07TOTAL�PROCESS�OPERATING�COST/month $4,674.00 $4,631.92TOTAL PROCESS OPERATING COST/year $56 088 00 $55 583 08
GHP�Load�Flow�25�GPM�7�Ton�WaterFurnace�502W12�
TOTAL�PROCESS�OPERATING�COST/year $56,088.00 $55,583.08
Hybrid�System�MONTHLY�Cost�Savings�with�GHP� $42.08Hybrid�System�ANNUAL�Cost�Savings�with�GHP $504.92
Percentage�Process�Load�with�Geo 0% 3.02%Percentage�Process�Load�with�Boiler 100% 96.98%

Colorado Department of Agriculture Renewable Heating & Cooling Roadmap December 15, 2013
Energy Intersections: Energy Strategy + Cross-‐Sector Collaboration 303.377.5006 • www.energyintersections.com Page 89 of 104
HEATING�STAGES�TO�DETERMINE�GHP�EFFICIENCY,�LOADS,�AND�ENERGY�USE
Stage�1�Heat�ELT�deg�F 53 53
GHP�COP/kWh
Stage�1�Heat�LLT�deg�F 60 60 6.3 COP
Stage�1�Process�BTU/hr 7,700����������������� 7,700���������������� 0.36��� kWh
Stage�2�Heat�ELT�deg�F 60 60Stage�2�Heat�LLT�deg�F 80 80 6.9 COP
Stage�2�Process�BTU/hr 22,000�������������� 22,000�������������� 0.93��� kWh
Stage�3�Heat�ELT�deg�F 80 80Stage 3 Heat LLT deg F 100 100 5 2 COPStage�3�Heat�LLT�deg�F 100 100 5.2 COP
Stage�3�Process�BTU/hr 22,000�������������� 22,000�������������� 1.24��� kWh
Stage�4�Heat�ELT�deg�F 100 100Stage�4�Heat�LLT�deg�F 120 120 4.1 COP
Stage�4�Process�BTU/hr 22,000�������������� 22,000�������������� 1.57��� kWh
Stage�5�Heat�ELT�deg�F 120 120Stage�5�Heat�LLT�deg�F 140 140 3.4 COP
Stage�5�Process�BTU/hr 22,000�������������� 22,000�������������� 1.90��� kWh
Stage�6�Heat�ELT�deg�F 140 140 Boiler�Ͳ�No�state�changeStage�6�Heat�LLT�deg�F 212 212
Stage�6�Process�BTU/hr 79,200�������������� 79,200��������������
Stage�7�Latent�Heat�Liquid�to�Steam�at�350�degrees 212�Ͳ�350�F 212Ͳ�350�F
Stage�7�Water�Temp/Pressure�Rise��0�to�100�psig�BTU 2,995,100��������� 2,995,100��������
Boiler�Ͳ�Water�to�Steam
Water�at�0�psig,�212�degrees
Steam�at�100�psig,�350�degrees
BOILER�MANUFACTURER�SPECIFICATIONS�AND�DERATING�USED�FOR�ANALYSIS
Heat�Input�BTU/hr 4,082,317Heat�Output�Ͳ�Net�BTU/hr 3,347,500
Efficiency�Ͳ�Rated 82.0%
Altitude�DeͲRate 14.0%Gas�Quality�DeͲRate 3.0%
lApplication�DeͲRate 11.8%
Efficiency�for�Analysis 53.2%
Blower�HP 5Pump�HP 5Boiler�Minimum�Flow�Rate��GPM 8.8Operating�Hours�Peak�Flow�Ͳ�Gallons�per�hour 530 2.17�GPM,�Process�at�2.2�GPM

Colorado Department of Agriculture Renewable Heating & Cooling Roadmap December 15, 2013
Energy Intersections: Energy Strategy + Cross-‐Sector Collaboration 303.377.5006 • www.energyintersections.com Page 90 of 104
Appendix C: Beer Brewing/Storage Case Study Model
Solar Heat Pump System with Ammonia Absorption Chiller
v.3.90
Total Array Size Ft 2
Weather Data-file Solar Array Operational Availability M 2
Count Oper. Temp. ºCModel ºFPeak Rating kWTH Assumed Loss
Average MonthlyMax MonthlyMin MonthlyPeak Output
Aug 21.4
May
Feb 16.8 Mar 20.8 Apr 20.9
Jan 15.2
100%
1.9
100%
100%
100%
100%
100%
100%
100%
100%
100%
7,200
100%100% 100% 100% 100% 100%
Production Potential (MWh TH )
Denver Jan Feb Mar Apr May Jun Jul
Load Factor
120 120MCT-HT235 248
0%
CF 100%Nov
100% 100%
Nov 15.8 21.476 Dec 14.7 14.741
Oct 19.5 19.082 100%
100%
100%
Sep 21.5 MWh THKey Metrics
Jun 20.9 Jul 20.8
100%
Dec100%
Chromasun Collectors
669
Total 229.0 0.228
JanuaryFebruaryMarchAprilMayJuneJulyAugustSeptemberOctoberNovemberDecember
100%
20.6
Aug Sep Oct
0
5
10
15
20
25
Jan Feb Mar Apr May Jun Jul Aug Sep Oct Nov Dec
MWhͲth
Monthly�Solar�Production
Solar Portion 7,815
Gas Portion 178,668
Combined 186,483
250 ºF 240 ºF
44.6 ºF 60.0 ºF
55.4 ºF 130.0 ºF
27,478 0.171 4,689 0.600 Solar Solar 1.600 12,504 0.750 16,672
533,966 0.171 91,120 0.510 Gas Gas 1.360 242,988 0.750 323,984
561,444 0.171 95,810 0.514 Total Total 1.370 255,492 0.750 340,656
v.3.90
Heat-Pump Fuel Offset
(kWh)
Existing Chiller
Efficiency (COP)
Heat-Pump Production (Therms)
H-P Cool Efficiency
(COP)
H-P Heat Efficiency
(COP)
Existing Boiler
Efficiency(COP)
Heat-Pump Fuel Offset(Therms)
Heat-PumpThermal Input
(Annual Therms)
Cooling Results Heating Results
Heat-Pump Production (Therms)
Chromasun'sThermally-Driven
Heat-Pump(Absorption Chiller)
Direction of Net Heat Flow
DHW or HHWCHW

Colorado Department of Agriculture Renewable Heating & Cooling Roadmap December 15, 2013
Energy Intersections: Energy Strategy + Cross-‐Sector Collaboration 303.377.5006 • www.energyintersections.com Page 91 of 104
Chromasun System Turnkey Economics
Assumptions AmountTotal Installed Cost 1,641,151$
CA (CSI) Solar Thermal (Step 1) $14.53/therm ! 1 year solar production (138,481)$ Federal MACRS no bonus IRS: Sec. 48; Bulletin 2011-16; Pub 946 (484,312)$ Federal ITC 30% IRS Sec. 48(a)(3) (385,855)$
Total Cash Cost (net of incentives) 632,504$ x
Utility Savings Cash Flows xBoiler Energy Savings Year 1 187,361$ Absorber Energy Purchases Year 1 (98,267)$ Electricity Savings Year 1 56,144$ Pumping Parasitic Loads Year 1 (10,986)$
First Year Savings 134,252$
Key Economic AssumptionsCooling Energy $0.100 / kWh (inflation factor = 4% / yr)Heating Energy $0.55 / NG-therm (inflation factor = 3% / yr)Existing Boiler / Chiller COPs 0.75 / 5.00Thermal Load Avg 120,000 GPD, with a 70.0 ºF temperature gain.Chromasun Solar THP Capacity 100 TR (cooling) @91% capacity factorCombined Tax Rate 44.3%
Simple Payback 4.96 YearsProject IRR 16.5% v.3.90

Colorado Department of Agriculture Renewable Heating & Cooling Roadmap December 15, 2013
Energy Intersections: Energy Strategy + Cross-‐Sector Collaboration 303.377.5006 • www.energyintersections.com Page 92 of 104
Appendix D: Greenhouse Hydronic Case Study
Ground Source Heat Pump Driven Cold & Hot Hydronic System Due to a lack of available data for specific electrical loads, the following analysis is anecdotal and expresses the benefits of a hydronic system for a greenhouse in four areas:
1. moving from forced-‐air cooling to hydronic heating and cooling, and the energy gains involved with forced-‐air versus hydronic;
2. implementing radiant floor cooling (RFC) below grade in the greenhouse, which can be combined with radiant floor heating (RFH) for dual functionality;
3. using a ground loop field as a high mass thermal sink which provides passive cooling with ground water in the loop; and
4. using a dual-‐process ground source heat pump where there are simultaneous loads for heating and cooling (reduces size of the loop field and doubles the efficiency of both processes).
The following table shows the savings potential of a forced-‐air system over radiant distribution—immediately the savings occur from replacing fans at 37.5% of energy use with limited ventilation fans using 1.5% and incurring a pumping load of 1.5%. Air transport is reduced from 9.3 to 1.9% of costs. Without doing anything else, a radiant hydronic system will use 40% less energy than the comparable forced-‐air system; the estimated ROI for this system would be above 20%, with an approximately 5-‐year payback.
Item % Power in VAV % Power in Radiant Cooling Fan and motor 37.5% 1.5%
Load from lights 18.8% 9.4%
Air transport load 9.3% 1.9%
Other loads 34.4% 34.4%
Pumps — 1.5%
Total 100% 57.7%
RFC can use passive cooling from the ground heat exchanger without operating the compressor. A 25 GPM circulating pump uses 2 amps at 240v = 480 watts. If the system circulates 50° F ground water through greenhouse and sending back down at 60 degrees (10° F delta T), the BTU production is 125,000 BTU/hour or the equivalent of 36kW of cooling. The efficiency factor (COP) is 36,000 watts out divided by 480 watts in or a COP of 75. Because this process would warm the ground, it could not be sustained at full operation throughout the summer; however, it could eliminate 20–25% of the greenhouse cooling loads. In contrast, a 10-‐ton (120,000 BTU/hour) heat pump with the compressor running would have a COP of 5.0, require 16,800 watts to power and use 35 times more energy than operating the passive circulation mode described above.
A ground heat exchanger can also be used to dump heat from large solar arrays, in lieu of oversizing storage for summer operation. A split ground loop heat exchanger is one example of implementing this capability.

Colorado Department of Agriculture Renewable Heating & Cooling Roadmap December 15, 2013
Energy Intersections: Energy Strategy + Cross-‐Sector Collaboration 303.377.5006 • www.energyintersections.com Page 93 of 104
Appendix E: Statewide Organizations Serving RH&C Applicable Sectors of Interest, Consultants to this Project & Other Contacts 25X’25 Mike Bowman [email protected]
Advanced Energy Systems Tim Olsen 303.908.2439 [email protected]
All American Energy Tom Potter [email protected]
Colorado Aquaculture Association 970.522.7980
Colorado Beef Council 303.830.7892 [email protected]
Colorado Brewers Guild John Carlson 303.507.7664 [email protected]
Colorado Egg Producers Bette Blinde 970.881.2902 [email protected]
Colorado Nursery and Greenhouse Association Sharon Harris 303.758.6672 [email protected]
Colorado Organic Producers Association 970.588.2292 [email protected]
Colorado Pork Producers Council Lauren Dever 303.637.9200 [email protected]
Colorado Potato Administrative Committee 970.352.5231 [email protected]
Colorado Renewable Energy Society (CRES) 303.806.5317 info@cres-‐energy.org
Colorado Solar Energy Industries Association (COSEIA) 303.333.7342 [email protected]
Colorado Wine Industry Development Board 720.304.3406 [email protected]
Energy Environmental Corp Al Wallace 303.877.5776 [email protected]
Energy Intersections, LLC Leslie Martel Baer 303.377.5006, x1 [email protected]
Geothermal Working Group/Climate Master Paul Bony [email protected]
Major Geothermal Joel Poppert 720.219.8340 [email protected]
National Agricultural Statistics Service Bill Meyer 303.236.2301 [email protected]
Natural Resources Conservation Service Eugene Backhaus 720.544.2868 [email protected]
RE-‐Align Technology Bob Kingston 970.333.8318 [email protected]

Colorado Department of Agriculture Renewable Heating & Cooling Roadmap December 15, 2013
Energy Intersections: Energy Strategy + Cross-‐Sector Collaboration 303.377.5006 • www.energyintersections.com Page 94 of 104
Rebecca English & Associations Becky English 303.728.4131 [email protected]
Rocky Mountain Farmers Union Bill Midcap 303.752.5800 [email protected]
Rocky Mountain Food Industry Association 303.830.7001 [email protected]
SolarWall by Conserval Engineering Todd Marron 416.319.6966, X227 [email protected]
Sustainability Management Services Samuel J. Anderson 720.336.3351 [email protected]
Western Dairy Association Bill Keating 720.356.3180 [email protected]

Colorado Department of Agriculture Renewable Heating & Cooling Roadmap December 15, 2013
Energy Intersections: Energy Strategy + Cross-‐Sector Collaboration 303.377.5006 • www.energyintersections.com Page 95 of 104
Appendix F: Survey of Producers’ Heating & Cooling Needs & Knowledge Please note: to conserve space, this serve does not show “screen breaks.” Each section was broken down into multiple screens to make it considerably more manageable for respondents to work with onscreen.
Have you been looking for ways to reduce your energy expenses? Or, protect yourself from the ups and downs of energy prices? If so, you will want to take this survey from the Colorado Department of Agriculture. While you answer questions about ways that you use heating and cooling in your operation, you also will learn about technologies that may help you reduce your heating and cooling costs. Taking the survey also may lead to opportunities for you to participate in subsidized demonstration projects of renewable heating and cooling systems and other programs.
The Colorado Department of Agriculture (CDA) is exploring whether agricultural operations and production costs could be improved through the sensible implementation of renewable heating and cooling technologies, such as geothermal heat pumps, solar hot water, or solar air heating.
To help us better understand how realistic these opportunities are, we have contracted with Energy Intersections, LLC, to prepare and conduct this survey about energy use in your operation and what you think about these heating and cooling technologies. This survey—which will take about 15 minutes—will also help the Department understand how we can better support your interest in these technologies and related programs. CDA will use this information to design programs—which may include education, financing, incentives or demonstration projects—to help you make good choices for your operation.
Please Note: We respect the confidentiality of your information. Survey responses will be combined together in the final report to CDA and will not identify individual operators. However, if you would like to allow us to ask you follow up questions or to share your situation as a case study, you will have the option of sharing your contact information at the end of the survey. Information provided in response to questions pertaining to the amount and costs of energy your operation uses will be treated as confidential commercial/financial information that is protected from public disclosure pursuant to section 24-‐72-‐204(3)(a)(IV), C.R.S.
Energy Intersections, LLC appreciates your help in determining the best uses for different renewable heating and cooling technologies (RH&Cs) in Colorado’s agricultural operations. Thank you in advance for participating in this survey. If you have any questions about this survey or the Department’s activities in agricultural energy efficiency and renewable energy, please contact Eric Lane, Conservation Services Director at the Colorado Department of Agriculture: [email protected] or (303) 239-‐4182.
About Your Operation To understand the energy requirements of your operation, we need to know a little bit about what you do. These questions will help us get a better picture of how you use energy.
1. Please indicate your agricultural sector(s). (Please check all that apply.)
a. Cattle
b. Pork

Colorado Department of Agriculture Renewable Heating & Cooling Roadmap December 15, 2013
Energy Intersections: Energy Strategy + Cross-‐Sector Collaboration 303.377.5006 • www.energyintersections.com Page 96 of 104
c. Poultry: meat
d. Poultry: egg production
e. Dairy
f. Grain
g. Seed
h. Beans
i. Crop farming (specify crops under “Other”)
j. Fruits/orchards
k. Greenhouse/nursery
l. Brewery
m. Winery
n. Food processing (specify foods under “Other”)
o. Other: ___________________________________________
2. What resources do you use in your operation for heating and cooling purposes only. (Please check all that apply.)
a. Natural gas
b. Propane
c. Utility-‐provided electricity
d. Other: ___________________________________________
3. About what percentage of your heating and cooling comes from each resource that you listed above?
a. Natural gas
b. Propane
c. Utility-‐provided electricity

Colorado Department of Agriculture Renewable Heating & Cooling Roadmap December 15, 2013
Energy Intersections: Energy Strategy + Cross-‐Sector Collaboration 303.377.5006 • www.energyintersections.com Page 97 of 104
d. Other:
4. Please estimate your average monthly expenses (as $/month) for your heating and cooling resources.
a. Natural gas
b. Propane
c. Utility-‐provided electricity
d. Other
5. Please describe any variations or patterns in your heating and cooling energy use, for example higher use on certain days of the week or months of the year.
We have a few more questions to help us understand how you use energy for heating and cooling.
6. Please rank the following uses of heating and cooling energy in your operation from 1 to 9, with 1 ranking as the highest expense and 9 ranking as the lowest expense.
a. Heating buildings or other spaces
b. Cooling buildings and other spaces
c. Domestic hot water
d. Industrial/process hot water (for steam, sterilization, etc.)
e. Heating for food processing
f. Cooling for food processing
g. Chemical manufacturing
h. Drying processes
i. Other: ___________________________________________
7. Please list the top five largest non-‐labor expenses in your operation (for example, rent, chemicals, taxes, energy for heating and cooling, feedstocks, electricity, water, fuel).
a. Expense #1 (largest) ___________________________________________
b. Expense #2 (second largest) ___________________________________________
c. Expense #3 (third largest) ___________________________________________

Colorado Department of Agriculture Renewable Heating & Cooling Roadmap December 15, 2013
Energy Intersections: Energy Strategy + Cross-‐Sector Collaboration 303.377.5006 • www.energyintersections.com Page 98 of 104
d. Expense #4 (fourth largest) ___________________________________________
e. Expense #5 (fifth largest) ___________________________________________
8. About how much do you spend on each of the top five expenses you listed in Question 7 per month ($/month)?
a. Expense #1 (largest)
b. Expense #2 (second largest)
c. Expense #3 (third largest)
d. Expense #4 (fourth largest)
e. Expense #5 (fifth largest)
9. About what percentage (%) of your total non-‐labor expenses is each of the top five expenses you listed in Question 7?
a. Expense #1 (largest) ___________________________________________%
b. Expense #2 (second largest) ___________________________________________%
c. Expense #3 (third largest) ___________________________________________%
d. Expense #4 (fourth largest) ___________________________________________%
e. Expense #5 (fifth largest) ___________________________________________%
10. Describe any situations in your operations where heating and cooling happen at the same time (although not necessarily in the same structure).
11. Are there any heating or cooling applications that are particularly problematic for you (for example, result in large expenses, are difficult to maintain at desired temperature, or cause extra work or time)? What is your operation’s biggest concern with respect to heating and cooling?
Background on Renewable Heating & Cooling Now let’s talk in more detail about renewable heating and cooling technologies (RH&Cs). Most ag ventures use energy for powering tools (electricity), heating and cooling (thermal energy) and moving people and things around (transportation). While most ag businesses use all of these types of energy, each operation is unique and will use different amounts of each kind of energy.
There are many ways to meet these different energy demands. Electricity needs, for example, can be met by combining efficient equipment with a variety of electricity generation, for example from a

Colorado Department of Agriculture Renewable Heating & Cooling Roadmap December 15, 2013
Energy Intersections: Energy Strategy + Cross-‐Sector Collaboration 303.377.5006 • www.energyintersections.com Page 99 of 104
utility or solar photovoltaic (PV) panels on your roof. The same is true of heating and cooling—or thermal—energy needs. Energy efficiency technologies like insulation and heating and cooling equipment such as infrared heaters, dryers and refrigeration units help you get the job done. As with electricity, there are renewable technologies that perform this heating and cooling work without the use of fossil fuels.
12. Are you familiar with renewable heating and cooling technologies (RH&Cs)?
a. Yes
b. No
13. Which RH&Cs do you know about? (1 means you could describe the pros and cons of the technology in some detail, 3 means you have heard of the technology but don’t know the details, 5 means you haven’t heard about the technology.)
a. Geothermal heat pumps
b. Solar air heating/cooling/ventilation
c. Liquid-‐based solar thermal
d. Biomass combustion
e. Biomass anaerobic digestion
f. Biomass pyrolysis
g. Biomass combined heat and electric power (CHP) There are several renewable technologies for heating and cooling that are very effective but not very well known. To make sure that we are all thinking of the same technologies, we’ll describe the main RH&Cs here.
Geothermal heat pump systems tap into the energy that the sun delivers to the ground by circulating a liquid through the ground and delivering it to a structure. When heat is needed, for example to warm a greenhouse or pasteurize milk, the system moves heat from the ground and delivers it to the structure. When cooling is required for processes like flash chilling fruits or refrigerating milk, the system reverses the process and stores the excess heat in the ground until needed. These systems effectively “compress” heating or cooling, delivering very hot or very cold temperatures, and everything in between. Because these systems pull energy from the ground, they can operate around the clock, not just during daylight hours.
Solar air heating and ventilation systems use panels on the outside of a building to heat fresh air and circulate it through the building using natural convection and some ventilation equipment. These systems can move large volumes of air, heating to desired levels. They can also be used to pull hot air from inside a building to the outside and draw in cooler outside air. These systems can be effective in

Colorado Department of Agriculture Renewable Heating & Cooling Roadmap December 15, 2013
Energy Intersections: Energy Strategy + Cross-‐Sector Collaboration 303.377.5006 • www.energyintersections.com Page 100 of 104
conditioning spaces in poultry operations, as well as drying ag co-‐products such as manure and brewery residuals.
Liquid-‐based solar thermal systems circulate a liquid through panels mounted on a roof or the ground in direct sunlight. The heated liquid circulates to the structure to deliver the heat energy where needed. There are low temperature systems that heat a barn or office, provide hot water for washing, preheat water or industrial processes, and even melt snow or heat floors, sidewalks or drives. High temperature systems produce very hot water or steam that can be used for sterilization or for process heat. These systems use storage tanks so that they keep working even after the sun goes down.
Biomass energy systems use a residual product such as excess silage or corn stover, brewery residuals, and animal manures to produce heat. Simple systems include biomass boilers that directly burn residuals to produce heat for a space, water or a process. More complex systems can produce heat and other products: anaerobic digesters, pyrolysis and combined heat and power systems can produce heat as well as either fuels or electricity.
All of the systems just described can be precisely controlled to achieve consistent heating or cooling. However, because each system has different characteristics and costs, each is optimal in different settings. For example, solar thermal and geothermal require no fuels or energy inputs other than the operation of small electric pumps. Biomass energy has operational costs associated with preparing and transporting the residuals, which can be cost effective if located in a community with dependable quantities of residuals.
Using Renewable Heating & Cooling (RH&Cs) in Colorado Agriculture
14. Please indicate any renewable heating and cooling systems (RH&Cs) that you are currently using in your operation. (Please check all that apply.)
a. Geothermal: heat pump heating
b. Geothermal: heat pump cooling
c. Geothermal: direct heating (using a “hot spot” under the ground)
d. Solar thermal: air heating/cooling/ventilation
e. Solar thermal: liquid-‐based heating
f. Solar thermal: liquid-‐based cooling
g. Biomass: wood chip boiler
h. Biomass: pellet stove
i. Biogas
j. Biomass: anaerobic digester

Colorado Department of Agriculture Renewable Heating & Cooling Roadmap December 15, 2013
Energy Intersections: Energy Strategy + Cross-‐Sector Collaboration 303.377.5006 • www.energyintersections.com Page 101 of 104
k. Biomass: pyrolysis
l. Biomass: combined heat and electric power (CHP)
m. Other: ___________________________________________
n. None of the above
15. Do you know of an agricultural operator(s) using any of the above listed RH&C systems?
a. Yes (go to 16)
b. No (skip 17)
16. If you are comfortable sharing the contact information of the operator(s) with the RH&C system with us so we may learn about the pros and cons of their system, please do so here. (Provide whatever contact information you feel is appropriate and can easily access.)
a. First and Last Name:
b. Phone Number:
c. Email Address:
d. Business Name:
e. Location (City/County):
f. Agricultural Sector (e.g., dairy, poultry, grain, fruit):
g. Name additional operators who may want to explore RH&C:
17. What organizations in your agricultural sector should we contact for additional information about existing and potential use of RH&C technologies? (Please include contact information if you have it.)
a. Organization Name:
b. First and Last Name (for a key individual):
c. Phone Number:
d. Email Address:
e. Location (City/County):

Colorado Department of Agriculture Renewable Heating & Cooling Roadmap December 15, 2013
Energy Intersections: Energy Strategy + Cross-‐Sector Collaboration 303.377.5006 • www.energyintersections.com Page 102 of 104
f. Agricultural Sector (e.g., dairy, poultry, grain, fruit):
18. Please describe specific heating or cooling needs in your operation that you think could be good opportunities to employ RH&C technologies.
19. Please rank your barriers to adopting one or more of these RH&C technologies into your operation, where 1 is the biggest barrier and 7 is the smallest barrier
a. Information / education / training
b. Cost
c. Financing
d. Permits, regulations
e. Technical barriers
f. Uncertainty, risks
g. Other: ___________________________________________
20. If you would like assistance with any of these barriers, which ones?
21. Are you familiar with USDA’s Rural Energy for America Program (REAP) grants and loans? (1 means you are very familiar and know the details, 3 means you have heard of it but don’t many details, 5 means you haven’t heard about the program.)
a. Scale of 1 to 5
22. Are you familiar with the Federal Investment Tax Credit available from the federal government for investment in geothermal, solar thermal and certain biomass heating systems? (1 means you are very familiar and know the details, 3 means you have heard of it but don’t many details, 5 means you haven’t heard about the tax credit.)
a. Scale of 1 to 5
23. Please rank the effectiveness of your sources of information about heating and cooling technologies and managing heating and cooling costs with 1 as the most important or trusted source, and 7 as the least important or trusted source.
a. USDA
b. Colorado Department of Agriculture

Colorado Department of Agriculture Renewable Heating & Cooling Roadmap December 15, 2013
Energy Intersections: Energy Strategy + Cross-‐Sector Collaboration 303.377.5006 • www.energyintersections.com Page 103 of 104
c. Neighbors/coffee shop
d. Bankers/finance people
e. Local agricultural co-‐op
f. Local energy company/provider
g. Other: ___________________________________________
24. What kind of technical or financial assistance would you like the Colorado Department of Agriculture to offer to help you implement renewable heating and cooling technologies in your operation? (Please check all that apply.)
a. Seminars on RH&C technologies
b. Demonstration project incentives
c. Help locating financing partners
d. Engineering support
e. Other: ___________________________________________
25. How could the Colorado Department of Agriculture make it easier for you to access and participate in these programs if they were offered to you?
Permission As we mentioned earlier, we respect the confidentiality of your. Survey responses will be combined together in the final report to CDA and will not identify individual operators. Information provided in response to questions pertaining to the amount and costs of energy your operation uses will be treated as confidential commercial/financial information that is protected from public disclosure pursuant to section 24-‐72-‐204(3)(a)(IV), C.R.S.
26. Do you give permission for Energy Intersections, on behalf of the Colorado Department of Agriculture, to collected and report your information combined with information provided by other producers?
a. Yes
b. No
27. May we contact you if you need we to clarify an answer, if we would like to ask permission to use your situation as a case study, or if we need further contact information for one of your referrals? If so, please enter your contact information here:

Colorado Department of Agriculture Renewable Heating & Cooling Roadmap December 15, 2013
Energy Intersections: Energy Strategy + Cross-‐Sector Collaboration 303.377.5006 • www.energyintersections.com Page 104 of 104
a. First and Last Name:
b. Phone Number:
c. Email Address:
d. Location (City/County):
e. Business Name:
f. Agricultural Sector (e.g., dairy, poultry, grain, fruit):
Renewable Heating & Cooling Survey Complete. Thank you! Your information has been submitted. We appreciate your assistance. Your information will help make CDA programs about heating and cooling more effective for operators like you and may lead to assistance programs and subsidized demonstration projects.
If you have any questions about this survey or the Department’s activities in agricultural energy efficiency and renewable energy, please contact Eric Lane, Conservation Services Director at the Colorado Department of Agriculture: [email protected] or (303) 239-‐4182. Thank you very much!