colorado community corrections - colorado … · presentation to interim committee on opioid and...
TRANSCRIPT
COLORADO COMMUNITY CORRECTIONSMODERN TRENDS IN RISK, NEED, AND BEHAVIORAL HEALTH DISORDERS
Presentation to Interim Committee on Opioid and Substance Use DisordersColorado General AssemblyAugust 22, 2017
Glenn A. Tapia, Director of Community CorrectionsColorado Department of Public SafetyDivision of Criminal Justice

TODAYS AGENDA
1. Basic Structure, Types and Locations of Community Corrections Programs
2. Evidence Based Risk Reduction – Our New Statutory Purpose
3. Basic Data and Facts about Colorado Community Corrections
Client Data Trends in Risk, Need, Substance Abuse and Mental Illness
Outcomes

DIVISION OF CRIMINAL JUSTICE (DCJ)STATUTORY RESPONSIBILITIES
Administer Funding to Boards/Program ($68,000,000 in FY18)
Establish State Standards for Program Performance
Audit for Compliance with Standards
Evaluate and Report Program Performance
Training and Technical Assistance to Boards and Programs
Local Governments (Community Corrections Boards) also co-regulate, monitor and assist community corrections facilities.
3

# of Facilities in District
No Facility in District
Facility Pending/Planned
Roughly 4000 Physical Beds and 3700 Funded Beds
Statewide

Diversion (Direct Sentence)
(Prison Sentence)
Parole (DOC)
Transition (within Prison Sentence)(Roughly 33% of Prison Releases)
Parole
(Roughly 67% of Prison Releases)
Non Residential (Diversion)
GENERAL TYPES OF PROGRAMS
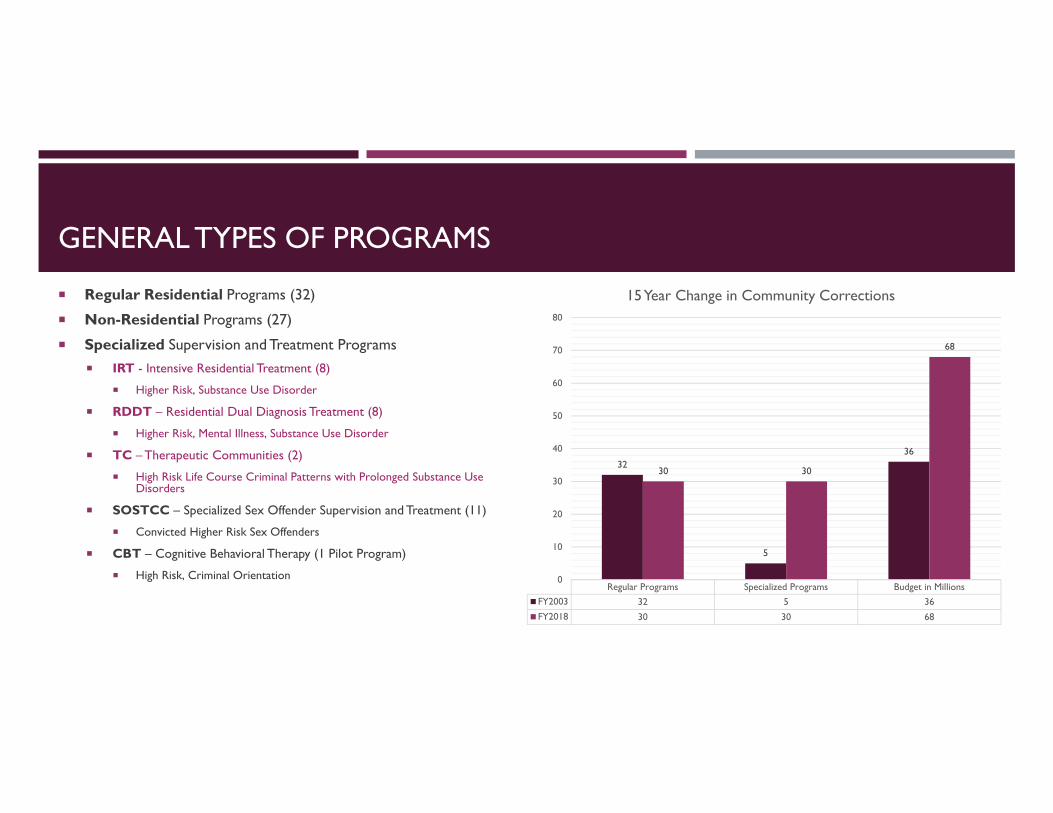
Regular Residential Programs (32)
Non-Residential Programs (27)
Specialized Supervision and Treatment Programs IRT - Intensive Residential Treatment (8)
Higher Risk, Substance Use Disorder
RDDT – Residential Dual Diagnosis Treatment (8)
Higher Risk, Mental Illness, Substance Use Disorder
TC – Therapeutic Communities (2)
High Risk Life Course Criminal Patterns with Prolonged Substance Use Disorders
SOSTCC – Specialized Sex Offender Supervision and Treatment (11)
Convicted Higher Risk Sex Offenders
CBT – Cognitive Behavioral Therapy (1 Pilot Program)
High Risk, Criminal OrientationRegular Programs Specialized Programs Budget in Millions
FY2003 32 5 36FY2018 30 30 68
32
5
36
30 30
68
0
10
20
30
40
50
60
70
80
15 Year Change in Community Corrections

Dual Diagnosis (MH & SA)5% Medications
2%
Mental Health16%
Recovery Support (10%)9%
Substance Abuse68%
Correctional Treatment Fund ExpendituresFY2017 Outpatient Funds

INTENSIVE RESIDENTIAL TREATMENT (IRT) PROGRAMS
90 Day Inpatient Treatment for High Risk, High Need, and Substance Use Disorders
20 Hours of Clinical/Cognitive Behavioral Substance Abuse Therapy (per week)
20 Hours of Additional Treatment Support Interventions (per week)
Must be formally assessed as needing Level 4c (IRT) Treatment with Standardized Offender Assessment
No Employment or Community Access while in IRT
Has Capacity for Condition of Probation (48 Beds) and Drug Related Misdemeanants
Program Locations (237 Funded Beds Total)1. Larimer County Community Corrections (Fort Collins) – 47 Beds
2. Mesa County Community Corrections (Grand Junction) – 18 Beds
3. Advantage Treatment Center (Sterling) – 31 Beds
4. COMCOR Inc (Colorado Springs) – 40 Beds
5. CORECIVIC Fox – (Denver) – 53 Beds
6. Intervention – Weld (Greeley) – 12 Beds
7. Intervention West (Lakewood) – 12 Beds
8. Advantage Treatment Center (Alamosa) – 24 Beds

RESIDENTIAL DUAL DIAGNOSIS TREATMENT (RDDT) PROGRAMS
Inpatient Treatment for High Risk, High Need, and Dually Diagnosed (Mental Illness/Substance Use Disorders)
8 Hours of Clinical/Cognitive Behavioral Dual Diagnosis Therapy (per week)
Employment or Community Access Depends on the Individual
Program Locations (131 Funded Beds Total)
1. Larimer County Community Corrections (Fort Collins) – 22 Beds
2. Independence House Fillmore (Denver) – 40 Beds
3. Mesa County Community Corrections (Grand Junction) – 13 Beds
4. CORECIVIC – CCTC (Centennial) – 9 Beds
5. Intervention – Weld (Greeley) – 5 Beds
6. Intervention – JeffCo (Lakewood) – 30 Beds
7. Intervention (Pueblo) – 5 Beds
8. COMCOR Inc (Colorado Springs) – 7 Beds
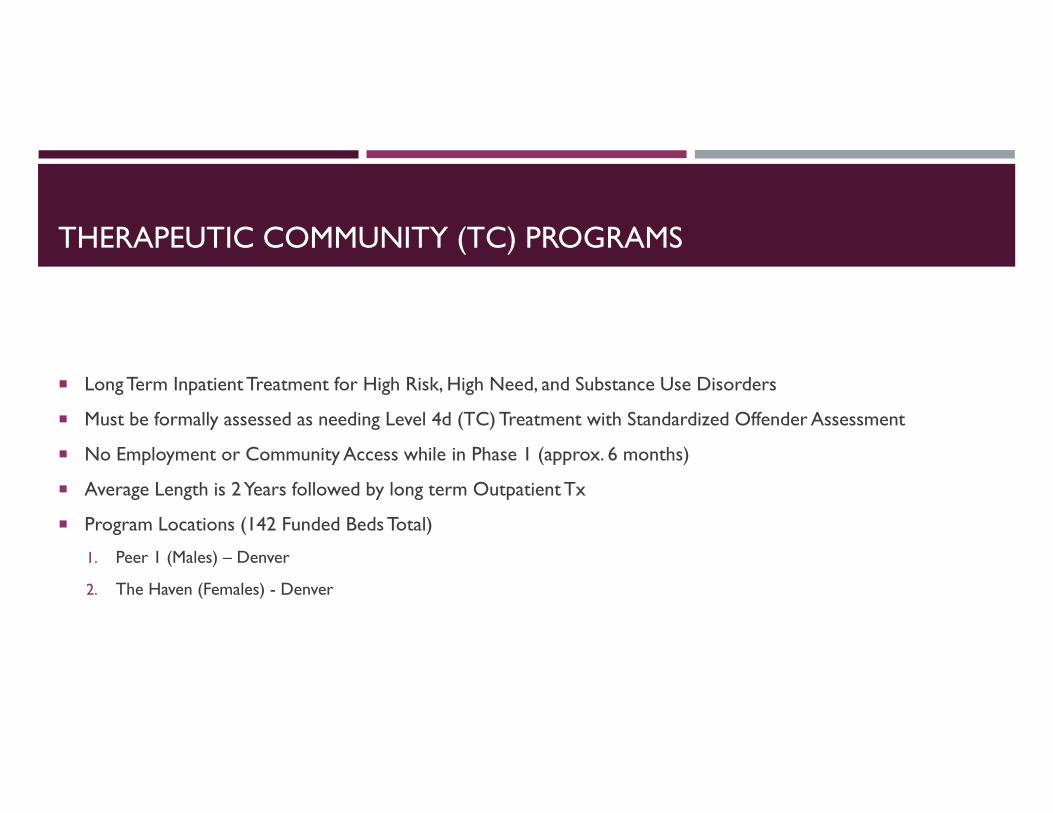
THERAPEUTIC COMMUNITY (TC) PROGRAMS
Long Term Inpatient Treatment for High Risk, High Need, and Substance Use Disorders
Must be formally assessed as needing Level 4d (TC) Treatment with Standardized Offender Assessment
No Employment or Community Access while in Phase 1 (approx. 6 months)
Average Length is 2 Years followed by long term Outpatient Tx
Program Locations (142 Funded Beds Total)
1. Peer 1 (Males) – Denver
2. The Haven (Females) - Denver
DATA TRENDS IN COMMUNITY CORRECTIONS POPULATIONSRISK/NEED/RESPONSIVITY PERSPECTIVE
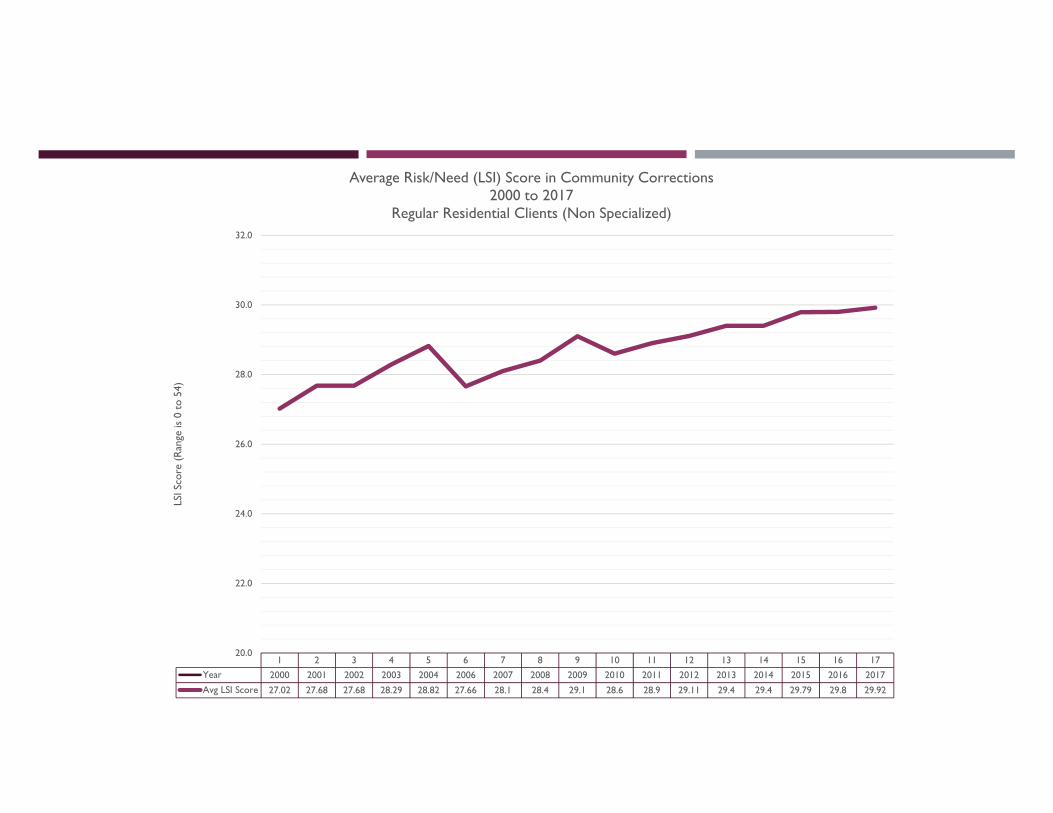
1 2 3 4 5 6 7 8 9 10 11 12 13 14 15 16 17Year 2000 2001 2002 2003 2004 2006 2007 2008 2009 2010 2011 2012 2013 2014 2015 2016 2017Avg LSI Score 27.02 27.68 27.68 28.29 28.82 27.66 28.1 28.4 29.1 28.6 28.9 29.11 29.4 29.4 29.79 29.8 29.92
20.0
22.0
24.0
26.0
28.0
30.0
32.0
LSI S
core
(Ran
ge is
0 t
o 54
)Average Risk/Need (LSI) Score in Community Corrections
2000 to 2017Regular Residential Clients (Non Specialized)
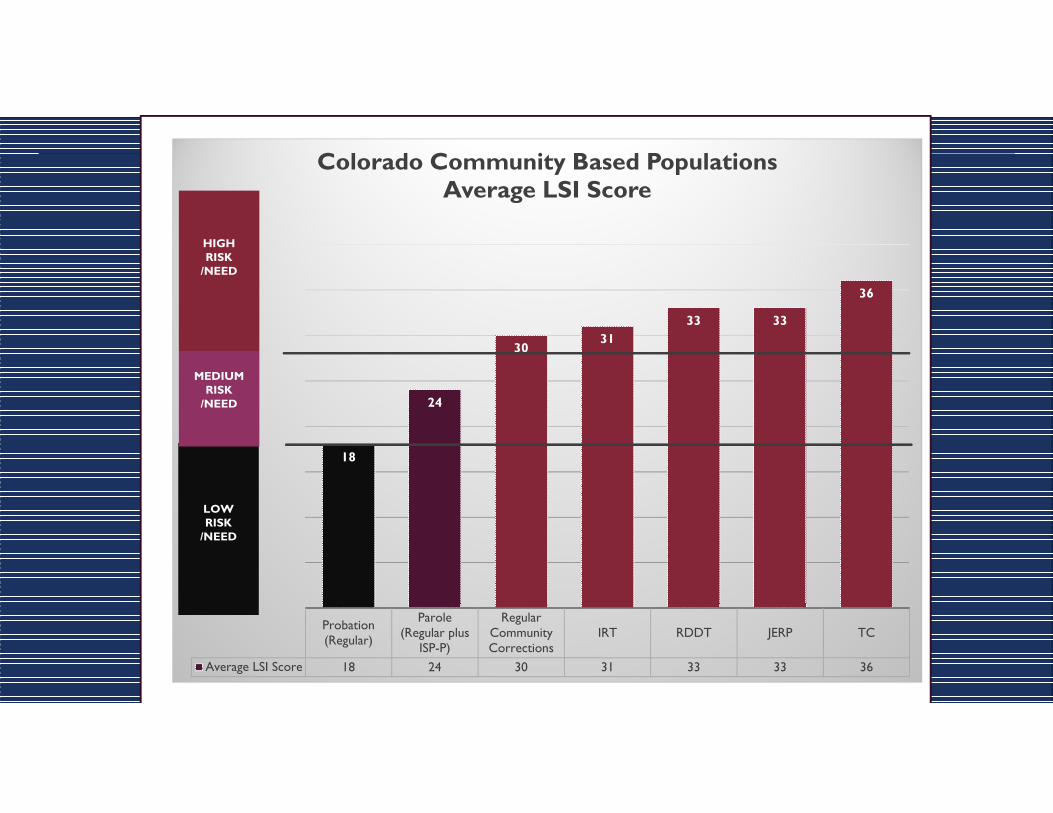
Probation(Regular)
Parole(Regular plus
ISP-P)
RegularCommunityCorrections
IRT RDDT JERP TC
Average LSI Score 18 24 30 31 33 33 36
18
24
3031
33 33
36
AV
G L
SI S
core
Colorado Community Based PopulationsAverage LSI Score
LOW RISK
/NEED
MEDIUM RISK
/NEED
HIGHRISK
/NEED

6.7%
3.0%
36.1%
26.1%
10.0%8.2%
3.7% 1.1%
0.00%
5.00%
10.00%
15.00%
20.00%
25.00%
30.00%
35.00%
40.00%
Level 1 - NoTreatmentRequired
Level 2 - Drug &Alcohol Education
Level 3 - WeeklyOutpatient
Therapy (WOP)
Level 4a -Enhanced
OutpatientTherapy (EOP)
Level 4b -Intensive
OutpatientTherapy (IOP)
Level 4c -Intensive
ResidentialTreatment (IRT)
Level 4d -Therapeutic
Community (TC)
Level 5 - MentalHealth/Medical
Referral
Assessed and Recommended Substance Abuse Treatment NeedsFY2017 Terminations
Regular (Non-Specialized) Residential Population in Community Corrections
Series1
HB 91-1173

Source: Colorado Division of Criminal Justice, Office of Research and StatisticsCommunity Corrections in Colorado: Program Outcomes and Recidivism, FY2012-13

Source: Colorado Division of Criminal Justice, Office of Research and StatisticsSpecial Analysis in Preparation for Report (Community Corrections in Colorado: Program Outcomes and Recidivism, [2017 Report Forthcoming])

FY09 FY10 FY11 FY12 FY13 FY14 FY15 FY16 FY17Mental Illness Rate 14.4% 17.6% 17.8% 20.7% 22.0% 24.0% 25.2% 28.2% 29.2%
0.0%
5.0%
10.0%
15.0%
20.0%
25.0%
30.0%
35.0%
Men
tal I
llnes
s R
ate
(Per
cent
of A
ll C
lient
s)
Mental Illness Rate TrendsFY09 through FY17 (9-Year Trend)
Colorado Community Corrections - Regular Residential Clients (Non-Specialized)
FY09 FY10 FY11 FY12 FY13 FY14 FY15 FY16 FY17Male 9.7% 12.2% 13.6% 14.7% 17.2% 18.2% 19.2% 22.4% 23.5%
Female 32.2% 37.8% 37.6% 47.0% 45.6% 50.4% 50.1% 52.1% 53.0%
0.0%
10.0%
20.0%
30.0%
40.0%
50.0%
60.0%
Men
tal I
llnes
s R
ate
(Per
cent
of A
ll C
lient
s)
Mental Illness Rate Trends (by Gender)FY09 through FY17 (9-Year Trend)
Colorado Community Corrections - Regular Residential Clients (Non-Specialized)

Non Drug Related
Technical Violation
50%
Drug Related Technical Violation
50%
Technical Violations in Community CorrectionsRegular Residential Clients (Non Specialized)
FY2017 Clients
35%32%
36%
40%38%
42%
47% 48%
65%68%
64%
60%62%
58%
53% 52%
0%
10%
20%
30%
40%
50%
60%
70%
80%
FY10 FY11 FY12 FY13 FY14 FY15 FY16 FY17
Drug Related vs Non Drug Related Technical ViolationsTrends - FY10 though FY17
Regular Residential Clients (Non Specialized)
Drug Related
Non Drug Related

13.1%
16.6% 17.0%
18.8% 18.3%
0.0%
5.0%
10.0%
15.0%
20.0%
25.0%
30.0%
35.0%
40.0%
45.0%
50.0%
FY13 FY14 FY15 FY16 FY17
Perc
ent
of A
ll D
rug
Rel
ated
Tec
hnic
al V
iola
tions
Substance Use Discharge Trends - FY13 through FY17(Percent of All Drug Related Technical Violations)
Regular Residential Clients (Non Specialized)
Amphetamine
Opiates
Alcohol
Marijuana
Other Unknown

FY10 FY11 FY12 FY13 FY14 FY15 FY16 FY17Residential Clients 17.60% 17.80% 20.70% 22.00% 24.00% 25.20% 28.20% 29.20%
IRT Clients 19.10% 14.30% 24.40% 23.70% 31.50% 33.40% 40.90% 47.40%
0.00%
5.00%
10.00%
15.00%
20.00%
25.00%
30.00%
35.00%
40.00%
45.00%
50.00%
Men
tal I
llnes
s R
ate
(Per
cent
of A
ll C
lient
s)Mental Illness Rate Trends
Regular Residential vs Intensive Residential Treatment PlacementsFY10 through FY17 (8-Year Trend)Colorado Community Corrections
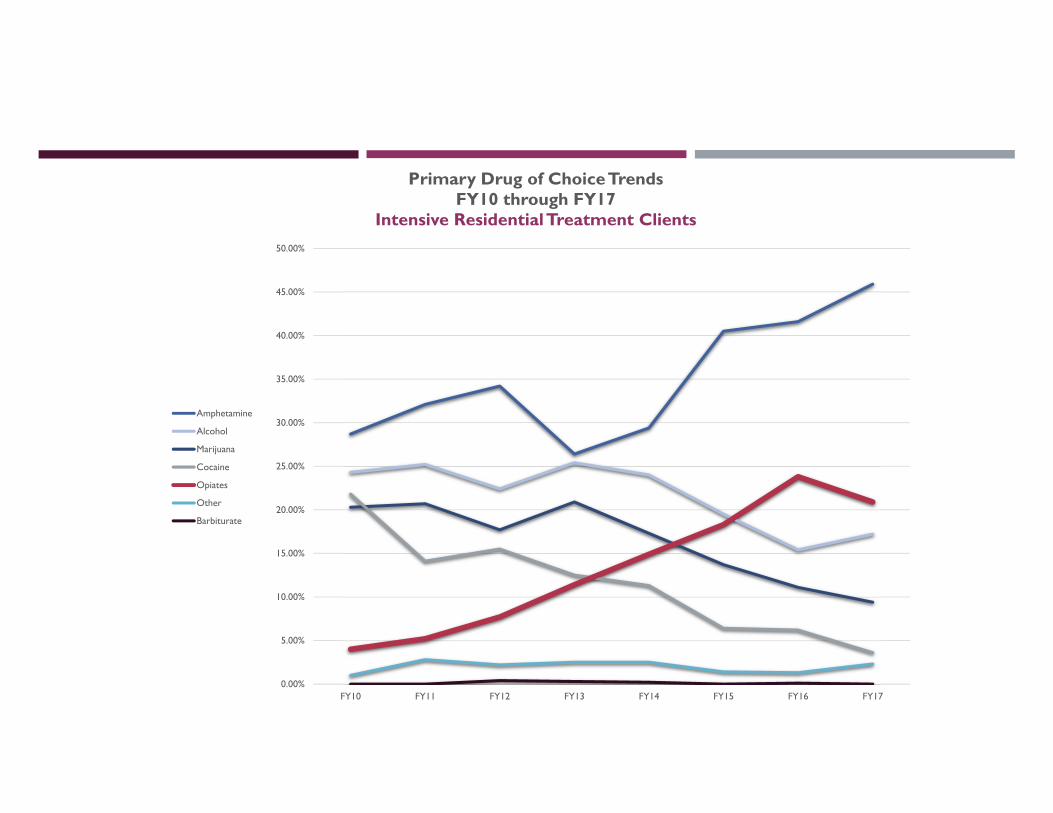
0.00%
5.00%
10.00%
15.00%
20.00%
25.00%
30.00%
35.00%
40.00%
45.00%
50.00%
FY10 FY11 FY12 FY13 FY14 FY15 FY16 FY17
Primary Drug of Choice TrendsFY10 through FY17
Intensive Residential Treatment Clients
Amphetamine
Alcohol
Marijuana
Cocaine
Opiates
Other
Barbiturate

0.00%
5.00%
10.00%
15.00%
20.00%
25.00%
30.00%
35.00%
40.00%
45.00%
50.00%
FY10 FY11 FY12 FY13 FY14 FY15 FY16 FY17
Primary Drug of Choice TrendsFY10 through FY17
Residential Dual Diagnosis Treatment Clients
Amphetamine
Alcohol
Marijuana
Cocaine
Opiates
Other

OUTCOMES IN COMMUNITY CORRECTIONS
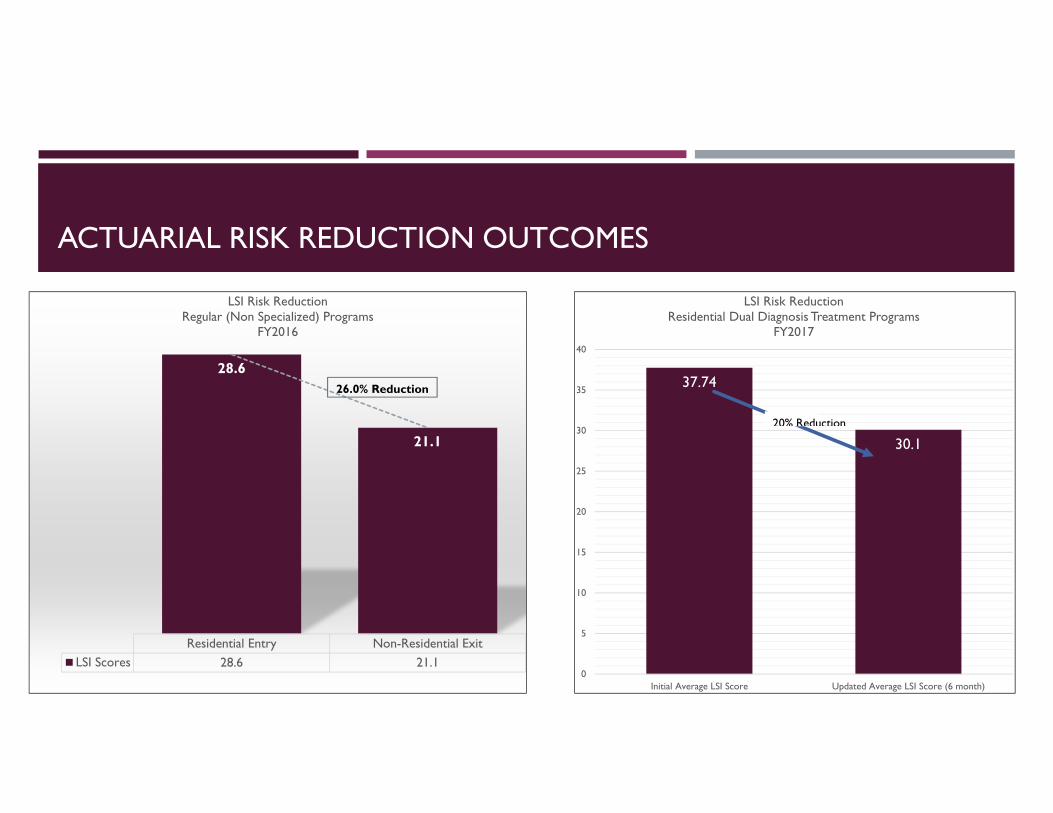
Residential Entry Non-Residential ExitLSI Scores 28.6 21.1
28.6
21.1
LSI Risk ReductionRegular (Non Specialized) Programs
FY2016
26.0% Reduction 37.74
30.1
0
5
10
15
20
25
30
35
40
Initial Average LSI Score Updated Average LSI Score (6 month)
LSI Risk ReductionResidential Dual Diagnosis Treatment Programs
FY2017
20% Reduction
ACTUARIAL RISK REDUCTION OUTCOMES

Source: Colorado Division of Criminal Justice, Office of Research and StatisticsCommunity Corrections Profilehttps://www.colorado.gov/pacific/dcj-ors/community-corrections-profile

1 Year Recidivism Rates 2 Year Recidivism RatesRegular Residential Programs 16.90% 29.90%
Residential Dual Diagnosis Programs 14.60% 15.20%Therapeutic Community Programs 10.50% 20.50%Intensive Residential Treatment Programs 23.70% 38.00%
0.00%
5.00%
10.00%
15.00%
20.00%
25.00%
30.00%
35.00%
40.00%
Perc
ent
Rec
idiv
atin
gComparison of Regular and Specialized Programs
1 YR and 2 YR Recidivism Rates (2011 Client Terminations)(source: Office of Research and Statistics,Community Corrections in Colorado: Program Outcomes and Recidivism, FY 2012-13)

PROGRAM QUALITY MATTERS
Provider 1 Provider 2Recidivated 19.3% 25.3%
0.0%
5.0%
10.0%
15.0%
20.0%
25.0%
Perc
ent R
ecid
ivis
m
Comparison of IRT Programs1 YR Recidivism Rates (2011 Client Terminations)
(source: Office of Research and Statistics, Division of Criminal Justice)

FINAL SUMMARY
Community corrections in Colorado has 32 facilities. Within these facilities we have 30 specialized programs, 18 of which focus on substance abuse and/or mental illness
A majority of the budgetary and programmatic growth in community corrections has occurred in specialized inpatient treatment programs as well as outpatient services through the Correctional Treatment Funds
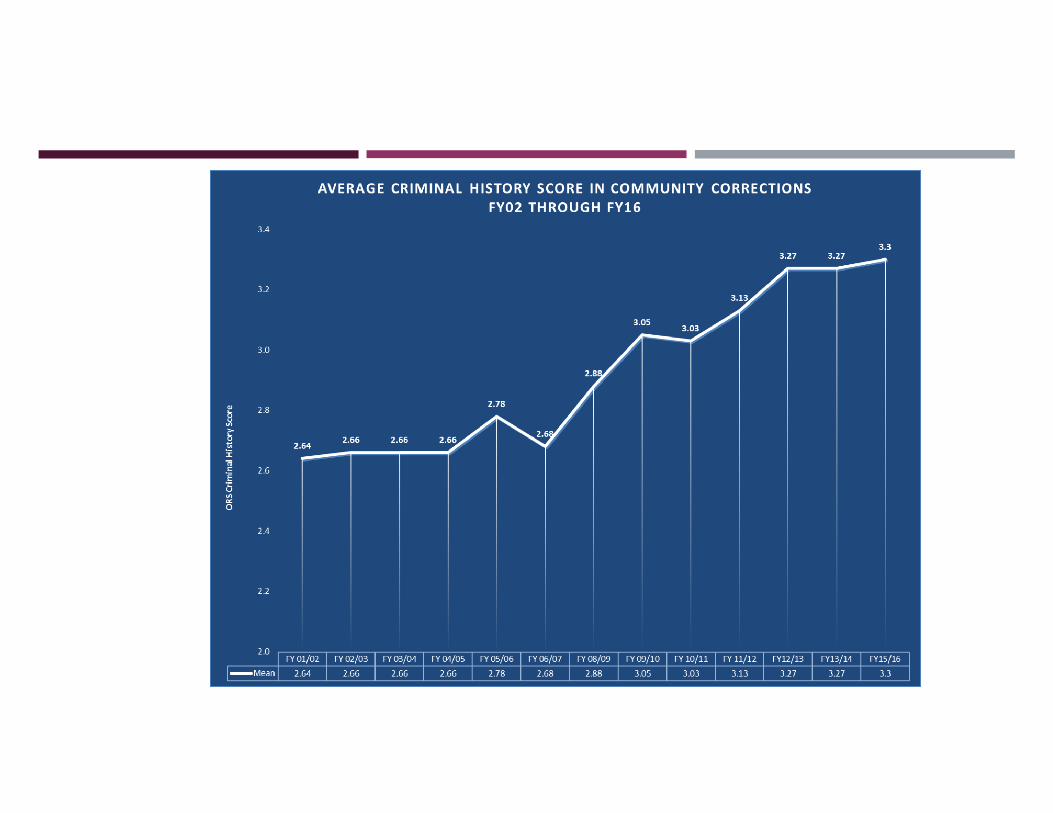
Clients admitted to community corrections have growing levels of assessed risks/needs and diagnosed mental illness
Clients in community corrections are higher risk/need than those in parole and probation
Substance abuse treatment matching matters – up to 24% reduction in recidivism
Drug related technical violations have increased while technical violations for other behavioral problems have decreased
Trends in clients admitted to inpatient treatment programs show increased preferences for amphetamines and opiates with synthetic drugs being next in line
Community corrections reduces risk of recidivism in both regular and dual diagnosis programs
Recidivism is lower today than in the past
Program quality matters