colorado potato certification service annual...
TRANSCRIPT
Colorado Potato Certification Service
Annual Summary 2017 Crop
In conjunction with
CCPGA Annual Meeting
February 5, 2018
Staff Listing – page 1
Bulk Shipment History Chart – page 2
Acres Entered/Accepted Table – page 3
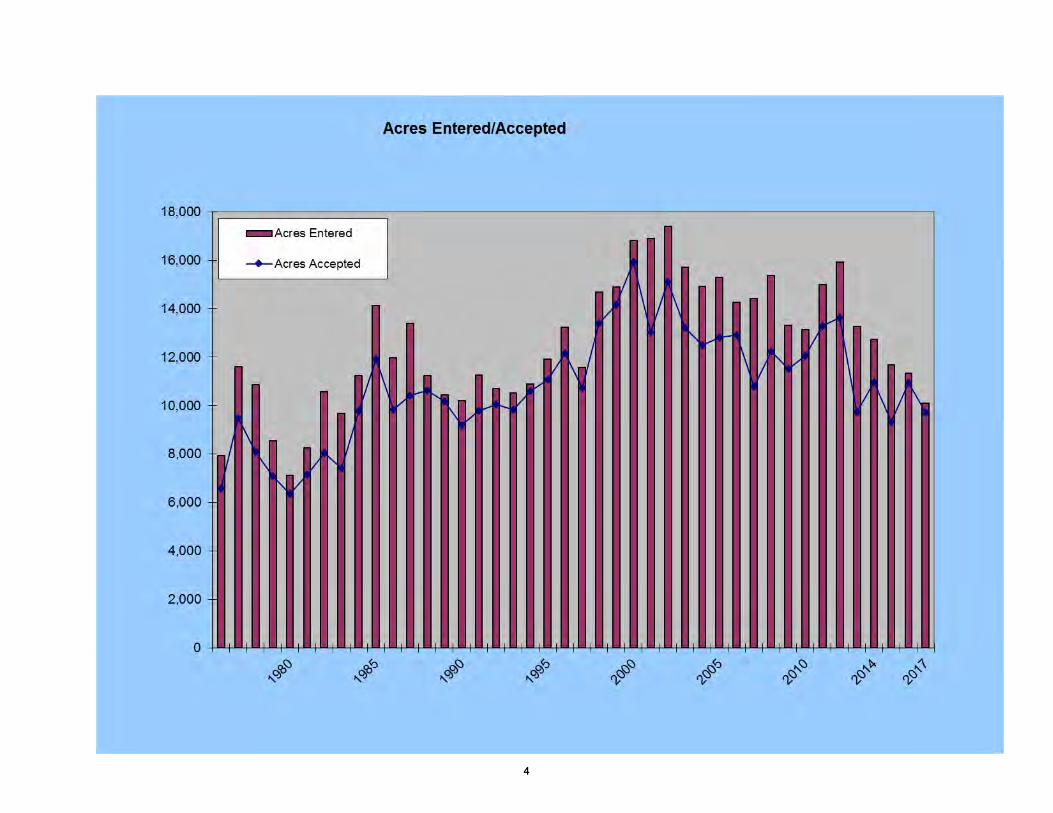
Acres Entered/Accepted Chart – page 4
Variety acreage entered 2014/2017 comparison – page 5
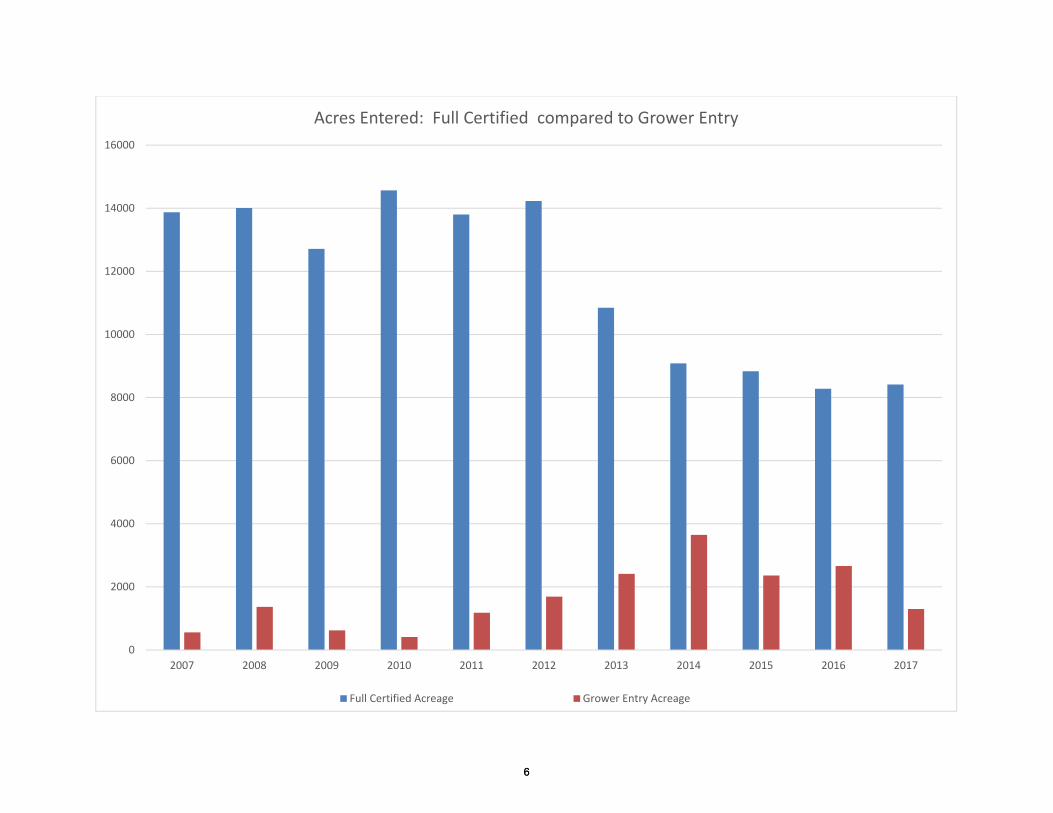
Grower Entry/Full Certified Acreage Comparison Chart – page 6
Grower Entry/Full Certified Acreage Tables – page 7-8
Tissue Culture Laboratory Summary – page 9
Disease Testing Laboratory Summary – page 10-11
2017 Crop Post Harvest Test Summary - page 12
Total Acreage Rejected for Mosaic – page 13
PCS General Budget Worksheet Fiscal YTD – page 14
Colorado Potato Certification Service Colorado State University
located at San Luis Valley Research Center 0249 East County Road 9 North
Center, CO 81125 719‐754‐3496
Fax 719‐754‐2619
Manager
Andrew Houser, M.S.
Extension 26
Disease Testing Specialist
Teresa Almeida
Extension 18
Research Associate II
Rick Haslar
Extension 22
Research Associate I
Sarah Shawcroft
Extension 18
Research Coordinator
Michelle Leckler
Extension 10
Assistant Manager
Sarah Noller, M.S.
Extension 20
Tissue Culture Manager
Carolyn Keller
Extension 29
Accounting Technician III
Sharon Yust
Extension 17
Field Man
Jeff Shawcroft
Extension 25
potatoes.colostate.edu
11
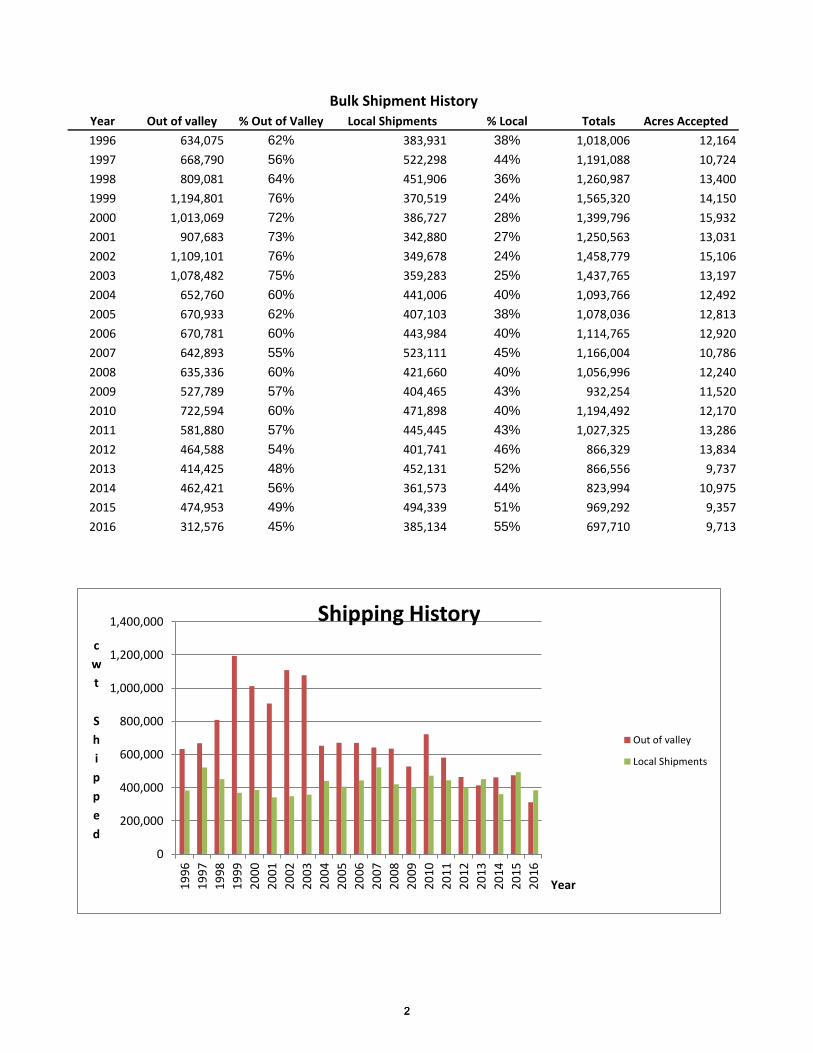
Year Out of valley % Out of Valley Local Shipments % Local Totals Acres Accepted
1996 634,075 62% 383,931 38% 1,018,006 12,164
1997 668,790 56% 522,298 44% 1,191,088 10,724
1998 809,081 64% 451,906 36% 1,260,987 13,400
1999 1,194,801 76% 370,519 24% 1,565,320 14,150
2000 1,013,069 72% 386,727 28% 1,399,796 15,932
2001 907,683 73% 342,880 27% 1,250,563 13,031
2002 1,109,101 76% 349,678 24% 1,458,779 15,106
2003 1,078,482 75% 359,283 25% 1,437,765 13,197
2004 652,760 60% 441,006 40% 1,093,766 12,492
2005 670,933 62% 407,103 38% 1,078,036 12,813
2006 670,781 60% 443,984 40% 1,114,765 12,920
2007 642,893 55% 523,111 45% 1,166,004 10,786
2008 635,336 60% 421,660 40% 1,056,996 12,240
2009 527,789 57% 404,465 43% 932,254 11,520
2010 722,594 60% 471,898 40% 1,194,492 12,170
2011 581,880 57% 445,445 43% 1,027,325 13,286
2012 464,588 54% 401,741 46% 866,329 13,834
2013 414,425 48% 452,131 52% 866,556 9,737
2014 462,421 56% 361,573 44% 823,994 10,975
2015 474,953 49% 494,339 51% 969,292 9,357
2016 312,576 45% 385,134 55% 697,710 9,713
Bulk Shipment History
0
200,000
400,000
600,000
800,000
1,000,000
1,200,000
1,400,000
19
96
19
97
19
98
19
99
20
00
20
01
20
02
20
03
20
04
20
05
20
06
20
07
20
08
20
09
20
10
20
11
20
12
20
13
20
14
20
15
20
16
c
w
t
S
h
i
p
p
e
d
Year
Shipping History
Out of valley
Local Shipments
22
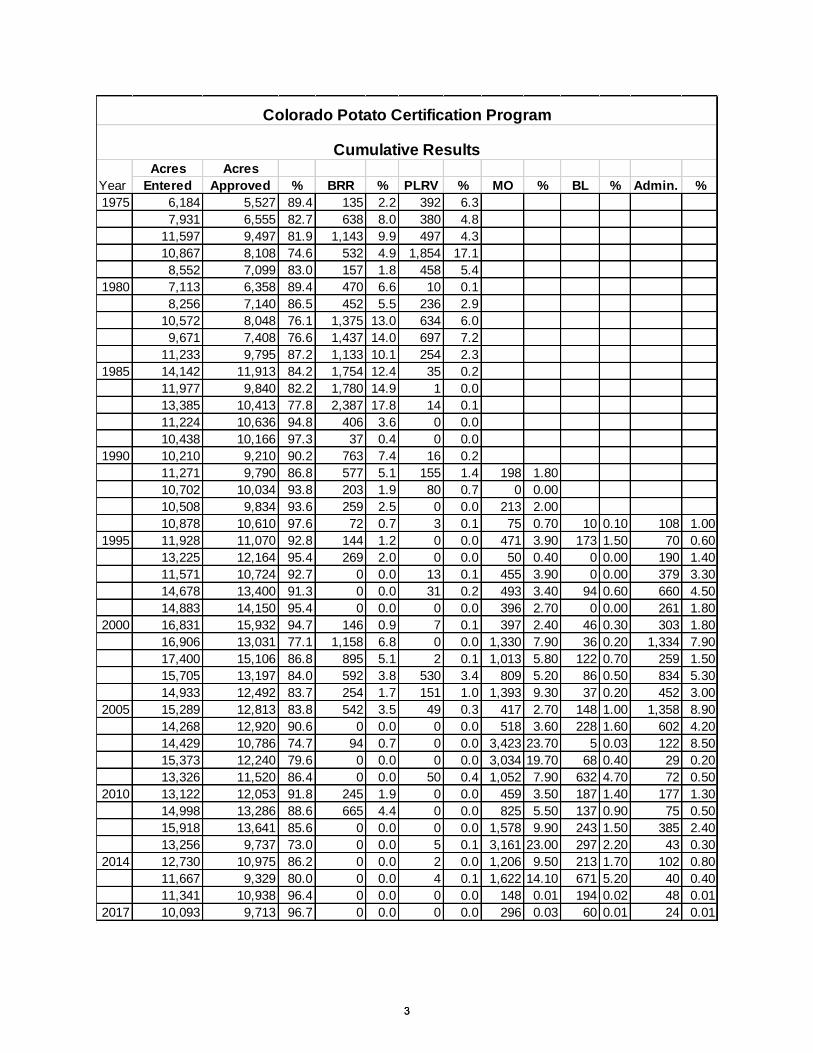
Acres Acres
Entered Approved % BRR % PLRV % MO % BL % Admin. %
1975 6,184 5,527 89.4 135 2.2 392 6.3
7,931 6,555 82.7 638 8.0 380 4.8
11,597 9,497 81.9 1,143 9.9 497 4.3
10,867 8,108 74.6 532 4.9 1,854 17.1
8,552 7,099 83.0 157 1.8 458 5.4
1980 7,113 6,358 89.4 470 6.6 10 0.1
8,256 7,140 86.5 452 5.5 236 2.9
10,572 8,048 76.1 1,375 13.0 634 6.0
9,671 7,408 76.6 1,437 14.0 697 7.2
11,233 9,795 87.2 1,133 10.1 254 2.3
1985 14,142 11,913 84.2 1,754 12.4 35 0.2
11,977 9,840 82.2 1,780 14.9 1 0.0
13,385 10,413 77.8 2,387 17.8 14 0.1
11,224 10,636 94.8 406 3.6 0 0.0
10,438 10,166 97.3 37 0.4 0 0.0
1990 10,210 9,210 90.2 763 7.4 16 0.2
11,271 9,790 86.8 577 5.1 155 1.4 198 1.80
10,702 10,034 93.8 203 1.9 80 0.7 0 0.00
10,508 9,834 93.6 259 2.5 0 0.0 213 2.00
10,878 10,610 97.6 72 0.7 3 0.1 75 0.70 10 0.10 108 1.00
1995 11,928 11,070 92.8 144 1.2 0 0.0 471 3.90 173 1.50 70 0.60
13,225 12,164 95.4 269 2.0 0 0.0 50 0.40 0 0.00 190 1.40
11,571 10,724 92.7 0 0.0 13 0.1 455 3.90 0 0.00 379 3.30
14,678 13,400 91.3 0 0.0 31 0.2 493 3.40 94 0.60 660 4.50
14,883 14,150 95.4 0 0.0 0 0.0 396 2.70 0 0.00 261 1.80
2000 16,831 15,932 94.7 146 0.9 7 0.1 397 2.40 46 0.30 303 1.80
16,906 13,031 77.1 1,158 6.8 0 0.0 1,330 7.90 36 0.20 1,334 7.90
17,400 15,106 86.8 895 5.1 2 0.1 1,013 5.80 122 0.70 259 1.50
15,705 13,197 84.0 592 3.8 530 3.4 809 5.20 86 0.50 834 5.30
14,933 12,492 83.7 254 1.7 151 1.0 1,393 9.30 37 0.20 452 3.00
2005 15,289 12,813 83.8 542 3.5 49 0.3 417 2.70 148 1.00 1,358 8.90
14,268 12,920 90.6 0 0.0 0 0.0 518 3.60 228 1.60 602 4.20
14,429 10,786 74.7 94 0.7 0 0.0 3,423 23.70 5 0.03 122 8.50
15,373 12,240 79.6 0 0.0 0 0.0 3,034 19.70 68 0.40 29 0.20
13,326 11,520 86.4 0 0.0 50 0.4 1,052 7.90 632 4.70 72 0.50
2010 13,122 12,053 91.8 245 1.9 0 0.0 459 3.50 187 1.40 177 1.30
14,998 13,286 88.6 665 4.4 0 0.0 825 5.50 137 0.90 75 0.50
15,918 13,641 85.6 0 0.0 0 0.0 1,578 9.90 243 1.50 385 2.40
13,256 9,737 73.0 0 0.0 5 0.1 3,161 23.00 297 2.20 43 0.30
2014 12,730 10,975 86.2 0 0.0 2 0.0 1,206 9.50 213 1.70 102 0.80
11,667 9,329 80.0 0 0.0 4 0.1 1,622 14.10 671 5.20 40 0.40
11,341 10,938 96.4 0 0.0 0 0.0 148 0.01 194 0.02 48 0.01
2017 10,093 9,713 96.7 0 0.0 0 0.0 296 0.03 60 0.01 24 0.01
Cumulative Results
Colorado Potato Certification Program
Year
33
44
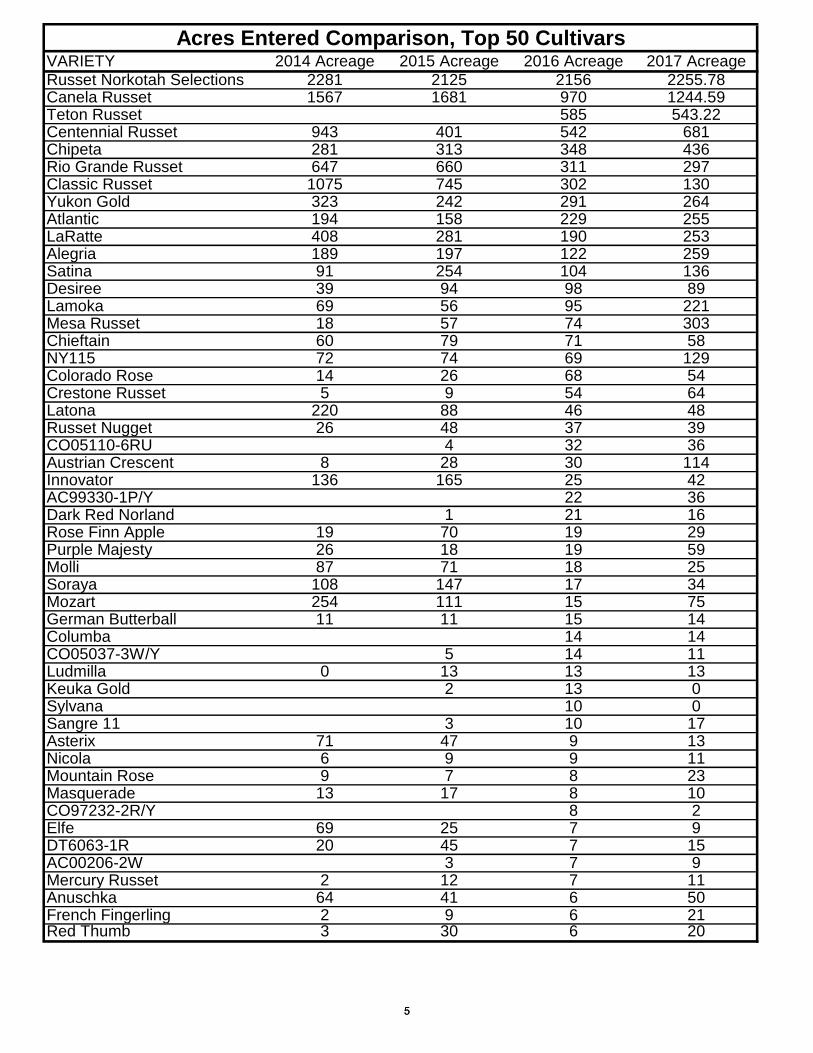
VARIETY 2014 Acreage 2015 Acreage 2016 Acreage 2017 AcreageRusset Norkotah Selections 2281 2125 2156 2255.78Canela Russet 1567 1681 970 1244.59Teton Russet 585 543.22Centennial Russet 943 401 542 681Chipeta 281 313 348 436Rio Grande Russet 647 660 311 297Classic Russet 1075 745 302 130Yukon Gold 323 242 291 264Atlantic 194 158 229 255LaRatte 408 281 190 253Alegria 189 197 122 259Satina 91 254 104 136Desiree 39 94 98 89Lamoka 69 56 95 221Mesa Russet 18 57 74 303Chieftain 60 79 71 58NY115 72 74 69 129Colorado Rose 14 26 68 54Crestone Russet 5 9 54 64Latona 220 88 46 48Russet Nugget 26 48 37 39CO05110-6RU 4 32 36Austrian Crescent 8 28 30 114Innovator 136 165 25 42AC99330-1P/Y 22 36Dark Red Norland 1 21 16Rose Finn Apple 19 70 19 29Purple Majesty 26 18 19 59Molli 87 71 18 25Soraya 108 147 17 34Mozart 254 111 15 75German Butterball 11 11 15 14Columba 14 14CO05037-3W/Y 5 14 11Ludmilla 0 13 13 13Keuka Gold 2 13 0Sylvana 10 0Sangre 11 3 10 17Asterix 71 47 9 13Nicola 6 9 9 11Mountain Rose 9 7 8 23Masquerade 13 17 8 10CO97232-2R/Y 8 2Elfe 69 25 7 9DT6063-1R 20 45 7 15AC00206-2W 3 7 9Mercury Russet 2 12 7 11Anuschka 64 41 6 50French Fingerling 2 9 6 21Red Thumb 3 30 6 20
Acres Entered Comparison, Top 50 Cultivars
55
0
2000
4000
6000
8000
10000
12000
14000
16000
2007 2008 2009 2010 2011 2012 2013 2014 2015 2016 2017
Acres Entered: Full Certified compared to Grower Entry
Full Certified Acreage Grower Entry Acreage
66
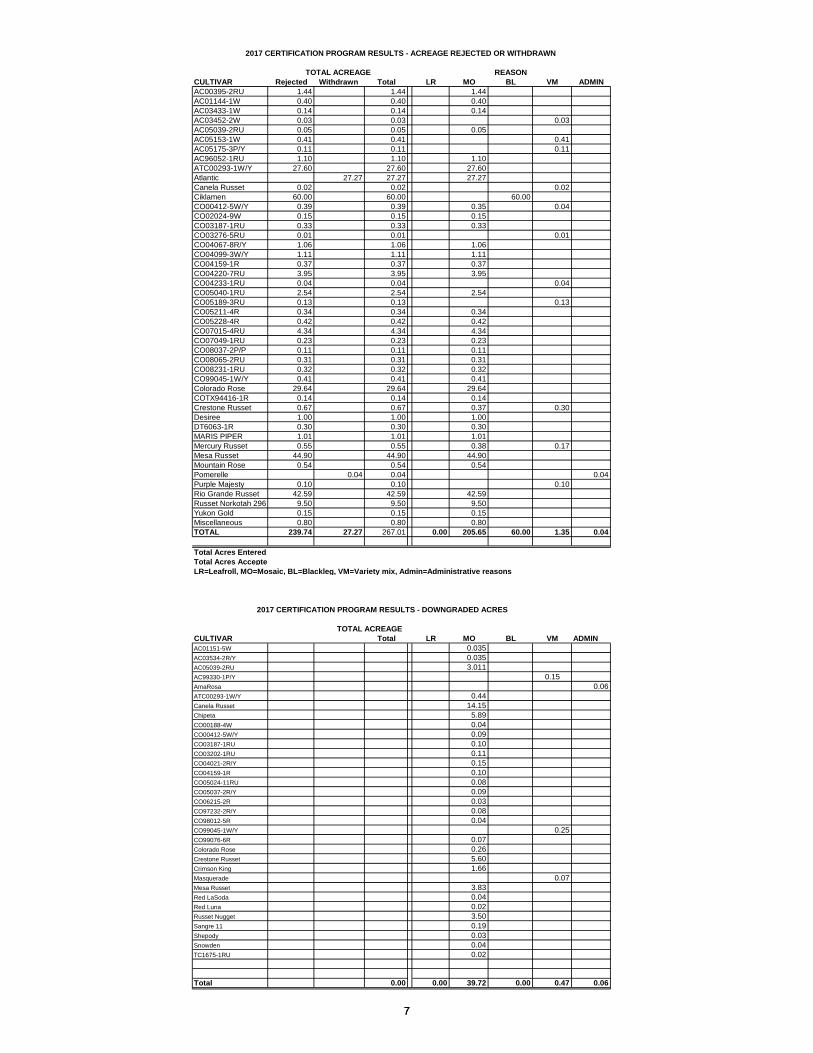
CULTIVAR Rejected Withdrawn Total LR MO BL VM ADMIN
AC00395-2RU 1.44 1.44 1.44
AC01144-1W 0.40 0.40 0.40
AC03433-1W 0.14 0.14 0.14
AC03452-2W 0.03 0.03 0.03
AC05039-2RU 0.05 0.05 0.05
AC05153-1W 0.41 0.41 0.41
AC05175-3P/Y 0.11 0.11 0.11
AC96052-1RU 1.10 1.10 1.10
ATC00293-1W/Y 27.60 27.60 27.60
Atlantic 27.27 27.27 27.27
Canela Russet 0.02 0.02 0.02
Ciklamen 60.00 60.00 60.00
CO00412-5W/Y 0.39 0.39 0.35 0.04
CO02024-9W 0.15 0.15 0.15
CO03187-1RU 0.33 0.33 0.33
CO03276-5RU 0.01 0.01 0.01
CO04067-8R/Y 1.06 1.06 1.06
CO04099-3W/Y 1.11 1.11 1.11
CO04159-1R 0.37 0.37 0.37
CO04220-7RU 3.95 3.95 3.95
CO04233-1RU 0.04 0.04 0.04
CO05040-1RU 2.54 2.54 2.54
CO05189-3RU 0.13 0.13 0.13
CO05211-4R 0.34 0.34 0.34
CO05228-4R 0.42 0.42 0.42
CO07015-4RU 4.34 4.34 4.34
CO07049-1RU 0.23 0.23 0.23
CO08037-2P/P 0.11 0.11 0.11
CO08065-2RU 0.31 0.31 0.31
CO08231-1RU 0.32 0.32 0.32
CO99045-1W/Y 0.41 0.41 0.41
Colorado Rose 29.64 29.64 29.64
COTX94416-1R 0.14 0.14 0.14
Crestone Russet 0.67 0.67 0.37 0.30
Desiree 1.00 1.00 1.00
DT6063-1R 0.30 0.30 0.30
MARIS PIPER 1.01 1.01 1.01
Mercury Russet 0.55 0.55 0.38 0.17
Mesa Russet 44.90 44.90 44.90
Mountain Rose 0.54 0.54 0.54
Pomerelle 0.04 0.04 0.04
Purple Majesty 0.10 0.10 0.10
Rio Grande Russet 42.59 42.59 42.59
Russet Norkotah 296 9.50 9.50 9.50
Yukon Gold 0.15 0.15 0.15
Miscellaneous 0.80 0.80 0.80
TOTAL 239.74 27.27 267.01 0.00 205.65 60.00 1.35 0.04
Total Acres Entered:
Total Acres Accepted:
LR=Leafroll, MO=Mosaic, BL=Blackleg, VM=Variety mix, Admin=Administrative reasons
CULTIVAR Total LR MO BL VM ADMIN
AC01151-5W 0.035
AC03534-2R/Y 0.035
AC05039-2RU 3.011
AC99330-1P/Y 0.15
AmaRosa 0.06
ATC00293-1W/Y 0.44
Canela Russet 14.15
Chipeta 5.89
CO00188-4W 0.04
CO00412-5W/Y 0.09
CO03187-1RU 0.10
CO03202-1RU 0.11
CO04021-2R/Y 0.15
CO04159-1R 0.10
CO05024-11RU 0.08
CO05037-2R/Y 0.09
CO06215-2R 0.03
CO97232-2R/Y 0.08
CO98012-5R 0.04
CO99045-1W/Y 0.25
CO99076-6R 0.07
Colorado Rose 0.26
Crestone Russet 5.60
Crimson King 1.66
Masquerade 0.07
Mesa Russet 3.83
Red LaSoda 0.04
Red Luna 0.02
Russet Nugget 3.50
Sangre 11 0.19
Shepody 0.03
Snowden 0.04
TC1675-1RU 0.02
Total 0.00 0.00 39.72 0.00 0.47 0.06
2017 CERTIFICATION PROGRAM RESULTS - ACREAGE REJECTED OR WITHDRAWN
2017 CERTIFICATION PROGRAM RESULTS - DOWNGRADED ACRES
TOTAL ACREAGE
TOTAL ACREAGE REASON
77
TOTAL ACREAGE REASON
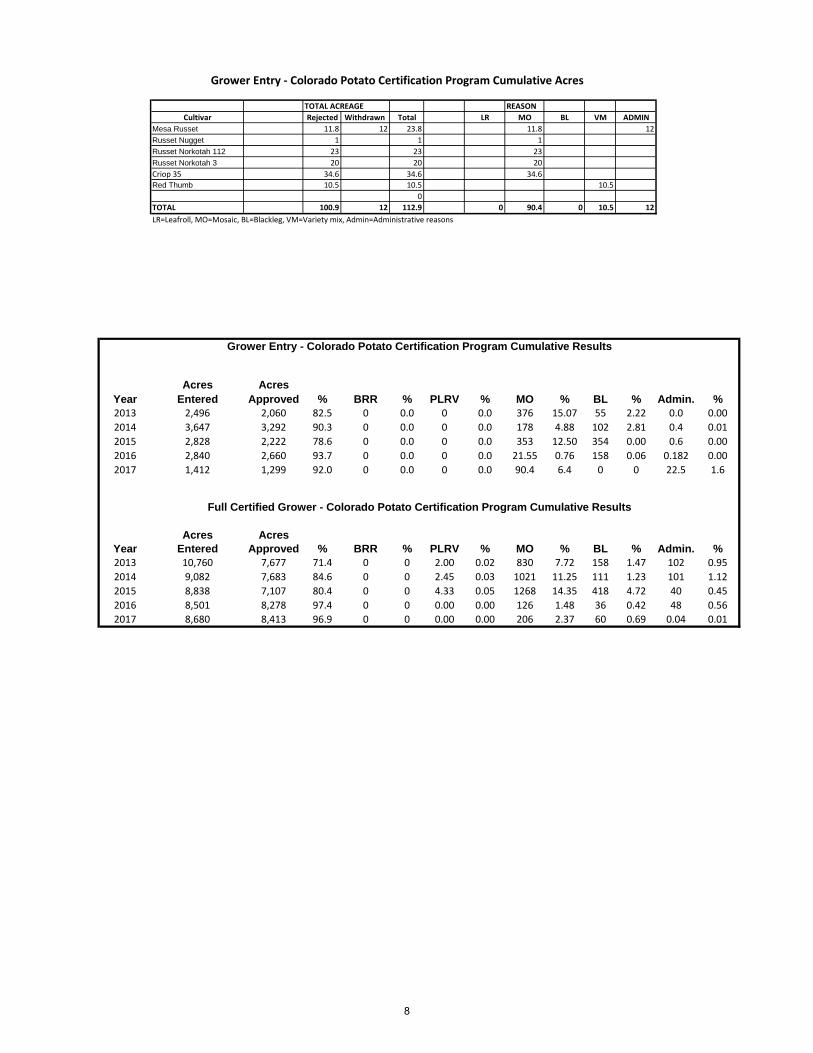
Cultivar Rejected Withdrawn Total LR MO BL VM ADMIN
Mesa Russet 11.8 12 23.8 11.8 12
Russet Nugget 1 1 1
Russet Norkotah 112 23 23 23
Russet Norkotah 3 20 20 20
Criop 35 34.6 34.6 34.6
Red Thumb 10.5 10.5 10.5
0
TOTAL 100.9 12 112.9 0 90.4 0 10.5 12
LR=Leafroll, MO=Mosaic, BL=Blackleg, VM=Variety mix, Admin=Administrative reasons
Acres Acres
Year Entered Approved % BRR % PLRV % MO % BL % Admin. %
2013 2,496 2,060 82.5 0 0.0 0 0.0 376 15.07 55 2.22 0.0 0.00
2014 3,647 3,292 90.3 0 0.0 0 0.0 178 4.88 102 2.81 0.4 0.01
2015 2,828 2,222 78.6 0 0.0 0 0.0 353 12.50 354 0.00 0.6 0.00
2016 2,840 2,660 93.7 0 0.0 0 0.0 21.55 0.76 158 0.06 0.182 0.00
2017 1,412 1,299 92.0 0 0.0 0 0.0 90.4 6.4 0 0 22.5 1.6
Acres Acres
Year Entered Approved % BRR % PLRV % MO % BL % Admin. %
2013 10,760 7,677 71.4 0 0 2.00 0.02 830 7.72 158 1.47 102 0.95
2014 9,082 7,683 84.6 0 0 2.45 0.03 1021 11.25 111 1.23 101 1.12
2015 8,838 7,107 80.4 0 0 4.33 0.05 1268 14.35 418 4.72 40 0.45
2016 8,501 8,278 97.4 0 0 0.00 0.00 126 1.48 36 0.42 48 0.56
2017 8,680 8,413 96.9 0 0 0.00 0.00 206 2.37 60 0.69 0.04 0.01
Full Certified Grower - Colorado Potato Certification Program Cumulative Results
Grower Entry - Colorado Potato Certification Program Cumulative Acres
Grower Entry - Colorado Potato Certification Program Cumulative Results
8
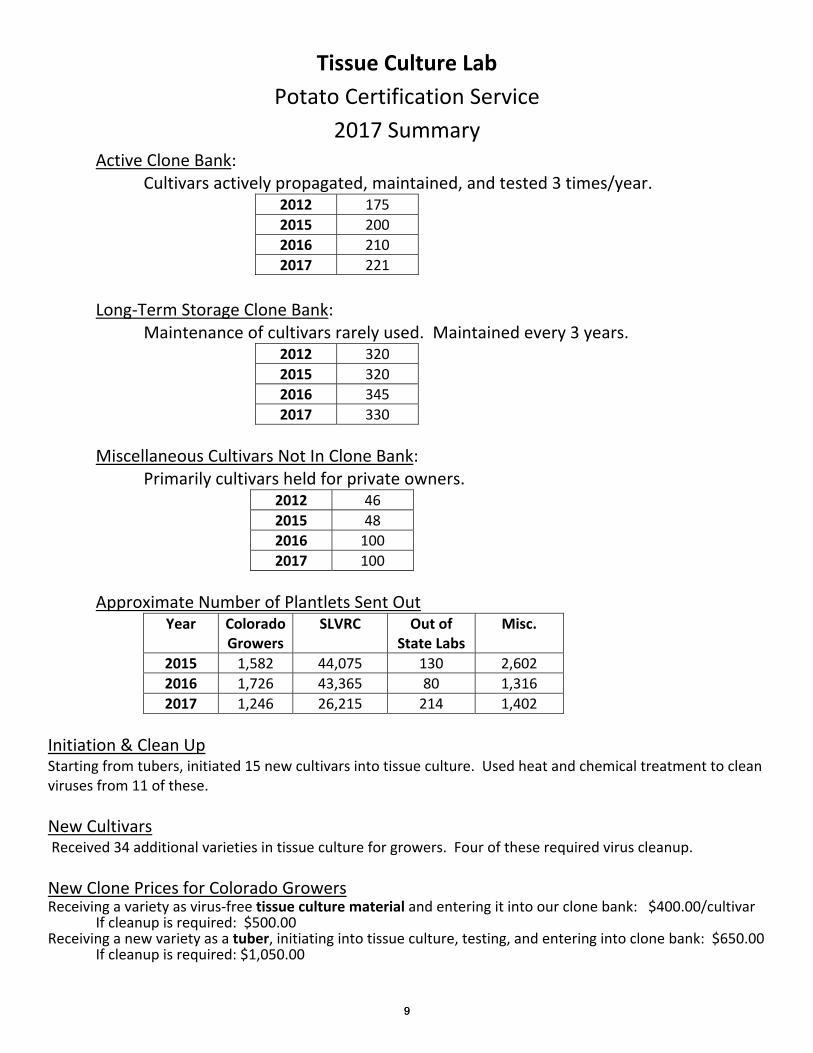
Tissue Culture Lab
Potato Certification Service
2017 Summary Active Clone Bank:
Cultivars actively propagated, maintained, and tested 3 times/year. 2012 175
2015 200
2016 210
2017 221
Long‐Term Storage Clone Bank:
Maintenance of cultivars rarely used. Maintained every 3 years. 2012 320
2015 320
2016 345
2017 330
Miscellaneous Cultivars Not In Clone Bank: Primarily cultivars held for private owners.
2012 46
2015 48
2016 100
2017 100
Approximate Number of Plantlets Sent Out Year Colorado
Growers SLVRC Out of
State Labs Misc.
2015 1,582 44,075 130 2,602
2016 1,726 43,365 80 1,316
2017 1,246 26,215 214 1,402
Initiation & Clean Up Starting from tubers, initiated 15 new cultivars into tissue culture. Used heat and chemical treatment to clean viruses from 11 of these.
New Cultivars Received 34 additional varieties in tissue culture for growers. Four of these required virus cleanup.
New Clone Prices for Colorado Growers Receiving a variety as virus‐free tissue culture material and entering it into our clone bank: $400.00/cultivar If cleanup is required: $500.00 Receiving a new variety as a tuber, initiating into tissue culture, testing, and entering into clone bank: $650.00 If cleanup is required: $1,050.00
99
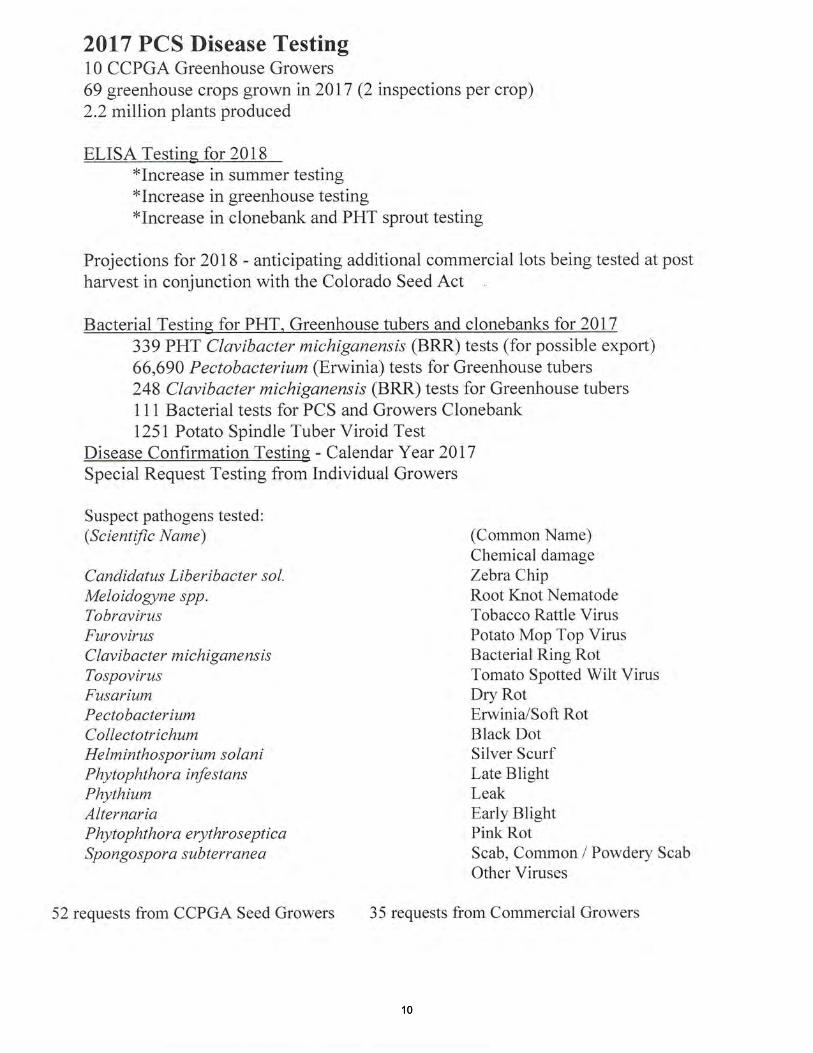
2017 PCS Disease Testing10 CCPGA Greenhouse Growers69 greenhouse crops grown in20|7 (2 inspections per crop)2.2 million plants produced
ELISA Testing for 2018*Increase in summer testing*Increase in greenhouse testingxlncrease in clonebank and PHT sprout testing
Projections for 2018 - anticipating additional commercial lots being tested at postharvest in coniunction with the Colorado Seed Act
Bacterial Testing for PHT. Greenhouse tubers and clonebanks for 2017339 PHT Clavibacter michiganensis (BRR) tests (for possible export)66,690 Pectobacterium (Erwinia) tests for Greenhouse tubers248 Clavibacter michiganensis (BRR) tests for Greenhouse tubers111 Bacterial tests for PCS and Growers ClonebankI25I Potato Spindle Tuber Viroid Test
Disease Confirmation Testing - Calendar Year 2017Special Request Testing from Individual Growers
Suspect pathogens tested:(Scientific Name) (Common Name)
Chemical damageCandidatus Liberibacter sol. Zebra ChipMeloidogyne spp. Root Knot NematodeTobravirus Tobacco Rattle VirusFurovirus Potato Mop Top VirusClavibacter michiganensis Bacterial Ring RotTospovirus Tomato Spotted Wilt VirusFusarium Dry RotPectobacterium Erwinia/Soft RotCollectotrichum Black DotHelminthosporium solani Silver ScurfPhytophthora infestans Late BlightPhythium LeakAlternaria Early BlightPhytophthora erythroseptica Pink RotSpongospora subterranea Scab, Common / Powdery Scab
Other Viruses
52 requests from CCPGA Seed Growers 35 requests from Commercial Growers
1010
Year
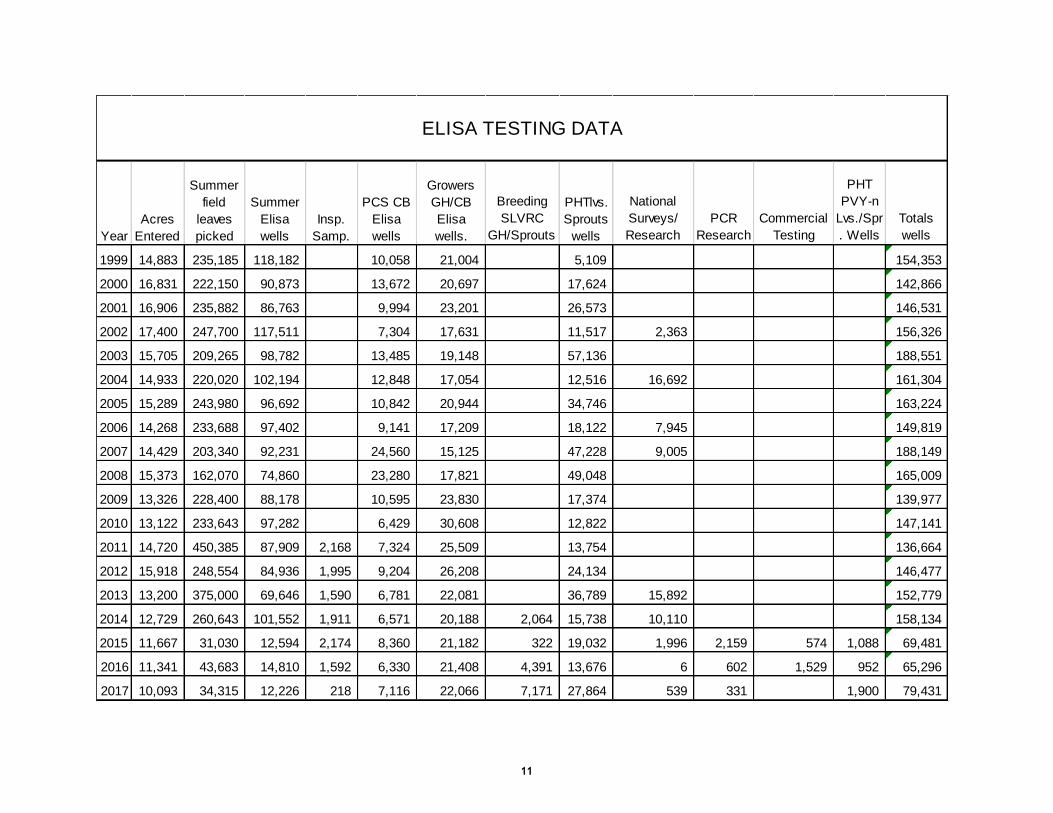
Breeding
SLVRC
GH/Sprouts
National
Surveys/
Research
PCR
Research
Commercial
Testing
PHT
PVY-n
Lvs./Spr
. Wells
Totals
wells
1999 14,883 235,185 118,182 10,058 21,004 5,109 154,353
2000 16,831 222,150 90,873 13,672 20,697 17,624 142,866
2001 16,906 235,882 86,763 9,994 23,201 26,573 146,531
2002 17,400 247,700 117,511 7,304 17,631 11,517 2,363 156,326
2003 15,705 209,265 98,782 13,485 19,148 57,136 188,551
2004 14,933 220,020 102,194 12,848 17,054 12,516 16,692 161,304
2005 15,289 243,980 96,692 10,842 20,944 34,746 163,224
2006 14,268 233,688 97,402 9,141 17,209 18,122 7,945 149,819
2007 14,429 203,340 92,231 24,560 15,125 47,228 9,005 188,149
2008 15,373 162,070 74,860 23,280 17,821 49,048 165,009
2009 13,326 228,400 88,178 10,595 23,830 17,374 139,977
2010 13,122 233,643 97,282 6,429 30,608 12,822 147,141
2011 14,720 450,385 87,909 2,168 7,324 25,509 13,754 136,664
2012 15,918 248,554 84,936 1,995 9,204 26,208 24,134 146,477
2013 13,200 375,000 69,646 1,590 6,781 22,081 36,789 15,892 152,779
2014 12,729 260,643 101,552 1,911 6,571 20,188 2,064 15,738 10,110 158,134
2015 11,667 31,030 12,594 2,174 8,360 21,182 322 19,032 1,996 2,159 574 1,088 69,481
2016 11,341 43,683 14,810 1,592 6,330 21,408 4,391 13,676 6 602 1,529 952 65,296
2017 10,093 34,315 12,226 218 7,116 22,066 7,171 27,864 539 331 1,900 79,431
Acres
Entered
ELISA TESTING DATA
PHTlvs.
Sprouts
wells
Growers
GH/CB
Elisa
wells.
PCS CB
Elisa
wells
Insp.
Samp.
Summer
Elisa
wells
Summer
field
leaves
picked
1111
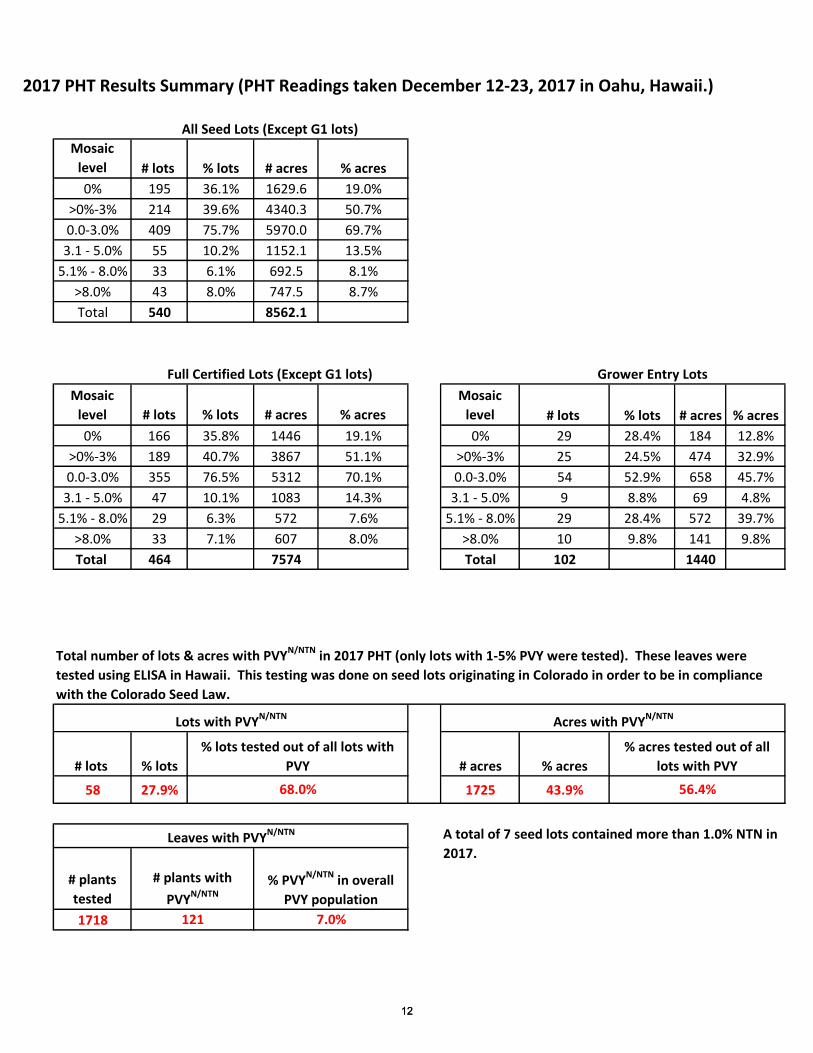
2017 PHT Results Summary (PHT Readings taken December 12-23, 2017 in Oahu, Hawaii.)
Mosaic
level # lots % lots # acres % acres
0% 195 36.1% 1629.6 19.0%
>0%-3% 214 39.6% 4340.3 50.7%
0.0-3.0% 409 75.7% 5970.0 69.7%
3.1 - 5.0% 55 10.2% 1152.1 13.5%
5.1% - 8.0% 33 6.1% 692.5 8.1%
>8.0% 43 8.0% 747.5 8.7%
Total 540 8562.1
Mosaic
level # lots % lots # acres % acres
Mosaic
level # lots % lots # acres % acres
0% 166 35.8% 1446 19.1% 0% 29 28.4% 184 12.8%
>0%-3% 189 40.7% 3867 51.1% >0%-3% 25 24.5% 474 32.9%
0.0-3.0% 355 76.5% 5312 70.1% 0.0-3.0% 54 52.9% 658 45.7%
3.1 - 5.0% 47 10.1% 1083 14.3% 3.1 - 5.0% 9 8.8% 69 4.8%
5.1% - 8.0% 29 6.3% 572 7.6% 5.1% - 8.0% 29 28.4% 572 39.7%
>8.0% 33 7.1% 607 8.0% >8.0% 10 9.8% 141 9.8%
Total 464 7574 Total 102 1440
# lots % lots # acres % acres
58 27.9% 1725 43.9%
# plants
tested
1718 121 7.0%
% lots tested out of all lots with
PVY
% acres tested out of all
lots with PVY
68.0% 56.4%
Leaves with PVYN/NTN A total of 7 seed lots contained more than 1.0% NTN in
2017.
# plants with
PVYN/NTN% PVYN/NTN in overall
PVY population
All Seed Lots (Except G1 lots)
Full Certified Lots (Except G1 lots) Grower Entry Lots
Total number of lots & acres with PVYN/NTN in 2017 PHT (only lots with 1-5% PVY were tested). These leaves were
tested using ELISA in Hawaii. This testing was done on seed lots originating in Colorado in order to be in compliance
with the Colorado Seed Law.
Lots with PVYN/NTN Acres with PVYN/NTN
1212
0
500
1000
1500
2000
2500
3000
3500
4000
4500
07 08 09 10 11 12 13 14 15 16 17
Acr
eag
e
Year
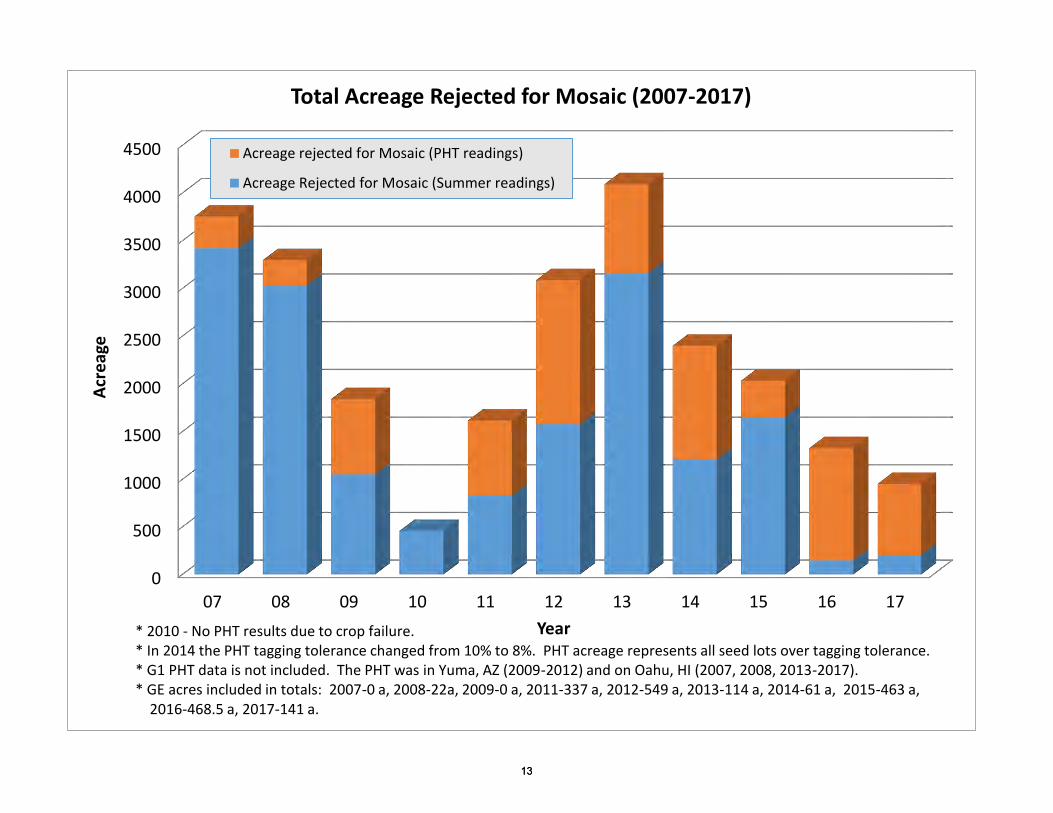
Total Acreage Rejected for Mosaic (2007-2017)
Acreage rejected for Mosaic (PHT readings)
Acreage Rejected for Mosaic (Summer readings)
* 2010 - No PHT results due to crop failure.* In 2014 the PHT tagging tolerance changed from 10% to 8%. PHT acreage represents all seed lots over tagging tolerance. * G1 PHT data is not included. The PHT was in Yuma, AZ (2009-2012) and on Oahu, HI (2007, 2008, 2013-2017).* GE acres included in totals: 2007-0 a, 2008-22a, 2009-0 a, 2011-337 a, 2012-549 a, 2013-114 a, 2014-61 a, 2015-463 a,
2016-468.5 a, 2017-141 a.
1313
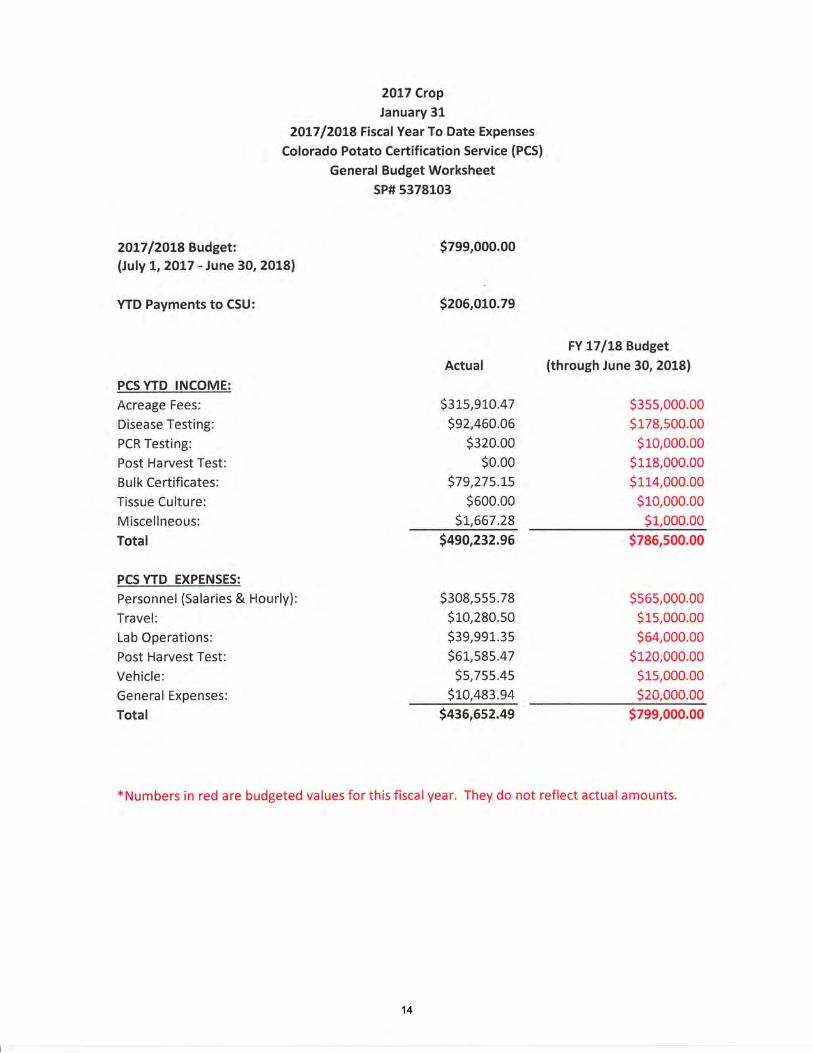
2Ot7l2OLg Budget:(July 1, 2Ot7 - June 30,2018)
YTD Payments to CSU:
PCS YTD INCOME:
Acreage Fees:
Disease Testing:
PCR Testing:
Post Harvest Test:
Bulk Certificates:Tissue Culture:
Miscellneous:
Total
PCSYTD EXPENSES:
Personnel (Salaries & Hourly):
Travel:
Lab Operations:
Post Harvest Test:
Vehicle:
General Expenses:
Total
2Ot7 CropJanuary 31
2OL7l20t8 Fiscal YearTo Date Expenses
Colorado Potato Certification Service (PCS)
General Budget Worksheet
sP# 5378103
s799,000.00
s206,010.79
Actual
S315,910.47
s92,450.05
s320.00so.oo
579,275.r5
s6oo.oo
5L,667.28
$49O,232.96
5308,555.78S10,z80.5o
539,991.35
561,585.47
55,755.45
s10,483.94
FY L7lL9 Budget(through June 30, 2018)
s355,000.00
s178,500.00
Slo,ooo.oos118,000.00
S114,ooo.oo
s10,000.00
s1,000.00s785,500.00
$565,000.00
515,000.00s64,000.00
s120,000.00s15,000.00
s20,000.00s436,652.49 s799,000.00
*Numbers in red are budgeted values for this fiscal year. They do not reflect actual amounts.
1414