colorado trade relationships 2004-2011
TRANSCRIPT

Colorado's International and Domestic Ports-to-Plains Region Trading Relationships
2004 2010 20112010-2011 Difference
2010-2011 % Change
2004-2011 Difference
2004-2011 % Change
MexicoTruck Exports $597,138,086 $466,957,496 $632,841,557 $165,884,061 35.5% $35,703,471 6.0%
Imports $481,370,426 $523,113,796 $624,224,611 $101,110,815 19.3% $142,854,185 29.7%Total Truck Trade with Mexico $1,078,508,512 $990,071,292 $1,257,066,168 $266,994,876 27.0% $178,557,656 16.6%
#DIV/0!Rail Exports $54,367,425 $66,879,661 $72,598,284 $5,718,623 8.6% $18,230,859 33.5%
Imports $27,719,924 $38,307,567 $26,292,370 -$12,015,197 -31.4% -$1,427,554 -5.1%Total Rail Trade with Mexico $82,087,349 $105,187,228 $98,890,654 -$6,296,574 -6.0% $16,803,305 20.5%
#DIV/0!TOTAL Exports $651,505,511 $533,837,157 $705,439,841 $171,602,684 32.1% $53,934,330 8.3%
Imports $509,090,350 $561,421,363 $650,516,981 $89,095,618 15.9% $141,426,631 27.8%Total Trade with Mexico $1,160,595,861 $1,095,258,520 $1,355,956,822 $260,698,302 23.8% $195,360,961 16.8%
Laredo, TX
Truck Exports $516,003,491 $362,423,814 $456,318,727 $93,894,913 25.9% -$59,684,764 -11.6%% of Total Exports to Mexico 86.4% 77.6% 72.1% -5.5% -14.3%
Imports $385,648,465 $315,117,510 $431,632,686 $116,515,176 37.0% $45,984,221 11.9%% of Total Imports to Mexico 80.1% 60.2% 69.1% 8.9% -11.0%
Total Truck Trade Thru Laredo $901,651,956 $677,541,324 $887,951,413 $210,410,089 31.1% -$13,700,543 -1.5%% Total Trade with Mexico 83.6% 68.4% 70.6% 2.2% -13.0%
Rail Exports $9,536,942 $7,820,824 $6,432,781 -$1,388,043 -17.7% -$3,104,161 -32.5%% of Total Exports to Mexico 17.5% 11.7% 8.9% -2.8% -8.7%
Imports $24,035,090 $7,446,835 $13,772,028 $6,325,193 84.9% -$10,263,062 -42.7%% of Total Imports to Mexico 86.7% 19.4% 52.4% 32.9% -34.3%
Total Rail Trade Thru Laredo $33,572,032 $15,267,659 $20,204,809 $4,937,150 32.3% -$13,367,223 -39.8%% Total Trade with Mexico 40.9% 14.5% 20.4% 5.9% -20.5%
TOTALExports $525,540,433 $370,244,638 $462,751,508 $92,506,870 25.0% -$62,788,925 -11.9%
% of Total Exports to Mexico 80.7% 69.4% 65.6% -3.8% -15.1%Imports $409,683,555 $322,564,345 $445,404,714 $122,840,369 38.1% $35,721,159 8.7%
% of Total Imports to Mexico 80.5% 57.5% 68.5% 11.0% -12.0%Total Trade Thru Laredo $935,223,988 $692,808,983 $908,156,222 $215,347,239 31.1% -$27,067,766 -2.9%
% Total Trade with Mexico 80.6% 63.3% 67.0% 3.7% -13.6%
Colorado -- Page1
Colorado's International and Domestic Ports-to-Plains Region Trading Relationships
2004 2010 20112010-2011 Difference
2010-2011 % Change
2004-2011 Difference
2004-2011 % Change
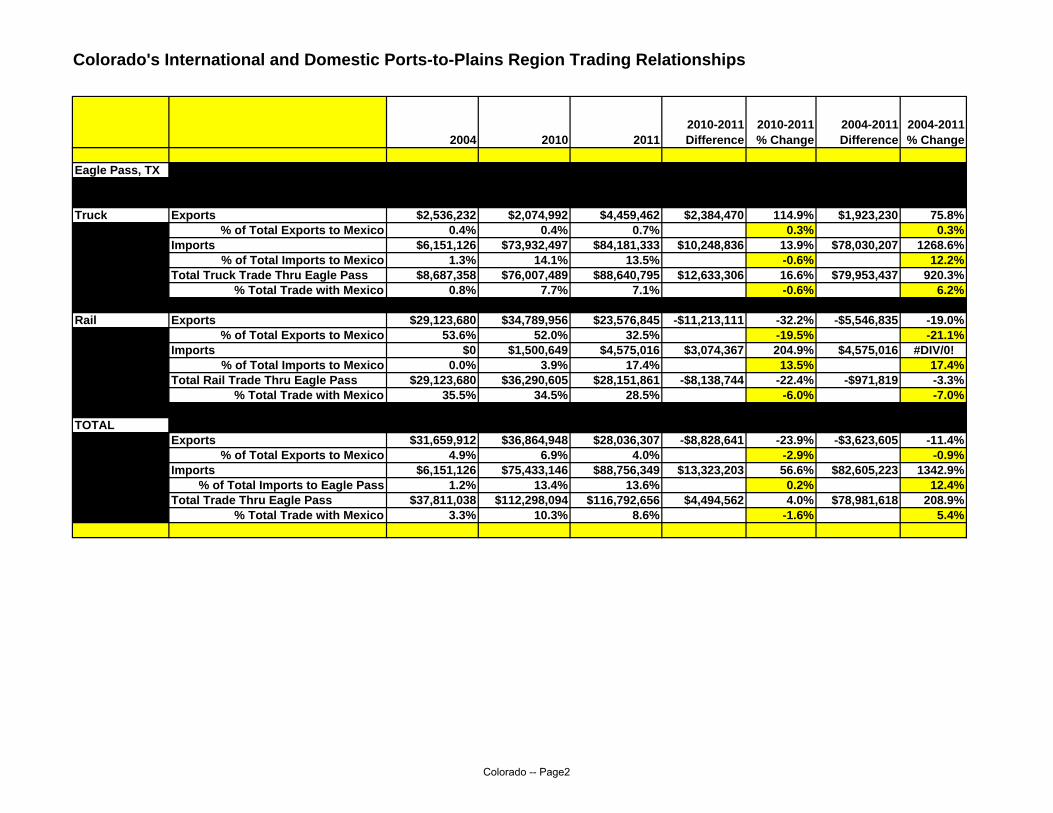
Eagle Pass, TX
Truck Exports $2,536,232 $2,074,992 $4,459,462 $2,384,470 114.9% $1,923,230 75.8%% of Total Exports to Mexico 0.4% 0.4% 0.7% 0.3% 0.3%
Imports $6,151,126 $73,932,497 $84,181,333 $10,248,836 13.9% $78,030,207 1268.6%% of Total Imports to Mexico 1.3% 14.1% 13.5% -0.6% 12.2%
Total Truck Trade Thru Eagle Pass $8,687,358 $76,007,489 $88,640,795 $12,633,306 16.6% $79,953,437 920.3%% Total Trade with Mexico 0.8% 7.7% 7.1% -0.6% 6.2%
Rail Exports $29,123,680 $34,789,956 $23,576,845 -$11,213,111 -32.2% -$5,546,835 -19.0%% of Total Exports to Mexico 53.6% 52.0% 32.5% -19.5% -21.1%
Imports $0 $1,500,649 $4,575,016 $3,074,367 204.9% $4,575,016 #DIV/0!% of Total Imports to Mexico 0.0% 3.9% 17.4% 13.5% 17.4%
Total Rail Trade Thru Eagle Pass $29,123,680 $36,290,605 $28,151,861 -$8,138,744 -22.4% -$971,819 -3.3%% Total Trade with Mexico 35.5% 34.5% 28.5% -6.0% -7.0%
TOTALExports $31,659,912 $36,864,948 $28,036,307 -$8,828,641 -23.9% -$3,623,605 -11.4%
% of Total Exports to Mexico 4.9% 6.9% 4.0% -2.9% -0.9%Imports $6,151,126 $75,433,146 $88,756,349 $13,323,203 56.6% $82,605,223 1342.9%
% of Total Imports to Eagle Pass 1.2% 13.4% 13.6% 0.2% 12.4%Total Trade Thru Eagle Pass $37,811,038 $112,298,094 $116,792,656 $4,494,562 4.0% $78,981,618 208.9%
% Total Trade with Mexico 3.3% 10.3% 8.6% -1.6% 5.4%
Colorado -- Page2

Colorado's International and Domestic Ports-to-Plains Region Trading Relationships
2004 2010 20112010-2011 Difference
2010-2011 % Change
2004-2011 Difference
2004-2011 % Change
Del Rio, TX
Truck Exports $245,719 $86,010 $52,771 -$33,239 -38.6% -$192,948 -78.5%% of Total Exports to Mexico 0.0% 0.0% 0.0% 0.0% 0.0%
Imports $2,874 $1,372,584 $2,914,848 $1,542,264 112.4% $2,911,974 101321.3%% of Total Imports to Mexico 0.0% 0.3% 0.5% 0.2% 0.5%
Total Truck Trade Thru Del Rio $248,593 $1,458,594 $2,967,619 $1,509,025 103.5% $2,719,026 1093.8%% Total Trade with Mexico 0.0% 0.1% 0.2% 0.1% 0.2%
Rail Exports #DIV/0!% of Total Exports to Mexico 0.0%
Imports #DIV/0!% of Total Imports to Mexico 0.0%
Total Rail Trade Thru Del Rio #DIV/0!% Total Trade with Mexico 0.0%
TOTALExports $245,719 $86,010 $52,771 -$33,239 -38.6% -$192,948 -78.5%
% of Total Exports to Mexico 0.0% 0.0% 0.0% 0.0% 0.0%Imports $2,874 $1,372,584 $2,914,848 $1,542,264 112.4% $2,911,974 101321.3%
% of Total Imports to Mexico 0.0% 0.2% 0.4% 0.2% 0.4%Total Trade Thru Del Rio $242,845 $1,458,594 $2,967,619 $1,509,025 103.5% $2,719,026 1122.0%
% Total Trade with Mexico 0.0% 0.1% 0.2% 0.1% 0.2%
Colorado -- Page3

Colorado's International and Domestic Ports-to-Plains Region Trading Relationships
2004 2010 20112010-2011 Difference
2010-2011 % Change
2004-2011 Difference
2004-2011 % Change
PTP
Truck Exports $518,785,442 $364,584,816 $460,830,960 $96,246,144 26.4% -$57,954,482 -11.2%% of Total Exports to Mexico 86.9% 78.1% 72.8% -5.3% -14.1%
Imports $391,802,465 $390,422,591 $518,728,867 $128,306,276 32.9% $126,926,402 32.4%% of Total Imports to Mexico 81.4% 74.6% 83.1% 8.5% 1.7%
Total Truck Trade Thru PTP $910,587,907 $755,007,407 $979,559,827 $224,552,420 29.7% $68,971,920 7.6%% Total Trade with Mexico 84.4% 76.3% 77.9% 1.7% -6.5%
Rail Exports $38,660,622 $42,610,780 $30,009,626 -$12,601,154 -29.6% -$8,650,996 -22.4%% of Total Exports to Mexico 71.1% 63.7% 41.3% -22.4% -29.8%
Imports $24,035,090 $8,947,484 $18,347,044 $9,399,560 105.1% -$5,688,046 -23.7%% of Total Imports to Mexico 86.7% 23.4% 69.8% 46.4% -16.9%
Total Rail Trade Thru PTP $62,695,712 $51,558,264 $48,356,670 -$3,201,594 -6.2% -$14,339,042 -22.9%% Total Trade with Mexico 76.4% 49.0% 48.9% -0.1% -27.5%
TOTALExports $557,446,064 $407,195,596 $490,840,586 $83,644,990 20.5% -$66,605,478 -11.9%
% of Total Exports to Mexico 85.6% 76.3% 69.6% -6.7% -16.0%Imports $415,837,555 $399,370,075 $537,075,911 $137,705,836 34.5% $121,238,356 29.2%
% of Total Imports to Mexico 81.7% 71.1% 82.6% 11.4% 0.9%Total Trade Thru PTP $973,277,871 $806,565,671 $1,027,916,497 $221,350,826 27.4% $54,638,626 5.6%
% Total Trade with Mexico 83.9% 73.6% 75.8% 2.2% -8.1%
Colorado -- Page4

Colorado's International and Domestic Ports-to-Plains Region Trading Relationships
2011 Leading Exports from Colorado to Mexico (Surface Transportation) 2011Rank Export1 2 Meat and edible meat offal $151,266,8712 37 Photographic or cinematographic goods $96,759,1483 84 Nuclear reactors; boilers; machinery and mechanical appliances; parts thereof $71,553,1944 4 Dairy produce; Birds' eggs; Natural honey; Edible products of animal origin; not elsewhere included $60,000,3785 85 Electrical machinery and equipment and parts thereof; Sound recorders and reproducers $36,006,1746 90 Optical; photographic; cinematographic; measuring; checking; precision; medical instruments $34,462,4117 73 Articles of iron or steel $31,885,2058 76 Aluminum and articles thereof $26,292,5349 39 Plastics and articles thereof $24,690,82510 27 Mineral fuels; mineral oils and products of their distillation; Bituminous substances; Mineral waxes $24,655,878
2011 Leading Imports to Colorado from Mexico (Surface Transportation) 2011Rank Import1 84 Nuclear reactors; boilers; machinery and mechanical appliances; parts thereof $88,848,6492 87 Vehicles; other than railway or tramway rolling stock; and parts and accessories thereof $77,390,1393 40 Rubber and articles thereof $76,354,5754 73 Articles of iron or steel $65,745,4765 90 Optical; photographic; cinematographic; measuring; checking; precision; medical instruments $59,457,3686 37 Photographic or cinematographic goods $50,454,5697 85 Electrical machinery and equipment and parts thereof; Sound recorders and reproducers $33,663,0418 94 Furniture; Bedding; mattress supports; cushions and similar stuffed furnishings; Lighting fittings $32,372,5419 96 Miscellaneous manufactured articles $24,062,10310 71 Natural or cultured pearls; precious or semiprevious stones; precious metals; articles thereof $22,900,204
Colorado -- Page5

Colorado's International and Domestic Ports-to-Plains Region Trading Relationships
2011 Leading Exports from Colorado to Mexico (Surface Transportation) 2011Rank Coahuila Export
1 31 Fertilizers $5,474,4902 84 Nuclear reactors; boilers; machinery and mechanical appliances; parts thereof $2,087,4223 39 Plastics and articles thereof $1,755,1824 87 Vehicles; other than railway or tramway rolling stock; and parts and accessories thereof $1,089,5255 85 Electrical machinery and equipment and parts thereof; Sound recorders and reproducers $865,8186 64 Footwear; gaiters and the like; Parts of such articles $659,5497 96 Miscellaneous manufactured articles $599,7168 76 Aluminum and articles thereof $512,9349 42 Articles of leather; Saddlery and harness; Travel goods; handbags and similar containers $493,790
10 40 Rubber and articles thereof $465,154
2011 Leading Exports from Colorado from Mexico (Surface Transportation) 2011Nuevo Leon Export
1 2 Meat and edible meat offal $46,472,2172 84 Nuclear reactors; boilers; machinery and mechanical appliances; parts thereof $11,867,8563 76 Aluminum and articles thereof $9,815,7634 85 Electrical machinery and equipment and parts thereof; Sound recorders and reproducers $2,862,8985 7 Edible vegetables and certain roots and tubers $2,400,7476 73 Articles of iron or steel $2,300,0277 83 Miscellaneous articles of base metal $1,768,7998 21 Miscellaneous edible preparations $1,760,8699 72 Iron and steel $1,262,118
10 48 Paper and paperboard; Articles of paper pulp; of paper or of paperboard $1,223,474
Colorado -- Page6

Colorado's International and Domestic Ports-to-Plains Region Trading Relationships
2011 Leading Exports from Colorado to Mexico (Surface Transportation) 20112011 Leading Exports from Colorado from Mexico (Surface Transportation) 2011
Tamaulipas Export1 2 Meat and edible meat offal $6,252,6062 84 Nuclear reactors; boilers; machinery and mechanical appliances; parts thereof $1,597,1703 56 Wadding; felt and nonwovens; Special yarns; Twine; cordage; ropes and cables and articles thereof $608,1864 29 Organic chemicals $360,9205 48 Paper and paperboard; Articles of paper pulp; of paper or of paperboard $217,7226 96 Miscellaneous manufactured articles $217,4127 4 Dairy produce; Birds' eggs; Natural honey; Edible products of animal origin; not elsewhere included $202,5218 39 Plastics and articles thereof $189,7539 87 Vehicles; other than railway or tramway rolling stock; and parts and accessories thereof $173,713
10 90 Optical; photographic; cinematographic; measuring; checking; precision; medical instruments $147,269
Colorado -- Page7

Colorado's International and Domestic Ports-to-Plains Region Trading Relationships
2004 2010 20112010-2011 Difference
2010-2011 %
Change2004-2011 Difference
2004-2011 % Change
CanadaTruck Exports $1,337,778,190 $1,136,831,970 $1,113,795,687 -$23,036,283 -2.0% -$223,982,503 -16.7%
Imports $807,034,746 $843,615,754 $972,111,081 $128,495,327 15.2% $165,076,335 20.5%Total Truck Trade with Canada $2,144,812,936 $1,980,447,724 $2,085,906,768 $105,459,044 5.3% -$58,906,168 -2.7%
#DIV/0!Rail Exports $63,037,304 $91,535,129 $121,777,273 $30,242,144 33.0% $58,739,969 93.2%
Imports $491,471,483 $230,684,240 $171,498,723 -$59,185,517 -25.7% -$319,972,760 -65.1%Total Rail Trade with Canada $554,508,787 $322,219,369 $293,275,996 -$28,943,373 -9.0% -$261,232,791 -47.1%
$0 #DIV/0!TOTAL Exports $1,400,815,494 $1,228,367,099 $1,235,572,960 $7,205,861 0.6% -$165,242,534 -11.8%
Imports $1,298,506,229 $1,074,299,994 $1,143,609,804 $69,309,810 6.5% -$154,896,425 -11.9%Total Trade with Canada $2,699,321,723 $2,302,667,093 $2,379,182,764 $76,515,671 3.3% -$320,138,959 -11.9%
Raymond, MT
Truck Exports $2,114,767 $5,971,708 $9,229,009 $3,257,301 54.5% $7,114,242 336.4%% of Total Exports to Canada 0.2% 0.5% 0.8% 0.3% 0.7%
Imports $10,885,418 $48,684,149 $31,162,027 -$17,522,122 -36.0% $20,276,609 186.3%% of Total Imports to Canada 1.3% 5.8% 3.2% -2.6% 1.9%
Total Truck Trade Thru Raymond $13,000,185 $54,655,857 $40,391,036 -$14,264,821 -26.1% $27,390,851 210.7%% Total Trade with Canada 0.6% 2.8% 1.9% -0.8% 1.3%
Rail Exports $0% of Total Exports to Canada 0.0% 0.0%
Imports $0% of Total Imports to Canada 0.0% 0.0%
Total Truck Trade Thru Raymond $0 $0% Total Trade with Canada 0.0% 0.0%
TOTALExports $2,114,767 $5,971,708 $9,229,009 $3,257,301 54.5% $7,114,242 336.4%
% of Total Exports to Canada 0.2% 0.5% 0.7% 0.3% 0.6%Imports $10,885,418 $48,684,149 $31,162,027 -$17,522,122 -36.0% $20,276,609 186.3%
% of Total Imports to Canada 0.8% 4.5% 2.7% -1.8% 1.9%Total Trade Thru Raymond $13,000,185 $54,655,857 $40,391,036 -$14,264,821 -26.1% $27,390,851 210.7%
% Total Trade with Canada 0.5% 2.4% 1.7% -0.7% 1.2%
Colorado -- Page8

Colorado's International and Domestic Ports-to-Plains Region Trading Relationships
2004 2010 20112010-2011 Difference
2010-2011 %
Change2004-2011 Difference
2004-2011 % Change
Sweet Grass, MT
Truck Exports $166,037,392 $141,927,729 $164,923,447 $22,995,718 16.2% -$1,113,945 -0.7%% of Total Exports to Canada 12.4% 12.5% 14.8% 2.3% 2.4%
Imports $166,269,963 $190,703,628 $293,018,322 $102,314,694 53.7% $126,748,359 76.2%% of Total Exports to Canada 20.6% 22.6% 30.1% 7.5% 9.5%
Total Truck Trade Thru Sweetgrass $332,307,355 $332,631,357 $457,941,769 $125,310,412 37.7% $125,634,414 37.8%% Total Trade with Canada 15.5% 16.8% 22.0% 5.2% 6.5%
Rail Exports $200,101 $16,958,495 $36,122,460 $19,163,965 113.0% $35,922,359 17952.1%% of Total Exports to Canada 0.3% 18.5% 29.7% 11.1% 29.3%
Imports $46,254,973 $33,684,411 $25,871,873 -$7,812,538 -23.2% -$20,383,100 -44.1%% of Total Exports to Canada 9.4% 14.6% 15.1% 0.5% 5.7%
Total Rail Trade Thru Sweet Grass $46,455,074 $50,642,906 $61,994,333 $11,351,427 22.4% $15,539,259 33.5%% Total Trade with Canada 8.4% 15.7% 21.1% 5.4% 12.8%
TOTALExports $166,237,493 $158,886,224 $201,045,907 $42,159,683 26.5% $34,808,414 20.9%
% of Total Exports to Canada 11.9% 12.9% 16.3% 3.3% 4.4%Imports $212,524,936 $224,388,039 $318,890,195 $94,502,156 42.1% $106,365,259 50.0%
% of Total Imports to Canada 16.4% 20.9% 27.9% 7.0% 11.5%Total Trade Thru Sweet Grass $378,762,429 $383,274,263 $519,936,102 $136,661,839 35.7% $141,173,673 37.3%
% Total Trade with Canada 14.0% 16.6% 21.9% 5.2% 7.8%
Colorado -- Page9

Colorado's International and Domestic Ports-to-Plains Region Trading Relationships
2004 2010 20112010-2011 Difference
2010-2011 %
Change2004-2011 Difference
2004-2011 % Change
Portal, ND
Truck Exports $18,094,321 $132,704,744 $94,832,987 -$37,871,757 -28.5% $76,738,666 424.1%% of Total Exports to Canada 1.4% 11.7% 8.5% -3.2% 7.2%
Imports $10,975,196 $32,207,301 $24,058,079 -$8,149,222 -25.3% $13,082,883 119.2%% of Total Imports to Canada 1.4% 3.8% 2.5% -1.3% 1.1%
Total Truck Trade Thru Portal $29,069,517 $164,912,045 $118,891,066 -$46,020,979 -27.9% $89,821,549 309.0%% Total Trade with Canada 1.4% 8.3% 5.7% -2.6% 4.3%
Rail Exports $21,863,019 $3,937,798 $6,878,614 $2,940,816 74.7% -$14,984,405 -68.5%% of Total Exports to Canada 34.7% 4.3% 5.6% 1.3% -29.0%
Imports $34,378,309 $4,610,480 $2,672,942 -$1,937,538 -42.0% -$31,705,367 -92.2%% of Total Imports to Canada 7.0% 2.0% 1.6% -0.4% -5.4%
Total Rail Trade Thru Portal $56,241,328 $8,548,278 $9,551,556 $1,003,278 11.7% -$46,689,772 -83.0%% Total Trade with Canada 10.1% 2.7% 3.3% 0.6% -6.9%
TOTALExports $39,957,340 $136,642,542 $94,832,987 -$41,809,555 -30.6% $61,754,261 137.3%
% of Total Exports to Canada 2.9% 11.1% 7.7% -3.4% 4.8%Imports $45,353,505 $36,817,781 $26,731,021 -$10,086,760 -27.4% -$18,622,484 -41.1%
% of Total Imports to Canada 3.5% 3.4% 2.3% -1.1% -1.2%Total Trade Thru Portal $85,310,845 $173,460,323 $121,564,008 -$51,896,315 -29.9% $43,131,777 42.5%
% Total Trade with Canada 3.2% 7.5% 5.1% -2.4% 1.9%
Colorado -- Page10
Colorado's International and Domestic Ports-to-Plains Region Trading Relationships
2004 2010 20112010-2011 Difference
2010-2011 %
Change2004-2011 Difference
2004-2011 % Change
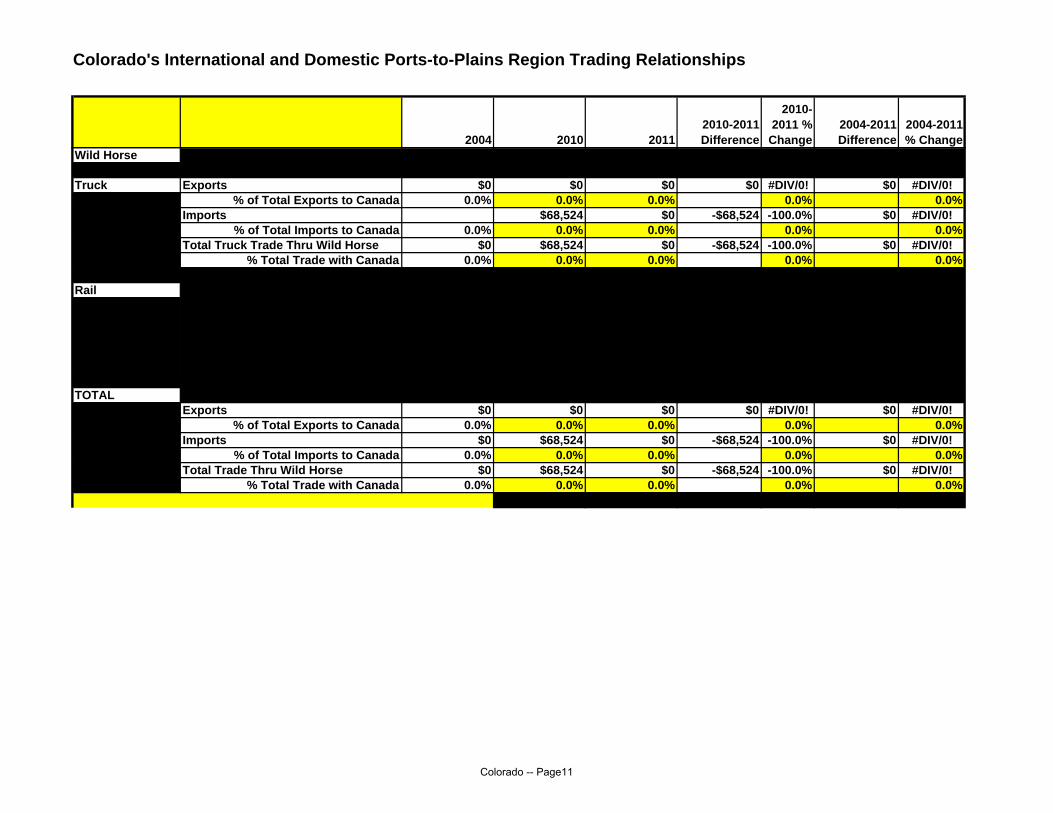
Wild Horse0
Truck Exports $0 $0 $0 $0 #DIV/0! $0 #DIV/0!% of Total Exports to Canada 0.0% 0.0% 0.0% 0.0% 0.0%
Imports $68,524 $0 -$68,524 -100.0% $0 #DIV/0!% of Total Imports to Canada 0.0% 0.0% 0.0% 0.0% 0.0%
Total Truck Trade Thru Wild Horse $0 $68,524 $0 -$68,524 -100.0% $0 #DIV/0!% Total Trade with Canada 0.0% 0.0% 0.0% 0.0% 0.0%
Rail
TOTALExports $0 $0 $0 $0 #DIV/0! $0 #DIV/0!
% of Total Exports to Canada 0.0% 0.0% 0.0% 0.0% 0.0%Imports $0 $68,524 $0 -$68,524 -100.0% $0 #DIV/0!
% of Total Imports to Canada 0.0% 0.0% 0.0% 0.0% 0.0%Total Trade Thru Wild Horse $0 $68,524 $0 -$68,524 -100.0% $0 #DIV/0!
% Total Trade with Canada 0.0% 0.0% 0.0% 0.0% 0.0%
Colorado -- Page11

Colorado's International and Domestic Ports-to-Plains Region Trading Relationships
2004 2010 20112010-2011 Difference
2010-2011 %
Change2004-2011 Difference
2004-2011 % Change
PTP#DIV/0!
Truck Exports $186,246,480 $280,604,181 $268,985,443 -$11,618,738 -4.1% $82,738,963 44.4%% of Total Exports to Canada 13.9% 24.7% 24.2% -0.5% 10.2%
Imports $179,359,926 $228,951,161 $326,305,410 $97,354,249 42.5% $146,945,484 81.9%% of Total Imports to Canada 22.2% 27.1% 33.6% 6.4% 11.3%
Total Truck Trade Thru PTP $365,606,406 $509,555,342 $595,290,853 $85,735,511 16.8% $229,684,447 62.8%% Total Trade with Canada 17.0% 25.7% 28.5% 2.8% 11.5%
Rail Exports $22,063,120 $20,896,293 $43,001,074 $22,104,781 105.8% $20,937,954 94.9%% of Total Exports to Canada 1.6% 1.8% 3.9% 2.0% 2.2%
Imports $80,633,282 $38,294,891 $28,544,815 -$9,750,076 -25.5% -$52,088,467 -64.6%% of Total Imports to Canada 10.0% 4.5% 2.9% -1.6% -7.1%
Total Rail Trade Thru PTP $102,696,402 $59,191,184 $71,545,889 $12,354,705 20.9% -$31,150,513 -30.3%% Total Trade with Canada 4.8% 3.0% 3.4% 0.4% -1.4%
TOTALExports $208,309,600 $301,500,474 $311,986,517 $10,486,043 3.5% $103,676,917 49.8%
% of Total Exports to Canada 14.9% 24.5% 25.3% 0.7% 10.4%Imports $259,993,208 $267,246,052 $354,850,225 $87,604,173 32.8% $94,857,017 36.5%
% of Total Imports to Canada 20.0% 24.9% 31.0% 6.2% 11.0%Total Trade Thru PTP $468,302,808 $568,746,526 $666,836,742 $98,090,216 17.2% $198,533,934 42.4%
% Total Trade with Canada 17.3% 24.7% 28.0% 3.3% 10.7%
Colorado -- Page12

Colorado's International and Domestic Ports-to-Plains Region Trading Relationships
2011 Leading Exports from Colorado to Canada (Surface Transportation) 2011Rank Export
1 2 Meat and edible meat offal $294,585,0082 84 Nuclear reactors; boilers; machinery and mechanical appliances; parts thereof $178,346,6753 27 Mineral fuels; mineral oils and products of their distillation; Bituminous substances; Mineral waxes $108,161,5644 73 Articles of iron or steel $99,136,0595 90 Optical; photographic; cinematographic; measuring; checking; precision; medical instruments $90,281,9446 85 Electrical machinery and equipment and parts thereof; Sound recorders and reproducers $87,435,1367 87 Vehicles; other than railway or tramway rolling stock; and parts and accessories thereof $51,952,0238 39 Plastics and articles thereof $44,325,1489 63 Other made-up textile articles; Needle craft sets; Worn clothing and worn textile articles; rags $25,990,157
10 76 Aluminum and articles thereof $24,943,189
2011 Leading Imports to Colorado from Canada (Surface Transportation) 2011Rank Import
1 27 Mineral fuels; mineral oils and products of their distillation; Bituminous substances; Mineral waxes $2,627,770,8612 84 Nuclear reactors; boilers; machinery and mechanical appliances; parts thereof $206,801,6533 44 Wood and articles of wood; Wood charcoal $85,253,7034 85 Electrical machinery and equipment and parts thereof; Sound recorders and reproducers $83,701,6915 73 Articles of iron or steel $80,059,4886 87 Vehicles; other than railway or tramway rolling stock; and parts and accessories thereof $79,208,9237 39 Plastics and articles thereof $71,692,2978 98 Special classification provisions $69,716,5489 36 Explosives; Pyrotechnic products; Matches; Pyrophoric alloys; Certain combustible preparations $64,460,236
10 94 Furniture; Bedding; mattress supports; cushions and similar stuffed furnishings; Lighting fittings $59,289,040
Colorado -- Page13

Colorado's International and Domestic Ports-to-Plains Region Trading Relationships
2011 Leading Exports from Colorado to Canada (Surface Transportation) 2011Rank Alberta Export
1 84 Nuclear reactors; boilers; machinery and mechanical appliances; parts thereof $50,291,5462 73 Articles of iron or steel $21,425,1413 90 Optical; photographic; cinematographic; measuring; checking; precision; medical instruments $19,193,4174 87 Vehicles; other than railway or tramway rolling stock; and parts and accessories thereof $17,924,0595 85 Electrical machinery and equipment and parts thereof; Sound recorders and reproducers $14,604,0746 39 Plastics and articles thereof $11,390,6977 27 Mineral fuels; mineral oils and products of their distillation; Bituminous substances; Mineral waxes $10,728,5868 63 Other made-up textile articles; Needle craft sets; Worn clothing and worn textile articles; rags $9,901,1689 2 Meat and edible meat offal $7,502,436
10 28 Inorganic chemicals; Organic or inorganic compounds of precious metals; of rare-earth metals $6,458,307
2011 Leading Exports from Colorado to Canada (Surface Transportation) 2011Rank British Colombia Export
1 84 Nuclear reactors; boilers; machinery and mechanical appliances; parts thereof $19,599,4922 73 Articles of iron or steel $15,872,1873 39 Plastics and articles thereof $9,425,1334 85 Electrical machinery and equipment and parts thereof; Sound recorders and reproducers $8,658,8365 87 Vehicles; other than railway or tramway rolling stock; and parts and accessories thereof $7,938,8366 21 Miscellaneous edible preparations $7,524,4157 2 Meat and edible meat offal $6,704,4158 90 Optical; photographic; cinematographic; measuring; checking; precision; medical instruments $6,415,5849 72 Iron and steel $4,847,419
10 94 Furniture; Bedding; mattress supports; cushions and similar stuffed furnishings; Lighting fittings $4,024,523
Colorado -- Page14
Colorado's International and Domestic Ports-to-Plains Region Trading Relationships
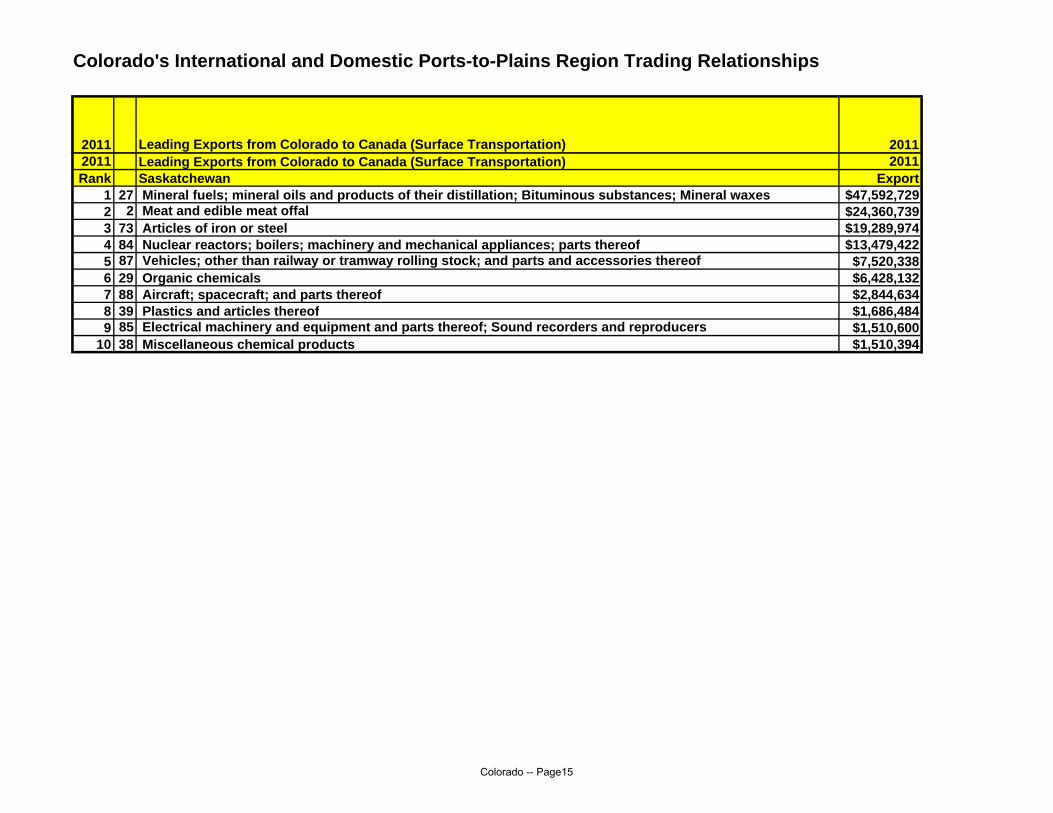
2011 Leading Exports from Colorado to Canada (Surface Transportation) 20112011 Leading Exports from Colorado to Canada (Surface Transportation) 2011Rank Saskatchewan Export
1 27 Mineral fuels; mineral oils and products of their distillation; Bituminous substances; Mineral waxes $47,592,7292 2 Meat and edible meat offal $24,360,7393 73 Articles of iron or steel $19,289,9744 84 Nuclear reactors; boilers; machinery and mechanical appliances; parts thereof $13,479,4225 87 Vehicles; other than railway or tramway rolling stock; and parts and accessories thereof $7,520,3386 29 Organic chemicals $6,428,1327 88 Aircraft; spacecraft; and parts thereof $2,844,6348 39 Plastics and articles thereof $1,686,4849 85 Electrical machinery and equipment and parts thereof; Sound recorders and reproducers $1,510,600
10 38 Miscellaneous chemical products $1,510,394
Colorado -- Page15

Colorado's International and Domestic Ports-to-Plains Region Trading Relationships
Domestic 2002 Domestic -- 2007
Rail Change
2002-2007
Truck Change
2002-2007Domestic --
2015
Rail Change
2002-2015
Truck Change
2002-2015Exports Rail Truck Exports Rail Truck Exports Rail TruckColorado $0 Colorado ColoradoMontana 76 462 9% Montana 747 7% -100% 62% Montana 13 780 7% -83% 69%Nebraska 722 12% Nebraska 1,117 11% 0% 55% Nebraska 10 2,203 19% 205%New Mexico 653 11% New Mexico 1,926 18% 0% 195% New Mexico 8 1,888 16% 189%North Dakota 0 0% North Dakota 120 1% 0% 100% North Dakota 123 1%Oklahoma 240 4% Oklahoma 420 4% 0% 75% Oklahoma 64 416 4% 73%South Dakota 187 3% South Dakota 227 2% 0% 21% South Dakota 261 2% 39%Texas 338 2,264 43% Texas 275 3,304 34% -19% 46% Texas 162 3,129 28% -52% 38%Wyoming 1,105 18% Wyoming 2,337 22% 0% 111% Wyoming 1 2,883 24% 161%Total ($m) 414 5,633 Total ($m) 275 10,198 100% -34% 81% Total ($m) 257 11,683 100% -38% 107%
6,047 10,473 73% 11,940 97%Millions
Imports Rail Truck Imports Rail Truck Imports Rail TruckColorado Colorado ColoradoMontana 46 0 1% Montana 80 1% -100% Montana 48 103 1% 5%Nebraska 298 1,267 24% Nebraska 223 1,589 17% -25% 25% Nebraska 244 2,107 18% -18% 66%New Mexico 9 407 7% New Mexico 561 5% -100% 38% New Mexico 5 937 7% -41% 130%North Dakota 39 1% North Dakota 0% 0% -100% North Dakota 80 320 3% 722%Oklahoma 675 11% Oklahoma 73 881 9% 100% 31% Oklahoma 76 974 8% 44%South Dakota 137 2% South Dakota 249 2% 0% 82% South Dakota 3 281 2% 105%Texas 167 2,653 44% Texas 84 5,488 52% -50% 107% Texas 95 6,164 47% -43% 132%Wyoming 90 603 11% Wyoming 232 1,179 13% 158% 96% Wyoming 231 1,610 14% 157% 167%Total ($m) $610 $5,781 Total ($m) 612 10,027 100% 0% 73% Total ($m) 783 12,496 100% 28% 116%
$6,391 10,639 66% 13,280 108%Millions
TOTALS Rail Truck TOTALS Rail Truck TOTALS Rail TruckColorado Colorado ColoradoMontana 122 462 5% Colorado 827 4% -100% 79% Colorado 883 4% -100% 91%Nebraska 298 1,989 18% Nebraska 223 2,706 14% -25% 36% Nebraska 254 4,310 18% -15% 117%New Mexico 9 1,060 9% New Mexico 2,487 12% -100% 135% New Mexico 2,825 11% -100% 167%North Dakota 39 0% North Dakota 120 1% 0% 208% North Dakota 444 2% 1038%Oklahoma 915 7% Oklahoma 73 1,301 7% -100% 42% Oklahoma 140 1,390 6% 52%South Dakota 324 3% South Dakota 476 2% 0% 47% South Dakota 541 2% 67%Texas 505 4,917 44% Texas 359 8,792 43% -29% 79% Texas 257 9,293 38% -49% 89%Wyoming 90 1,708 14% Wyoming 232 3,516 18% 158% 106% Wyoming 232 4,493 19% 158% 163%Total ($m) $1,024 $11,414 Total ($m) 887 20,225 100% -13% 77% Total ($m) 883 24,179 100% -14% 112%
$12,438 21,112 70% 25,062 101%
Colorado -- Page16