colorado travel impacts - dean runyan associatesdeanrunyan.com/doc_library/coimp.pdfcolorado travel...
TRANSCRIPT

Colorado Travel Impacts 1996-2016p
Image Credit: Matt Inden/Miles
June 2017
Prepared for the
Colorado Tourism Office
Denver, Colorado

THE ECONOMIC IMPACT OF TRAVEL ON COLORADO
1996-2016P
June 2017
prepared for the
Colorado Tourism Office Office of Economic Development and International Trade
Denver, Colorado
Dean Runyan Associates 833 SW Eleventh Avenue, Suite 920
Portland, OR 97205 503/226-2973
www.deanrunyan.com

PREFACE The purpose of this study is to document the economic significance of the travel industry in Colorado from 1996 to 2016. These findings show the level of travel spending by overnight international and domestic visitors traveling to and through the state and the impact this spending had on the economy in terms of earnings, employment and tax revenue.
This study was prepared for the Colorado Tourism Office by Dean Runyan Associates. Dean Runyan Associates has specialized in research and planning services for the travel, tourism and recreation industry since 1984. With respect to economic impact analysis, the firm developed and currently maintains the Regional Travel Impact Model (RTIM), a proprietary computer model for analyzing travel economic impacts at the state, regional and local level. Dean Runyan Associates also has extensive experience in project feasibility analysis, market evaluation, survey research and travel and tourism planning.
Special thanks are due to the staff at the Colorado Tourism Office for their valuable support and assistance.
Dean Runyan Associates
833 SW 11th Ave., Suite 920 Portland, OR 97205
(503) 226-2973 www.deanrunyan.com
TABLE OF CONTENTS
page
List of Tables and Figures i
Executive Summary iii
I. National Travel Trends 1
II. Colorado Travel Impacts 5
III. Regional Overnight Visitor Impacts 13
IV. District Overnight Visitor Impacts 21
V. County Overnight Visitor Impacts 35
Appendices
A. Regional Travel Impact Model 54
B. Definition of Terms 59
C. NAICS Industries 61
PAGE i DEAN RUNYAN ASSOCIATES

LIST OF TABLES AND FIGURES page
National Travel Trends
Annual Direct Travel Spending in U.S., 2000-2016p 2
Spending by Foreign and Resident Travelers in U.S. 2
Foreign Share of U.S. Internal Travel Spending 3
Overseas Arrivals (Millions) 3
Relative Value of Selected Foreign Currencies compared to U.S. Dollar 3
U.S. Travel Industry Employment 4
Components of U.S. Travel Industry Employment 4
State Travel Impacts
Colorado Travel Trends, 1996-2016p 7
Colorado Travel Industry Employment, 1996-2016p 8
Colorado Visitor Spending adjusted for Inflation, 2000-2016p 8
Taxable Sales of Lodging Establishments, 1996-2016p 9
Domestic Visitors to Colorado by Air Transportation, 2000-2016 9
Travel-Generated Local and State Tax Receipts, 2016p 10
Colorado Travel Impacts, 2006-2016p 11
Regional Overnight Visitor Impacts
Colorado Regions (counties included) 14
Overnight Visitor-Generated Earnings by Region, 2016p 14
Overnight Visitor-Generated Earnings as a % of Total Earnings, 2016p 15
Denver Metro Overnight Visitor Impacts, 2006-2016p 16
Mountain Resort Overnight Visitor Impacts, 2006-2016p 17
Pikes Peak Overnight Visitor Impacts, 2006-2016p 18
Other Colorado Overnight Visitor Impacts, 2006-2016p 19
Regional Overnight Visitor Impacts, 2016p 20
District Overnight Visitor Impacts
Colorado Districts (counties included) 22
Overnight Visitor-Generated Earnings by District, 2016p 23
Overnight Visitor-Generated Earnings as a % of Total Earnings, 2016p 23
Northwest District Overnight Visitor Impacts, 2006-2016p 24
Mesa District Overnight Visitor Impacts, 2006-2016p 25
Southwest District Overnight Visitor Impacts, 2006-2016p 26
North Central District Overnight Visitor Impacts, 2006-2016p 27
Central District Overnight Visitor Impacts, 2006-2016p 28
South Central District Overnight Visitor Impacts, 2006-2016p 29
Larimer District Overnight Visitor Impacts, 2006-2016p 30
Denver District Overnight Visitor Impacts, 2006-2016p 31
El Paso/Teller District Overnight Visitor Impacts, 2006-2016p 32
Northeast District Overnight Visitor Impacts, 2006-2016p 33
Southeast District Overnight Visitor Impacts, 2006-2016p 34
DEAN RUNYAN ASSOCIATESPAGE ii

LIST OF TABLES AND FIGURES (CONTINUED) El Paso through Garfield, 2002-2016p 41
Gilpin through Hinsdale, 2002-2016p 42
Huerfano through Kiowa, 2002-2016p 43
Kit Carson through Larimer, 2002-2016p 44
Las Animas through Mesa, 2002-2016p 45
Mineral through Montrose, 2002-2016p 46
Morgan through Park, 2002-2016p 47
Phillips through Pueblo, 2002-2016p 48
Rio Blanco through Saguache, 2002-2016p 49
San Juan through Summit, 2002-2016p 50
Teller through Yuma, 2002-2016p 51
PAGE iii DEAN RUNYAN ASSOCIATES

This page intentionally blank

EXECUTIVE SUMMARY
This report describes the economic impacts of travel to and through Colorado and each of its sixty-four counties, four tourism regions, and eleven districts. The estimates of the direct impacts associated with traveler spending in Colorado were produced using the Regional Travel Impact Model (RTIM) developed by Dean Runyan Associates.
Recent Travel Trends in the Colorado Travel Industry
· Total direct travel spending in Colorado during 2016 was over $19.7 billion - direct travel spending directly supported over 165,000 jobs and earnings of over $5.8 billion.
· The Colorado travel industry experienced a 2.7 percent increase in travel spending from 2015 in current dollars. Since 2009, travel spending in real (inflation-adjusted) dollars has increased by 4.1 percent per year.
$10
$12
$14
$16
$18
$20
20
00
20
01
20
02
20
03
20
04
20
05
20
06
20
07
20
08
20
09
20
10
20
11
20
12
20
13
20
14
20
15
20
16
Constant Dollars
Current Dollars
Bil
lio
ns
Colorado Travel Spending Adjusted for Inflation, 2000-2016p
Source: Dean Runyan Associates, Bureau of Labor Statistics and Rocky Mountain Lodging Report.
· Air travel to Colorado destinations on domestic flights was up 7.6 percent from the preceding year.
· The Colorado travel industry generated $1.2 billion in local and state tax revenues in the 2016 calendar year – this represents approximately $560 of tax revenue per household in the state.
PAGE v DEAN RUNYAN ASSOCIATES

THE TRAVEL INDUSTRY BENEFITS ALL REGIONS OF COLORADO
While travel and tourism is important throughout the state, about half (51%) of all overnight travel spending occurs in the Denver Metro Region.
17%All Other
51%Denver Metro
24%
MountainResort
9%Pikes Peak
Travel Spending by Region, 2016p
Source: Dean Runyan Associates, U.S. Bureau of Labor Statistics and U.S. Bureau of Economic Analysis.
Travel-Generated Earnings as a Percent of Total EarningsColorado Regions, 2016p
0% 2% 4% 6% 8% 10% 12% 14%
Mountain Resort
Denver Metro
Pikes Peak
Other Colorado
12.9%
2.0%
1.8%
1.7%
Percent Travel-Generated Earnings
Source: Dean Runyan Associates, U.S. Bureau of Labor Statistics and U.S. Bureau of Economic Analysis.
DEAN RUNYAN ASSOCIATESPAGE vi

I. NATIONAL TRAVEL TRENDS
PAGE 1 DEAN RUNYAN ASSOCIATES

The national level data in this section focuses on visitor spending trends in current and
real dollars, resident and foreign visitor spending in the U.S., and trends in
travel-generated employment.
The following two graphs are derived from the Bureau of Economic Analysis Travel and Tourism Satellite Accounts*. Both graphs show direct tourism output for the United States - spending by resident and foreign visitors. The 2016 values are based on the first three quarters of the year.
$400
$500
$600
$700
$800
$900
$1,000
00 02 04 06 08 10 12 14 16p
Current Real
Year
Ou
tpu
t (B
illi
on
s)
Annual Direct Travel Spending in U.S., 2000-16p Spending by resident and
foreign visitors was $938
billion in 2016 in current
dollars. This represents a
3.0 percent increase over
2015. When adjusted for
changes in prices (real
dollars), spending increased
by 2.3 percent from 2015
to 2016 - compared to a 4.7
percent increase for the
preceding year.
$60
$80
$100
$120
$140
$160
$180
$200
00 02 04 06 08 10 12 14 16p
Foreign Resident
Year
Ou
tpu
t (Y
ear
20
00
=1
00
)
Spending by Foreign and Resident Travelers in U.S.
(Curent Dollars; Year 2000=100)
The bottom chart compares
the change in current dollar
spending by resident and
foreign visitors since 2000.
In 2016, the increase in
spending by resident
visitors (4.7 percent)
compares to a 2.0 percent
decrease in non-resident
spending. Visitor spending
by non-residents increased
by 5.2 percent from 2014
to 2015. Note: Foreign visitor spending does not include expenditures on health and educational services or expenditures by short term seasonal workers.
*See http://www.bea.gov/industry/index.htm#satellite.
DEAN RUNYAN ASSOCIATESPAGE 2
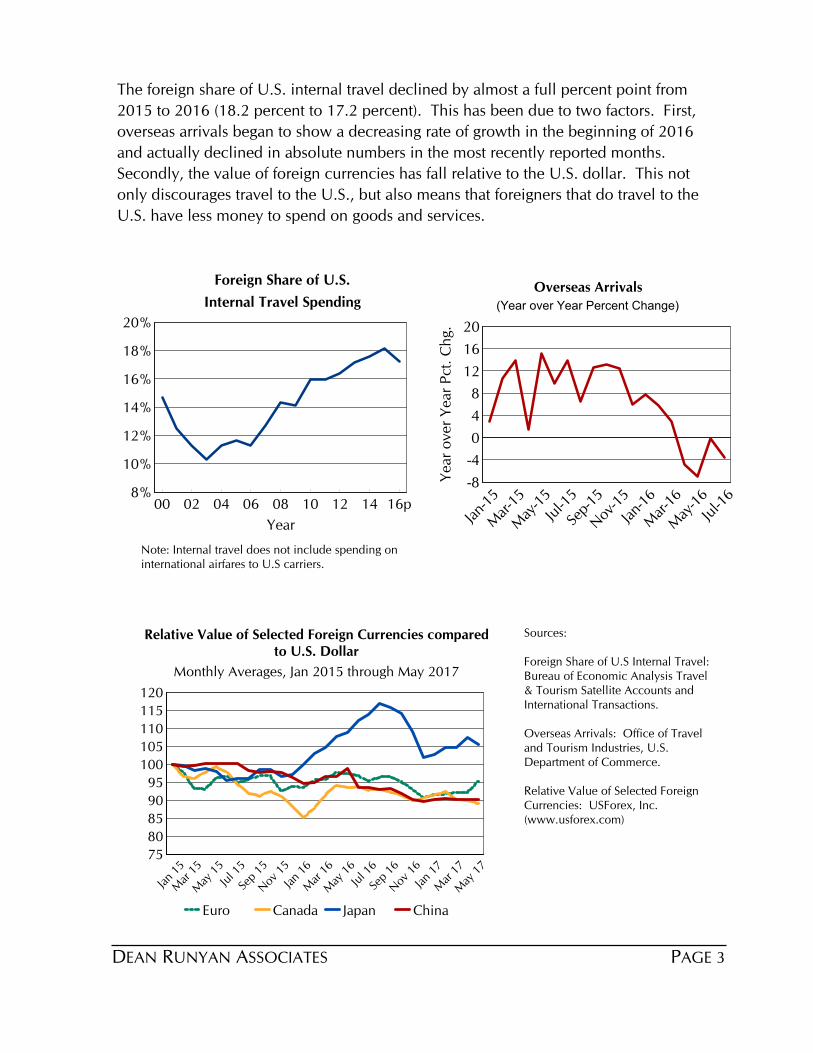
The foreign share of U.S. internal travel declined by almost a full percent point from
2015 to 2016 (18.2 percent to 17.2 percent). This has been due to two factors. First,
overseas arrivals began to show a decreasing rate of growth in the beginning of 2016
and actually declined in absolute numbers in the most recently reported months.
Secondly, the value of foreign currencies has fall relative to the U.S. dollar. This not
only discourages travel to the U.S., but also means that foreigners that do travel to the
U.S. have less money to spend on goods and services.
8%
10%
12%
14%
16%
18%
20%
00 02 04 06 08 10 12 14 16p
Year
Foreign Share of U.S.
Internal Travel Spending
Note: Internal travel does not include spending on international airfares to U.S carriers.
-8
-4
0
4
8
12
16
20
Jan-
15
Mar
-15
May
-15
Jul-1
5
Sep-
15
Nov
-15
Jan-
16
Mar
-16
May
-16
Jul-1
6
Yea
r o
ver
Yea
r P
ct.
Ch
g.
Overseas Arrivals
(Year over Year Percent Change)
75
80
85
90
95
100
105
110
115
120
Jan
15
Mar
15
May
15
Jul 1
5
Sep
15
Nov
15
Jan
16
Mar
16
May
16
Jul 1
6
Sep
16
Nov
16
Jan
17
Mar
17
May
17
Euro Canada Japan China
Relative Value of Selected Foreign Currencies comparedto U.S. Dollar
Monthly Averages, Jan 2015 through May 2017
Sources:
Foreign Share of U.S Internal Travel: Bureau of Economic Analysis Travel & Tourism Satellite Accounts and International Transactions.
Overseas Arrivals: Office of Travel and Tourism Industries, U.S. Department of Commerce.
Relative Value of Selected Foreign Currencies: USForex, Inc. (www.usforex.com)
PAGE 3 DEAN RUNYAN ASSOCIATES

4.4
4.6
4.8
5.0
5.2
5.4
5.6
5.8
6.0
00 04 08 12 16p
Year
Emp
loym
ent
(Millio
ns)
U.S. Travel Industry Employment
Source: Bureau of Economic Analysis Travel & Tourism Satellite Accounts.
The following two graphs show employment trends since 2000 and the composition
of travel industry employment since the recession. The first graph shows that
travel-generated employment recovered from the 2008-09 recession by 2013. Since
then, however, there has been no significant employment growth in the industry.
Leisure and hospitality employment was 3.5 million in 2016 or 65 percent of total
travel industry employment, compared to 3.6 million in 2000 or 61 percent of the
total. Most of this growth was due to food services employment. However,
employment in transportation and other industries declined over the same period from
2.3 million to 1.8 million, mostly due to decreased employment in the airline and
related transportation industries.
1.0K
1.5K
2.0K
2.5K
3.0K
3.5K
4.0K
00 04 08 12 16p
Leisure & Hosp. Transport & Other
Year
Components of U.S. Travel Industry Employment
Source: Bureau of Economic Analysis Travel & Tourism Satellite Accounts.Leisure & hospitality includes accommodations, food services, and arts, entertainment & recreation. Transportation and other includes retail and all other industries.
61%
65%
DEAN RUNYAN ASSOCIATESPAGE 4

II. COLORADO TRAVEL IMPACTS1996-2016p
PAGE 5 DEAN RUNYAN ASSOCIATES

The Scope of the Colorado Travel Industry
The multi-billion dollar travel industry in Colorado is an important part of the state and local economies. The industry is represented primarily by businesses in the leisure and hospitality sector, transportation, and retail. The money that visitors spend on various goods and services while in Colorado produces business receipts at these firms, which in turn generate earnings and employment for Colorado residents. In addition, state and local governments collect taxes that are generated from visitor spending. Most of these taxes are imposed on the sale of a goods and services to visitors, thus avoiding a tax burden on local residents.
The focus of this report is on the overnight (both domestic and international) and day visitor components of the Colorado travel industry from 1996 through 2016p. On the following pages are detailed travel spending, employment and earnings estimates, and tax receipts directly generated by overnight and day visitors to and through Colorado. Following this section, detailed travel impact estimates of overnight visitors for regions, districts and counties constitute the remainder of this report (impacts of day visitors available only at the state level).
Direct Impacts of Travel in Colorado: A Summary
· Total direct travel spending in Colorado was approximately $19.7 billion during 2016p.
· Visitors that stayed overnight in commercial lodging (hotels, motels, rented condos, bed & breakfasts) accounted for about two-thirds (66%) of all visitor spending.
· Lodging expenses (including campgrounds) accounted for 24 percent of all spending by visitors to Colorado. Motor fuel and ground transportation accounted for 11 percent, and food & beverage services accounted for 23 percent of all visitor spending.
· Direct travel spending in Colorado generated over 165,000 jobs with earnings of $5.8 billion in 2016p.
· Direct travel spending generated $1.2 billion in local and state taxes (not including property taxes).
· Since 1996, visitor-generated spending has increased at an average annual rate of 4.0 percent, earnings by 3.7 percent, and local and state tax revenues by 5.6 percent and 3.3 percent, respectively.
DEAN RUNYAN ASSOCIATESPAGE 6

Spending($Billion)
Earnings($Billion)
Employment(Thousand) Local State
Colorado Direct Travel Impacts, 1996-2016p
Tax Receipts ($Million)
Total
1996 $8.9 $2.8 139.7 $243 $258 $502
1997 $9.5 $2.9 139.3 $264 $275 $540
1998 $10.1 $3.1 141.5 $278 $293 $570
1999 $10.6 $3.1 140.6 $288 $295 $584
2000 $11.2 $3.3 140.2 $310 $303 $614
2001 $10.8 $3.4 131.2 $301 $288 $589
2002 $10.5 $3.3 128.2 $305 $283 $588
2003 $10.9 $3.3 128.2 $310 $289 $599
2004 $12.0 $3.5 136.3 $338 $316 $653
2005 $12.7 $3.6 137.5 $373 $327 $700
2006 $14.0 $3.9 142.6 $420 $360 $780
2007 $15.0 $4.1 147.0 $462 $383 $844
2008 $15.3 $4.2 148.2 $471 $381 $852
2009 $13.5 $4.0 140.1 $430 $350 $780
2010 $14.6 $4.0 138.4 $460 $366 $826
2011 $15.8 $4.1 141.1 $495 $382 $877
2012 $16.5 $4.4 145.1 $521 $397 $918
2013 $17.3 $4.7 150.4 $556 $418 $974
2014 $18.6 $5.0 155.4 $615 $446 $1,061
2015 $19.1 $5.5 160.6 $663 $470 $1,133
2016p $19.7 $5.8 165.4 $725 $491 $1,215
Annual Percent Change
15-16p
96-16p
2.7%
4.0%
6.9%
3.7%
3.0%
0.8%
9.3%
5.6%
4.4%
3.3%
7.3%
4.5%
Earnings include payroll, other earned income and proprietor income. Employment includes payroll employees and proprietors. Annual Percentage Change for 1996-2016p is the average annual percentage change.
PAGE 7 DEAN RUNYAN ASSOCIATES

COLORADO TRAVEL TRENDS The first graph, below, shows the trend in travel industry employment from 1996-2016p.
Colorado Travel Industry Employment, 1996-2016p
115K
125K
135K
145K
155K
165K
175K
19
96
19
97
19
98
19
99
20
00
20
01
20
02
20
03
20
04
20
05
20
06
20
07
20
08
20
09
20
10
20
11
20
12
20
13
20
14
20
15
20
16
Job
s
Source: Dean Runyan Associates, Inc.
Other indicators of visitor travel trends to Colorado are also shown. These include travel spending adjusted for inflation, taxable sales for lodging establishments and domestic air visitors to Colorado.
$10
$12
$14
$16
$18
$20
20
00
20
01
20
02
20
03
20
04
20
05
20
06
20
07
20
08
20
09
20
10
20
11
20
12
20
13
20
14
20
15
20
16
Constant Dollars
Current Dollars
Bil
lio
ns
Colorado Visitor Spending Adjusted for Inflation, 2000-2016p
Source: Dean Runyan Associates, Bureau of Labor Statistics and Rocky Mountain Lodging Report.
DEAN RUNYAN ASSOCIATESPAGE 8

$0.0
$0.5
$1.0
$1.5
$2.0
$2.5
$3.0
$3.5
$4.0
$4.5
19
96
19
97
19
98
19
99
20
00
20
01
20
02
20
03
20
04
20
05
20
06
20
07
20
08
20
09
20
10
20
11
20
12
20
13
20
14
20
15
20
16
Bil
lio
ns
Taxable Sales of Lodging Establishments, 1996-2016
Source: Dean Runyan Associates and Colorado Department of Revenue. Taxable Sales includes room rentals and other sales (e.g., food, entertainment) of lodging establishments. Some taxable room rentals (e.g., condos) not included.
Current Dollars
0.0
2.0
4.0
6.0
8.0
10.0
20
00
20
01
20
02
20
03
20
04
20
05
20
06
20
07
20
08
20
09
20
10
20
11
20
12
20
13
20
14
20
15
20
16
Mil
lio
ns
Domestic Visitors to Colorado by Air Transportation, 2000-2016
Source: Dean Runyan Associates and Bureau of Transportation Origin-Destination Survey. This is an estimate of visitation, not the amount of spending in Colorado.
PAGE 9 DEAN RUNYAN ASSOCIATES

TAX IMPACTS
Approximately one-half of all travel-generated tax receipts accrue to local governments in Colorado. Local taxes include room taxes, sales taxes and auto rental taxes levied by cities, counties and special districts and regions. Property taxes are not included. State taxes include the 2.9 percent state sales tax, the 22 cents per gallon motor fuel tax, and income taxes on travel-generated earnings and travel-related business income.
$106.6State Income
$500.9Local Sales
$154.5Local Lodging
$69.4Other Local*
$301.7State Sales
$82.5State Gasoline
Travel-Generated Tax Impacts: Local & State Receipts, 2016p
($Million)
Source: Dean Runyan Associates. *Other Local includes Passenger Facility Charge (PFC) and Auto Rental Tax.
DEAN RUNYAN ASSOCIATESPAGE 10

Colorado Travel Impacts, 2006-2016p
2006 2008 2010 2012 2013 2014 2015 2016p
Total Direct Travel Spending ($Million)Destination Spending 12,360 13,558 12,963 14,706 15,420 16,562 17,070 17,623
Other Travel* 1,616 1,709 1,603 1,796 1,875 2,015 2,066 2,038
Total Direct Spending 13,976 15,267 14,566 16,501 17,296 18,577 19,136 19,660
Visitor Spending by Type of Traveler Accommodation ($Million)Hotel, Motel, Rented Room 7,450 8,253 7,805 9,016 9,641 10,623 11,206 11,679
Campground 321 311 313 325 313 307 319 324
Private Home (VFR) 2,279 2,462 2,438 2,675 2,738 2,838 2,876 2,936
Vacation Home 540 602 613 647 656 672 674 691
Day Travel 1,770 1,930 1,794 2,043 2,072 2,122 1,995 1,992
Destination Spending 12,360 13,558 12,963 14,706 15,420 16,562 17,070 17,623
Visitor Spending by Commodity Purchased ($Million)Accommodations 2,419 2,791 2,496 2,827 3,061 3,481 3,870 4,161
Food Service 2,425 2,655 2,773 3,161 3,368 3,662 3,891 4,091
Food Stores 514 575 572 651 678 730 764 767
Local Tran. & Gas 1,943 2,319 1,972 2,326 2,325 2,326 1,940 1,869
Arts, Ent. & Rec. 1,736 1,765 1,740 1,916 2,000 2,112 2,177 2,228
Retail Sales 1,869 1,887 1,924 2,112 2,189 2,297 2,360 2,393
Visitor Air Tran. 1,455 1,567 1,486 1,711 1,799 1,953 2,068 2,114
Destination Spending 12,360 13,558 12,963 14,706 15,420 16,562 17,070 17,623
Industry Earnings Generated by Travel Spending ($Million)Accom. & Food Serv. 1,698 1,939 1,845 2,059 2,180 2,347 2,560 2,728
Arts, Ent. & Rec. 853 951 903 970 1,024 1,095 1,199 1,243
Retail** 346 367 353 371 382 403 428 446
Ground Tran. 95 102 102 102 105 116 125 132
Visitor Air Tran. 399 363 328 381 478 495 529 609
Other Travel* 533 480 425 472 579 594 616 675
Total Earnings 3,924 4,201 3,957 4,355 4,748 5,049 5,456 5,832
Industry Employment Generated by Travel Spending (Thousand Jobs)Accom. & Food Serv. 78.3 80.8 76.4 81.3 84.2 87.4 90.7 93.8
Arts, Ent. & Rec. 32.6 34.5 32.7 34.1 35.0 36.3 37.7 38.5
Retail** 13.9 14.2 13.5 13.9 14.2 14.5 14.9 15.3
Ground Tran. 3.3 3.4 3.0 3.0 3.1 3.3 3.4 3.6
Visitor Air Tran. 6.1 6.5 5.5 5.7 6.2 6.3 6.3 6.7
Other Travel* 8.4 8.7 7.2 7.2 7.7 7.7 7.6 7.5
Total Employment 142.6 148.2 138.4 145.1 150.4 155.4 160.6 165.4
Government Revenue Generated by Travel Spending ($Million)Local Tax Receipts 421 471 460 521 556 615 663 725
State Tax Receipts 360 381 366 397 418 446 470 491
Federal Tax Receipts 935 1,000 946 957 1,092 1,163 1,235 1,293
Total Direct Gov't Revenue 1,715 1,852 1,772 1,875 2,066 2,224 2,368 2,509
Details may not add to totals due to rounding.
*Other Travel includes resident air travel and travel agencies. **Retail includes gasoline.
PAGE 11 DEAN RUNYAN ASSOCIATES

This page intentionally blank
DEAN RUNYAN ASSOCIATESPAGE 12

III. REGIONAL OVERNIGHT VISITOR IMPACTS2006-2016p
PAGE 13 DEAN RUNYAN ASSOCIATES

COLORADO REGIONS
Denver Metro Mountain Resort
Adams Eagle
Arapahoe Grand
Broomfield Gunnison
Denver La Plata
Douglas Montrose
Jefferson Pitkin
Routt
Pikes Peak San Miguel
El Paso Summit
Fremont
Teller Other
all remaining counties
DEAN RUNYAN ASSOCIATESPAGE 14

17%All Other
51%Denver Metro
24%
MountainResort
8%Pikes Peak
Overnight Travel-Generated Earnings by Region, 2016p
Travel-generated earnings are distributed approximately half to the Denver Metro region, one-quarter (24%) to the Mountain Resort region, and the remainder to the Pikes Peak region and all other counties. However, the size of travel-generated earnings in relation to total earnings is actually much lower in the Denver Metro region as compared to the Mountain Resort region (as shown in the bar chart).
Overnight Travel-Generated Earnings as a percentage
of Total Earnings by Region, 2016p
0% 2% 4% 6% 8% 10% 12% 14%
Mountain Resort
Denver Metro
Pikes Peak
Other Colorado
13.0%
2.1%
1.8%
1.8%
Percent Travel-Generated Earnings
Source: Dean Runyan Associates, U.S. Bureau of Labor Statistics and U.S. Bureau of Economic Analysis.
Source: Dean Runyan Associates, U.S. Bureau of Labor Statistics and U.S. Bureau of Economic Analysis.
PAGE 15 DEAN RUNYAN ASSOCIATES

20132012201020082006
Denver MetroOvernight Travel Impacts, 2006-2016p
2014 2015 2016p
Total Direct Travel Spending ($Million)
Destination Spending 4,601 5,152 4,926 5,722 6,092 6,670 6,908 7,129
Other Travel* 1,361 1,429 1,380 1,565 1,659 1,789 1,840 1,803
Total Direct Spending 5,963 6,582 6,307 7,287 7,751 8,458 8,749 8,932
Visitor Spending by Type of Traveler Accommodation ($Million)
Hotel, Motel, Rented Room 3,254 3,695 3,514 4,140 4,463 4,964 5,174 5,362
Campground 22 20 20 21 20 20 21 21
Private Home (VFR) 1,292 1,400 1,355 1,520 1,568 1,644 1,672 1,704
Vacation Home 33 37 37 40 41 42 41 42
Destination Spending 4,601 5,152 4,926 5,722 6,092 6,670 6,908 7,129
Visitor Spending by Commodity Purchased ($Million)
Accommodations 783 958 849 1,001 1,106 1,305 1,440 1,538
Food Service 707 793 823 967 1,049 1,159 1,224 1,285
Food Stores 128 146 145 168 177 192 200 201
Local Tran. & Gas 843 980 889 1,020 1,043 1,063 961 956
Arts, Ent. & Rec. 437 461 455 510 538 578 596 613
Retail Sales 558 575 581 658 695 743 761 770
Visitor Air Tran. 1,145 1,241 1,185 1,398 1,484 1,629 1,728 1,765
Destination Spending 4,601 5,152 4,926 5,722 6,092 6,670 6,908 7,129
Industry Earnings Generated by Travel Spending ($Million)
Accom. & Food Serv. 543 644 605 684 728 791 868 932
Arts, Ent. & Rec. 221 254 229 254 271 293 320 333
Retail** 100 108 103 111 116 124 131 137
Ground Tran. 71 77 77 77 79 88 94 100
Visitor Air Tran. 380 343 311 362 458 476 508 586
Other Travel* 482 426 392 437 541 556 576 632
Total Earnings 1,797 1,852 1,716 1,925 2,195 2,327 2,497 2,720
Industry Employment Generated by Travel Spending (Thousand Jobs)
Accom. & Food Serv. 21.6 23.6 22.3 23.9 25.0 26.3 27.4 29.0
Arts, Ent. & Rec. 6.4 6.9 6.4 6.8 7.3 7.6 7.8 8.0
Retail** 3.6 3.8 3.6 3.8 4.0 4.2 4.2 4.0
Ground Tran. 2.5 2.6 2.3 2.3 2.3 2.5 2.6 3.0
Visitor Air Tran. 5.7 6.1 5.2 5.3 5.8 5.9 6.0 6.0
Other Travel* 7.2 7.6 6.5 6.5 7.0 7.0 6.9 7.0
Total Employment 46.9 50.6 46.2 48.6 51.5 53.4 54.9 57.0
Government Revenue Generated by Travel Spending ($Million)
Local Tax Receipts 190 219 211 241 261 295 316 336
State Tax Receipts 127 136 130 144 156 169 178 187
Total Gov't Revenue 317 356 341 385 417 464 494 523
Details may not add to totals due to rounding.
*Other Travel includes resident air travel and travel agencies. **Retail includes gasoline.
The Denver Metro region includes Adams, Arapahoe, Broomfield, Denver, Douglas and Jefferson counties.
DEAN RUNYAN ASSOCIATESPAGE 16

20132012201020082006
Mountain ResortOvernight Travel Impacts, 2006-2016p
2014 2015 2016p
Total Direct Travel Spending ($Million)
Destination Spending 2,814 3,007 2,891 3,200 3,399 3,691 3,973 4,164
Other Travel* 53 60 54 53 57 64 67 69
Total Direct Spending 2,868 3,067 2,945 3,253 3,456 3,755 4,040 4,233
Visitor Spending by Type of Traveler Accommodation ($Million)
Hotel, Motel, Rented Room 2,248 2,391 2,253 2,531 2,719 2,994 3,256 3,427
Campground 78 79 78 81 79 78 81 82
Private Home (VFR) 151 160 169 179 186 193 202 208
Vacation Home 338 377 391 408 415 428 435 447
Destination Spending 2,814 3,007 2,891 3,200 3,399 3,691 3,973 4,164
Visitor Spending by Commodity Purchased ($Million)
Accommodations 954 1,068 941 1,037 1,130 1,262 1,422 1,538
Food Service 673 712 747 838 893 973 1,048 1,100
Food Stores 163 179 178 201 210 229 242 244
Local Tran. & Gas 145 169 151 174 176 179 158 155
Arts, Ent. & Rec. 432 430 426 463 482 515 540 552
Retail Sales 278 272 279 302 312 328 342 346
Visitor Air Tran. 170 178 170 185 196 206 221 229
Destination Spending 2,814 3,007 2,891 3,200 3,399 3,691 3,973 4,164
Industry Earnings Generated by Travel Spending ($Million)
Accom. & Food Serv. 525 580 543 605 646 698 760 802
Arts, Ent. & Rec. 232 254 245 265 287 309 342 354
Retail** 60 63 62 64 66 70 76 79
Ground Tran. 11 12 12 12 12 13 14 15
Visitor Air Tran. 6 6 5 7 8 8 8 9
Other Travel* 6 7 4 4 5 5 6 6
Total Earnings 840 921 870 957 1,024 1,104 1,206 1,265
Industry Employment Generated by Travel Spending (Thousand Jobs)
Accom. & Food Serv. 20.9 20.6 19.3 20.6 21.2 22.1 22.8 23.0
Arts, Ent. & Rec. 6.8 6.9 6.8 7.4 7.6 8.0 8.4 9.0
Retail** 2.2 2.2 2.1 2.1 2.2 2.3 2.4 2.0
Ground Tran. 0.4 0.4 0.3 0.3 0.4 0.4 0.4 0.0
Visitor Air Tran. 0.2 0.2 0.1 0.2 0.2 0.2 0.2 0.0
Other Travel* 0.1 0.1 0.1 0.1 0.1 0.1 0.1 0.0
Total Employment 30.6 30.5 28.8 30.8 31.7 33.0 34.3 35.0
Government Revenue Generated by Travel Spending ($Million)
Local Tax Receipts 102 112 108 122 131 144 160 178
State Tax Receipts 71 77 73 80 86 93 101 107
Total Gov't Revenue 174 188 181 202 216 237 261 285
Details may not add to totals due to rounding.
*Other Travel includes resident air travel and travel agencies. **Retail includes gasoline.
The Mountain Resort region includes Eagle, Grand, Gunnison, La Plata, Montrose, Pitkin, Routt, San Miguel and Summit counties.
PAGE 17 DEAN RUNYAN ASSOCIATES
20132012201020082006
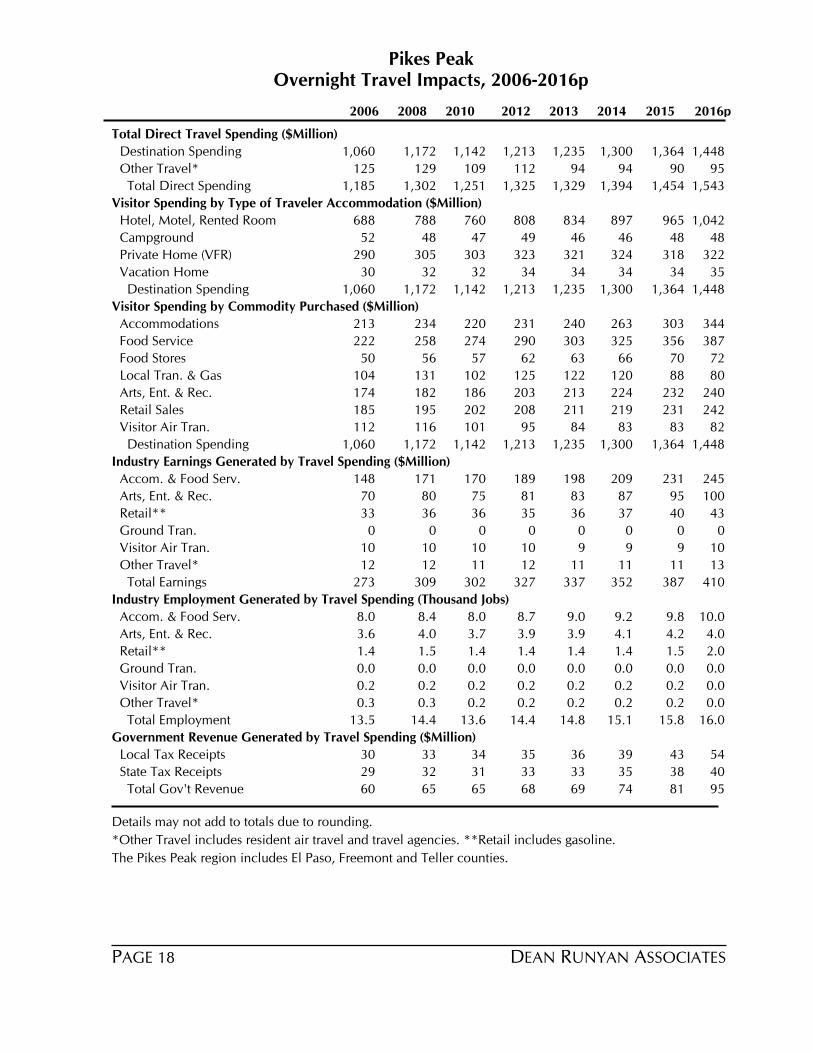
Pikes PeakOvernight Travel Impacts, 2006-2016p
2014 2015 2016p
Total Direct Travel Spending ($Million)
Destination Spending 1,060 1,172 1,142 1,213 1,235 1,300 1,364 1,448
Other Travel* 125 129 109 112 94 94 90 95
Total Direct Spending 1,185 1,302 1,251 1,325 1,329 1,394 1,454 1,543
Visitor Spending by Type of Traveler Accommodation ($Million)
Hotel, Motel, Rented Room 688 788 760 808 834 897 965 1,042
Campground 52 48 47 49 46 46 48 48
Private Home (VFR) 290 305 303 323 321 324 318 322
Vacation Home 30 32 32 34 34 34 34 35
Destination Spending 1,060 1,172 1,142 1,213 1,235 1,300 1,364 1,448
Visitor Spending by Commodity Purchased ($Million)
Accommodations 213 234 220 231 240 263 303 344
Food Service 222 258 274 290 303 325 356 387
Food Stores 50 56 57 62 63 66 70 72
Local Tran. & Gas 104 131 102 125 122 120 88 80
Arts, Ent. & Rec. 174 182 186 203 213 224 232 240
Retail Sales 185 195 202 208 211 219 231 242
Visitor Air Tran. 112 116 101 95 84 83 83 82
Destination Spending 1,060 1,172 1,142 1,213 1,235 1,300 1,364 1,448
Industry Earnings Generated by Travel Spending ($Million)
Accom. & Food Serv. 148 171 170 189 198 209 231 245
Arts, Ent. & Rec. 70 80 75 81 83 87 95 100
Retail** 33 36 36 35 36 37 40 43
Ground Tran. 0 0 0 0 0 0 0 0
Visitor Air Tran. 10 10 10 10 9 9 9 10
Other Travel* 12 12 11 12 11 11 11 13
Total Earnings 273 309 302 327 337 352 387 410
Industry Employment Generated by Travel Spending (Thousand Jobs)
Accom. & Food Serv. 8.0 8.4 8.0 8.7 9.0 9.2 9.8 10.0
Arts, Ent. & Rec. 3.6 4.0 3.7 3.9 3.9 4.1 4.2 4.0
Retail** 1.4 1.5 1.4 1.4 1.4 1.4 1.5 2.0
Ground Tran. 0.0 0.0 0.0 0.0 0.0 0.0 0.0 0.0
Visitor Air Tran. 0.2 0.2 0.2 0.2 0.2 0.2 0.2 0.0
Other Travel* 0.3 0.3 0.2 0.2 0.2 0.2 0.2 0.0
Total Employment 13.5 14.4 13.6 14.4 14.8 15.1 15.8 16.0
Government Revenue Generated by Travel Spending ($Million)
Local Tax Receipts 30 33 34 35 36 39 43 54
State Tax Receipts 29 32 31 33 33 35 38 40
Total Gov't Revenue 60 65 65 68 69 74 81 95
Details may not add to totals due to rounding.
*Other Travel includes resident air travel and travel agencies. **Retail includes gasoline.
The Pikes Peak region includes El Paso, Freemont and Teller counties.
DEAN RUNYAN ASSOCIATESPAGE 18

20132012201020082006
All OtherOvernight Travel Impacts, 2006-2016p
2014 2015 2016p
Total Direct Travel Spending ($Million)
Destination Spending 2,114 2,297 2,209 2,528 2,623 2,779 2,830 2,889
Other Travel* 77 91 60 66 66 69 69 70
Total Direct Spending 2,191 2,387 2,270 2,594 2,688 2,847 2,899 2,960
Visitor Spending by Type of Traveler Accommodation ($Million)
Hotel, Motel, Rented Room 1,260 1,379 1,278 1,538 1,625 1,769 1,811 1,848
Campground 168 163 167 174 168 164 170 172
Private Home (VFR) 547 597 611 653 664 678 685 703
Vacation Home 140 157 153 164 166 169 164 167
Destination Spending 2,114 2,297 2,209 2,528 2,623 2,779 2,830 2,889
Visitor Spending by Commodity Purchased ($Million)
Accommodations 469 532 487 559 585 652 704 741
Food Service 469 513 530 617 650 697 728 755
Food Stores 147 165 163 188 194 206 213 212
Local Tran. & Gas 243 293 248 297 299 302 251 241
Arts, Ent. & Rec. 375 375 361 401 416 429 435 439
Retail Sales 384 386 391 433 443 458 464 465
Visitor Air Tran. 27 32 29 34 35 35 36 37
Destination Spending 2,114 2,297 2,209 2,528 2,623 2,779 2,830 2,889
Industry Earnings Generated by Travel Spending ($Million)
Accom. & Food Serv. 343 388 372 410 429 459 493 525
Arts, Ent. & Rec. 180 199 195 204 210 223 243 249
Retail** 73 78 75 80 81 85 89 92
Ground Tran. 13 13 13 13 14 15 16 17
Visitor Air Tran. 3 3 3 2 2 2 3 3
Other Travel* 32 36 18 18 22 22 24 24
Total Earnings 644 718 677 727 758 806 867 911
Industry Employment Generated by Travel Spending (Thousand Jobs)
Accom. & Food Serv. 20.0 20.3 19.1 20.2 20.7 21.4 21.9 23.0
Arts, Ent. & Rec. 9.8 10.5 9.9 9.8 9.9 10.3 10.7 11.0
Retail** 3.3 3.4 3.2 3.3 3.3 3.4 3.4 4.0
Ground Tran. 0.4 0.4 0.4 0.4 0.4 0.4 0.4 0.0
Visitor Air Tran. 0.1 0.1 0.1 0.0 0.0 0.0 0.0 0.0
Other Travel* 0.8 0.7 0.4 0.4 0.4 0.4 0.4 0.0
Total Employment 34.4 35.4 33.1 34.1 34.8 35.9 36.9 38.0
Government Revenue Generated by Travel Spending ($Million)
Local Tax Receipts 63 70 69 81 85 92 97 105
State Tax Receipts 60 65 62 69 71 76 79 81
Total Gov't Revenue 123 135 132 150 156 168 176 186
Details may not add to totals due to rounding.
*Other Travel includes resident air travel and travel agencies. **Retail includes gasoline.
Other Colorado includes all counties not within Denver, Mountain Resort or Pikes Peak regions.
PAGE 19 DEAN RUNYAN ASSOCIATES

Regional Overnight Travel Impacts, 2016p
DenverMetro
MountainResort
PikesPeak
OtherColorado
Total Direct Travel Spending ($Million)Destination Spending 7,129 4,164 1,448 2,889
Other Travel* 1,803 69 95 70
8,932 4,233 1,543 2,959Total Direct Spending
Visitor Spending by Type of Traveler Accommodation ($Million)Hotel, Motel, Rented Room 5,362 3,427 1,042 1,848
Campground 21 82 48 172
Private Home (VFR) 1,704 208 322 703
Vacation Home 42 447 35 167
7,129 4,164 1,447 2,890Destination Spending
Visitor Spending by Commodity Purchased ($Million)Accommodations 1,538 1,538 344 741
Food Service 1,285 1,100 387 755
Food Stores 201 244 72 212
Local Tran. & Gas 956 155 80 241
Arts, Ent. & Rec. 613 552 240 439
Retail Sales 770 346 242 465
Visitor Air Tran. 1,765 229 82 37
7,128 4,164 1,447 2,890Destination Spending
Industry Earnings Generated by Travel Spending ($Million)Accom. & Food Serv. 932 802 245 525
Arts, Ent. & Rec. 333 354 100 249
Retail** 137 79 43 92
Ground Tran. 100 15 0 17
Visitor Air Tran. 586 9 10 3
Other Travel* 632 6 13 24
2,720 1,265 411 910Total Earnings
Industry Employment Generated by Travel Spending (Thousand Jobs)Accom. & Food Serv. 29.0 23.0 10.0 23.0
Arts, Ent. & Rec. 8.0 9.0 4.0 11.0
Retail** 4.0 2.0 2.0 4.0
Ground Tran. 3.0 0.0 0.0 0.0
Visitor Air Tran. 6.0 0.0 0.0 0.0
Other Travel* 7.0 0.0 0.0 0.0
57.0 34.0 16.0 38.0Total Employment
Government Revenue Generated by Travel Spending ($Million)Local Tax Receipts 336 178 54 105
State Tax Receipts 187 107 40 81
523 285 94 186Total Gov't Revenue
Details may not add to totals due to rounding.
*Other Travel includes resident air travel and travel agencies. **Retail includes gasoline.
DEAN RUNYAN ASSOCIATESPAGE 20

IV. DISTRICT OVERNIGHT VISITOR IMPACTS2006-2016p
PAGE 21 DEAN RUNYAN ASSOCIATES

Northwest District Central District El Paso/Teller District
Eagle Chaffee El Paso
Garfield Fremont Teller
Grand Gunnison
Jackson Hinsdale Northeast District
Moffat Lake Logan
Rio Blanco Park Morgan
Routt Pitkin Phillips
Sedgwick
Mesa District South Central District Washington
Mesa Alamosa Weld
Conejos Yuma
Southwest District Costilla
Archuleta Custer Southeast District
Delta Huerfano Baca
Dolores Las Animas Bent
La Plata Mineral Cheyenne
Montezuma Pueblo Crowley
Montrose Rio Grande Elbert
Ouray Saguache Kiowa
San Juan Kit Carson
San Miguel Larimer District Lincoln
Larimer Otero
North Central District Prowers
Clear Creek Denver District
Gilpin Adams
Summit Arapahoe
Boulder
Broomfield
Denver
Douglas
Jefferson
COLORADO DISTRICTS
DEAN RUNYAN ASSOCIATESPAGE 22

$0 $800 $1,600 $2,400 $3,200
Denver District
Northwest District
El Paso/Teller District
Central District
North Central District
Southwest District
Larimer District
South Central District
Northeast District
Mesa District
Southeast District
$2,886
$600
$394
$388
$291
$261
$184
$111
$77
$70
$43
Millions
Overnight Travel-Generated Earnings by District, 2016p(Millions)
Source: Dean Runyan Associates, U.S. Bureau of Labor Statistics and U.S. Bureau of Economic Analysis.
0% 2% 4% 6% 8% 10% 12% 14% 16% 18%
North Central District
Central District
Northwest District
Southwest District
Southeast District
South Central District
Denver District
Mesa District
El Paso/Teller District
Larimer District
Northeast District
16.6%
12.1%
10.1%
5.7%
2.8%
2.3%
2.0%
1.9%
1.8%
1.7%
0.8%
Percent Travel-Generated Earnings
Overnight Travel-Generated Earnings as a percentage
of Total Earnings by District, 2016p
Source: Dean Runyan Associates, U.S. Bureau of Labor Statistics and U.S. Bureau of Economic Analysis.
PAGE 23 DEAN RUNYAN ASSOCIATES

20132012201020082006
Northwest DistrictOvernight Travel Impacts, 2006-2016p
2014 2015 2016p
Total Direct Travel Spending ($Million)Destination Spending 1,378 1,482 1,342 1,570 1,634 1,760 1,878 1,940Other Travel* 16 16 12 11 11 11 11 12 Total Direct Spending 1,393 1,498 1,354 1,581 1,644 1,771 1,889 1,952
Visitor Spending by Type of Traveler Accommodation ($Million)Hotel, Motel, Rented Room 1,085 1,154 1,004 1,223 1,283 1,401 1,512 1,564Campground 40 44 39 41 40 39 41 41Private Home (VFR) 83 90 90 92 93 96 99 101Vacation Home 169 194 209 214 218 224 227 234 Destination Spending 1,378 1,482 1,342 1,570 1,634 1,760 1,878 1,940
Visitor Spending by Commodity Purchased ($Million)Accommodations 444 497 407 480 512 562 636 675Food Service 329 353 349 420 439 476 507 527Food Stores 81 91 86 102 105 114 120 119Local Tran. & Gas 75 88 76 90 90 91 78 76Arts, Ent. & Rec. 225 225 212 245 252 268 279 284Retail Sales 148 148 142 163 166 173 178 179Visitor Air Tran. 76 80 69 70 71 75 80 81 Destination Spending 1,378 1,482 1,342 1,570 1,634 1,760 1,878 1,940
Industry Earnings Generated by Travel Spending ($Million)Accom. & Food Serv. 254 283 259 295 308 333 362 382Arts, Ent. & Rec. 111 123 116 123 134 144 158 165Retail** 32 35 32 35 36 38 40 41Ground Tran. 5 5 5 5 5 6 6 7Visitor Air Tran. 1 1 2 3 3 3 4 4Other Travel* 3 3 2 2 2 2 2 2 Total Earnings 406 449 415 463 487 525 571 600
Industry Employment Generated by Travel Spending (Jobs)Accom. & Food Serv. 10,220 10,180 9,270 10,100 10,240 10,620 11,030 11,240Arts, Ent. & Rec. 3,390 3,820 3,700 3,930 4,010 4,250 4,380 4,790Retail** 1,160 1,160 1,030 1,110 1,130 1,140 1,190 1,210Ground Tran. 160 170 150 150 150 160 170 170Visitor Air Tran. 30 30 30 60 70 70 70 70Other Travel* 70 60 40 40 40 40 40 40 Total Employment 15,030 15,420 14,220 15,380 15,630 16,270 16,870 17,520
Government Revenue Generated by Travel Spending ($Million)Local Tax Receipts 51 55 49 58 61 67 75 83State Tax Receipts 35 38 34 39 41 44 48 50 Total Gov't Revenue 86 93 83 98 103 111 123 133
Details may not add to totals due to rounding.
*Other Travel includes resident air travel and travel agencies. **Retail includes gasoline.
The Northwest District includes Eagle, Garfield, Grand, Jackson, Moffat, Rio Blanco and Routt counties.
DEAN RUNYAN ASSOCIATESPAGE 24

20132012201020082006
Mesa DistrictOvernight Travel Impacts, 2006-2016p
2014 2015 2016p
Total Direct Travel Spending ($Million)Destination Spending 200 241 210 232 236 240 247 247Other Travel* 24 31 30 35 33 35 34 35 Total Direct Spending 224 273 240 267 269 275 281 282
Visitor Spending by Type of Traveler Accommodation ($Million)Hotel, Motel, Rented Room 132 164 131 146 150 153 159 158Campground 9 9 10 11 10 10 10 11Private Home (VFR) 54 63 63 68 69 71 71 72Vacation Home 5 6 6 6 6 6 6 6 Destination Spending 200 241 210 232 236 240 247 247
Visitor Spending by Commodity Purchased ($Million)Accommodations 44 62 48 50 50 51 56 57Food Service 43 51 47 52 54 55 58 59Food Stores 13 15 14 16 16 16 17 17Local Tran. & Gas 20 24 20 24 24 23 19 18Arts, Ent. & Rec. 23 25 23 24 24 24 25 25Retail Sales 35 38 35 38 38 38 38 38Visitor Air Tran. 22 27 25 29 30 32 34 34 Destination Spending 200 241 210 232 236 240 247 247
Industry Earnings Generated by Travel Spending ($Million)Accom. & Food Serv. 31 40 36 39 41 44 46 47Arts, Ent. & Rec. 9 11 9 8 9 9 10 10Retail** 6 7 6 7 7 7 7 7Ground Tran. 1 1 1 1 1 1 1 1Visitor Air Tran. 3 3 2 1 2 2 2 2Other Travel* 4 4 3 2 2 2 2 2 Total Earnings 53 65 57 58 61 64 68 70
Industry Employment Generated by Travel Spending (Jobs)Accom. & Food Serv. 1,700 1,880 1,670 1,760 1,810 1,900 1,910 1,930Arts, Ent. & Rec. 900 1,000 850 790 810 750 760 800Retail** 260 280 260 260 260 260 270 270Ground Tran. 30 30 30 30 30 30 30 30Visitor Air Tran. 60 60 40 30 40 40 40 40Other Travel* 80 90 60 40 40 40 40 40 Total Employment 3,030 3,340 2,910 2,900 2,990 3,020 3,050 3,100
Government Revenue Generated by Travel Spending ($Million)Local Tax Receipts 7 9 7 8 8 8 9 9State Tax Receipts 6 6 6 6 6 6 6 7 Total Gov't Revenue 12 15 13 14 14 14 15 15
Details may not add to totals due to rounding.
*Other Travel includes resident air travel and travel agencies. **Retail includes gasoline.
The Mesa District includes Mesa county.
PAGE 25 DEAN RUNYAN ASSOCIATES

20132012201020082006
Southwest DistrictOvernight Travel Impacts, 2006-2016p
2014 2015 2016p
Total Direct Travel Spending ($Million)Destination Spending 588 628 607 673 719 760 810 866Other Travel* 23 26 26 27 30 34 36 36 Total Direct Spending 610 653 632 700 749 795 846 902
Visitor Spending by Type of Traveler Accommodation ($Million)Hotel, Motel, Rented Room 382 406 376 426 473 511 556 606Campground 70 72 75 78 75 73 76 77Private Home (VFR) 66 71 78 84 86 88 90 94Vacation Home 70 78 79 85 86 88 87 89 Destination Spending 588 628 607 673 719 760 810 866
Visitor Spending by Commodity Purchased ($Million)Accommodations 162 178 164 178 193 211 236 262Food Service 126 134 136 154 168 179 195 212Food Stores 38 42 41 46 49 51 55 57Local Tran. & Gas 61 71 63 73 74 76 67 66Arts, Ent. & Rec. 81 82 78 84 90 94 100 106Retail Sales 80 78 80 85 89 91 95 98Visitor Air Tran. 40 43 44 53 56 59 61 65 Destination Spending 588 628 607 673 719 760 810 866
Industry Earnings Generated by Travel Spending ($Million)Accom. & Food Serv. 110 120 112 121 131 138 150 162Arts, Ent. & Rec. 42 46 45 50 54 58 63 68Retail** 17 17 17 17 18 19 20 21Ground Tran. 5 5 5 5 5 6 6 7Visitor Air Tran. 2 2 1 2 2 2 2 2Other Travel* 1 1 1 1 1 1 1 1 Total Earnings 176 191 181 196 211 223 242 261
Industry Employment Generated by Travel Spending (Jobs)Accom. & Food Serv. 5,520 5,300 4,800 4,940 5,260 5,350 5,510 5,760Arts, Ent. & Rec. 1,840 1,700 1,680 1,800 1,830 1,890 2,040 2,160Retail** 760 750 710 710 730 740 770 820Ground Tran. 170 170 150 150 160 170 170 180Visitor Air Tran. 50 60 50 50 50 50 50 50Other Travel* 40 40 30 30 30 30 30 30 Total Employment 8,390 8,020 7,430 7,690 8,060 8,230 8,570 9,000
Government Revenue Generated by Travel Spending ($Million)Local Tax Receipts 19 20 20 22 24 25 28 31State Tax Receipts 16 16 16 17 18 19 21 22 Total Gov't Revenue 34 37 36 39 42 44 49 53
Details may not add to totals due to rounding.
*Other Travel includes resident air travel and travel agencies. **Retail includes gasoline.
The Southwest District includes Archuleta, Delta, Dolores, La Plata, Montezuma, Montrose, Ouray, San Juan and San Miguel counties.
DEAN RUNYAN ASSOCIATESPAGE 26

20132012201020082006
North Central DistrictOvernight Travel Impacts, 2006-2016p
2014 2015 2016p
Total Direct Travel Spending ($Million)Destination Spending 716 760 720 791 859 938 1,015 1,113Other Travel* 0 0 0 0 0 0 0 0 Total Direct Spending 717 761 720 791 859 939 1,016 1,114
Visitor Spending by Type of Traveler Accommodation ($Million)Hotel, Motel, Rented Room 625 666 624 690 757 834 908 1,004Campground 19 18 18 18 18 17 18 18Private Home (VFR) 15 16 20 20 21 22 22 23Vacation Home 57 60 59 62 63 65 67 69 Destination Spending 716 760 720 791 859 938 1,015 1,113
Visitor Spending by Commodity Purchased ($Million)Accommodations 257 293 258 282 316 359 407 463Food Service 165 175 183 201 218 240 262 290Food Stores 39 42 42 47 50 55 59 62Local Tran. & Gas 22 27 22 26 26 26 20 19Arts, Ent. & Rec. 164 156 147 162 172 178 182 188Retail Sales 69 67 68 73 77 81 86 91Visitor Air Tran. 0 0 0 0 0 0 0 0 Destination Spending 716 760 720 791 859 938 1,015 1,113
Industry Earnings Generated by Travel Spending ($Million)Accom. & Food Serv. 122 136 123 134 144 155 172 184Arts, Ent. & Rec. 63 66 71 71 72 76 83 88Retail** 14 15 14 15 15 16 18 19Ground Tran. 1 1 1 1 1 1 1 1Visitor Air Tran. 0 0 0 0 0 0 0 0Other Travel* 0 0 0 0 0 0 0 0 Total Earnings 200 218 209 220 232 248 274 292
Industry Employment Generated by Travel Spending (Jobs)Accom. & Food Serv. 5,550 5,520 5,300 5,740 5,900 6,110 6,360 6,550Arts, Ent. & Rec. 2,110 2,110 2,230 2,320 2,360 2,450 2,580 2,670Retail** 560 540 540 550 580 610 630 660Ground Tran. 20 20 20 20 20 20 20 20Visitor Air Tran. 0 0 0 0 0 0 0 0Other Travel* 10 10 0 0 0 0 0 0 Total Employment 8,250 8,200 8,090 8,620 8,850 9,190 9,600 9,900
Government Revenue Generated by Travel Spending ($Million)Local Tax Receipts 23 26 25 28 31 34 38 44State Tax Receipts 19 20 19 21 22 25 27 30 Total Gov't Revenue 41 46 44 48 53 59 65 74
Details may not add to totals due to rounding.
*Other Travel includes resident air travel and travel agencies. **Retail includes gasoline.
The North Central District includes Clear Creek, Gilpin, and Summit counties.
PAGE 27 DEAN RUNYAN ASSOCIATES

20132012201020082006
Central DistrictOvernight Travel Impacts, 2006-2016p
2014 2015 2016p
Total Direct Travel Spending ($Million)Destination Spending 798 841 876 911 955 1,032 1,089 1,108Other Travel* 18 20 17 17 18 19 20 21 Total Direct Spending 815 861 893 927 973 1,051 1,109 1,130
Visitor Spending by Type of Traveler Accommodation ($Million)Hotel, Motel, Rented Room 599 635 664 687 727 801 850 864Campground 44 40 42 44 43 42 44 44Private Home (VFR) 60 63 66 71 74 76 79 81Vacation Home 96 104 104 110 111 114 116 119 Destination Spending 798 841 876 911 955 1,032 1,089 1,108
Visitor Spending by Commodity Purchased ($Million)Accommodations 247 272 263 269 285 322 352 370Food Service 190 200 227 238 250 270 285 290Food Stores 48 53 56 60 61 66 69 67Local Tran. & Gas 40 48 42 49 49 50 43 43Arts, Ent. & Rec. 126 125 135 134 138 146 151 149Retail Sales 90 87 96 98 100 105 107 106Visitor Air Tran. 56 57 58 64 72 74 81 85 Destination Spending 798 841 876 911 955 1,032 1,089 1,108
Industry Earnings Generated by Travel Spending ($Million)Accom. & Food Serv. 159 174 170 187 199 216 230 243Arts, Ent. & Rec. 79 86 84 88 94 101 114 112Retail** 19 19 20 20 20 21 22 23Ground Tran. 3 3 3 3 3 3 4 4Visitor Air Tran. 3 4 2 2 3 3 3 4Other Travel* 3 3 2 2 2 3 3 3 Total Earnings 265 289 281 302 322 348 377 388
Industry Employment Generated by Travel Spending (Jobs)Accom. & Food Serv. 6,570 6,390 6,120 6,400 6,570 6,860 6,890 7,020Arts, Ent. & Rec. 1,940 1,910 1,830 1,880 1,900 1,950 2,030 2,100Retail** 770 750 750 740 750 770 790 810Ground Tran. 100 100 90 90 90 100 100 110Visitor Air Tran. 80 100 60 60 70 70 70 70Other Travel* 60 70 30 30 30 30 30 30 Total Employment 9,520 9,320 8,870 9,200 9,410 9,760 9,920 10,140
Government Revenue Generated by Travel Spending ($Million)Local Tax Receipts 29 31 34 36 38 42 45 50State Tax Receipts 20 21 22 22 24 26 27 28 Total Gov't Revenue 49 52 56 59 62 68 72 78
Details may not add to totals due to rounding.
*Other Travel includes resident air travel and travel agencies. **Retail includes gasoline.
The Central District includes Chaffee, Fremont, Gunnison, Hinsdale, Lake, Park and Pitkin counties.
DEAN RUNYAN ASSOCIATESPAGE 28

20132012201020082006
South Central DistrictOvernight Travel Impacts, 2006-2016p
2014 2015 2016p
Total Direct Travel Spending ($Million)Destination Spending 237 267 275 299 294 308 321 330Other Travel* 2 2 2 2 2 2 1 1 Total Direct Spending 239 269 277 302 296 310 323 331
Visitor Spending by Type of Traveler Accommodation ($Million)Hotel, Motel, Rented Room 126 151 157 175 170 184 199 205Campground 27 25 26 27 26 26 27 27Private Home (VFR) 65 69 72 76 77 77 76 78Vacation Home 19 21 20 22 22 22 20 21 Destination Spending 237 267 275 299 294 308 321 330
Visitor Spending by Commodity Purchased ($Million)Accommodations 53 63 65 68 64 71 80 86Food Service 58 65 72 80 80 85 92 96Food Stores 19 21 22 24 24 26 27 27Local Tran. & Gas 28 36 28 35 34 34 26 23Arts, Ent. & Rec. 30 32 33 35 35 36 37 38Retail Sales 47 48 52 56 54 56 58 58Visitor Air Tran. 2 3 3 2 3 2 1 2 Destination Spending 237 267 275 299 294 308 321 330
Industry Earnings Generated by Travel Spending ($Million)Accom. & Food Serv. 40 47 47 48 48 50 54 58Arts, Ent. & Rec. 26 30 29 31 31 34 38 39Retail** 10 10 11 11 11 11 12 12Ground Tran. 0 0 0 0 0 0 0 0Visitor Air Tran. 0 0 0 0 0 0 0 0Other Travel* 1 0 0 0 0 0 1 0 Total Earnings 77 88 87 91 91 96 105 111
Industry Employment Generated by Travel Spending (Jobs)Accom. & Food Serv. 2,980 3,180 3,060 2,970 2,980 3,050 3,110 3,280Arts, Ent. & Rec. 1,040 1,100 950 930 920 980 1,020 1,090Retail** 480 490 490 480 470 480 500 510Ground Tran. 10 10 10 10 10 10 10 10Visitor Air Tran. 0 0 0 0 0 0 0 0Other Travel* 20 10 10 10 10 10 10 10 Total Employment 4,520 4,800 4,520 4,400 4,400 4,520 4,650 4,900
Government Revenue Generated by Travel Spending ($Million)Local Tax Receipts 7 8 8 9 9 9 10 11State Tax Receipts 7 8 8 9 8 9 10 10 Total Gov't Revenue 14 16 17 18 17 18 20 21
Details may not add to totals due to rounding.
*Other Travel includes resident air travel and travel agencies. **Retail includes gasoline.
The South Central District includes Alamosa, Conejos, Costilla, Custer, Huerfano, Las Animas, Mineral, Pueblo, Rio Grande and Saguache counties.
PAGE 29 DEAN RUNYAN ASSOCIATES

20132012201020082006
Larimer DistrictOvernight Travel Impacts, 2006-2016p
2014 2015 2016p
Total Direct Travel Spending ($Million)Destination Spending 429 440 427 510 534 593 618 608Other Travel* 8 9 6 5 3 3 4 4 Total Direct Spending 437 449 433 515 537 596 622 612
Visitor Spending by Type of Traveler Accommodation ($Million)Hotel, Motel, Rented Room 253 251 237 308 330 385 406 390Campground 37 34 34 35 34 33 34 35Private Home (VFR) 102 113 115 123 125 129 133 136Vacation Home 37 42 41 44 45 46 45 46 Destination Spending 429 440 427 510 534 593 618 608
Visitor Spending by Commodity Purchased ($Million)Accommodations 106 105 101 125 135 158 175 176Food Service 99 103 105 128 136 153 162 160Food Stores 32 34 33 40 41 46 48 46Local Tran. & Gas 40 49 41 49 49 49 40 38Arts, Ent. & Rec. 71 70 68 78 81 88 91 89Retail Sales 81 78 78 90 92 100 102 99Visitor Air Tran. 0 1 1 1 0 0 0 0 Destination Spending 429 440 427 510 534 593 618 608
Industry Earnings Generated by Travel Spending ($Million)Accom. & Food Serv. 68 71 74 86 90 97 108 112Arts, Ent. & Rec. 30 33 33 36 40 44 47 47Retail** 15 15 14 16 16 18 19 19Ground Tran. 2 2 2 2 2 2 2 2Visitor Air Tran. 0 0 0 0 0 0 0 0Other Travel* 4 4 3 3 4 3 4 4 Total Earnings 118 125 126 143 151 164 180 184
Industry Employment Generated by Travel Spending (Jobs)Accom. & Food Serv. 3,840 3,670 3,660 4,050 4,120 4,260 4,450 4,540Arts, Ent. & Rec. 2,180 2,440 2,350 2,360 2,410 2,670 3,010 2,800Retail** 660 660 620 660 660 680 710 690Ground Tran. 60 60 50 50 60 60 60 60Visitor Air Tran. 0 0 0 0 0 0 0 0Other Travel* 100 100 70 60 70 60 60 60 Total Employment 6,840 6,930 6,750 7,180 7,320 7,720 8,290 8,160
Government Revenue Generated by Travel Spending ($Million)Local Tax Receipts 12 12 12 15 16 18 19 21State Tax Receipts 12 12 12 14 15 16 17 17 Total Gov't Revenue 24 24 24 29 31 34 37 38
Details may not add to totals due to rounding.
*Other Travel includes resident air travel and travel agencies. **Retail includes gasoline.
The Larimer District includes Larimer county.
DEAN RUNYAN ASSOCIATESPAGE 30

20132012201020082006
Denver DistrictOvernight Travel Impacts, 2006-2016p
2014 2015 2016p
Total Direct Travel Spending ($Million)Destination Spending 4,956 5,539 5,306 6,151 6,541 7,133 7,381 7,623Other Travel* 1,380 1,453 1,393 1,579 1,672 1,802 1,854 1,819 Total Direct Spending 6,335 6,993 6,699 7,729 8,213 8,935 9,235 9,441
Visitor Spending by Type of Traveler Accommodation ($Million)Hotel, Motel, Rented Room 3,488 3,951 3,764 4,429 4,770 5,282 5,501 5,707Campground 24 22 23 24 23 22 23 23Private Home (VFR) 1,396 1,513 1,467 1,641 1,690 1,769 1,799 1,833Vacation Home 48 53 53 58 58 60 59 60 Destination Spending 4,956 5,539 5,306 6,151 6,541 7,133 7,381 7,623
Visitor Spending by Commodity Purchased ($Million)Accommodations 869 1,057 940 1,105 1,219 1,427 1,572 1,681Food Service 791 884 920 1,077 1,166 1,279 1,349 1,418Food Stores 153 174 172 199 210 226 235 236Local Tran. & Gas 877 1,021 923 1,062 1,084 1,104 992 986Arts, Ent. & Rec. 496 522 516 576 606 647 666 686Retail Sales 625 642 650 733 773 821 840 851Visitor Air Tran. 1,145 1,241 1,185 1,398 1,484 1,629 1,728 1,765 Destination Spending 4,956 5,539 5,306 6,151 6,541 7,133 7,381 7,623
Industry Earnings Generated by Travel Spending ($Million)Accom. & Food Serv. 600 708 666 752 801 866 950 1,020Arts, Ent. & Rec. 258 296 268 297 316 340 370 386Retail** 112 121 115 124 130 138 146 152Ground Tran. 72 78 78 78 80 89 96 101Visitor Air Tran. 380 343 311 362 458 476 508 587Other Travel* 493 440 399 445 549 564 584 641 Total Earnings 1,915 1,986 1,837 2,058 2,334 2,473 2,653 2,886
Industry Employment Generated by Travel Spending (Jobs)Accom. & Food Serv. 24,210 26,420 24,890 26,650 27,820 29,140 30,400 31,700Arts, Ent. & Rec. 8,250 8,810 8,200 8,680 9,210 9,450 9,660 9,650Retail** 4,090 4,290 4,090 4,310 4,490 4,620 4,700 4,790Ground Tran. 2,540 2,610 2,300 2,320 2,370 2,490 2,610 2,720Visitor Air Tran. 5,670 6,050 5,160 5,320 5,820 5,910 5,950 6,290Other Travel* 7,400 7,800 6,600 6,580 7,110 7,120 7,000 6,970 Total Employment 52,150 55,980 51,250 53,870 56,820 58,730 60,320 62,130
Government Revenue Generated by Travel Spending ($Million)Local Tax Receipts 204 235 227 260 281 316 339 362State Tax Receipts 137 148 141 156 168 182 191 201 Total Gov't Revenue 342 383 368 416 450 498 530 563
Details may not add to totals due to rounding.
*Other Travel includes resident air travel and travel agencies. **Retail includes gasoline.
DistrictThe Denver District includes Adams, Arapahoe, Boulder, Broomfield, Denver, Douglas and Jefferson counties.
PAGE 31 DEAN RUNYAN ASSOCIATES

20132012201020082006
El Paso/Teller DistrictOvernight Travel Impacts, 2006-2016p
2014 2015 2016p
Total Direct Travel Spending ($Million)Destination Spending 1,005 1,115 1,087 1,156 1,176 1,241 1,300 1,382Other Travel* 124 129 109 112 94 94 90 96 Total Direct Spending 1,130 1,245 1,196 1,267 1,270 1,335 1,390 1,478
Visitor Spending by Type of Traveler Accommodation ($Million)Hotel, Motel, Rented Room 668 766 740 788 811 874 936 1,013Campground 39 36 35 36 35 34 36 36Private Home (VFR) 273 287 285 304 302 304 299 303Vacation Home 25 27 27 28 28 29 29 30 Destination Spending 1,005 1,115 1,087 1,156 1,176 1,241 1,300 1,382
Visitor Spending by Commodity Purchased ($Million)Accommodations 202 223 209 221 230 252 290 330Food Service 210 244 260 276 287 310 338 369Food Stores 45 51 52 56 58 61 65 66Local Tran. & Gas 98 123 96 117 114 112 82 75Arts, Ent. & Rec. 166 174 178 195 205 216 223 231Retail Sales 173 183 190 195 198 207 218 229Visitor Air Tran. 112 116 101 95 84 83 83 82 Destination Spending 1,005 1,115 1,087 1,156 1,176 1,241 1,300 1,382
Industry Earnings Generated by Travel Spending ($Million)Accom. & Food Serv. 140 162 161 181 190 201 222 235Arts, Ent. & Rec. 66 76 71 77 79 83 91 95Retail** 31 34 33 33 33 35 38 41Ground Tran. 0 0 0 0 0 0 0 0Visitor Air Tran. 10 10 10 10 9 9 9 10Other Travel* 12 12 11 12 11 11 11 13 Total Earnings 258 293 287 312 323 338 371 394
Industry Employment Generated by Travel Spending (Jobs)Accom. & Food Serv. 7,290 7,790 7,450 8,130 8,520 8,750 9,250 9,620Arts, Ent. & Rec. 3,410 3,800 3,470 3,710 3,750 3,890 3,970 4,180Retail** 1,260 1,370 1,320 1,280 1,300 1,330 1,400 1,470Ground Tran. 0 0 0 0 0 0 0 0Visitor Air Tran. 220 220 180 170 170 160 160 160Other Travel* 280 280 220 220 210 200 200 210 Total Employment 12,460 13,470 12,650 13,520 13,950 14,330 14,980 15,640
Government Revenue Generated by Travel Spending ($Million)Local Tax Receipts 29 32 32 34 35 37 41 52State Tax Receipts 28 30 30 31 32 33 36 39 Total Gov't Revenue 57 62 62 65 66 71 77 90
Details may not add to totals due to rounding.
*Other Travel includes resident air travel and travel agencies. **Retail includes gasoline.
The El Paso/Teller District includes El Paso and Teller counties.
DEAN RUNYAN ASSOCIATESPAGE 32

20132012201020082006
Northeast DistrictOvernight Travel Impacts, 2006-2016p
2014 2015 2016p
Total Direct Travel Spending ($Million)Destination Spending 176 194 192 221 250 278 267 259Other Travel* 2 1 1 1 1 1 1 1 Total Direct Spending 178 195 193 222 251 278 268 260
Visitor Spending by Type of Traveler Accommodation ($Million)Hotel, Motel, Rented Room 58 65 60 78 105 131 119 106Campground 7 7 7 7 7 7 7 7Private Home (VFR) 105 114 119 128 130 133 135 139Vacation Home 6 8 7 8 8 8 7 7 Destination Spending 176 194 192 221 250 278 267 259
Visitor Spending by Commodity Purchased ($Million)Accommodations 22 25 23 28 37 47 44 38Food Service 46 50 54 62 72 81 81 82Food Stores 16 18 18 21 23 25 26 25Local Tran. & Gas 22 28 22 27 28 28 21 19Arts, Ent. & Rec. 26 28 29 31 34 36 36 37Retail Sales 44 44 47 51 56 60 59 58Visitor Air Tran. 0 0 0 0 0 0 0 0 Destination Spending 176 194 192 221 250 278 267 259
Industry Earnings Generated by Travel Spending ($Million)Accom. & Food Serv. 25 29 28 31 36 41 44 46Arts, Ent. & Rec. 14 16 14 16 16 18 19 20Retail** 8 9 9 9 10 11 11 11Ground Tran. 0 0 0 0 0 0 0 0Visitor Air Tran. 0 0 0 0 0 0 0 0Other Travel* 1 1 1 1 1 1 1 1 Total Earnings 48 54 51 57 63 70 75 77
Industry Employment Generated by Travel Spending (Jobs)Accom. & Food Serv. 1,800 1,820 1,690 1,800 2,040 2,220 2,290 2,350Arts, Ent. & Rec. 1,130 1,250 1,090 1,180 1,170 1,250 1,250 1,230Retail** 390 390 380 390 420 440 440 440Ground Tran. 10 10 10 10 10 10 10 10Visitor Air Tran. 0 0 0 0 0 0 0 0Other Travel* 30 20 20 10 10 10 10 10 Total Employment 3,360 3,500 3,190 3,390 3,640 3,920 4,000 4,040
Government Revenue Generated by Travel Spending ($Million)Local Tax Receipts 4 4 5 5 6 7 7 7State Tax Receipts 5 6 6 6 7 8 8 8 Total Gov't Revenue 9 10 10 12 13 15 15 14
Details may not add to totals due to rounding.
*Other Travel includes resident air travel and travel agencies. **Retail includes gasoline.
The Northeast District includes Logan, Morgan, Phillips, Sedgwick, Washington, Weld and Yuma counties.
PAGE 33 DEAN RUNYAN ASSOCIATES

20132012201020082006
Southeast DistrictOvernight Travel Impacts, 2006-2016p
2014 2015 2016p
Total Direct Travel Spending ($Million)Destination Spending 109 122 129 149 151 156 151 154Other Travel* 20 20 8 8 13 13 15 13 Total Direct Spending 129 142 137 158 164 169 165 167
Visitor Spending by Type of Traveler Accommodation ($Million)Hotel, Motel, Rented Room 36 44 50 66 65 67 61 62Campground 5 4 4 5 4 4 4 4Private Home (VFR) 60 63 65 69 72 74 74 77Vacation Home 8 10 9 10 11 11 11 11 Destination Spending 109 122 129 149 151 156 151 154
Visitor Spending by Commodity Purchased ($Million)Accommodations 13 16 18 22 21 22 22 23Food Service 16 17 20 25 25 26 25 26Food Stores 5 6 6 7 7 8 7 7Local Tran. & Gas 52 59 58 65 68 70 68 69Arts, Ent. & Rec. 9 10 11 12 12 12 12 12Retail Sales 14 14 16 18 18 18 17 17Visitor Air Tran. 0 0 0 0 0 0 0 0 Destination Spending 109 122 129 149 151 156 151 154
Industry Earnings Generated by Travel Spending ($Million)Accom. & Food Serv. 12 14 15 15 15 15 15 16Arts, Ent. & Rec. 4 5 6 6 6 6 6 6Retail** 3 3 4 4 4 4 4 4Ground Tran. 7 7 7 7 7 8 9 9Visitor Air Tran. 0 0 0 0 0 0 0 0Other Travel* 12 12 4 5 7 8 8 8 Total Earnings 38 41 36 37 39 41 43 44
Industry Employment Generated by Travel Spending (Jobs)Accom. & Food Serv. 780 830 860 800 770 780 780 790Arts, Ent. & Rec. 360 360 410 440 420 400 390 380Retail** 160 160 160 170 170 160 160 160Ground Tran. 240 240 210 210 220 230 240 250Visitor Air Tran. 0 0 0 0 0 0 0 0Other Travel* 290 260 110 120 140 140 140 120 Total Employment 1,840 1,860 1,760 1,740 1,720 1,720 1,700 1,710
Government Revenue Generated by Travel Spending ($Million)Local Tax Receipts 2 3 4 4 4 4 4 5State Tax Receipts 4 4 4 4 5 5 5 5 Total Gov't Revenue 6 7 8 9 9 9 9 9
Details may not add to totals due to rounding.
*Other Travel includes resident air travel and travel agencies. **Retail includes gasoline.
The Southeast District includes Baca, Bent, Cheyenne, Crowley, Elbert, Kiowa, Kit Carson, Lincoln, Otero and Prowers counties.
DEAN RUNYAN ASSOCIATESPAGE 34
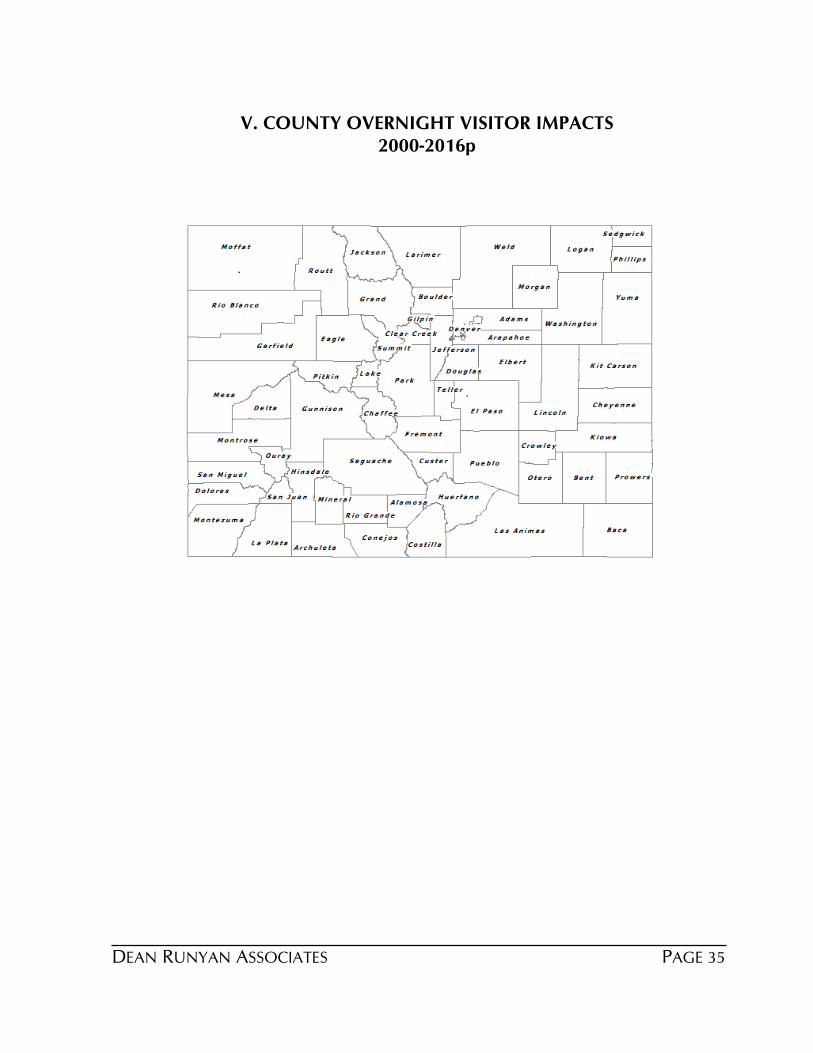
V. COUNTY OVERNIGHT VISITOR IMPACTS2000-2016p
PAGE 35 DEAN RUNYAN ASSOCIATES

2013201220102008200620042002
County Overnight Travel Impacts, 2002-2016p
2014 2015 2016p
Adams
Travel Spending ($M) 382.6 347.5 299.0 342.6 318.4 262.3 219.6 419.6 420.8 429.0
Earnings ($M) 94.2 82.3 73.7 80.5 77.9 67.4 60.1 101.0 110.0 120.1
Employment (jobs) 4,396 3,768 3,531 3,872 3,831 3,692 3,375 4,561 4,678 4,809
Local Taxes ($M) 18.0 15.4 13.4 15.2 14.0 11.9 10.4 20.8 22.7 24.0
State Taxes ($M) 12.9 11.9 11.1 12.1 11.9 10.4 9.2 14.0 14.6 15.1
Alamosa
Travel Spending ($M) 37.0 39.9 35.8 29.4 27.7 25.0 20.1 34.6 41.9 44.3
Earnings ($M) 8.5 8.8 8.3 8.0 7.5 6.8 5.8 8.5 9.5 9.8
Employment (jobs) 457 476 466 462 483 459 431 441 462 490
Local Taxes ($M) 1.2 1.3 1.2 0.9 0.8 0.8 0.7 1.1 1.4 1.8
State Taxes ($M) 1.0 1.1 1.0 0.8 0.8 0.7 0.6 0.9 1.2 1.2
Arapahoe
Travel Spending ($M) 875.2 841.5 740.3 779.3 729.2 661.0 606.4 940.5 982.9 1,011.9
Earnings ($M) 233.0 227.0 197.5 222.6 214.4 209.2 201.7 247.9 276.6 289.1
Employment (jobs) 6,557 6,386 5,902 6,457 6,052 6,203 6,360 6,854 7,174 7,261
Local Taxes ($M) 23.6 22.2 19.3 20.3 18.0 15.5 13.7 26.5 29.4 30.7
State Taxes ($M) 25.9 25.0 22.8 23.9 22.6 20.4 19.0 27.7 29.6 30.6
Archuleta
Travel Spending ($M) 47.2 45.9 40.6 36.8 37.8 34.2 29.6 52.8 54.8 59.9
Earnings ($M) 15.6 14.4 13.7 14.6 14.8 13.9 12.0 16.9 18.7 20.4
Employment (jobs) 613 561 561 611 668 623 600 622 652 708
Local Taxes ($M) 2.0 1.9 1.7 1.5 1.5 1.2 1.1 2.2 2.4 2.6
State Taxes ($M) 1.3 1.3 1.2 1.1 1.1 1.0 0.9 1.5 1.6 1.7
PAGE 36 DEAN RUNYAN ASSOCIATES

2013201220102008200620042002
County Overnight Travel Impacts, 2002-2016p
2014 2015 2016p
Baca
Travel Spending ($M) 3.0 3.1 3.1 3.2 3.0 2.3 1.8 3.1 3.1 3.0
Earnings ($M) 0.5 0.5 0.5 0.7 0.7 0.5 0.4 0.6 0.7 0.6
Employment (jobs) 29 29 30 49 52 46 41 37 40 41
Local Taxes ($M) 0.0 0.0 0.0 0.0 0.0 0.0 0.0 0.0 0.0 0.0
State Taxes ($M) 0.1 0.1 0.1 0.1 0.1 0.1 0.1 0.1 0.1 0.1
Bent
Travel Spending ($M) 3.7 3.7 3.3 3.9 3.5 3.2 2.5 3.2 2.7 2.8
Earnings ($M) 0.8 0.7 0.7 0.9 0.8 0.8 0.6 0.7 0.6 0.6
Employment (jobs) 45 45 47 66 66 62 53 38 36 40
Local Taxes ($M) 0.1 0.1 0.1 0.1 0.1 0.1 0.1 0.1 0.1 0.1
State Taxes ($M) 0.1 0.1 0.1 0.1 0.1 0.1 0.1 0.1 0.1 0.1
Boulder
Travel Spending ($M) 461.9 442.2 392.2 411.3 372.9 328.7 290.5 476.9 486.3 509.3
Earnings ($M) 139.3 133.1 120.3 134.0 117.6 108.6 99.0 145.4 155.9 165.8
Employment (jobs) 5,300 5,228 5,026 5,428 5,235 5,105 4,752 5,340 5,422 5,528
Local Taxes ($M) 20.4 19.2 15.4 15.7 14.1 10.9 9.9 21.4 22.7 25.7
State Taxes ($M) 12.6 12.0 10.9 11.3 10.5 9.2 8.4 13.0 13.6 14.3
Broomfield
Travel Spending ($M) 101.2 100.8 84.6 78.5 73.6 65.1 40.0 107.4 110.8 114.7
Earnings ($M) 26.3 25.3 23.4 26.8 24.1 21.7 13.5 27.2 29.1 30.5
Employment (jobs) 1,126 1,101 1,077 1,179 1,108 1,025 696 1,140 1,167 1,210
Local Taxes ($M) 4.4 4.4 3.6 3.4 3.2 2.5 1.6 4.7 4.9 5.1
State Taxes ($M) 2.5 2.5 2.1 2.1 1.9 1.7 1.0 2.7 2.8 2.9
DEAN RUNYAN ASSOCIATESPAGE 37

2013201220102008200620042002
County Overnight Travel Impacts, 2002-2016p
2014 2015 2016p
Chaffee
Travel Spending ($M) 75.3 71.0 56.6 56.5 50.7 50.6 47.3 82.6 82.4 92.7
Earnings ($M) 21.0 19.5 17.6 18.2 16.0 16.2 15.5 22.2 24.3 26.8
Employment (jobs) 969 948 866 908 903 987 996 983 1,000 1,047
Local Taxes ($M) 2.8 2.6 2.0 1.8 1.6 1.6 1.6 3.1 3.2 3.8
State Taxes ($M) 2.1 2.0 1.7 1.7 1.5 1.5 1.4 2.3 2.4 2.7
Cheyenne
Travel Spending ($M) 1.8 1.8 1.6 1.7 1.5 1.0 0.7 1.8 1.6 1.6
Earnings ($M) 0.4 0.4 0.6 0.3 0.3 0.2 0.2 0.4 0.4 0.5
Employment (jobs) 31 30 48 26 24 19 15 34 33 31
Local Taxes ($M) 0.0 0.0 0.0 0.0 0.0 0.0 0.0 0.0 0.0 0.0
State Taxes ($M) 0.1 0.1 0.1 0.1 0.1 0.0 0.0 0.1 0.1 0.1
Clear Creek
Travel Spending ($M) 26.2 25.1 21.5 23.3 22.2 19.9 18.6 26.4 27.5 31.0
Earnings ($M) 7.2 6.3 5.5 5.3 5.1 4.8 4.7 7.6 8.6 9.6
Employment (jobs) 370 332 303 305 300 297 321 364 408 432
Local Taxes ($M) 0.7 0.6 0.5 0.5 0.5 0.5 0.5 0.7 0.8 1.1
State Taxes ($M) 0.8 0.7 0.7 0.7 0.7 0.6 0.6 0.8 0.9 1.0
Conejos
Travel Spending ($M) 8.1 8.2 7.6 7.5 7.3 5.9 5.6 8.1 7.4 8.5
Earnings ($M) 2.1 2.2 2.1 2.5 2.5 2.1 2.0 2.2 2.2 2.5
Employment (jobs) 151 158 193 206 175 152 145 148 143 164
Local Taxes ($M) 0.1 0.1 0.1 0.1 0.1 0.1 0.1 0.1 0.1 0.2
State Taxes ($M) 0.2 0.2 0.2 0.2 0.2 0.2 0.2 0.2 0.2 0.3
PAGE 38 DEAN RUNYAN ASSOCIATES

2013201220102008200620042002
County Overnight Travel Impacts, 2002-2016p
2014 2015 2016p
Costilla
Travel Spending ($M) 4.0 4.0 3.1 3.7 3.6 3.4 3.0 3.7 4.3 3.9
Earnings ($M) 1.0 1.0 0.9 1.0 0.9 0.9 0.8 0.9 1.2 1.2
Employment (jobs) 83 90 76 83 80 82 81 80 101 95
Local Taxes ($M) 0.1 0.1 0.1 0.1 0.1 0.1 0.1 0.1 0.1 0.1
State Taxes ($M) 0.1 0.1 0.1 0.1 0.1 0.1 0.1 0.1 0.1 0.1
Crowley
Travel Spending ($M) 1.0 1.0 1.0 1.1 1.0 0.8 0.5 1.0 0.9 0.9
Earnings ($M) 0.2 0.2 0.2 0.2 0.2 0.2 0.1 0.2 0.2 0.2
Employment (jobs) 12 12 13 13 12 12 8 12 12 12
Local Taxes ($M) 0.0 0.0 0.0 0.0 0.0 0.0 0.0 0.0 0.0 0.0
State Taxes ($M) 0.0 0.0 0.0 0.0 0.0 0.0 0.0 0.0 0.0 0.0
Custer
Travel Spending ($M) 10.0 9.6 9.2 9.5 8.5 8.3 8.1 10.8 10.7 11.2
Earnings ($M) 1.6 1.7 1.9 2.3 2.0 2.0 2.0 1.7 1.8 2.0
Employment (jobs) 121 129 155 198 167 176 188 139 135 141
Local Taxes ($M) 0.2 0.2 0.2 0.2 0.2 0.2 0.2 0.3 0.3 0.3
State Taxes ($M) 0.2 0.2 0.2 0.3 0.2 0.2 0.2 0.3 0.3 0.3
Delta
Travel Spending ($M) 31.6 32.0 33.4 34.3 36.2 30.0 23.3 34.1 33.9 35.5
Earnings ($M) 9.4 9.4 9.6 10.2 10.7 9.0 7.1 10.4 11.1 12.1
Employment (jobs) 525 519 564 563 654 574 482 544 589 614
Local Taxes ($M) 0.9 0.9 0.9 1.0 1.1 0.9 0.7 0.9 1.0 1.0
State Taxes ($M) 0.8 0.8 0.9 0.9 1.0 0.8 0.7 0.9 0.9 1.0
DEAN RUNYAN ASSOCIATESPAGE 39

2013201220102008200620042002
County Overnight Travel Impacts, 2002-2016p
2014 2015 2016p
Denver
Travel Spending ($M) 5,580.2 5,245.0 4,531.2 4,651.7 4,209.8 3,484.8 3,199.3 6,135.2 6,374.8 6,508.8
Earnings ($M) 1,638.5 1,399.2 1,245.1 1,334.3 1,319.4 1,146.3 1,140.3 1,732.2 1,844.4 2,033.1
Employment (jobs) 31,483 29,814 28,335 31,151 28,801 26,697 25,292 32,531 33,279 34,572
Local Taxes ($M) 190.5 177.3 156.4 160.3 137.6 101.8 93.7 216.1 230.8 246.7
State Taxes ($M) 88.9 81.0 71.6 74.2 68.1 57.3 54.4 97.4 102.4 109.5
Dolores
Travel Spending ($M) 4.7 4.6 3.7 3.5 3.4 3.3 3.1 4.8 5.0 5.1
Earnings ($M) 0.9 0.9 0.7 0.8 0.8 0.8 0.7 0.9 1.0 1.0
Employment (jobs) 58 56 54 66 78 79 77 54 59 62
Local Taxes ($M) 0.1 0.1 0.1 0.1 0.1 0.1 0.1 0.1 0.1 0.1
State Taxes ($M) 0.1 0.1 0.1 0.1 0.1 0.1 0.1 0.1 0.1 0.1
Douglas
Travel Spending ($M) 261.1 243.2 204.0 214.3 165.8 132.3 84.5 277.1 280.4 284.4
Earnings ($M) 60.1 57.5 52.3 54.0 40.1 33.1 21.5 64.5 70.7 72.9
Employment (jobs) 2,636 2,569 2,451 2,495 1,959 1,626 1,093 2,709 2,813 2,838
Local Taxes ($M) 8.0 7.1 5.8 5.6 4.0 3.0 2.0 8.6 8.9 9.3
State Taxes ($M) 7.5 7.1 6.3 6.5 5.3 4.4 3.1 8.0 8.3 8.5
Eagle
Travel Spending ($M) 897.9 863.6 736.4 775.0 728.7 636.2 587.3 952.4 1,031.4 1,033.1
Earnings ($M) 217.3 207.8 182.4 199.9 182.7 165.3 156.7 228.8 248.2 251.5
Employment (jobs) 6,901 6,866 6,307 6,836 6,581 6,387 6,355 7,056 7,385 7,542
Local Taxes ($M) 34.7 32.9 27.5 29.1 26.8 23.1 23.8 37.1 41.2 45.1
State Taxes ($M) 22.0 21.0 17.9 19.0 17.7 15.6 14.6 23.3 25.6 25.8
PAGE 40 DEAN RUNYAN ASSOCIATES

2013201220102008200620042002
County Overnight Travel Impacts, 2002-2016p
2014 2015 2016p
El Paso
Travel Spending ($M) 1,131.6 1,138.3 1,086.2 1,138.5 1,027.2 956.7 810.1 1,189.1 1,243.2 1,330.1
Earnings ($M) 278.9 268.0 246.8 253.0 221.8 209.0 180.7 293.2 322.4 344.1
Employment (jobs) 12,418 11,905 11,139 11,916 10,996 10,944 9,466 12,736 13,351 13,971
Local Taxes ($M) 33.4 32.5 31.3 31.3 28.2 22.2 18.5 35.9 39.8 50.4
State Taxes ($M) 29.8 29.1 28.0 28.5 26.1 24.6 21.4 31.5 33.9 36.4
Elbert
Travel Spending ($M) 69.0 61.8 57.3 67.2 63.8 60.4 57.7 72.5 75.9 77.2
Earnings ($M) 15.4 12.7 12.4 19.7 19.2 19.4 19.3 16.5 18.0 17.8
Employment (jobs) 399 370 371 546 572 609 696 410 414 416
Local Taxes ($M) 1.8 1.7 1.6 1.5 0.9 0.8 0.6 1.9 1.9 2.0
State Taxes ($M) 1.7 1.5 1.5 1.6 1.5 1.3 1.3 1.8 1.8 1.9
Fremont
Travel Spending ($M) 58.8 57.6 55.4 57.1 55.1 46.5 40.6 58.7 64.2 65.6
Earnings ($M) 14.0 14.9 15.0 15.4 14.6 12.6 11.4 14.1 16.3 16.6
Employment (jobs) 805 877 915 956 1,010 894 842 777 855 836
Local Taxes ($M) 1.4 1.3 1.3 1.4 1.3 1.1 1.0 1.4 1.7 2.5
State Taxes ($M) 1.7 1.7 1.7 1.7 1.7 1.4 1.3 1.7 1.9 1.9
Garfield
Travel Spending ($M) 144.1 143.9 121.2 145.0 125.5 97.0 85.6 157.1 163.2 168.2
Earnings ($M) 40.9 38.9 36.1 43.5 36.8 29.5 26.8 45.2 49.0 52.2
Employment (jobs) 1,581 1,514 1,431 1,654 1,588 1,412 1,367 1,699 1,743 1,803
Local Taxes ($M) 6.1 6.0 5.1 5.8 5.1 3.6 3.3 6.8 7.3 7.8
State Taxes ($M) 4.3 4.3 3.8 4.4 4.0 3.2 2.9 4.7 5.0 5.2
DEAN RUNYAN ASSOCIATESPAGE 41

2013201220102008200620042002
County Overnight Travel Impacts, 2002-2016p
2014 2015 2016p
Gilpin
Travel Spending ($M) 132.3 124.3 109.5 121.0 129.1 133.1 140.6 133.6 132.9 132.7
Earnings ($M) 47.3 49.2 50.6 45.9 45.3 45.7 50.3 48.2 51.9 53.3
Employment (jobs) 1,669 1,687 1,655 1,531 1,573 1,569 1,766 1,697 1,710 1,753
Local Taxes ($M) 1.0 1.0 0.9 0.8 0.8 0.8 0.9 1.1 1.1 1.2
State Taxes ($M) 1.6 1.6 1.6 1.5 1.6 1.6 1.7 1.7 1.7 1.8
Grand
Travel Spending ($M) 231.3 223.0 179.5 200.0 195.2 165.8 158.8 269.8 288.6 310.5
Earnings ($M) 70.3 64.0 59.4 63.1 60.3 52.6 51.5 81.3 91.6 99.7
Employment (jobs) 2,661 2,543 2,367 2,564 2,556 2,402 2,621 2,928 3,091 3,272
Local Taxes ($M) 7.8 7.4 5.9 6.7 6.6 5.7 5.6 9.2 11.4 13.6
State Taxes ($M) 5.8 5.5 4.6 5.1 5.0 4.3 4.2 6.7 7.3 7.9
Gunnison
Travel Spending ($M) 156.5 149.9 136.2 136.4 138.5 120.3 83.2 174.6 182.4 195.8
Earnings ($M) 39.8 38.0 35.0 39.4 38.2 34.4 22.2 47.4 52.1 56.1
Employment (jobs) 1,933 1,867 1,793 2,036 2,172 2,068 1,453 2,144 2,246 2,334
Local Taxes ($M) 5.7 5.5 5.0 4.9 4.7 4.1 2.4 6.6 7.0 7.9
State Taxes ($M) 3.5 3.3 3.0 3.1 3.1 2.7 1.8 4.0 4.2 4.6
Hinsdale
Travel Spending ($M) 11.4 11.5 10.5 10.1 10.5 9.5 9.5 14.3 11.9 13.8
Earnings ($M) 6.9 7.6 5.2 5.5 5.6 5.2 5.3 8.5 7.5 8.8
Employment (jobs) 449 444 286 298 335 319 381 502 411 441
Local Taxes ($M) 0.5 0.5 0.4 0.4 0.4 0.4 0.3 0.6 0.5 0.6
State Taxes ($M) 0.3 0.3 0.3 0.3 0.3 0.3 0.3 0.4 0.3 0.4
PAGE 42 DEAN RUNYAN ASSOCIATES

2013201220102008200620042002
County Overnight Travel Impacts, 2002-2016p
2014 2015 2016p
Huerfano
Travel Spending ($M) 12.4 12.5 11.4 11.9 9.6 8.8 8.1 12.0 13.0 12.7
Earnings ($M) 3.0 3.0 3.2 3.8 3.0 2.9 2.9 2.7 3.0 3.2
Employment (jobs) 166 166 184 215 173 164 175 152 167 172
Local Taxes ($M) 0.4 0.4 0.4 0.3 0.2 0.2 0.2 0.4 0.5 0.5
State Taxes ($M) 0.4 0.4 0.4 0.4 0.3 0.3 0.3 0.4 0.4 0.4
Jackson
Travel Spending ($M) 4.6 4.1 3.9 3.8 3.4 3.1 3.2 6.0 5.4 7.8
Earnings ($M) 2.7 2.4 2.3 2.3 2.1 1.9 2.0 3.1 3.0 4.3
Employment (jobs) 107 99 98 94 95 94 102 119 102 137
Local Taxes ($M) 0.2 0.1 0.1 0.1 0.1 0.1 0.1 0.3 0.2 0.3
State Taxes ($M) 0.1 0.1 0.1 0.1 0.1 0.1 0.1 0.2 0.1 0.2
Jefferson
Travel Spending ($M) 550.7 508.8 447.6 515.0 465.8 390.2 397.3 578.2 578.9 583.2
Earnings ($M) 142.7 134.0 124.3 133.9 121.2 108.7 121.1 154.5 166.7 174.6
Employment (jobs) 5,321 5,007 4,927 5,397 5,168 4,978 5,788 5,593 5,785 5,912
Local Taxes ($M) 16.5 14.6 12.9 14.6 13.5 10.3 12.6 18.1 19.7 20.2
State Taxes ($M) 18.1 16.9 15.9 17.5 16.8 14.7 15.1 19.0 19.8 20.2
Kiowa
Travel Spending ($M) 1.0 0.9 0.8 0.9 0.9 0.8 0.7 1.0 1.0 1.0
Earnings ($M) 0.3 0.3 0.3 0.3 0.3 0.3 0.2 0.3 0.3 0.3
Employment (jobs) 18 20 20 20 21 22 19 18 17 16
Local Taxes ($M) 0.0 0.0 0.0 0.0 0.0 0.0 0.0 0.0 0.0 0.0
State Taxes ($M) 0.0 0.0 0.0 0.0 0.0 0.0 0.0 0.0 0.0 0.0
DEAN RUNYAN ASSOCIATESPAGE 43

2013201220102008200620042002
County Overnight Travel Impacts, 2002-2016p
2014 2015 2016p
Kit Carson
Travel Spending ($M) 17.8 16.7 13.8 13.0 10.7 12.5 11.2 18.5 17.7 17.1
Earnings ($M) 5.5 5.3 4.6 4.4 3.5 4.6 4.3 5.6 5.7 6.1
Employment (jobs) 244 244 216 215 189 261 261 244 244 250
Local Taxes ($M) 0.4 0.4 0.3 0.3 0.2 0.2 0.2 0.5 0.5 0.4
State Taxes ($M) 0.6 0.5 0.5 0.4 0.4 0.4 0.4 0.6 0.6 0.6
La Plata
Travel Spending ($M) 252.7 249.0 218.2 229.1 211.8 189.5 152.0 273.1 283.0 296.6
Earnings ($M) 72.9 68.5 63.3 70.2 64.4 61.6 54.2 76.7 79.4 84.1
Employment (jobs) 2,827 2,746 2,594 2,838 2,906 2,947 2,742 2,906 2,937 3,054
Local Taxes ($M) 7.2 7.0 6.3 6.6 6.2 5.3 4.5 7.8 8.2 9.2
State Taxes ($M) 5.5 5.4 5.0 5.3 5.1 4.7 4.0 5.9 6.1 6.5
Lake
Travel Spending ($M) 29.1 30.5 27.4 28.8 25.1 21.9 21.8 29.5 29.9 34.4
Earnings ($M) 8.7 8.8 8.3 9.5 7.9 7.0 7.2 9.4 9.8 10.8
Employment (jobs) 349 357 337 393 372 351 405 355 353 389
Local Taxes ($M) 0.7 0.8 0.7 0.7 0.6 0.5 0.6 0.8 0.8 0.9
State Taxes ($M) 0.8 0.8 0.8 0.8 0.7 0.6 0.6 0.8 0.8 1.0
Larimer
Travel Spending ($M) 536.9 515.3 432.6 448.7 436.7 365.3 310.4 595.9 621.6 611.5
Earnings ($M) 151.4 142.5 125.5 124.5 118.2 100.9 88.2 164.2 179.6 184.3
Employment (jobs) 7,316 7,184 6,752 6,933 6,836 6,496 5,847 7,723 8,288 8,162
Local Taxes ($M) 15.8 15.0 11.7 11.8 11.8 9.6 8.5 18.0 19.3 20.5
State Taxes ($M) 14.8 14.1 12.2 12.4 12.3 10.3 9.1 16.4 17.4 17.3
PAGE 44 DEAN RUNYAN ASSOCIATES

2013201220102008200620042002
County Overnight Travel Impacts, 2002-2016p
2014 2015 2016p
Las Animas
Travel Spending ($M) 36.1 35.2 33.4 35.8 27.7 17.9 15.2 35.9 35.4 35.4
Earnings ($M) 11.3 11.0 11.8 12.9 9.6 6.3 5.6 11.0 11.8 12.6
Employment (jobs) 615 611 673 770 632 432 390 580 576 586
Local Taxes ($M) 0.9 0.9 0.9 0.9 0.7 0.5 0.4 0.9 0.9 0.9
State Taxes ($M) 1.1 1.0 1.0 1.1 0.9 0.6 0.5 1.1 1.1 1.1
Lincoln
Travel Spending ($M) 27.3 28.4 22.8 19.0 16.6 12.1 10.5 29.6 25.6 26.1
Earnings ($M) 2.4 2.8 4.6 3.4 3.1 2.4 2.3 2.6 2.7 2.9
Employment (jobs) 124 153 270 213 209 171 181 132 130 131
Local Taxes ($M) 0.7 0.7 0.6 0.3 0.3 0.2 0.2 0.8 0.7 0.8
State Taxes ($M) 0.9 0.9 0.9 0.7 0.7 0.6 0.5 0.9 0.9 0.9
Logan
Travel Spending ($M) 26.3 24.3 21.7 21.7 20.5 18.6 17.2 30.9 28.4 23.1
Earnings ($M) 7.8 6.7 6.4 6.9 6.3 6.0 5.7 8.9 9.1 8.0
Employment (jobs) 424 374 349 383 403 402 375 464 449 406
Local Taxes ($M) 0.9 0.8 0.6 0.6 0.5 0.5 0.5 1.1 1.0 0.8
State Taxes ($M) 0.8 0.7 0.6 0.6 0.6 0.6 0.5 0.9 0.8 0.7
Mesa
Travel Spending ($M) 269.1 266.5 240.0 272.8 223.8 180.4 133.2 275.2 281.0 282.3
Earnings ($M) 60.8 57.8 57.2 64.7 53.0 43.9 39.1 63.9 67.7 70.3
Employment (jobs) 2,994 2,900 2,909 3,340 3,029 2,701 2,481 3,016 3,050 3,105
Local Taxes ($M) 8.0 7.9 7.4 8.6 6.7 5.4 4.7 8.2 8.7 8.8
State Taxes ($M) 6.0 5.9 5.6 6.4 5.5 4.5 4.0 6.1 6.4 6.5
DEAN RUNYAN ASSOCIATESPAGE 45

2013201220102008200620042002
County Overnight Travel Impacts, 2002-2016p
2014 2015 2016p
Mineral
Travel Spending ($M) 12.7 13.8 13.7 12.6 12.4 11.8 12.2 14.3 14.3 15.0
Earnings ($M) 4.3 4.5 4.3 4.1 3.9 3.7 3.9 4.9 4.8 5.3
Employment (jobs) 268 294 296 290 286 288 317 303 309 314
Local Taxes ($M) 0.4 0.5 0.5 0.4 0.4 0.4 0.4 0.5 0.5 0.5
State Taxes ($M) 0.3 0.3 0.3 0.3 0.3 0.3 0.3 0.4 0.4 0.4
Moffat
Travel Spending ($M) 34.0 37.0 26.1 34.5 31.4 22.4 16.7 28.6 30.5 32.9
Earnings ($M) 8.6 8.8 7.7 8.6 7.6 5.4 4.0 7.6 7.8 8.0
Employment (jobs) 520 534 499 595 582 439 347 455 475 472
Local Taxes ($M) 1.1 1.2 0.8 1.1 1.0 0.7 0.5 0.9 1.0 1.1
State Taxes ($M) 0.9 1.0 0.7 1.0 0.9 0.6 0.5 0.8 0.8 0.9
Montezuma
Travel Spending ($M) 84.4 77.0 70.0 75.8 72.4 62.9 54.2 85.0 86.8 87.7
Earnings ($M) 18.9 17.7 17.0 18.3 17.1 14.9 13.3 19.3 20.4 21.3
Employment (jobs) 1,008 971 986 1,089 1,137 1,038 965 1,003 1,034 1,045
Local Taxes ($M) 2.4 2.2 2.1 2.3 2.2 1.9 1.8 2.5 2.7 2.7
State Taxes ($M) 2.2 2.0 1.9 2.0 2.0 1.7 1.5 2.3 2.4 2.4
Montrose
Travel Spending ($M) 109.9 103.8 103.1 98.9 91.9 76.8 59.9 115.4 122.3 127.7
Earnings ($M) 19.2 18.2 18.2 20.0 18.8 16.4 14.6 19.9 21.5 23.4
Employment (jobs) 844 796 777 925 1,144 1,112 999 864 901 944
Local Taxes ($M) 2.2 2.2 2.2 2.1 1.6 1.5 1.1 2.3 2.5 2.7
State Taxes ($M) 2.4 2.3 2.4 2.3 2.2 1.9 1.7 2.5 2.6 2.7
PAGE 46 DEAN RUNYAN ASSOCIATES

2013201220102008200620042002
County Overnight Travel Impacts, 2002-2016p
2014 2015 2016p
Morgan
Travel Spending ($M) 26.4 24.2 20.1 24.9 22.8 22.0 16.6 34.1 31.8 30.0
Earnings ($M) 7.2 6.6 6.1 6.5 5.9 6.2 4.8 9.0 9.3 9.4
Employment (jobs) 479 460 451 482 453 494 381 560 569 555
Local Taxes ($M) 0.6 0.5 0.4 0.5 0.5 0.5 0.4 0.9 0.9 0.8
State Taxes ($M) 0.9 0.8 0.7 0.8 0.8 0.8 0.7 1.1 1.1 1.0
Otero
Travel Spending ($M) 19.8 19.5 18.0 16.9 15.0 14.2 10.7 20.2 18.2 18.2
Earnings ($M) 4.9 4.7 4.9 4.8 4.1 4.1 3.2 5.0 5.0 5.1
Employment (jobs) 265 267 309 305 279 287 222 263 255 252
Local Taxes ($M) 0.4 0.4 0.4 0.4 0.3 0.3 0.3 0.5 0.4 0.4
State Taxes ($M) 0.6 0.6 0.5 0.5 0.5 0.4 0.4 0.6 0.5 0.5
Ouray
Travel Spending ($M) 33.3 32.3 28.3 27.8 22.1 22.1 20.9 33.8 37.9 42.7
Earnings ($M) 9.9 9.4 8.8 10.0 7.7 8.0 7.6 10.4 11.2 12.7
Employment (jobs) 459 430 424 461 378 403 440 464 483 537
Local Taxes ($M) 1.6 1.5 1.4 1.1 0.9 0.8 0.8 1.6 1.9 2.3
State Taxes ($M) 0.9 0.9 0.8 0.8 0.7 0.7 0.6 1.0 1.1 1.2
Park
Travel Spending ($M) 21.9 21.6 19.8 19.6 17.6 15.7 14.9 23.7 23.8 24.3
Earnings ($M) 6.0 6.1 6.1 7.2 6.4 5.9 5.8 6.6 7.0 7.2
Employment (jobs) 406 406 488 518 500 472 432 446 447 464
Local Taxes ($M) 0.6 0.6 0.5 0.5 0.5 0.4 0.4 0.7 0.7 0.7
State Taxes ($M) 0.6 0.6 0.6 0.6 0.5 0.5 0.4 0.6 0.7 0.7
DEAN RUNYAN ASSOCIATESPAGE 47

2013201220102008200620042002
County Overnight Travel Impacts, 2002-2016p
2014 2015 2016p
Phillips
Travel Spending ($M) 4.5 4.4 3.9 4.4 3.9 3.2 2.3 4.5 5.6 5.4
Earnings ($M) 0.9 0.8 0.8 0.7 0.7 0.6 0.5 0.9 1.2 1.3
Employment (jobs) 54 53 52 59 60 60 47 56 73 72
Local Taxes ($M) 0.0 0.0 0.0 0.0 0.0 0.0 0.0 0.0 0.1 0.1
State Taxes ($M) 0.2 0.2 0.2 0.2 0.2 0.2 0.1 0.2 0.2 0.2
Pitkin
Travel Spending ($M) 619.5 584.9 586.6 552.7 517.7 428.6 392.0 667.9 713.9 703.0
Earnings ($M) 225.9 206.9 193.4 193.6 176.6 149.5 139.2 239.5 259.4 261.5
Employment (jobs) 4,495 4,301 4,190 4,210 4,227 3,906 3,923 4,557 4,604 4,626
Local Taxes ($M) 26.4 24.8 24.0 21.3 19.8 16.0 13.0 28.9 31.3 33.8
State Taxes ($M) 14.5 13.6 13.6 13.0 12.1 10.0 9.2 15.7 16.9 16.7
Prowers
Travel Spending ($M) 19.2 20.9 15.1 14.8 13.2 13.5 12.2 18.2 18.2 19.2
Earnings ($M) 8.5 9.2 7.0 6.6 5.6 5.8 5.3 8.5 8.9 9.4
Employment (jobs) 552 571 437 406 412 412 374 528 517 517
Local Taxes ($M) 0.7 0.7 0.5 0.5 0.4 0.4 0.3 0.6 0.6 0.6
State Taxes ($M) 0.5 0.5 0.4 0.4 0.3 0.3 0.3 0.5 0.5 0.5
Pueblo
Travel Spending ($M) 150.6 149.3 138.3 134.7 119.2 113.5 92.3 162.2 167.9 169.3
Earnings ($M) 49.8 49.8 46.5 46.1 40.1 39.7 33.0 53.9 60.1 62.6
Employment (jobs) 2,016 1,994 1,990 2,057 2,007 2,076 1,852 2,057 2,145 2,283
Local Taxes ($M) 4.5 4.5 4.3 4.0 3.5 3.4 3.0 5.1 5.6 5.8
State Taxes ($M) 4.3 4.3 4.1 4.0 3.7 3.5 3.1 4.7 5.0 5.1
PAGE 48 DEAN RUNYAN ASSOCIATES

2013201220102008200620042002
County Overnight Travel Impacts, 2002-2016p
2014 2015 2016p
Rio Blanco
Travel Spending ($M) 15.7 14.5 13.7 17.0 12.3 14.1 10.0 14.5 12.6 12.1
Earnings ($M) 6.9 6.6 7.2 7.7 5.3 6.4 4.4 6.2 5.8 5.7
Employment (jobs) 230 225 220 261 213 284 203 207 183 189
Local Taxes ($M) 0.4 0.4 0.4 0.5 0.3 0.4 0.3 0.4 0.4 0.3
State Taxes ($M) 0.4 0.4 0.4 0.5 0.3 0.4 0.3 0.4 0.4 0.3
Rio Grande
Travel Spending ($M) 18.4 22.2 18.3 17.8 17.4 16.5 14.3 20.6 20.2 22.1
Earnings ($M) 6.9 6.9 6.3 6.4 6.3 6.3 5.6 8.1 8.8 9.2
Employment (jobs) 395 368 361 399 408 453 401 465 460 496
Local Taxes ($M) 0.7 0.8 0.7 0.6 0.6 0.6 0.6 0.8 0.8 0.9
State Taxes ($M) 0.6 0.7 0.6 0.6 0.6 0.5 0.5 0.7 0.7 0.7
Routt
Travel Spending ($M) 316.3 294.8 273.2 322.7 296.6 249.9 234.6 342.6 357.2 387.2
Earnings ($M) 140.4 134.2 119.7 124.2 110.9 95.8 93.3 153.1 165.7 178.5
Employment (jobs) 3,632 3,598 3,295 3,413 3,416 3,119 3,268 3,807 3,890 4,103
Local Taxes ($M) 11.1 10.2 9.5 11.6 10.6 9.0 8.6 12.2 13.0 14.3
State Taxes ($M) 7.6 7.1 6.6 7.6 7.0 5.9 5.7 8.3 8.8 9.6
Saguache
Travel Spending ($M) 6.9 6.8 6.0 5.6 5.3 4.9 4.2 8.0 7.7 8.9
Earnings ($M) 1.8 1.7 1.7 1.5 1.4 1.3 1.1 2.2 2.2 2.5
Employment (jobs) 122 118 124 118 109 90 84 160 148 163
Local Taxes ($M) 0.1 0.1 0.1 0.1 0.1 0.1 0.1 0.2 0.2 0.2
State Taxes ($M) 0.2 0.2 0.2 0.2 0.1 0.1 0.1 0.2 0.2 0.2
DEAN RUNYAN ASSOCIATESPAGE 49
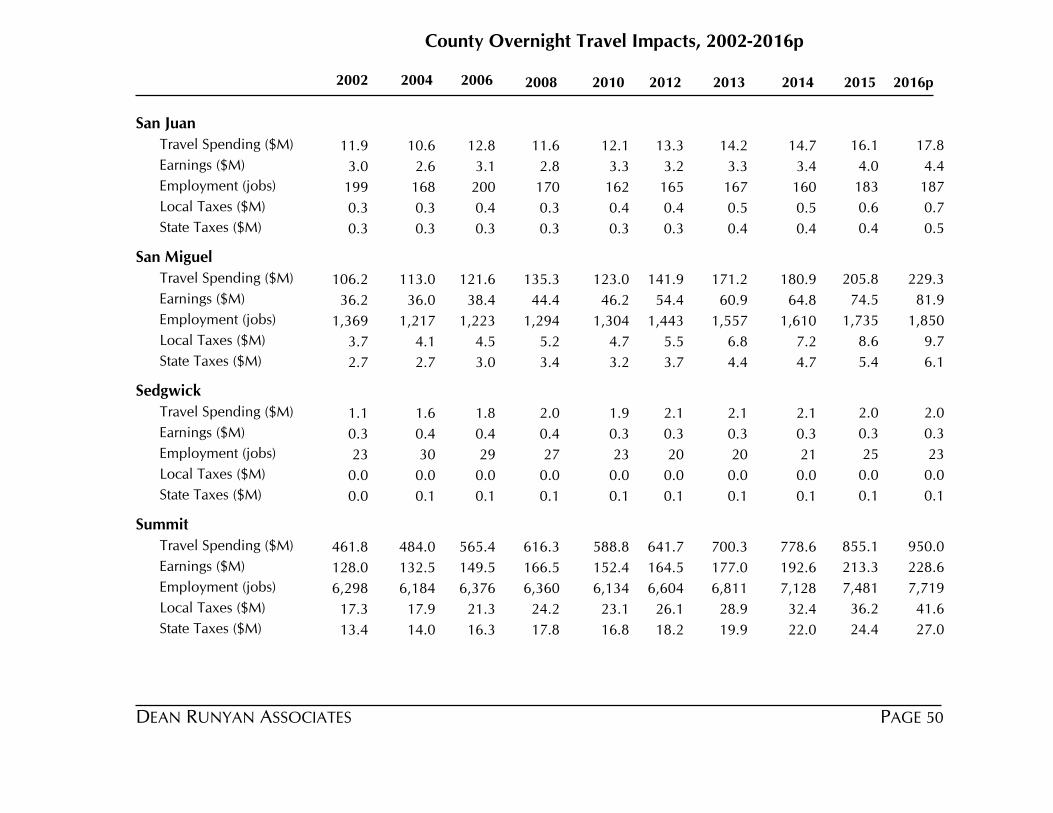
2013201220102008200620042002
County Overnight Travel Impacts, 2002-2016p
2014 2015 2016p
San Juan
Travel Spending ($M) 14.2 13.3 12.1 11.6 12.8 10.6 11.9 14.7 16.1 17.8
Earnings ($M) 3.3 3.2 3.3 2.8 3.1 2.6 3.0 3.4 4.0 4.4
Employment (jobs) 167 165 162 170 200 168 199 160 183 187
Local Taxes ($M) 0.5 0.4 0.4 0.3 0.4 0.3 0.3 0.5 0.6 0.7
State Taxes ($M) 0.4 0.3 0.3 0.3 0.3 0.3 0.3 0.4 0.4 0.5
San Miguel
Travel Spending ($M) 171.2 141.9 123.0 135.3 121.6 113.0 106.2 180.9 205.8 229.3
Earnings ($M) 60.9 54.4 46.2 44.4 38.4 36.0 36.2 64.8 74.5 81.9
Employment (jobs) 1,557 1,443 1,304 1,294 1,223 1,217 1,369 1,610 1,735 1,850
Local Taxes ($M) 6.8 5.5 4.7 5.2 4.5 4.1 3.7 7.2 8.6 9.7
State Taxes ($M) 4.4 3.7 3.2 3.4 3.0 2.7 2.7 4.7 5.4 6.1
Sedgwick
Travel Spending ($M) 2.1 2.1 1.9 2.0 1.8 1.6 1.1 2.1 2.0 2.0
Earnings ($M) 0.3 0.3 0.3 0.4 0.4 0.4 0.3 0.3 0.3 0.3
Employment (jobs) 20 20 23 27 29 30 23 21 25 23
Local Taxes ($M) 0.0 0.0 0.0 0.0 0.0 0.0 0.0 0.0 0.0 0.0
State Taxes ($M) 0.1 0.1 0.1 0.1 0.1 0.1 0.0 0.1 0.1 0.1
Summit
Travel Spending ($M) 700.3 641.7 588.8 616.3 565.4 484.0 461.8 778.6 855.1 950.0
Earnings ($M) 177.0 164.5 152.4 166.5 149.5 132.5 128.0 192.6 213.3 228.6
Employment (jobs) 6,811 6,604 6,134 6,360 6,376 6,184 6,298 7,128 7,481 7,719
Local Taxes ($M) 28.9 26.1 23.1 24.2 21.3 17.9 17.3 32.4 36.2 41.6
State Taxes ($M) 19.9 18.2 16.8 17.8 16.3 14.0 13.4 22.0 24.4 27.0
PAGE 50 DEAN RUNYAN ASSOCIATES
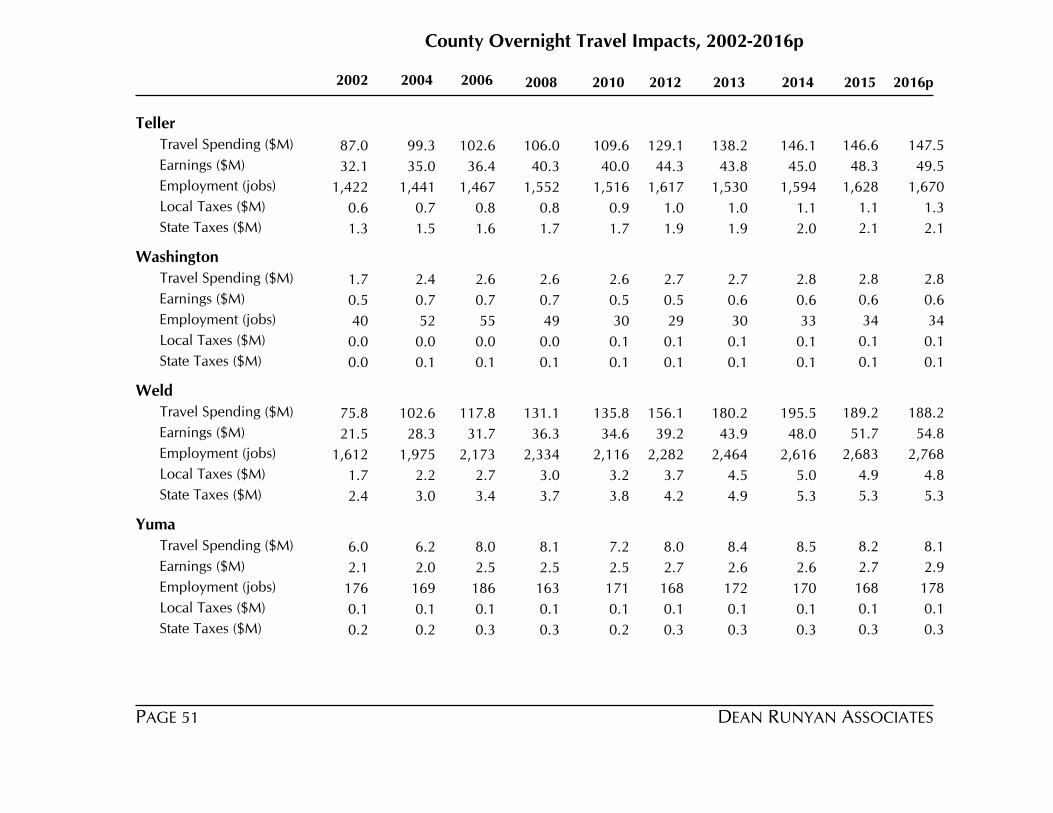
2013201220102008200620042002
County Overnight Travel Impacts, 2002-2016p
2014 2015 2016p
Teller
Travel Spending ($M) 138.2 129.1 109.6 106.0 102.6 99.3 87.0 146.1 146.6 147.5
Earnings ($M) 43.8 44.3 40.0 40.3 36.4 35.0 32.1 45.0 48.3 49.5
Employment (jobs) 1,530 1,617 1,516 1,552 1,467 1,441 1,422 1,594 1,628 1,670
Local Taxes ($M) 1.0 1.0 0.9 0.8 0.8 0.7 0.6 1.1 1.1 1.3
State Taxes ($M) 1.9 1.9 1.7 1.7 1.6 1.5 1.3 2.0 2.1 2.1
Washington
Travel Spending ($M) 2.7 2.7 2.6 2.6 2.6 2.4 1.7 2.8 2.8 2.8
Earnings ($M) 0.6 0.5 0.5 0.7 0.7 0.7 0.5 0.6 0.6 0.6
Employment (jobs) 30 29 30 49 55 52 40 33 34 34
Local Taxes ($M) 0.1 0.1 0.1 0.0 0.0 0.0 0.0 0.1 0.1 0.1
State Taxes ($M) 0.1 0.1 0.1 0.1 0.1 0.1 0.0 0.1 0.1 0.1
Weld
Travel Spending ($M) 180.2 156.1 135.8 131.1 117.8 102.6 75.8 195.5 189.2 188.2
Earnings ($M) 43.9 39.2 34.6 36.3 31.7 28.3 21.5 48.0 51.7 54.8
Employment (jobs) 2,464 2,282 2,116 2,334 2,173 1,975 1,612 2,616 2,683 2,768
Local Taxes ($M) 4.5 3.7 3.2 3.0 2.7 2.2 1.7 5.0 4.9 4.8
State Taxes ($M) 4.9 4.2 3.8 3.7 3.4 3.0 2.4 5.3 5.3 5.3
Yuma
Travel Spending ($M) 8.4 8.0 7.2 8.1 8.0 6.2 6.0 8.5 8.2 8.1
Earnings ($M) 2.6 2.7 2.5 2.5 2.5 2.0 2.1 2.6 2.7 2.9
Employment (jobs) 172 168 171 163 186 169 176 170 168 178
Local Taxes ($M) 0.1 0.1 0.1 0.1 0.1 0.1 0.1 0.1 0.1 0.1
State Taxes ($M) 0.3 0.3 0.2 0.3 0.3 0.2 0.2 0.3 0.3 0.3
DEAN RUNYAN ASSOCIATESPAGE 51

APPENDICES Appendix A. Regional Travel Impact Model
Appendix B. Definition of Terms Appendix C. NAICS Industries
DEAN RUNYAN ASSOCIATESPAGE 52

APPENDIX A
Regional Travel Impact Model This appendix provides a brief overview of methodology, terminology and limitations of the Regional Travel Impact Model.
Direct Impacts The estimates of the direct impacts associated with traveler spending in Colorado were produced using the Regional Travel Impact Model (RTIM) developed by Dean Runyan Associates. The input data used to detail the economic impacts of the Colorado travel industry were gathered from various local, state and federal sources.
Travel impacts consist of estimates of travel spending and the employment, earnings and tax receipts generated by this spending. These estimates are also broken out by type of traveler accommodation and by the type of business in which the expenditures occur.
Types of Travel Impacts Included Most of the travel that occurs in Colorado is included in the scope of this analysis. The purpose of such travel can be for business, pleasure, shopping, to attend meetings, or for personal, medical or educational purposes. All trips to Colorado by U.S. residents and foreign visitors are included. The travel of Colorado residents to other destinations within Colorado is included, provided that it is neither commuting nor other routine travel. Travel to non-Colorado destinations by Colorado residents is not included as a component of visitor spending. Outbound air travel impacts and spending on travel arrangement services are included in the “Other Travel” category.
The impacts associated with both overnight and day travel are included if the travelers remain at the destination overnight or the destination is over 50 miles, one-way, from the traveler's home. These definitions are used to screen and, if necessary, to interpret and adjust local data used for travel impact measurements.
Transportation Impacts The focus of this analysis is on the destination-specific impacts of visitors. This is straightforward with respect to the spending on commodities such as accommodations, food services, recreation and retail purchases. It is less obvious with respect to ground and air transportation services, in that transportation provides a link between an origin and destination. In this report, the impacts related to spending on transportation are allocated to the location (i.e., county) in which those spending impacts occur, regardless of whether that location is the ultimate destination of the visitor. For this reason, urban counties will tend to have relatively greater transportation impacts even though some of that spending on transportation will be related to visits at other destinations.
PAGE 53 DEAN RUNYAN ASSOCIATES

Impact Categories The specific categories of travel impacts included in this analysis are as follows:
Impact Category
Description
Expenditures Purchases by travelers during their trip, including lodging taxes and other applicable local and state taxes, paid by the traveler at the point of sale.
Earnings The earnings (wage and salary disbursements, earned benefits and proprietor income) of employees and owners of businesses that receive travel expenditures. Only the earnings attributable to travel expenditures are included; this typically is only a portion of all business receipts.
Employment Employment associated with the above earnings; this includes both full- and part-time positions of wage and salary workers and proprietors.
Local Tax Receipts
Tax receipts collected by counties and municipalities, as levied on applicable travel-related purchases, including lodging, food and beverage service, retail goods and motor fuel taxes. The local share of the state sales tax is also included in this category. Property taxes are not included.
State Tax Receipts
The state share of the state sales tax, state lodging and motor fuel taxes, auto rental taxes, modified business taxes, entertainment taxes and gaming taxes are included in state tax receipts.
DEAN RUNYAN ASSOCIATESPAGE 54

Visitor Categories Travelers are classified according to the type of accommodation in which they stay. The types of visitors are as follows:
Type of Visitor Description
Hotel, Motel, B&B
Travelers staying in hotels, motels, resorts, bed & breakfast establishments, and other commercial accommodations, excluding campgrounds, where a transient lodging tax is collected.
Campground Travelers staying in a privately owned (i.e., commercial) or publicly managed campgrounds.
Private Home Travelers staying as guests with friends or relatives.
Vacation Home Travelers using their own vacation home or timeshare and those borrowing or renting a vacation home where a transient lodging tax is not collected.
Day Travel
Both in-state and out-of-state residents whose trip does not include an overnight stay at a destination in Colorado.
PAGE 55 DEAN RUNYAN ASSOCIATES
Reporting Format A description of the headings and categories of the detailed direct impact tables is provided below.
· Total Direct Travel Spending includes the total visitor spending at destination, described above, plus spending on travel agencies and resident air travel (other spending). Total direct travel spending does not include secondary (indirect and induced) effects.
· Visitor Spending by Type of Traveler Accommodation refers to the total direct spending of each category of visitor at that destination (county or state). For example, the spending of visitors that stayed at hotels or motels includes their spending on accommodations, food & beverage service, recreation, transportation and all other visitor related commodities.
· Visitor Spending by Commodity Purchased refers to the total spending on each commodity for all types of visitors. For example, the total spending on Food & Beverage Services includes spending by visitors staying in hotels, private campgrounds, private homes and the other types of accommodation. The total spending on commodities is identical to the total spending by type of accommodation.
The next two sections, Travel-Generated Earnings and Employment by Industry, provide estimates of travel-generated earnings and employment that are based on an industry, rather than a commodity, classification. A business that is classified in a particular industry may include more than one commodity. For example, a resort that is classified in the accommodation industry may provide accommodations, food and beverages, and recreation.
· Industry Earnings Generated by Travel Spending includes the payroll, other earned benefits and proprietor income of all employees in that industry classification.
· Industry Employment Generated by Travel Spending includes all full- and part-time employees. This includes payroll employees covered by unemployment insurance and those that are not, as well as proprietors.
The final section provides an estimate of tax receipts generated by travel spending.
· Tax Revenues Generated by Travel Spending provides a breakout of local and state a tax receipts. The specific taxes are listed on the preceding page.
DEAN RUNYAN ASSOCIATESPAGE 56
Interpretation of Impact estimates Users of this report should be aware of several issues regarding the interpretation of the impact estimates contained herein.
· The employment estimates in this report are estimates of the total number of full- and part-time jobs directly generated by travel spending, rather than the number of individuals employed. Both payroll jobs and self-employment are included in these estimates. Caution should therefore be used in comparing these estimates with other employment data series.
· In general, estimates of small geographic areas (e.g., rural counties) are less reliable than estimates for regions or metropolitan counties. Trend analysis and comparisons of counties with relatively low levels of travel-related economic activity should therefore be interpreted cautiously.
· The estimates of travel impacts published in this report will necessarily differ somewhat from estimates generated from different models, methodologies and data sources. Nonetheless, it should be emphasized that all credible estimates of direct travel impacts at the state level, including those of Dean Runyan Associates, are of similar magnitude.
PAGE 57 DEAN RUNYAN ASSOCIATES

APPENDIX B
DEFINITION OF TERMS
Accommodation: Spending for lodging by hotel and motel guests, campers and vacation home users.
Air Transportation: Air passenger spending attributable to travelers in and to Colorado. The spending total includes air travel spending made outside Colorado for travel to Colorado, purchases by Colorado residents who travel outside the state, and air travel within the state.
Campers: Travelers staying at RV parks and commercial campgrounds or at public campgrounds such as those in State or National Parks.
Day Visitor: A traveler whose trip does not include an overnight stay and who travels out of his/her local area (50+ miles one way).
Destination Spending: Spending by travelers at or near their destinations. This excludes spending on air transportation and for travel arrangement. All automobile operating expenses are included in the ground transportation component of destination spending.
Earnings: Total earnings include wage and salary disbursements, other earned benefits and proprietor income. Only the earnings attributable to travel expenditures are included.
Eating, Drinking: Businesses serving food and beverages for immediate consumption. In addition to table service restaurants, this category includes fast-food outlets and refreshment stands.
Employment: Industry employment (jobs) associated with the travel-generated payroll and proprietors. This includes both full- and part-time positions.
Expenditures: Purchases by travelers during their trip, including lodging taxes and other applicable local and state taxes paid by the traveler at the point of sale.
Food Stores: Grocery stores, supermarkets, fruit stands, retail bakeries, and other businesses selling food for consumption off the premises.
Ground Transport: Spending on car rentals, gasoline and other vehicle operating expenses, and on local transportation such as taxi, bus and train.
DEAN RUNYAN ASSOCIATESPAGE 58

Hotel and Motel Guests: Travelers staying in hotels, motels, resorts, bed & breakfast establishments, condominiums, and other lodging places where the transient lodging tax is collected.
Local Tax Receipts: Tax revenue collected by counties and municipalities, as levied on applicable travel-related businesses (includes the transient lodging and local sales taxes).
Private Home Guests: Travelers staying as guests with friends or relatives.
Receipts: Travel expenditures less the sales and excise taxes imposed on those expenditures (also referred to as business receipts).
Recreation: Spending on amusement and recreation, such as admissions to tourist attractions.
Retail Sales: Spending for gifts, souvenirs and other items (excludes spending listed separately, such as food stores or recreation).
Spending Distributions: Information from visitor surveys showing how spending by each type of visitor is divided between various business categories.
State Tax Receipts: State sales taxes, personal and business income taxes, motor fuel taxes, and car rental taxes attributable to travel expenditures.
Transient Occupancy Tax: A local tax charged on lodging (also referred to as room tax, transient lodging tax, hotel tax or bed tax).
Travel: A day or overnight trip that is not of a local or commuting nature. Travel may be for business or pleasure purposes.
Travel Arrangement: Spending for fees paid to travel agents and tour operators.
Traveler: A person traveling in the state of Colorado. A traveler may be a Colorado resident or a resident of another state. The terms traveler and visitor have the same meaning in this report.
Vacation Home User: Travelers using their own vacation home or timeshare and those renting a vacation home or privately-owned cabin where transient occupancy tax is not collected.
PAGE 59 DEAN RUNYAN ASSOCIATES

APPENDIX C
TRAVEL IMPACT INDUSTRYNAICS INDUSTRIES* (code)
Approximate
Pct. Travel
Employment
Accommodation & Food Services
Accommodation (721) 80%
Food Services and Drinking Places (722) 20%
Residential Property Managers (531311)
Arts, Entertainment & Recreation 40%
Performing Arts, Spectator Sports (711)
Museums (712)
Amusement, Gambling (713)
Scenic and Sightseeing Transportation (487)
Miscellaneous Industries (see note**)
Retail
Food & Beverage Stores (445) 5%
Gasoline Stations (447) 15%
Clothing and Clothing Accessories Stores (448) 5%
Sporting Goods, Hobby, Book, and Music Stores (451) 5%
General Merchandise Stores (452) 5%
Miscellaneous Store Retailers (453) 5%
Ground Transportation
Interurban and rural bus transportation (4852)
Taxi and Limousine Service (4853)
Charter Bus Industry (4855)
Passenger Car Rental (532111) 70%
Parking Lots and Garages (812930)
Air Transportation
Scheduled Air Passenger Transportation (481111) 70%
Support Activities for Air Transportation (4881)
Travel Arrangement Services
Travel Agencies (56151) 100%
Notes: *Government enterprises (e.g., park systems) are included in this classification.
**Includes parts of industries in other sectors (e.g., accommodation, charter bus).
A more detailed description of these industries can be found at http://www.ntis.gov/naics.
TRAVEL IMPACT INDUSTRIES MATCHED TO 2007 NAICS
DEAN RUNYAN ASSOCIATESPAGE 60