colour spaces for paddy soil moisture content determination
TRANSCRIPT
1
S. Nor Hafizah and B. Siti KhairunnizaJ. Trop. Agric. and Fd. Sc. 39(1)(2011): 000– 000
Colour spaces for paddy soil moisture content determination(Ruang warna untuk penentuan kandungan kelembapan tanah sawah)
S. Nor Hafizah* and B. Siti Khairunniza*
Keywords: soil moisture content, colour, image processing, RGB, HSV, CIELUV.
AbstractA study using RGB, HSV and CIELUV colour spaces was conducted to determine the paddy soil moisture content at two different soil depths. Results from the experiment showed that each layer of soil gave a different soil colour as the soil moisture content varies with the depth of the soil layer. By comparing the result of laboratory work with the result of image processing technique, it was shown that 15 cm depth soil which had higher moisture content gave a lower value of mean pixel intensity compared to the surface soil. When the digital images of soil were transformed to HSV (USGS Munsell), a colour space commonly used to represent soil colour, the result showed that the mean pixel intensity was not consistent for each soil layer. To overcome this problem, the RGB and CIELUV colour spaces were used. The CIELUV colour space gave more consistent mean pixel intensity for each soil layer. It successfully indicated that lower moisture content will give higher value of mean pixel intensity. Results from statistical analysis also showed that RGB and CIELUV colour spaces were significantly related to the soil moisture content. CIELUV gave the highest value of correlation at –0.548 and a smaller value of RMSE in linear regression analysis.
*Department of Biological and Agricultural Engineering, Faculty of Engineering, Universiti Putra Malaysia, 43400 UPM Serdang, Selangor, MalaysiaAuthors’ full names: Nor Hafizah Sumgap and Siti Khairunniza BejoE-mail: [email protected]©Malaysian Agricultural Research and Development Institute 2011
IntroductionRice is a staple food in this region and most of the paddy in Malaysia is grown on low land paddy fields, flooded with water. Water depth and late flooding of field after sowing can affect yield production. It is important to monitor the water, weeds and fertilizer status to give advance notice to farmers on the occurrence of pests and diseases. The knowledge of moisture content gives advantage in agriculture practice. It gives information of soil condition and can be used to identify the best practice to improve yield production.
Moisture content is defined as the amount of water present in the soil. Moisture conditions can affect the soil structure. Wet soil can suffer from erosion while soil that is too dry can become hard and compacted. Different types of soil respond to moisture differently. A clay soil will absorb more water while sandy soil will drain water quickly. The change in moisture content may change the rheological characteristic of soil and affect many hydraulic and transport properties. Soil moisture information is valuable to a wide range of government agencies and private companies concerned with weather and
2
Colour spaces for paddy soil
climate, runoff potential and flood control, soil erosion and slope failure, reservoir management, geotechnical engineering, and water quality. Soil moisture is a key variable in controlling the exchange of water and heat energy between the land surface and the atmosphere through evaporation and plant transpiration (Koster et al. 2004). There are several methods to determine moisture content. The value of moisture content can be used not only to determine appropriate irrigation time but also to determine the amount of soil moisture used by the plants. In laboratory work, soil is oven dried for 24 h to get the mass of water pore. However, this method is time consuming and the calculated gravimetric moisture content may underestimate the actual amount of moisture used by plants as it measures soil moistures based on weight. The soil moisture used by plants is expressed as a depth of water. Therefore, the volumetric moisture is more appropriate for determining the amount of soil moisture used by plants as it measures soil moisture based on volume. However, it requires more tedious work compared to gravimetric method (Blaine and Steve 1998). For in situ measurement, there are available sensors such as dielectric moisture sensor which is buried under the soil and gives fast reading. However, the use of sensors is limited since it depends on the technical specifications provided by manufacturers. Soil moisture content and other physical soil properties have a strong influence on the amount and composition of energy reflected and emitted from soil surface. This effect is mainly determined by the soil moisture content of the soil surface, which is highly dynamic, being temporally and spatially variable as a result of microclimate, evaporative demands and non-uniform soil physical properties (Huete and Warrick 1990). Colour is frequently used by soil scientists for soil identification and classification. It is used as an indicator of field soil physical, chemical and biological properties and the occurrence
of soil processes. Soils with dark surface horizons are generally associated with high organic matter contents, categorizing them as fertile and suitable for plant growth (Schulze et al. 1993). Soil colours can also be used to qualitatively describe the status of moisture, for example, due to changes in the refractive index, dry soils are lighter in colour compared to the wet soils (Thompson and Bell 1996). The Munsell Soil Colour Charts can be used to precisely describe soil colours by determining the hue, value and chroma of the colour. These three variables describe a perceptual colour space and not a quantitative measure of visible light. The system was designed to arrange colours according to the equal intervals of visual perception. Thus, the primary advantage of the Munsell system is its ease of interpretation. However, the Munsell Hue Value Chroma (HVC) coordinates are psycho sensory and based on subjective perception and comparison, therefore, the system is not uniform (Viscarra Rossel et al. 2006). Although this system is useful, it is light dependent and has a limitation on the number of colour chips. As a result, this system is less appropriate when precise colour measurements are needed. These limitations have prompted researchers to use more objective and more accurate methods to measure the colour by optical techniques such as digital cameras (Viscarra Rossel et al. 2003; Viscarra Rossel et al. 2009), chromameters (Konen et al. 2003) and spectrometers (Post et al. 1993). There are a number of colour spaces that exist to overcome some limitation of the Munsell System such as Red Green Blue (RGB), CIELAB and CIELUV. CIE stands for the International Commission on Illumination. It has been defined as a system that classifies colour according to human visual system. It measures the sensitivities of the three broad bands in the eye by matching spectral colours to specific mixtures of three coloured lights (Adrian and Alan 1998). The three colours in LAB
3
S. Nor Hafizah and B. Siti Khairunniza
are Luminance, A (Red – Green axis), and B (Blue – Yellow axis). Meanwhile, the three colours in LUV are Luminance, U (Red vs Green) and V (Blue vs Yellow). CIELAB and CIELUV are device independent colour spaces and use Cartesian-type coordinate system which is more useful in numerical and predictive analysis. CIELUV has an associated two-dimensional chromaticity chart which is useful for showing additive colour mixtures, making CIELUV useful in applications using Cathode Ray Tube (CRT) displays. In order to evaluate the usefulness of the various colour space, the relationships between soil colour and soil moisture content have been analysed. Soil moisture content was correlated to parameters from the various colour spaces that describe both the lightness of the colour and its chroma. The main purpose of this study was to find appropriate colour spaces for paddy soil moisture content determination by using an image processing approach. Three different colour spaces were used to determine the soil moisture content taken from two different depths of paddy soil.
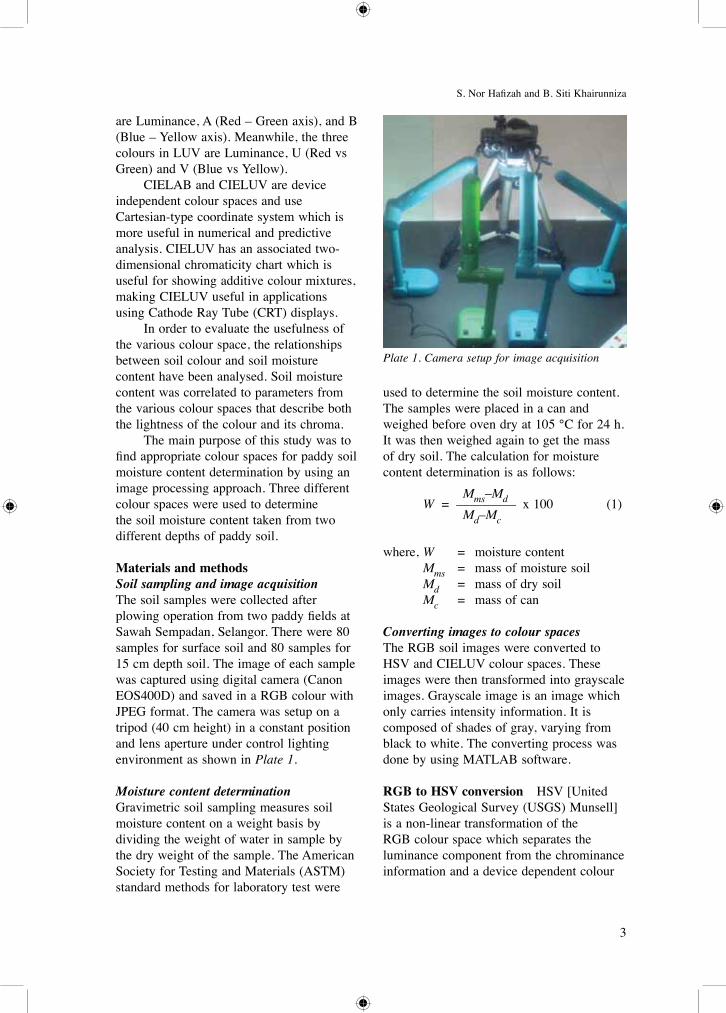
Materials and methodsSoil sampling and image acquisitionThe soil samples were collected after plowing operation from two paddy fields at Sawah Sempadan, Selangor. There were 80 samples for surface soil and 80 samples for 15 cm depth soil. The image of each sample was captured using digital camera (Canon EOS400D) and saved in a RGB colour with JPEG format. The camera was setup on a tripod (40 cm height) in a constant position and lens aperture under control lighting environment as shown in Plate 1.
Moisture content determinationGravimetric soil sampling measures soil moisture content on a weight basis by dividing the weight of water in sample by the dry weight of the sample. The American Society for Testing and Materials (ASTM) standard methods for laboratory test were
used to determine the soil moisture content. The samples were placed in a can and weighed before oven dry at 105 °C for 24 h. It was then weighed again to get the mass of dry soil. The calculation for moisture content determination is as follows: Mms–Md W = ––––––––– x 100 (1) Md–Mc
where, W = moisture content Mms = mass of moisture soil Md = mass of dry soil Mc = mass of can
Converting images to colour spacesThe RGB soil images were converted to HSV and CIELUV colour spaces. These images were then transformed into grayscale images. Grayscale image is an image which only carries intensity information. It is composed of shades of gray, varying from black to white. The converting process was done by using MATLAB software.
RGB to HSV conversion HSV [United States Geological Survey (USGS) Munsell] is a non-linear transformation of the RGB colour space which separates the luminance component from the chrominance information and a device dependent colour
Plate 1. Camera setup for image acquisition
4
Colour spaces for paddy soil
space. The S and V components are calculated as follows: (max – min) S = ––––––––––– (2) max V = max (3)where, max = max (R, G, B) min = min (R, G, B)
The H component is calculated as follows:
if R = max and G = min; H = 5 + B'elseif R = max and G ≠ min; H = 1 – G'elseif G = max and B = min; H = R' + 1elseif G = max and B ≠ min; H = 3 – B'elseif R = max; H = 5 + G'otherwise H = 5 – R'
where, max – R R’ = ––––––––– (4) max – min max – G G’ = ––––––––– (5) max – min max – B B’ = ––––––––– (6) max – min RGB to CIELUV conversion The CIE XYZ is a standard that defines a three-dimensional space where three values, called tristimulus values define a colour. The CIELUV was obtained after the xy coordinates were transformed to a uniform chromaticity scale to overcome the perceptual non-linearity of the XYZ (Wyszecki and Stiles 1982). The RGB colour data were converted to XYZ colour data and finally to LUV colour data as given in equations 7–12.
R 3.240479 –1.53715 –0.498535 X G = –0.969256 1.875992 0.041556 x Y (7) ( B) ( 0.055648 –0.204043 1.057311 ) ( Z )
4X u' = –––––––––––––––– (8) X + 15Y + 3Z
9Y v' = –––––––––––––––– (9) X + 15Y + 3Z Y 1/3 Y 6 3 116 –––– –16, ––– > –––– ( Yn ) Yn ( 29 ) L = 29 3 Y Y 6 3 (10) ––– –––– ––– ≤ ––––
{ ( 3 ) Yn' Yn ( 29 ) }
then, U = 13L (u' – u'n) (11) V = 13L (v' – v'n) (12)
Mean pixel intensity The mean pixel intensity of soil samples in each colour space was calculated and compared. The mean pixel intensity was calculated as follows: i=m j=m
SS x (i,j) i=m j=m Mean (x) = –––––––––– (13) m x n where, i = number of column j = number of row m = maximum number of
columns in the image n = maximum number of rows
in the image x(i,j) = pixel value at location (i,j)
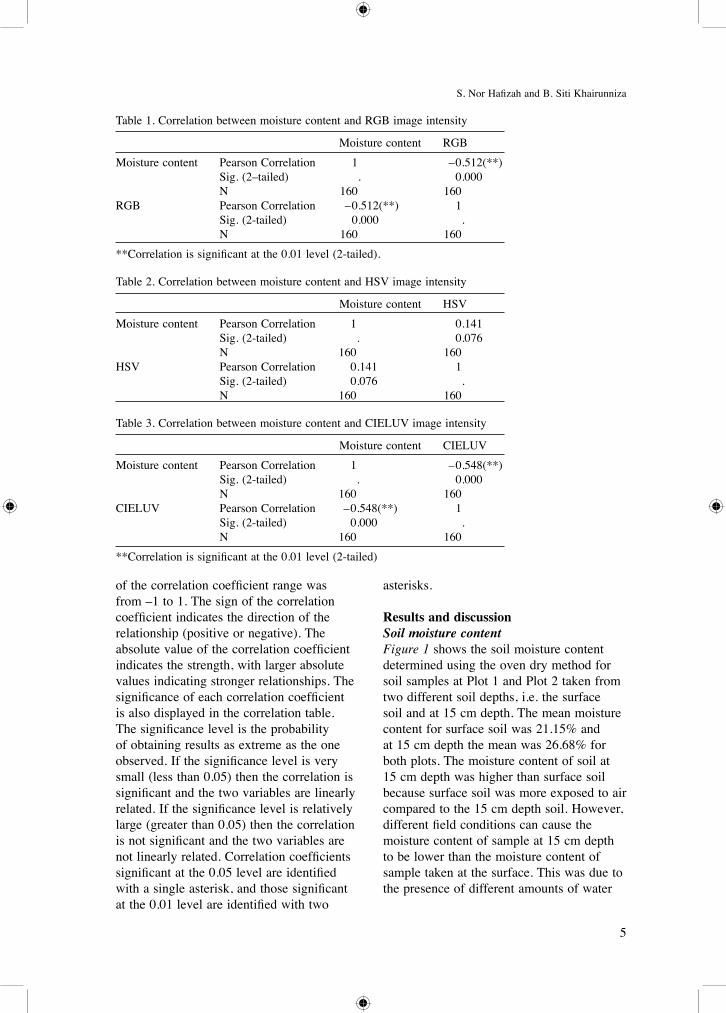
Statistical analysisStatistical analysis on the relationship between all colour spaces and moisture content was done by calculating its Pearson correlation using SPSS software. Results of the analysis are displayed in the correlation tables (Tables 1–3) which include the value of correlation coefficients, significance values, and the number of cases with non-missing values (N). The values
5
S. Nor Hafizah and B. Siti Khairunniza
Table 1. Correlation between moisture content and RGB image intensity
Moisture content RGBMoisture content Pearson Correlation 1 –0.512(**) Sig. (2–tailed) . 0.000 N 160 160RGB Pearson Correlation –0.512(**) 1 Sig. (2-tailed) 0.000 . N 160 160**Correlation is significant at the 0.01 level (2-tailed).
Table 2. Correlation between moisture content and HSV image intensity
Moisture content HSVMoisture content Pearson Correlation 1 0.141 Sig. (2-tailed) . 0.076 N 160 160HSV Pearson Correlation 0.141 1 Sig. (2-tailed) 0.076 . N 160 160
Table 3. Correlation between moisture content and CIELUV image intensity
Moisture content CIELUVMoisture content Pearson Correlation 1 –0.548(**) Sig. (2-tailed) . 0.000 N 160 160CIELUV Pearson Correlation –0.548(**) 1 Sig. (2-tailed) 0.000 . N 160 160**Correlation is significant at the 0.01 level (2-tailed)
of the correlation coefficient range was from –1 to 1. The sign of the correlation coefficient indicates the direction of the relationship (positive or negative). The absolute value of the correlation coefficient indicates the strength, with larger absolute values indicating stronger relationships. The significance of each correlation coefficient is also displayed in the correlation table. The significance level is the probability of obtaining results as extreme as the one observed. If the significance level is very small (less than 0.05) then the correlation is significant and the two variables are linearly related. If the significance level is relatively large (greater than 0.05) then the correlation is not significant and the two variables are not linearly related. Correlation coefficients significant at the 0.05 level are identified with a single asterisk, and those significant at the 0.01 level are identified with two
asterisks.
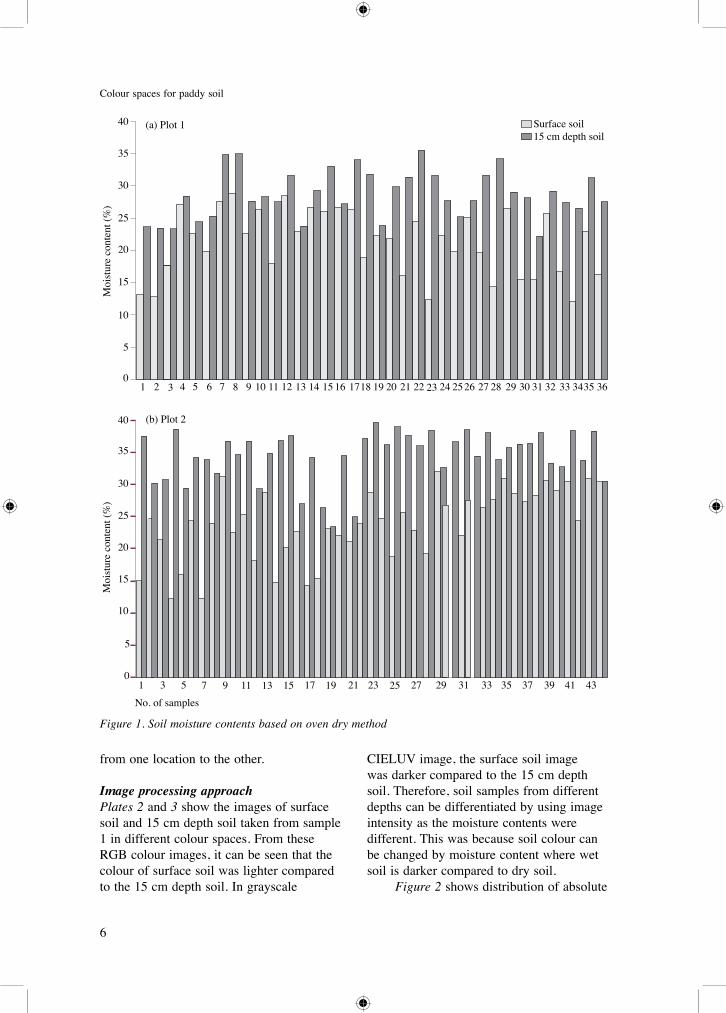
Results and discussionSoil moisture content Figure 1 shows the soil moisture content determined using the oven dry method for soil samples at Plot 1 and Plot 2 taken from two different soil depths, i.e. the surface soil and at 15 cm depth. The mean moisture content for surface soil was 21.15% and at 15 cm depth the mean was 26.68% for both plots. The moisture content of soil at 15 cm depth was higher than surface soil because surface soil was more exposed to air compared to the 15 cm depth soil. However, different field conditions can cause the moisture content of sample at 15 cm depth to be lower than the moisture content of sample taken at the surface. This was due to the presence of different amounts of water
6
Colour spaces for paddy soil
0
5
10
15
20
25
30
35
40
1 2 3 4 5 6 7 8 9 10 11 12 13 14 15 16 1718 19 20 21 22 23 24 2526 27 28 29 30 31 32 33 3435 36
Moi
stur
e co
nten
t (%
)
0
5
10
15
20
25
30
35
40
1 3 5 7 9 11 13 15 17 19 21 23 25 27 29 31 33 35 37 39 41 43
Moi
stur
e co
nten
t (%
)
(a) Plot 1
(b) Plot 2
No. of samples
Surface soil15 cm depth soil
Figure 1. Soil moisture contents based on oven dry method
from one location to the other.
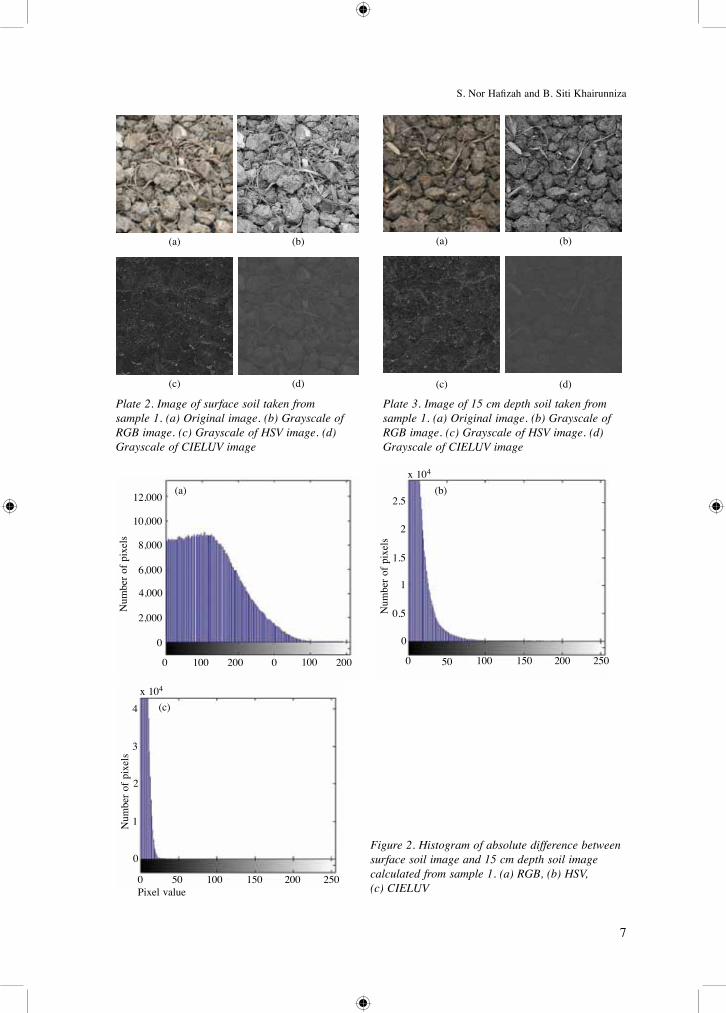
Image processing approach Plates 2 and 3 show the images of surface soil and 15 cm depth soil taken from sample 1 in different colour spaces. From these RGB colour images, it can be seen that the colour of surface soil was lighter compared to the 15 cm depth soil. In grayscale
CIELUV image, the surface soil image was darker compared to the 15 cm depth soil. Therefore, soil samples from different depths can be differentiated by using image intensity as the moisture contents were different. This was because soil colour can be changed by moisture content where wet soil is darker compared to dry soil. Figure 2 shows distribution of absolute
7
S. Nor Hafizah and B. Siti Khairunniza
(a) (b)
(c) (d)
Plate 2. Image of surface soil taken from sample 1. (a) Original image. (b) Grayscale of RGB image. (c) Grayscale of HSV image. (d) Grayscale of CIELUV image
(a) (b)
(c) (d)
Plate 3. Image of 15 cm depth soil taken from sample 1. (a) Original image. (b) Grayscale of RGB image. (c) Grayscale of HSV image. (d) Grayscale of CIELUV image
Figure 2. Histogram of absolute difference between surface soil image and 15 cm depth soil image calculated from sample 1. (a) RGB, (b) HSV, (c) CIELUV
(a)12,000
10,000
8,000
6,000
4,000
2,000
0
Num
ber o
f pix
els
0 100 200 0 100 200
(b)x 104
Num
ber o
f pix
els
2.5
2
1.5
1
0.5
0
0 50 100 150 200 250
(c)
0 50 100 150 200 250
Num
ber o
f pix
els
x 104
4
3
2
1
0
Pixel value
8
Colour spaces for paddy soil
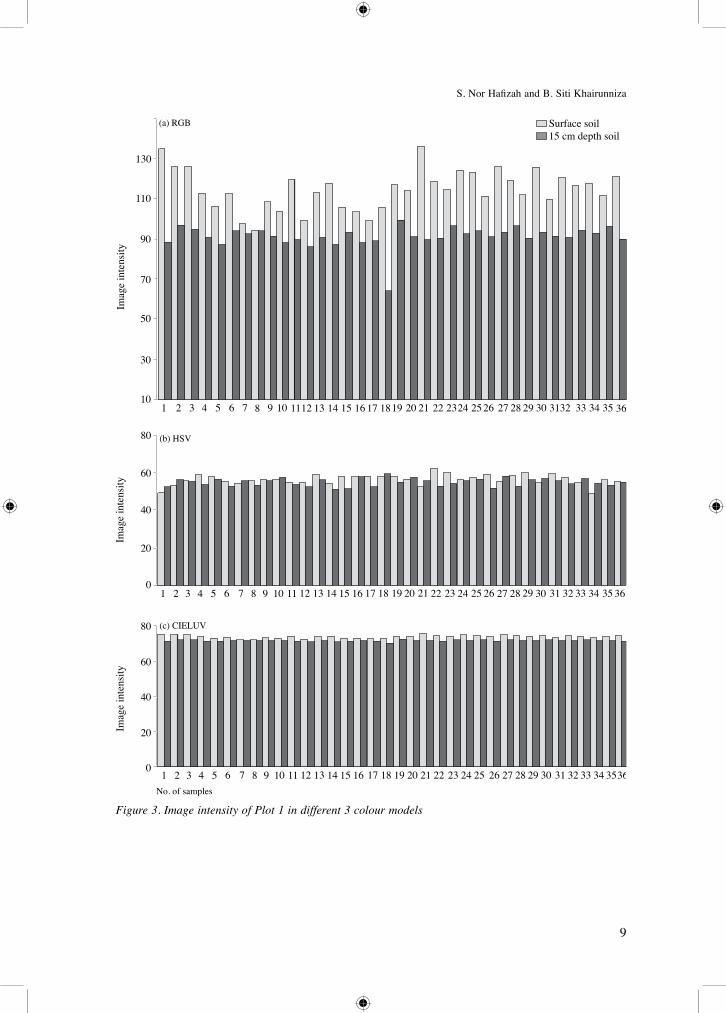
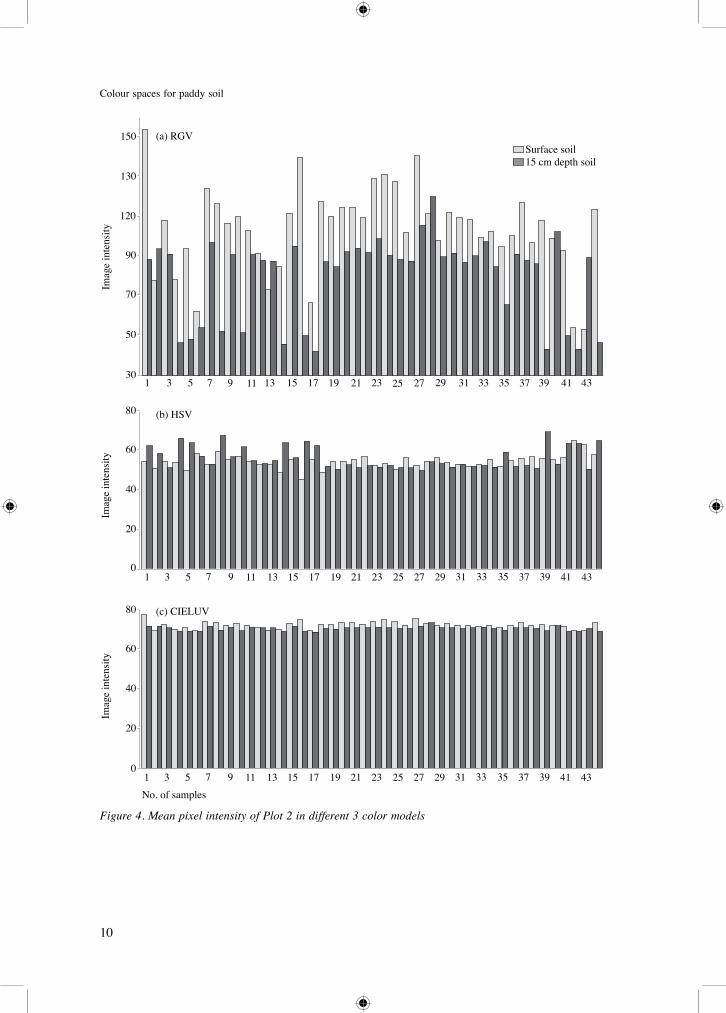
difference between surface soil image and 15 cm depth soil image at different colour spaces. This was done by subtracting each intensity element of surface soil image from its corresponding intensity element of 15 cm depth soil. The x-axis represents the difference of pixel value between the two images at its corresponding pixel location. The higher the pixel value the greater the difference between them. The y-axis represents the total number of pixels in its corresponding pixel value of different images. From this figure, it can be seen that RGB image provides greater difference in values among the three colour spaces. This is followed by HSV and CIELUV image. Figure 3 shows the results for mean pixel intensity of RGB, HSV and CIELUV images taken from 36 samples of Plot 1. These results were compared with the results taken from the laboratory work (Figure 1). All 15 cm depth soil samples had higher value of moisture content compared to surface soil (Figure 1). However, results of HSV showed that only 11 out of 36 samples had higher values of mean pixel intensity for 15 cm depth soil compared to the surface soil. Results of RGB and CIELUV indicated that both colour spaces can separate the values of mean pixel intensity in all 36 samples. Therefore, it can be concluded that RGB and CIELUV colour spaces gave more consistent results compared to HSV. Although CIELUV gave the smallest value of average difference of mean pixel intensity between both depths (2.12), compared to HSV (2.78) and RGB (21.71), it gave more consistent results with a standard deviation of 1.36 compared to the others, i.e. 14.29 for RGB and 2.53 for HSV. This might be because CIELUV is a more uniform colour system, while RGB is a device dependent colour space and had mixing of luminance and chrominance which affect the pixel intensity calculation. Figure 4 shows the results of mean pixel intensity of RGB, HSV and CIELUV images taken from 44 samples of Plot 2. In this case, only a small number of surface
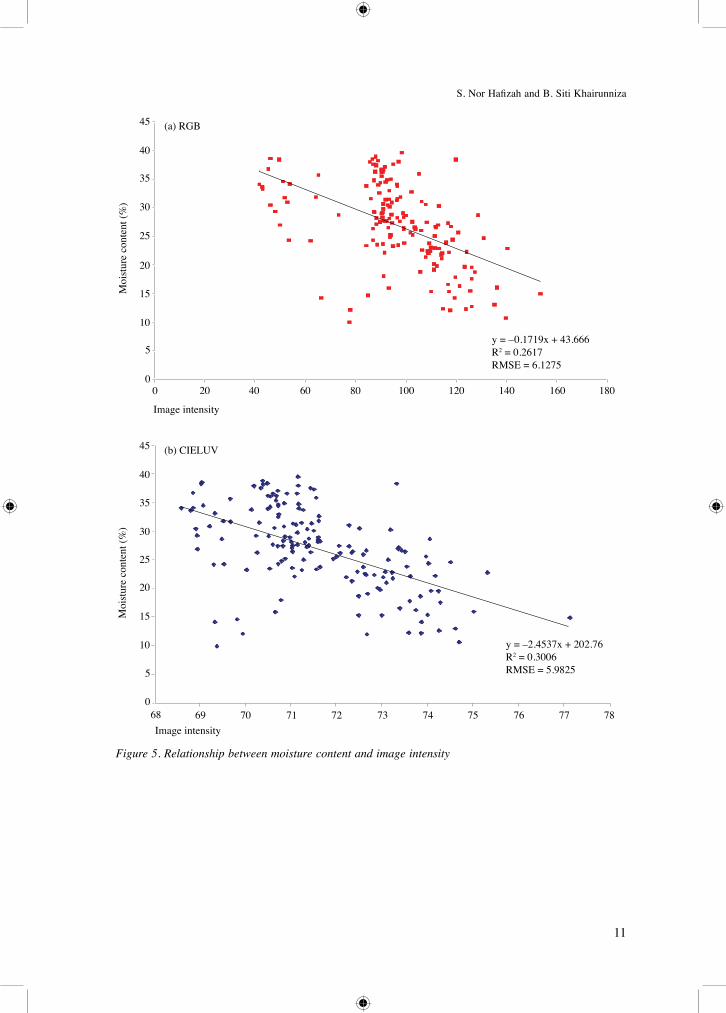
soil images had lower values of mean pixel intensity compared to the 15 cm depth soil images in all colour spaces. Only 20 samples for HSV and 5 samples for RGB and CIELUV had lower mean pixel intensity values on the surface soil. This condition might be influenced by the amount of organic matter in soil samples as soil with dark colour was generally associated with high amount of organic matter. However, CIELUV still gave more consistent results compared to RGB where the standard deviation for CIELUV was 1.68 and 24.51 for RGB. Results of both samples clearly showed that the image intensity can be used to differentiate moisture content for different depths of soil. Tables 1–3 show the results of statistical analysis for the RGB, HSV and CIELUV soil images respectively. From these tables, it can be seen that the significant levels in RGB and CIELUV colour spaces are less than 0.05. Therefore, it can be concluded that the value of correlation, r, is significant in RGB (–0.512) and CIELUV (–0.548). These values of correlation are not the results of chance or random sampling error. These negative r values indicate that the increase in moisture content is associated with the decrease of image intensity of CIELUV and RGB images. The r value for CIELUV is higher than RGB which indicated that moisture content would give a better relationship with CIELUV image intensity compared to RGB image intensity. The correlation in HSV is not significant since its significant level is 0.141. The linear relationship between the soil images taken from RGB and CIELUV colour spaces with the soil moisture content is shown in Figure 5. The graphs show that soils with higher moisture content were darker in colour. However, the CIELUV colour space gave higher value of R2 and smaller value of Root Mean Square Error (RMSE) compared to RGB. The soil in aggregate size was used to represent the real field condition. As a result it might produce shadow on the soil image. This shadow
9
S. Nor Hafizah and B. Siti Khairunniza
10
30
50
70
90
110
130
1 2 3 4 5 6 7 8 9 1112 13 14 15 16 17 181910 20 21 22 2324 25 26 27 28 29 30 3132 33 34 35 36
Imag
e in
tens
ity
0
20
40
60
80
1 2 3 4 5 6 7 8 9 10 11 12 13 14 15 16 17 18 19 20 21 22 23 24 25 26 27 28 29 30 31 32 33 34 35 36
Imag
e in
tens
ity
0
20
40
60
80
Imag
e in
tens
ity
1 2 3 4 5 6 7 8 9 10 11 12 13 14 15 16 17 18 19 20 21 22 23 24 25 26 27 28 29 30 31 32 33 34 3536No. of samples
(a) RGB
(b) HSV
(c) CIELUV
Surface soil15 cm depth soil
Figure 3. Image intensity of Plot 1 in different 3 colour models
10
Colour spaces for paddy soil
30
50
70
90
120
130
150
1 3 5 7 9 13 15 19 21 23 25 27 29 31 33 35 37 39 41 43
Imag
e in
tens
ity
0
20
40
60
80
1 3 5 7 9 11 13 15 17 19 21 23 25 27 29 31 33 35 37 39 41 43
0
20
40
60
80
No. of samples1 3 5 7 9 11 13 15 17 19 21 23 25 27 29 31 33 35 37 39 41 43
Imag
e in
tens
ityIm
age
inte
nsity
11 17
Surface soil15 cm depth soil
(a) RGV
(b) HSV
(c) CIELUV
Figure 4. Mean pixel intensity of Plot 2 in different 3 color models
11
S. Nor Hafizah and B. Siti Khairunniza
0
5
10
15
20
25
30
35
40
45
0 20 40 60 80 100 120 140 160 180
Image intensity
Moi
stur
e co
nten
t (%
)
0
5
10
15
20
25
30
35
40
45
68 69 70 71 72 73 74 75 76 77 78Image intensity
Moi
stur
e co
nten
t (%
)
y = –0.1719x + 43.666R2 = 0.2617RMSE = 6.1275
(a) RGB
y = –2.4537x + 202.76R2 = 0.3006RMSE = 5.9825
(b) CIELUV
Figure 5. Relationship between moisture content and image intensity
12
Colour spaces for paddy soil
might influence the small value of R2.
ConclusionThe RGB and CIELUV colour spaces can differentiate both depths of soil which means that both colour spaces can differentiate the value of moisture content even only at 15 cm depth. Results from statistical analysis showed that the value of mean pixel intensity of soil images was significantly correlated with the soil moisture content. CIELUV colour space gave the highest value of correlation (r = –0.548) and provided more consistent results since it gave a better value of R2 (0.3006) and smaller RMSE (5.9825). In conclusion, CIELUV colour space gave better image interpretation of soil moisture content compared to RGB and HSV. It gave more consistent intensity values at each depth. Although the results of statistical analysis is significant, the value of R2 is still small. Therefore, the use of image processing techniques in predicting soil moisture content cannot solely depend on the soil colour. Other properties such as soil image texture might be included to improve the accuracy of the results.
ReferencesAdrian, F. and Alan, R. (1998). Colour space
conversions. Retrieved on 9 Dec. 2009 from http://www.poynton.com/PDFs/coloureq.pdf
Blaine, H. and Steve, O. (1998). Measuring soil moisture. Davis, USA: University of California
Huete, A.R. and Warrick, A.W. (1990). Assessment of vegetation and soil water regimes in partial canopies with optical remotely sensed data. Remote Sens. Environ 32: 155–167
Konen, M.E., Burras, C.L. and Sandor, J.A. (2003). Organic carbon, texture and quantitative colour measurement relationships for cultivated soils in north central Iowa.
Soil Science Society of America Journal 67: 1823–1830
Koster, R.D., Dirmeyer, P.A., Guo, Z., Bonan, G., Chan, E. and Cox, P. (2004). Regions of strong coupling between soil moisture. Science 305: 1138−1140
Post, D.F., Levine, S.J., Bryant, R.B., Mays, M.D., Batchily, K., Escadafal, R. and Huete, A.R. (1993). Correlations between field and laboratory measurements of soil colour. In: Soil colour (Bigham, J.M. and Ciolkosz, E.J., eds.), p. 35–50. Madison: Soil Science Society of America
Schulze, D.G., Nagel, J.L., Van Scoyoc, G.E., Henderson, T.L., Baumgardner, M.F. and Scott, D.E. (1993). Significance of organic matter in determining soil colours. In: Soil colour (Bigham, J.M. and Ciolkosz, E.J., eds.), p. 71–90. Madison: Soil Science Society of America
Thompson, J.A. and Bell, J. (1996). Colour index for identifying hydric conditions for seasonally saturated mollisols in Minnesota. Soil Science Society of America Journal 60: 1979–1988
Viscarra Rossel, R.A., Cattle, S.R., Ortega, A. and Fouad, Y. (2009). In situ measurements of soil colour, mineral composition and clay content by vis–NIR spectroscopy. Geoderma 150: 253–266
Viscarra Rossel, R.A., Minasny, B., Roudier, P. and McBratney, A.B. (2006). Colour space models for soil science. Geoderma 133: 320–337
Viscarra Rossel, R.A., Walter, C. and Fouad, Y. (2003). Assessment of two reflectance techniques for the quantification of field soil organic carbon. In: Precision agriculture (Stafford, J. and Werner, A., eds.), p. 697– 703. Fourth European Conference on Precision Agriculture, Berlin: Wageningen Academic Publishers
Wyszecki, G. and Stiles, W.S. (1982). Colour science: Concepts and methods, quantitative data and formulae. 2nd Edition. New York: Wiley
13
S. Nor Hafizah and B. Siti Khairunniza
AbstrakPenggunaan ruang warna RGB, HSV dan CIELUV telah dikaji bagi menentukan kandungan lembapan tanah sawah pada dua lapisan berbeza. Keputusan kajian menunjukkan bahawa bagi setiap lapisan, warna tanah berbeza kerana kandungan lembapan tanah berubah mengikut kedalaman lapisan tanah. Dengan membandingkan keputusan uji kaji makmal dengan keputusan pemprosesan imej, didapati bahawa tanah pada kedalaman 15 cm yang memiliki lembapan lebih tinggi memberikan nilai keamatan piksel yang lebih rendah berbanding dengan tanah permukaan. Apabila imej digital tanah ditukarkan ke ruang warna HSV (USGS Munsell), satu ruang warna yang sering kali digunakan untuk mewakili warna tanah, keputusan menunjukkan purata keamatan imej yang tidak konsisten bagi setiap lapisan tanah. Untuk mengatasi masalah ini, ruang warna RGB dan CIELUV telah digunakan. Ruang warna CIELUV memberikan nilai keamatan imej yang lebih konsisten bagi setiap lapisan tanah. Ruang warna ini berjaya menunjukkan lembapan tanah yang lebih rendah akan memberikan nilai keamatan imej yang lebih tinggi. Keputusan analisis statistik menunjukkan ruang warna RGB dan CIELUV saling berhubung kait dengan kandungan lembapan tanah. CIELUV memberikan nilai korelasi yang lebih tinggi iaitu –0.548 dan nilai RMSE yang lebih kecil berbanding dengan RGB melalui analisis regresi linear.
Accepted for publication on