columbus southern power company, conesville …web.epa.ohio.gov/dsw/permits/doc/0ib00013.fs.pdffor...
TRANSCRIPT

Factsheet for Conesville Power Plant NPDES Permit Renewal, October 2007 Page 1
National Pollutant Discharge Elimination System (NPDES) Permit Program
F A C T S H E E T
Regarding an NPDES Permit To Discharge to Waters of the State of Ohio
for Columbus Southern Power Company, Conesville Generating Station
Public Notice No.: 07-10-033 OEPA Permit No.: 0IB00013*LD
Public Notice Date: October 24, 2007 Application No.: (OH #) OH0005371
Comment Period Ends: November 24, 2007
Name and Address of Facility Where
Name and Address of Applicant: Discharge Occurs:
Columbus Southern Power Company Columbus Southern Power Company
c/o American Electric Power Conesville Generating Station
1 Riverside Plaza 47201 County Road 273
Columbus, Ohio 43215 Conesville, Ohio 43811
Coshocton County
Receiving Water: Muskingum River Subsequent
Stream Network: Ohio River
Introduction
Development of a Fact Sheet for NPDES permits is required by Title 40 of the Code of Federal
Regulations, Section 124.8 and 124.56. This document fulfills the requirements established in those
regulations by providing the information necessary to inform the public of actions proposed by the Ohio
Environmental Protection Agency, as well as the methods by which the public can participate in the
process of finalizing those actions.
This Fact Sheet is prepared in order to document the technical basis and risk management decisions that
are considered in the determination of water quality based NPDES Permit effluent limitations. The
technical basis for the Fact Sheet may consist of evaluations of promulgated effluent guidelines and other
treatment-technology based standards, existing effluent quality, instream biological, chemical and
physical conditions, and the allocations of pollutants to meet Ohio Water Quality Standards. This Fact
Sheet details the discretionary decision-making process empowered to the director by the Clean Water
Act and Ohio Water Pollution Control Law (ORC 6111). Decisions to award variances to Water Quality
Standards or promulgated effluent guidelines for economic or technological reasons will also be justified
in the Fact Sheet where necessary.
Effluent limits based on available treatment technologies are required by Section 301(b) of the Clean
Water Act. Many of these have already been established by U.S. EPA in the effluent guideline
regulations (a.k.a. categorical regulations) for industry categories in 40 CFR Parts 405-499. Technology-

Page 2 Factsheet for Conesville Power Plant NPDES Permit Renewal, October 2007
based regulations for publicly-owned treatment works are listed in the Secondary Treatment Regulations
(40 CFR Part 133). If regulations have not been established for a category of dischargers, the director
may establish technology-based limits based on best professional judgment (BPJ).
Ohio EPA reviews the need for water-quality-based limits on a pollutant-by-pollutant basis. Wasteload
allocations are used to develop these limits based on the pollutants that have been detected in the
discharge, and the receiving water’s assimilative capacity. The assimilative capacity depends on the flow
in the water receiving the discharge, and the concentration of the pollutant upstream. The greater the
upstream flow, and the lower the upstream concentration, the greater the assimilative capacity is.
Assimilative capacity may represent dilution (as in allocations for metals), or it may also incorporate the
break-down of pollutants in the receiving water (as in allocations for oxygen-demanding materials).
The need for water-quality-based limits is determined by comparing the wasteload allocation for a
pollutant to a measure of the effluent quality. The measure of effluent quality is called PEQ - Projected
Effluent Quality. This is a statistical measure of the average and maximum effluent values for a pollutant.
As with any statistical method, the more data that exists for a given pollutant, the more likely that PEQ
will match the actual observed data. If there is a small data set for a given pollutant, the highest measured
value is multiplied by a statistical factor to obtain a PEQ; for example if only one sample exists, the factor
is 6.2, for two samples - 3.8, for three samples - 3.0. The factors continue to decline as samples sizes
increase. These factors are intended to account for effluent variability, but if the pollutant concentrations
are fairly constant, these factors may make PEQ appear larger than it would be shown to be if more
sample results existed.
Summary of Proposed Permit Conditions
Most of the requirements in the existing permit for the Conesville Power Plant are proposed to continue in
the draft permit. However, there are also a number a new requirements, including the authorization of a
variance from meeting water quality standards for mercury. The development of a pollutant minimization
program in order to reduce mercury discharge concentrations is required as a condition of the variance.
Internal monitoring stations have been added in order to monitor the effluent from a new treatment plant
for the flue-gas desulfurization wastestream from generating unit # 4. A monitoring station has also been
added to track the quantity of sewage sludge removed from the site and taken to another NPDES permit
holder. Requirements for operator certification, outfall signage, and submittal of fish impingement and
entrainment data have been included in Part II of the permit. Since the NPDES permit application
requested an increase in the discharge of pollutants from outfall 001, an anti-degradation review has been
conducted in association with this permit renewal, and the Director of Ohio EPA has determined that a
lowering of water quality in the Muskingum River is necessary.
This permit renewal is proposed for a term of approximately four and one-half years, expiring on July
31, 2012. This schedule will allow the Conesville Power Plant permit to be on a similar schedule with the
other facilities within the same watershed basin.

Factsheet for Conesville Power Plant NPDES Permit Renewal, October 2007 Page 3
Table of Contents
Page
Introduction................................................................................................................................................... 1
Summary of Proposed Permit Conditions..................................................................................................... 2
Table of Contents.......................................................................................................................................... 3
Procedures for Participation in the Formulation of Final Determinations.................................................... 5
Location of Discharge/Receiving Water Use Classification......................................................................... 6
Facility Description....................................................................................................................................... 7
Description of Existing Discharge ................................................................................................................ 7
Anticipated Changes to Conesville Discharge.............................................................................................. 9
Receiving Water Quality/Environmental Hazard Assessment ................................................................... 11
Development of Water Quality-Based Effluent Limits .............................................................................. 11
Parameter Selection .................................................................................................................................... 12
Wasteload Allocation.................................................................................................................................. 12
Reasonable Potential ................................................................................................................................... 13
Whole Effluent Toxicity WLA ................................................................................................................... 13
Effluent Limits / Hazard Management Decisions....................................................................................... 14
Whole Effluent Toxicity ............................................................................................................................. 17
Thermal Management Plan ......................................................................................................................... 17
Section 316(b) Data Submittal.................................................................................................................... 18
Other Permit Requirements......................................................................................................................... 18
Page 4 Factsheet for Conesville Power Plant NPDES Permit Renewal, October 2007
Table of Contents (continued)
List of Figures
Figure 1. Location of Conesville Power Plant. .................................................................................. 6
Figure 2. Wastewater Flow Diagram ............................................................................................... 10
Figure 3. Muskingum River Study Area .......................................................................................... 12
List of Tables
Table 1. Flow Rates for Outfalls 001 and 601 (in MGD) ................................................................. 7
Table 2. Description of Conesville Plant Outfalls ............................................................................ 8
Table 3. Aquatic Life Use Attainment Status: Muskingum River in 2006.................................... 11
Table 4. Concentration of Chemicals Found in Outfall 001 Effluent ............................................. 19
Table 5. Effluent Characterization and Decision Criteria: 2002 - 2006 ........................................ 20
Table 6. Effluent Data for Conesville Power Plant......................................................................... 24
Table 7. Water Quality Criteria in the Study Area ......................................................................... 25
Table 8. Instream Conditions and Discharger Flow ....................................................................... 26
Table 9. Summary of Effluent Limits to Maintain Applicable Water Quality Criteria .................. 29
Table 10. Parameter Assessment ...................................................................................................... 30
Table 11-xxx. Final Effluent Limits and Monitoring Requirements Table 11-001. …for Outfall 001 for Chlorination/Bromination Duration of 120 Minutes/Day or Less ................31
Table 11-091. …for Outfall 091 for Chlorination/Bromination Duration of Greater than 120 Minutes/Day ........31
Table 11-601. …for Outfall 601.............................................................................................................................32
Table 11-602. …for Outfall 602.............................................................................................................................32
Table 11-603. …for Outfall 603.............................................................................................................................33
Table 11-604. …for Outfall 604.............................................................................................................................33
Table 11-607. …for Outfall 607.............................................................................................................................34
Table 11-608. …for Outfall 608.............................................................................................................................34
Attachment A. Federal Effluent Guidelines Applicable to Conesville Plant ............................................ 36

Factsheet for Conesville Power Plant NPDES Permit Renewal, October 2007 Page 5
Procedures for Participation in the Formulation of Final Determinations
The draft action shall be issued as a final action unless the Director revises the draft after consideration of
the record of a public meeting or written comments, or upon disapproval by the Administrator of the U.S.
Environmental Protection Agency.
Within thirty days of the date of the Public Notice, any person may request or petition for a public
meeting for presentation of evidence, statements or opinions. The purpose of the public meeting is to
obtain additional evidence. Statements concerning the issues raised by the party requesting the meeting
are invited. Evidence may be presented by the applicant, the state, and other parties, and following
presentation of such evidence other interested persons may present testimony of facts or statements of
opinion.
Requests for public meetings shall be in writing and shall state the action of the Director objected to, the
questions to be considered, and the reasons the action is contested. Such requests should be addressed to:
Legal Records Section
Ohio Environmental Protection Agency
Lazarus Government Center
P.O. Box 1049
Columbus, Ohio 43216-1049
Interested persons are invited to submit written comments upon the discharge permit. Comments should
be submitted in person or by mail no later than 30 days after the date of this Public Notice. Deliver or
mail all comments to:
Ohio Environmental Protection Agency
Attention: Division of Surface Water
Water Resource Management Section
Lazarus Government Center
P.O. Box 1049
Columbus, Ohio 43216-1049
The OEPA permit number and Public Notice numbers should appear on each page of any submitted
comments. All comments received no later than 30 days after the date of the Public Notice will be
considered.
The application, fact sheet, public notice, permit including effluent limitations, special conditions,
comments received and other documents are available for inspection and may be copied at a cost of 25
cents per page at the Ohio Environmental Protection Agency at the address shown above any time
between the hours of 8:00 a.m. and 5:00 p.m., Monday through Friday. Copies of the Public Notice are
available at no charge at the same address.

Page 6 Factsheet for Conesville Power Plant NPDES Permit Renewal, October 2007
Location of Discharge/Receiving Water Use Classification
The Conesville Power
Plant, a Columbus
Southern Power Company
affiliated with American
Electric Power is located
near Conesville, Ohio, in
Coshocton County. The
facility discharges into the
Muskingum River at
River Mile (RM) 102.89.
This segment of the
Muskingum River is
described by Ohio EPA
River Code 17-001, U.S.
EPA River Reach #
05040004-071, and the
Western Allegheny
Plateau (WAP)
Ecoregion. The
Muskingum River is
presently designated for
the following uses:
Warmwater Habitat
(WWH), Agricultural
Water Supply (AWS),
Industrial Water Supply
(IWS), and Primary
Contact Recreation
(PCR). The approximate
location of the Conesville
Plant is shown in Figure
1.
Use designations define the goals and expectations for a waterbody. These goals are set for aquatic life
protection, recreation use and water supply use, and are defined in the Ohio Water Quality Standards, or
the Ohio Administrative Code (OAC 3745-1-07). The use designations for individual waterbodies are
listed in rules -08 through -32 of the OAC. Once the goals are set, numeric water quality standards are
developed to protect these uses; higher quality uses typically have more protective water quality criteria.
Use designations for aquatic life protection include habitats for coldwater fish and macroinvertebrates,
warmwater aquatic life and waters with exceptional communities of warmwater organisms. These uses
all meet the goals of the federal Clean Water Act. Ohio Water Quality Standards (WQS) also include
aquatic life use designations for waterbodies which can not meet the Clean Water Act goals because of
human-caused conditions that can not be remedied without causing fundamental changes to land use and
widespread economic impact. The dredging and clearing of some small streams to support agricultural or
urban drainage is the most common of these conditions. These streams are given Modified Warmwater or
Limited Resource Water designations.
Figure 1. Location of Conesville Power Plant

Factsheet for Conesville Power Plant NPDES Permit Renewal, October 2007 Page 7
Recreation uses are defined by the depth of the waterbody and the potential for wading or swimming.
Uses are defined for bathing waters, swimming/canoeing (Primary Contact) and wading only (Secondary
Contact - generally waters too shallow for swimming or canoeing).
Water supply uses are defined by the actual or potential use of the waterbody. Public Water Supply
designations apply near existing water intakes so that waters are safe to drink with standard treatment.
Most other waters are designated for agricultural and industrial water supply.
Facility Description
The Conesville Plant is a pulverized coal-fired steam-electric generating station. This facility is involved
in the generation, transmission, and distribution of electric power. The total generating capacity is 1945
megawatts of electricity based upon the operation of six units.
The Conesville Plant’s processes generate wastewaters which are regulated by the federal effluent
guidelines (FEGs) listed in 40 CRF Part 423, Steam Electric Power Generating Point Source Category.
The process operations at this facility are also defined by the standard industrial classification (SIC)
category 4911 - Electric Services.
Description of Existing Discharge
The Conesville Power
Plant samples at five
internal monitoring
stations all of which
discharge wastewater
through external outfall
001 to the Muskingum
River. The majority of
the wastewater discharged
from outfall 001 is
comprised of once-
through cooling water
while a much smaller
amount comes from a holding pond whose discharge is monitored at internal station 601. Table 1 shows
the reported flow rates for the Conesville Generating Station for the years 2002 through 2006. The flow
rates are constant at outfall 001 for 2002 through 2004 followed by lower discharge rates in 2005 and
2006. The pattern for internal station 601 is similar, although the decrease in flow rate occurs in 2004 for
this outfall.
Table 2 on the following page lists all the internal monitoring stations as well as external outfall 001. The
treatment provided immediately upstream from each monitoring station, the sources of wastewater, and
estimated current as well as projected discharge amounts are all included in Table 2. As stated above,
internal station 601 monitors the wastewater from the holding pond, which receives wastewater from a
number of different sources including a sewage treatment plant, coal pile runoff, storm water, cooling
tower blowdown, and an ash pond.
Table 1. Flow Rates for Outfalls 001 and 601 (in MGD)
Outfall 001 Outfall 601
Year 50th
Perc.*
95th
Perc. Maximum
50th
Perc.
95th
Perc. Maximum
2002 259.9 311.0 311.0 20.8 24.3 26.6
2003 259.9 311.0 311.0 20.8 24.3 44.7
2004 259.9 311.0 355.3 16.8 24.3 36.0
2005 186.5 288.7 506.2 14.2 17.4 21.5
2006 237.6 288.7 297.2 14.2 17.4 22.9
Overall 237.6 311.0 506.2 17.4 24.3 44.7
* “Perc.” means percentile.
Page 8 Factsheet for Conesville Power Plant NPDES Permit Renewal, October 2007
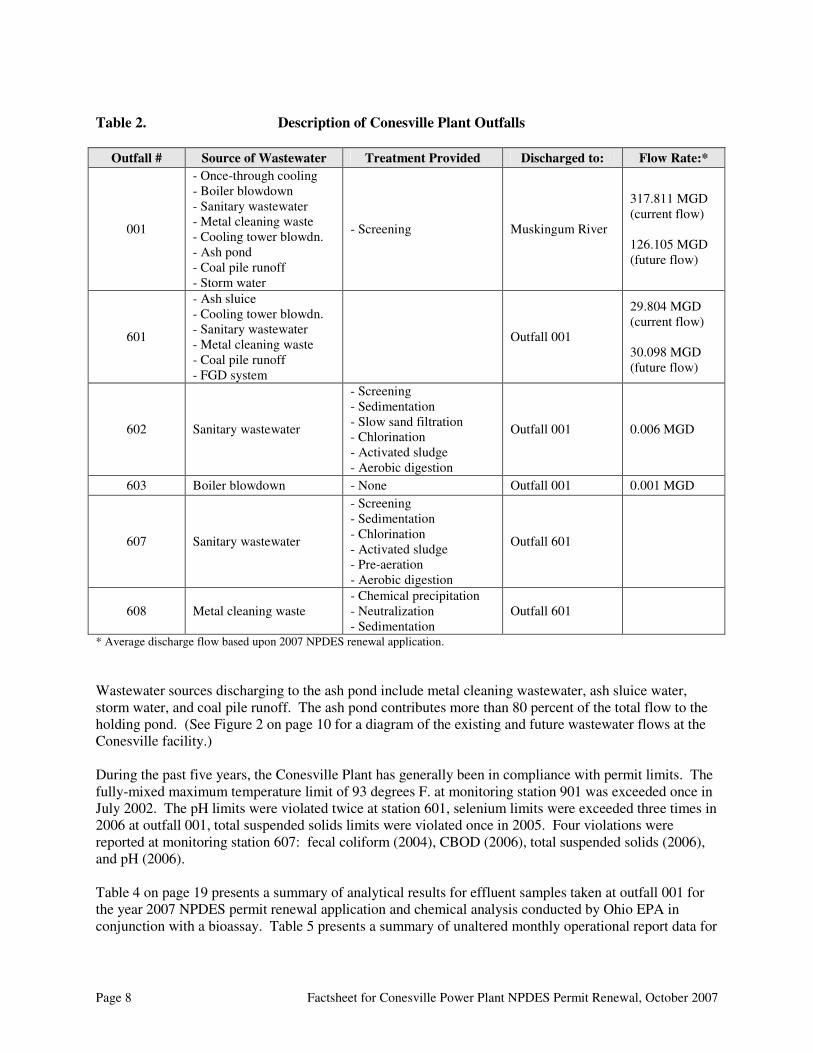
Table 2. Description of Conesville Plant Outfalls
Outfall # Source of Wastewater Treatment Provided Discharged to: Flow Rate:*
001
- Once-through cooling
- Boiler blowdown
- Sanitary wastewater
- Metal cleaning waste
- Cooling tower blowdn.
- Ash pond
- Coal pile runoff
- Storm water
- Screening Muskingum River
317.811 MGD
(current flow)
126.105 MGD
(future flow)
601
- Ash sluice
- Cooling tower blowdn.
- Sanitary wastewater
- Metal cleaning waste
- Coal pile runoff
- FGD system
Outfall 001
29.804 MGD
(current flow)
30.098 MGD
(future flow)
602 Sanitary wastewater
- Screening
- Sedimentation
- Slow sand filtration
- Chlorination
- Activated sludge
- Aerobic digestion
Outfall 001 0.006 MGD
603 Boiler blowdown - None Outfall 001 0.001 MGD
607 Sanitary wastewater
- Screening
- Sedimentation
- Chlorination
- Activated sludge
- Pre-aeration
- Aerobic digestion
Outfall 601
608 Metal cleaning waste
- Chemical precipitation
- Neutralization
- Sedimentation
Outfall 601
* Average discharge flow based upon 2007 NPDES renewal application.
Wastewater sources discharging to the ash pond include metal cleaning wastewater, ash sluice water,
storm water, and coal pile runoff. The ash pond contributes more than 80 percent of the total flow to the
holding pond. (See Figure 2 on page 10 for a diagram of the existing and future wastewater flows at the
Conesville facility.)
During the past five years, the Conesville Plant has generally been in compliance with permit limits. The
fully-mixed maximum temperature limit of 93 degrees F. at monitoring station 901 was exceeded once in
July 2002. The pH limits were violated twice at station 601, selenium limits were exceeded three times in
2006 at outfall 001, total suspended solids limits were violated once in 2005. Four violations were
reported at monitoring station 607: fecal coliform (2004), CBOD (2006), total suspended solids (2006),
and pH (2006).
Table 4 on page 19 presents a summary of analytical results for effluent samples taken at outfall 001 for
the year 2007 NPDES permit renewal application and chemical analysis conducted by Ohio EPA in
conjunction with a bioassay. Table 5 presents a summary of unaltered monthly operational report data for

Factsheet for Conesville Power Plant NPDES Permit Renewal, October 2007 Page 9
the period August 2002 through September 2006 for the Conesville Plant, as well as current permit limits,
and monthly average projected effluent quality (PEQavg) and daily maximum PEQmax values.
Anticipated Changes to Conesville Discharge
The permittee is planning to install additional environmental controls at the Conesville facility which will
result in changes to the characteristics of the wastewater discharge. A flue gas desulfurization (FGD)
system will be installed to remove sulfur dioxide from air emissions, and a selective catalytic reduction
(SCR) system is planned in order to remove nitrogen oxides. The waste material created by operation of
the FGD system will be discharged to a new treatment system which will include precipitation, primary
clarification, and secondary clarification. According to the permit application, this treatment system will
be, “…designed to remove solids, and will also remove some sulfates, some fluorides, and a large portion
of the particulate metals…” As shown in Figure 2, the wastewater from this process will be routed to the
existing ash pond while the dewatered solids will be removed to a landfill. The discharge to the ash pond
is expected to increase the loading of trace metals, including mercury.
The SCR treatment system utilizes ammonia, carbon dioxide, and water vapor to capture the nitrogen
oxides. It is possible that the discharge to the ash pond could increase in ammonia concentration due to
the operation of this system.
In late 2009, Conesville expects to retire the unit 3 generating unit. After the retirement of this unit, all of
the remaining generating units will operate with closed-cycle cooling, resulting in:
• a significant reduction in the discharge flow rate at outfall 001. The flow rate at outfall 001 will
be roughly equivalent to the flow rate at internal station 601;
• a significant reduction in the quantity of water withdrawn at the plant intake (Station 801).
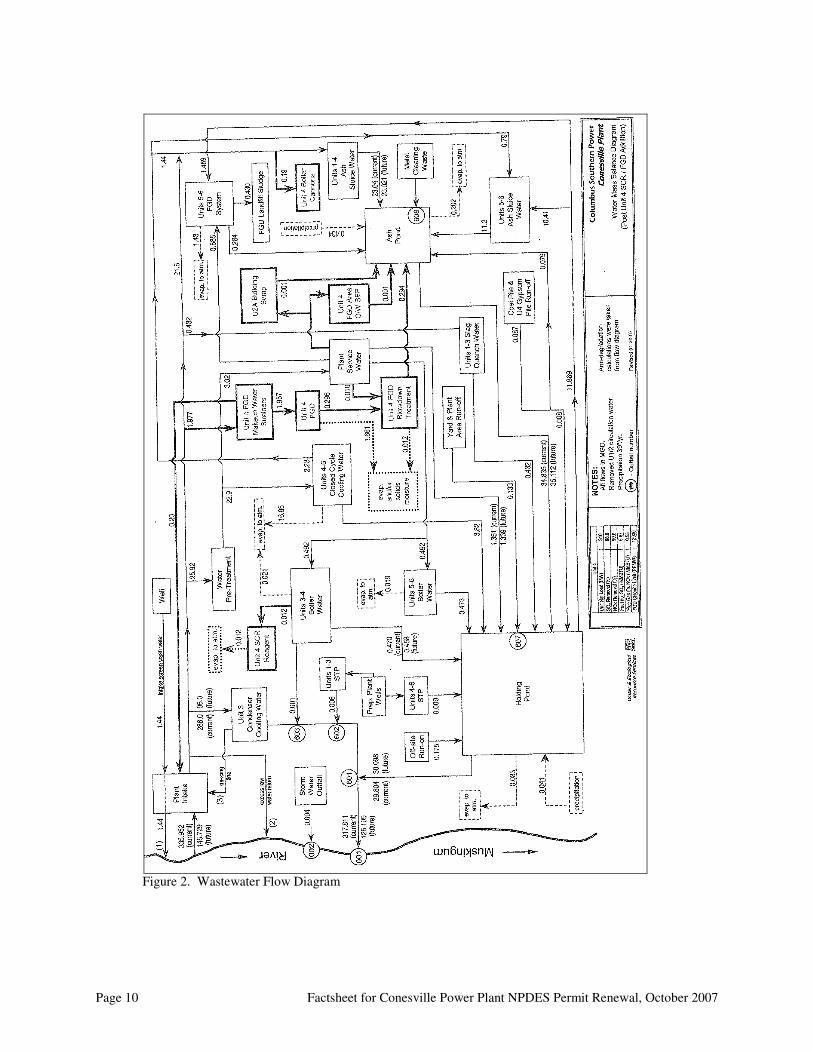
Page 10 Factsheet for Conesville Power Plant NPDES Permit Renewal, October 2007
Figure 2. Wastewater Flow Diagram
Factsheet for Conesville Power Plant NPDES Permit Renewal, October 2007 Page 11
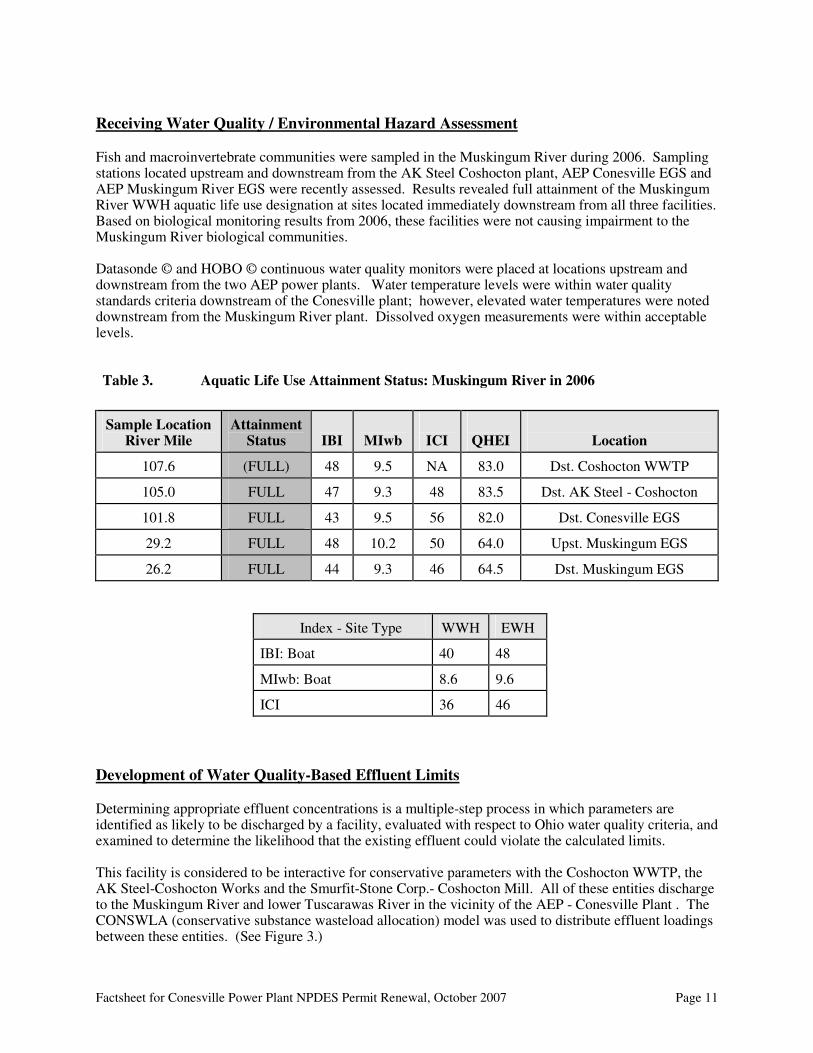
Receiving Water Quality / Environmental Hazard Assessment Fish and macroinvertebrate communities were sampled in the Muskingum River during 2006. Sampling stations located upstream and downstream from the AK Steel Coshocton plant, AEP Conesville EGS and AEP Muskingum River EGS were recently assessed. Results revealed full attainment of the Muskingum River WWH aquatic life use designation at sites located immediately downstream from all three facilities. Based on biological monitoring results from 2006, these facilities were not causing impairment to the Muskingum River biological communities. Datasonde © and HOBO © continuous water quality monitors were placed at locations upstream and downstream from the two AEP power plants. Water temperature levels were within water quality standards criteria downstream of the Conesville plant; however, elevated water temperatures were noted downstream from the Muskingum River plant. Dissolved oxygen measurements were within acceptable levels. Table 3. Aquatic Life Use Attainment Status: Muskingum River in 2006
Sample Location River Mile
Attainment Status
IBI
MIwb
ICI
QHEI
Location
107.6 (FULL) 48 9.5 NA 83.0 Dst. Coshocton WWTP
105.0 FULL 47 9.3 48 83.5 Dst. AK Steel - Coshocton
101.8 FULL 43 9.5 56 82.0 Dst. Conesville EGS
29.2 FULL 48 10.2 50 64.0 Upst. Muskingum EGS
26.2 FULL 44 9.3 46 64.5 Dst. Muskingum EGS
Index - Site Type WWH EWH
IBI: Boat 40 48
MIwb: Boat 8.6 9.6
ICI 36 46
Development of Water Quality-Based Effluent Limits
Determining appropriate effluent concentrations is a multiple-step process in which parameters are identified as likely to be discharged by a facility, evaluated with respect to Ohio water quality criteria, and examined to determine the likelihood that the existing effluent could violate the calculated limits. This facility is considered to be interactive for conservative parameters with the Coshocton WWTP, the AK Steel-Coshocton Works and the Smurfit-Stone Corp.- Coshocton Mill. All of these entities discharge to the Muskingum River and lower Tuscarawas River in the vicinity of the AEP - Conesville Plant . The CONSWLA (conservative substance wasteload allocation) model was used to distribute effluent loadings between these entities. (See Figure 3.)

Page 12 Factsheet for Conesville Power Plant NPDES Permit Renewal, October 2007
Parameter Selection
Effluent data for the Conesville
Power Plant were used to
determine what parameters should
undergo wasteload allocation.
The pollutants discharged are
identified by the data available to
Ohio EPA - Monthly Operating
Report (MOR) data submitted by
the permittee, compliance
sampling data collected by Ohio
EPA, and any other data
submitted by the permittee, such
as priority pollutant scans
required by the NPDES renewal
application or by pretreatment, or
other special conditions in the
NPDES permit. The sources of
effluent data are as follows: Self-monitoring data (LEAPS) August 2002 through September 2006
2.c. Application Data 2007 Ohio EPA data (compliance, survey) 2005-06
The effluent data were checked for outliers and one value for TDS of 1236 mg/l was removed. This data is evaluated statistically, and PEQ values are calculated for each pollutant. PEQavg values represent the 95
th percentile of monthly average data, and PEQmax values represent the 95
th percentile of all data points.
The average and maximum projected effluent quality (PEQ) values are presented in Table 6. For a summary of the screening results, refer to the parameter groupings on page 30.
PEQ values are used according to Ohio rules to compare to applicable WQS and allowable WLA values
for each pollutant evaluated. Initially, PEQ values are compared to the applicable average and maximum
WQS. If both PEQ values are less than 25 percent of the applicable WQS, the parameter does not have
the reasonable potential to cause or contribute to exceedances of WQS, and no wasteload allocation is
done for that parameter. If either the PEQavg or PEQmax is greater than 25 percent of the applicable WQS,
a wasteload allocation is conducted to determine whether the parameter exhibits reasonable potential (and
needs to be limited) or if monitoring is required.
Wasteload Allocation For those parameters that require a wasteload allocation (WLA), the results are based on the uses assigned
to the receiving waterbody in OAC 3745-1. Dischargers are allocated pollutant loadings/concentrations
based on the Ohio Water Quality Standards (WQS - OAC 3745-1). Most pollutants are allocated by a
mass-balance method because they do not degrade in the receiving water. Wasteload allocations using
this method are done using the following general equation: Discharger WLA = (downstream flow x
WQS) - (upstream flow x background concentration). Discharger WLAs are divided by the discharge
flow so that the WLAs are expressed as concentrations. However, as discussed previously, discharges
from the Conesville Power Plant are considered to be interactive with the Coshocton WWTP, the AK
Tuscarawas RiverWalhonding River
Muskingum River
002
003
004
Coshocton WWTP
AK Steel
American ElectricPower -Conesville
RM 1.04
RM 1.17
RM 0.4
RM 108.56
RM 105.88
RM 102.89
StoneContainer
Intake 801
Outfall 001
Figure 3. Muskingum River Study Area

Factsheet for Conesville Power Plant NPDES Permit Renewal, October 2007 Page 13
Steel-Coshocton Works and the Smurfit-Stone Corp.- Coshocton Mill and the WLAs have been
developed as such. The applicable waterbody uses for this facility’s discharge and the associated stream
design flows are as follows:
Aquatic life (WWH) Toxics (metals, organics, etc.) Average Annual 7Q10
Maximum Annual 1Q10 Ammonia-N Average Summer/winter 30Q10
Agricultural Water Supply Harmonic mean flow Human Health (nondrinking) Harmonic mean flow
Allocations are developed using a percentage of stream design flow (as specified in Table 8), and allocations cannot exceed the Inside Mixing Zone Maximum criteria. The data used in the WLA are listed in Tables 7 and 8. The wasteload allocation results to maintain all
applicable criteria are presented in Table 9.
Reasonable Potential After appropriate effluent limits are calculated by wasteload allocation, the lowest most restrictive
average and maximum values are selected from Table 9 and are referred to as Preliminary Effluent Limits
(PELavg and PELmax respectively). The reasonable potential of the discharger to exceed the wasteload
allocation (PEL values) is determined by comparing the PEQavg (Table 6) to the PELavg and the PEQmax to
the PELmax for each parameter. Based on this comparison, each parameter is placed in a defined “group”.
Parameters that do not have a water quality standard (WQS) or do not require a WLA based on the initial
screening are assigned to either group 1 or 2. Parameters are assigned to group 3, 4, or 5 depending on
how close the PEQ value is to the allocated value or PEL. The groupings listed in Table 10 reflect the
reasonable potential hazard assessment done according to WLA procedures.
Whole Effluent Toxicity WLA
Whole effluent toxicity or “WET” is the total toxic effect of an effluent on aquatic life measured directly
with a toxicity test. Acute WET measures short term effects of the effluent while chronic WET measures
longer term and potentially more subtle effects of the effluent.
Water Quality Standards for WET are expressed in Ohio’s narrative “free from” WQS rule (OAC 3745-1-
04(D)). These “free froms” are translated into toxicity units (TUs) by the associated WQS
Implementation Rule (OAC 3745-2-09). Wasteload allocations can then be calculated using TUs as if
they were water quality criteria.
The wasteload allocation calculations for WET are similar to those for aquatic life criteria (using the
chronic toxicity unit (TUc) and 7Q10 for average and the acute toxicity unit (TUa) and 1Q10 for
maximum). These values are the levels of effluent toxicity that should not cause instream toxicity during
critical low-flow conditions. For Conesville, the wasteload allocations are 0.54 TUa and 2.56 TUc
When the calculated acute AET is less than 1.0 TUa, Allowable Effluent Toxicity is defined as:
Dilution Ratio Allowable Effluent Toxicity

Page 14 Factsheet for Conesville Power Plant NPDES Permit Renewal, October 2007
(downstream flow to discharger flow) (percent effects in 100% effluent)
up to 2 to 1 30
greater than 2 to 1 but less than 2.7 to 1 40
2.7 to 1 to 3.3 to 1 50
The AET is 30 percent effects in 100 percent effluent based on the dilution ratio of 1 to 1.
Effluent Limits/Hazard Management Decisions The final effluent limits are determined by evaluating the groupings in conjunction with other applicable
rules and regulations. Tables 11-001, 11-091, 11-601, 11-602, 11-603, 11-604, 11-607, and 11-608 show
the draft NPDES limits and monitoring requirements for the Conesville Power Plant.
Federal and State laws/regulations require that dischargers meet both treatment-technology-based limits
and any more stringent standards needed to comply with state WQS. Permit limits are based on the more
restrictive of the two. Treatment-technology-based limits for Conesville, found in 40 CFR Part 423,
Steam Electric Power Generating Point Source Category, are based on the milligrams of pollutant allowed
to be discharged per liter.
The Conesville Power Plant’s NPDES permit application requested an increase in the discharge of
pollutants from outfall 001. As a result, an anti-degradation review has been conducted in association
with this permit renewal, and the Director of Ohio EPA has determined that a lowering of water quality in
the Muskingum River is necessary. In accordance with OAC 3745-1-05, this decision was reached only
after examining a series of technical alternatives, reviewing social and economic issues related to the
degradation, and considering all public and appropriate intergovernmental comments. On the following
four pages, a discussion of the limits and monitoring requirements for each outfall is presented in some
detail.
Outfall 001: Tables 11-001 and 11-091
Monitoring for water temperature, thermal discharge, pH, total dissolved residue, total residual
oxidants, flow rate, total residual chlorine, and duration of chlorination/bromination have been
continued in the draft permit. Since a large portion of the discharge from this outfall is non-contact
cooling water, it is important to monitor the temperature of the wastewater as it enters the Muskingum
River. Monitoring of the quantity of heat discharged is required in units of million BTUs per hour.
Total residual chlorine includes a limit of 0.2 milligrams per liter (mg/l), which allows chlorination at
this outfall for not more than two hours each day, and is based upon the Federal Effluent Guidelines
for steam-electric power plants. The limit of 0.05 mg/l for total residual oxidants, which is based upon
best professional judgement regarding the relative toxicity of bromine, allows the Conesville Plant to
discharge bromine or bromine and chlorine compounds for not more than two hours per day. The pH
limits are based upon water quality standards.
When the duration of chlorination and/or bromination exceeds two hours per day, more stringent
limits for total residual chlorine and total residual oxidants are proposed at 0.033 mg/l and 0.01 mg/l,
respectively. The limit for total residual oxidants is a continuation of existing permit limits, and best
professional judgement. The daily maximum as well as the 30-day average limits for total residual
chlorine are based upon the wasteload allocation. When the duration of chlorination/bromination

Factsheet for Conesville Power Plant NPDES Permit Renewal, October 2007 Page 15
exceeds two hours/day, the facility is required to report sample results for these parameters under
permit Table 091.
The Ohio EPA risk assessment places selenium, and total residual chlorine in group 5. This placement
indicates that an environmental hazard exists and limits for selenium are necessary to protect water
quality. The limits for selenium have been increased based upon the anti-degradation review, and
have also been adjusted based upon the projected decrease in the discharge rate from this outfall. The
limits developed in the wasteload allocation have been included for outfall 091 in the draft permit.
Mercury has also been placed in Group 5 as of November 2010 when the use of mixing zones to
determine wasteload allocations for bioaccumulative chemicals of concern (BCCs) will no longer be
allowed. For the time period prior to November 2010, mercury is placed in risk assessment category
Group 3 and monitoring only is proposed for the first three years of this permit. In November 2010,
limits for mercury will become effective with a monthly average limit of 12 ng/l. Conesville will be
required to use EPA Method 1631 (or EPA Method 245.7) to analyze samples for mercury.1
The Ohio EPA risk assessment places iron in group 4. This placement as well as the data in Tables 5
and 6 support that this pollutant should not pose environmental hazards and limits are not necessary to
protect water quality. Monitoring is proposed at a frequency of once per month to provide a larger
dataset to ensure that iron is not a parameter of concern at this outfall.
The Ohio EPA risk assessment places a number of parameters in groups 2 and 3. This placement as
well as the data in Tables 5 and 6 support that these pollutants should not pose environmental hazards
and limits are not necessary to protect water quality. Monitoring for these parameters is optional, and
Ohio EPA believes it is not warranted for the majority of these pollutants. However, monitoring
requirements have been continued for total dissolved based upon the reported sample results and the
expectation that the discharge will continue to include this pollutant, especially with the start-up of the
FGD wastewater treatment system for unit 4.
1 In November 2010, the use of mixing zones to determine the waste load allocation for bioaccumulative
chemicals of concern (BCCs) will no longer be allowed. This means that limits for BCCs after November 2010
must meet water quality standards with no allowances for dilution. Since mercury is considered a BCC, the use of
Method 1631 should be used in order to properly evaluate reasonable potential for the subsequent permit renewal.

Page 16 Factsheet for Conesville Power Plant NPDES Permit Renewal, October 2007
Mercury Variance at Outfall 001
In order to comply with the mercury limits discussed above, the permittee has applied for coverage
under the general mercury variance, Rule 3745-33-07(D)(10) of the Ohio Administrative Code. Based
on the results of low-level mercury monitoring, the permittee has determined that its discharge cannot
meet the 30-day average water quality-based effluent limit (WQBEL) of 12 nanograms per liter (ng/l).
However, the permittee believes that the facility will be able to achieve an annual average mercury
effluent concentration of 12 ng/l. The variance application also demonstrated to the satisfaction of
Ohio EPA that there is no readily apparent means of complying with the WQBEL without
constructing prohibitively expensive end-of-pipe controls for mercury. Based on these factors, the
permittee is eligible for coverage under the general mercury variance.
Ohio EPA has reviewed the mercury variance application and has determined that it meets the
requirements of the Ohio Administrative Code. Items X and Y in Part II of the draft NPDES permit
list the provisions of the mercury variance, and includes the following requirements:
• A variance-based monthly average effluent limit of 167 ng/l, which was developed from
sampling data analyzed by the permittee;
• A requirement that the permittee make reasonable progress to meet the water quality-based
effluent limit for mercury by implementing the plan of study, which has been developed as
part of the Pollutant Minimization Program (PMP);
• Low-level mercury monitoring of the plant’s influent and effluent;
• A requirement that the annual average mercury effluent concentration is less than or equal to
12 ng/l as specified in the plan of study;
• A summary of the elements of the plan of study;
• A requirement to submit an annual report on implementation of the PMP; and
• A requirement for submittal of a certification stating that all permit conditions related to
implementing the plan of study and the PMP have been satisfied, but that compliance with the
monthly average water quality-based effluent limit for mercury has not been achieved.
Outfall 601: Table 11-601
The draft permit includes limits for total suspended solids, oil and grease, and pH, which are all a
continuation of the existing permit limits. A limit for total residual chlorine has replaced a limit for
free available chlorine. In addition, another table has been added to the permit (station 691) for
reporting total residual chlorine when discharge of chlorinated cooling tower blowdown into the
holding pond exceeds two hours per day. Limits for total suspended solids, oil and grease, and pH are
based upon Federal Effluent Guidelines for steam-electric power plants. Monitoring only is included
for total precipitation, total dissolved residue, and flow rate which is also a continuation of existing
permit requirements.
Outfall 602: Table 11-602
The draft permit includes limits for total suspended solids, oil and grease, pH, fecal coliform, and
CBOD5 at this outfall which discharges sanitary wastewater. These requirements are a continuation of
existing permit limits.

Factsheet for Conesville Power Plant NPDES Permit Renewal, October 2007 Page 17
Outfall 603: Table 11-603
This outfall discharges boiler blowdown. The limits for total suspended solids and oil and grease are
proposed to continue from the existing permit, and are based upon Federal Effluent Guidelines for
steam-electric power plants.
Outfall 604: Table 11-604
This outfall will monitor the discharge from the FGD chloride purge stream WWTP which will treat
wastewater from the unit 4. The parameters to be monitored at this outfall are based upon best
professional judgement and the expected pollutants identified in documents submitted by the
permittee. Another monitoring station (station 605) has been added to monitor the concentration of
mercury prior to treatment at the FGD chloride purge stream WWTP.
Outfall 607: Table 11-607
This outfall also discharges sanitary wastewater. The draft permit includes limits for total suspended
solids, pH, fecal coliform, and CBOD which are all a continuation of existing permit limits.
Outfall 608: Table 11-608
Metal cleaning wastewater is discharged from this outfall. The draft permit includes limits for copper
and iron based upon Federal Effluent Guidelines. These limits and monitoring for pH and flow rate
are all a continuation of existing permit requirements.
Whole Effluent Toxicity
Ohio EPA conducted a bioassay for whole effluent toxicity at outfall 001 in November 2005 at the
Conesville Generating Station, and found no evidence of acute toxicity. Biomonitoring is not
recommended at this time as a permit requirement.
Thermal Management Plan
The existing thermal management plan for the Conesville Generating Station provides a variance to water
quality standards for temperature. As a part of renewing this permit, the requirements of the thermal
management plan were reviewed as well as the available biological and temperature data for the
Muskingum River in the vicinity of the Conesville facility. Biological data shows that the Muskingum
River is in attainment of use designation both upstream and downstream of the thermal discharge. The
most recent evidence of this attainment status is based upon sampling conducted during the summer of
2006 by Ohio EPA. These results are consistent with those found in earlier years as well. It appears that
elevated temperature conditions within the Conesville thermal plume may cause short-term avoidance of
some thermally-sensitive fish species (or may impair thermally-sensitive fish life history stages).
However, biological criteria are generally being maintained, and biological indices did not differ
significantly between discharge and upstream locations under summer low flow/high temperature
conditions.

Page 18 Factsheet for Conesville Power Plant NPDES Permit Renewal, October 2007
Temperature data was examined for the years 1995 through 2006 for the Conesville facility, and in
general, showed that all permit conditions in the thermal management plan are being met downstream of
the discharge. Temperature never exceeded 93º F. and average summer temperature never exceeded 87º
F. during this period.
Based upon this review and analysis, Ohio EPA does not believe there is any justification for relaxation or
more stringent thermal management plan requirements.
Section 316(b) Data Submittal
Under rules which were promulgated July 9, 2004 under Section 316(b) of the federal Clean Water Act
(33 U.S.C. section 1326), the permittee was required to collect and/or compile the following information
pertaining to the facility’s cooling water intake structure(s):
- source water physical data [40 CFR 122.21(r)(2)];
- cooling water intake structure data [40 CFR 122.21(r)(3)];
- cooling water system data [40 CFR 122.21(r)(5)]; and
- rates of impingement and/or entrainment of fish and shellfish at the facility’s cooling water intake
structure(s) based upon sampling conducted at the facility.
The permit requires all of this information listed above to be submitted with the permittee’s next NPDES
permit renewal application unless federal rules are promulgated which require the submittal of the
information at an earlier date.
Other Permit Requirements
Operator certification requirements have been included in Part II, Items W and AE of the permit in
accordance with rules adopted in December 2006. These rules require the Conesville Generating Plant
to meet the rule requirements for a Class A wastewater treatment plant for the sewage treatment plant
operations discharging through outfalls 602 and 607 when the permit is renewed or modified after
December 21, 2008. The facility is also required to designate an operator in charge of sewage
treatment plant operations in accordance with rule 3745-7-02 of the Ohio Administrative Code.
Part II of the permit also includes requirements for signs to be placed at each outfall discharging to the
Muskingum River, providing information about the discharge. Signage at outfalls is required pursuant
to Ohio Administrative Code 3745-33-08(A). Requirements for monitoring sludge removed from the
facility have been added to Part II of the permit to address sampling procedures and reporting.

Factsheet for Conesville Power Plant NPDES Permit Renewal, October 2007 Page 19
Table 4. Concentrations of Chemicals Found in Outfall 001 Effluent
2007 Permit Application Renewal Form 2C ------------------------------------Effluent------------------- Ohio EPA Bioassay
Parameter No. of Samples Average* Maximum 11/28/2005
Outfall 001
Aluminum (ug/l) 1 290. < 200.
Ammonia (mg/l) 1 0.1 0.112
Antimony (ug/l) 1 0.2
Arsenic (ug/l) 1 2. 2.
Barium (ug/l) 1 47.7. 52.
Boron (ug/l) 1 152. NA
Calcium (mg/l) NA 75.
Chloride (mg/l) NA 70.2
Chlorine, Total Residual (mg/l) 1 0.0785
Chromium (ug/l) 1 1. < 30.
Cobalt (ug/l) 1 0.6
Copper (ug/l) 1 3.8 < 10.
Diethylphthalate (ug/l) NA 5.9
Fluoride (mg/l) 1 0.33 NA
Iron (ug/l) 1 679. 878.
Lead (ug/l) 1 0.9 < 2.
Magnesium (mg/l) 1 22.7 24.
Manganese (ug/l) 1 112. 218.
Mercury (ng/l) 24 19.06 44.8 < 200.
Molybdenum (ug/l) 1 4.3. NA
Nitrate-Nitrite as N (mg/l) 1 2.4 1.97
Nickel (ug/l) 1 3.3 < 40.
Phenols (ug/l) 1 2. < 100.
Phosphorus (mg/l) 1 0.3 0.125
Selenium (ug/l) 44 1.7 67. < 2.
Strontium (ug/l) NA 346.
Sulfate (mg/l) 1 210. NA
Titanium (ug/l) 1 5. NA
TKN (mg/l) NA 0.51
Total Dissolved Solids (mg/l) NA 468.
Total Suspended Solids (mg/l) 1 11.6 5.
Zinc (ug/l) 1 58.5 11.

Page 20 Factsheet for Conesville Power Plant NPDES Permit Renewal, October 2007
Table 5. Effluent Characterization and Decision Criteria: 2002-2006
Summary of analytical results for Outfalls 001, 589, 601, 602, 603, 607, 801, 802, and 901. Decision Criteria: PEQavg = monthly averages; PEQmax = daily
maximum analytical results.
Current Permit Limits Percentiles Decision Criteria
Parameter Season Units 30 day Daily # Obs. 50th
95th
Data Range # Obs. PEQave PEQmax
Outfall 001
Water Temperature Annual F -- -- 1826 75.6 102 31.4-109
Thermal Discharge Annual Million BTU/Hr -- -- 732 1430 3010 105-4210
pH Annual S.U. 6.5 <= pH <= 9.0 280 7.8 8.22 6.61-8.86
Residue, Total Dissolved Annual mg/l -- -- 19 402 673 278-1240 14 499.5 614.
Residue, Total Dissolved Annual kg/day -- -- 19 345000 793000 218000-1460000
Selenium, Total Recoverable Annual ug/l 5.6 -- 73 0 12.6 0-67 73 23.316 26.406
Selenium, Total Recoverable Annual kg/day 2.67 -- 73 0 9.73 0-11.6
Flow Rate Summer MGD 920 209 311 79.9-506
Flow Rate Winter MGD 906 260 311 28.8-355
Flow Rate Annual MGD -- -- 1826 238 311 28.8-506
Mercury, Total (Low Level) Annual ng/l -- -- 53 14.2 40.4 2.17-44.8 50 32 44
Mercury, Total (Low Level) Annual kg/day -- -- 53 0.0127 0.0302 0.00121-0.0434
Outfall 589
Sludge Weight Annual Dry Tons -- -- 15 0.063 1.32 0.006-1.96
Sludge Solids, Percent Total Annual % -- -- 15 0.3 14.2 0.06-27
Sludge Solids, Percent Volatile Annual % -- -- 15 64.9 84 8.47-90.4

Factsheet for Conesville Power Plant NPDES Permit Renewal, October 2007 Page 21
Table 5. Effluent Characterization and Decision Criteria: 2002-2006
Summary of analytical results for Outfalls 001, 589, 601, 602, 603, 607, 801, 802, and 901. Decision Criteria: PEQavg = monthly averages; PEQmax = daily
maximum analytical results.
Current Permit Limits Percentiles Decision Criteria
Parameter Season Units 30 day Daily # Obs. 50th
95th
Data Range # Obs. PEQave PEQmax
Outfall 601
Total Precipitation Annual Inches -- -- 1400 0 0.7 0-3.3
pH Annual S.U. 6.0 <= pH <= 9.0 575 7.12 8.14 6.22-11
Residue, Total Dissolved Annual mg/l -- -- 17 1030 1490 377-2000
Total Suspended Solids Annual mg/l 30 100 1228 15 28 2-92
Oil and Grease, Total Annual mg/l 7 0 0 0-0 Oil and Grease, Hexane Extr Method Annual mg/l 15 20 54 0 3 0-3
Flow Rate Summer MGD 638 16.5 24.3 0.24-36
Flow Rate Winter MGD 595 17.4 24.3 0.022-44.7
Flow Rate Annual MGD -- -- 1233 17.4 24.3 0.022-44.7
Chlorine, Free Available Annual mg/l -- 0.085 263 0 0.04 0-0.07
Outfall 602
Flow Rate Summer GPD 823 5350 9430 1.2-26000
Flow Rate Winter GPD 740 4540 9610 359-121000
Flow Rate Annual GPD -- -- 1563 4990 9550 1.2-121000
pH Annual S.U. 6.0 <= pH <= 9.0 62 7.05 7.59 6-8.01
Total Suspended Solids Annual mg/l 12 18 60 3 11 0-15
Fecal Coliform Annual #/100 ml 1000 2000 31 0 108 0-212
Flow Rate Summer MGD 92 0.004 0.005 0.002-0.007
Flow Rate Winter MGD 120 0.003 0.004 0.001-0.011
Flow Rate Annual MGD 212 0.003 0.005 0.001-0.011
CBOD 5 day Summer mg/l 10 15 31 3 6 0-7

Page 22 Factsheet for Conesville Power Plant NPDES Permit Renewal, October 2007
Table 5. Effluent Characterization and Decision Criteria: 2002-2006
Summary of analytical results for Outfalls 001, 589, 601, 602, 603, 607, 801, 802, and 901. Decision Criteria: PEQavg = monthly averages; PEQmax = daily
maximum analytical results.
Current Permit Limits Percentiles Decision Criteria
Parameter Season Units 30 day Daily # Obs. 50th
95th
Data Range # Obs. PEQave PEQmax
CBOD 5 day Winter mg/l 10 15 31 3 9 0-14
Outfall 603
Flow Rate Summer GPD 70 15800 45500 990-53500
Flow Rate Winter GPD 52 18100 50700 5940-83200
Flow Rate Annual GPD -- -- 122 16500 46500 990-83200
Total Suspended Solids Annual mg/l 30 100 83 1.1 18.2 0-34
Oil and Grease, Total Annual mg/l 10 0 0 0-0 Oil and Grease, Hexane Extr Method Annual mg/l 15 20 74 1 2 0-3
Flow Rate Summer MGD 6 0.026 0.0418 0.013-0.042
Flow Rate Winter MGD 12 0.013 0.0345 0.01-0.04
Flow Rate Annual MGD 18 0.02 0.0412 0.01-0.042
Outfall 607
Flow Rate Summer GPD 828 18600 21800 3050-32600
Flow Rate Winter GPD 779 18600 18600 2590-24900
Flow Rate Annual GPD -- -- 1607 18600 19900 2590-32600
pH Annual S.U. 6.0 <= pH <= 9.0 63 7.23 7.99 6.4-8.2
Total Suspended Solids Annual mg/l 30 45 66 13 37 1-45
Fecal Coliform Annual #/100 ml 1000 2000 32 7.5 740 0-8100
Flow Rate Summer MGD 92 0.011 0.016 0.008-0.019
Flow Rate Winter MGD 120 0.01 0.0131 0.005-0.019

Factsheet for Conesville Power Plant NPDES Permit Renewal, October 2007 Page 23
Table 5. Effluent Characterization and Decision Criteria: 2002-2006
Summary of analytical results for Outfalls 001, 589, 601, 602, 603, 607, 801, 802, and 901. Decision Criteria: PEQavg = monthly averages; PEQmax = daily
maximum analytical results.
Current Permit Limits Percentiles Decision Criteria
Parameter Season Units 30 day Daily # Obs. 50th
95th
Data Range # Obs. PEQave PEQmax
Flow Rate Annual MGD 212 0.01 0.016 0.005-0.019
CBOD 5 day Summer mg/l 25 40 31 4 10.5 0-17
CBOD 5 day Winter mg/l 25 40 30 8.5 16 2-125
Outfall 801
Water Temperature Annual F 702 70.8 80.4 42.9-88.5
Outfall 802
Flow Rate Summer MGD 732 2020 10200 367-15300
Flow Rate Winter MGD 0 0 0 0-0
Flow Rate Annual MGD 732 2020 10200 367-15300
Outfall 901
Water Temperature Annual F 701 73.6 90 43.1-94.9
Page 24 Factsheet for Conesville Power Plant NPDES Permit Renewal, October 2007
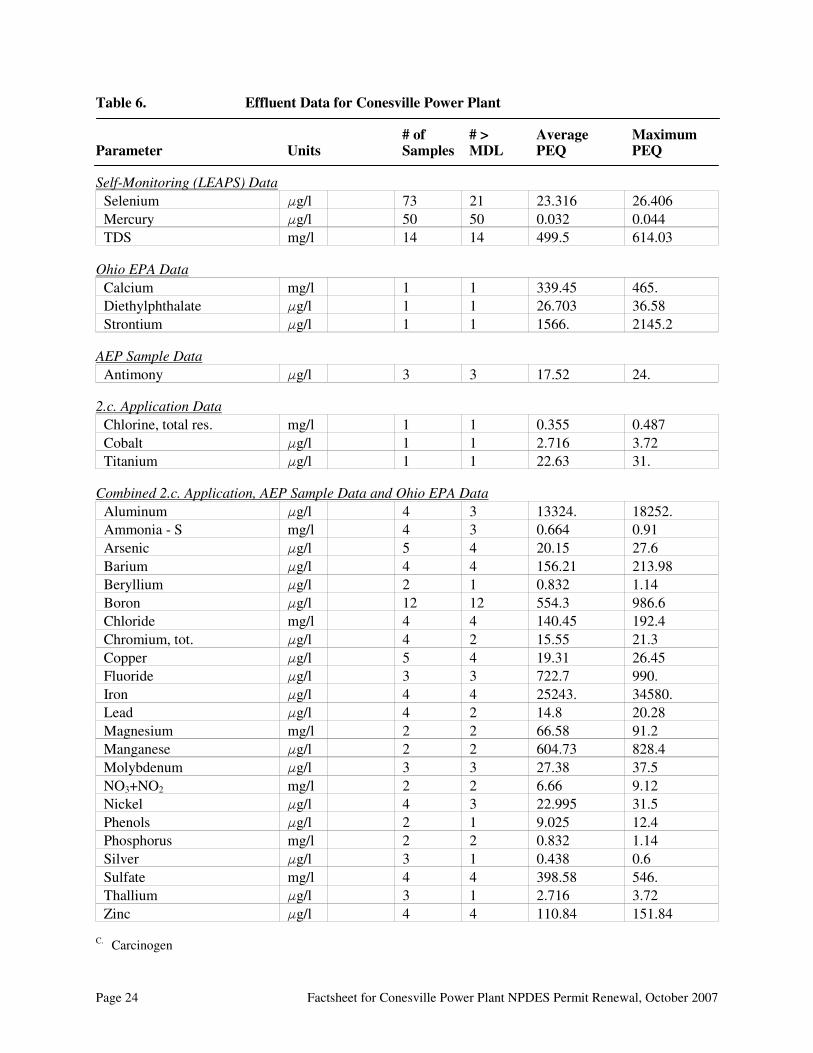
Table 6. Effluent Data for Conesville Power Plant # of # > Average Maximum Parameter Units Samples MDL PEQ PEQ Self-Monitoring (LEAPS) Data
Selenium Fg/l 73 21 23.316 26.406
Mercury Fg/l 50 50 0.032 0.044
TDS mg/l 14 14 499.5 614.03 Ohio EPA Data
Calcium mg/l 1 1 339.45 465.
Diethylphthalate Fg/l 1 1 26.703 36.58
Strontium Fg/l 1 1 1566. 2145.2 AEP Sample Data
Antimony Fg/l 3 3 17.52 24.
2.c. Application Data
Chlorine, total res. mg/l 1 1 0.355 0.487
Cobalt Fg/l 1 1 2.716 3.72
Titanium Fg/l 1 1 22.63 31. Combined 2.c. Application, AEP Sample Data and Ohio EPA Data
Aluminum Fg/l 4 3 13324. 18252.
Ammonia - S mg/l 4 3 0.664 0.91
Arsenic Fg/l 5 4 20.15 27.6
Barium Fg/l 4 4 156.21 213.98
Beryllium Fg/l 2 1 0.832 1.14
Boron Fg/l 12 12 554.3 986.6
Chloride mg/l 4 4 140.45 192.4
Chromium, tot. Fg/l 4 2 15.55 21.3
Copper Fg/l 5 4 19.31 26.45
Fluoride Fg/l 3 3 722.7 990.
Iron Fg/l 4 4 25243. 34580.
Lead Fg/l 4 2 14.8 20.28
Magnesium mg/l 2 2 66.58 91.2
Manganese Fg/l 2 2 604.73 828.4
Molybdenum Fg/l 3 3 27.38 37.5
NO3+NO2 mg/l 2 2 6.66 9.12
Nickel Fg/l 4 3 22.995 31.5
Phenols Fg/l 2 1 9.025 12.4
Phosphorus mg/l 2 2 0.832 1.14
Silver Fg/l 3 1 0.438 0.6
Sulfate mg/l 4 4 398.58 546.
Thallium Fg/l 3 1 2.716 3.72
Zinc Fg/l 4 4 110.84 151.84 C.
Carcinogen

Factsheet for Conesville Power Plant NPDES Permit Renewal, October 2007 Page 25
Table 7. Water Quality Criteria in the Study Area Outside Mixing Zone Criteria Inside Average Maximum Mixing Human Agri- Aquatic Aquatic Zone Parameter Units Health culture Life Life Maximum All Segments
Antimony Fg/l 4300. -- 190. 900. 1800.
Arsenic Fg/l -- 100. 150. 340. 680.
Barium Fg/l -- -- 220. 2000. 4000.
Bis(2-Ethylhexyl)phthalate Fg/l 59. -- 8.4 1100. 2100.
Boron Fg/l -- -- 950. 8500. 17000.
Chlorine, tot. res. Fg/l -- -- 11. 19. 38.
Chromium +6, diss. Fg/l -- -- 11. 16. 31.
Cyanide, free Fg/l 220000. -- 12. 46. 92.
Diethylphthalate Fg/l 120000. -- 220. 980. 2000.
Fluoride Fg/l -- 2000. -- -- --
gamma BHC Fg/l 0.63 -- 0.057 0.95 1.9
Isopropylbenzene Fg/l -- -- 4.8 43. 86.
Iron Fg/l -- 5000. -- -- --
Mercury A Fg/l 0.012 10. 0.91 1.7 3.4
Molybdenum Fg/l -- -- 20000. 190000. 370000.
NO3+NO2 mg/l -- 100. -- -- --
Naphthalene Fg/l -- -- 21. 170. 340.
Phenol Fg/l 4600000. -- 400. 4700. 9400.
Selenium Fg/l 11000. 50. 5.0 -- --
Strontium Fg/l -- -- 5300. 48000. 95000.
Thallium Fg/l 6.3 -- 17. 79. 160.
Tetrachloroethylene Fg/l 89. -- 53. 430. 850.
Total Dissolved Solids mg/l -- -- 1500. -- – Below CSP -Conesville
Ammonia S mg/l -- -- 0.6 -- --
Ammonia W mg/l -- -- 4.0 -- --
Beryllium Fg/l 280. 100. 66. 560. 1100.
Cadmium Fg/l -- 50. 5.9 16. 32.
Chromium, tot. Fg/l -- 100. 210. 4500. 9000.
Copper Fg/l 1300. 500. 24. 40. 80.
Lead Fg/l -- 100. 27. 510. 1000.
Nickel Fg/l 4600. 200. 130. 1200. 2400.
Silver Fg/l -- -- 1.3 11. 22.
Zinc Fg/l 69000. 25000. 310. 310. 620. A Bioaccumulative Chemical of Concern (BCC)

Page 26 Factsheet for Conesville Power Plant NPDES Permit Renewal, October 2007
Table 8. Instream Conditions and Discharger Flow Parameter Units Value Basis Tuscarawas River 7Q10 cfs annual 271. USGS gage #03129000, 1937-97 data 1Q10 cfs annual 258. USGS gage #03129000, 1937-97 data 30Q10 cfs summer 310. USGS gage #03129000, 1937-97 data
winter 549. USGS gage #03129000, 1937-97 data
Harmonic Mean Flow cfs annual 1092. USGS gage #03129000, 1937-97 data Mixing Assumption % average 97 Stream-to-discharge ratio
% maximum 97 Stream-to-discharge ratio Walhonding River 7Q10 cfs annual 233. USGS gage #03138500, 1937-91 data
1Q10 cfs annual 94.1 USGS gage #03138500, 1937-91 data 30Q10 cfs summer 279. USGS gage #03138500, 1937-91 data
winter 417. USGS gage #03138500, 1937-91 data
Harmonic Mean Flow cfs annual 836. USGS gage #03138500, 1937-91 data Mixing Assumption % average 97 Stream-to-discharge ratio
% maximum 97 Stream-to-discharge ratio Instream Temperature
oC
Below Smurfit-Stone summer 25.6 STORET; 13 values, 1988-94 winter 4.5 BWQR; 57 values
Below Coshocton WWTP summer 25.5 STORET; 34 values, 1988-98 winter 3.0 STORET; 19 values, 1988-94
Below AK Steel summer 25.2 STORET; 11 values, 1988-94 winter 3.0 STORET; 19 values, 1988-94
Below AEP Conesville summer 28.5 LEAPS 901; 610 values, 2001-05 winter 4.5 BWQR; 57 values
Instream pH S.U. Below Smurfit-Stone summer 8.21 STORET; 12 values, 1988-94
winter 8.2 BWQR; 46 values Below Coshocton WWTP summer 8.2 STORET; 27 values, 1988-98
winter 7.8 STORET; 13 values, 1988-94 Below AK Steel summer 8.1 STORET; 10 values, 1988-94
winter 7.8 STORET; 13 values, 1988-94 Below AEP Conesville summer 8.1 LEAPS; 94 values, 2001-2005
winter 7.9 LEAPS; 64 values, 2001-2005 Instream Hardness mg/l Below Smurfit-Stone annual 296. STORET; 26 values, 1994-2005 Below Coshocton WWTP annual 254. LEAPS 901; 26 values, 2001-03 Below AK Steel annual 289. STORET; 15 values, 1988-94 Below CSP -Conesville annual 305. STORET; 15 values, 1988-94

Factsheet for Conesville Power Plant NPDES Permit Renewal, October 2007 Page 27
Table 8. Instream Conditions and Discharger Flow (continued) Parameter Units Value Basis Background Water Quality All Segments Bis(2-Ethylhexyl) phthalate Fg/l annual 0. No representative data available. Boron Fg/l annual 0. No representative data available. Chlorine, total res. Fg/l annual 0. No representative data available. Chromium
+6, diss. Fg/l annual 0. No representative data available.
Cyanide, free Fg/l annual 0. No representative data available. Fluoride Fg/l annual 0. No representative data available. gamma BHC Fg/l annual 0. No representative data available. Isopropylbenzene Fg/l annual 0. No representative data available. Molybdenum Fg/l annual 0. No representative data available. Mercury Fg/l annual 0. No representative data available.
Naphthalene Fg/l annual 0. No representative data available. Selenium Fg/l annual 0. No representative data available. Silver Fg/l annual 0. No representative data available. Strontium Fg/l annual 0. No representative data available. Tetrachloroethyl. Fg/l annual 0. No representative data available. Thallium Fg/l annual 0. No representative data available. Tuscarawas River Ammonia mg/l summer 0.043 STORET; 5 values, 3<MDL, 1988-94 winter 0.043 STORET; 5 values, 3<MDL, 1988-94 Arsenic Fg/l annual 0. No representative data available. Barium Fg/l annual 0. No representative data available. Cadmium Fg/l annual 0. STORET; 5 values, 5<MDL, 1988-94 Chromium, tot. Fg/l annual 0. STORET; 5 values, 5<MDL, 1988-94 Copper Fg/l annual 0. STORET; 5 values, 5<MDL, 1988-94 Iron Fg/l annual 870. BWQR; 562 values,0<MDL Lead Fg/l annual 1.8 STORET; 5 values, 4<MDL, 1988-94 Nickel Fg/l annual 0. STORET; 5 values, 5<MDL, 1988-94
NO3+NO2 mg/l annual 1.24 STORET; 4 values, 0<MDL, 1988-94 TDS mg/l annual 638. STORET; 4 values, 0<MDL, 1988-94 Zinc Fg/l annual 30.8 STORET; 5 values, 2<MDL, 1988-94 Walhonding River Ammonia mg/l summer 0.025 STORET; 21 values, 16<MDL, ‘88-94 winter 0.025 STORET; 21 values, 16<MDL, ‘88-94 Arsenic Fg/l annual 2.0 STORET; 16 values, 6<MDL, ‘88-94 Barium Fg/l annual 65. STORET; 10 values, 0<MDL, 1988 Cadmium Fg/l annual 0.1 STORET; 21 values, 20<MDL, ‘88-94 Chromium, tot. Fg/l annual 0. STORET; 19 values, 19<MDL, ‘88-94 Copper Fg/l annual 0. STORET; 19 values, 19<MDL, ‘88-94 Iron Fg/l annual 1030. STORET; 15 values, 0<MDL, ‘88-94 Lead Fg/l annual 1.0 STORET; 21 values, 16<MDL, ‘88-94 Nickel Fg/l annual 0. STORET; 19 values, 19<MDL, ‘88-94
NO3+NO2 mg/l annual 1.2 STORET; 21 values, 0<MDL, 1988-94 TDS mg/l annual 328. STORET; 21 values, 0<MDL, 1988-94 Zinc Fg/l annual 5.0 STORET; 19 values, 12<MDL, ‘88-94

Page 28 Factsheet for Conesville Power Plant NPDES Permit Renewal, October 2007
Table 8. Instream Conditions and Discharger Flow (continued) Parameter Units Value Basis Discharge Flows cfs outfall # Coshocton WWTP 001 6.81 DSW AK Steel 001 3.09 DSW CSP -Conesville 001 195. CSP
801 (Intake) 225. CSP Smurfit-Stone 002 11.9 DSW 003 3.71 DSW 004 0.42 DSW

Factsheet for Conesville Power Plant NPDES Permit Renewal, October 2007 Page 29
Table 9. Summary of Effluent Limits to Maintain Applicable Water Quality Criteria
Average Maximum Inside
Human Agri Aquatic Aquatic Mixing Zone
Parameter Units Health Supply Life Life Maximum
Ammonia Summer mg/l -- -- 1.7 -- –
Winter mg/l -- -- 19. -- –
Barium Fg/l -- -- 470. 3283. 4000.
Boron Fg/l -- -- 2435. 15170. 17000.
Chlorine, tot. res. Fg/l -- -- 27. 33. 38.
Copper Fg/l 11340.A 4361.
A 56.
66.
80.
Fluoride Fg/l -- 19080. -- -- –
Iron Fg/l -- 38980. -- -- –
Lead Fg/l -- 925. 64. 880. 1000.
Mercury C Fg/l 0.1 94.
A 2.2 2.9 3.4
Selenium Fg/l 104900. 477. 12. -- –
Silver Fg/l -- -- 3.2 19. 22.
Strontium Fg/l -- -- 13560. 85650. 95000.
Thallium Fg/l 60. -- 42. 138. 160.
TDS mg/l -- -- 2927. -- –
Zinc Fg/l 636700.A 230600.
A 726.
A 513. 620.
A Allocation must not exceed the Inside Mixing Zone Maximum.
C Bioaccumulative Chemical of Concern (BCC); no mixing zone allowed after 11/15/2010, WQS must be met at
end-of-pipe; unless the requirements for an exception are met as listed in 3745-2-08(L).

Page 30 Factsheet for Conesville Power Plant NPDES Permit Renewal, October 2007
Table 10. Parameter Assessment
Group 1: Due to a lack of criteria, the following parameters could not be evaluated at this time.
Aluminum Calcium Chloride
Magnesium Manganese Phosphorus
Sulfate Titanium
Group 2: PEQ < 25% of WQS or all data below minimum detection limit; WLA not required. No limit
recommended, monitoring optional.
Antimony Arsenic Beryllium
Chromium, tot. Cobalt Diethylphthalate
Molybdenum Nickel NO3+NO2
Phenol
Group 3: PEQmax < 50% of maximum PEL and PEQavg < 50% of average PEL. No limit recommended,
monitoring optional.
Ammonia Barium Boron
Copper Fluoride Lead
Silver Mercury ( before 11/15/2010) Strontium
TDS Thallium Zinc
Group 4: PEQmax > 50% but <100% of the maximum PEL or PEQavg > 50% but < 100% of the average
PEL. Monitoring is appropriate.
Iron
Group 5: Maximum PEQ > 100% of the maximum PEL or average PEQ > 100% of the average PEL, or
either the average or maximum PEQ is between 75 and 100% of the PEL and certain
conditions that increase the risk to the environment are present. Limit recommended.
Limits to Protect Numeric Water Quality Criteria
Applicable Recommended Effluent Limits
Parameter Units Period Average Maximum
Chlorine, tot. res. Fg/l annual 27. 33.
Mercury (after 11/15/2010) Fg/l annual 0.012 1.7
Selenium Fg/l annual 12. –

Factsheet for Conesville Power Plant NPDES Permit Renewal, October 2007 Page 31
Table 11-001. Final Effluent Limits and Monitoring Requirements for Outfall 001:
For Chlorination/Bromination Duration of 120 Minutes/Day or Less
Effluent Limits
Concentration Loading (kg/day)a
30 Day Daily 30 Day Daily
Parameter Units Average Maximum Average Maximum Basisb
Water Temperature EF - - - - - - - - - - - - Monitor - - - - - - - - - - - - - - - Mc
Thermal Discharge Million BTU/Hr - - - - - - - - - - - Monitor - - - - - - - - - - - Mc
pH S.U. - - - - - - - - - - - 6.5 to 9.0 - - - - - - - - - - - - - - - EP/BPT
Residue, Total Diss. mg/l - - - - - - - - - - - - Monitor - - - - - - - - - - - - - - - EP/BPJ
Selenium :g/l 12 -- 5.72 -- Mc /AD
Iron :g/l - - - - - - - - - - - - Monitor - - - - - - - - - - - - - - - WLA
Oxidants, Total Res. mg/l -- 0.05 -- -- EP/BPJ
Flow MGD - - - - - - - - - - - - Monitor - - - - - - - - - - - - - - - Mc
Chlorine, Total Residual mg/l -- 0.2 -- -- EP/BAT
Mercury ng/l 167. 1700. 0.080 0.811 MV/MZP
Chlorination/Bromination
Duration minutes -- 120 -- -- EP/BAT
a Effluent loadings are based upon an average design flow of 126 MGD.
b,c See page 34 for definition of terms and explanation of monitoring requirements.
Table 11-091. Final Effluent Limits and Monitoring Requirements for Outfall 091:
For Chlorination/Bromination Duration of Greater than 120 Minutes/Day
Effluent Limits
Concentration Loading (kg/day)a
30 Day Daily 30 Day Daily
Parameter Units Average Maximum Average Maximum Basisb
Oxidants, Total Res. mg/l -- 0.01 -- -- EP/BPJ
Chlorine, Total Residual mg/l 0.027 0.033 -- -- WLA
Chlorination/Bromination
Duration minutes -- -- -- -- EP/BAT
a Effluent loadings are based upon an average design flow of 126 MGD.
b,c See page 34 for definition of terms and explanation of monitoring requirements.

Page 32 Factsheet for Conesville Power Plant NPDES Permit Renewal, October 2007
Table 11-601. Final Effluent Limits and Monitoring Requirements for Outfall 601
Effluent Limits
Concentration Loading (kg/day)a
30 Day Daily 30 Day Daily
Parameter Units Average Maximum Average Maximum Basisb
Total Precipitation Inches - - - - - - - - - - - - Monitor - - - - - - - - - - - - - - EP
pH S.U. - - - - - - - - - - - 6.0 to 9.0 - - - - - - - - - - - - - - EP/BPT
Residue, Total Dissolved mg/l - - - - - - - - - - - - Monitor - - - - - - - - - - - - - - EP/BPJ
Suspended Solids mg/l 30 100 -- -- EP/BPT
Oil and Grease mg/l 15 20 -- -- EP/BPT
Flow rate MGD - - - - - - - - - - - - Monitor - - - - - - - - - - - - - - - Mc /EP
Chlorine, Tot. Res. mg/l -- 0.2 -- -- Mc /BPJ
Chlorination/Bromination
Duration minutes -- 120 -- -- BPJ
b,c See page 34 for definition of terms and explanation of monitoring requirements.
Table 11-602. Final Effluent Limits and Monitoring Requirements for Outfall 602
Effluent Limits
Concentration Loading (kg/day)a
30 Day Daily 30 Day Daily
Parameter Units Average Maximum Average Maximum Basisb
Flow rate GPD - - - - - - - - - - - - Monitor - - - - - - - - - - - - - - - Mc /EP
pH S.U. - - - - - - - - - - - 6.0 to 9.0 - - - - - - - - - - - - - - EP/BPT
Suspended Solids mg/l 12 18 -- -- EP/BPT
Fecal Coliform #/100 ml 1000 2000 -- -- EP/BPT
CBOD5 mg/l 10 15 -- -- Mc /EP
b,c See page 34 for definition of terms and explanation of monitoring requirements.

Factsheet for Conesville Power Plant NPDES Permit Renewal, October 2007 Page 33
Table 11-603. Final Effluent Limits and Monitoring Requirements for Outfall 603
Effluent Limits
Concentration Loading (kg/day)a
30 Day Daily 30 Day Daily
Parameter Units Average Maximum Average Maximum Basisb
Flow rate GPD - - - - - - - - - - - - Monitor - - - - - - - - - - - - - - - Mc /EP
Suspended Solids mg/l 30 100 -- -- EP/BPT
Oil and Grease mg/l 15 20 -- -- EP/BPT
b,c See page 34 for definition of terms and explanation of monitoring requirements.
Table 11-604. Final Effluent Limits and Monitoring Requirements for Outfall 604
Effluent Limits
Concentration Loading (kg/day)a
30 Day Daily 30 Day Daily
Parameter Units Average Maximum Average Maximum Basisb
Water Temperature EC - - - - - - - - - - - - Monitor - - - - - - - - - - - - - - - Mc
pH S.U. - - - - - - - - - - - - Monitor - - - - - - - - - - - - - - - BPJ
Residue, Total Diss. mg/l - - - - - - - - - - - - Monitor - - - - - - - - - - - - - - - BPJ
Total Suspended Solids mg/l - - - - - - - - - - - - Monitor - - - - - - - - - - - - - - - BPJ
Ammonia mg/l - - - - - - - - - - - - Monitor - - - - - - - - - - - - - - - BPJ
Chloride, Total mg/l - - - - - - - - - - - - Monitor - - - - - - - - - - - - - - - BPJ
Sulfate mg/l - - - - - - - - - - - - Monitor - - - - - - - - - - - - - - - BPJ
Selenium :g/l - - - - - - - - - - - - Monitor - - - - - - - - - - - - - - - BPJ
Boron :g/l - - - - - - - - - - - - Monitor - - - - - - - - - - - - - - - BPJ
Nickel :g/l - - - - - - - - - - - - Monitor - - - - - - - - - - - - - - - BPJ
Cadmium :g/l - - - - - - - - - - - - Monitor - - - - - - - - - - - - - - - BPJ
Lead :g/l - - - - - - - - - - - - Monitor - - - - - - - - - - - - - - - BPJ
Flow MGD - - - - - - - - - - - - Monitor - - - - - - - - - - - - - - - Mc
Mercury ng/l - - - - - - - - - - - - Monitor - - - - - - - - - - - - - - - BPJ
b,c See page 34 for definition of terms and explanation of monitoring requirements.

Page 34 Factsheet for Conesville Power Plant NPDES Permit Renewal, October 2007
Table 11-607. Final Effluent Limits and Monitoring Requirements for Outfall 607
Effluent Limits
Concentration Loading (kg/day)a
30 Day Daily 30 Day Daily
Parameter Units Average Maximum Average Maximum Basisb
Flow rate GPD - - - - - - - - - - - - Monitor - - - - - - - - - - - - - - - Mc /EP
pH S.U. - - - - - - - - - - - 6.0 to 9.0 - - - - - - - - - - - - - - - - - EP/BPT
Suspended Solids mg/l 30 45 -- -- EP/BPT
Fecal Coliform #/100 ml 1000 2000 -- -- EP/BPT
CBOD5 mg/l 25 40 -- -- Mc /EP
b,c See below for definition of terms and explanation of monitoring requirements.
Table 11-608. Final Effluent Limits and Monitoring Requirements for Outfall 608
Effluent Limits
Concentration Loading (kg/day)a
30 Day Daily 30 Day Daily
Parameter Units Average Maximum Average Maximum Basisb
pH S.U. - - - - - - - - - - - - Monitor - - - - - - - - - - - - - - - EP/BPT
Copper :g/l 1000 1000 -- -- Mc /EP/BPJ
Iron :g/l 1000 1000 -- -- Mc /EP/BPJ
Flow rate MGD - - - - - - - - - - - - Monitor - - - - - - - - - - - - - - - Mc /EP
b,c See below for definition of terms and explanation of monitoring requirements.
b Definitions: ABS = Antibacksliding Rule (OAC 3745-33-05(E) and 40 CFR Part 122.44(l));
AD = Antidegradation (OAC 3745-1-05);
BPJ = Best Professional Judgment;
EP = Existing Permit for the Conesville Plant;
FEG-BAT = Best Available Control Technology Currently Available, 40 CFR Part
423.13(e);
FEG-BPT = Best Practicable Waste Treatment Technology, 40 CFR Part
423.12(b)(3) and (b)(4);
M = Monitoring;
MZP = Mixing Zone Phaseout for mercury wasteload allocation (OAC 3745-2);
MV = Mercury Variance [OAC 3745-33-07(D)(10)];
PD = Plant Design Criteria;
RP = Reasonable Potential for effluent to violate water quality standards (3745-33-
07(A));
316(a) = Water Quality Variance demonstration
WET = Whole Effluent Toxicity (OAC 3745-33-07(B)) ;

Factsheet for Conesville Power Plant NPDES Permit Renewal, October 2007 Page 35
WLA = Wasteload Allocation procedures (OAC 3745-2);
WLA/IMZM = Wasteload Allocation limited by Inside Mixing Zone Maximum;
WQS = Ohio Water Quality Standards (OAC 3745-1).
c Monitoring of flow and other indicator parameters is specified to assist in the evaluation of effluent
quality and treatment plant performance.
d 7 day average limit.
Page 36 Factsheet for Conesville Power Plant NPDES Permit Renewal, October 2007
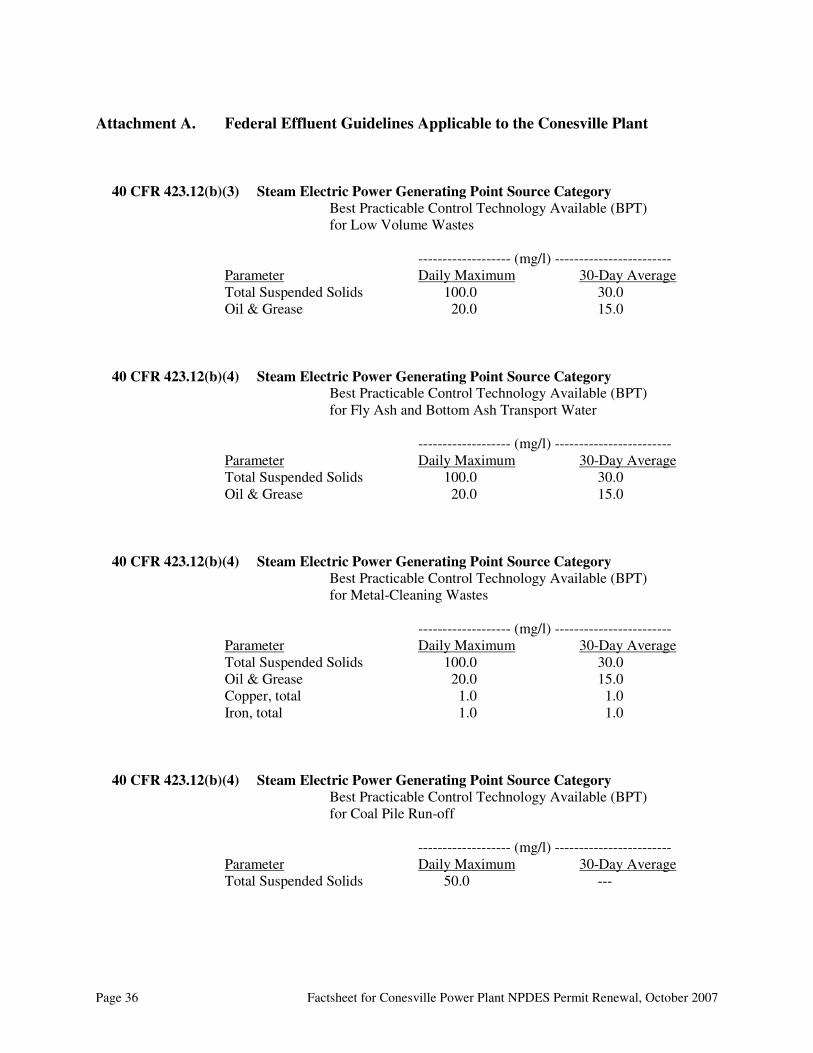
Attachment A. Federal Effluent Guidelines Applicable to the Conesville Plant
40 CFR 423.12(b)(3) Steam Electric Power Generating Point Source Category Best Practicable Control Technology Available (BPT)
for Low Volume Wastes
------------------- (mg/l) ------------------------
Parameter Daily Maximum 30-Day Average
Total Suspended Solids 100.0 30.0
Oil & Grease 20.0 15.0
40 CFR 423.12(b)(4) Steam Electric Power Generating Point Source Category Best Practicable Control Technology Available (BPT)
for Fly Ash and Bottom Ash Transport Water
------------------- (mg/l) ------------------------
Parameter Daily Maximum 30-Day Average
Total Suspended Solids 100.0 30.0
Oil & Grease 20.0 15.0
40 CFR 423.12(b)(4) Steam Electric Power Generating Point Source Category Best Practicable Control Technology Available (BPT)
for Metal-Cleaning Wastes
------------------- (mg/l) ------------------------
Parameter Daily Maximum 30-Day Average
Total Suspended Solids 100.0 30.0
Oil & Grease 20.0 15.0
Copper, total 1.0 1.0
Iron, total 1.0 1.0
40 CFR 423.12(b)(4) Steam Electric Power Generating Point Source Category Best Practicable Control Technology Available (BPT)
for Coal Pile Run-off
------------------- (mg/l) ------------------------
Parameter Daily Maximum 30-Day Average
Total Suspended Solids 50.0 ---

Factsheet for Conesville Power Plant NPDES Permit Renewal, October 2007 Page 37
Attachment A. Federal Effluent Guidelines Applicable to the Conesville Plant
40 CFR 423.13(b) Steam Electric Power Generating Point Source Category Best Available Technology Economically Achievable (BAT)
------------------- (mg/l) ------------------------
Parameter Daily Maximum 30-Day Average
Total Residual Chlorine 0.20 --