column base plate design
TRANSCRIPT

COLUMN BASE PLATE DESIGN – LAPPING STRIP METHODKEVIN COWIE CLARK HYLAND NANDOR MAGO
Kevin Cowie is a Structural Engineer in the Steel Structures Analysis Service at the New Zealand Heavy Engineering Research Association.
Clark Hyland is a Structural Engineer and the manager for the Steel Structures Analysis Service at the New Zealand Heavy Engineering Research Association.
Nandor Mago is an Applied Research Engineer – Finite Element Analyst at NZ Heavy Engineering Research Association (HERA) in 1999. His primary role is to support with FEA the wide range of HERA’s Structural Steel and NZ Welding Centre research activities. He is a user of Nastran for Windows and ABAQUS/
Standard/ CAE.
ABSTRACT Finite element analyses of column base plates show that neither the Thornton model, recommended by American Institute of Steel Construction, nor the Eurocode 3 Annex L model adequately reflects the bearing stress distribution. Finite element analysis shows a concentration in bearing stress occurs where the flanges of an H section meets the web. This paper presents an improved design procedure incorporating this observation. Uniform bearing stress distributions under the web and flanges are superimposed to give an increased bearing stress in the region where the flanges meet the web.
Kevin Cowie
Clark Hyland
Nandor Mago

1. INTRODUCTION
A review of literature and codes for column pinned base plates shows there are various different design procedures and that not one covers the whole spectrum of column pinned base plates. Assumption of bearing pressure under the base plates also varies. In this paper a brief description of literature reviewed is presented along with their various assumptions. The procedure developed by the authors, called the Lapping Strip method approach, is then presented including a description of Finite Element Analysis, (FEA), testing. The Lapping Strip method for base plate design is used in HERA Report R4-100:2003 Structural Steelwork Connections Guide.
2. Literature Review
Ranzi and Kneen made a comprehensive review of column base plate procedures and a summary is presented below. (Rabzi, G and Kneen, P., 2002)
2.1. Cantilever Model
The cantilever model was the first available approach to design of column pinned base plates. This model is appropriate for design of large base plates where the dimensions of the base plate are much larger than that of the column. This model assumes a uniform bearing pressure on the underside of the base plate. For an H-section the loaded area on the base plate is assumed to be concentrated over an area of 0.95dc x 0.80bfc. As shown in Figure 1 and 2. This results in the base plate bending as a cantilever about the edges of this area. This approach leads to a conservative design for large base plates.
Figure 1: Cantilver model assumed loaded area
Figure 2: Cantilver Model – collapse mechanism As the cantilever extension reduces the predicted capacities becomes increasingly unconservative. 2.2. Fling Model
The Fling model is a modification to the cantilever model. It is only applicable to H shaped sections. This model recognized limitations of bare plate stiffness on load capacity by introducing a serviceability check. For base plates where sizes are similar to the column, Fling recommended a strength check based on yield line theory with a pattern as shown in Figure 3. The support conditions assumed for the plate are fixed along the web, simply supported along the flanges and free on the edges opposite to the web.
Figure 3: Fling Model – Yield line pattern 2.3. Murray-Stockwell Model
The Murray-Stockwell model is applicable to “lightly’ loaded base plate for H section columns. The definition of a lightly loaded base plate is that of a relatively flexible plate approximately the same size as the outside dimensions of the connected column. The Murray-Stockwell model assumes that the pressure distribution under a base plate is not uniform but is assumed to be an H shaped area inside the H section. The Murray-Stockwell model assumes that the pressure acting over the H shaped bearing area is uniform and equal to the maximum bearing capacity of the concrete. Refer to Figure 4.

Figure 4: Murray-Stockwell Model – Assumed shape of pressure distribution.
2.4. Thornton Model
The Thornton Model is a combination of the Cantilever, Fling and Murray-Stockwell models. The derived compact formula is suitable for only H-shaped columns. The Cantilever model is used for extended base plates. Otherwise the Murray-Stockwell model governs. However the crossover between the two approaches is not consistent. 2.5. Eurocode 3 Model Annex L of Eurocode 3, 1993, gives another procedure for the design of a column base plate. This model utilizes the concept of rigid areas used in the Murray-Stockwell model, but extends the rigid areas outside the section perimeter. For an H-section the bearing area is assumed to be uniform over an H shaped bearing that extends inside and outside the H-section. Refer to Figure 5.
Column Base Plate
Rigid Area
Figure 5: Eurocode 3 assumed bearing pressure The development of the procedure is based on the T-stub approach. The Eurocode method gives a
significant improvement in bearing capacities over the Thornton Model and uses a uniform approach. However finite element analysis shows that the method over predicts the base capacities due to the overly simplified stress distribution assumed. Therefore the authors have developed an improved procedure called the Lapping Strip Method.
3. Lapping Strip Method
3.1. Introduction
The Lapping Strip Method modifies the equivalent rigid area concept and the “T” stub model used in Annex L of Eurocode 3. The Lapping Strip Method is developed for an H-section by considering the flange and web separately and then combining the bearing pressures giving an increased bearing stress in the vicinity where the flanges meet the web. 3.2. T-Stub model
The T-stub model is a unit length column with a uniform axial load over its length. The bearing area on the underside of the base plate is represented by an equivalent rigid area over which the stress is uniform. Refer to the Figure 6. The length of the equivalent rigid area from the face of the column, c, can be calculated by equating bearing capacity of the concrete with the bending capacity of the steel base plate.
Figure 6: “T” stub model assumed stress distribution The design bending moment of the base plate is given by the equation:
* 2b
1M c
2= σ (1)
bσ Concrete bearing stress
c Effective cantilever length
c c
wt
bσ
it
F
The elastic flexural capacity of the steel base plate is given by equation:
2i yi
1M t f
6= (2)
it Base plate thickness
yif Base plate yield stress
The elastic rather than the plastic capacity is used to maintain consistency with the rigid area approach applied. Equations 1 and 2 are combined to determine the effective cantilever length, c.
yii
b
fc t
3=
σ (3)
Inserting material reduction factors, according to the New Zealand Steel Structures Standard: NZS3404:1997 and the New Zealand Concrete Structures Standard NZS3101:1995 the equation becomes:
s yii
b
fc t
3
φ=
φσ (4)
The maximum axial load that the base plate strip can take is equal to the equivalent rigid area multiplied by the concrete bearing capacity. Under a single vertical plate section the maximum capacity is ( ) ( )bp b w sN t 2c d 2c Nφ = φσ + + ≤ φ (5)
d Depth of plate section wt Web thickness of plate section
sNφ Axial capacity of vertical plate
Figure 7: Unit plate rigid bearing area
The equivalent rigid area is increased to take account of welds by measuring the rigid cantilever length, c, from 80% of the weld leg length. Therefore the rigid area and the axial connection capacity of a plate section is increased and given by equation:
( )( )bp b w wi wi sN t 1.6t 2c d 1.6t 2c Nφ = φσ + + + + ≤ φ wit Weld web leg length (6)
3.3. H section
This approach is applied to an H section shown in Figure 8 by considering the web and flange separately and then superimposing the stress distributions on each other, to give an increased bearing pressure in the vicinity where the flanges meet the web.
Figure 8: Development of H section rigid bearing area. The design bearing pressure in the lapping regions is set equal to the design concrete bearing capacity. Therefore the flanges and web bearing stress outside the lapping zones is half the concrete bearing capacity. The effective rigid bearing area under the flanges and web including allowance for welds is ( )( )rf f wi f wiA b 1.6t 2c t 1.6t 2c= + + + +
(7)
( )( )rw w wi w wiA d 1.6t 2c t 1.6t 2c= + + + + (8)
rfA Effective flange rigid plate area
rwA Effective web rigid plate area
fb Flange width
wd Web depth
ft Flange thickness
wt Web thickness
The total effective bearing area is then equal to r rf rwA 2A A= + (9)
bφσ
it
wtc
d
Rigid Area

Figure 9: H section rigid bearing area The design bearing capacity of the connection is
bp c r b
1N A
2φ = φ σ (10)
3.4. Slenderness Limits
Slender elements of columns will not develop the full section capacity and will alter the stress distribution in the base plate. Where the slenderness yield limits of the web and flange are not met, then the axial load distribution is not uniform at the design load. Studies of slender elements have found that slender plates develop post-buckling capacities by shedding load to locations close to the edge restraints (AS/NZS 4600:1996). The ‘effective design width’ approach used in AS/NZS 4600:1996 approximates the non-uniform distribution of stress over the entire length of the plate to a reduced effective length of uniform distributed stress. Refer to Figure 10. This same approach has been used in the Lapping Strip Method.
Figure 10: Equivalent stress for a slender element (AS/NZS 4600:1996) From NZS3404:1997 the slenderness yield limits used for H-sections are: eyλ = 16 Hot Rolled, HR, flange
eyλ = 45 Hot Rolled, HR, web
eyλ = 14 Welded, HW, flange
eyλ = 35 Welded, HW, web
The flange and web slenderness is
yf wef
f
fb t
2t 250
−λ = Flange slenderness
(11)
yfew
w
fd 2t
t 250
−λ = Web slenderness
(12) The effective flange width and web depth is
eyef f f
ef
b b bλ
= ≤ λ (13)
( ) ( )eyew f f
ew
d d 2t d 2tλ
= − ≤ − λ (14)
The effective flange width is developed symmetrically about the flange mid point. The effective web depth is split and extends evenly from the flange/web intersections. Refer to Figure 11. ( )( )rf ef wi f wiA b 1.6t 2c t 1.6t 2c= + + + + (15)
( )( )rw ew f wi w wiA d 2t 1.6t 2c t 1.6t 2c= + + + + +
(16)
Figure 11: I section rigid bearing area for bef < bf and dew < d – 2tf 3.5. Channel Section Columns
The Lapping Strip Method is applied to channel section columns as shown in Figure 12. The effective rigid areas of the flanges and web are assessed in a similar way to the H section procedure above.
Figure 12: Channel section rigid bearing area

3.6. Rectangular Hollow Section Columns
For rectangular hollow, RHS, and square hollow, SHS, section columns, two sides are treated as webs and the other two sides as flanges. The effective flange and web widths are given by equations
( ) eyef w w
ef
b b 2t b 2tλ
= − ≤ − λ (17)
( ) eyew w w
ew
d d 2t d 2tλ
= − ≤ − λ (18)
Element slenderness is calculated using equations
yf wef
f
fb 2t
2t 250
−λ = (19)
yfew
w
fd 2t
t 250
−λ = (20)
From NZS3404:1997 the slenderness yield limits for cold formed hollow sections is eyλ = 40
Figure 13: SHS/RHS section rigid bearing area 3.6. Circular Hollow Section Columns
For circular hollow section, CHS, columns the effective rigid bearing pressure is based on the assumption that bearing pressure inside the CHS increases conservatively up to twice the bearing pressure outside for small diameter sections. r rin routA 2A A= + (21)
−−−
+π=22
28.0
2ct
dt
dA w
owi
orin
(22)
+−
++π=
22
8.02
8.02 wi
owi
orout t
dct
dA
(23)
Figure 14: CHS section rigid bearing area
4. Finite Element Analysis
4.1. Introduction
The Lapping Strip Method assumptions were verified by a series of non-linear static finite element analyses. The models were built and analyzed in ABAQUS version 6.3-1. Elastic perfectly plastic material properties were assumed for the steel columns and base plates. Incompatible mode solid, C3D8I, and reduced integration, C3D8R, elements with finer mesh in the vicinity of the base plate were assigned to the steel and concrete members. ABAQUS concrete smeared cracking material model was assigned to the large plain concrete foundation block. Contact between the base plate and concrete was modeled. The properties of this interaction were frictionless in tangential direction, while the normal behavior of pressure-overclosure was assumed in the shape of exponential decay. No investigation was performed on how the interaction properties influence the results, but negligible variations in the bearing stresses are expected. Two columns with two different sized base plates were analyzed. The two sizes of base plates for each column were selected for two situations. The first where the base plate size extended beyond the regions of rigid bearing area calculated using the Lapping Strip Method. The second where the base plate area was minimum, i.e. extending just beyond the column depth and breadth. The two columns analyzed were 1200WB455 and 500WC440. The FEA models did not include any modeling of welds.

4.2. Finite Element Analysis Models
No Section Flange Yield
Web Yield
Flange Width
Column depth
Web thickness
Flange thickness
Base Plate Yield
Concrete Strength
Base Plate Dimensions
yff
MPa ywf
MPa fb
mm d
mm wt
mm ft
mm yif
MPa
'cf
MPa
Breadth mm
Depth mm
Thickness mm
1 1200WB455 280 300 500 1200 16 40 240 30 840 1540 115 3 500WC440 280 280 500 480 40 40 240 30 730 710 75
Table 1: Extended Base Plates
Table 2: Minimum Area Base Plates 4.2. Finite Element Analysis Results
FEA results are presented in Table 3 and 4 and the contact pressure distribution is shown in Figures 15 to 17. The maximum stress and the average stress in the stress block area based on Lapping Strip Method are presented. This is compared to the predicted stress for the area in the vicinity of where the web meets the flanges. The first predicted pressure is calculated using idealised material properties with no material reduction factors applied. The second predicted pressure uses material properties with reduction factors applied. The design concrete bearing capacity, accounting for confinement of the concrete, is calculated in accordance with New Zealand Concrete Structures code NZS 3101:1995. The equation being
' '2b c c c c
1 min
A0.85f , 0.85f 2
A
φσ = φ φ
(24)
'cf 28 day concrete cylinder strength
1A Base plate foot print area
2A Design effective concrete bearing area
Model No. Axial load kN
Maximum Stress MPa
2 9366 42.0 4 10200 65.0
Table 3: Minimum Sized Area Base Plates
Finite Element Analysis Lapping Strip Method Prediction Model No. Axial load kN
Max Stress MPa
Ave Stress in Stress Block MPa
Ideal material MPa
Material Reduction Factors Applied
MPa 1 14913 26.9 21.5 38.0 30.9 3 14112 46.4 40.9 60.0 50.4
Table 4: Predicted Stress verus FEA Stress in Lapping Areas
No Section Flange Yield
Web Yield
Flange Width
Column depth
Web thickness
Flange thickness
Base Plate Yield
Concrete Strength
Base Plate Dimensions
yff
MPa ywf
MPa fb
mm
d mm
wt
mm ft
mm yif
MPa
'cf
MPa
Breadth mm
Depth mm
Thickness mm
2 1200WB455 280 300 500 1200 16 40 240 30 720 1220 115 4 500WC440 280 280 500 480 40 40 240 60 520 520 90
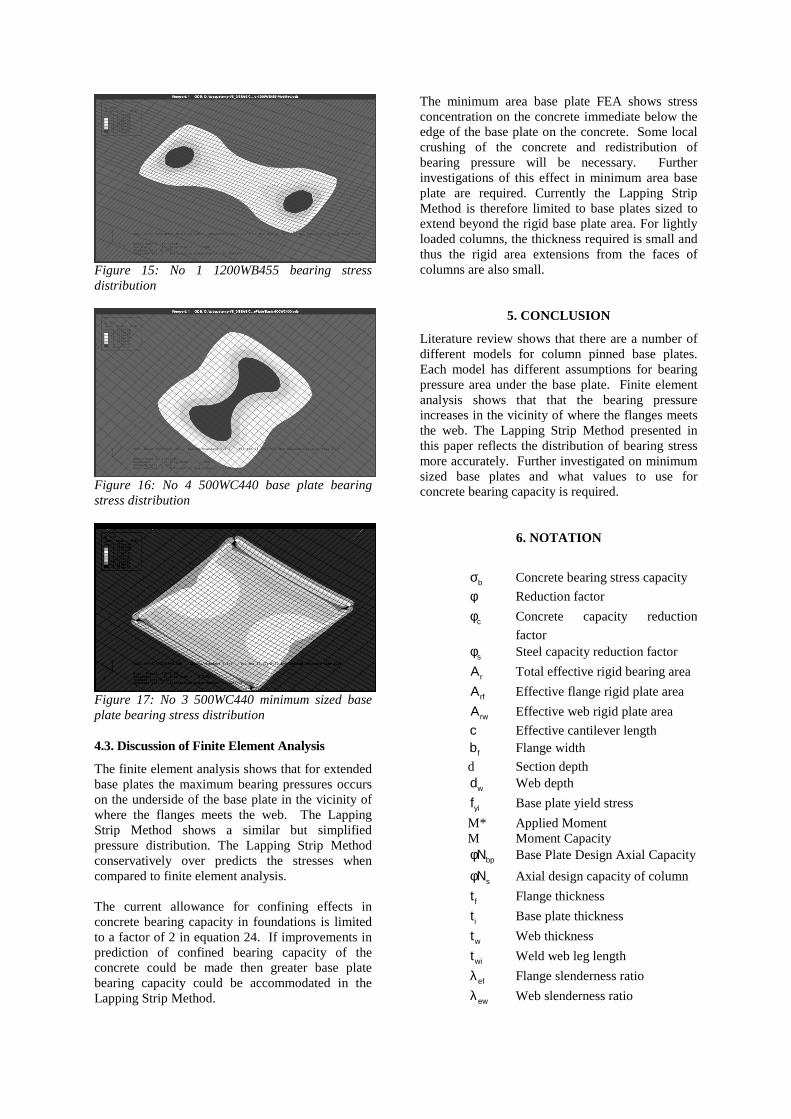
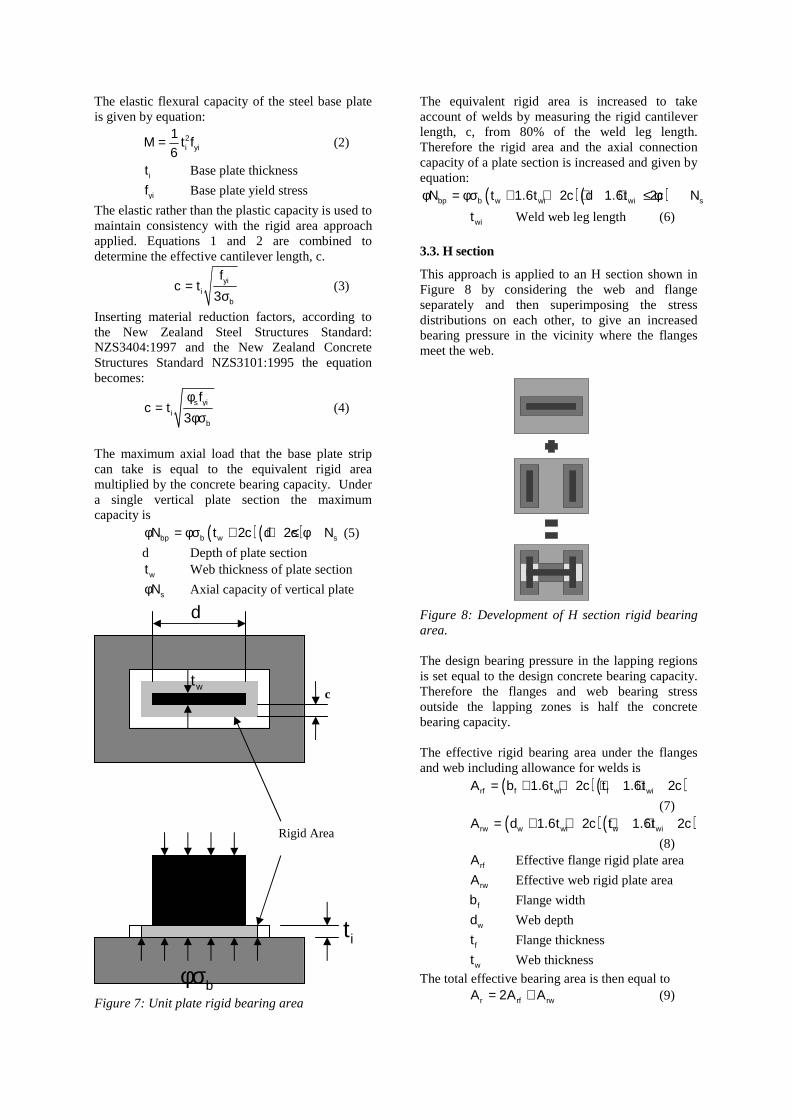
Figure 15: No 1 1200WB455 bearing stress distribution
Figure 16: No 4 500WC440 base plate bearing stress distribution
Figure 17: No 3 500WC440 minimum sized base plate bearing stress distribution 4.3. Discussion of Finite Element Analysis
The finite element analysis shows that for extended base plates the maximum bearing pressures occurs on the underside of the base plate in the vicinity of where the flanges meets the web. The Lapping Strip Method shows a similar but simplified pressure distribution. The Lapping Strip Method conservatively over predicts the stresses when compared to finite element analysis. The current allowance for confining effects in concrete bearing capacity in foundations is limited to a factor of 2 in equation 24. If improvements in prediction of confined bearing capacity of the concrete could be made then greater base plate bearing capacity could be accommodated in the Lapping Strip Method.
The minimum area base plate FEA shows stress concentration on the concrete immediate below the edge of the base plate on the concrete. Some local crushing of the concrete and redistribution of bearing pressure will be necessary. Further investigations of this effect in minimum area base plate are required. Currently the Lapping Strip Method is therefore limited to base plates sized to extend beyond the rigid base plate area. For lightly loaded columns, the thickness required is small and thus the rigid area extensions from the faces of columns are also small.
5. CONCLUSION
Literature review shows that there are a number of different models for column pinned base plates. Each model has different assumptions for bearing pressure area under the base plate. Finite element analysis shows that that the bearing pressure increases in the vicinity of where the flanges meets the web. The Lapping Strip Method presented in this paper reflects the distribution of bearing stress more accurately. Further investigated on minimum sized base plates and what values to use for concrete bearing capacity is required.
6. NOTATION
bσ Concrete bearing stress capacity
φ Reduction factor
cφ Concrete capacity reduction
factor
sφ Steel capacity reduction factor
rA Total effective rigid bearing area
rfA Effective flange rigid plate area
rwA Effective web rigid plate area
c Effective cantilever length
fb Flange width
d Section depth
wd Web depth
yif Base plate yield stress
M* Applied Moment M Moment Capacity
bpNφ Base Plate Design Axial Capacity
sNφ Axial design capacity of column
ft Flange thickness
it Base plate thickness
wt Web thickness
wit Weld web leg length
efλ Flange slenderness ratio
ewλ Web slenderness ratio

eyλ Plate element slenderness ratio
yield limit
REFERENCES
1. AS/NZS 4600:1996. Cold-formed steel structures. Standards New Zealand/ Standards Australia
2. ABAQUS/Standard. Finite Element Analysis Program. 2001. HKS Inc, Pawtucket RI, USA.
3. Eurocode 3: Design of steel structures DD Env 1993-1-1 Part 1.1 General rules and rules for buildings, 1992
4. Hyland, C., HERA Report R4:100:1999 Structural Steework Connections Guide, 1999, HERA, Manukau, New Zealand
5. Hyland, C., Cowie, K., Clifton,. C., HERA Report R4:2003 Structural Steework Connections Guide, 2003, HERA, Manukau, New Zealand
6. Joints in Steel Construction Moment Connections. 1997, The Steel Construction Institute, England
7. NZS 3101:1995. Concrete Structures Standard. Wellington: Standards New Zealand.
8. NZS 3404:1997. Steel Structures Standard. Wellington: Standards New Zealand.
9. Ranzi, G and Kneen, P Design of Pinned Column Base Plates. Steel Construction, Vol 36 No 2 September 2002, Australian Steel Institute, Australia.