column curves and stress-strain diagrams - nvlpubs.nist.gov ·...
TRANSCRIPT
RP492
COLUMN CURVES AND STRESS-STRAIN DIAGRAMS
By William R. Osgood
ABSTRACT
The only important column formula which rests on a strictly theoretical basisis the Considere-Engesser formula, which includes the Euler formula as a specialcase. Attempts have been made to underpin by a general theoretical foundationother essentially empirical formulas, notably the Rahkine formula; but these at-tempts have not been successful. It would be very satisfying, however, if theseempirical formulas could be shown to be reasonable special forms of the Considere-Engesser formula. Any column formula for centrally loaded columns is a specialcase of the Considere-Engesser formula provided the compressive stress-strain
diagram has a certain definite shape. The present paper examines a few of thecommonest types of empirical formulas and determines the shape of the stress-
strain diagram in each case which makes them compatible with the Considere-Engesser theory.
The only column formula which rests on a strictly theoretical basis
and which at the same time is of practical importance, in the sensethat tests confirm the theory, is the Considere-Engesser formula, 1
which includes the Euler formula as a special case. Attempts havebeen made to underpin by a general theoretical foundation otherformulas, essentially empirical, notably the Rankine formula; but nosuccessful attempt has yet been made. It would be very satisfying,
however, if these empirical formulas could be shown to be reasonablespecial forms of the Considere-Engesser formula. Any column for-
mula for centrally loaded columns is a special case of the Considere-Engesser formula, provided the compressive stress-strain diagram of
the material has a certain definite shape. It is the purpose of thepresent paper to examine a few of the commonest empirical formulasand to determine the necessary shape of the stress-strain diagram in
order that these formulas may be compatible with the Considere-Engesser theory. A somewhat similar investigation has been carried
out by P. M. Frandsen, 2 but he refers the empirical formulas back to
the Engesser formula. 3
1 Developed in 1889 and the years following by A. Considere, Fr. Engesser, and F. Jasinski; re-presentedindependently by Theo. v. Karman, Mitteilungen iiber Forschungsarbeiten, Verein deutscher Ingenieure,Heft 81, Berlin, Julius Springer, 1910, and by R. V. Southwell, Engineering, vol. 94, p. 249, London, Aug.23 1912.
2 Den Teknisk Forenings Tidsskrift, Haefte 19, p. 139, Copenhagen, Sept. 15, 1920.i Zeitschrift des hannoverischen Architekten- und Ingenieur-Verein, vol. 35, p. 455, 1889.
571
572 Bureau of Standards Journal oj Research \ vol. 9
The following notation will be used
:
P = the load on the column at failure by buckling.
A = the cross-sectional area of the column.P
o-= -j=the average normal stress on the cross section at failure
Z = the "free length" of the column, the distance between twosuccessive points of inflection of the center line.
i = the least radius of inertia or radius of gyration of the cross
section of the column, measured parallel to the plane of
bending.E=the modulus of elasticity of the material of the column.£" = the "tangent modulus" at the stress a; that is, E' is the
slope of the compressive stress-strain diagram at thestress a.
E= l
-j -> where 7i is the moment of inertia about the axis
of average stress of the part of the cross-sectional areawhich suffers an increase of stress at the instant of failure
of the column, I2 is the moment of inertia about the axis
of average stress of the part of the cross-sectional areawhich suffers a decrease of stress at the instant of failure of
the column, and I=Ai2is the moment of inertia of the total
cross-sectional area of the column about the gravity axis
perpendicular to the plane of bending; the position of theaxis of average stress is defined by the relation E'Si=ES2 , where Si and S2 are the statical moments aboutthe axis of average stress, respectively, of the two partsof the cross-sectional area just mentioned in connectionwith Ii and I2 .
e — the strain due to the stress o\
au — the short-column strength of the material, to be taken as
the yield point in the case of ductile materials. (See
Appendix II.)
Eee =— •
0"
5 =—
•
(TP = the stress above which Euler's formula ceases to apply,strictly the proportional limit of the material, but prac-tically likely to be considerably above the actual propor-tional limit.
'1 I l<[u
ir'%\ E'Cn , CR , constants.
The assumptions underlying the Considere-Engesser theory are
that the material is homogeneous, cross sections remain plane, thestress-strain relation for increasing strain is the same as that given bythe stress-strain diagram, the stress-strain relation for decreasingstrain is given by a line parallel to the tangent to the stress-strain
diagram at the origin, the axis of the column is straight, the cross

Osgood] Column Curves and Stress-Strain Diagrams 573
section of the column is uniform throughout the free length, and theloading is axial.
The Considere-Engesser formula may be written
7T2E
<j =iy
In order that any empirical formula expressible as
l=IM (2)
give the same relation between a and -. as the Considere-Engesser%
formula, we must have
*»$©
where -. is given by (2). The stress-strain diagram must satisfy this
equation.E is a function not only of the slope of the stress-strain diagram at
(e, a) but also of the shape of the cross section, and no general reduc-tion of equation (3) is possible. Fortunately,_however, the effect of
the shape of the cross section on the value of E does not vary greatlyfor cross sections ordinarily used which have an axis of symmetryperpendicular to the plane of bending. 4 It can be shown that E is
smaller for the idealized H section (negligible web, flanges thin com-pared to distance between them) with the plane of bending normal to
the flanges than for any other section with the symmetry just men-tioned. Consequently, if E for the H section is used, equation (1)
will give results on the safe side for all symmetrical sections, andequation (3) may be reduced with the assurance that the results
obtained represent limiting values for such sections. The value of Efor the idealized H section is
6
E"ETE f (4)
which, substituted in equation (3), with E'=-t-i gives
7T2 2
a =dt, l (5)
da^E© ™and this is the equation of the stress-strain curve if equation (2) is
to represent a theoretically possible column formula.
* See Appendix I.
* K&rm&n (see footnote 1, p. 571).

574 Bureau of Standards Journal oj Research [Voi.9
Instead of integrating equation (5) for various functions - =/ (a),%
it is preferable for comparative purposes to introduce the nondi-mensional variables 6
€ =^)S =-, X= HJ% (6)
In terms of these quantities equations (1) and (5) become
s==1? E (7)
and
1 2/fi^s =
x*- S+T (8)
(is
where in the latter equation X is a given function of s; (7) is the equa-tion of a curve obtained from the column curve by dividing the aver-
lEage stresses by uu and the slenderness ratios by t -./ — , and
V <ru
(8) is the equation of a curve obtained from the stress-strain curve
by dividing the stresses by <ru and the strains by -^-
In the Euler range, for which E = E, equation (7) reduces to
s = y* (9)
and equation (8) becomes, with the use of equations (6)
s = e (10)
For values of s above sp ; that is, above the Euler range, for a con-tinuous stress-strain diagram the solution of (8) becomes
JSj
s ds
sX2 -s + 2sp (11)
The reduced stress-strain diagram represented by equations (10)
and (11) will now be considered for some empirical column formulas.The parabolic or hyperbolic type of formula.—A common type of
formula is one of the form
a = a
If
nthe curve represented by (12) is tangent to the Euler curve at <r= —Xo ""*
* The first of these has been used by K. Hohenemser (Zeitschrift fur angewandte Mathematik undMechanik, vol. 11, p. 15, February, 1931), the second has been used several times before and is obvious, andthe third has been used by L. B. Tuckerman, the late S. N. Petrenko, and C. D. Johnson (NationalAdvisory Committee for Aeronautics, Technical Note No. 307, Washington, D. C).

Osgood] Column Curves and Stress-Strain Diagrams 575
With this value of Cn , in terms of the variables defined by (6), equa-tion (12) becomes
1 n\n+2j X (13)
which applies forn
n + 2< s ^ 1, Figure 1 shows the curves
f.O
09
0.6
0.7
G6
«0 0.5
0.4
QJ
o.a
o./
OA O.e 12 16 ZO 2.4 2#A
Figure 1.-
—
Reduced column curves of several types
represented by equation (9) (marked Euler) and equation (13) fordifferent values of n. Equation (13) solved for X gives
\ ^\ N
v ^^ix7\t>
\
\
\\
\
\\i
\
\
-&JA*r
W; Tp\ \
\\\ I
V \\
\\\
\ \\ \\
\
\
\
\
\
\\
\
\ \
A\ \
/Dslrr-inC/nn/z/e \^ >.
\
\\s\
*.
"•<:
>^
. /wy/»+2\-M /1 x1
x=UK~)" a(1 ~ 8) " (14)

576 Bureau of Standards Journal of Research [ vol. 9
and substitution of this expression in equation (11) gives finally
-o^-i: dsn S "I ZiS p (15)
s(l — s)«
nfor values of s from —r-7> to 1, inclusive. For s less than or equal to
71 + 2 ' ^
6'
n71+2
?.0
equation (10) applies.
0.9
08
OJ
0.6
<0 0.5
0.4
0.3
0.2
OJ
1
/
/n*4
// .
/ / /?' '21
fv/es-—/
/?»/^S»?--
*.
^s*
*
/ *^>-
—
^
9 ~i ^
7
s<
s
4nan.wne
//
//
//
/ /
/ /
'
1
//
V/
//1//
0.2 0.4 0.6
eae /.o /.2 /.4
Figuke 2.
—
Reduced compressive stress-strain diagrams corresponding to
the column curves of Figure 1
Figure 2 shows the curves represented by equation (10) (markedEuler) and equation (15) for different values of n.
J

Osgood] Column Curves and Stress-Strain Diagrams 577
The case n = -^ represents a column formula which experience has
shown to be suitable for brittle materials like cast iron. (See fig. 1.)
Equation (15) becomes
512 C s _ds ,2 , 1R .
e = 3125 JHsJV=Ty-S+
5(I6)
which reduces to
e= J638[3^+2IT^+fl
i+logT^-J^6:i877 (17)
applicable for -=-;gs:gl. (See fig. 2.)
The case n= 1 represents a column formula suitable for commongrade wood. (See fig. 1.) Equation (15) becomes
8 fs ds 2
,1Q .
e==27jH sii^-y-
S+3
(18)
which reduces to
^(tV 10^)"^ -4276 (19)
applicable for- ^s^ 1. (See fig. 2.)
The case n = 2 represents a column formula suitable for ductile
materials like mild steel. (See fig. 1.) Equation (15) becomes
e^
which reduces to
\[* -TT-\-*+ X (2°)2Jy2 s(l-s)
e^logj^-s+1 (21)
applicable for ~ ^ sS 1. (See fig. 2.)
The case n = 4: represents a column formula suitable for hardmaterials like hard steel. (See fig. 1.) Equation (15) becomes
_4-y/3 f« ds,4
which reduces to
-TLir^-* +i
(22)
4V3, 1-Vl-s , ,g=s9 lQg
1 + ^1^ -^ + 2-347 (23)
2applicable for ~ ^s^ 1. (See fig. 2.)

578 Bureau oj Standards Journal of Research [Vol. 9
The Rankine formula.—The Rankine formula
1 + C•0)(24)
has been used for all values of -with CR = —o%» in which case the curve
represented by (24) approaches tangency to theEuler curve at infinity.
With this value of CR , in terms of the variables defined by (6),
equation (24) becomes
5 = 1 1 \ 2 (25)
which solved for X gives
/l — o
(26)
and substitution of this expression in equation (11) gives
Jo 1-sor
e=-2 1og (l-s)-s (27)
for values of s from to 1, inclusive.
The curves represented by equations (25) and (27) are shown in
Figures 1 and 2, respectively.
Appendix III shows an American Bridge Co. reduced straight-line
column curve and the corresponding reduced stress-strain diagram.All of the curves in Figure 2 except the curve marked n = 4 (equation
(23)) approach the horizontal line s = l asymptotically. The curvemarked n = 4 has a horizontal tangent at e — 1.347, 8= 1. A compari-son of the curves of Figure 1 with the corresponding curves of Fig-
ure 2 shows the type of compressive stress-strain diagram which is
necessary in any particular case in order that a given column curvemay represent accurately the strength of columns. The shapes of thereduced stress-strain diagrams are all reasonable except for high val-
ues of s and possibly in the case of the Rankine formula. The shapeof the diagram for high values of s is relatively unimportant, however,since the corresponding portion of the column curve lies in the regionof
" short columns, " and such columns do not usually fail by buckling.It is doubtful whether any structural material would show a reducedcompressive stress-strain diagram like that required for the Rankineformula.Viewed in another way, any (reduced) compressive stress-strain
diagram in Figure 2 will yield the (reduced) column curve correspondingto it in Figure 1. If, therefore, the short-column strength, <ru , of thematerial is such that, or can be denned (Appendix III) so that, the(reduced) compressive stress-strain diagram fits a curve of Figure 2,
the column strength of the material will be given by the correspondingcurve of Figure 1 . It will frequently be possible by a suitable choiceof <ru to obtain good agreement between the actual (reduced) com-

Osgood] Column Curves and Stress-Strain Diagrams 579
pressive stress-strain diagram and one of the curves of Figure 2 upto some limiting value of s, be3Tond which the agreement will not begood. In that case the corresponding curve of Figure 1 will represent
the column strength up to the same value of s. Thus, if representa-
tive compressive stress-strain diagrams of a material are available,
it may be possible to draw the corresponding column curve withouttests. This method is not to be recommended to the exclusion of
tests, however, particularly not if the agreement between the actual
(reduced) compressive stress-strain diagram and a curve of Figure 2
is not extremely good.The author wishes to express his indebtedness to Dr. Walter
Ramberg, of the engineering mechanics section, Bureau of Standards,for checking the equations.
APPENDIX I
Figure 3 shows the variation of ^ with -=, for a number of different
cross sections, as listed on the figure. The curves for the thin cir-
cular-ring section (thickness negligible in comparison with thediameter) and the solid circular section are plotted from formulasby R. V. Southwell. 7
The formula for the rectangular section is given by T. v. Karman, 8
and the six points for the I section are taken from a graph byW. Gehler. 9 The two curves for the thin T section (thickness of theweb and the flange negligible in comparison with their lengths) havebeen worked out by the author.
It may be noted that the curve for an unsymmetrical section mayHe considerably below the curve for the idealized H section, and the
lower limit for such sections is the curve -=,= r- . (Fig. 3.) Conse-
quently, Frandsen's treatment 10 may be considered as applyingunmodified to unsymmetrical sections.
APPENDIX II
In interpreting column tests of ductile materials it is of someimportance how au is defined. If <ju is defined as the stress determinedby the intersection of the stress-strain curve with a line through theorigin having a slope aE (0<a<l), the experimental points whenplotted as a X, s-diagram are likely to lie more nearly on a smoothcurve than otherwise. Under ideal conditions of test (perfectly
straight specimens, perfect centering, etc.) if different materialshaving affine stress-strain diagrams are tested, and if au is determinedas outlined, all points \,s will lie on one and the same curve. In
5 2tests made at the Bureau of Standards the values a= ~ and a = -x have
* Southwell (see footnote 1, p. 571.)8 Karman (see footnote 1, p. 571.)8 Proceedings of the Second International Congress for Applied Mechanics, p. 366, Zurich, Sept. 12-17,
1926.w See foot note 2, p. 571.

580 Bureau of Standards Journal oj Research Vol.9
f.O
0.9
0.8
O.I
0.6
'Mkjas
0.4
0.3
02
Of
«
/s
/ / !
S//
/
/7
/ /
jz® V
/ /
/ /f /
/y//
/ /
(
/
/
(V
/
/
/
/
/
/
/(
/
1@yi%1 1
7
/
/Qy
/
> / /§-1
1
1 iI®,'/1
1
I /
1
1
1 ,
i iif -0®@
€
X
+
ti-sect/on(?cfea///zea()
Tfi/n c/rcu/ar-r/ng sec7VonRec/angc//ar secf/'on
5o//of c/'rcu/ar sec//on
1
1
i i
i
1 1
/
'r'/// it1 ,
1 h1 '
7/?/r? T-secT/on, f/ange fw/ce The
web,fa//ure Toward f/ange) Tn/n T-sec/Von, f/ange rw/ce/he
weh, /a//ore away from f/angeZ-sect/on, fa//urepara//e//o web
i iL1
1
!:'/t
Ml1
if//
Zsecf/on, /a//isre per/oena//cu/artoweb.
r
0.2 OA 0.6 0.8 AO
TP 77"
Figure 3.
—
Variation of -^ with — for various shapes of cross section
Osgood] Column Curves and Stress-Strain Diagrams 581
AC/
\0.9 \
0.6
0.7
Ob)
/O£C/.O
as1*)
0.4
asi
0.2
1
1
fa*
ft) Rec/ucepf co/umn cc/rw
1*4
a/
i
0.4 ae /.? A6 2.Q 2.4 2.6 A0.2 0.4 0.6 0.8 /.a /.2 /.4 e
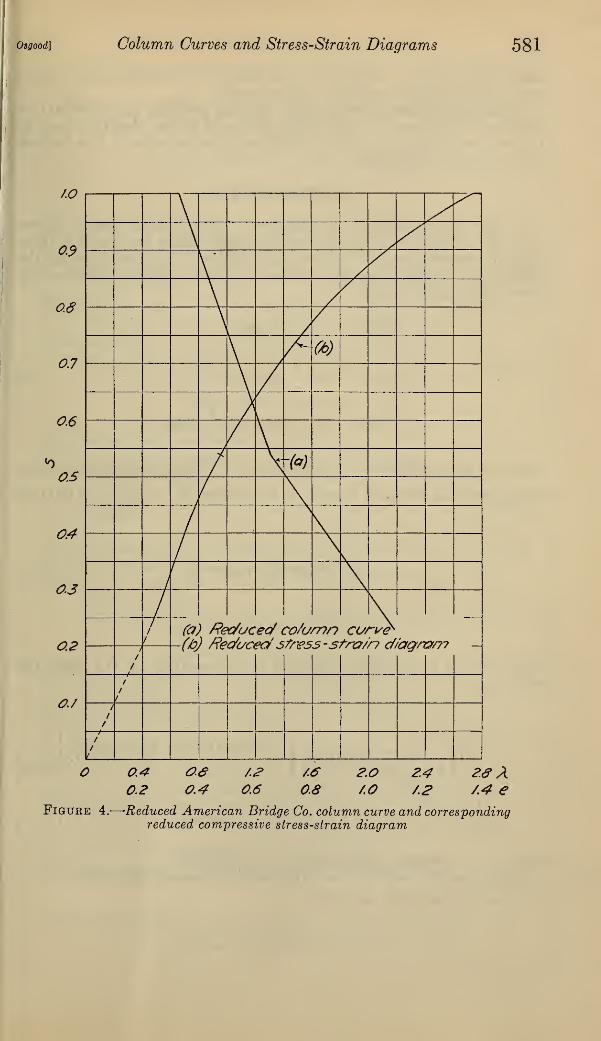
Figure 4.
—
Reduced American Bridge Co. column curve and correspondingreduced compressive stress-strain diagram

582 Bureau oj Standards Journal of Research [ Vol. 9
been found to give satisfactory results for chromium-molybdenumsteel and duralumin columns, respectively.
By adjusting the value of a, it may be possible to fit the actual(reduced) compressive stress-strain diagram rather closely to one of
the curves of Figure 2 up to a sufficiently high value of s to includeall except short columns.
APPENDIX III
It may be of interest to compare a specification column curvewith the stress-strain diagram which would make the curve a theo-
retically correct one. The American Bridge Co. curve given by thefollowing equations has been chosen for this purpose (units are in
pounds per square inch)
:
I
at= 13,000 for 0^-^60,
V
1 = 19,000- 100 I for 60<-:<120,
1 7
<r, = 13,000-50 4 for 120<*^200,
(28)
where as is the allowable average stress. These equations become,
respectively, in terms of X and s, if we assume -^( = oT¥7r )= 0.001 168,
s = l,
S13 2
A lorlsss8s=13
i V~2 . t7
s = 1 — -V- X for ^o ;s^13
(29)
The reduced stress-strain diagram is represented by the following
equations
:
e = -s + 0.0913 + <7 for l>s>13
(30)
=t(V- +logT^)-s + C for^>s>4\l — s
bl — s/ 13
e = -r13
where the constant of integration C is arbitrary.
Equations (29) and (30) are represented graphically in Figure 4.
Washington, July 14, 1932.
o