column slenderness analysis for reinforced concrete … slenderness analysis... · in this...
TRANSCRIPT

www.insightcore.com
Journal of Buildings and Sustainability
31
2017 Vol. 2 No. 2
Column Slenderness Analysis for Reinforced Concrete Frame
Structures using Finite Element Modelling
Mohammad Hossaina1 and Fayez Moutassema
a Department of Civil Engineering and Construction, Bradley University, USA
A B S T R A C T
This research is done to understand the slenderness effects of Reinforced Concrete (RC) columns in a frame structure through a
parametric study considering column design inputs and using a Finite Element Method (FEM) modelling procedure. Three ten-
story commercial buildings are modeled using FEM software ETABS. A parametric study is done on three different square floor
panels, five different column heights, and three different column locations in the RC beam-column frame structures. It is observed
that the corner column is the most sensitive to become slender in comparison to the edge and the inner columns. A 17.5′ (5334 mm)
long column becomes slender according to the slenderness criteria recommended by the American Concrete Institute (ACI) code.
All RC frames should be considered as a sway frame, since a column can be a non-slender member when considering the RC frame
as a non-sway frame but is a slender member while considering it as a sway frame. Also, column slenderness should be checked
using both the Slenderness Ratio (kl/r) and the Moment Magnification Factor (δns and δs). A column is a non-slender member
when considering the Slenderness Ratio, but it behaves as a slender member when considering the Moment Magnification Factor.
Keywords: Column, Finite Element Modelling, Non-Sway, Slenderness, Sway, Moment Magnification Factor
1. Introduction
Slender columns are the structural members whose ultimate load carrying capacities are affected by the slenderness
effect and produce additional bending stresses and instability of columns due to excessive deflection. A slender column
has less strength than a short column of the same sectional area, and hence it carries a lesser load as compared to a
short column (Kumar, 2005). The slenderness of a column dramatically increases due to increase in column height
and buckling under gravity or horizontal loads (Halder, 2007). Therefore, evaluation of a slender column involves
consideration of the column height, its cross-sectional size in addition to the type of load.
Slender columns exhibit deflections when being subjected to eccentric loads. These deflections produce additional
flexural stresses due to the increase in eccentricity by the amount of transverse deflection (∆). This phenomenon is
known as the P-∆ effect. P-∆ is sometimes referred to as the "secondary moment." This secondary moment reduces
the axial load carrying capacity of a slender column (Nilson, Darwin, & Dolan, 2003). P-∆ is a non-linear effect that
occurs in every structure where columns are subjected to horizontal loads such as wind loads. P-∆ is only one of many
second-order effects (Dobson & Arnot, 2003). The P-∆ effect should be included in the analysis for the design of
high-rise buildings in which the story drift exceeds 1/85 radians during expected earthquake excitations in seismic
regions (Mollick, 1997). The P-∆ effect should be considered as structures become even more slender and less resistant
to deformation. Rathbone (2002) noted that P-∆ effects in structures will always occur and always requires
consideration. As a result, codes of practice are referring to the engineers - to use the second order analysis
progressively so that P-∆ effects are accounted for when appropriate in design. Second order analysis is as essential
in concrete and timber design as it is in the design of steelwork (Dobson & Arnott, 2003).

Hossain, M. and Moutassem, F. / Journal of Buildings and Sustainability, 2017, Vol. 2, No. 2
32
If the total moment including the secondary moment reaches the ultimate capacity of a section, the column fails to
owe to material failure. Parameters such as column-buckling effect, elastic shortening, and secondary moments due
to lateral deflection, are not needed when designing short columns but are needed for the design of slender columns
(Hassoun, 2005). The concept of diagnosing whether the existence of any slender column effects is imperative and
should be considered before the actual slenderness effect calculation procedure is performed (Ferguson, Breen, &
Jirsa, 1987).
If a column is very slender, it becomes unstable before reaching material failure, and such instability failure is
observed in those columns (Bazant & Know, 1994). Slenderness effects are more pronounced in a column of a
unbraced frame than a braced frame. Frames that do not have adequate bracing against lateral loads show excessive
sway, which jeopardizes the stability of columns. Adequate bracing in a frame helps to stabilize secondary
deformations at column ends and produces more stable columns. Columns are treated differently depending on the
bracing conditions in their frames because of different behavior between a braced and an unbraced frame.
The vertical extension of the buildings is now essential for Bangladesh due to deficiency of land, cost of property,
and to accommodate a vast number of growing human population in small areas. Most of the buildings are concrete
beam-column or flat-plate frame structures. For the high-rise structures, it is frequently seen that there is an increased
ground floor height from conventional ground floor heights due to architectural or functional purpose, which
subsequently turns a column slender.
However, with the increasing use of high-strength materials and improved methods of dimensioning members, it is
now possible to design much smaller cross-sections. Together with the use of more innovative structural concepts,
that are rational and reliable, the design procedure for slender columns have become increasingly important. The
American Concrete Institute (ACI) code provides different guidelines for designing slender columns with relation to
critical parameters in non-sway and sway frames. Commercially available software for structural design of building
structures incorporates the ACI code design guidelines. The use of commercially available structural analysis and
design software are increasing on a daily basis in design offices. However, until recently, there are very few studies
done to understand slender column behavior using finite element modelling (Abdallah, Shazly, Mohamed, Masmoudi,
& Mousa, 2017; Mustafa, Elhussieny, Matar, Alaaser, 2016; Rodrigues, Manzoli, Bitencourt Jr, dos Prazeres, &
Bittencourt, 2015). Also, application of slender column design procedures is not straightforward, and this also
increases the chances of having an under-designed structure.
2. Objective and Methodology
Considering the effect of slenderness in column design is becoming very important especially with the rapid
increase in materials properties in high-rise construction. The concept of diagnosing whether any slender column
effect exists is crucial and should be considered before the actual slenderness effect calculation procedures are
performed. For this reason, it is essential to understand the ACI code design process for slender columns. The
parameters that influence the design of slender columns need careful evaluation. The objective of this research is to
study the effect of slenderness in Reinforced Concrete (RC) column design by carrying out a parametric approach and
identifying the critical parameters for the RC beam-column structures.
In this research, one typical model of a high-rise building is developed using ETABS software (Computers &
Structures, 2003). The model is developed considering all possible gravity and horizontal loads. Essential parameters
that affect column slenderness such as column height, column dimension, and span length are considered as a
parameter and are varied in the normal range.
It should be noted that ACI code (318-1999) is followed. The reason for using an old version of the code is because
the Bangladesh National Building Code (BNBC, 2006) was developed by following an old version of the ACI code.
In this study, BNBC is used to perform dead load, live load, wind load, and earthquake load calculations and other
necessary parameters required for a building design. BNBC is a comprehensive code, which is developed using ACI,
ASCE (American Society of Civil Engineers), IBC (International Building Code), and UBC (Uniform Building Code)
codes. Though, BNBC revision is currently underway to adapt and address the new ACI code (318-2011); however,

Hossain, M. and Moutassem, F. / Journal of Buildings and Sustainability, 2017, Vol. 2, No. 2
33
use of factors to magnify load magnitudes is still being utilized by the current and updated appendix sections of the
ACI code (318-2011). Moreover, the basic slender column design procedure has not been changed in the current
edition of the ACI code.
3. Slender Column Design Procedures
As suggested in the ACI Commentary 10.11.4, a compression member can be assumed braced if it is located in a
story in which the bracing elements (i.e., shear walls) have a stiffness that is substantial enough to limit lateral
deflection to the extent that the column strength is not substantially affected. Visual inspection can often make such a
determination. If not, the ACI Code 10.11.4 provides two quantitative criteria for determining if a story is treated as
non-sway or a sway frame. In one of the methods, it has been mentioned that if the Stability Index is less than 0.05,
then the frame is considered as braced. The Stability Index can be determined by using the equation (1).
(1)
where Q is the stability index, is the total factored vertical load in the story, Vu is the total factored shear load in the
story, lc is the height of the column measured center-to-center of the joints in the frame, and ∆0 is the first-order relative
deflection between the top and the bottom of the story due to Vu.
A frame could have both non-sway and sway effects. For a column, it could have a more substantial non-sway
effect than a sway effect and vice-versa. Primarily, Slenderness Ratio (kl/r) is determined for each column to determine
non-sway or sway effect. For a non-sway frame, a designer can neglect slenderness effect if and for a sway frame
slenderness effect can be neglected if klu/r < 22, where k is the effective height factor; lu is the unsupported height
taken as the clear distance between two floor slabs, beams, or other members providing lateral support; r is the radius
of gyration of the cross-section of the column associated with the axis about which bending is occur; M1 is the value
of the smaller end moment calculated from a conventional first-order elastic analysis (positive if the column is bent in
a single curvature and negative if it is bent in a double curvature); and M2 is the value of the larger factored end
moment on the column, and is always positive.
If a column is slender, it will fail by buckling into the shape of a sine wave when the load reaches a particular
value Pc, which is called the Euler buckling load or critical load that is given by the equation (2),
(2)
where E is the elastic modulus of the column and Imin is the minimum moment of inertia of the column. It is seen
that the buckling load decreases rapidly with the increase in the Slenderness Ratio (kl/r).
If a column falls under either a non-sway or a sway frame and crosses the limiting value, then a Moment
Magnification Factor (δns or δs) is required to be calculated. Steps used to compute a Non-Sway Moment Magnification
Factor (δns) are shown in the equations (3) to (6),
(3)
(4)
cu
u
lV
PQ
0
2
2min
kl
EIPc
d
gcIEEI
1
4.0
storythe in shearfactored Total
storya withinload dead Factoredd
Hossain, M. and Moutassem, F. / Journal of Buildings and Sustainability, 2017, Vol. 2, No. 2
34
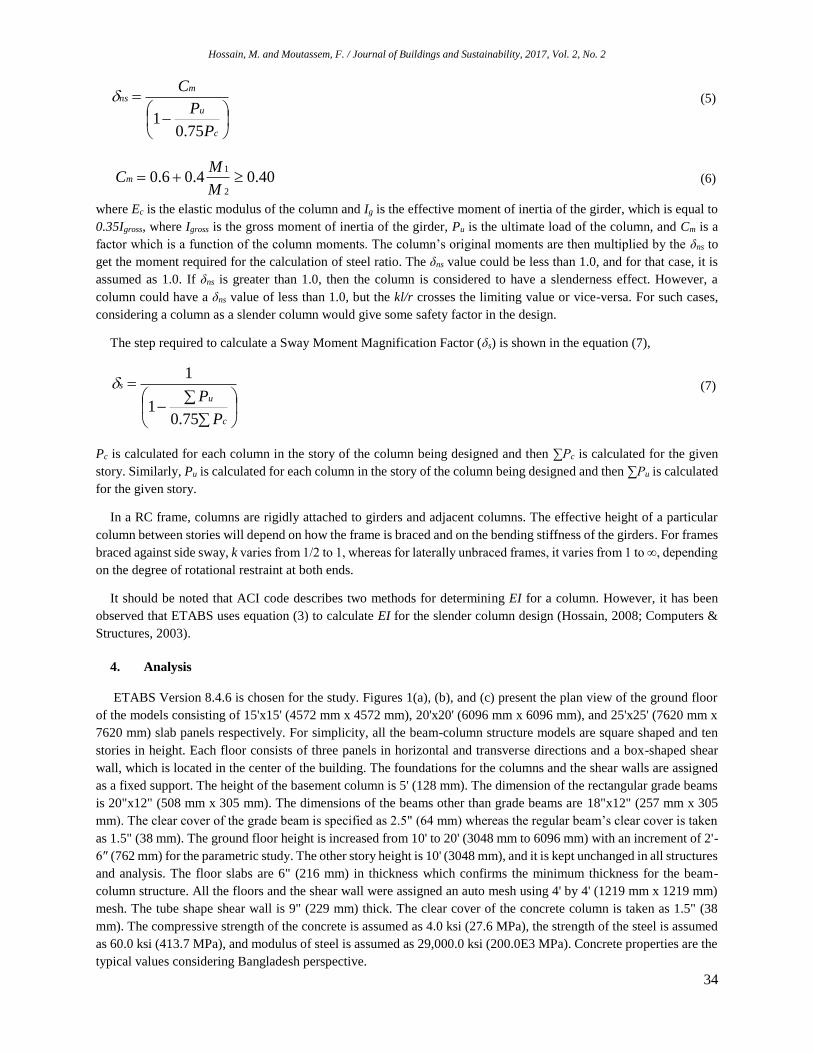
(5)
(6)
where Ec is the elastic modulus of the column and Ig is the effective moment of inertia of the girder, which is equal to
0.35Igross, where Igross is the gross moment of inertia of the girder, Pu is the ultimate load of the column, and Cm is a
factor which is a function of the column moments. The column’s original moments are then multiplied by the δns to
get the moment required for the calculation of steel ratio. The δns value could be less than 1.0, and for that case, it is
assumed as 1.0. If δns is greater than 1.0, then the column is considered to have a slenderness effect. However, a
column could have a δns value of less than 1.0, but the kl/r crosses the limiting value or vice-versa. For such cases,
considering a column as a slender column would give some safety factor in the design.
The step required to calculate a Sway Moment Magnification Factor (δs) is shown in the equation (7),
(7)
Pc is calculated for each column in the story of the column being designed and then ∑Pc is calculated for the given
story. Similarly, Pu is calculated for each column in the story of the column being designed and then ∑Pu is calculated
for the given story.
In a RC frame, columns are rigidly attached to girders and adjacent columns. The effective height of a particular
column between stories will depend on how the frame is braced and on the bending stiffness of the girders. For frames
braced against side sway, k varies from 1/2 to 1, whereas for laterally unbraced frames, it varies from 1 to ∞, depending
on the degree of rotational restraint at both ends.
It should be noted that ACI code describes two methods for determining EI for a column. However, it has been
observed that ETABS uses equation (3) to calculate EI for the slender column design (Hossain, 2008; Computers &
Structures, 2003).
4. Analysis
ETABS Version 8.4.6 is chosen for the study. Figures 1(a), (b), and (c) present the plan view of the ground floor
of the models consisting of 15'x15' (4572 mm x 4572 mm), 20'x20' (6096 mm x 6096 mm), and 25'x25' (7620 mm x
7620 mm) slab panels respectively. For simplicity, all the beam-column structure models are square shaped and ten
stories in height. Each floor consists of three panels in horizontal and transverse directions and a box-shaped shear
wall, which is located in the center of the building. The foundations for the columns and the shear walls are assigned
as a fixed support. The height of the basement column is 5' (128 mm). The dimension of the rectangular grade beams
is 20"x12" (508 mm x 305 mm). The dimensions of the beams other than grade beams are 18"x12" (257 mm x 305
mm). The clear cover of the grade beam is specified as 2.5" (64 mm) whereas the regular beam’s clear cover is taken
as 1.5" (38 mm). The ground floor height is increased from 10' to 20' (3048 mm to 6096 mm) with an increment of 2'-
6″ (762 mm) for the parametric study. The other story height is 10' (3048 mm), and it is kept unchanged in all structures
and analysis. The floor slabs are 6" (216 mm) in thickness which confirms the minimum thickness for the beam-
column structure. All the floors and the shear wall were assigned an auto mesh using 4' by 4' (1219 mm x 1219 mm)
mesh. The tube shape shear wall is 9" (229 mm) thick. The clear cover of the concrete column is taken as 1.5" (38
mm). The compressive strength of the concrete is assumed as 4.0 ksi (27.6 MPa), the strength of the steel is assumed
as 60.0 ksi (413.7 MPa), and modulus of steel is assumed as 29,000.0 ksi (200.0E3 MPa). Concrete properties are the
typical values considering Bangladesh perspective.
c
u
mns
P
P
C
75.01
40.04.06.02
1
M
MCm
c
u
s
P
P
75.01
1

Hossain, M. and Moutassem, F. / Journal of Buildings and Sustainability, 2017, Vol. 2, No. 2
35
Gravity loads include the live loads on the building and the self-weight of the building. In Bangladesh, only wind
and earthquake loads are taken as environmental loads. For this analysis, the imposed live load is considered as 60
psf (2.9E-3 MPa), and the dead load is 60 psf (2.9E-3 MPa). The deal load includes 20 psf (9.6E-4 MPa) of floor
finish, 30 psf (1.4E-3 MPa) of boundary wall, and 10 psf (4.8E-4 MPa) of false ceiling. The dead load from the
slabs, beams, and columns are calculated automatically by the ETABS using the unit weight of the concrete. The
unit weight of the concrete is taken as 150 lb/cubic feet (2403 kg/cubic meter). According to the BNBC, the live
load is fixed as 40 psf (1.9E-3 MPa) for a residential building; the live load varies from 75 to 150 psf (3.6E-3 to
7.2E-3 MPa) for other public buildings. For a practical point of view, the live load of the commercial building
models is considered to be more than residential buildings but lower than crowded public gathering places.
Figure 1. FEM Models Used for Parametric Study (Dimensions are in Feet)
(a) 15′x15′ (4572 mm x 4572 mm) Floor Panel (b) 20′x20′ (6096 mm x 6096 mm) Floor Panel
(c) 25′x25′ (7620 mm x 7620 mm) Floor Panel

Hossain, M. and Moutassem, F. / Journal of Buildings and Sustainability, 2017, Vol. 2, No. 2
36
The wind and earthquake loads are calculated following the BNBC standard for a commercial building in Dhaka.
From the BNBC table titled “Basic wind speeds for selected locations in Bangladesh,” the Basic Wind Speed (Vb) is
chosen as 130.5 mph (210 km/hr). The exposure type is selected as “Exposure A” because the building is sited in the
urban area. The windward coefficient is calculated as 1.4 from the BNBC article titled “Overall pressure coefficient
(Cp) for rectangular building with flat roofs.” As the structure is ranked as the standard occupancy structure, the
corresponding value of the Structural Importance Coefficient (CI) equals to 1.00. The wind load is assumed as acting
on the four faces of the building. From the Seismic Zone Map of Bangladesh, the Seismic Zone Coefficient (Z) is
taken as 0.15 corresponding to the seismic zone 2. In the basic design information, it has been acknowledged that the
building system is a dual system defined as the concrete with concrete IMRF (Intermediate Moment Resisting Frame).
So, from the BNBC, the Response Modification Coefficient for the Structural Systems (R) is taken as 9 for both
horizontal directions of the building. The Structural Importance Coefficient is taken as 1.00 for the earthquake
analysis, and it is same as the wind load analysis. The earthquake force is acting from both horizontal directions of
the building. The Structural Period is intended from “Method A” that is described in the BNBC. According to the
BNBC, the site soil characteristic is considered as S3. As it is a commercial building, the BNBC classified it as a
standard occupancy structure and ranked the Structural Importance Category as IV. In the model, the following loads
are used: dead load (DL), live load (LL), wind load from X direction (WLx), wind load from Y direction (WLy),
earthquake load from X direction (EQx), and earthquake load from Y direction (EQy). The Wind and the earthquake
loads are applied perpendicular to the building axis. No eccentric load is applied to the model for simplicity. The
ETABS version 8.4.6 uses the default cases of load combination of ACI code (318-1999). Total 18 load cases are
considered in the models.
4.1 Parametric Study
Table.1 shows the floor panel sizes, column positions, column heights, column sizes, and periphery beam sizes,
which are used for the parametric study. In this parametric study, total 15 models (3 models for each floor panel size
with 5 varying column heights) are generated for the beam-column structure with a tube shape shear wall in the core
of the structure. So, among these 15 beam-column structures, a total of 45 ground floor columns are considered for
the slender column behavior analysis. The cross-section of columns and beams are selected from a practical point of
view.
Table 1. Parameters for parametric study
Floor panel
size
Column
position Column height @ ground level Column size
Periphery beams
size
15'x15' (4572 mm x
4572 mm)
Corner 10' to 20' @ 2'-6″ increment
(3048 mm to 6096 mm @ 762
mm increment)
14"x14" (356 mm x 356
mm)
10"x18" (254 mm x 457
mm)
Edge similar 15"x15"
(381 mm x 381
mm)
Inner similar 16"x16"
(406 mm x 406
mm)
20'x20'
(6096 mm x 6096 mm)
Corner similar
15"x15"
(381 mm x 381 mm)
Similar Edge similar
17"x17"
(432 mm x 432 mm)
Inner similar
18"x18"
(457 mm x 457
mm)
25'x25' (7620 mm x
7620 mm)
Corner similar
16"x16"
(406 mm x 406
mm)
Similar Edge similar 20"x20"
(508 mm x 508
mm)
Inner similar 24"x24"
(610 mm x 610
mm)

Hossain, M. and Moutassem, F. / Journal of Buildings and Sustainability, 2017, Vol. 2, No. 2
37
For reinforced concrete column structure, a slab panel size larger than 25' (7620 mm) is not a common scenario.
The slab panel greater than 25′ (7620 mm) needs special design requirements. A slab panel smaller than 15' (4572
mm) does not frequently use in commercial buildings because the column spacing is small for ground floor car parking.
The beam dimensions were kept the same for all the models because of the consistency in the analysis. After each
model is analyzed using ETABS, the moment values of the selected column end and design load for each targeted
column are extracted from the software. All the parameters are calculated using a spreadsheet and cross-checked each
time with the ETABS design output. Both δns and δs are determined, and relative graphs are plotted to describe the
behavior of the slender column under different conditions.
5. Results and Discussions
5.1 Critical Buckling Load
The limiting value of Slenderness Ratio (kl/r) is checked with the recommended ACI code guideline. According
to the ACI guideline, a column should be treated as a slender column if the value of the kl/r is greater than 34-12M1/M2.
The maximum value of 34-12M1/M2 that is limited by the ACI code is 40.0. M1 and M2 are the column end moments,
and M1 is less than M2. If the column exhibits double curvature, then the ratio of M1/M2 will represent a negative value,
and if the column exhibits single curvature then the ratio will have a positive value. The curvature can be recognized
by reading the sign of the end moments computed by ETABS. If the end moments represent the same sign (positive
or negative), then the column has a single curvature or vice-versa.
Figure 2 represents Slenderness Ratio (kl/r) for three column locations with corresponding Critical Buckling Load
(Pc). According to Figure 2(a), the value of kl/r is greater or equals to 40 for six corner columns. The Pc value decreased
by around 25% when the column height increased by 2.5' (762 mm).
Pc verses kl/r for the edge column is illustrated in Figure 2(b). It can be seen that the kl/r is greater than 40.0 for
three edge columns. The 20' (6096 mm) edge column for the 25'x25' (6096 mm x 6096 mm) panel size showed
slenderness effect. The size of the edge column is 17"x17" (432 mm x 432 mm) for the 25'x25' (7620 mm x 7620 mm)
size panel. The steel ratio increases by more than 8% in some cases if the column size is reduced from the 17"x17"
(432 mm x 432 mm) dimensions. The kl/r is greater than 40.0 for one column in the 15'x15' (4572 mm x 4572 mm)
size panel.
Figure 2(c) shows the kl/r for the inner columns. It is seen that three inner columns showed slenderness effect. No
column showed slenderness behavior for the 25'x25' (7620 mm x 7620 mm) slab panel. In the FEM model, the steel
ratio increased such that the column fails due to over reinforcement if the column dimension is reduced for the 25'x25'
(7620 mm x 7620 mm) slab panel. The column section for the 25'x25' (7620 mm x 7620 mm) slab panel is increased
compared to the 20'x20' (6096 mm x 6096 mm) slab panel to keep the steel ratio in the tolerable limit. For this reason,
the column of this slab panel does not show slenderness compared to the lower sized slab panels. For all three panels,
the Pc value decreases by around 25.0% while the column height is increased from 17.5' (5334 mm) to 20.0' (6096
mm). Therefore, it will not be wise to judge slenderness by the only variation in the PC and the kl/r. From the above
discussions and observations, it can be concluded that corner columns are most sensitive to become slender.

Hossain, M. and Moutassem, F. / Journal of Buildings and Sustainability, 2017, Vol. 2, No. 2
38
Figure 2. Critical Buckling Load (Pc) for Different Column Positions
5.2 Ration of Ultimate Load to Critical Buckling Load
Figure 3 shows three column locations to understand the influence of loads in column buckling. Figure 3(a)
represents the ratio of Pu/Pc with kl/r. According to Figure 3(a), the slenderness needs to be considered when the
design load (Pu) reaches 30% of the critical buckling load (Pc). According to Figures 3(b) and 3(c), the edge and the
corner columns showed a slenderness behavior when Pu is increased by more than 40% of Pc. The above observation
also proves that the corner columns showed a higher slenderness behavior when compared to the edge and inner
columns.
0
5000
10000
15000
20000
25000
0 20 40 60
Pc
(kip
)
Slenderness Ratio (kl/r)
15'x15' Panel 20'x20' Panel 25'x25' Panel
0
5000
10000
15000
20000
25000
0 20 40 60
Pc
(kip
)
Slenderness Ratio (kl/r)
15'x15' Panel 20'x20' Panel 25'x25' Panel
0
5000
10000
15000
20000
25000
0 20 40 60
Pc
(kip
)
Slenderness Ratio (kl/r)
15'x15' Panel 20'x20' Panel 25'x25' Panel
(a) Corner Column
(b) Edge Column
(c) Inner Column

Hossain, M. and Moutassem, F. / Journal of Buildings and Sustainability, 2017, Vol. 2, No. 2
39
Figure 3. Ratio of Ultimate Column Load (Pu) to Critical Buckling Load (Pc) for Different Column Positions
5.3 Non-Sway Moment Magnification Factor
Non-sway Moment Magnification Factor (δns) is considered when the slenderness of a column predominantly
depends on the gravity load effect. The increase of dead and live load is directly influenced by this type of slenderness
behavior. For this study, the columns are checked for the 1.4DL+1.7LL load combination, since this load combination
provides maximum gravity load on the structures. The moment and the load data are collected from the ETABS
software calculation. Figure 4 is illustrated to understand the δns for the columns at different locations. If δns is higher
than 1.0, then it is multiplied by the column moments to magnify the value and is then used to calculate the steel ratio
required. However, if the value is lower than 1.0, then it is taken as 1.0 considering the safety factor.
0.00
0.20
0.40
0.60
0 20 40 60
Pu/P
c
Slenderness Ratio (kl/r)
15'x15' Panel 20'x20' Panel 25'x25' Panel
0.00
0.20
0.40
0.60
0 20 40 60
Pu/P
c
Slenderness Ratio (kl/r)
15'x15' Panel 20'x20' Panel 25'x25' Panel
0.00
0.20
0.40
0.60
0 20 40 60
Pu/P
c
Slenderness Ratio (kl/r)
15'x15' Panel 20'x20' Panel 25'x25' Panel
(a) Corner Column
(b) Edge Column
(c) Inner Column

Hossain, M. and Moutassem, F. / Journal of Buildings and Sustainability, 2017, Vol. 2, No. 2
40
Figure 4. Non-Sway Moment Magnification Factors (δns) for Different Column Positions
Figure 4(a) shows the δns variations for the corner columns. The δns value is increased by about 43.0% when column
height is increased from 17.5' (5334 mm) to 20.0' (6096 mm) for the 15'x15' (4572 mm x 4572 mm) slab panel. The
δns value is increased by about 25.0% when column height is increased from 15.0' (4572 mm) to 17.5' (5334 mm) for
the 15'x15' (4572 mm x 4572 mm) slab panel. Also the δns is increased by about 59.0% for the same increment in
column height (17.5' to 20.0') for the 20'x20' (6096 mm x 6096 mm) slab panel and δns is increased by about 72.0%
for the 25'x25' (7620 mm x 7620 mm) slab panel. So, there is a significant increase in the δns value which is observed
when the column height increases from 17.5' (5334 mm) to 20.0' (6096 mm).
0.00
0.50
1.00
1.50
2.00
0 20 40 60
δns
Slenderness Ratio (kl/r)
15'x15' Panel 20'x20' Panel 25'x25' Panel
0.00
0.50
1.00
1.50
2.00
0 20 40 60
δns
Slenderness Ratio (kl/r)
15'x15' Panel 20'x20' Panel 25'x25' Panel
0.00
0.50
1.00
1.50
2.00
0 20 40 60
δns
Slenderness Ratio (kl/r)
15'x15' Panel 20'x20' Panel 25'x25' Panel
(a) Corner Column
(b) Edge Column
(c) Inner Column
Hossain, M. and Moutassem, F. / Journal of Buildings and Sustainability, 2017, Vol. 2, No. 2
41
According to Figure 2(b), the value for kl/r is higher than 40.0 for one column in the 15'x15' (4572 mm x 4572 mm)
panel but according to Figure 4(b) and the ETABS calculation, the δns value is lower than 1.0. If the design engineers
only rely on the ETABS analysis and design output, then it is highly likely that it may result in an under reinforced
column design. According to the ACI code approach, the 17.5' (5334 mm) column should be considered as a slender
column, but ETABS does not consider it as a slender column as δns value is lower than 1.0. It is seen that δns for a
corner column exceed 1.0 only for three columns even though from slenderness point of view six columns should be
designed as slender columns. The variation between ETABS and ACI analysis shows that the ACI code design
approach is conservative.
Figure 4(b) is illustrated for the δns against the kl/r for the edge columns of the three panels. The δns value is increased
by about 74.0% while the column height is increased from 17.5' (5334 mm) to 20.0' (6096 mm) for the 15'x15' (4572
mm x 4572 mm) panel. The δns value is increased by about 84.0% while column height is increased from 17.5' (5334
mm) to 20.0' (6096 mm) for the 20'x20' (6096 mm x 6096 mm) slab panel and it is increased by about 36.0% for the
25'x25' (7620 mm x 7620 mm) panel. The δns value is not significantly high for the edge column for the 25'x25' (7620
mm x 7620 mm) panel compared to the other two panels. Similar to the corner column, a drastic change is observed
when column height is increased from 17.5' (5334 mm) to 20.0' (6096 mm) for the edge column.
Figure 4(c) is illustrated for the δns against kl/r for the inner columns of the three slab panels. The δns value is
increased by about 45.0% while the column height is increased from 17.5' (5334 mm) to 20.0' (6096 mm) for the
15'x15' (4572 mm x 4572 mm) slab panel size. The δns is increased by about 43.0% for the column while the height is
increased from 17.5' (5334 mm) to 20.0' (6096 mm) for the 20'x20' (6096 mm x 6096 mm) slab panel size. The δns is
increased by about 20.0% for the 25'x25' (7620 mm x 7620 mm) slab panel for the same height increment of the
column. Compared to the other two column locations, the value of δns is not much higher for the inner column for all
the panel size. For this reason, it is concluded that the inner column is not slender susceptible compared to the corner
and the edge column.
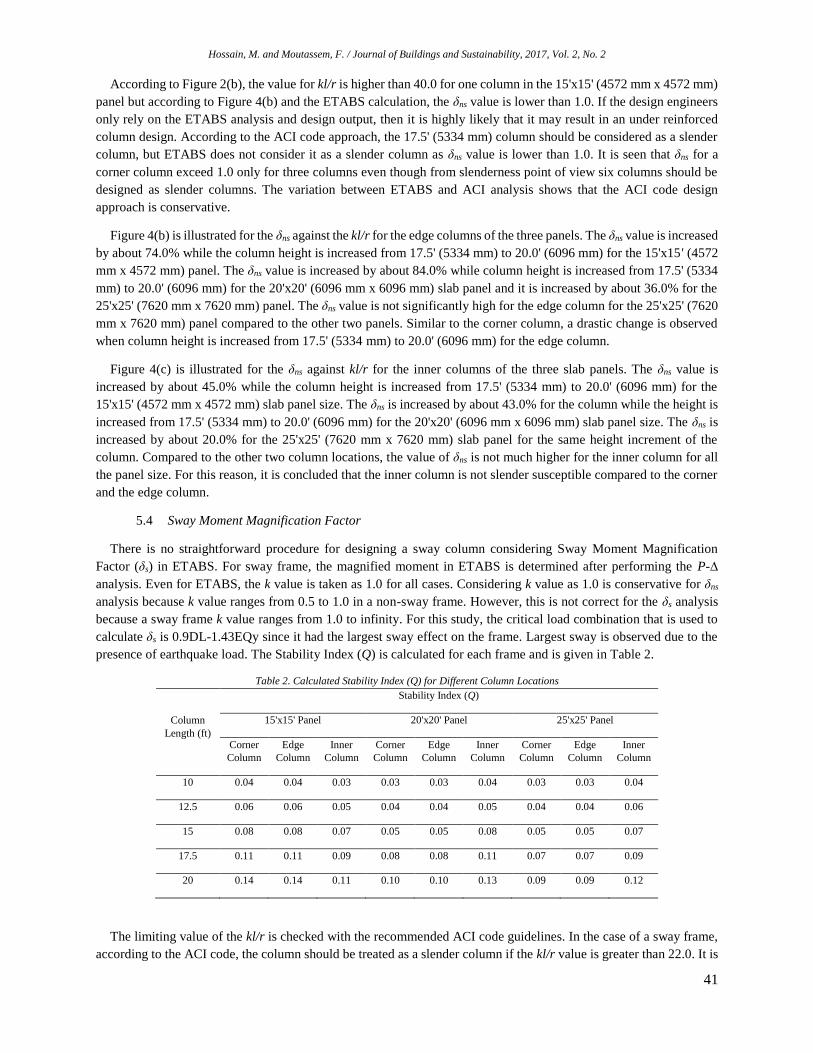
5.4 Sway Moment Magnification Factor
There is no straightforward procedure for designing a sway column considering Sway Moment Magnification
Factor (δs) in ETABS. For sway frame, the magnified moment in ETABS is determined after performing the P-∆
analysis. Even for ETABS, the k value is taken as 1.0 for all cases. Considering k value as 1.0 is conservative for δns
analysis because k value ranges from 0.5 to 1.0 in a non-sway frame. However, this is not correct for the δs analysis
because a sway frame k value ranges from 1.0 to infinity. For this study, the critical load combination that is used to
calculate δs is 0.9DL-1.43EQy since it had the largest sway effect on the frame. Largest sway is observed due to the
presence of earthquake load. The Stability Index (Q) is calculated for each frame and is given in Table 2.
Table 2. Calculated Stability Index (Q) for Different Column Locations
Column
Length (ft)
Stability Index (Q)
15'x15' Panel 20'x20' Panel 25'x25' Panel
Corner
Column
Edge
Column
Inner
Column
Corner
Column
Edge
Column
Inner
Column
Corner
Column
Edge
Column
Inner
Column
10 0.04 0.04 0.03 0.03 0.03 0.04 0.03 0.03 0.04
12.5 0.06 0.06 0.05 0.04 0.04 0.05 0.04 0.04 0.06
15 0.08 0.08 0.07 0.05 0.05 0.08 0.05 0.05 0.07
17.5 0.11 0.11 0.09 0.08 0.08 0.11 0.07 0.07 0.09
20 0.14 0.14 0.11 0.10 0.10 0.13 0.09 0.09 0.12
The limiting value of the kl/r is checked with the recommended ACI code guidelines. In the case of a sway frame,
according to the ACI code, the column should be treated as a slender column if the kl/r value is greater than 22.0. It is

Hossain, M. and Moutassem, F. / Journal of Buildings and Sustainability, 2017, Vol. 2, No. 2
42
observed that the value for kl/r was higher than 22.0 for all the 15 corner columns. Therefore, the columns which are
neglected due to a lower value (i.e., less than 1.0) of δns must be considered carefully for the sway moment effect even
if the value is low. It has been checked that these 15 columns Stability Index (Q) are lower than 5.0% for the five
columns, but according to Figure 5(a), it is seen that even they are in the non-sway frame but have slenderness effect.
The kl/r value is nearly 100 for the 25'x25' (7620 mm x 7620 mm) slab panel and 20' (6096 mm) column. The 20'
(6096 mm) column is very slender and requires a second order computer analysis. Therefore, this concludes that
slenderness effect occurs in all cases for the corner column.
Figure 5. Sway Moment Magnification Factors (δs) for Different Column Positions
Figure 5(b) presents δs versus kl/r for the 15 edge columns for the three panels, and all the columns have a sway
effect similar to the corner columns. The kl/r is more than 100.0 for the 20' (6096 mm) column for the 25'x25' (7620
1.00
1.05
1.10
1.15
1.20
0 30 60 90 120
δs
Slenderness Ratio (kl/r)
15'x15' Panel 20'x20' Panel 25'x25' Panel
1.00
1.05
1.10
1.15
1.20
0 30 60 90 120
δs
Slenderness Ratio (kl/r)
15'x15' Panel 20'x20' Panel 25'x25' Panel
1.00
1.05
1.10
1.15
1.20
0 30 60 90 120
δs
Slenderness Ratio (kl/r)
15'x15' Panel 20'x20' Panel 25'x25' Panel
(a) Corner Column
(b) Edge Column
(c) Inner Column

Hossain, M. and Moutassem, F. / Journal of Buildings and Sustainability, 2017, Vol. 2, No. 2
43
mm x 7620 mm) slab panel. So, the column needs second order computer analysis. From comparing Figures 5(a) and
(b) it is seen that value of the δs varies from 1.0 to 1.18. The 15′x15′ (4572 mm x 4572 mm) size panel showed higher
δs values compared to the 25′x25′ (7620 mm x 7620 mm) size panel but another way around while compared the kl/r.
For the 25'x25' (7620 mm x 7620 mm) panel, the kl/r values are higher in comparison to the other two panels.
Therefore, considering only δs or kl/r would not be sufficient to compute column slenderness.
In Figure 5(c), the δs value is plotted against the kl/r for the inner column. Except for the 20′ (6096 mm) column,
no kl/r value exceeds 100.0, but every column has a slenderness effect. The increment of δs in a column for the 15'x15'
(4572 mm x 4572 mm) slab panel is steeper than the other two panels. From the preceding description of δns, it was
concluded that slenderness effect in the inner column is as important as it is for other two locations.
5.5 ACI Code Limitations
According to the ACI code, for compression members in the non-sway frames, the effect of slenderness may be
neglected when klu/r≤34-12M1/M2, where 34-12M1/M2 is not taken higher than 40.0. So, if (klu/r)/(34-12M1/M2) is less
than 1.0, then the column will not show any slenderness effect. Figure 6(a) is plotted for the δns against the (klu/r)/(34-
12M1/M2) for the beam-column frame structures. The dotted lines show the slenderness limits. It is seen that nine
columns exceeded the limit bounded by the ACI code. The column with a height greater than 20' (6096 mm) is at risk
of slenderness effect. Column heights ranging from 17.5' (5334 mm) to 20' (6096 mm) are substantially considered as
slender columns. In Figure 5(a) only one column δns value is higher than 1.0, but the (klu/r)/(34-12M1/M2) value is less
than 1.0 for that column. For three columns the ratio of the (klu/r)/(34-12M1/M2) is higher than 1.0, but the δns value is
less than 1.0. These four cases could be considered as an outlier considering the 45 columns result. So, from Figure
6(a) this can conclude that the guideline for considering δns is satisfactory.
Figure 6. ACI Code Limitations for the Non-Sway Moment Magnification Factor (δns) and Sway Moment Magnification Factors (δs)
0
1
2
0 0.5 1 1.5 2
δns
(klu/r)/(34-12M1/M2)
(a) Limit for Non-Sway Moment Magnification Factor (δns)
1
1.05
1.1
1.15
1.2
0 2.5 5
δs
(klu/r)/22
(b) Limit for Sway Moment Magnification Factor (δs)

Hossain, M. and Moutassem, F. / Journal of Buildings and Sustainability, 2017, Vol. 2, No. 2
44
According to the ACI code, for the compression member in a sway frames, the effect of slenderness may be
neglected when the klu/r value is less than 22.0. So, if the value of (klu/r)/22 is lower than 1.0, then the column will
not show any slenderness effect. Figure 6(b) is a plot of δs versus (klu/r)/22 for the beam-column frame structures. The
dotted lines indicate the limits for slenderness. From Figure 6(b) it is seen that all 45 columns have exceeded the limit
bounded by the ACI code. The column with a height higher than the 20' (6096 mm) is at risk of slenderness effect.
Column heights ranging from 17.5' (5334 mm) to 20' (6096 mm) are substantially considered as slender columns. So,
from Figure 6(b) this concludes that the guideline for considering δs is satisfactory, and every column is at risk for the
sway effect even it may not be in danger for the non-sway effect. So, the designer should check a column both for the
non-sway and the sway effect.
6. Conclusions and Recommendations
The objective of this study is to understand the effects of column design inputs on the slenderness of RC columns
for beam-column frame structures. The study is limited considering symmetric beam-column frame structures with
only ten stories high. Based on the limited study and from the above discussions, it can be concluded that:
1. Every RC frame in a structure needs to be treated as a sway frame since ground floor columns in the structure
have a Sway Moment Magnification Factor (δs) of varying magnitudes. So, if a designer uses ETABS, then
it is necessary to run the P-∆ analysis option with the specified load combination.
2. Corner columns are more sensitive to becoming slender in comparison to the edge and the inner columns.
For a corner column, the bi-axial moment is not balanced, but it is partially balanced for an edge column and
mostly balanced for an inner column. A corner column is most likely to become slender due to the presence
of the imbalanced moment.
3. The effect of Non-Sway Moment Magnification Factor (δns) is higher than Sway Moment Magnification
Factor (δs). The column that is longer or equal to 17.5' (5334 mm) is vulnerable due to the higher value of
δns. The variation in δns sometimes increases significantly when the column height is increased from 17.5'
(5334 mm) to 20.0' (6096 mm). This sudden increment in δns value will affect the steel ratio of the column.
4. The structural models are developed considering a commercial building located in a moderate earthquake
influence zone and occupancy. In Bangladesh as other two earthquakes influence zones are present, so it is a
need to study the effect of slenderness in columns in different earthquake zones and another occupancy, i.e.,
residential.
5. The study is done considering increment of all columns of a particular floor level. In Bangladesh, it is
observed that only columns in one or two frame make double height while other columns keep in nominal
height. So, the influence of slenderness in this type of building requires a thorough study.
6. The 15 models developed by ETABS are square shape, and all the columns considered in these models have
a square cross-section. Rectangular and irregular shapes of building with different column shapes require
further studying. A guideline for the design of slender columns in reference of Bangladesh could be
established by summarizing all the ACI Code.
REFERENCES
Abdallah, M. H., Shazly, M., Mohamed, H. M., Masmoudi, R., & Mousa, A. (2017). Nonlinear Finite Element
Analysis of Short and Long Reinforced Concrete Columns Confined with GFRP Tubes. Journal of
Reinforced Plastics and Composites, 36(13), 972-987.
ACI Committee 318., 1999. Building Code Requirements for Structural Concrete & Commentary: ACI 318-99,
American Concrete Institute, Detroit.
Bangladesh National Building Code., 2006. BNBC: Housing and Building Research Institute, Dhaka, Bangladesh.
Bazant, Z. P. & Kwon, Y. W. (1994). Failure of Slender and Stocky Reinforced Concrete Column: Tests of Size
Effect. Materials and Structures, 27, 79-90.
Computers & Structures Inc., 2003. ETABS: Integrated Building Design Software. Version 8.0. Berkeley, California,
USA.
Dobson, R. (2003). An Overview of P-Delta Analysis. New Steel Construction, 11(1).

Hossain, M. and Moutassem, F. / Journal of Buildings and Sustainability, 2017, Vol. 2, No. 2
45
Dobsin, R. A. & Arnot, K. (2003). Brief Overview of 2nd Order (or P Delta) Analysis. [Online]
http://www.cscworld.com/services/ techpaper.html.
Ferguson, P. M., Breen, J. E., & Jirsa, J. O., 1987. Reinforced Concrete Fundamentals, Fifth Edition. John Willy &
Sons, New York.
Halder, B. K., 2007. Design of Concrete Column Considering Slenderness Effect, Unpublished B. Sc. Thesis,
Department of Civil Engineering, Bangladesh University of Engineering and Technology.
Hassoun, M. N., 2005. Structural Concrete. Addison-Wesley Publishing Company Inc., New York.
Hossain, M., 2008. Effects of Slenderness in Reinforced Concrete Column Design, M. Engg. Research Project,
Department of Civil Engineering, Bangladesh University of Engineering and Technology.
Kumar, S., 2005. Treasure of RCC Design (In S.I Unit). Standard Book House, New Delhi.
Mollick, M. A. A. (1997). Experimental Study on P-Delta Effect on High Rise Building. Journal of Civil Engineering,
The Institute of Engineers, Bangladesh (IEB), 25(2).
Mustafa, S. A. A., Elhussieny, O. M., Matar, E. B., & Alaaser, A. G. (2016). Experimental and FE Analysis of
Stiffness Steel I-Column with Slender Sections. Ain Shams Engineering Journal, DOI:
https://doi.org/10.1016/j.asej.2016.12.001.
Nilson, A. H., Darwin, D., & Dolan, C. W., 2003. Design of Concrete Structures, 13th Edition. Tata McGraw-Hill
Publishing Company, New Delhi.
Rathbone, A. J. (2002). Second-Order effect, Who Needs Them. The Structural Engineer, 80(21), 19.
Rodrigues, E. A., Manzoli, O. L. Bitencourt Jr., L. A. G., dos Prazeres, P.G. C., & Bittencourt, T. N. (2015). Failure
Behavior Modeling of Slender Reinforced Concrete Columns Subjected to Eccentric Load. Latin American
Journal of Solids and Structures, 12, 520-541.
© This article is licensed under a Creative Commons Attribution 4.0 International License.