colusa_11_floodmgmt
TRANSCRIPT

Colusa Basin Watershed Assessment Final
H. T. Harvey & Associates15 December 2008
189
FLOOD MANAGEMENT
The eastern third of the Colusa Basin Watershed lies within the natural floodplain of the Sacramento River. The geology and geomorphology of the valley flat is described above. Its surficial geology records its pre-EuroAmerican condition: a surface covered with Sacramento River floodplain deposits which were deposited by slough channels in ribbons over the surface enclosing flood basins where finer grained sediment fell out as flood basin deposits, features that progressively disappeared from the old maps of the area as these overflow and swamplands were progressively reclaimed for agriculture. Kelley (1989) reflected on early explorers’ assessments of the scene:
The flatlands of the Valley were studded with oaks – high, stately trees with broad spreading crowns. The deep flowing Sacramento dominated the scene, its banks lined by a tangled riverine growth of tall oaks, sycamore, cottonwood, willow, and ash, about a mile in width. Men travelling horseback across the Valley floor in the late 1840s rode through open seas of wild oats and other grasses standing six feet high, stretching as far as the eye could see, and so thickly grown that their horse could only make their way with difficulty. In normal flow the Sacramento River is a big river, carrying about 5,000 cubic feet per second, but in flood times it can on occasion swell gigantically to such immense flows as 600,000 cubic feet per second. Indeed, the river’s channel could never contain within its natural banks the huge flows of water that almost annually poured out of the canyons of the northern Sierra Nevada. Signs of yearly flooding were everywhere apparent to Ensign Gabriel Moraga, reaching out, he estimated, to cover a band of territory perhaps five miles across on the eastern side and three miles on the west. In effect, each watercourse on the flat Sacramento Valley floor, from small stream to great river, flowed on an elevated platform, built up by the silt the streams deposited in their own beds. As floodwaters periodically rose to overtop the stream banks and spread out over the valley floor, natural levees were also built up, for as the overflowing waters lost velocity they dropped their remaining burden of silt most heavily on the land immediately bordering the rivers. From these more elevated locations paralleling the watercourses, floodwaters flowed down to pond in wide shallow basins lying between the streams, the broad expanse of these flood-created lakes often leaving nothing dry but the natural levees bordering the rivers and the higher lands next to them. Together, the ponds in the basins annually created a vast inland sea a hundred miles long occupying the centerline of the Sacramento Valley which slowly drained back into the river channels and down through the delta during the spring months. In their lowest elevations, where the water ponded the longest, these basins immense swamps of tules (that is, large bulrushes), standing ten to fifteen feet high. The Indians built not only their homes but their boats and sleeping mats of these tall, woody reeds.
Naturally frequent and sustained flooding of the Colusa Basin Watershed’s low-lying lands, the Colusa Basin, was both a blessing and a curse. Hundreds of thousands of years of routine flooding of the watershed’s valley flat had built up its surface with fertile soils resting in a fair climate, but tremendous organization and effort was needed to realize much of the watershed’s latent agricultural potential. It would take excavating a tremendous length of the deep and wide irrigation and drainage canals and building up higher and higher flood control levees to battle the river flood. The early flood control efforts were decidedly locally driven, pushed forward by

Colusa Basin Watershed Assessment Final
H. T. Harvey & Associates15 December 2008
190
social leaders like the Colusa Sun editor Will S. Green and the farmers and landowners who invested time and money in the necessary work. However, these early efforts were destined to fail due partly to a lack of organization and physical conflicts with concurrent flood control levee building on the east bank of the river and partly because the local leaders and the national engineering experts continually underestimated what tremendous flood discharges the Sacramento could produce. Ultimately, the hastily shored-up levees were more uniformly bolstered and incorporated into the federal Sacramento River Flood Control Project, a project not substantially completed and deemed largely successful until the flood of February-March 1940. Levee breaks from that flood were shored up again by 1944, and although there had been widespread flooding of the Colusa Basin it was certainly much less than it could have been; the project had given people of the Colusa Basin Watershed some confidence that the major source of damaging floods had been controlled. Perhaps there is no better account of the broader political and cultural factors entwined in the history of reclamation and flood control efforts than that prepared by Kelley in Battling the Inland Sea (1989). Much of the historical summary in this section is taken from that account. We also found maps of some of the early detailed engineering planning studies which viewed over the decades of tried and failed project planning dovetail with Kelley’s history of the same. We also review the broadly ranging engineering reports of the DWR (1962, 1964, and 1990) to summarize the watershed’s more recent and relevant history of flood management. Even with the problem of Sacramento River overflow substantially solved, the watershed is left with a lesser but still serious and complicated flooding problem referred to in this assessment as the ‘residual flooding.’ Finally, we briefly review the comprehensive programs the CBDD and USBR have proposed to mitigate the residual flooding.
Pre-1850 Sources and Patterns of Flood Waters in the Colusa Basin Watershed
Before the Sacramento River Flood Control Project was substantially completed in 1944, general widespread flooding of the Colusa Basin Watershed was dominated by frequent flood overflows from the Sacramento River. The natural levee on the west side of the Sacramento River generally held back its floodwaters at the upstream end of the watershed, but because the slope of the river was changing, these levees weren’t enough beginning at Hamilton Bend about 7 mi north of Colusa. The natural geomorphic tendency for the past hundreds of thousands of years was for the Sacramento to drop some of its silt load and flood broadly over its bank, thereby becoming more gradually sloped and narrowing the banks. Large flood flows commonly gushed out onto the upper Colusa Basin from ‘seven-mile’ slough (also known as Cheney Slough) and generally along that 7-mi stretch. The town of Colusa lay on a somewhat more elevated natural levee deposit protecting it from most flood overflow. Just downstream from Colusa, the Sacramento River almost annually poured floodwaters out to the east into Sutter Basin and out to the west into the lower Colusa Basin via Upper Sycamore Slough and multiple locations downstream from Colusa to Knights Landing. As Kelley (1989) explained:
Upstream from Colusa the Sacramento River flows with a strong current, for its bed, though relatively flat, has a significant fall: about thirty feet in elevation in the twenty river-miles above town. In this reach, therefore, the Sacramento winds tortuously back and forth within a wide bed, for the river has power enough to cut into the banks on either side, forcing them three quarters of a mile apart. Meandering between these banks, the Sacramento has actively formed loops and
Colusa Basin Watershed Assessment Final
H. T. Harvey & Associates15 December 2008
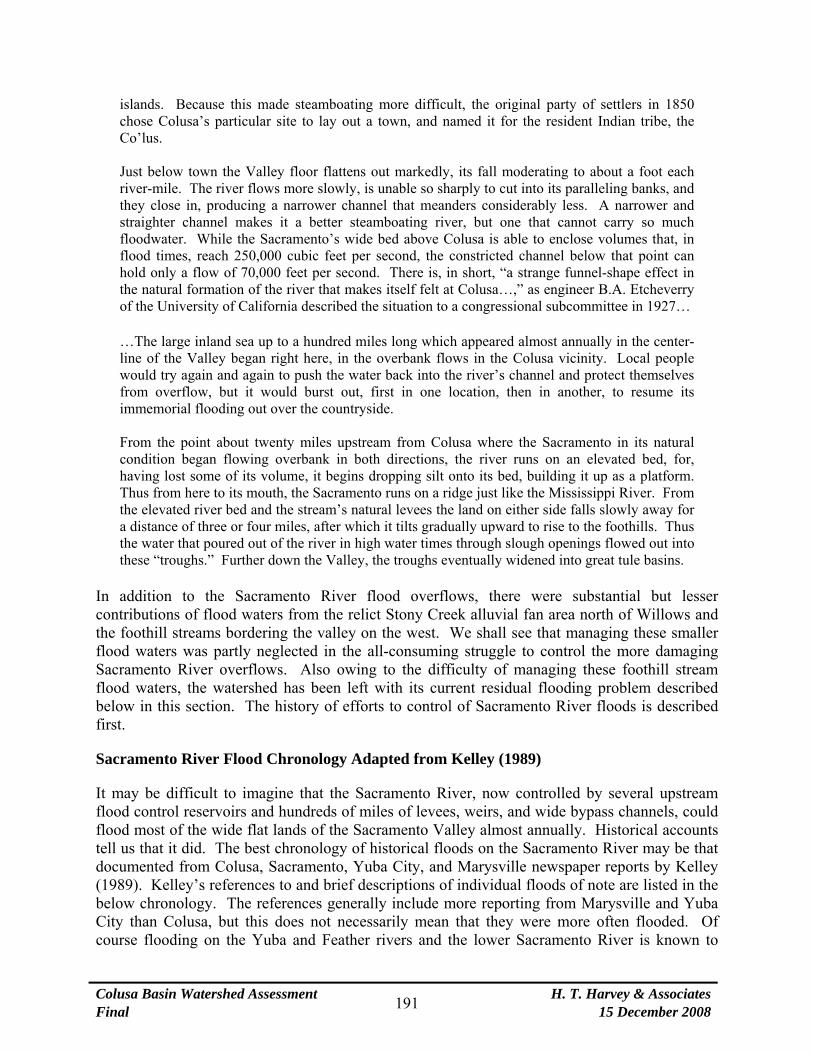
191
islands. Because this made steamboating more difficult, the original party of settlers in 1850 chose Colusa’s particular site to lay out a town, and named it for the resident Indian tribe, the Co’lus. Just below town the Valley floor flattens out markedly, its fall moderating to about a foot each river-mile. The river flows more slowly, is unable so sharply to cut into its paralleling banks, and they close in, producing a narrower channel that meanders considerably less. A narrower and straighter channel makes it a better steamboating river, but one that cannot carry so much floodwater. While the Sacramento’s wide bed above Colusa is able to enclose volumes that, in flood times, reach 250,000 cubic feet per second, the constricted channel below that point can hold only a flow of 70,000 feet per second. There is, in short, “a strange funnel-shape effect in the natural formation of the river that makes itself felt at Colusa…,” as engineer B.A. Etcheverry of the University of California described the situation to a congressional subcommittee in 1927… …The large inland sea up to a hundred miles long which appeared almost annually in the center-line of the Valley began right here, in the overbank flows in the Colusa vicinity. Local people would try again and again to push the water back into the river’s channel and protect themselves from overflow, but it would burst out, first in one location, then in another, to resume its immemorial flooding out over the countryside. From the point about twenty miles upstream from Colusa where the Sacramento in its natural condition began flowing overbank in both directions, the river runs on an elevated bed, for, having lost some of its volume, it begins dropping silt onto its bed, building it up as a platform. Thus from here to its mouth, the Sacramento runs on a ridge just like the Mississippi River. From the elevated river bed and the stream’s natural levees the land on either side falls slowly away for a distance of three or four miles, after which it tilts gradually upward to rise to the foothills. Thus the water that poured out of the river in high water times through slough openings flowed out into these “troughs.” Further down the Valley, the troughs eventually widened into great tule basins.
In addition to the Sacramento River flood overflows, there were substantial but lesser contributions of flood waters from the relict Stony Creek alluvial fan area north of Willows and the foothill streams bordering the valley on the west. We shall see that managing these smaller flood waters was partly neglected in the all-consuming struggle to control the more damaging Sacramento River overflows. Also owing to the difficulty of managing these foothill stream flood waters, the watershed has been left with its current residual flooding problem described below in this section. The history of efforts to control of Sacramento River floods is described first.
Sacramento River Flood Chronology Adapted from Kelley (1989)
It may be difficult to imagine that the Sacramento River, now controlled by several upstream flood control reservoirs and hundreds of miles of levees, weirs, and wide bypass channels, could flood most of the wide flat lands of the Sacramento Valley almost annually. Historical accounts tell us that it did. The best chronology of historical floods on the Sacramento River may be that documented from Colusa, Sacramento, Yuba City, and Marysville newspaper reports by Kelley (1989). Kelley’s references to and brief descriptions of individual floods of note are listed in the below chronology. The references generally include more reporting from Marysville and Yuba City than Colusa, but this does not necessarily mean that they were more often flooded. Of course flooding on the Yuba and Feather rivers and the lower Sacramento River is known to

Colusa Basin Watershed Assessment Final
H. T. Harvey & Associates15 December 2008
192
have been exacerbated by massive sediment discharges from the hydraulic mining operations in the Sierra Nevada. It’s not clear how much the mining debris would have exacerbated flooding in the Colusa Basin Watershed. There have been fewer reports out of Colusa probably reflecting its elevated location on a high natural levee deposit of the Sacramento River. As Kelley (1989) wrote:
Colusa’s site, however, was sufficiently high above the Sacramento so that, unlike Yuba City and Marysville, in its history it has never itself been actually flooded. However, it has been much more likely to be entirely surrounded for long periods by flooded territory. Colusa borders a much larger river, and it sat in the midst of what then were wide tule swamps that encircled it, making the town in floodtimes an island in a sea of floodwaters.
Failure of Early Privately Constructed Flood Protections
After 1850, the new settlers of the “overflow lands” on the valley flat did what they could to provide adequate irrigation, drainage, and flood protection on their individual and collective parcels, but these relatively small uncoordinated projects were practically failing with each new flood, failing both because they were too small and because they were part of an uncoordinated fabric of small projects dotting a broad floodplain. Flood protection of one small area was generally at the expense of still unprotected or less protected neighboring areas because the facilities typically followed rectilinear property boundaries which tended to cut off natural flow paths and concentrate flood flow to either side. On 31 May 1861, the state legislature passed AB 54: “An Act to provide for the Reclamation and Segregation of Swamp and Overflowed, and Salt Marsh and Tide Lands, donated to the State of California by Act of Congress.” AB 54 was intended to promote organization of “swampland districts” comprising sensibly organized blocks of overflow lands, whose collective landowners would benefit from economies of scale and cooperate to build more capital-intensive and more effective drainage and flood protection facilities. It was thought these facilities would be designed using engineering principles and consistent standards inspired by state supervision to be provided by an elected Board of Swampland Commissioners. Kelley (1989) explained:
A swampland district was to be created only if it encompassed an area of land “susceptible to one mode or system of reclamation,” by which was meant land contained “within natural boundaries” that comprised, in drainage terms, an integrated unit. In practice, the board understood this requirement to mean that a district would usually encompass an entire basin between main channels of the rivers. (Since the Valley’s rivers were in a depositional phase, laying down silts in their beds rather than scouring it out, their beds were higher than the lands on either side.) Individual basins could encompass more than a hundred thousand acres. When a petition came in from at least a third of the landowners in such an area, the commission would proceed to erect the district. Thereafter, it would draw on money held in the Swamp Land Fund (created from the sales of swamplands in that district) and on such additional funds as landowners might themselves have to provide, to build a single system of levees and outfall works for the entire district. Thus, there would be no levees around individual properties; rather, the entire basin would be drained and protected from flood, so that all land would be protected in common. (In 1862, taxing powers were given to the districts for this purpose.) These works, it will be noted, were not simply to be thrown up in the traditional, amateur way, they were to be

Colusa Basin Watershed Assessment Final
H. T. Harvey & Associates15 December 2008
193
planned, and by engineers appointed by the Board of Swamp Land Commissioners, not by the landowners.
But after 5 years of poor results under this program, the state legislature considered passage of AB 591 that would dissolve the Board of Swamp Land Commissioners and pass the same responsibility to the boards of supervisors of individual counties. Will S. Green of Colusa, is credited with representing Colusa and Tehama counties in influencing the legislature to pass a version of AB 591 in 1868: the Green Act or Green’s Land Act. According to Kelley (1989):
In his new legislation Green gave the Republicans’ “district” concept a revealing Democratic twist: he radically localized it. That is, when purchasers of half or more of a tract of swamp and overflowed land “susceptible of one mode of reclamation” – in practice, now, this simply meant whatever land the group owned – wished to build protective levees, they needed only to petition their local County Board of Supervisors for creation of a swampland district (which could be limited, now, to a single piece of property), informing them of their desire “to adopt measures to reclaim the same.” The board, in its turn, was to make certain that the lands to be included were properly described, after which it had no choice but to authorize formation of the district. It no longer possessed, in short, any authority to examine and approve, or disapprove, proposed levee systems around the property, their alignment or nature, or whether they interfered with the Valley’s natural drainage patterns…
Kelley (1989) lamented that:
. . . the result was that for the most of the next half-century, the Sacramento Valley would be scissored into a crazy-quilt of small reclamation districts whose levees followed property lines, not the Valley’s natural drainage pattern. Flood control anarchy, and therefore massive flood control failure, would be the result.
He was correct that an early opportunity to exact a more comprehensive and physically sensible flood control solution for the Sacramento Valley certainly had existed in the 1860s when millions of contiguous acres of overflow and swamp lands were held by the State, an opportunity that vanished with the passage of Green’s Land Act in 1868, which saw those millions of acres pass into private landownership within just 3 years, in individual blocks as large as 250,000 acres. Practically, as Kelley lamented, this meant that the ultimate configuration of flood control levees would not necessarily conform to the sinuous boundaries of natural drainage paths. And some of the earliest private levees would block the most common sense ‘path of least resistance’ pathways for safely directing the inevitable Sacramento River overflows, those pathways where there are today designated flood bypasses. And flood control anarchy did ensue. As early as 1867 Colusa County dammed off Wilkins Slough along the west bank of the river about 18 mi south of Colusa, but within a week of its completion local people in the Wilkins Slough area destroyed it. This was just the beginning of vigilante violence over flood control. By 1870, Reclamation District [RD] 108 had been established and completed some 45 mi of levee on the west bank of the Sacramento River from Knights Landing upstream to the vicinity of Upper Sycamore Slough. The first levee was built 60 ft back from the river bluff and just 3-ft-high, 1 ft above the highest river flood level known at the time. It closed 5 major sloughs (Upper

Colusa Basin Watershed Assessment Final
H. T. Harvey & Associates15 December 2008
194
Sycamore, Wilkins, Bear, Lower Sycamore, and Cache Sloughs) and pushed would be Colusa Basin floodwaters over the river’s east bank onto RD70 overflow lands lying in the Sutter Basin. Kelley (1989):
A group of swampland entrepreneurs whose lands lay in Colusa Basin revealed that they had pooled there interests to form Reclamation District 108, a giant organization that is still, more than a century later, in active existence. RD 108’s appearance was historically crucial. It did in fact initiate in a major way the building of levees on the Sacramento’s banks, and its doing so set the whole process of enclosing that stream rushing swiftly along thereafter in a spiral of hectic construction, each project spurred into being as riposte to prior ones.
Rather than seeking an injunction halting the levee construction, RD70 also sought to reclaim its own overflow lands and so began erecting a similar 40-mi-long levee on the east bank of the river from Knights Landing to the mouth of Butte Slough near Meridian. But closing off Sacramento River flood waters from the RD70 lands practically required closing off flood waters from entering Sutter Basin via the wide natural channel of Butte Slough. William H. Parks established RD5 and with the 3 April 1971 blessing of the Sutter County Board of Supervisors, proceeded to construct a levee-dam across Butte Slough: “Parks Dam” was to be built 6 ft above the high water mark and 8 ft wide on the top (Kelley 1989). Parks Dam would have pushed Sacramento River flood waters directly into upper Colusa Basin, over the still natural west river bank in the 5-mi long reach between Upper Sycamore Slough and the higher elevation lands at Colusa. By June 1871, RD108 resolved to cut off this gap and so acquired overflow lands to the north by forming RD124. RD108 extended their west bank levee to the north along the border of these newly annexed lands to block off the 5-mile-long and 7-mi-long gaps to the north between Colusa and Hamilton Bend. The RD124 levee was 5-ft-high and 4-ft-wide along the top. By the end of 1871, the west bank levee was 60 mi long, extending from Knights Landing to Hamilton Bend, the entire floodprone eastern border of the Colusa Basin Watershed. At the same time, Parks would report to the Sutter County Board of Supervisors that his levee-dam was completed across Butte Slough and recommended to the Board that caretakers be placed on the dam to guard it from vandals. Three weeks later during a night when rising river flows were pooling along the face of Park Dam, “masked men arrived at the structure, overpowered the guards, and cut the structure at 2 places between Butte Slough and the highlands bordering Sutter Buttes” (Kelley 1989). Five hundred ft of the dam blew out and Parks immediately committed to rebuilding it, which he did 3 more times over the next 4 years. In a series of events Kelley (1989) described as the “Parks Dam War” it would also fail 3 more times, twice by the river and finally at the hands of angry RD70 residents. RD108’s 6-ft high, 60-mi-long west bank levee was saved from the threat of Parks Dam but it was still not enough to protect the Colusa Basin Watershed from frequent damaging floods.
In 1889, the people of Colusa County flung themselves into an almost desperate outburst of levee building, putting up many miles of costly new levee, but it was all lost labor. In 1892, after a huge storm, the Sacramento reached its highest mark ever at Colusa, there were many levee breaks above and below town on both sides of the river, and thereafter Colusa County people seem to have fallen back exhausted, unable to do more. (Kelley 1989).

Colusa Basin Watershed Assessment Final
H. T. Harvey & Associates15 December 2008
195
Some 20 years after the Parks Dam controversy ended, Kelley (1989) quoted the Colusa Sun commenting that “The landowners of 108 expect to be drowned out about two years in five. They fight the water like heroes.” After these years of continually struggling against the river and repairing the west bank levee, one of RD108’s largest landowners and leading flood fighters, A. H. Rose, now State Commissioner of Public Works, reported the state of affairs to governor Markham, as told by Kelley (1989):
Looking out on the Sacramento Valley in 1895, a quarter of a century after he and his fellow investors had launched RD 108, Commissioner Rose saw a discouraging scene. Vast sums of money, he remarked in his first annual report to the governor, had been spent on levees, and much of it had been wasted. The subject of flood control in the Sacramento Valley needed to be treated as a whole, he said, but instead the Valley “is divided into several hundred [independent] Reclamation Swamp Land or Protection Districts.” Some of them had natural boundaries, but most were “arbitrarily bounded by property or other lines.” Each district was supreme so far as the location and height of its levees were concerned, which in many cases they had built with no attention whatever to their effects on anyone else or on the river, “the prime object being the protection of the lands of their district according to the local objects to be obtained, which generally means the construction of levees powerful enough to overtop or force a break on the other side.” Quite out of their concern had been making certain that channelways were of appropriate size, or that there was suitable outfall for floodwaters to flow down valley. How had this happened? Reported Rose: “This unfortunate condition has been the direct outgrowth of the policy of the State to sell lands prior to their reclamation by the State; or even to prescribe the limits and locations of levees and drainage channels.”
Sacramento River Flood Chronology
1850 – January Two weeks of inundation damaged buildings within a mile from river in Sacramento. Afterwards, first levee in the Sacramento Valley constructed, entirely around the town of Sacramento.
1852 – March Caused Sacramento ring levee to fail and flooded Sacramento. Marysville also
flooded. 1852 – December Deeper inundation than January 1850. Entire valley south of Colusa under water.
Thousands of cattle drowned. 1853 – March Marysville was inundated 1 ft deeper than March 1852. 1860 – March flood 1861 – March widespread overflow in the flatlands 1861 – December part of “double-flood of 1861-1862 . . . lasting for more than a month…and far
exceeding anything people had earlier seen” 1862 – January “double-flood of 1861-1862 . . . The inland sea had rarely ever spread so widely
or had been so deep”

Colusa Basin Watershed Assessment Final
H. T. Harvey & Associates15 December 2008
196
1864 – December “heavy and pounding rains” 1866 – December Will S. Green: “Without doubt, more water passed down the valley [during the
flood] than ever before since its settlement by whites in the same length of time. . . . One sheet of water more than 20 miles across was reported to cover the valley floor between Marysville and Colusa. . . . The river tore out several large cuts in its east bank, and torrents of water flowed out into the tule lands.”
1867 – February “‘one continuous body of water’ many miles across straddling the whole course
of the Sacramento River from above Colusa southward. . . from three to eight miles wide on the west side of the river, perhaps half that area being covered on the east.”
1867 – December “Colusa Sun reports that town and its environs were ‘now an island; above,
below, to the right and left is one vast sheet of water. Between town and the Coast Range the water presents the appearance of an inland sea.’”
1868 – March “the area downriver from Colusa was experiencing the highest water it had ever
known. ‘The county … on either side,’ wrote Green, ‘is completely inundated.’” (p.118)
1872 – January “Caused winter rains of December 1871 and early January 1872. From Colusa,
Green observed that “great oceans of water…are to be seen in every direction from town” First edition of Parks Dam across the opening of Butte Slough was destroyed by “masked men” that “overpowered the guards and cut the structure at 2 places between Butte Slough and the highlands bordering Sutter Buttes.” (p. 160); “The Sacramento River reached its highest mark at Colusa since American Settlement.”
1874 – January “the rains continued, sweeping in from the southwest day after day, and the great
Sacramento River continued to swell” washing out the second construction of Parks Dam.
1875 – January “an enormous deluge of storm waters in early January battered the Valley day
after day and produced a catastrophic flood” on the Yuba and Feather Rivers. “…for many miles north and south of Colusa the Sacramento poured heavily through openings on the east bank…”, causing failure of the third construction of Parks Dam. (p. 169)
1875 – December “more disastrous flooding” 1876 – January RD70 levee on east bank of Sacramento River near the head of Butte Slough
failed and washed homes away in that district. District members subsequently cut fourth construction of Parks Dam. (p.170)
1878 – February “the Sacramento, which had been running higher than ever before because of
debris in its bed, burst through a levee downstream from the city of Sacramento.” (p. 181)
Colusa Basin Watershed Assessment Final
H. T. Harvey & Associates15 December 2008
197
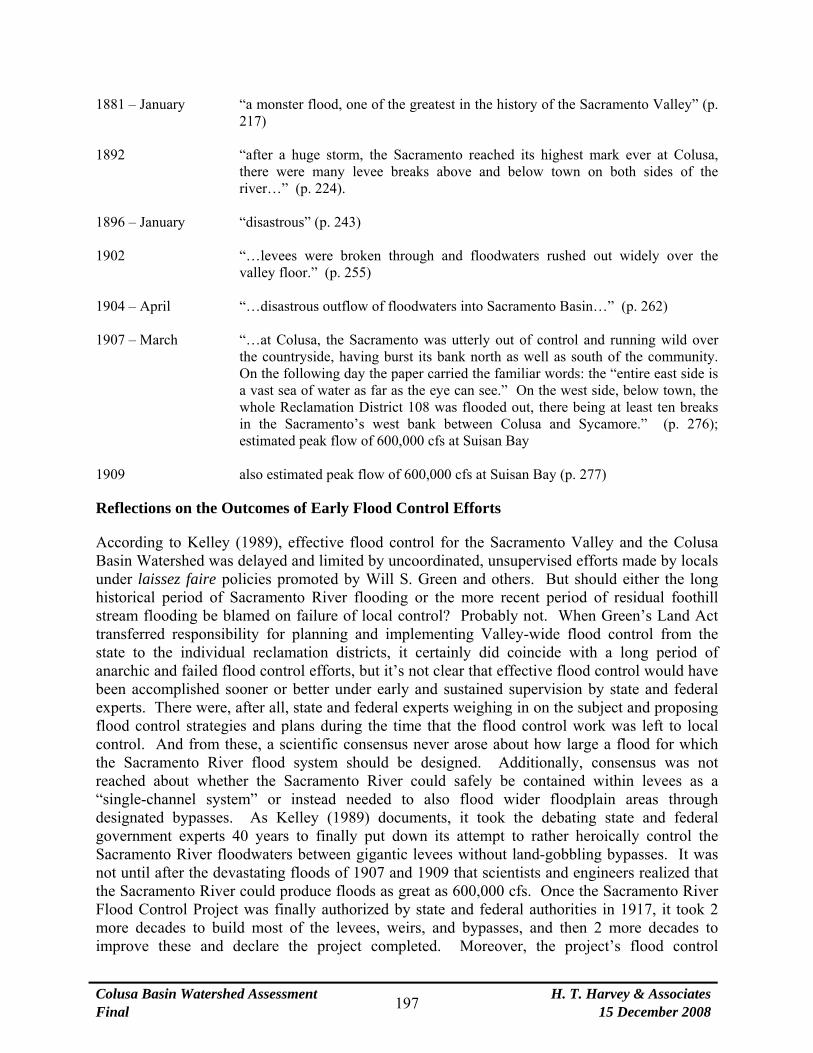
1881 – January “a monster flood, one of the greatest in the history of the Sacramento Valley” (p. 217)
1892 “after a huge storm, the Sacramento reached its highest mark ever at Colusa,
there were many levee breaks above and below town on both sides of the river…” (p. 224).
1896 – January “disastrous” (p. 243) 1902 “…levees were broken through and floodwaters rushed out widely over the
valley floor.” (p. 255) 1904 – April “…disastrous outflow of floodwaters into Sacramento Basin…” (p. 262) 1907 – March “…at Colusa, the Sacramento was utterly out of control and running wild over
the countryside, having burst its bank north as well as south of the community. On the following day the paper carried the familiar words: the “entire east side is a vast sea of water as far as the eye can see.” On the west side, below town, the whole Reclamation District 108 was flooded out, there being at least ten breaks in the Sacramento’s west bank between Colusa and Sycamore.” (p. 276); estimated peak flow of 600,000 cfs at Suisan Bay
1909 also estimated peak flow of 600,000 cfs at Suisan Bay (p. 277)
Reflections on the Outcomes of Early Flood Control Efforts
According to Kelley (1989), effective flood control for the Sacramento Valley and the Colusa Basin Watershed was delayed and limited by uncoordinated, unsupervised efforts made by locals under laissez faire policies promoted by Will S. Green and others. But should either the long historical period of Sacramento River flooding or the more recent period of residual foothill stream flooding be blamed on failure of local control? Probably not. When Green’s Land Act transferred responsibility for planning and implementing Valley-wide flood control from the state to the individual reclamation districts, it certainly did coincide with a long period of anarchic and failed flood control efforts, but it’s not clear that effective flood control would have been accomplished sooner or better under early and sustained supervision by state and federal experts. There were, after all, state and federal experts weighing in on the subject and proposing flood control strategies and plans during the time that the flood control work was left to local control. And from these, a scientific consensus never arose about how large a flood for which the Sacramento River flood system should be designed. Additionally, consensus was not reached about whether the Sacramento River could safely be contained within levees as a “single-channel system” or instead needed to also flood wider floodplain areas through designated bypasses. As Kelley (1989) documents, it took the debating state and federal government experts 40 years to finally put down its attempt to rather heroically control the Sacramento River floodwaters between gigantic levees without land-gobbling bypasses. It was not until after the devastating floods of 1907 and 1909 that scientists and engineers realized that the Sacramento River could produce floods as great as 600,000 cfs. Once the Sacramento River Flood Control Project was finally authorized by state and federal authorities in 1917, it took 2 more decades to build most of the levees, weirs, and bypasses, and then 2 more decades to improve these and declare the project completed. Moreover, the project’s flood control

Colusa Basin Watershed Assessment Final
H. T. Harvey & Associates15 December 2008
198
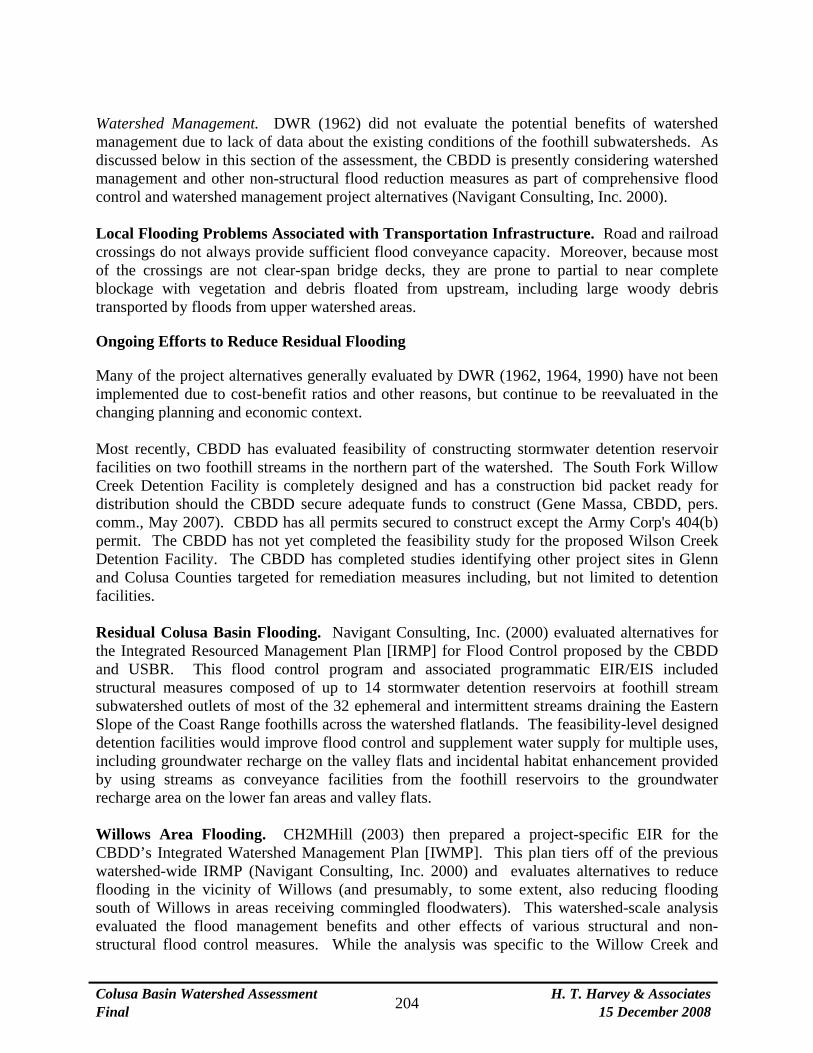
successes owe not just to its ultimate configuration of levees, weirs, and bypasses, but equally to its flood control reservoirs. These structures would not have arrived on the California landscape any earlier than they did, having come during a period of dam-building that was facilitated not just by scientific progress but also by the New Deal economic policies. It is also not as clear as Kelley suggested, that the Colusa Basin was “scissored into a crazy-quilt of small reclamation districts” which blocked natural flow patterns. The Colusa Basin exhibits several very large reclamation districts arranged in a seemingly logical north-south pattern. RD108 lands encompassed nearly the entire floodprone length of the Sacramento River’s west bank that discharged to the Colusa Basin: one hydrologic unit. The levee it built along that length of bank was incorporated directly into the Sacramento River Flood Control Project. If anything, perhaps RD2047 should have within its boundaries more of the Lower Colusa Basin lands that were enclosed very early by RD108 and its Back Levee, which may have allowed the construction of a somewhat more effective configuration of the Colusa Basin Drain. Much of the residual flooding problem in the watershed today is due to inadequate flood conveyance capacity along the trace of the Back Levee, but this may be dominated by the backwater effect from high stages in the Sacramento River and the Yolo Bypass, problems related to the basin’s natural topography that no early comprehensive Valley-wide flood control project probably could have solved. If Green’s Land Act hadn’t passed in 1868, and instead the state and federal government had begun then to supervise the design of a comprehensive Valley-wide flood control project, would a flood bypass like the Sutter Bypass have been constructed through the Colusa Basin? A 1904 plan appears to propose a “West Side Drainage Canal” running approximately along the present Colusa Basin Drain alignment, as would have presumably been dictated in part by the RD108 holdings in the lower Colusa Basin (Figure 1-Flood). The 1904 plan shows 2 designated bypass channels running from the Sacramento River’s west bank into the West Side Drainage Canal: one about 7 mi north of Colusa at “Caldens Landing” and one about 5 mi south of Colusa at Upper Sycamore Slough, 2 of the dominant natural Sacramento River overflow points. Later flood control planning and design drawings prepared by the California Department of Public Works in 1925 did not show these 2 west bank flood weirs, but did show a proposed 1000-ft-wide right-of-way bordering the early precursor channels of the Colusa Basin Drain, the Old Davis Levee, and the RD108 Back Levee. This continuous 1000-ft-wide drainage right-of-way was labeled “limit of required waterway for west side streams.” It would have discharged through a 750-ft-wide version of the Knights Landing Ridge Cut (Figure 2-Flood). But would these early proposed drainage canals have worked better to drain the residual flooding from the foothill streams than the existing Colusa Basin Drain and Knights Landing Ridge Cut? DWR (1962, 1990) evaluated the costs and benefits of constructing a widened drainage canal in virtually the same alignment and enlarging the Knights Landing Ridge Cut and improving drainage downstream from its outlet. These evaluations have consistently failed to generate an economic justification.
Sacramento River Flood Control Project
The State Legislature approved the California Debris Commission plan in 1911 and created the State Reclamation Board to oversee its implementation. This Sacramento River Flood Control Project was thus adopted by the State in 1911 and then authorized by Congress as a federal flood
Colusa Basin Watershed Assessment Final
H. T. Harvey & Associates15 December 2008
199
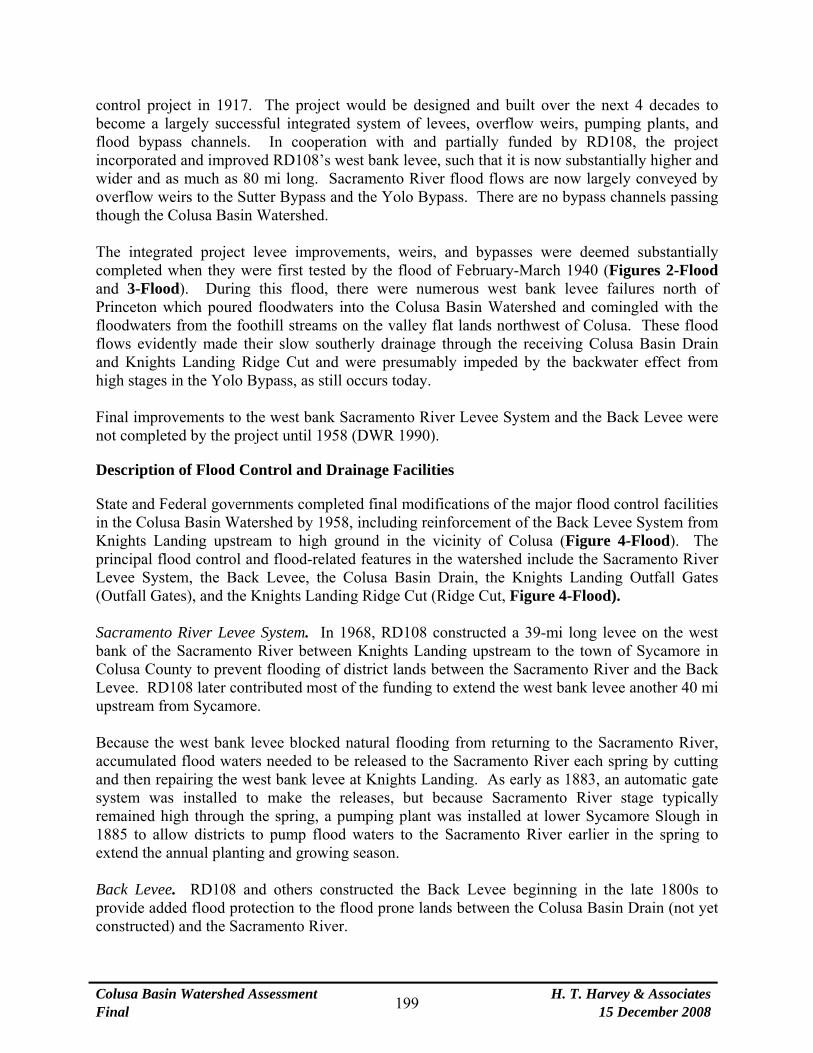
control project in 1917. The project would be designed and built over the next 4 decades to become a largely successful integrated system of levees, overflow weirs, pumping plants, and flood bypass channels. In cooperation with and partially funded by RD108, the project incorporated and improved RD108’s west bank levee, such that it is now substantially higher and wider and as much as 80 mi long. Sacramento River flood flows are now largely conveyed by overflow weirs to the Sutter Bypass and the Yolo Bypass. There are no bypass channels passing though the Colusa Basin Watershed. The integrated project levee improvements, weirs, and bypasses were deemed substantially completed when they were first tested by the flood of February-March 1940 (Figures 2-Flood and 3-Flood). During this flood, there were numerous west bank levee failures north of Princeton which poured floodwaters into the Colusa Basin Watershed and comingled with the floodwaters from the foothill streams on the valley flat lands northwest of Colusa. These flood flows evidently made their slow southerly drainage through the receiving Colusa Basin Drain and Knights Landing Ridge Cut and were presumably impeded by the backwater effect from high stages in the Yolo Bypass, as still occurs today. Final improvements to the west bank Sacramento River Levee System and the Back Levee were not completed by the project until 1958 (DWR 1990).
Description of Flood Control and Drainage Facilities
State and Federal governments completed final modifications of the major flood control facilities in the Colusa Basin Watershed by 1958, including reinforcement of the Back Levee System from Knights Landing upstream to high ground in the vicinity of Colusa (Figure 4-Flood). The principal flood control and flood-related features in the watershed include the Sacramento River Levee System, the Back Levee, the Colusa Basin Drain, the Knights Landing Outfall Gates (Outfall Gates), and the Knights Landing Ridge Cut (Ridge Cut, Figure 4-Flood). Sacramento River Levee System. In 1968, RD108 constructed a 39-mi long levee on the west bank of the Sacramento River between Knights Landing upstream to the town of Sycamore in Colusa County to prevent flooding of district lands between the Sacramento River and the Back Levee. RD108 later contributed most of the funding to extend the west bank levee another 40 mi upstream from Sycamore. Because the west bank levee blocked natural flooding from returning to the Sacramento River, accumulated flood waters needed to be released to the Sacramento River each spring by cutting and then repairing the west bank levee at Knights Landing. As early as 1883, an automatic gate system was installed to make the releases, but because Sacramento River stage typically remained high through the spring, a pumping plant was installed at lower Sycamore Slough in 1885 to allow districts to pump flood waters to the Sacramento River earlier in the spring to extend the annual planting and growing season. Back Levee. RD108 and others constructed the Back Levee beginning in the late 1800s to provide added flood protection to the flood prone lands between the Colusa Basin Drain (not yet constructed) and the Sacramento River.
Colusa Basin Watershed Assessment Final
H. T. Harvey & Associates15 December 2008
200
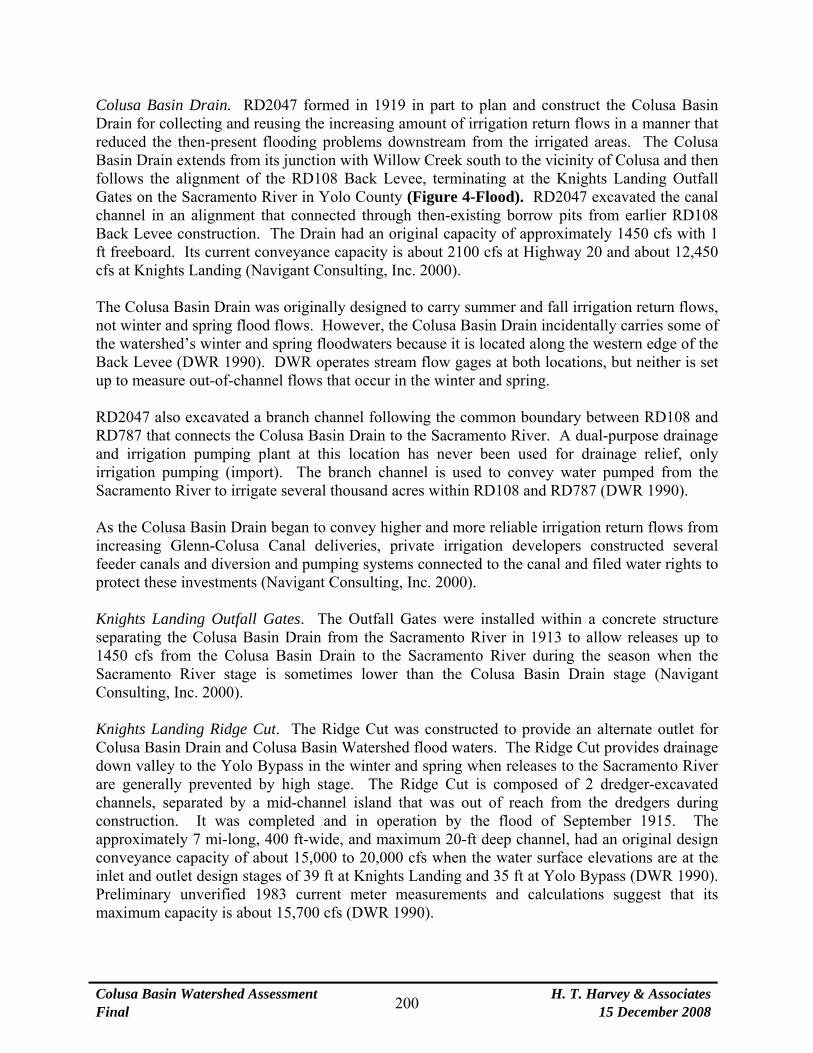
Colusa Basin Drain. RD2047 formed in 1919 in part to plan and construct the Colusa Basin Drain for collecting and reusing the increasing amount of irrigation return flows in a manner that reduced the then-present flooding problems downstream from the irrigated areas. The Colusa Basin Drain extends from its junction with Willow Creek south to the vicinity of Colusa and then follows the alignment of the RD108 Back Levee, terminating at the Knights Landing Outfall Gates on the Sacramento River in Yolo County (Figure 4-Flood). RD2047 excavated the canal channel in an alignment that connected through then-existing borrow pits from earlier RD108 Back Levee construction. The Drain had an original capacity of approximately 1450 cfs with 1 ft freeboard. Its current conveyance capacity is about 2100 cfs at Highway 20 and about 12,450 cfs at Knights Landing (Navigant Consulting, Inc. 2000). The Colusa Basin Drain was originally designed to carry summer and fall irrigation return flows, not winter and spring flood flows. However, the Colusa Basin Drain incidentally carries some of the watershed’s winter and spring floodwaters because it is located along the western edge of the Back Levee (DWR 1990). DWR operates stream flow gages at both locations, but neither is set up to measure out-of-channel flows that occur in the winter and spring. RD2047 also excavated a branch channel following the common boundary between RD108 and RD787 that connects the Colusa Basin Drain to the Sacramento River. A dual-purpose drainage and irrigation pumping plant at this location has never been used for drainage relief, only irrigation pumping (import). The branch channel is used to convey water pumped from the Sacramento River to irrigate several thousand acres within RD108 and RD787 (DWR 1990). As the Colusa Basin Drain began to convey higher and more reliable irrigation return flows from increasing Glenn-Colusa Canal deliveries, private irrigation developers constructed several feeder canals and diversion and pumping systems connected to the canal and filed water rights to protect these investments (Navigant Consulting, Inc. 2000). Knights Landing Outfall Gates. The Outfall Gates were installed within a concrete structure separating the Colusa Basin Drain from the Sacramento River in 1913 to allow releases up to 1450 cfs from the Colusa Basin Drain to the Sacramento River during the season when the Sacramento River stage is sometimes lower than the Colusa Basin Drain stage (Navigant Consulting, Inc. 2000). Knights Landing Ridge Cut. The Ridge Cut was constructed to provide an alternate outlet for Colusa Basin Drain and Colusa Basin Watershed flood waters. The Ridge Cut provides drainage down valley to the Yolo Bypass in the winter and spring when releases to the Sacramento River are generally prevented by high stage. The Ridge Cut is composed of 2 dredger-excavated channels, separated by a mid-channel island that was out of reach from the dredgers during construction. It was completed and in operation by the flood of September 1915. The approximately 7 mi-long, 400 ft-wide, and maximum 20-ft deep channel, had an original design conveyance capacity of about 15,000 to 20,000 cfs when the water surface elevations are at the inlet and outlet design stages of 39 ft at Knights Landing and 35 ft at Yolo Bypass (DWR 1990). Preliminary unverified 1983 current meter measurements and calculations suggest that its maximum capacity is about 15,700 cfs (DWR 1990).

Colusa Basin Watershed Assessment Final
H. T. Harvey & Associates15 December 2008
201
The Ridge Cut provides an alternate gravity outlet for lower Colusa Basin floodwaters. It reduces the duration of flooding, but it does not prevent flooding; when the Yolo Bypass stage is high, the backwater effect can extend upstream as far as College City. This also creates an additional backwater effect in the lower reaches of the Colusa Basin Drain (Navigant Consulting, Inc. 2000). By a 1937 agreement, the floodwater gravity drain outlet elevation of the Ridge Cut was set to 25.5 ft so that floodwaters, ponded in the valley basin lands between the Back Levee and high ground to the west and south, pass unimpeded to the Yolo Bypass while sustaining a pool sufficient for rediversion rights for irrigation with Colusa Basin Drain water entering the Ridge Cut (DWR 1990).
Structural and Non-structural Projects for Relieving Residual Flooding Problems in the Watershed
The current FEMA 100-year floodplain (Figure 4-Flood) shows that almost all of the historically flooded lands of Colusa Basin Watershed would be flooded during a large flood event with the Sacramento River Flood Control Project in place. The project generally prevents Sacramento River flooding during less frequent floods. Black Butte Dam on Stony Creek has eliminated the smaller historical contributions of Stony Creek floodwaters to the watershed north of Willows, but there are substantial areas in the watershed that are subject to relatively frequent flooding from the foothill streams. The FEMA 100-year floodplain map does not describe well the pattern of more frequent flooding in the watershed. DWR (1962) produced a map of “historically inundated areas” that seems to describe the pattern of the more frequent, approximately 5-year floodplain. Willows Area. The FEMA 100-year floodplain map (Figure 4-Flood) shows that several foothill streams, including South Fork of Willow Creek, coalesce along a low, broad ridge of land northwest of Willows. These combined flood waters inundate parts of Willows regardless of stage in the Sacramento River or presence of flood overflows from the Sacramento onto the valley flat lands. Alternatives for reducing the frequency and extent of flooding in this area are currently being evaluated by the CBDD and USBR (CH2MHill 2003), and are summarized below. Residual Colusa Basin Flooding. DWR (1962) summarizes the typical pattern of routine flooding occurring along the Colusa Basin Drain resulting from foothill streams runoff in the winter and rice irrigation water releases in the summer:
Flood conditions, including those arising from poor drainage, impede agriculture and economic development in portions of the Colusa Basin [Watershed]. Problems of flooding exist along Willow Creek, along the Colusa Basin [Drain] and its tributary drainage channels, and in portions of the Yolo Bypass below the Knights Landing Ridge Cut. These problems are caused by improper and insufficient individual farm drainage, inadequate facilities to remove drainage from low lying areas into the Colusa Basin [Drain] and other major drainage canals, insufficient channel capacities of flood and drainage canals tributary to the Colusa Basin [Drain], and inadequate discharge capacity of the Colusa Basin [Drain] into either the Sacramento River or the Yolo Bypass.

Colusa Basin Watershed Assessment Final
H. T. Harvey & Associates15 December 2008
202
During the winter flood period, roughly October through March, floods are caused by precipitation within the [watershed] and runoff from the foothill region to the west. The magnitude of the discharge in these winter storms is very large when compared with the channel capacity of the Colusa Basin [Drain]. The channel capacity in the upper reaches, for example, is exceeded when the discharge at Highway 20 near Colusa is greater than 2,100 second-feet. The maximum mean daily discharge of record occurred on February 21, 1958, and was 23,900 second-feet at that point. Because the channel is inadequate to handle the discharge, the excess flows flood an extensive area along the channel. In 1958, the flooded area extended continuously from Knights Landing to Orland, a distance of 70 miles. The flooded areas are frequently large at this time of year, but the damages are relatively light since the lands inundated are principally agricultural and idle during the winter. Highways, roads, and public utilities, as well as the limited urban or domestic development within the floodplain are subject to damage. In the spring months, April through June, flooding is caused principally by irrigation return flows rather than by precipitation. During the spring, precipitation is generally insignificant. The channel capacity of the Colusa Basin [Drain] is usually adequate to handle the irrigation return flows, except in the reach between College City and Knights Landing where flooding of a small area occurs regularly. The resulting damages are large since this flooding occurs in the normal growing season. This spring flooding results from local agricultural practices which cause irrigation return flows that cannot be dissipated by works constructed to relieve winter flood conditions.
According to DWR (1962), releases of water from rice fields typically peaks in May when high stage also typically prevails in the Sacramento River. This prevents the released water from draining though the Outfall Gates, and the outlet of the Knights Landing Ridge Cut is also backed up or otherwise inadequate to pass the released water. There is presumably less summer flooding along the Colusa Basin Drain today than there was at the time of DWR’s (1962) characterization of the problem, as would have the resulted from better coordinated releases. In addition, land has been put into agricultural production up to the western edge of the Colusa Basin Drain [canal], and the levees have been built along the western edge of the canal to protect agricultural lands. These levees may act to constrict the canal’s capacity and thereby incrementally raise the canal water surface elevation in places. DWR (1962) reported that between 1 April and 1 June in 15 of the last 40 years, water has overflowed the banks of the drainage canal between College City and Knights Landing. DWR (1962, 1964) prepared hydraulic models of the Colusa Basin Drain channel to serve as a basis for evaluating the flood benefits in terms of reduced inundation area resulting from a range of management actions: (1) improved drainage facilities from the Knights Landing Ridge Cut through the Yolo Bypass, (2) systems of levees along the Colusa Basin Drain, (3) flood control reservoirs in the western foothills, and (4) watershed management. DWR (1990) updated the evaluation of these alternatives, many of which are still under consideration, and added a fifth evaluation of enlarging the Knights Landing Ridge Cut. Yolo Basin Project. DWR (1962) evaluated the flood management benefits for the lower backwater affected reaches of the Colusa Basin Drain of constructing a new 10,000-ft-long unlined 130-ft-wide trapezoidal drainage canal in the Yolo Basin from the outlet of the Knights Landing Ridge Cut downstream to the Tule Canal and comparably enlarging Tule Canal by

Colusa Basin Watershed Assessment Final
H. T. Harvey & Associates15 December 2008
203
addition of 15,300-ft-long levees. DWR (1962) concluded that the project was economically justified (cost-benefit ratio of 1.34:1) even though most of the benefits would accrue to landowners on the downstream end of the watershed. DWR (1990) reevaluated the Yolo Basin Project as having a total project cost of about $8 million, and a 50-yr period cost-benefit analysis of the project at an 8.875% discount rate yielded an updated cost-benefit ratio of 0.25. The reduced cost-benefit ratio compared to DWR (1962) is due to new water quality concerns and the estimated $5 million additional project cost introduced by the need to extend the North Bay Aqueduct’s Barker Slough Pumping Plant intake to Miner Slough. Enlarge Knights Landing Ridge Cut. DWR (1990) evaluated various alternative methods and configurations for increasing the conveyance capacity of the Ridge Cut, including a range of design channel base widths up to 1400 ft. DWR (1990) found that the conveyance capacity could be increased by 7300 cfs at a cost of about $12 million. Fifty-year period cost-benefit analysis of the project at an 8.875% discount rate yielded an updated cost-benefit ratio of 0.15. DWR (1990) noted that the evaluated alternative included removal of the heavily vegetated existing islands, the environmental impacts of which would be controversial. Colusa Basin Drain Levees. First, DWR (1962, 1964) considered the potential benefits of constructed new and/or enlarged levees along the existing Colusa Basin Drain to create a maximum channel top width of 450 to 1,000 ft. The levees would range from 18-ft-high in the south to 11-ft-high in the north and would, for example, provide for 27,000 cfs conveyance capacity at the Highway 20 crossing. Pumping stations and flap gates would be used to drain floodprone areas. Cost-benefit analysis of the 50-year protection level project indicated that the levee project was not economically justified, yielding ratio of 0.33 at a 4% interest rate. DWR (1990) reevaluated the levee project, estimating it then to cost $76 million for protecting 180,000 acres. Fifty-year period cost-benefit analysis of the 100-year protection level project at an 8.875% discount rate yielded an updated cost-benefit ratio of 0.19. The levee protection alternative has generally been abandoned in favor of projects that use reservoirs on the foothill streams to detain floodwaters. Foothill Reservoir Project. DWR (1962) evaluated the potential benefits of constructing flood detention reservoirs on 17 foothill streams, finding it a generally less desirable solution to flooding problems than building levees along the Colusa Basin Drain. DWR (1990) reevaluated the project considering 29 moderate-sized reservoir sites at total cost of $82 million. Seven of the 29 sites ranked highest on a cost per square mile drainage area controlled basis: South Fork Willow Creek, Logan Creek, Hunter Creek, Funks Creek, Stone Corral Creek, Freshwater Creek, and Cortina Creek (generally the larger foothill subwatersheds). These 7 reservoirs were estimated to cost about $27 million. Fifty-year period cost-benefit analysis of the seven reservoir project alternative at an 8.875% discount rate yielded a cost-benefit ratio of 0.65. DWR (1990) found in general that “the limited runoff of Westside tributaries makes it unlikely that significant water supply or recreation benefits could be developed in a multiple-purpose reservoir.” The Colusa Basin Drainage District [CBDD] resumed evaluation of alternatives including different numbers and combinations of 14 foothill reservoirs as part of comprehensive flood control and watershed management alternatives (Navigant Consulting, Inc. 2000).
Colusa Basin Watershed Assessment Final
H. T. Harvey & Associates15 December 2008
204
Watershed Management. DWR (1962) did not evaluate the potential benefits of watershed management due to lack of data about the existing conditions of the foothill subwatersheds. As discussed below in this section of the assessment, the CBDD is presently considering watershed management and other non-structural flood reduction measures as part of comprehensive flood control and watershed management project alternatives (Navigant Consulting, Inc. 2000). Local Flooding Problems Associated with Transportation Infrastructure. Road and railroad crossings do not always provide sufficient flood conveyance capacity. Moreover, because most of the crossings are not clear-span bridge decks, they are prone to partial to near complete blockage with vegetation and debris floated from upstream, including large woody debris transported by floods from upper watershed areas. Ongoing Efforts to Reduce Residual Flooding
Many of the project alternatives generally evaluated by DWR (1962, 1964, 1990) have not been implemented due to cost-benefit ratios and other reasons, but continue to be reevaluated in the changing planning and economic context. Most recently, CBDD has evaluated feasibility of constructing stormwater detention reservoir facilities on two foothill streams in the northern part of the watershed. The South Fork Willow Creek Detention Facility is completely designed and has a construction bid packet ready for distribution should the CBDD secure adequate funds to construct (Gene Massa, CBDD, pers. comm., May 2007). CBDD has all permits secured to construct except the Army Corp's 404(b) permit. The CBDD has not yet completed the feasibility study for the proposed Wilson Creek Detention Facility. The CBDD has completed studies identifying other project sites in Glenn and Colusa Counties targeted for remediation measures including, but not limited to detention facilities. Residual Colusa Basin Flooding. Navigant Consulting, Inc. (2000) evaluated alternatives for the Integrated Resourced Management Plan [IRMP] for Flood Control proposed by the CBDD and USBR. This flood control program and associated programmatic EIR/EIS included structural measures composed of up to 14 stormwater detention reservoirs at foothill stream subwatershed outlets of most of the 32 ephemeral and intermittent streams draining the Eastern Slope of the Coast Range foothills across the watershed flatlands. The feasibility-level designed detention facilities would improve flood control and supplement water supply for multiple uses, including groundwater recharge on the valley flats and incidental habitat enhancement provided by using streams as conveyance facilities from the foothill reservoirs to the groundwater recharge area on the lower fan areas and valley flats. Willows Area Flooding. CH2MHill (2003) then prepared a project-specific EIR for the CBDD’s Integrated Watershed Management Plan [IWMP]. This plan tiers off of the previous watershed-wide IRMP (Navigant Consulting, Inc. 2000) and evaluates alternatives to reduce flooding in the vicinity of Willows (and presumably, to some extent, also reducing flooding south of Willows in areas receiving commingled floodwaters). This watershed-scale analysis evaluated the flood management benefits and other effects of various structural and non-structural flood control measures. While the analysis was specific to the Willow Creek and

Colusa Basin Watershed Assessment Final
H. T. Harvey & Associates15 December 2008
205
Wilson Creek foothill stream subwatersheds which have the most impact on flooding in the vicinity of Willows, the general findings of the flood management analysis are largely transferable to the other 15 or more foothill stream subwatersheds in the Basin by virtue of overall hydrologic-geomorphic setting and land use patterns. In addressing Willows area flood control, CH2MHill (2003) considered non-structural measures including recommended changes in rangeland management practices and reforestation of upland areas to reduce peak flow and sediment discharged to watershed (or to the proposed detention reservoir), and improved regulatory floodplain management on the valley floor. Structural measures evaluated included the following:
• Two stormwater detention reservoirs receiving peak flows from North and South Fork Willow Creek and Wilson Creek, respectively
• Using existing rice fields on the valley floor as spreading basins • Restoration of stream sections in the upper watershed and on the valley floor to increase
channel conveyance capacity, floodplain connectivity, and temporary storage of floodplain waters
• A ring levee surrounding the City of Willows The environmental impact analysis and report summarized these measures and utilized hydrologic modeling to estimate their individual flood management benefits. The following is a summary of the CBDD’s proposed flood management measures (CH2MHill 2003). CH2MHill (2003), however, concluded that while rangeland management changes and reforestation would have a measurable impact on peak flow reduction, the potential benefits were limited by the widespread coverage of clayey-soils with naturally high runoff potential in the foothills area. Additionally, it should be noted that the introduction of Mediterranean annual grasses and forbs is a factor in the replacement of deep-rooted native perennial grasses and forbs by shallow-rooted non-native annuals that is not entirely a result of grazing. Changes to Rangeland Management (Proposed). Changes in upper watershed rangeland management practices would increase soil infiltration capacity and soil moisture retention, thereby reducing peak flow discharge reaching the Willows area. Management actions evaluated included grazing management, livestock fencing, riparian buffers, pest and weed management, range plantings, conservation cover, use exclusions, prescribed burning, and/or watershed drainage enhancement and sediment control. The restoration of native perennial grasses over 40,000 acres of rangeland was specifically evaluated. Reforestation (Proposed). Reforesting annual grasslands to woodlands increases canopy cover and results in increased groundcover. Increased canopy cover also theoretically reduces rainfall-runoff by intercepting an increment of the initial rainfall and protecting the land surface from rainfall-splash type soil erosion. The primary flood management benefit of reforestation is in increasing soil infiltration capacity and soil moisture retention. The potential flood management benefits of planting oak trees over 4600 acres of woodlands were specifically evaluated.

Colusa Basin Watershed Assessment Final
H. T. Harvey & Associates15 December 2008
206
Floodplain Management (Proposed). Non-structural floodplain management measures do not provide the direct and immediate flood control benefits of traditional built flood control facilities, but are expected to reduce flood damage over time using policy and regulatory actions to better accommodate expected future flooding. Measures include raising and/or flood-proofing structures, negotiating flood easement areas (including potential to restore and enhance habitat where appropriate), and restricting future development in flood-prone areas. CH2MHill (2003) estimated that implementing all of the non-structural measures, including rangeland management, reforestation, and floodplain management, would reduce the 5-year flooded area in the vicinity of Willows approximately 26%. Lesser flood benefits are expected during larger, less frequent storms. In general, the potential flood benefits of non-structural measures such as rangeland management are limited by the presence of clayey soils with naturally high runoff potential in the upland watershed areas (CH2MHill 2003). Ancillary benefits of the non-structural measures included increased overall environmental quality, habitat improvements, rangeland productivity, water quality, and seasonal duration of foothill stream baseflow. South Fork Willow Creek Detention Basin (In Design and Permitting). The South Fork Willow Creek detention basin has now been designed. It would be located in the foothills approximately 12 mi west of Willows. The basin would detain stormwater from upper Willow Creek, which would then be released after storm flows recede. The proposed embankment (dam) would be approximately 70-ft high, including 10 ft of freeboard above the 100-year water surface elevation. The embankment cross-section would range from 200-550 ft wide at the bottom and up to 20 ft wide at the top. The total length of the embankment would be roughly 600 ft. The detention basin would accommodate up to 5200 ac-ft of storage and would inundate approximately 305 ac during the 100-year storm. As designed, the South Fork Willow Creek detention basin is anticipated to reduce peak flow in the combined Willow Creek and Wilson Creek channels at Willows (at flood stages, Willow Creek and Wilson Creek are practically combined channels) by approximately 14% for the 100-year flood and 11% for the 5-year flood. Modeling suggests the flooded area would reduce as much as 25% for the 100-year flood and 47% for the 5-year flood. Wilson Creek Detention Basin (Proposed). The proposed Wilson Creek detention basin would be located and designed to operate in the same manner as the South Fork Willow Creek detention basin. The embankment would be 55-ft high (10 ft of freeboard above the 100-year water surface elevation), and the cross-section would be approximately 300 ft wide at the bottom and 20 ft wide at the top. The total length of the embankment would be roughly 3500 ft, and the basin would hold up to 2300 ac-ft and inundate approximately 163 ac during the 100-year design inflow. The Wilson Creek detention basin is anticipated to reduce peak flow in the combined Willow Creek and Wilson Creek channels at Willows by approximately 7% for the 100-year flood and 6% for a 5-year flood. Modeling suggests the flooded area in the vicinity of Willows would reduce as much as 13% for the 100-year flood and 26% for the 5-year flood.

Colusa Basin Watershed Assessment Final
H. T. Harvey & Associates15 December 2008
207
Rice Field Spreading Basins (Proposed). The rice field spreading basins would modify existing rice fields adjacent to or near streams to also serve as a network of small-scale stormwater detention basins. The existing temporary detention effect of suitably situated rice fields would be increased by raising the elevation of existing berms surrounding fields and installing inlet and outlet drainage facilities designed to receive and release storm flows as needed during the winter, while allowing normal rice field production and operation during the growing season. CH2MHill (2003) estimated that adapting existing suitable rice fields as spreading basins would reduce the 100-year peak flow in the combined Willow Creek and Wilson Creek channels (at the City of Willows) by approximately 11%, but have a lesser or negligible effect on more frequent floods, such as the 5-year flood. The corresponding reduction in the 100-year flooded area (in the vicinity of Willows) would be as much as 19%. Upper Watershed Stream Restoration (Proposed). CH2MHill (2003) evaluated the potential flood management benefits of reconnecting the generally incised isolated foothill valley stream sections in the upper watersheds with their former floodplains by installing as many as 21 concrete grade control structures designed to raise the bed elevation and planting riparian buffer strips on the thus activated floodplain surfaces adjacent to the stream (along half of the stream length). The grade control structures and more frequent floodplain flows would theoretically reduce the flow velocity and increase temporary flood water storage in the isolated valley sections of the upper watershed areas, estimated to reduce the 100-year peak flow in the combined Willow and Wilson Creek channels at Willows by 5% and the 5-year peak flow by 2%. Ancillary benefits are increased and enhanced aquatic and riparian habitat, improved water quality, improved bank stability, increased groundwater recharge, and reduced channel maintenance costs in most cases borne by private landowners. The timing of channel incision in the upper watershed areas was not determined by the environmental impact analysis, and it is not clear if most of the incision occurred before or after 1850. CH2MHill (2003) presumed that the incision occurred after Euro-American settlement, as may have resulted from grazing and deforestation. However, it is also plausible that much of the incision may have predated Euro-American settlement, especially considering the naturally high runoff potential of the shallow clayey upland soils and the possibility that Native Americans used fire as a method of vegetation management or hunting in or near the upper watershed area. The possibility that channel incision is less a contemporary land use impact and more a central tendency or an irreversible state needs to be considered carefully before actions are taken to, in effect, reverse presumed land use impacts. This would include proposals to structurally “build back up” the stream bed elevation in incised stream sections using a series of grade control structures and imported coarse sediment. Valley Stream Restoration (Proposed). CH2MHill (2003) evaluated the feasibility and flood control benefits of reconfiguring the almost universally straightened and confined valley streams to restore some of their pre-development flood conveyance capacity and temporary floodplain storage capacity. Increasing the sinuosity, reducing the slope, and increasing the width of the channels would essentially allow natural geomorphic processes to restore some of the streams’ natural pre-development channel form. Specifically, setting back levees and banks to widen the channels an average of 20 ft was considered along 61,000 linear ft of Willow Creek and 55,000 linear ft of Wilson Creek, also requiring replacement of 21 undersized bridge crossings. Valley

Colusa Basin Watershed Assessment Final
H. T. Harvey & Associates15 December 2008
208
stream restoration was anticipated to reduce the 100-year peak flow at Willows by 4% and the 5-year peak flow by 4%. The measure would provide little reduction in the flooded area in the vicinity of Willows. Ancillary benefits are increased and enhanced aquatic and riparian habitat, improved water quality, improved bank stability, and reduced channel maintenance costs borne primarily by private landowners. Ring Levee (Proposed). The City of Willows area could be more completely protected from flooding by installing a 2-mi-long ring levee extending approximately from the Glenn-Colusa Canal to Pacific Avenue. An 8-ft-high embankment with 2:1 (vertical:horizontal) side slopes and a 12-ft-wide gravel service road was considered.
Figure 1-Flood. Detail from 1904 plan for Sacramento valley flood control improvements prepared by the State Commission of Engineers of 1904.

Figure 2-Flood. Detail from 1940 illustration of February-March 1940 flood inundation in the Sacramento Valley prepared by California Department of Public Works.

Figure 3-Flood. Detail from 1940 map of the areas inundated by the flood of February-March 1940 prepared by the State Department of Public Works Division of Water Resources.

Orland
Willows
Williams
Colusa
Woodland
Artois
Maxwell
Arbuckle
College City
Dunnigan
Zamora
SitesLodoga
Stonyford
Leesville
Grimes
MillersLanding
Knights Landing
Te
ha
ma
Gl
en
n-
Co
lu
sa
Co
lu
sa
Ca
na
l
Ca
na
l
Co
lu
sa
Ba
si
n
Dr
ai
nS
ac
ra
me
nt
o
Ri
ve
r
Bypass
Sutter
Bypass
Tisdale Bypass
Ordbend
Princeton
Lurline Creek
Black Butte LakeBlack Butte Lake
Thermalito AfterbayThermalito Afterbay
East Park ReservoirEast Park Reservoir
SutterButtesSutterButtes
Stony Gorge ReservoirStony Gorge Reservoir
Thermalito Diversion PoolThermalito Diversion Pool
505
5
5
5
505
20
16
20
45
113
162
191
162
29
149
99
162
20
162
45
99
MIDWAY
RD D
KNOXVILLE RD
RD 307
RD 19
RD 57
RD S
RD 87
LARK
IN R
D
RECLAMATION RDWYO AVE
NEAL RD
RD 14
TULE RD
RD 40
PASS RD
RD 308
COUN
TY R
D E4
COUNTY RD 24
HAHN RD
COLUSA HWYRD
89
4 MILE
RD
WHITE RD
COUN
TY R
D Z
MILE
LN
RD R
ORD FERRY RD
S BUTTE RD
WILD
WOOD
RD
CLARK RD
COUNTY HWY 22
W BUTT
E RD
CARL
SON
RD
RD 86
A
NUESTRO RD
CUTLER AVE
RD 206
Sand CreekCortina CreekSa
lt C
reek
French Creek
Grap
evin
e Cr
eek
So. Fk. Willow
Creek
Stone Corral Creek
Walker Creek
Wilson Creek
So. Fk. Walker Creek
Lt. Buckeye
Salt
Cree
k
Wildcat Creek
Elk Creek
So. Fk. Oat Creek
Spring Creek
Bird Creek
Whisky Creek
Walters Creek
Buckeye Creek
Petroleum Creek
Brush Creek
No.Fk. Willow Creek
White Cabin Creek
Hayes Hollow Creek
Freshwater Creek
Oat Cre
ek
Logan Creek
Nye Creek
Funks Creek
Sycam
ore Slough
Salt Gulch Creek
Dunnigan Creek
Smith Creek
Chamisal Creek
Gopher Creek
Hunters Creek
Ant
elop
e C
reek
Calvins Creek
Glenn Valley Slough
Logan Creek
Cache Creek
But
te C
reek
Bear CreekLi
ttle
Dry
Cree
k
Cher
okee
Can
al
Stony Creek
Snak
e R
iver
Mud C
reek
Big Chico Creek
North Fork Cache Creek
Feat
her R
iver
Glenn-Colusa Canal
Grindstone Creek
Butte
Cre
ek
Yolo
Stony Creek
Stony Creek
Moulton Weir
Fremont Weir
Tisdale Weir
Colusa Weir
ColusaCounty
GlennCounty
YoloCounty
ButteCounty
SutterCounty
LakeCounty
NapaCounty
TehamaCounty
YubaCounty
Lake Berryessa Recreation AreaLake Berryessa Recreation Area
0 5 102.5Miles
Colusa Basin Watershed Assessment: Floodprone Areas and Existing Flood Control Facilities
2850-01 Dec. 2008 4a - Flood
SM N:\Projects\2850-01\Figures\April 2008
LEGENDWatershed Boundary
Existing Flood Control FacilitiesWeir
Project Levees Maintained by DWR*
Flood Hazard Zone Designation 100 YR Flood Plain500 YR Flood Plain or 100 YR Flood Plain Protected by Levee
Source: 1. Q3 Flood Data from Federal Emergency Management Agency, 2. Navigant Consulting 2000,3. Sacramento River Conservation Area Forum Handbook 2003DWR* - Department of Water Resources
Project Levees Maintained by Reclamation, Levee, and Drainage Districts and Muncipalities
Project Levees Maintained by DWR*: Sec 12878to Sec. 12878.45 of the 1961 Water Code
Knights Landing Outfall Gates

Orland
Willows
Williams
Colusa
Artois
Maxwell
Arbuckle
SitesLodoga
Stonyford
Leesville
Grimes
Te
ha
ma
Gl
en
n-
Co
lu
sa
Co
lu
sa
Ca
na
l
Ca
na
l
Co
lu
sa
Ba
si
n
Dr
ai
n
Sa
cr
am
en
to
Ri
ve
r
Ordbend
Princeton
Lurline Creek
Matchline Sheet 2 - Figure 4c
Black Butte LakeBlack Butte Lake
East Park ReservoirEast Park Reservoir
Stony Gorge ReservoirStony Gorge Reservoir
5
5
20
20
162
162
20
162
45
99
ROAD
D
ROAD 57
ROAD
S
WYO AVE
COUNTY RD 24
4 MILE
RD
COUN
TY R
D Z
MILE
LN
ORD FERRY RD
W BUTT
E RD
CUTLER AVE
RD 206
Sand CreekCortina Creek
Salt
Cre
ek
French Creek
Grap
evin
e Cr
eek
So. Fk. Willow
Creek
Stone Corral Creek
Walker Creek
Wilson Creek
So. Fk. Walker Creek
Spring Creek
Walters Creek
No.Fk. Willow Creek
White Cabin Creek
Hayes Hollow Creek
Freshwater Creek
Logan Creek
Nye Creek
Funks Creek
Sycam
ore Slough
Salt Gulch Creek
Chamisal Creek
Gopher Creek
Hunters Creek
Ant
elop
e C
reek
Calvins Creek
Glenn Valley Slough
Logan Creek
Bear Creek
Stony Creek
Mud C
reek
Glenn-Colusa Canal
Grindstone Creek
Butte
Cre
ek
Stony Creek
Stony Creek
Moulton Weir
Colusa Weir
ColusaCounty
GlennCounty
ROAD 35
HAHN RD
ROAD 39
ROAD 33
OHM
RD
ROAD
Y
LURLINE AVE
RIVER
RD
MEYERS RD
BEAR
VALL
EY R
D
ROAD 60
TWO
MILE
RD
WALNUT DR
ROAD 303
ROAD
R
ROAD 305
ROAD 69
HUST
ED R
DKEEGAN RD
ANITA RDBENNETT RD
KING RD
ROAD 304
ROAD
BB
COUN
TY R
OAD
F
EVAN
S RD
ROAD
B
BRIM RD
ROAD 67
ROAD 50
ROAD 66
ROAD
T
ROAD
SS
ROAD 54
ROAD 35
0 3.4 6.81.7Miles
Colusa Basin Watershed Assessment: Floodprone Areas and Existing Flood Control Facilities - Sheet 1
2850-01 Dec. 2008 4b - Flood
SM N:\Projects\2850-01\Figures\April 2008
LEGENDWatershed Boundary
Existing Flood Control FacilitiesWeir
Flood Hazard Zone Designation 100 YR Flood Plain500 YR Flood Plain or 100 YR Flood Plain Protected by Levee
Project Levees Maintained by Reclamation, Levee, and Drainage Districts and Muncipalities
Project Levees Maintained by DWR*: Sec 12878to Sec. 12878.45 of the 1961 Water Code
Sources: 1. Q3 Flood Data from Federal Emergency Management Agency, 2. Navigant Consulting 2000,3. Sacramento River Conservation Area Forum Handbook 2003DWR* - Department of Water Resources

Williams
Woodland
Arbuckle
College City
Dunnigan
Zamora
Grimes
MillersLanding
Knights Landing
Te
ha
ma
G l e n n -
Co
l us
a
C o l u s aC a n a l
Ca
na
l
Co
lu
sa
Ba
si
n
Dr
ai n
Sa
cr
am
en
to
Ri
ve
r
Bypass
Sutter
Bypass
Tisdale Bypass
Matchline Sheet 1 - Figure 4b
7099
Esparto
Madison
Camp Far West ReservoirCamp Far West Reservoir
5
5
505
20
16
20
45
113
99
20
KNOXVILLE RD
ROAD 19
ROAD
87
RECLAMATION RD
ROAD 14
TULE RD
RD 40
COUN
TY R
D E4
HAHN RD
ROAD
89RIEGO RD
S BUTTE RD
WILD
WOO
D RD
COUNTY HWY 22
ELVERTA RD
CARL
SON
RD
RD 86
A
HOWSLEY RD
Sand CreekCortina Creek
Salt
Cre
ek
Lt. Buckeye
Salt
Cree
k
Wildcat C
reek
Elk Creek
So. Fk. Oat Creek
Spring Creek
Bird Creek
Whisky Creek
Walters Creek
Buckeye Creek
Petroleum Creek
Brush Creek
Oat Cre
ek
Sycamore
Slough
Dunnigan Creek
Smith Creek
Chamisal Creek
Cache Creek
Bear Creek
Yolo
Fremont Weir
Tisdale Weir
ColusaCounty
YoloCounty
SutterCounty
LakeCounty
NapaCounty
SacramentoCounty
OHM
RD
PACI
FIC A
VE
MEYERS RD
SUBACCO RD
BEAR
VALL
EY R
D
WHITE RD
PELGER RD
ROAD 6
WALNUT DR
ROAD 2
SANKEY RD
FRONTAGE RD
SAND CREEK RD
ROAD 12
OSWALD RD
ERLE RD
COUNTY ROAD 24
COUNTY ROAD 17
VARNEY RD
HUST
ED R
DKEEGAN RD
ROAD 108
H R
D
ROAD
86
JERUSALEM RD
HILLGATE RD
LEVE
E RD
SILLS RD
ROAD 78
STRIPLIN RD
SAWT
ELLE
AVE
GREE
N R
D
EVAN
S RD
VERN
ON R
D
ROAD
95B
ROAD 10
TARK
E RD
ENSLEY RD
KIRKVILLE RD
ROAD 8053
BOGUE RD
BOUL
TON
RD
ROAD
98A
BROW
NING
RD
ROAD
97
ROAD
107A
LEISER RD
BAILE
Y RD
ROAD
89
RANCH RD
REIFF RD
ROAD 63
LEVE
E RD
LEVE
E RD
Lake Berryessa Recreation AreaLake Berryessa Recreation Area
0 3.4 6.81.7Miles
Colusa Basin Watershed Assessment: Floodprone Areas and Existing Flood Control Facilities - Sheet 2
2850-01 Dec. 2008 4c - Flood
SM N:\Projects\2850-01\Figures\April 2008
LEGENDWatershed Boundary
Existing Flood Control FacilitiesWeir
Project Levees Maintained by DWR*
Flood Hazard Zone Designation 100 YR Flood Plain500 YR Flood Plain or 100 YR Flood Plain Protected by Levee
Sources: 1. Q3 Flood Data from Federal Emergency Management Agency, 2. Navigant Consulting 2000,3. Sacramento River Conservation Area Forum Handbook 2003DWR* - Department of Water Resources
Project Levees Maintained by Reclamation, Levee, and Drainage Districts and Muncipalities
Project Levees Maintained by DWR*: Sec 12878to Sec. 12878.45 of the 1961 Water Code
Knights Landing Outfall Gates

Figure 5-Flood. Detail from map of existing and possible flood control and drainage features showing historically flooded areas in the Willows area and along the Colusa Basin Drain (adapted from DWR 1962).