comba telecom 2012 annual results
DESCRIPTION
Comba Telecom 2012 Annual ResultsTRANSCRIPT
2012 Annual Results Corporate Presentation
IPPC V1 25 March 2013

2
Disclaimer
This presentation has been prepared by Comba Telecom Systems Holdings Limited (the “Company”) for reference only. The information contained in this presentation has not been independently verified. The Company does not make any representation, warranty or undertaking, whether express or implied, to and no reliance should be placed on, the fairness, accuracy, suitability, completeness or correctness of the information or opinions contained herein. Any summary does not purport to be complete and accurate. None of the Company or its affiliates or their respective directors, employees or representatives will be liable for any loss howsoever arising from any use of this presentation or its contents or otherwise arising in connection with this presentation. This presentation contains statements that constitute forward-looking statements. These statements include descriptions regarding the intent, belief or current expectations of the Company or its officers with respect to the Company and the relevant industry. Such forward-looking statements are not guarantees of future performance and involve risks and uncertainties, and actual results may differ from those in the forward-looking statements in material respect as a result of various factors and assumptions (in particular for the national policies). The Company has no obligation does not undertake to revise forward-looking statements to reflect future events or circumstances. This presentation does not constitute an offer to sell or issue or the solicitation of an offer to buy or acquire securities of the Company in any jurisdiction or an inducement to enter into investment activity, not may it or any part of if form the basis of or be relied upon in connection with any contract or commitment whatsoever.

3
Agenda
Financial Highlights
Financial Review
Customer Review
Business Review
Open Forum & Appendix
IPPC 25 March 2013

Financial Highlights
Financial Results
Exceptional Items
Pro-forma Financial Results
Financial Position
Key Financial Indicators
4 4

For the year ended 31 December For the six months
ended 30 June 2012
HK$’000 2012 2011 Change
Revenue 6,332,867 6,354,218 (0.3%) 2,591,529
Gross profit 1,615,879 2,326,697 (30.6%) 719,304
Gross profit margin 25.5% 36.6% (11.1 pp) 27.8%
Operating (loss)/profit (105,495) 805,919 (113.1%) (135,458)
Tax 67,515 121,772 (44.6%) 15,129
(Loss)/Profit attributable to shareholders (202,364) 659,084 (130.7%) (160,960)
Net (loss)/profit margin (3.2%) 10.4% (13.6 pp) (6.2%)
Basic (loss)/earnings per share (HK cents) (13.43) 43.99 (130.5%) (10.68)
Operating cash flow 201,320 (278,670) 172.2% (673,066)
5
Financial Results

6
Items Details FY12 FY11
Remarks HK$Mn
1 Cost of sales ▸ Inventories write-off / write-down 146 27 ▸ Obsolete inventories
2
Awarded share expenses
▸ 26 million new shares were awarded to 365 qualified individuals (mainly management, sales & R&D) at the market closing price of HK$9.32 on 12 April 2011
54 145
▸ 88% of the expenses have been recognized in FY11 & FY12
▸ Expenses in FY13 & FY14: HK$23Mn & HK$4Mn
(Expenses details in Appendix )
3 Share option expenses
▸ Expenses related to 2 share option schemes : • Jul 2011 – Jul 2013 @ exercise price of
HK$6.57 • Jan 2013 – Jan 2015 @ exercise price
of HK$5.66
38 16 ▸ Incentive schemes for
staff
4 Gain on acquisition
▸ In 2011, the PRC company was acquired for enlarging the product portfolio
N/A (48)
▸ Cash consideration of HK$84 million for a net asset value of HK$132 million
TOTAL 238 140
Exceptional Items

7
For the year ended 31 December For the six months ended
HK$’000 2012 2011 Change 30 June 2012
Revenue 6,332,867 6,354,218 (0.3%) 2,591,529
Gross profit margin 27.9% 37.1% (9.2 pp) 27.8%
Operating profit / (loss) 133,077 945,995 (85.9%) (78,588)
Operating profit / (loss) margin 2.1% 14.9% (12.8 pp) (3.0%)
Profit / (loss) attributable to shareholders 36,208 799,160 (95.5%) (104,090)
Net profit / (loss) margin 0.6% 12.6% (12.0 pp) (4.0%)
Basic earnings / (loss) per share (HK cents) 2.40 53.34 (95.5%) (6.91)
Pro-forma Financial Results (Assuming NO exceptional items)

Financial Position
8
As at 31 December As at 30 June
HK$’000 2012 2011 Change 2012
Net cash / (debt) 9,999 77,243 (87.1%) (812,605)
Total assets 10,091,711 9,581,332 5.3% 9,578,597
Total liabilities 6,229,552 5,498,508 13.3% 5,784,688
Net assets 3,805,622 4,014,064 (5.2%) 3,731,779
NAV per share (HK$) 2.49 2.63 (5.3%) 2.45
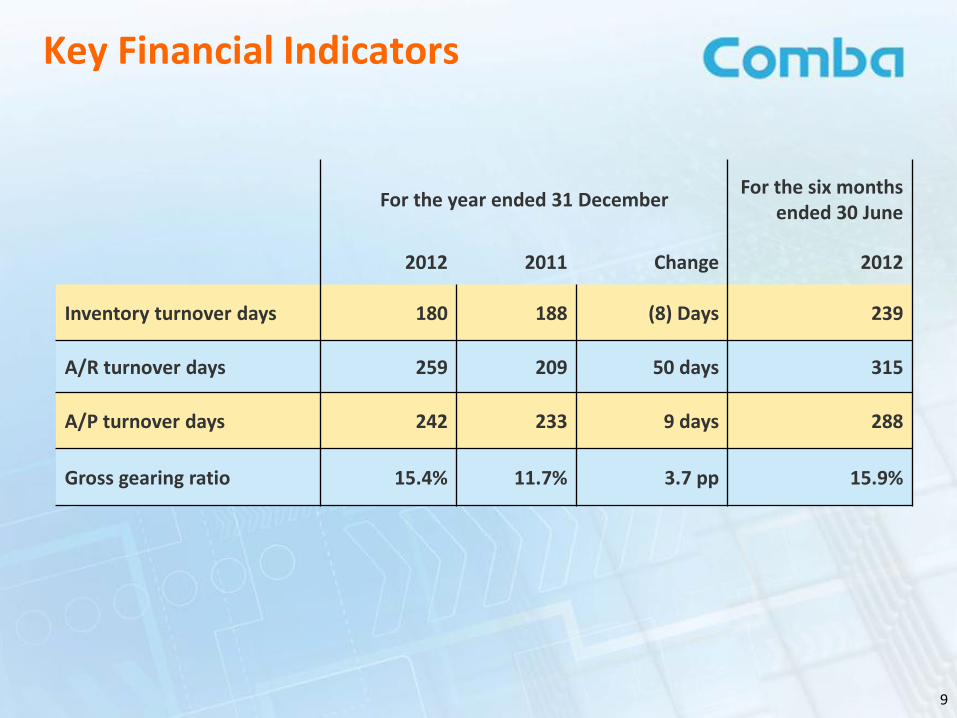
Key Financial Indicators
For the year ended 31 December For the six months
ended 30 June
2012 2011 Change 2012
Inventory turnover days 180 188 (8) Days 239
A/R turnover days 259 209 50 days 315
A/P turnover days 242 233 9 days 288
Gross gearing ratio 15.4% 11.7% 3.7 pp 15.9%
9

Financial Review
Revenue Breakdown by Customers
Revenue Breakdown by Businesses
Cost Structure
10 10

Revenue Breakdown by Customers
52.3% China Mobile
7.5%
China Unicom
4.3% 22.0%
2.1%
Others
16.0%
16.3% International Customers & Core Equipment Manufacturers
20.9%
For the year ended 31 December 2012
China Telecom
9.1% 7.3%
= YOY change
Slight decline in the PRC market Satisfactory growth in the overseas markets
11

Revenue Breakdown by Businesses
19.8 %
Wireless Enhancement
35.6 %
8.0 %
Wireless Access & Transmission
2.1 %
28.7 %
43.5 %
Services
30.2%
For the year ended 31 December 2012
1.3 %
Antennas & Subsystems
Strong growth in Services Decline in Wireless Enhancement due to project delay
= YOY change
12

1.9% 1.1%
0.5% 0.7%
13.1%14.3%
6.9%8.0%
5.7%
5.9%
0%
5%
10%
15%
20%
25%
30%
2011 2012
13
Cost Structure
As % of Total Revenue
Administrative expenses
Inflation, increase in staff salaries and continuous global expansion of the sales and service networks. More cost savings are expected in FY13.
Selling and distribution costs
Continuous development of new products
R&D costs
= YOY change
4.1%
15.3%
8.9%
Finance costs
Taxation charge 44.6%
45.0%
Inflation and increased administrative supports as a result of global business expansion. More cost savings are expected in FY13.
Higher interest rate and more financing activities as a result of global business expansion
For the year ended 31 December
28.1%
30.0%
Lower earnings in certain subsidiaries

14
Customer Review
Global Customers
China Business
International Customers & Core Equipment Manufacturers

Global Customers
China
Core Equipment Vendors
EMEA APAC Americas
15

Review & Opportunities:
Revenues at HK$ 5,168 million
Tightened operator CAPEX controls by operators
Increased focus on services and solutions to maintain revenues
Numerous network optimization and maintenance projects for operators Success in winning major wireless projects: 18th National Congress, 12th National Games venues
2013 and beyond
Data demands on wireless networks driven by increasing 3G usage
4G licensing, 3G expansion and multi-network activity driving capacity enhancement solutions
Small Cell, MDAS, LTE portfolio and services together enables total capacity enhancement solution offerings
China Business
(HK$’000)
Revenue
5,342,122 5,168,442
2011 2012
Y/Y:
-3.3%
16

Review & Opportunities:
Revenues up by 21% to HK$1,029 million
Tougher CAPEX environment: operators are selecting
suppliers with strong value proposition
Successfully created a local total solutions platform: Major sporting events e.g. 2014 Sochi Winter Games, 2014 World Cup Brazil Hong Kong MTR Express Rail Link: high speed rail linking Hong Kong to China
2013 and beyond
LTE commercialization driving long term growth
Increasing capacity demands on networks
Products and solutions together position the company at the epicenter of the growth
International Customers & Core Equipment Manufacturers
(HK$’000) Revenue
Y/Y:
+20.9% 851,238
1,029,375
2011 201217

18
Business Review
Wireless Access & Transmission
Wireless Enhancement
Antenna & Subsystems
Services
Summary

In-building Coverage
Stadium/Large Venues Scenic Areas
(Camouflaged Solutions)
Rural Area Coverage
Wireless Backhaul
Subways & Tunnels
Urban Area Coverage
Base Station Solutions
Solutions for all Network Stages
19

In-building Coverage
Stadium/Large Venues Scenic Areas
(Camouflaged Solutions)
Rural Area Coverage
Wireless Backhaul
Subways & Tunnels
Urban Area Coverage
Base Station Solutions
Solutions for all Network Stages
BTS Antennas
Tower Mounted Solutions
In-Building Solutions
Outdoor Wireless
Enhancement
Network Optimization
Solutions etc..
Installation,
Commissioning, etc.
Small Cell Solutions
Wi-Fi Solutions Wireless Backhaul
20

Review & Opportunities:
Revenues increased by 2% to HK$ 506 million
WIRELESS ACCESS (WLAN Solutions + Small Cell Solutions)
Directly addresses capacity solutions demand
Positive market response to IB-WAS and WLAN Solutions
Integrated into in-building solution offerings
Successful small cell trials in multiple provinces in China
Joint nanocell research program with China Mobile Research Institute
2013 and beyond
Exploding wireless data usage is driving offload solutions demand
Enhancement of small cell solutions for various systems
Expansion of sales to international market
Y/Y:
+2.1%
Revenue
(HK$’000)
Small Cell Solutions (IB-WAS)
WLAN Solutions
Wireless Access & Transmission
495,474 505,884
2011 2012
21

WIRELESS TRANSMISSION (Digital Microwave Systems & Satellite Solutions)
Expanded digital microwave solution sales to international markets around the world
Complete backhaul solutions
Diversified customer base to include fixed wireless network operators
Introduction of satellite solutions
Market feedback in China is positive - solutions deployed for public safety and emergency communications.
2013 and beyond
High speed, high capacity networks driving backhaul demand and solution development:
Continuous 2G/3G network build-outs and enhancement
Volume requirements for LTE and small cells
Break into new international market segment with satellite solutions
Digital Microwave Systems
Satellite Solutions
Wireless Access & Transmission
High Capacity
Wireless
Backhaul
Enterprise Subscribers
Residential Subscribers
Wi-Fi &
Enterprise Small
Cell
Wi-Fi & Home
Small Cell
22

Wireless Enhancement
Review & Opportunities:
Revenues decreased by 36% to HK$ 1,254 million
Tightened CAPEX in China impacted spending on wireless enhancement
2013 and beyond
LTE high capacity demands for high density areas driving wireless enhancement solutions
Well-positioned to capture the growing demand for multi-band, multi-operator DAS market
Build on the success of major ongoing projects such as 2014 World Cup, 2014 Sochi Winter Games, 18th National Congress.
Passive DAS (Small Venue)
Active DAS (Med/Large Venue)
Repeaters
Remote Radio Units
Y/Y:
+26.9%
(HK$’000) Revenue
Y/Y:
-35.6% 1,948,091
1,254,085
2011 2012
23

Antennas & Subsystems
Antennas
Tower Mounted Solutions
RF Front Ends
* ABI Research 2011, EJL Wireless Research 2012
Y/Y:
+1.3%
Review & Opportunities:
Revenues up at 1% to HK$ 1,819 million
Recognized one of the top 3 global base station antennas and subsystems vendor*
The #1 antenna vendor in China
Volume supply of multi-system combiners to China operators (2G/3G/LTE/WLAN)
LTE antenna portfolio deployed worldwide
2013 and beyond
Data demands driving new network buildout
Co-siting drives multi-system solutions to ease operator cellsite acquisition
Continued portfolio expansion to address demand for:
Multi-port, multi-band antennas and camouflaged antennas
street level and special antennas for high capacity/high density solutions
Revenue
(HK$’000)
1,795,136 1,818,823
2011 201224

Services
Network Maintenance
Network Consultancy
Network Planning
Project Rollout
Installation &
Commissioning
Network Commissioning
Network Optimization
Y/Y:
+30.2%
Review & Opportunities:
Revenues increased by 30% to HK$ 2,754 million
Growth reflecting strategy of solution sales and pure-service plays
Services include maintenance, consultation, commissioning, network optimization and project management
2013 and beyond
Localized services and total solutions is a key differential element
Continued strategic expansion of service and solution offerings
Revenue (HK$’000)
2,115,517
2,754,075
2011 2012
25

Summary
Continuous growth in demands for data and capacity driving global market in 2013 and beyond
Smartphone usage creating demand for anytime, anywhere access to data
Demand for end-to-end, cost-effective solutions for network rollout and optimization
Comba Telecom’s portfolio:
IB-WAS: Small Cells and Wi-Fi
Wireless Enhancement: Indoor and Outdoor DAS, MDAS
Transmission: Total IP Backhaul
Antennas & Subsystems: LTE-ready portfolio
Services: Localization allows total solution offerings
A compelling products and services portfolio positions Comba Telecom for future growth.
26

Open Forum
27

Appendix
28

Awarded Shares Expenses
1H 2H FY
Vesting shares (Mn) (1)
Expenses (HK$Mn)
(2)
Vesting shares (Mn) (3)
Expenses (HK$Mn)
(4)
Vesting shares (Mn)
(1) + (3)
Expenses (HK$Mn) (2) + (4)
2011 Nil 87 8.9 58 8.9 145
2012 5.7 34 Nil 20 5.7 54
2013 5.7 15 Nil 8 5.7 23
2014 5.7 4 Nil Nil 5.7 4
Total 26 226
On 12 April 2011, 26 million new shares were awarded to 365 qualified individuals at the market closing price of HK$9.32. Total expenses of approximately HK$226 million will be charged to the P/L in the 4 years.
29

Thank You
30