combination and comparison of digital … · t. kersten / combination and comparison of digital...
TRANSCRIPT
The 7th International Symposium on Virtual Reality, Archaeology and Cultural Heritage, VAST (2006), pp. 207–214, M. Ioannides, D. Arnold, F. Niccolucci, K. Mania (Editors)
Combination and Comparison of Digital Photogrammetry and Terrestrial Laser Scanning for the Generation of Virtual
Models in Cultural Heritage Applications
Thomas P. Kersten
HafenCity University Hamburg, Department Geomatics, Hebebrandstrasse 1, 22297 Hamburg, Germany
Abstract This paper summarizes two projects by the HafenCity University Hamburg, in which two historical build-ings were recorded by digital architectural photogrammetry and 3D terrestrial laser scanning and each re-constructed as a CAD building model. In one project each procedure was used separately and compared for the 3D recording and modelling of the church in Raduhn (in Mecklenburg-Western Pomerania, Ger-many), while in the second project the West Tower ensemble of Duderstadt (in Lower Saxony, Germany) was reconstructed by combination of both procedures. For both projects the digital SLR camera Fujifilm FinePix S2 pro and the terrestrial laser scanner Mensi GS100 were used. The church Raduhn was modelled both from 51 images using PhotoModeler, and from the 3D point cloud of the laser scanner using 3Dipsos. In this project the accuracy, the level of detail and the amount of work expended for both generated models were compared to each other. The West Tower ensemble, consisting of tower, museum and surrounding buildings, was modelled from 58 digital images and a 3D point cloud using PHIDIAS for visualisation ap-plications, which were used for presentation at the 500 year anniversary of the West Tower in the year 2006. The necessary work procedures from data acquisition to visualisation are described for both projects including the obtained accuracy (1-2 cm) and the amount of work expended.
1. Introduction
For 3D recording of objects like buildings terrestrial laser scanning today increasingly represents a genuine alterna-tive or supplementary measuring method to tachymetry or to digital architectural photogrammetry. However different laser scanners are available on the market as camera or panorama view scanners depending upon requirements regarding accuracy, range, resolution and scanning speed. The processing of tachometric or photogrammetric data for the generation of 3D building models is today a proven method. The photogrammetric acquisition and 3D model-ling of historical buildings e.g. with the software PIC-TRAN were published in [KAL04]. A software solution for the combined processing of laser scanning and image data with the program PHIDIAS of PHOCAD, Aachen is pre-sented in [BS05a]. Practical experiences using PHIDIAS with laser scanning data of a RIEGL LMS Z420i combined with a calibrated Nikon D100 digital camera are described in [NDSR05]. A comparison between 3D laser scanning and stereo photogrammetry from a practical point of view was performed by [Lin05] with the conclusion that the
combination of both techniques offer efficient options to generate the most suitable product. [IDST05] presented the combination of laser scanner data of the Cyrax 2500 and simple photogrammetric procedures for surface reconstruc-tion of monuments.
In this paper two projects were carried out by the HafenCity University Hamburg, in which two historical buildings (Fig. 1 and 2) were recorded by digital architec-tural photogrammetry and 3D terrestrial laser scanning and each reconstructed as a CAD building model. In one pro-ject each procedure was used separately and compared for the 3D recording and modelling of the church in Raduhn (in Mecklenburg-Western Pomerania, Germany), while in the second project the West Tower ensemble of Duderstadt (in Lower Saxony, Germany) was reconstructed by combi-nation of both procedures. The necessary work procedures from data acquisition to visualisation are described for both projects including the obtained accuracy and the amount of work expended. The virtual objects are presented and appropriate conclusions are drawn from the combination and comparison of both procedures.

208 T. Kersten / Combination and Comparison of Digital Photogrammetry and Terrestrial Laser Scanning for Virtual Models
2. The recorded objects - church in Raduhn and West Tower ensemble in Duderstadt
The church (Fig. 1) is located in the small village Raduhn in the district Parchim (Mecklenburg-Western Pomerania). The village was mentioned for the first time in a marriage-certificate from November 23rd in 1264, however no further documents exist concerning the building of the church. In the years 1857 to 1859 the "old church" was completely modified in the new gothic style under Grand Duke Frie-drich Franz II, which is today indicated in numerous pointed arches of the windows and doors. The melange of original rock faces and clay bricks is a time witness to this serious structural rebuilding. At the north and east front arches and bricked up windows are present in the brick-work as further signs of a formerly extended church. The building covers a ground plan of approx. 7 x 8 meters and has a roof ridge height of approximately 15 meters. The tower at the west side has a height of 24 meters. Today a large meadow surrounds the church, delineated by a one meter low dry stone wall.
Figure 1: Church in Raduhn (Mecklenburg-Western Pom-erania, Germany).
Figure 2: Front (left) and back view (right) of the West Tower in Duderstadt (Lower Saxony, Germany).
The West Tower (in German: Westerturm) is the land-mark of the city Duderstadt (district Goettingen) in the south-easternmost part of Lower Saxony. The West Tower (approx. 35m x 8m x 52m, see Fig. 2) is the only com-pletely preserved tower of the medieval city attachment, which was already mentioned for the first time in docu-ments on October 16th in 1343 as Niedertor. After a fire in spring 1424 the West Tower was destroyed, but it was rebuilt in stone after a short time period. The roof structure was completed in 1505, which made the tower into the landmark of the city due to its regular twisting. Due to serious damage to the timber construction of the roof a fundamental remediation of the tower was accomplished in the year 2002. In the course of this remediation the city wall in the old Bachmann' house was also opened and the structure of the old house front was replaced by a glass construction. The restored West Tower ensemble was solemnly inaugurated on August 12th in 2004 and made accessible to the public.
3. Systems for object recording
The recording of the two buildings was performed with a commercial digital SLR camera Fujifilm FinePix S2 pro and the terrestrial laser scanning system Mensi GS100. The S2 possesses a CCD chip with a sensor of 23.3 mm x 15.6 mm, which offer a maximum interpolated resolution of 4256 x of 2848 pixels, which yields a file size of approx. 35 MB per image in TIFF. At this resolution 28 photos can be stored on one Compact Flash Card with 1 GB storage capacity. The camera was used with Nikkor lenses with focal lengths of 14 mm and 28 mm.
Figure 3: Terrestrial 3D laser scanning system Mensi GS100 at HafenCity University Hamburg
The 3D laser scanning system GS100 is manufactured by Mensi S.A., France and consists of a laser scanner, accessories (Fig. 3) and appropriate software for data ac-quisition and post processing. The technical specifications of the system are summarized in [Men04]. The optimal

T. Kersten / Combination and Comparison of Digital Digital Photogrammetry and Terrestrial Laser Scanning for Virtual Models 209
scanning range is between 2 - 100m. The panoramic view scanner (field of view 360° horizontal, 60° vertically) offers an uninterrupted panoramic capture of a scene of 2m x 2m x 2m up to 200m x 200m x 60m indoors or outdoors. The resolution of the scanner is 0.002gon (in horizon-tal/vertical direction). The laser point has a size of 3mm at 50m distance, whereby the standard deviation of a single distance measurement is 6mm. The distance measurements are performed by pulsed time-of-flight laser ranging using a green laser (532nm, laser class II or III). The system is able to measure up to 5000 points per second. Investiga-tions into the accuracy behaviour of the terrestrial laser scanning system Mensi GS100 are described in [KSM05].
Fig. 3 shows the 3D laser scanning system Mensi GS100 (weight 13.5 kg) with accessories, consisting of a rugged flight case and a notebook for controlling the unit during data acquisition. The usage of an efficient power generator is recommended for field work, when mains power cannot be obtained.
4. Photogrammetric object recording and laser scan-ning
The object survey was performed via the following work procedures: signalling of control points for the photo-grammetric image acquisition and for laser scanning, measurement of a geodetic 3D network including control point determination using a Leica tacheometer, and laser scanning and photogrammetric image acquisition. The recording of the church Raduhn was conducted within one day at 21st of April 2004, while the West Tower ensemble was captured in February 2005 on three days.
Figure 4: Mobile turning ladder at the West Tower in Duderstadt for signalling of control points and for image recording
As photogrammetric control points 45 signals (size Ø 25 mm) for the church Raduhn and 49 signals (size Ø 50 mm) for the West tower were used. The signals were well distributed and attached to the object. Due to the height of the West Tower a mobile turning ladder with a maximum
work height of 28m (Fig. 4) was used for the signalling of control points and for additional photographs with the camera. For the registration and geo-referencing of the laser scanning point clouds of the West Tower nine green Mensi targets and six spheres were placed at the tower wall and on each tacheometer station, while the spheres for the scans of the church were just fixed on the eight tacheome-ter stations, which were well distributed around the church. Due to the building arrangement of the West tower ensem-ble and the integration of the internal area of the tower and the museum the geodetic 3D network consisted of four sub-networks with altogether 12 stations, from which all con-trol points for photogrammetry and laser scanning were measured. In an adjustment with the software PANDA (GeoTec, Laatzen) the 3D network and all control points were determined with a standard deviation of better than 1.5 mm (West Tower) and 3mm (church Raduhn). The outside and internal areas of the West Tower ensemble were recorded with 137 images in total (with maximum resolution, resulting in 5 GB graphic data), but only 58 images were used for the camera calibration and the fol-lowing data processing. On the other hand the church Raduhn was recorded with 60 images (resolution 3040 x 2016 pixel) using the camera with a Nikkor 14mm lens at eye-level, but here 51 images were used for later evalua-tion.
Figure 5: Terrestrial 3D laser scanning system Mensi GS100 in use: church Raduhn (left) and West Tower (right)
Both objects were scanned with the laser scanner GS100 (Fig. 5) from five (church Raduhn) and ten scanner stations (West Tower) at a grid spacing of 20 mm and 93 mm over 10 m distance, respectively. Object details such as windows or tower figures were scanned with a higher resolution of 5 mm / 10 m. The controlling of the scanner was performed with the software PointScape, whereby the selection of the scan ranges was conducted by video fram-ing of the internal video camera. Each visible target and sphere (which was attached to the tower wall and on the tachymetry stations) was scanned separately on each scan-ner station for the later registration and geo-referencing of the scans. These were automatically recognized as control points by the software. With the scanning of the West
210 T. Kersten / Combination and Comparison of Digital Photogrammetry and Terrestrial Laser Scanning for Virtual Models
Tower spire it turned out that the black slate roof hardly reflected the green laser light, so that this part of the build-ing had to be reconstructed later by photogrammetric methods. For the church 12 million points were scanned, which corresponds to a data volume of approx. 230 MB, while for the West Tower ensemble 13,5 million points (250 MB) were scanned.
5. Data processing
5.1. Registration and geo-referencing of scans
For manual registration and geo-referencing of the scans the software RealWorks Survey V4.2 from Mensi was used. All scanner stations were registered using three to seven targets and spheres in each scan, whereby the preci-sion for the registration of the point clouds was between 4 mm (minimum) and 8 mm (maximum value) for both projects. The geo-referencing of the registered point cloud of the West Tower was achieved by 23 control points (6 spheres on geodetic net stations, 9 targets and 8 spheres at the tower wall) with a RMS of 8.8mm of the control points, which was sufficient for the following object reconstruc-tion. The geo-referencing of the point cloud of the church was performed with a RMS of 5.2mm using 3Dipsos.
Figure 6: Entire point cloud of church Raduhn represented with RGB values of the point cloud
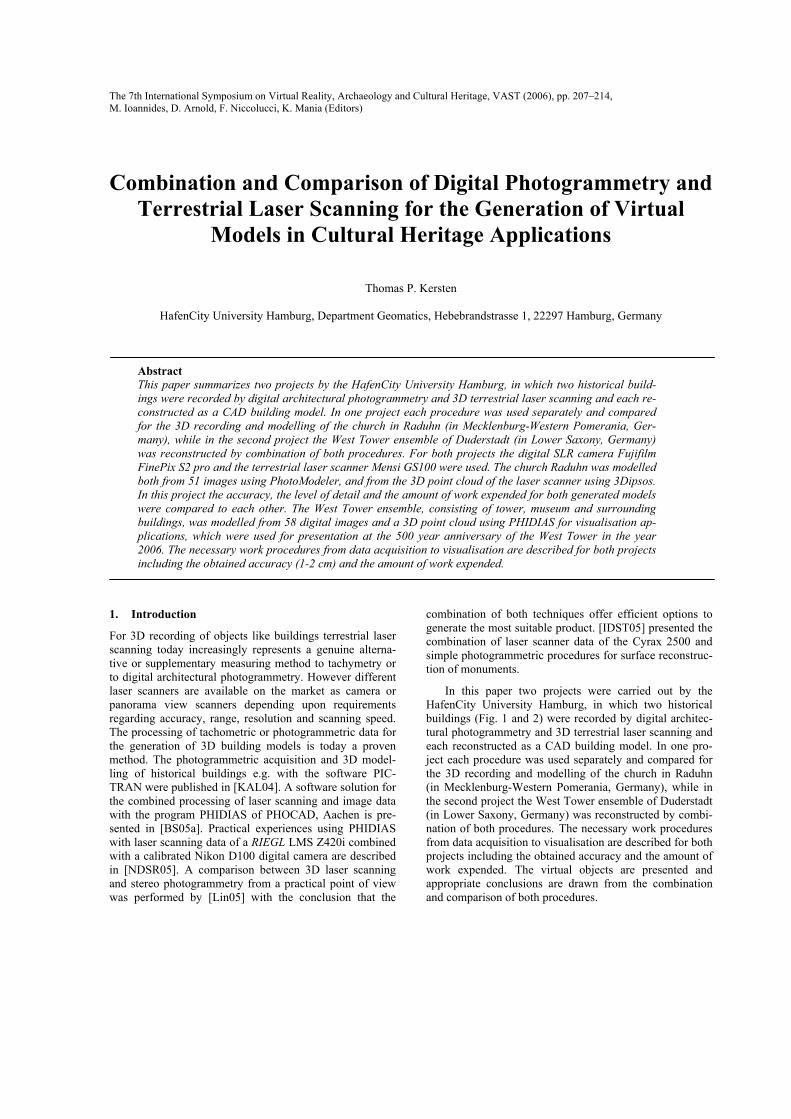
Subsequently each entire point cloud (Fig. 6 and 7) was cleaned up, i.e. all redundant points, which did not belong to the object, were deleted. For the object reconstruction the parts/areas in the point cloud, which were required for data processing, were segmented and exported as an ASCII file, in order to be able to be processed in PHIDIAS.
Figure 7: Entire point cloud of West Tower ensemble
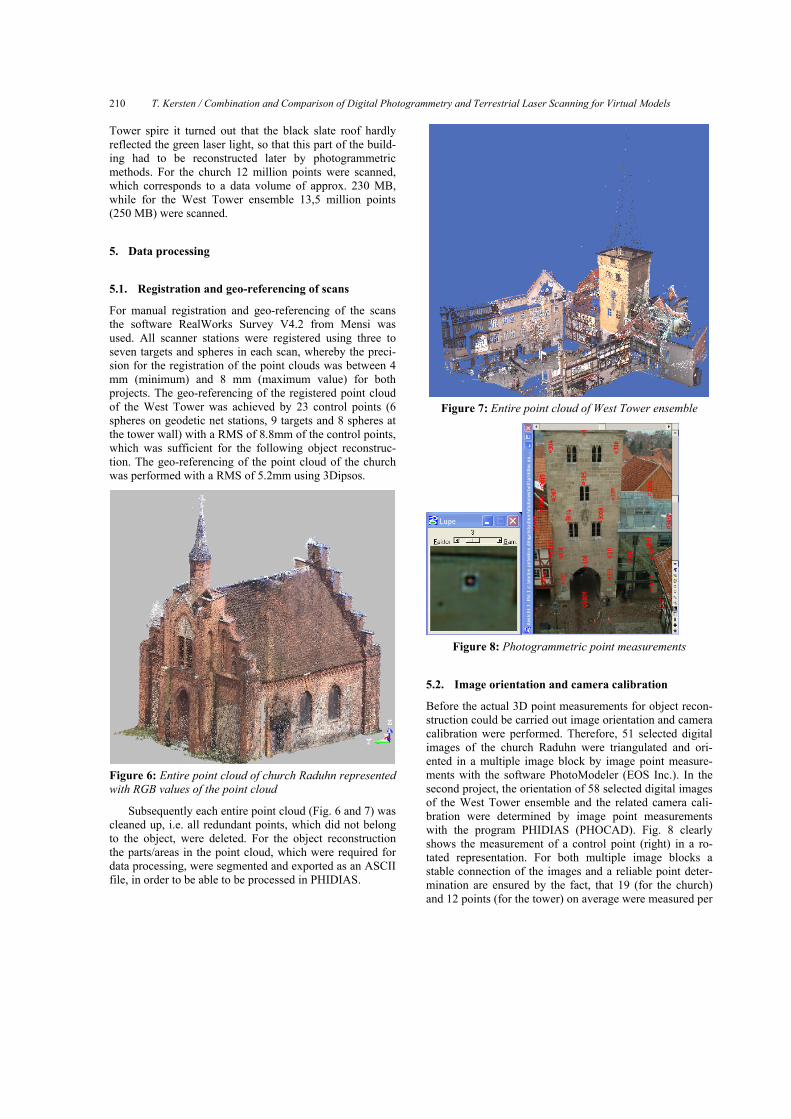
Figure 8: Photogrammetric point measurements
5.2. Image orientation and camera calibration
Before the actual 3D point measurements for object recon-struction could be carried out image orientation and camera calibration were performed. Therefore, 51 selected digital images of the church Raduhn were triangulated and ori-ented in a multiple image block by image point measure-ments with the software PhotoModeler (EOS Inc.). In the second project, the orientation of 58 selected digital images of the West Tower ensemble and the related camera cali-bration were determined by image point measurements with the program PHIDIAS (PHOCAD). Fig. 8 clearly shows the measurement of a control point (right) in a ro-tated representation. For both multiple image blocks a stable connection of the images and a reliable point deter-mination are ensured by the fact, that 19 (for the church) and 12 points (for the tower) on average were measured per

T. Kersten / Combination and Comparison of Digital Digital Photogrammetry and Terrestrial Laser Scanning for Virtual Models 211
image and that each object point was measured, on aver-age, in 8 and 6 images, respectively. All image orientation parameters were determined simultaneously with the cam-era calibration parameters in both software packages by a bundle block adjustment. Systematic errors, like the high lens distortion, were compensated in the camera calibration for the further evaluation. All image points could be meas-ured with an image measuring precision of sxy = 3.0 micron (church) and 4.8 micron (West Tower) respectively, which corresponds to a precision of better than a half and/or one pixel. The standard deviations for the coordinates of object points were about 2 mm in both projects for the signalised points and better than 1 cm for all natural points. These results confirm the high precision potential of digital SLR cameras for applications in architectural photogrammetry, which could be also achieved in other projects [KAL05].
5.3. Object reconstruction by different procedures
In order to be able to compare the potential of the photo-grammetric and the laser scanning data for the 3D evalua-tion and the object reconstruction of the church, oriented images in PhotoModeler and segmented point clouds in 3Dipsos were evaluated separately.
Figure 9: Reconstruction of a window by photogrammetric 3D point measurements (left, centre) and a window detail (right) in comparison, generated from photogrammetric data (bottom) and from laser scanning data (top)
In PhotoModeler the necessary object points were measured in at least three images with a standard deviation of better than 10 mm, whereby identical objects, as e.g. windows or stucco volumes were measured only once in detail and were inserted later in CAD as CAD copy in a measured insert point. For the generation of the 3D volume model the points were imported via a DXF file into Auto-CAD. For constructive working with AutoCAD the differ-ent main elements, like facades, windows, stanchions, tower, main and side entrance were modelled in separate files. Smaller objects and details, e.g. roofs, pattern of the ornament and crosses, were directly designed in the respec-tive files of the associated elements. The individually mod-
elled objects were built up afterwards to an entire volume model. Fig. 9 presents a window, which was generated from digital images. Furthermore, a 3D window detail, which was generated from photogrammetric data (bottom right) and from laser scanning data (top right) is shown in Figure 9.
Due to the geometrical structure of the building the modelling of the point clouds was made predominantly in 3Dipsos by best-fit-functions, i.e. most geometry elements were produced over an approximation of a plane. E.g., in the segmented point cloud of a facade an adjusted plane was computed without basic conditions. These geometrical elements were pruned afterwards with other planes. In such a way, the facades, the roof elements, stanchions and ga-bles could be generated. For the embrasure of the windows, adjusted planes right-angled to a further plane, and for the vaults of the windows, adjusted cylinders, were calculated. The ornaments were modelled with the geometrical ele-ment torus. For the production of the 3D volume models the modelled data were transferred via a DXF file to Auto-CAD.
Figure 10: 3D volume model of church Raduhn in com-parison: photogrammetry (left) vs. laser scanning (right)
Fig. 10 shows the church Raduhn as two comparable rendered 3D volume models, where one was generated from digital photogrammetric images (left) and the other from laser scanner data (right). For both models some distances were controlled by geodetic determined dis-tances. For this quality control an accuracy of up to 20 mm could be achieved, whereby the differences between pho-togrammetry and laser scanning were also in the same range. However, it must be stated, that the point identifica-tion and the generalizations for object reconstruction have an influence on the accuracy of the compared distances. A detailed description of the comparative reconstruction of the church Raduhn using both procedures is summarized in [Hof05].

212 T. Kersten / Combination and Comparison of Digital Photogrammetry and Terrestrial Laser Scanning for Virtual Models
5.4. Object reconstruction by combination of both procedures
The object reconstruction of the West Tower ensemble was accomplished with the photogrammetric system PHIDIAS, which is an MDL-application for the CAD system Micro-Station. The measured data from PHIDIAS can be dis-played directly in MicroStation and further processed by the combination of these programs. The point clouds, which were imported in ASCII format, are converted into an internal binary format, in order to accelerate further processing of these data and to reduce the file size.
Figure 11: Representation of the point cloud in combina-tion with image data (top) and monoplotting of stones using information of an image and laser scanning (bottom)
3D point determination by monoplotting in PHIDIAS is possible by the combination of photogrammetric and laser scanning data. Therefore, the point cloud and the pertinent image are displayed on screen at the same time (see Fig. 11). In a first step a mapping plane must be specified, whereby it must be defined that the axis of the coordinate system is right-angled on the building facade, in order to simplify a later mapping of each single stone. The neces-sary depth information is received from the point cloud after the definition of a plane. For the mapping of the single stones the point cloud was hidden and the drawing of each single stone was executed in 3D as a "closed polygon". The single stones were drawn over the actual edges of the build-ing as well as over the windows and passages, in order to determine the accurate corners and edges in the CAD pro-gram by pruning according to the reconstruction of all building facades. Afterwards, all single stones were ex-
truded into a 3D volume body on the actual wall thickness, which was determined by hand measurements with a strength of up to 1,55 m. A detailed description of the reconstruction of the West Tower is summarized in [BS05b].
Figure 12: Generation of the top of the West Tower: pho-togrammetric image, wire frame, rendered model in Auto-CAD and visualisation in Highlight pro
5.5. Visualisation
For the visualization of the West Tower ensemble the surrounding topography (roads, ways, paving stone transi-tions, traffic signs, lanterns, trash cans and watercourse) and the adjacent buildings (generalized) were recorded by tacheometry with Leica TCRP 1105+. This recording was supplemented by detailed hand measurements (sketches) of some objects such as lanterns and traffic signs.
Figure 13: Rendered perspective scenes of West Tower ensemble Duderstadt generated by AutoCAD
The visualization of both objects was realised with dif-ferent programs: AutoCAD, AECViz of TORNADO Tech-nologies Inc., Canada, 3D Studio VIZ and Highlight pro. In AutoCAD the 3D volume model was rendered to obtain a quality control of the modelled data (Fig. 13) and to pro-vide perspective view in BMP format. An interactive ani-mation was created for each data set with AECViz (Fig. 14), i.e. the entire DWG file (church: 12 MB, West Tower: 132 MB) was converted into 3 and 5 MB large executable

T. Kersten / Combination and Comparison of Digital Digital Photogrammetry and Terrestrial Laser Scanning for Virtual Models 213
programs (EXE file), respectively, which can be viewed from all perspectives and which also can be used for an interactive walk or fly through. In Highlight pro a video sequence was created for both projects with a length of 53 (church) and 161 seconds (West Tower) at a resolution of 640 x 480 pixels as a coded MPEG file (30 and 57 MB, respectively) (see Fig. 15), while a virtual walk through was generated additionally with 3D Studio as a film se-quence of the West Tower (3:31 min, AVI, 727 MB). Some visualizations of the West Tower ensemble are available for the public at a computer terminal in the tower cafe.
Figure 14: Interactive virtual model of West Tower ensem-ble Duderstadt generated by AECViz
6. Time and cost aspects
The work load for the entire processing of project West Tower ensemble Duderstadt amounted to 623 working hours. In total, theoretical costs of approx. € 35,000 for the project were induced using appropriate current hourly wages for measuring assistant, technician and engineer. In Fig. 16 the proportional work expended of the individual work procedures are represented. It is evident that 52% of the entire work time was spent with CAD modelling and visualization. In the time for visualization only the work with AutoCAD and AECViz is included, since the video sequences were generated later.
In the project church Raduhn the following working hours were needed: laser scanning 161h (object recording 6 h, 3Dipsos 91h, AutoCAD 63h) and photogrammetry 251h (object recording 2h, PhotoModeler 144h, AutoCAD 105h). Thus, the following costs of the project result with-out the necessary 3D geodetic net measurements and con-trol point determination: € 7,000 (laser scanning) and € 10,000 (photogrammetry). The higher costs of photogram-metry are to be justified by the much higher degree of achieved detail. Potential for optimisation for such projects could be possible by reducing of the number of used con-trol points and their geodetic control point determination,
by focussing on laser scanning of important object parts, by using more experienced personnel for CAD modelling and by omitting details.
Figure 15: Perspective scene of the virtual model of church Raduhn (top) and of West Tower ensemble Duder-stadt (bottom) generated by Highlight pro V3
Figure 16: Expenditure of human labour for project West Tower ensemble Duderstadt in percent

214 T. Kersten / Combination and Comparison of Digital Photogrammetry and Terrestrial Laser Scanning for Virtual Models
7. Conclusions and outlook
The church Raduhn and the West Tower ensemble Duder-stadt were successfully reconstructed by digital architec-tural photogrammetry and terrestrial laser scanning as virtual 3D volume models. The assigned technologies (instruments and software) offer a detailed and accurate reconstruction of the objects with an accuracy of 1-2 cm. The combined evaluation of photogrammetric and laser scanning data with PHIDIAS proved very efficient, since a direct connection for the CAD modelling was available. In project church Raduhn a more detailed model could be created by photogrammetric evaluation of the images com-pared to the model derived from point clouds, but the work expended was clearly higher with the photogrammetric procedure. With a higher resolution of laser scanning a detailed model could be generated, however at expense of a higher expenditure of human labour for the data acquisition and for the evaluation of the point clouds. For applications in architecture (e.g. building acquisition) it is appropriate and viable to use the laser scanner for stone-fair mapping or for the modelling of object details, such as sculptures and ornamentations, in combination with photogrammetry if such objects can be scanned with a very high point den-sity. One can easily model these object details in CAD using simple cuttings (Fig. 17). Nevertheless, manual point measurements and CAD modelling still remain a substan-tial cost factor for such detailed 3D models in future. In addition the combined object recording and evaluation sets high capital outlays for the laser scanning system (approx. € 120,000). On the other hand a photogrammetry system (camera and PC incl. software) with approx. € 7000 repre-sents a low-cost system.
Figure 17: Modelling of ornaments by laser scanning data: cutting of the point cloud (left), CAD line derived from the laser scanning data (centre), extrusion of the CAD line (right).
8. References
[BS05a] BECKER, R., SCHWERMANN, R.: Bestandserfassung durch kombinierte Auswertung von Laserscanner- und Bilddaten. Photogrammetrie, Laserscanning, Optische 3D-Messtechnik – Beiträge der Oldenburger 3D-Tage 2005, Th. Luhmann (Hrsg.), Wichmann Verlag, Heidel-berg, pp. 134-141.
[BS05b] BIEBERMANN, M., SCHNEIDER, M.: 3D-Erfassung und Modellierung des Duderstädter West toweren-sembles durch Kombination von digitaler Architek-turphotogrammetrie und terrestrischem Laserscanning. Unpublished diploma thesis, HafenCity University Ham-burg, June 2005.
[Hof05] HOFFMANN, R.: Vergleichende Untersuchung bei der 3D-Erfassung und Modellierung der Kirche von Ra-duhn durch digitale Photogrammetrie und terrestrischem Laserscanning. Unpublished diploma thesis, HafenCity University Hamburg, June 2005.
[IDST05] IOANNIDIS, Ch., DEMIR, N., SOILE, S., TSAKIRI,
M.: Combination of Laser Scanner Data and Simple Pho-togrammetric Procedures for Surface Reconstruction of Monuments. CIPA 2005 XX Int. Symposium, 26 Sep. – 01 Oct., 2005, Torino, Italy. http://cipa.icomos.org/index.php?id=356
[KAL04] KERSTEN, TH., ACEVEDO PARDO, C., LINDSTAEDT, M.: 3D Acquisition, Modelling and Visualization of north German Castles by Digital Architectural Photogram-metry. The Int. Archives of Photogrammetry, Remote Sensing and Spatial Information Sciences, Vol. XXXV, Commission V, Part B2, (July, 2004), pp. 126-132.
[KSM05] KERSTEN, TH., STERNBERG, H., MECHELKE, K.: Investigations into the Accuracy Behaviour of the Terres-trial Laser Scanning System Mensi GS100. Optical 3D Measurement Techniques VII, (Eds. Gruen/Kahmen), Vol. I, Vienna, (Oct. 2005), pp. 122-131.
[LIN05] LINSINGER, W.: “3D Laser” versus “Stereo Photo-grammetry” for Documentation and Diagnosis of Build-ings and Monuments (Pro and Contra). CIPA 2005 XX Int. Symposium, 26 Sep. – 01 Oct., 2005, Torino, Italy. http://cipa.icomos.org/index.php?id=356
[Men04] MENSI: GS 100 3D laser scanner. http://www.mensi.com/website2002/gs100.asp, 2004.
[NDSR05] NEUBAUER, W., DONEUS, M., STUDNICKA, N., RIEGL, J.: Combined High Resolution Laser Scanning and Photogrammetrical Documentation of the Pyramids at Giza. CIPA 2005 XX Int. Symposium, 26 Sep. – 01 Oct., 2005, Torino, Italy, http://cipa.icomos.org/index.php?id=356