combination of biological and photochemical treatment · pdf filecombination of biological and...
TRANSCRIPT

Combination of biological andphotochemical treatment for degradationof azo dyes
Anbarasan Anbalagan
Degree project in applied biotechnology, Master of Science (2 years), 2012Examensarbete i tillämpad bioteknik 45 hp till masterexamen, 2012Biology Education Centre, Uppsala University, and Department of biotechnology, Lund UniversitySupervisors: Bo Mattiasson and Maria JonstrupExternal opponent: Aishwarya G Nadadhur

1
Waste is not waste unless it is used as waste…
[Inspired from Earth day Canada]

2
Abstract
Azo dyes are designed to withstand sun light, chemicals, water and microorganism in the
dress material. They are present in textile waste water exhausted during the dyeing step. After
modern waste water treatment, these dyes are transformed from one form to another as
chemical sludge or secondary wastes, and build up of toxic compounds has been found in
treated water. To degrade azo dyes, a combination of biological pre-treatment and photo-
chemical post-treatment of Remazol Red RR (100 mg/l) was evaluated. Initially two separate
anaerobic biofilm reactors were used at different hydraulic retention times (HRTs) (6, 4 and 2
days) using starch as carbon source (0.465 g/l); 58-64% reduction of chemical oxygen
demand (COD) was attained in the reactors. Thereafter 4 days HRT was selected to study
performance of the anaerobic reactors when lowering the phosphate content from 292 mg/l to
36.5 mg/l; 61-69% COD removal was achieved under these conditions. Complete
decolourisation was achieved in all pre-treatment conditions. In the second part, photo-
Fenton treatment was evaluated for complete mineralisation of dye metabolites formed
during anaerobic pre-treatment. The optimal reagent concentrations were found to be 15
mM of H2O2 and 3 mM of Fe2+
using the reactor effluent after 4 days HRT, 99 % COD
removal was attained. By using effluent from the phosphate study, COD removal of 99% was
achieved at 10 mM of H2O2 and 1 mM of Fe2+
. Hence, this study shows that reducing the
amount of phosphate in the anaerobic medium minimises the reagent consumption in the
photo-Fenton post-treatment to completely remove Remazol Red RR.
Keywords: Azo dyes; Remazol Red RR; Anaerobic pre-treatment; Photo-Fenton post-
treatment; Hydraulic retention time; Phosphate content; Chemical oxygen demand.

3
CONTENTS
1 Introduction 04
1.1 Background 04
1.2 Scope of this thesis 04
1.3 Textile waste water-an overview 04
1.4 Replacement of traditional dyes 04
1.5 Azo dye chemistry 05
1.6 Significance of textile dye loss 07
1.7 Ecological problem 08
1.8 Different treatment options 08
1.8.1 Biodegradable treatments 08
1.8.2 Study supporting anaerobic treatment as post treatment 09
1.8.3 Physical and chemical treatment 10
1.8.4 Photo-Fenton as post treatment 10
1.9 Combination of biological and photo-chemical treatment 11
2 Materials and Method 13
2.1 Inoculumn 13
2.2 Chemicals 13
2.2.1 Preparation of anaerobic medium 13
2.3 Anaerobic pre-treatment 13
2.3.1 Anaerobic batch studies 13
2.3.2 Anaerobic biofilm reactors 13
2.4 Photo-Fenton batch experiment 15
2.4.1 Comparison Fenton and photo-Fenton treatment 15
2.4.2 Assessment of photo-Fenton parameters for post treatment after anaerobic batches 15
2.4.3 Assessment of photo-Fenton parameters for reactor effluent after HRT and phosphate study 16
2.4.4 Stepwise addition of hydrogen peroxide 17
2.5 Analytical methods 17
2.6 Formulas used 18
3 Results 19
3.1 Anaerobic Batch experiments (pre-treatment) 20
3.2 Photo-Fenton batch experiments (post-treatment) 25
3.3 Reactor studies: part-I 27
3.3.1 HRT studies in anaerobic biofilm reactors 27
3.3.2 Assessment of photo-Fenton parameters for reactor effluent after HRT study 29
3.3.3 Step wise addition of hydrogen peroxide for established Fenton reagent conditions 33
3.4 Reactor studies: part-II 35
3.4.1 Phosphate study in anaerobic biofilm reactors 35
3.4.2 Assessment of photo-Fenton parameters for anaerobically treated synthetic waste water from
anaerobic batches 35
3.5 Overall degradation of Remazol Red RR 37
4 Discussions 38
5 Conclusions and Future perspectives 43
6 References 45
7 Acknowledgements 47
8 Appendix 48

4
1 Introduction
1.1 Background
The entire world looks more vibrant and colourful to our eyes because of the existence of
colourful xenobiotic compounds in the fabrics called dyes. However, the ecological effects of
dyes in effluents from textile industries have been under serious discussions for last three
decades. Potable water is becoming scarcer in most of the textile producing nations.
Improved remediation of exhausted water and its reuse is required to stop the ecological
effects. As a result, textile waste water remediation via microbial application has opened a
cheap gateway for improved treatment of textile waste water to an extent, but complete
mineralisation of the dye intermediates is doubtful. Alternatively, recent research shows
chemical degradation as a stand alone treatment to reduce pollutants level in the textile waste
water. The level of aromatic toxic compounds and colours in the form of dyes released in the
dyeing step is increasing and varies in the released waste water periodically because of
various manufacturing practises. Apart from large quantity of water consumption, disposal of
more contaminants enters into the fertile lands after various textile operations. To increase the
textile production in the world market, textile industries are tempted to release improperly
treated waste water directly into water streams [1]. Analysis of treated waste water collected
from Youngor Textile Complex in China has shown presence of persistent chemicals even
after modern waste water treatment [31]. Replacement with safer alternatives would stop the
usage of hazardous chemicals. Every decade treatment techniques vary and it is not fixed to
treat the textile waste water.
1.2 Scope of this thesis
The aim of this study was to study the feasibility of a combined biological and photochemical
process for treatment of azo dye containing waste water.
1.3 Textile waste water- an overview
Waste water is exhausted in large amount every year due to increased demand for coloured
dress materials. Waste water generated from textile industries is composed of suspended
solids, unfixed dyes, grease, oil, high chemical oxygen demand (COD), high salt content and
other soluble chemicals. COD denotes the amount of oxygen required to oxidise the
pollutants present in the waste water . It is used to estimate soluble and insoluble pollutants
present in textile waste water before discharged into the environment. It is also characterised
by alkaline pH. Examples of characterised textile waste waters from different sources are
shown in table 1 and 2. Most of the chemicals differ in their concentration because of
different manufacturing practises [5]. Characteristics of waste water vary with every step, as
listed in Table1. A simplified overview of a wet textile process, starting from sizing to
finishing of the textile is illustrated in Fig. 1.1. Dyes are discharged in large quantity during
the dyeing and finishing process. As a result of manufacturing, approximately 10,000
different dyes were exploited with an annual production of more than 50, 000 metric tonnes
to meet the demands of dyeing [4].
1.4 Replacement of traditional dyes
Historical evidence shows that ancient people were aware of dyes from plants extracts and
other inorganic sources already thousands of years ago. Indeed the first organic dye, indigo
was used to wrap up mummies in the Egyptian civilization 4000 years ago [3, 22, 4].

5
Additionally, most of the world’s ancient architecture contains colourants, which were
extracted from plants. Apparently older methods involved large amount of raw materials,
land and labours to prepare a small quantity of impure dye. However, the use of natural dyes
decreased in late nineteenth century [3].
Fig1. 1 Simplified view of chemicals and other impurities generated during wet textile processing. (A: aim
of the wet processing techniques, B: different phases of cotton wet processing, C: chemicals released after
wet processing)
Table 1: Characteristics of a textile waste water from wet processing of cotton [6, 11].
Chemical
Properties
Desizing
Scouring
Bleaching
Mercerizing
Dyeing
pH
8.8-9.2
10 – 13
8.5 - 9.6
5-10
8.9-10.1
COD (mg/l)
4600- 5900
8000
6700-13500
1600
1100- 4600
Table 2: Notable inorganic salts present in waste water from wet processing of denim [28]
Inorganic salts
Denim - wet
processing
Garment rinsing
Dyeing
Chlorides (mg/l)
680
4
11,900
Phosphates (mg/l)
13
2
32
Sulfates (mg/l)
70
30
140
In 1856, Perkins accidentally invented the first synthetic dye called mauvein. After this
innovation, synthetic textile dyes became ubiquitous and were used for curtains, carpets, seat

6
covers, etc. Synthetic dyes are nowadays used for many applications in addition to textiles such as
leather, cosmetics, paints and paper printings, foods etc. [3, 8].
In fact, old and modern dyes differ in the way of production methodology. Apparently to
produce versatility in colour and also to improve the longevity against strains, chemicals and
solar light, traditional natural dyes were suddenly replaced by synthetic dyes these were
assigned to have aromatic structures because of their stability and to produce vibrant colours
[3].
1.5 Azo dyes
When looking close into the molecular structure of a textile dye, it contains an arrangement
of atoms which is responsible for colour formation called “chromophore” [2, 4, 9, 22]. Based
on the absorption capacity of the chromophore in the visible light, different colours are
produced by the dyes [2]. Common chromophores contain bonds such as azo (-N=N-),
carbonyl (-C=O-), and nitro (-NO2) etc [2, 4, 9]. The chromophore structure can be connected
to a group called “auxochrome” which is used to alter or shade the colour of the dye [2, 9].
Some familiar auxochromes found in dyes are amines (-NH2), carboxyl (-COOH), hydroxyl
(-OH) and sulphonic acid sodium salt (-SO3Na) [2, 36]. The auxochromes can belong to any
class of dyes such as basic, vat, direct, and reactive, disperse and pigment while the aromatic
structure connected by these bonds gives stabilization for their structures [4, 36]. Textile dyes
are classified based on their structure (e.g. azo, anthraquinone) and dyeing methodology (e.g.
basic, direct) [2, 4]. Textile dyes are designed to bear properties such as longevity of colour,
resistance against chemicals, microbes, natural strains and sunlight [2]. These features
attracted textile manufacturers to replace the traditional natural dyes.
More than the worldwide output of fabric industries survives because of the omnipresent
nature of following reactive dye groups: azo, anthraquinone, phthalocyanine, triarylmethane,
stiblene and sulphur dyes etc [10, 4, 9]. Also, 80% of the acid and reactive dyes are made up
of azo compounds [5, 9]. Azo dyes are predominantly used in textile industries. They are
characterised by the azo bond (-N=N-) and they are highly water soluble and designed to be
recalcitrant. Based on the number of azo bonds, azo dyes are classified as mono-, di- and tri-
etc. Azo dyes are an important group of dyes produced worldwide in large quantity due to the
simplicity in synthesis. Industrial scale production started in 1858 when P. Gries developed
the diazotisation mechanism for synthesising azo compounds [7]. Overall 60-70% of the
textile manufacturers consume azo dyes for producing vibrant colours in their textile products
[30]. A majority of azo dyes responsible for blue, red and yellow, are generally a mixture of
different dyes to produce different colours [4].
Fig. 1.2: Remazol Black 5, an example of a typical azo dye.

7
1.6 Significance of textile dye loss
Reactive dyes (example: Procion MX) were introduced in 1956. They are highly soluble in
water, and they require very intense conditions like high temperature and acidic or basic
environment to provide fixation to cotton fibres [7]. Some of the original dyes were toxic in
nature. They also showed improper fixation on clothes and high amounts were lost in the
rinsing step. In 1958, a range of reactive azo dyes called Remazol dyes were introduced to
combat fixation losses. Hence, they were designed to include vinyl sulfone groups to reduce
the toxicity, which is readily soluble in water and used for different fibres, but loss of these
dyes persisted due to incomplete fixation [14]. In recent years, pre-treatment of fibers,
combination of dyes and introduction of auxiliary compounds have been used to decrease the
fixation loss. Nevertheless about 15-20% of the dyes are still lost in the textile effluent
annually [11]. An important reason for the loss is spontaneous hydrolysis before adsorption
or covalent bonding to cotton fibres (Fig. 1.3). As a result of hydrolysis, unfixed dyes are
released with the dye house effluent which makes the waste water appear coloured. The main
environmental effects are due to reactive azo dyes. Along with unfixed dyes, dye impurities
are also present in the effluent [2, 4].
Fig. 1.3: Simplified view of dye fixation and fixation loss [12].
Overall loss of different dyes is summarised in the table 3. New dye classes should be
carefully investigated using toxicity studies before their introduction to the market.
Table 3. Fixation loss to effluents during dyeing step (adapted from [6]).
Commercial dye types Fibres used for fixation Loss of dyes in the effluent (%)
Acid Polyamide 5 - 20
Basic Acrylic 0 - 5
Direct Cellulose 5 - 30
Disperse Polyester 0 - 10
Metal complex Wool 2 - 10
Reactive Cellulose 10 - 50
Sulphur Cellulose 10 - 40
Vat Cellulose 5 - 20

8
1.7 Ecological problems
Generally, azo dyes are not considered to be toxic to humans [4]. Chronic effects are
associated with those who work in the textile processing [10]. According to the reports of
International Agency of Research and Cancer (IARC), cleavage of azo dyes results in
intermediate compounds of aromatic amines, which can act as mutagens [8]. If azo dyes are
accidentally consumed by humans they are further reduced by microbes present in the gastro
intestinal tract. The dye intermediates act as carcinogens by forming acyl oxy amines via N-
hydroxylation and can initiate bladder cancer. Formation of aromatic amines leads to N-
acetylation, O-acetylation and results in acyloxy amines. Later they are reduced into
nitrenium and carbonium ions. These compounds anchor with DNA and RNA, and
consequently end in mutation of the nucleic acids, and formation of tumours [10]. Dyes can
also be reduced under anaerobic condition in the environment into more toxic compounds. It
is easy to visualise the turbid colour of the textile effluents through our naked eyes. Being
dirty in appearance it affects aquatic organisms by inhibiting penetration of the sunlight [10,
11]. Moreover, mixing of dyes in running water stream makes it non potable.
Case studies show that textile dyes and other process chemicals were mixed with irrigation
water and their build up has been found in agricultural fields in the Sangenar region of India
and the Yangtze River delta of China [1, 24]. Toxicity studies of textile waste water from
Sangenar region (India) showed harmful effects in rats [1]. Stockholm Environmental
Institute reports that due to cheap labour and low production cost, most brands have their
supply chains in developing countries like Thailand and Bangladesh [36].
1.8 Different treatment options
1.8.1 Biodegradable treatments
In recent years, several groups of microorganisms have been reported for biodegradation of
azo dyes. Microorganisms including white rot fungi, mixed and pure culture of bacteria have
been shown to carry out decolourisation of textile dyes, but still complete degradation has not
been reported [36]. None of the pure strains have been used for textile waste water treatment
in full-scale application [36].
Anaerobic treatment is well established for breaking the complex dye structure into aromatic
amines by reduction of the azo bond. Anaerobic degradation takes place in the absence of
molecular oxygen by converting organic compounds present in the waste water to carbon
dioxide, methane and other trace gasses. Under anaerobic environment, reactive groups of
dyes can act as electron acceptor in the electron transport chain for anaerobic cleavage of
dyes [2, 36]. It is believed that microbial azo dye reduction involves nonspecific enzymatic
secretion from diverse microbial consortium in the anaerobic sludge or by chemical induced
reduction through flavonoids, Fe2+,
ascorbate, cysteine and sulphide [2, 13]. Until now there is
no clear evidence about the mechanism of anaerobic dye decolourisation [2, 13, 35]. Not only
dye reduction, but most of the organic matter present in excess could also be reduced by
anaerobic treatment. However, the possibility of biogas production is not demonstrated so far
in the full scale anaerobic dye reduction [13]. Major anaerobic cleavage products from textile
dyes such as toluene, napthalene, aniline, toluidine and benzidine etc were common among
reactive azo dyes. These metabolites are toxic to living environment [15]. Even if the effluent
obtained is colourless, the water soluble by-products from anaerobically cleaved dyes can be
toxic to living environment. The aromatic amines are not further degraded under anaerobic

9
conditions and therefore anaerobic treatment requires a post-treatment to eliminate the toxic
amines [2].
Conventional aerobic treatment can be used to oxidise organic compounds, however it cannot
be used to decolourise azo dyes, with the exception of some organisms and dyes [30]. Azo
bonds have an electron withdrawing capacity and are thereby not oxidisable by the oxidative
catabolism of aerobic microbes. Aerobic reduction of azo bonds is not successful because
oxygen is a more favourable electron acceptor for microbes than the dyes. In addition, some
aerobes contain oxidative enzymes such as mono- and di- oxygenases which have the
potential to degrade azo dyes, but there is no evidence so far to use aerobes in large scale [2].
Most of the azo dyes are non degradable using activated sludge treatment due to lack of
specific enzymes. Therefore most of the textile dyes are not aerobically biodegradable.
Adsorption to aerobic organisms only occurs to a low extent because most of these dyes are
water soluble [2, 8].
In order to have less impact on environment and operational cost, only combined anaerobic
and aerobic treatments have been reported in full scale application. For instance, first
successful application of anaerobic and aerobic treatment was installed in full scale in The
Netherlands (1999) [8].
1.8.2 Studies supporting anaerobic treatment as a pre-treatment
PAQUES AB, a Netherlands based textile waste water company, is using a combination of
anaerobic treatment and aerobic treatment to degrade pollutants present in the textile waste
water [18]. This company has successfully treated textile waste water in large scale with 35-
55% COD removal and complete colour removal in the anaerobic step. Also, to increase the
efficiency of this process, the starch wastes obtained at desizing step are directed into the
anaerobic reactors to support the growth of anaerobic microbes [8]. Moreover, the effluent
obtained from the anaerobic step is directed to aerobic treatment. The degradation of amines
and other products formed during the anaerobic step increases the COD reduction to between
80-90%. However, bypassing the toxicity of the processed water is still a quest for them [8,
18]. According to recent studies using combined anaerobic and aerobic reactors, azo dyes are
only partially mineralised and one of the dyes showed a tendency to auto-oxidise, i.e.
resistance to aerobic treatment was evident [17].
1.8.3 Physical and chemical treatments
A conventional physical method, like adsorption using activated carbon, is a very efficient
treatment method; however reactivation for reuse of the adsorbent is economically
unfavourable in large scale. Membrane filtration techniques have the potential to produce
reusable water and remove the dyes completely, but this result in concentrated sludge at the
end of the treatment. It is not suitable for water soluble dyes [2, 13]. Eventually all physical
treatments terminate in sludge or secondary waste generation. Sludge or secondary waste
disposal, cost, and reusability limit these methods.
Different kinds of chemical degradation techniques are under investigation such as advanced
oxidation processes (AOPs), electrochemical destruction, and sodium hypochloride treatment
[13]. Apparently, the most widely investigated AOPs like photo catalytic oxidation using
titanium oxide (TiO2), ozone treatment (with ultra violet or hydrogen peroxide), UV/H2O2
treatment, Fenton and photo-Fenton reaction are evaluated by many researchers for their high
degradation efficiency [22]. However, if these methods are utilised as standalone treatments

10
for decolourisation and mineralisation of coloured textile waste water, the treatment is
considered to be too expensive and will ultimately result in high chemical consumption.
Apart from some AOPs, others maximise secondary waste but the drawbacks of all these
methods is high reagent consumption and treatment cost, while disposal of these secondary
waste is also a big concern in the midst of other anthropogenic wastes [13]. In the case of
ozonation, the half life of the ozone in gaseous state and cost of production confines its use in
large scale [4, 13]. Conversely sodium hypochloride treatment leaves water with increased
chloride content. It is worth to mention that electrochemical destruction cannot be applied in
full scale because of the high power consumption [13]. Among these different processes,
Fenton’s reaction with assistance of light source is considered to be more economical with
solar energy and it is well documented for degradation of dyes. Since most of the textile
manufacturing units are located in tropical regions of Asia, combining this method with a
biological treatment could create a plausible synergy.
1.8.3 Photo-Fenton as post treatment
Fig. 1.4: Proposed photochemical mechanism for mineralisation of anaerobically treated solution through photo-
Fenton reaction. Initial step, starts with Fenton’s reaction and then UV assisted Fenton reaction results in
regeneration of Ferrous (Fe2+
) ions resulting in formation of hydroxyl (OH
.) radical [29].
Fenton reaction is a complex oxidation method, which uses environmentally safe chemicals
like H2O2 and iron. Fenton reaction is first developed by Henry John horstman [38]. Photo-
Fenton is similar oxidation process the only difference is it happens in the presence of solar
or artificial radiation and the rate of pollutant degradation is fast in the presence of radiation
[25]. As depicted above in Fig. 1.4., the reaction mainly involves iron (II) species and
hydrogen peroxide. Under protonated condition hydrogen peroxide disassociates in the
presence of Fe (II) (Ferrous ion) as catalyst, which ends in the formation of reactive hydroxyl
radicals and generation of Fe (III) ions (Ferric ions) by losing an electron. This mechanism is
renowned as classical Fenton reaction. In the presence of UV light, the reaction is more
favourable for recycling of Fe (II) ions that gears up the process again by forming hydroxyl
radicals. Recycling of Fe (II) is understood to be more common under irradiation [12, 22, 23,
31]. In recent years, it has been documented that [Fe(OH)] 2+
is a commonly occurring
species of ferric ions under highly acidic solution. This results in new hydroxyl radicals and
ferrous ion regeneration [23]. It is believed that reactive hydroxyl radicals are involved in non
specific attack of aromatic by-products in the post-treatment. Photochemical oxidation is
investigated as a post treatment throughout this study with reference to Jonstrup et al [17].
There are three main reasons for choosing photo-Fentons reaction as a best match for post
treatment: its simplicity, economical feasibility and safety compared to other methods.
1.9 Combination of biological and photo-chemical treatment
In contrast to recent studies, anaerobic degradation reduces most of the organic content. Also
elimination of organic content in the pre-treatment will reduce the consumption of reagents in

11
the post-treatment (Fig. 1.5) [31]. Photo-Fenton has been reported to achieve very high
decolourisation and mineralisation of the aqueous dye solution [2, 17, 19 22, 23, 31]. Hence
by considering the toxicity and reduction of pollutants; photo-Fenton treatment is a promising
option to treat the by-products formed in anaerobic step (Fig. 1.5). According to the amount
of chemical consumption and economical viability, combination of two processes is always
best to increase the treatment efficiency and balanced pollutant reduction. Hence, inexpensive
biological treatment by anaerobic decolourisation and post treatment by photo-Fenton
reaction is tried to open a new path for mineralisation of pollutants present in textile
industries.
Fig 1.5: Overall treatment strategy to remove azo dye.
12
2. Materials and Methods
2.1 Inoculum
Anaerobic sludge collected from Källby municipal waste water treatment plant in Lund was
used as inoculum in the pre-treatment.
2.2 Chemicals
Remazol Red RR, Remazol Blue RR and Remazol Yellow RR were supplied by a textile
factory located in Tirupur, India. Remazol Red RR was comprised of a mixture of azo dyes.
Remazol Blue RR was a mixture of diazo-vinylsulfone dye stuff and formazan vinyl sulfone-
copper complex dye stuff. Remazol Yellow RR was composed of sulfonated azo reactive dye
stuffs [16]. These dyes were used without further purification. In photo-Fenton reaction:
hydrogen peroxide 30% (w/w, Merck, Germany), iron (II) sulphate heptahydrate (ICN
Biochemicals Inc, USA) were used.
2.2.1 Preparation of anaerobic medium
Glucose (1 g/l) or modified starch (0.465, 0.78, 1.16 and 1.55 g/l) were used as a carbon
source for batch tests. Starch concentration of 0.465 g/l was used for reactor studies.
Anaerobic medium was prepared by adding the carbon source (glucose or starch), 10 ml of
mineral salt solution, 1 ml of trace element solution, 1 ml of ultra trace element solution, 1ml
of vitamin solution and 1.5 ml of cysteine solution. Additionally, 2.6 g/l of sodium hydrogen
carbonate was added as buffering agent. Finally, the medium was diluted to 1 liter by adding
sterile distilled water and pH was adjusted to 7 using 1M sulphuric acid.
Starch solution was prepared by mixing starch in distilled water at a temperature of 150°C for
2 hours. The solution was autoclaved and then the pH was adjusted to 12 with 1M Sodium
hydroxide and allowed to stand overnight.
The mineral salts solution composition (g/l): KH2PO4 (53.5), NH4Cl (30), NaCl (30),
CaCl2.2H2O (11), MgCl2.H2O (10). The trace elements composition (g/l): FeCl2.4H2O (2),
H3BO3 (0.05), ZnCl2 (0.05), CuCl2.2H2O (0.038), MnCl2.2H2O (0.41), (NH4)6MO7O21.4H2O
(0.05), AlCl3.6H2O (0.09), CoCl2.6H2O (0.05), NiSO4.6H2O (0.1), EDTA (0.5). Vitamin
solution composition (mg/l): pyridoxamine (175), nicotinic acid (100), D-pantothenic acid
Ca-salt (100), cyanocobalamin (54), 4-aminobenzoic acid, pyridoxine HCl (101), D-biotin
(20), thioctic acid (50), lipoic acid (50), folic acid (22), riboflavin (49), thiamine. HCl (56).
Ultra trace element composition (mg/l): Na2SeO3.5H2O (130), NaWO4.2H2O (690). Cysteine
stock solution had a cysteine concentration of 23.4 g/l. In order to prevent contamination,
mineral salts solutions were autoclaved and heat labile nutrients were added through 0.2 μm
sterile filter.
2.3 Anaerobic pre-treatment
2.3.1 Anaerobic batch studies
Before scaling up to the reactor studies, anaerobic batch tests were performed to determine
the decolourisation efficiency of the anaerobic treatment with regards to different dyes and a
dye mixture. Batch tests for decolourisation were carried out in serum bottles with a total

13
volume of 120 ml and a working volume of 70 ml. All the bottles were loaded with 70 ml of
anaerobic medium with corresponding dye concentration of 100 mg/l The batch studies were
used to preliminarily determine if Remazol dyes could be decolourised or not. They were
tested in relatively simple and limited conditions and hence vitamins, trace elements and ultra
trace elements were not included in the medium. Each bottle was inoculated with 1.5 ml of
the anaerobic sludge and the anaerobic atmosphere was created by flushing the bottles with
nitrogen gas for 4 minutes to remove oxygen present in the head space. The bottles were
sealed with butyl rubber stoppers and aluminium crimps. The bottles were incubated at room
temperature (22-22°C) in the dark until the decolourisation of the dyes. Two kinds of control
tests were performed, namely abiotic and biotic control.
The abiotic control was composed of dye and anaerobic medium, to determine the
physical decolourisation efficiency in the absence of microbes. Hence it was not
inoculated with anaerobic sludge.
The biotic control was composed of autoclaved anaerobic sludge and dye containing
medium, to determine decolourisation due to adsorption of biomass.
All the controls were incubated in dark and the decolourisation was monitored for 3 days.
Therefore all the batches were run in triplicates.
With the above mentioned preparation, the influence of different conditions on the anaerobic
treatment was evaluated.
Carbon source: first 1 g/l of glucose was used. Then to identify the suitable way of
utilising starch released in desizing step of textile processing and to replace glucose,
anaerobic batch decolourisation was performed using 0.465, 0.78, 1.16 and 1.55 g/l of
starch. Remazol Red RR of 100 mg/l was used in this experiment.
Dyes structures: 100 mg/l of Remazol Red RR, Remazol Blue RR and mixture of
dyes were used in anaerobic batches. Starch at a concentration of 0.465 g/l was used
as carbon source.
Salinity: high concentration of NaCl is one of the important characteristic of textile
waste water. In order to determine the effectiveness of anaerobic decolourisation
against varied saline conditions, batch tests were performed using 0, 5, 10, 20, and 50
g/l of sodium chloride in the medium containing 100 mg/l of Remazol Red RR. Starch
at a concentration of 0.465 g/l was used as carbon source.
Additionally to study the viability of photo-Fenton as post-treatment after the
anaerobic decolourisation, anaerobic batch tests were performed on Remazol Red RR
(100 mg/l) in the anaerobic medium containing no phosphate and no sodium chloride
(phosphate and chloride ions bind with iron ions and hence interfere with the
oxidation process). After six days of run, anaerobically treated solution from batches
were separated from the sludge by centrifugation at 10,000 rpm for 20 minutes and
stored at 4°C for the assessment of photo-Fenton parameters.
2.3.2 Anaerobic bio-film reactors
Two water jacketed anaerobic reactors made of glass were installed to study the
decolourisation of synthetic textile waste water as shown in Fig. 2.3.2. The reactors had a
total volume of 600 ml with a head space of 100 ml. Poraver carriers, made up of recycled
glass were filled inside the reactors to provide support for bio-film formation. The working
volume of reactor-A was 340 ml and of reactor-B 345 ml. To maintain the mesophilic
condition of 37°C, water bath was connected to the water jacket on the reactors. A peristaltic

14
pump was used for medium recirculation in an up flow mode in order to get good mass and
heat transfer. A second peristaltic pump was used for the feeding of the medium. The
anaerobic condition in the medium was maintained by connecting a gas bag filled with
nitrogen gas to the inlet bottle. Two gas bags were connected to the effluent vessels to collect
the gas produced during the anaerobic reactions in the reactor.
After setting up the reactor, 3/4 of reactor volume was inoculated with anaerobic sludge and
allowed for bio-film formation. During the start up of the reactors, the growth of the
anaerobic sludge was supported by feeding in glucose (1 g/l) containing anaerobic medium
for one month. The initial Hydraulic Retention Time (HRT) was 8 days. Once the bio-film
started to form in the Poraver carriers, wash out of cells was reduced. Subsequently the HRT
was adjustted to 6 days. Gradually the anaerobes inside the reactors were acclimatized to
medium containing 0.465 g/l of starch and stable conditions were steadily maintained for one
month. Remazol Red RR of 100 mg/l was introduced into the feed. Dye containing medium
was fed constantly for one month at 6 days HRT to allow acclimatization of the sludge.
The influence of two different conditions on the anaerobic treatment was evaluated
HRT: the decolourisation efficiency at three different HRTs (6, 4 and 2 days) was
studied.
Phosphate content: phosphate concentration was studied. Phosphate added as
macronutrient in the medium would have negative effect on photo-Fenton reaction,
due to precipitation of FePO4. Hence availability of iron would be lower to participate
in photo-Fenton reaction. The amount of phosphate in the medium was first reduced
from 290 m g/l to 36.5 mg/l. HRT of the reactors was 4 days.
When an operating condition was changed, the reactors were allowed to adjust to the new
condition for three HRTs to maintain the stability. COD and absorbance at the wavelength of
maximum absorbance for Remazol Red RR (518 nm) was measured for each HRT after
reaching steady state condition. To monitor the stability of the reactors, pH of the reactors
were measured every day.
In order to combine the anaerobic pre-treatment with photo-Fenton oxidation, the reactor
effluents were collected at the end of each HRT, and the sample was separated from the
biomass by centrifugation at 10,000 rpm for 20 minutes and filtered through 0.44 mm
Whatman micro glass filter with the aid of vacuum pump. The filtered samples were stored at
4°C.

15
Fig. 2.3.2 Anaerobic biofilm reactors set up used for decolourisation of Remazol Red RR.
2.4 Photo-Fenton treatment
The photo-Fenton experiment was used for treatment of both an aqueous dye solution
(Remazol Red RR) and anaerobically pre-treated synthetic textile waste water.
2.4.1 Comparison of Fenton and photo-Fenton
The experiment was conducted on solutions of Remazol Red RR and Remazol Blue RR each
having a concentration of 100 mg/l. The dye solution was acidified to a pH of 3 using H2SO4.
The reaction was carried out in 15 ml glass tubes filled with 10 ml of dye solution. Iron
corresponding to a concentration of 0.25 mM was added to the test tubes and mixed. This was
followed by the addition of hydrogen peroxide in the resulting solution, to a final
concentration of 3 mM. Irradiation was provided by an 18 W UV-Vis blue lamp (Sylvian
reptistar, USA, 30% UVA, 5% UVB) placed 15 cm above the surface of the glass tubes.
Stirring was provided by a rocking table with a speed of 50 runs per minute. A similar set up
was followed for the Fenton reaction but the sample was not irradiated with UV light.
Aqueous dye solution was used as a photolysis control without Fenton reagent. To measure
the extent of decolourisation and mineralisation, samples were withdrawn at a particular time
interval. Additionally, to stop the ongoing reaction, equal amount of sodium sulphite (3.8 g/l)
was added to the withdrawn sample. All the experiments were conducted in triplicate.
The experimental set up described above was used for all photo-Fenton batch experiment.
2.4.2 Optimization of photo-Fenton parameters for post treatment after anaerobic
batches
The experiments were divided into three types:
To check the efficient consumption of reagents and mineralisation of aromatic
structures: stepwise addition of H2O2 was performed in aqueous dye solution. Iron
concentration was fixed constant at 0.25 mM; 1 mM of hydrogen peroxide was set as

16
an initial concentration. Then the concentration of H2O2 was increased by 1 mM for
every 45 minutes until the final concentration of 3 mM was reached. The same photo-
Fenton reagent condition was used for anaerobically treated solution obtained from
batches. Spectrophotometeric analysis was performed at particular time interval for
the comparative studies of photo-Fenton reaction.
Assessment of iron: since iron was known to bind with phosphate, iron was optimised
first before optimising the concentration of hydrogen peroxide. Small amount of
phosphate was always present in the anaerobically treated effluent because of
decaying biomass. The photo-Fenton experiment was conducted using 0, 0.25, 1, 3
and 5 mM of iron and concentration of H2O2 was set at 10 mM.
Assessment of H2O2 concentration: in order to find the efficient reagent usage in
photo-Fenton, step wise addition of hydrogen peroxide was performed by keeping
iron concentration constant at 3 mM. Three different hydrogen peroxide
concentrations were chosen: 3 mM, 5 mM and 10 mM; and the concentration of H2O2
was increased by 3 mM, 5 mM, 10 mM for every 45 minutes for each of these
solutions respectively. Hydrogen peroxide was added until the final concentration of
15 mM was reached in all batches. As control, photo-Fenton experiment was
performed with 15 mM of hydrogen peroxide altogether at the beginning.
All the experiments were run in triplicates and run until a reaction time of 4 hours. Hydrogen
peroxide concentration was monitored at the end of the treatment. COD analyses were
performed before and after each experiment. Absorbance at 267 nm was measured at regular
intervals during the experiments.
2.5 Scaling up of photo-Fenton post-treatment to reactor scale
2.5.1 Assessment of photo-Fenton parameters for reactor effluent after HRT and
phosphate study
Iron ions are renowned to participate in salt formation with phosphate in the effluent.
Phosphate concentrations in the effluent of the reactors were determined as 301 mg/l (Reactor
A) and 272 mg/l (Reactor B). Three different iron concentrations (3, 5 and 7 mM) were
chosen with respect to these phosphate concentrations. A preliminary test was run in 10 ml
glass tubes to determine which iron concentration would be effective for treatment of the
reactor effluent collected from reactor B. Samples were withdrawn for spectrophotometeric
analysis at regular intervals and concentration of H2O2, pH and COD were determined at the
end of the treatment.
For the following photo-Fenton experiment test tubes were replaced by glass beaker of 200
ml filled with 50 ml of acidified reactor effluent from reactor B at 4 days HRT. Beakers were
covered with glass lids to avoid evaporation. Evaluation of Fenton regents were divided into
two stages:
Iron concentration: with respect to phosphate concentration of 272 mg/l in the
effluent, different iron concentration of 1, 3 and 5 mM were selected. Based on the
preliminary photo-Fenton batch tests, 15 mM of hydrogen peroxide was fixed
constant.
H2O2 concentration: 3 different concentrations 10, 15 and 20 mM were considered.
The iron concentration was fixed at 3 mM based on iron assessment experiment.
The effluent collected after phosphate study in anaerobic reactors was used to evaluate the
efficiency of photo-Fenton.

17
Iron concentration: the photo-Fenton treatment was conducted using 1, 3 and 5 mM of
iron and 15mM of H2O2 for all iron concentrations.
H2O2 concentration: 3 different concentrations 10, 15 and 20 mM were selected and
1mM of iron for all H2O2 concentrations.
Sample volume of 2 ml was collected from the reaction vessel at an interval of 2 hours for
COD analysis in order to determine the optimal reaction time. Assessment experiments were
run in duplicates.
2.5.2 Stepwise addition of hydrogen peroxide
Once established that 15 mM of H2O2 was the optimal dose, the possibility of adding it in a
step-wise mode was considered. In fact, this may allow a reduction of the total required
amount of H2O2, or a reduction of the reaction time.
In the experiment iron concentration was set as 3mM and initial hydrogen peroxide
concentration as 5 mM. Then 5 mM of H2O2 was added every 45 minutes until a final
concentration of 15 mM. Hydrogen peroxide dosage was tried in two different additions. The
total reaction time of the photo-Fenton reaction was 4 hours. This experiment was run in
duplicates.
2.6 Analytical methods
Decolourisation was determined by measuring the absorbance at the wavelength of maximum
absorbance in the visible. In particular the absorbance was measured for Remazol Red RR at
518nm, Remazol Blue RR at 603nm and at 527 nm for the mixture of three Remazol dyes
(Remazol Red RR, Remazol Blue RR, Remazol Yellow RR) using Shimadzu UV-Visible
spectrophotometer.
Mineralisation of aromatic amines during photo-Fenton reaction was evaluated by the
reduction of absorbance in the UV range using Pharmacia Biotech Ultraspec 1000
spectrophotometer (Uppsala, Sweden). Scanning was always performed between 200 to
400nm to check the presence of amines at this wavelength. When using anaerobically treated
solutions in photo-Fenton, to stop the reaction, sample volume of 0.25 ml was withdrawn and
quenched with equal amount of sodium sulphite. It was followed by neutralisation of pH
using a drop of 1M NaOH and absorbance at the wavelength of 267 nm was measured. The
resulting samples were centrifuged at 13,000 rpm for 10 minutes and diluted with distilled
water prior to analysis.
COD was measured using Dr Lange test kits (LCK 114, LCI 500, Hach Lange, Germany).
Analysis was done with a LASA 100 type spectrophotometer. COD was expressed in mg/l of
oxygen. 2 ml of sample was used for COD analysis, dilutions were done whenever necessary.
Hydrogen peroxide was monitored during sampling through hydrogen peroxide test strips
(provided by Merck, maximum detection limit - 3 mM) since hydrogen peroxide can
contribute to the measured COD values. Since the interference of hydrogen peroxide was
known to contribute to the measured COD values. So to eliminate the interference, an
equation formulated by Kang et al (Eqt.1) was used. This equation can be applied when the
H2O2 concentrations were lower than 200 mg/l (5.88 mM) [19].
COD (mg/l) = COD measured _ 0.4706 [H2O2] ----------------------------------------------- (1)

18
Phosphate concentrations were estimated in the reactor studies using Dr. Lange test kit (LCK
049, Hach Lange, Germany). 1 ml of sample directly from the reactor was collected and
filtered using 0.2 μm non sterile filters to remove the biomass. 5ml of diluted samples were
used for estimating phosphate content. The same procedure (without filtration) applies for
stored effluent from reactors and Remazol Red RR solution (100 mg/l).
2.7 Formulas used
Percentage of decolourisation was obtained by the following formulae:
Initial absorbance - Final absorbance
Decolourisation (%) = ---------------------------------------------- X 100
Initial absorbance
Percentage of COD reduction was obtained by the following formulae:
Initial COD (mg/l) - Final COD (mg/l)
COD reduction (%) = ---------------------------------------------- X 100
Initial COD (mg/l)
Hydraulic retention time (HRT) is defined as the time taken for the stay of synthetic
waste water in the anaerobic biofilm reactor. It was obtained by
Working volume of the reactor (ml)
HRT (days) = ----------------------------------------------
Measured flow rate (ml/hrs)

19
3 Results
3.1 Anaerobic batch studies (pre-treatment)
Several batch studies were conducted as explained in coming sections, to have an idea about
anaerobic treatment for scaling up to reactor studies spectra of Remazol Blue RR and
Remazol Red RR dyes before and after anaerobic treatment are shown in Fig. 3.1a and b.
a)
b)
Fig. 3.1: UV-Vis scanning images of a) Remazol Blue RR and b) Remazol Red RR before and after anaerobic
decolourisation.
a) Influence of carbon sources
Batch decolourisation tests were performed using 1 g/l of glucose as carbon source which
contributed to a COD of 1006 mg/l. As shown in Fig. 3.2, glucose or any of the media
0.0
0.2
0.4
0.6
0.8
1.0
1.2
1.4
1.6
1.8
200 300 400 500 600 700 800
Ab
sorb
an
ce
wavelength (nm)
before treatment
after treatment
0.0
0.2
0.4
0.6
0.8
1.0
1.2
1.4
1.6
200 300 400 500 600 700 800
Ab
sorb
an
ce
wavelength (nm)
before treatment
after treatment

20
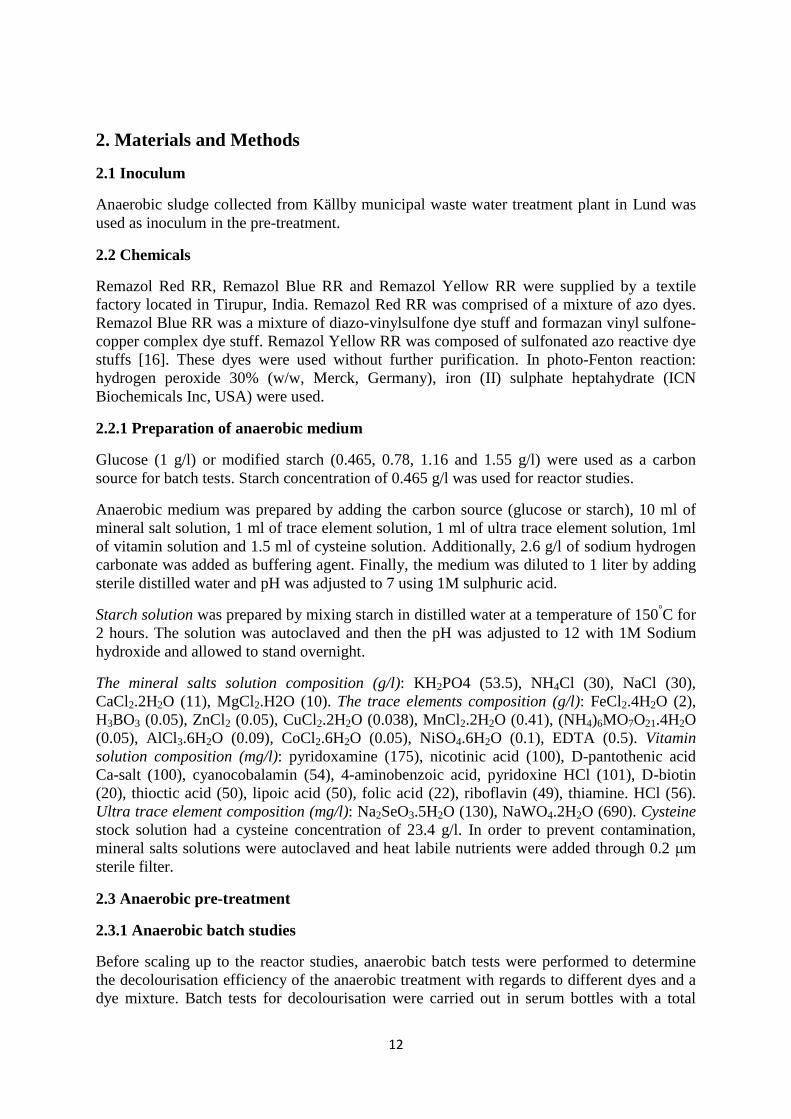
compounds were not involved in physical decolourisation of textile dyes. Decolourisation in
the abiotic controls for Remazol Red RR and Remazol Blue RR were under 10%. Adsorption
of dyes to autoclaved anaerobic sludge was also relatively low, 22% for Remazol Blue RR
and 3% for Remazol Red RR (Fig. 3.2a and b). Both the dyes were efficiently decolourised
by the anaerobic inoculum within 3 days. In particular, 81% decolourisation was achieved for
Remazol Blue RR and 87% for Remazol Red RR without any previous acclimatisation (Fig
3.2a and b).
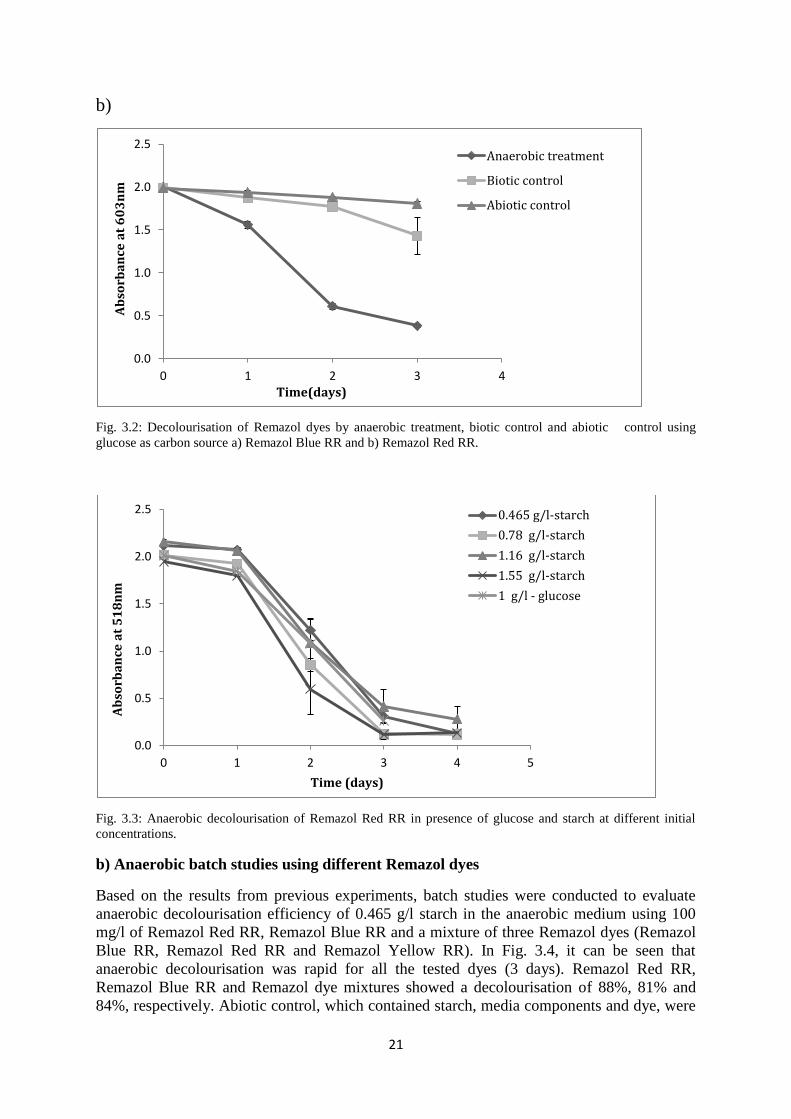
Fig. 3.3 shows that complete decolourisation was achieved at all starch concentrations.
Decolourisation was rapid when using 0.465 g/l of starch as carbon source, together with
media components which contributed to a COD of 598 g/l. Different starch concentration,
0.78, 1.16 and 1.55 g/l which corresponds to COD of 1000, 1500 and 2000 g/l were used.
Effective decolourisation was obtained at all of the starch concentrations within 4 days (Table
4). Anaerobic decolourisation is fast (3 days) with glucose (87%) as well as with different
starch concentrations (Table 4).
Table: 4 COD produced by different starch concentrations and anaerobic decolourisation efficiency produced by
different starch concentrations.
a)
0.0
0.5
1.0
1.5
2.0
2.5
0 1 2 3 4
Ab
sorb
an
ce a
t 5
18
nm
Time (days)
Anaerobic treatment
Biotic control
Abiotic control
Starch (g/l)
COD (mg/l)
Decolourisation (%)
0.465
598
94
0.78
1000
94
1.16
1500
86
1.55
2000
93
21
b)
Fig. 3.2: Decolourisation of Remazol dyes by anaerobic treatment, biotic control and abiotic control using
glucose as carbon source a) Remazol Blue RR and b) Remazol Red RR.
Fig. 3.3: Anaerobic decolourisation of Remazol Red RR in presence of glucose and starch at different initial
concentrations.
b) Anaerobic batch studies using different Remazol dyes
Based on the results from previous experiments, batch studies were conducted to evaluate
anaerobic decolourisation efficiency of 0.465 g/l starch in the anaerobic medium using 100
mg/l of Remazol Red RR, Remazol Blue RR and a mixture of three Remazol dyes (Remazol
Blue RR, Remazol Red RR and Remazol Yellow RR). In Fig. 3.4, it can be seen that
anaerobic decolourisation was rapid for all the tested dyes (3 days). Remazol Red RR,
Remazol Blue RR and Remazol dye mixtures showed a decolourisation of 88%, 81% and
84%, respectively. Abiotic control, which contained starch, media components and dye, were
0.0
0.5
1.0
1.5
2.0
2.5
0 1 2 3 4
Ab
sorb
an
ce a
t 6
03
nm
Time(days)
Anaerobic treatment
Biotic control
Abiotic control
0.0
0.5
1.0
1.5
2.0
2.5
0 1 2 3 4 5
Ab
sorb
an
ce a
t 5
18
nm
Time (days)
0.465 g/l-starch
0.78 g/l-starch
1.16 g/l-starch
1.55 g/l-starch
1 g/l - glucose

22
not participated in adsorption of dyes. Abiotic adsorption control contributed 4, 10 and 2% of
colour removal with Remazol Red RR, Remazol Blue RR and Remazol dye mixtures. From
the results obtained it can be concluded that different dyes have different affinity towards
starch. Remazol Blue showed 10% decolourisation due to adsorption to starch. Adsorption of
biomass did not contribute to the removal of dyes to any higher extent. Maximum reduction
by biomass adsorption of 21% was obtained in the Remazol dye mixture. Remazol Red RR
and Remazol Blue RR showed 8 and 10% colour removal due to adsorption of biomass.
c) Influence of sodium chloride in anaerobic treatment
To study the effects of salt concentration and to mimic real textile effluent from dyeing and
printing steps, different NaCl concentrations of 0, 5, 10, 20 and 50 g/l were added to the
anaerobic medium with starch as a carbon source (0.465 g/l) and Remazol Red RR (100 mg/l)
to evaluate the influence on the anaerobic decolourisation. Decolourisation was monitored
every day. Decolourisation of Remazol Red RR was slow in presence of high salt
concentration. Without acclimatisation to any of the salt concentrations, decolourisation of
95%, 93%, and 93% was obtained for 0, 5 and 10 g/l of NaCl within five days (Fig. 3.5).
a)
0.0
0.5
1.0
1.5
2.0
2.5
0 1 2 3 4
Ab
sorb
an
ce a
t 5
18
nm
Time (days)
Anaerobic treatment
Biotic control
Abiotic control

23
b)
c)
Fig. 3.4: Decolourisation of Remazol dyes and their mixture by anaerobic treatment, biotic control and abiotic
control using starch as carbon source. a) Remazol Blue RR, b) Remazol Red RR and c) Remazol dye mixture
(Remazol Red RR, Remazol Blue RR, and Remazol Yellow RR).
A decolourisation of 91% was obtained in the presence of 20 g/l of NaCl after six days of
incubation. At the concentration of 50 g/l of NaCl, 70% decolourisation was achieved after
eight days. COD was measured before and after the treatment. About 62-68% of COD
reduction was achieved in the presence of 0 to 20 g/l of NaCl (Fig. 3.5b). At the highest salt
concentration, 21% of COD reduction was obtained.
0.0
0.5
1.0
1.5
2.0
2.5
0 1 2 3 4
Ab
sorb
an
ce a
t 3
06
nm
Time(days)
Anaerobic treatment
Biotic control
Abiotic control
0.0
0.2
0.4
0.6
0.8
1.0
1.2
0 1 2 3 4 5
Ab
sorb
an
ce a
t 5
27
nm
Time (days)
Anaerobic treatment
Biotic control
Abiotic control

24
a)
b)
Fig. 3.5: Influence of salinity on the anaerobic treatment of Remazol Red RR a) Decolourisation of Remazol
Red RR in the presence of 0, 5, 10, 20 and 50 g/l of NaCl. b) Total COD reduced before and after anaerobic
treatment.
3.2 Photo-Fenton batch experiments (post-treatment)
a) Comparison of photo-Fenton between aqueous dye solution and anaerobically treated
solution
Photo-Fenton reagents optimised for aqueous dye solution (0.25 mM-Fe2+
; 3 mM-H2O2) (see
appendix: Fig. 8.1a and b) was not enough to achieve degradation of aromatic amines present
in the anaerobically treated solution when NaCl and PO43-
were not added in the medium.
Remazol Red RR contained 27.45 mg/l of PO43-
which is believed to support the growth of
the microbes. However step wise addition of hydrogen peroxide to Remazol Red RR solution
0.0
0.5
1.0
1.5
2.0
2.5
0 2 4 6 8 10
Ab
sorb
an
ce a
t 5
18
nm
Time (days)
0 g/l-NaCl
5 g/l-NaCl
10 g/l-NaCl
20 g/l-NaCl
50 g/l-NaCl
0
200
400
600
800
1,000
1,200
1,400
1,600
1,800
0 5 10 20 50
C O
D (
mg
/l)
NaCl concentration (g/l)
before
after

25
resulted in 95.6 % of absorbance removal at UV region after four hours of reaction. Only
66.7% of total absorbance removal at 267 nm was achieved with anaerobically treated
solution may be because of the presence of phosphate from decaying biomass and high
organic content (Fig. 3.6 a).
b) Optimisation of iron for anaerobically treated dye solution
In all batch tests, anaerobic medium contained 290 mg/l of phosphate. Additionally Remazol
Red RR (100 mg/l) contributed to 27.45 mg/l of phosphate in the medium. Anaerobically
treated solution was collected from anaerobic batches after complete decolourisation and
used for photo-Fenton treatment. The COD of the anaerobically treated solution was 425± 6.
The reason for the high COD is due to high organic content. Hence to determine the optimal
condition four different concentration of iron were used as shown in Fig. 3.6b and apart from
0.25 mM of iron, all iron concentrations contributed to significant COD removal. In
particular, the percentage of COD removal was 65.8, 66.5 and 64.9 when using 1, 3 and 5mM
of iron (data not shown). Absorbance at 267 nm was reduced by 34 % at 0.25 mM, 82 % at 1
mM, 84.5 % at 3 mM and 80% at 5 mM (Fig. 3.6b).
c) Comparison of all-in-one step and stepwise addition of H2O2
From previous screening tests, 3mM of iron was chosen and used in combination with
different hydrogen peroxide initial concentrations. The initial COD of the anaerobically
treated solution was 245±6. As a control to see the difference with step wise addition, large
initial dose of 15mM H2O2 contributed to 61.7% COD removal ( data not shown) and 80%
absorbance reduction (Fig 3.6 c). The COD removal was 63.4% when the H2O2 dosage was
added in 2 step addition (2 steps for every 45 minutes). Absorbance at ultra violet region had
increased to 89% reduction with step wise addition. COD removal efficiency reached 58%
when hydrogen peroxide dosage was increased in 4 steps (3 mM for each 45 minutes)
allowing more time for consumption of hydrogen peroxide. Likewise, 74 % of absorbance
reduction was achieved with 4 step addition (Fig 3.6 c).

26
a)
b)
0.0
0.5
1.0
1.5
2.0
2.5
3.0
3.5
0 30 60 90 120 150 180 210 240 270
Ab
sorb
an
ce a
t 2
67
& 2
90
nm
Time (minutes)
Anaerobically treated solution
Dye solution
0.0
0.2
0.4
0.6
0.8
1.0
1.2
1.4
1.6
1.8
2.0
0 60 120 180 240
Ab
sorb
an
ce a
t 2
67
nm
Time (minutes)
0.25 mM - Fe 2+
1 mM - Fe 2+
3 mM- Fe 2+
5 mM - Fe 2+

27
c)
Fig. 3.6: Reduction of absorbance at 267 nm during photo-Fenton oxidation of the anaerobically treated solution
(batch tests) a) comparison with photo-Fenton oxidation of aqueous Remazol Red RR b) Optimisation of iron
concentration c) Comparison of all-in-one step and stepwise addition of H2O2 for the photo-Fenton treatment
oxidation of anaerobically treated Remazol Red RR.
3.3 Reactor studies: part-I
3.3.1 Influence of different HRTs (anaerobic pre-treatment)
Anaerobic decolourisation of Remazol Red RR was studied in reactor A and B with respect
to different HRTs. Complete decolourisation was achieved in both of the anaerobic biofilm
reactors at all HRTs studied as shown in Fig 3.7a. At a HRT of 6 days, about 98% of the dyes
were decolourised in both of the reactors while the decolourisation was 97% for reactor A
and 96% for reactor B at 4 days HRT. 98% of COD was achieved down to 2 days in both of
the reactors. The colour produced by chromophore of Remazol Red RR at 518 nm was
completely reduced and the peak of absorbance at 290 nm shifted to 267 nm.
Starch (0.465 g/l) contributed to most of the COD in the reactor (598 mg/l) and Remazol Red
RR (100 mg/l) contributed to a COD of 59 mg/l. COD reduction for the whole period in the
reactors is shown in the Fig. 3.7b. When the HRT was at 6 days, reactor A resulted in 62%
and B 64% average COD removal which is due to presence of dye metabolites, partially
degraded starch or other anaerobic products formed during the anaerobic treatment. With
reduction to a HRT of 4 days, the average COD reduction was 59% for reactor A and 65%
for reactor B, while COD removal in reactor A was decreased from 59% to 54% down to a
HRT of 2 days. Reactor B was remained almost same at 64% COD removal. Since the
anaerobic sludge contains a mixture of facultative anaerobes the product of one group would
be the substrate of other groups. Indeed usage of external buffer was not necessary to
maintain the pH of the system. Hence pH is kept as a good alarm for the stability of the
reactor and it was monitored every day. Throughout the HRT studies pH of the reactors was
always in the range of 7.6 – 8 (see appendix: Fig. 8.2a).
0.0
0.5
1.0
1.5
2.0
2.5
3.0
0 60 120 180 240
Ab
sorb
an
ce a
t 2
67
nm
Time(minutes)
15 mM H2O2
5 mM H2O2 - every 45 minutes (2 step addition)
3 mM H2O2 - every 45 minutes (4 step addition)

28
a)
b)
Fig. 3.7: Colour and COD removal during anaerobic treatment of Remazol Red RR in anaerobic biofilm reactors
at HRTs of 6, 4 and 2 days. a) Colour removal and b) COD removal
3.3.2 Assessment of photo-Fenton for reactor effluent after HRT study (post-treatment)
a) Influence of iron concentrations
It was a time consuming method and also not important to post-treat all the effluents
collected during HRT studies. So effluent collected after 4 days HRT was selected. Screening
0
20
40
60
80
100 d
ay
s 1
2
5
6
7
8
11
1
2
13
1
4
17
1
8
1
2
3
4
5
6
7
8
9
10
1
1
12
1
2
3
4
5
6
HRT- 6 days HRT- 4 days HRT- 2 days
De
colo
uri
sati
on
(%
)
Reactor A
Reactor B
0
20
40
60
80
100
HRT-6 days HRT-4 days HRT-2 days
CO
D (
mg
/l)
Reactor A
Reactor B

29
test was conducted to assess the influence of iron (see appendix: Fig. 8.3a and b). Based on
the screening tests using anaerobically treated effluent, 3 and 5 mM of iron concentration
were chosen but 7mM of iron was left because results were not improved further. Therefore,
5mM of iron was selected as a maximum and 1 mM as a minimum concentration. Hydrogen
peroxide concentration was set constant at 15 mM. The initial COD before the anaerobic
treatment was 609 mg/l. Total COD of 65% was removed during anaerobic treatment in the
reactor and 23% of COD was considered to be reduced by free growing biomass in the
effluent container. Hence the COD of the anaerobically treated effluent (reactor B) at the start
of the photo-Fenton reaction was 72-84 mg/l. Aromatic amines and anaerobic by products
remaining in the effluent was responsible for the residual COD in the effluent. With increase
in iron concentration from 3 to 5mM, there was a slight decrease in COD reduction from 96%
to 78 % and absorbance reduction from 87 to 83 % (Fig. 3.8 a and b). Complete degradation
was obtained when 3 mM of iron was used as a catalyst. When the catalyst concentration was
1 mM, degradation did not happen. Higher final COD values were obtained due to
interference of hydrogen peroxide with the COD measurements. To determine the optimal
reaction time, COD was measured with 2 hours interval, and the amount of hydrogen
peroxide in the system was determined using hydrogen peroxide test strips. Interference of
H2O2 with COD measurements was corrected using Kang et al correlation in equation 1 [19].
Hydrogen peroxide was totally consumed after four hours of reaction time (Fig 3.8c). As
shown in Fig. 3.8c, hydrogen peroxide consumption was slower when the iron concentration
was lower i.e. hydroxyl radical production decreased with decreasing iron concentration. In
the presence of high initial hydrogen peroxide dosage (15mM) and low amount of iron (1
mM), the effect of hydrogen peroxide was favoured. The reason for final higher average
COD value (158.5 mg/l) and 36 % absorbance at 267 nm were due to residual hydrogen
peroxide and coagulation during neutralisation of the sample. It was always expected that
more than 3 mM hydrogen peroxide was present in the reaction vessel since strips has a
maximum range of only 3 mM.
a)
0
0.5
1
1.5
2
2.5
3
0 60 120 180 240
Ab
sorb
an
ce a
t 2
69
nm
Time (minutes)
1 mM - Fe 2+
3 mM - Fe 2+
5 mM - Fe2+

30
b)
c)
Fig. 3.8: Assessment of iron concentration for photo-Fenton oxidation of anaerobically treated Remazol Red RR
solution from reactor a) Reduction of absorbance at 267 nm with different iron concentration, b) COD reduction
with different iron concentration, and c) Reduction in hydrogen peroxide concentration with respect to reaction
time.
b) Influence of hydrogen peroxide concentration
Hydrogen peroxide plays an important role in the photo-Fenton since it is the oxidant. Hence
three different concentrations 10, 15 and 20 mM were evaluated for the degradation of
amines and to find the lowest concentration required for the photo-Fenton oxidation. Iron
concentration was set at 3 mM. There was slight decrease in COD reduction efficiency from
95% to 87%, when the concentration of hydrogen peroxide was increased from 15 to 20 mM
but degradation of amines in terms of reduction of absorbance at 267 nm, 87 % for 15 mM
and 84% for 20 mM. When hydrogen peroxide concentration was decreased to 10 mM,
overall 79% of COD and 80% of absorbance was reduced (Fig. 3.9a and b). As shown in Fig.
0
20
40
60
80
100
120
140
160
180
200
0 120 240
CO
D (
mg
/l)
Time (minutes)
1 mM - Fe 2+
3 mM - Fe 2+
5 mM - Fe 2+
0
100
200
300
400
500
600
0 60 120 180 240
Hy
dro
ge
n p
ero
xid
e (
mg
/l)
Time(minutes)
1 mM - Fe2+
3 mM - Fe2+
5 mM - Fe2+

31
3.9c, hydrogen peroxide was effectively consumed with the three selected concentration but
15 mM of hydrogen peroxide achieved the highest COD removal. Higher and lower initial
dose resulted in less efficient absorbance and COD removal.
a)
b)
0.0
0.5
1.0
1.5
2.0
2.5
3.0
0 60 120 180 240
Ab
sorb
an
ce a
t 2
67
nm
Time (minutes)
10mM -H2O2
15mM-H2O2
20mM-H2O2
0
10
20
30
40
50
60
70
80
90
100
0 60 120 180 240
CO
D (
mg
/l)
Time (minutes)
20mM-H2O2
10mM-H2O2
15mM-H202

32
c)
Fig. 3.9: Assessment of hydrogen peroxide for photo-Fenton oxidation of anaerobically treated solution from
reactor a) Reduction of absorbance at 267 nm with different iron concentration, b) COD reduction with different
iron concentration, and c) Reduction in hydrogen peroxide concentration with respect to reaction time.
3.3.3 Stepwise addition of hydrogen peroxide from the selected reagent conditions
In Fig. 3.13a and b it can be seen that a COD removal of 89% and absorbance reduction of
86% were obtained with addition of 5mM H2O2 every 45 minutes till a maximum of 15 mM
H2O2. As shown in Fig. 3.10 c after every addition, the consumption of hydrogen peroxide
was very low with respect to time and consumed effectively. Hence it would be better to add
step wise by allowing enough time for H2O2 to be consumed or else large initial dose would
be better.
a)
0
100
200
300
400
500
600
700
800
0 60 120 180 240
Hy
dro
ge
n p
ero
xid
e (
mg
/l)
Time (minutes)
10 mM - H202
15 mM - H2O2
20 mM - H2O2
0.0
0.5
1.0
1.5
2.0
2.5
3.0
0 60 120 180 240
Ab
sorb
an
ce a
t 2
67
nm
Time(minutes)
5mM H2O2 every 45 minutes(2 step addition)

33
b)
c)
Fig. 3.10: Stepwise addition of hydrogen peroxide from the optimised reagent conditions a) Reduction of
aromatic amines at 267 nm with different step wise additions b) COD reduction in different stepwise additions
c) Reduction in hydrogen peroxide concentration with respect to time.
3.4 Reactor studies: part-II
3.4.1 Phosphate study in anaerobic pre-treatment
High decolourisation of Remazol Red RR (100 mg/l) was achieved in both the reactors with
phosphate concentration of 36.5 mg/l in the anaerobic medium (Fig. 3.11a.). A
decolourisation efficiency of 98% was obtained for reactor A and 95% for B at 4 days HRT.
These results were similar to those obtained when studying the influence of different HRTs
(Fig. 3.11a). Hence, the COD removal was 61% in reactor A and 69% for reactor B. The
COD removal at the end of three HRTs at 4 days is shown in the Fig. 3.11b. A decrease in
0
10
20
30
40
50
60
70
80
90
0 60 120 180 240
CO
D (
mg
/l)
Time (minutes)
5mM H2O2 every 45 minutes
0
20
40
60
80
100
120
140
160
180
0 60 120 180 240
Hy
dro
ge
n p
ero
xid
e (
mg
/l)
Time (minutes)
5 mM H2O2 every 45 minutes

34
phosphate concentration in both of the reactors was expected during every complete cycle of
4 days HRT but increased concentration would be due to release of phosphate from decaying
biomass. Average phosphate content in the reactor A was 141 mg/l and 87 mg/l for B at 4
days HRT (Fig. 3.11 c). It is important to notice that Remazol Red RR (100 mg/l) contained
27.45 mg/l of phosphate. The pH of the reactors did not vary much and it was always in the
range of 7.65-8.2 (See appendix: Fig. 8b).
a)
b)
0
10
20
30
40
50
60
70
80
90
100
da
ys 1
2
3
4
5
6
7
8
9
10
11
12
HRT- 4 days
De
colo
uri
sati
on
(%
)
Reactor A
Reactor B
0
10
20
30
40
50
60
70
80
90
100
CO
D (
mg
/l)
HRT- 4 days
Reactor A
Reactor B

35
c)
Fig. 3.11: Influence of phosphate (36.5 mg/l) on anaerobic biofilm reactors a) Colour removal b) COD removal,
and c) phosphate content in the reactors.
3.5.2 Assessment of photo-Fenton parameters for reactor effluent after phosphate study
a) Influence of iron concentrations
To reduce the amount of catalyst and sludge production, the phosphate content in the
anaerobic medium was reduced from 292 mg/l to 36.5 mg/l to study the efficiency of photo-
Fenton oxidation. The phosphate concentration in the reactor A and B effluent were
determined to be 46.71 and 46.61 mg/l. Hence the evaluated Fenton reagents used in previous
experiments were used to select the optimal usage of Fenton reagents (see section). The effect
of the addition of iron on the mineralisation of aromatic amines has been studied by setting
hydrogen peroxide constantly at 15 mM. The results are shown in Fig. 3.12. The COD
content in the collected effluent (reactor B) was 74-78 mg/l. All of the iron concentrations
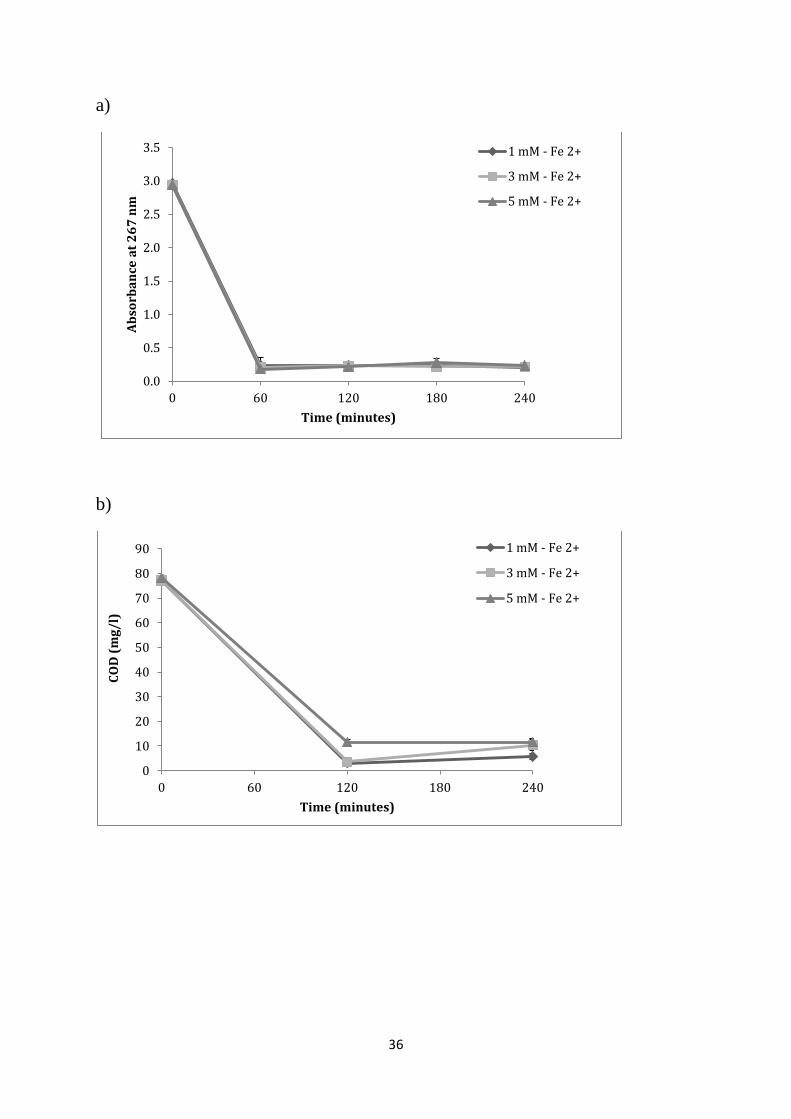
contributed to very high reduction of absorbance at 267 nm. Absorbance reduction was 93 %
for 1 mM and 3 mM and 92 % for 5 mM of iron (Fig. 3.12 a). After four hours reaction time,
build up of sludge was more evident in 3 and 5 mM of iron compared to 1 mM of iron.
Absorbance reduction was relatively high compared to the very high phosphate containing
effluent (Fig. 3.12 a). Hydroxyl radical production was very fast with all tested iron
concentrations (Fig. 3.12 b). Hence, hydrogen peroxide was consumed within 2 hours of
reaction time at all of the iron concentrations.
High COD removal of 93 % at1 mM, 87% at 3 mM and 85% at 5 mM of iron were achieved.
From these data, it can be concluded that efficiency of photo-Fenton oxidation can be
improved by reducing the phosphate level in the biological step.
0
20
40
60
80
100
120
140
160
180
0 1 2 3
Ph
osp
ha
te c
on
ten
t (m
g/
l)
HRT - 4 days
Reactor A
Reactor B
36
a)
b)
0.0
0.5
1.0
1.5
2.0
2.5
3.0
3.5
0 60 120 180 240
Ab
sorb
an
ce a
t 2
67
nm
Time (minutes)
1 mM - Fe 2+
3 mM - Fe 2+
5 mM - Fe 2+
0
10
20
30
40
50
60
70
80
90
0 60 120 180 240
CO
D (
mg
/l)
Time (minutes)
1 mM - Fe 2+
3 mM - Fe 2+
5 mM - Fe 2+

37
c)
Fig. 3.12: Assessment of iron concentration for photo-Fenton oxidation of anaerobically treated Remazol Red
RR solution from reactor after phosphate study a) Reduction of absorbance at 267 nm with different iron
concentration, b) COD reduction with different iron concentration, and c) Reduction of hydrogen peroxide
concentration with respect to reaction time.
b) Influence of hydrogen peroxide concentrations
The assessment of different H2O2 concentration is shown in Fig. 3. 13. 1 mM of iron was
chosen during the assessment of different iron concentrations and set as constant to study the
influence of H2O2 at three different concentrations. At 10, 15 and 20 mM of H2O2 the COD
reduction was 93, 93 and 85% respectively (Fig. 3.13b). Absorbance at 267 nm was reduced
by 92% at 10 mM, 93% at 15 mM and 94% at 20 mM (Fig. 3.13a). Hydrogen peroxide was
effectively consumed within 2 hours of reaction time (Fig. 3.13c).
a)
0
100
200
300
400
500
600
0 60 120 180 240
Hy
dro
ge
n p
ero
xid
e(m
g/
l)
Time (minutes)
1 mM - Fe 2+
3 mM - Fe 2+
5 mM - Fe 2+
0.0
0.5
1.0
1.5
2.0
2.5
3.0
3.5
0 60 120 180 240
Ab
sorb
an
ce a
t 2
67
nm
Time (minutes)
10 mM - H2O2
15 mM - H2O2
20 mM - H2O2

38
b)
c)
Fig. 3.13: Assessment of H2O2 concentration for photo-Fenton oxidation of anaerobically treated Remazol Red
RR solution from reactor after phosphate study a) Reduction of absorbance at 267 nm with different H2O2
concentration, b) COD reduction with different iron concentration, and c) Reduction of hydrogen peroxide
concentration with respect to reaction time.
0
10
20
30
40
50
60
70
80
90
0 60 120 180 240
CO
D (
mg
/l)
Time (minutes)
10 mM - H2O2
15 mM - H2O2
20 mM - H2O2
0
100
200
300
400
500
600
0 60 120 180 240
Hy
dro
ge
n p
ero
xid
e (
mg
/l)
Time (minutes)
10 mM - H2O2
15 mM - H2O2
20 mM - H2O2

39
3.6 Overall degradation of Remazol Red RR
As a result of azo bond cleavage during anaerobic pre-treatment, characterise chromophore
responsible for red colour (518 nm) disappeared and aromatic structures responsible for
absorbance peak (290 nm) at ultra violet region was shifted to new peak (267 nm) (Fig. 3.13,
see also section 3.1). Photo-Fenton post-treatment completely reduced the peak at UV region
by metabolised Remazol Red RR (Fig. 3.14).
Fig. 3.14 UV-visible spectrum of Remazol Red RR before and after combining anaerobic and photo-Fenton
treatment.
0.0
0.2
0.4
0.6
0.8
1.0
1.2
1.4
1.6
1.8
2.0
200 300 400 500 600 700 800
Ab
sorb
an
ce
Wavelength (nm)
Before anaerobic
After anaerobic
After photo-Fenton

40
4 Discussions
Combined anaerobic and photo-Fenton treatment was used for complete degradation of azo
dye. Initially anaerobic batch studies were conducted using two azo dyes (Remazol Red RR,
Remazol Blue RR) and mixture of azo dyes (Remazol Red RR, Remazol Blue RR and
Remazol Yellow RR), all the dyes show complete decolourisation using modified starch
(0.465 g/l). It was time consuming to post-treat all the azo dyes. Therefore, to represent azo
dye, Remazol Red RR was chosen and anaerobically treated Remazol Red RR was studied in
the post-treatment with photo-Fenton oxidation. As a result, almost a maximum level of
degradation was attained. Finally reactor studies were conducted using anaerobic biofilm
reactor with Remazol Red RR and the effluents coming out of the reactors were used for
photo-Fenton oxidation. Complete degradation of Remazol Red RR by using cheap pre-and
post-treatment was fixed as the strategy throughout this investigation.
Batch studies
Anaerobic batch experiments (pre-treatment)
Influence of carbon source
In recent years, almost all the documented anaerobic decolourisation studies were conducted
using glucose [16, 17, 20, 21, 31]. Glucose was considered to be an expensive carbon source
if it is used in full scale application. Hence glucose was used for comparative studies with
different starch concentrations. Starch is present in excess at the end of desizing step [6].
Frijters et al used starch waste from the desizing step as an external carbon source for
anaerobic pre-treatment in pilot scale for waste water coming out of bleaching, scouring and
dyeing processes. So the cost of the carbon source can be reduced by using starch containing
waste water from the desizing step or other industries [8].Anaerobic sludge was efficient in
utilising simple as well as complex carbon sources to carry out decolourisation of azo dyes.
Decolourisation levels in biotic and abiotic controls were not significant for decolourisation
of azo dyes. Similar kind of decolourisation results were obtained by Soriaglu and Bisgin
[21]
Anaerobic batch studies using different Remazol dyes
Even though waste water usually contains various azo dye mixtures, anaerobic
decolourisation was effective with batch experiments containing 100 mg/l of Remazol Red
RR, Remazol Blue RR and mixture of Remazol Red RR, Remazol Blue RR and Remazol
Yellow RR. It has been reported that adsorption of dyes to starch takes place first before
consumption by anaerobic sludge but neither adsorption of biomass or starch contributed to
decolourisation of Remazol dyes [29].
Influence of sodium chloride in anaerobic treatment
Commonly 50-80 g/l of NaCl or Na2SO4 is used in dyeing processes to improve dye fixation
and completion [27]. According to the results with different NaCl concentrations, anaerobic
decolourisation was delayed with increase in salt concentration. It could be predicted that
scaling up to reactor studies could be a real challenge due to long term exposure to high salt
concentration.

41
Photo-Fenton batch experiments (post-treatment)
Comparison of photo-Fenton between aqueous dye solution and anaerobically treated
solution
From the obtained data’s, optimisation of Fenton reagent was needed to an efficient
degradation of anaerobic by-products. It was easy to infer from the results that the optimised
conditions from aqueous dye solution cannot be considered as a good reagent condition for
treating anaerobically reduced dye solution.
Optimisation of iron for anaerobically treated dye solution
Jonstrup et al found that reduction of amines could increase if the optimised conditions of
iron and hydrogen peroxide were employed in photo-Fenton treatment [17]. The datas
obtained in this experiment clearly demonstrate that iron would influence the oxidation
process to be more efficient.
Optimisation of stepwise addition of H2O2 using anerobically treated solution
H2O2 is important for oxidation of aromatic amines formed during anaerobic pre-treatment.
Finding correct concentration of oxidant is an important parameter for photo-Fenton
treatment. Considering obtained results, 2 step additions of H2O2 would be best if the organic
content of the anaerobically treated solution is considerably high. Primo et al found that H2O2
dosing improved the COD removal efficiency of photo-Fenton of landfill leachate with high
organic content [26].
Reactor studies: part-I
Influence of different HRTs (pre-treatment)
COD reduction during different HRT were higher compared to pilot scale sequential
anaerobic-aerobic study conducted by Frijters et al, where they achieved 35-55% COD
removal on anaerobic pre-treatment using starch waste from desizing step [8]. From the
obtained results, we can say that acclimatisation of waste water to anaerobic microbial
community would certainly increase the reduction of organic compounds present in the
textile waste water. Even though the working volume of the reactors was slightly different,
anaerobic treatment was quiet efficient for decolourisation of Remazol Red RR (100 mg/l).
The inner surface of the effluent collection bottles and tubes were occupied by free growing
algae or anaerobic microbes coming out of the reactors. Therefore, during different HRTs, the
effluent coming out of the reactor with remaining nutrients supported the free growing algal
population or anaerobic microbes.
Assessment of photo-Fenton after HRT study (post-treatment)
It is possible to confirm from the results that iron and hydrogen peroxide concentrations are
mandatory parameters to be optimised during the design of the photo-Fenton reaction.
According to post-treatment using photo-Fenton, a hydrogen peroxide concentration of 15
mM was found to be optimal for removal of dye intermediates and an iron concentration of 3
mM was found to be optimal to catalyse photo-Fenton oxidation when the organic content of
the anaerobic effluent is low. Throughout the experiment COD was measured in acidic
condition (pH-3) in order to demonstrate that the COD removal was due to photo-Fenton
reaction. However precipitation is common when pH is changed from acidic to neutral
condition, which makes the formed sludge separate from the treated water. So there is the

42
possibility of a further COD removal after neutralisation of the photo-Fenton treated waste
water if the organic content is high. There was always a background level of absorbance in
the UV range during photo-Fenton reaction which was probably due to the absorptive nature
of Fenton reagents or due to oxidised short chain intermediate products [31]
Stepwise addition of hydrogen peroxide from the selected reagent conditions
According to the obtained results, stepwise addition of H2O2 at different time interval more or
less remains closer to the H2O2 dose added all together at the beginning of 15mM. Therefore,
adding all-together at the beginning would be best if the organic content of the anaerobically
pre-treated synthetic waste water.
Reactor studies: part-II
Phosphate study (anaerobic pre-treatment)
In the present study, colour and COD were effectively removed by anaerobic treatment in the
presence of low phosphate content. Jonstrup et al had found that effect of phosphate content
on the photo-Fenton reaction can be reduced by decreasing the added phosphate as
macronutrient in anaerobic pre-treatment [17].
Assessment of photo-Fenton after phosphate study
Obtained data’s clearly demonstrate that H2O2 level can be lowered from 15 mM to 10 mM
and iron concentration from 3 mM to 1 mM. Based on the hydrogen peroxide consumption
during photo-Fenton, the total reaction time can be shortened from 4 to 2 hours by decreasing
the amount of phosphate from 292 mg/l to 36.5 mg/l.

43
5 Conclusions and Future perspectives
Considering the pre-treatment results at different conditions, it can be concluded that
anaerobic treatment can be efficient to obtain 58 to 69 % of COD reduction and complete
colour removal. To improve the COD reduction, two continuous anaerobic digesters
connected in series could increase the removal of COD from the starch and other organic
compounds. As evidenced during the experiment, free growing algae or anaerobic bacteria in
the outlet are also considered as one of the reasons for low COD in the stored effluent
collected from 4 days HRT during HRT and phosphate study.
At the moment it is not possible to use only biological processes for treatment of textile
effluents. For example, sequential anaerobic and aerobic treatment has been efficiently
employed in some treatment plants, but a physical or chemical post-treatment is suggested to
ensure removal of the residual toxic chemicals [Carla Frijters, interview]. Moreover,
sometimes auto-oxidisable dyes limit the efficiency of sequential processes [34]. Considering
post-treatment options, photo-Fenton is economically feasible if a biological pre-treatment
step is used. The results show that when the total COD was effectively reduced during the
anaerobic pre-treatment step, then the photo-Fenton was effective to remove 95% of the
remaining COD. Efficient COD reduction in the anaerobic treatment is necessary for the
efficiency of the photo-Fenton treatment. If the organic content in the pre-treated effluent is
high, more Fenton reagents will be consumed for the oxidation. Considering the HRT studies,
the anaerobic step contributed to 58-64% total COD removal. Likewise phosphate study data
demonstrated 61-69% of total COD removal. Additionally, the physical biomass removal in
the centrifugation and filtration were responsible for small amount of COD removal in
effluent collected at 4 days during HRT and phosphate study. Overall optimised parameters
for photo-Fenton for effluents containing 4 day HRT increased the overall COD removal
efficiency from 88% to 99% COD removal. Similarly COD removal was increased from 87%
to 99% when the phosphate content in the medium was low (36 .5 mg/l). Obtained results
demonstrate that average final COD of the effluent after combined biological and photo-
Fenton treatment was in the range of 3-5 mg/l. Therefore, toxicity studies should be
conducted before full scale application to ensure that the remaining compounds are non-toxic.
Anaerobic treatment is well established for cleavage of dyes. From an economic point of
view anaerobic pre-treatment would be the most cost effective treatment option. Photo-
Fenton would be a better alternative than the aerobic treatment since it is more efficient for
amine degradation. Reuse of iron after photo-Fenton would make the process more
environmental friendly, since it would reduce the amount of iron ions in the effluent. Toxicity
should also be assessed in the final sludge [32]. The sludge produced would be rich in
nutrients like phosphorous, sulphur and iron etc, so there could be a possibility to use it as
fertilizer if it is not toxic. Toxicity studies should also be conducted to confirm that the final
effluent after the photo-Fenton treatment is less toxic than the initial textile effluent. The
possibility of using solar light instead of artificial UV-light would reduce the electricity cost
significantly. Moreover the investigation should be continued to study the influence of salts
in pre- and post treatment.
All textile producing nations have to progress a strict legislation to limit the release of
pollutants into the environment. Efficient inspection and quick enforcement should be done
to stop the discharge of hazardous wastes into water streams. Most of the textile brands from
high income nations have the responsibility to directly encourage improvement of the
treatment methods and to solve the issues by governing recent developments in textile waste
water treatment. Improved treatment methods would stop the textile pollutants in the water

44
stream. Safer alternatives have to replace currently used azo dyes, dyeing techniques and
auxiliary chemicals. Recently it has been found that two textile companies in China still use
many chemicals that have been banned in Europe. It has been found that these companies are
good partners with world famous brands like Adidas, Nike, Puma, H&M and Lacoste [24].
Thus biological treatment can be successfully employed at the end of the treatment. Proper
regulation and awareness among company workers will improve the chemical release into the
environment.

45
6 References
1. Sharma S, Kalpana, Artic, Shweta, Suryavathi V, Singh K P, Ramesh, Shipra,
Sharma K P, 2007. Toxicity assessment of textile dye waste water using swiss albino
rats. Australian journal of ecotoxicology 13: 81-85
2. Jonstrup M, 2011. Treatment of textile waste waters using combination of biological
and Physico-chemical methods. Ph. D Thesis, Lund University, Lund, Sweden.
3. Christie R M, 2007. Environmental aspects of Textile dyeing. Wood Head Publishing
limited, Cambridge, England. Volume 1. pg.45-46
4. Wallace T H, 2001. Biological Treatment of a synthetic dye water and an industrial
textile wastewater containing Azo dye compounds, Masters Thesis, Virginia
Polytechnic Institute and State University, Blacksburg, Virginia.
5. Singh P, Sanghi R, Pandey A, Iyengar L, 2007. Decolourisation and partial
degradation of monoazo dyes in sequential fixed film anaerobic batch reactor
(SFABR). Bioresource Technology 98: 2053-2054.
6. Carvents J, Dos Santos A B, 2010. Reduction of azo dyes by anaerobic bacteria:
microbiological and biochemical aspects. Review of environmental science and
biotechnology 10: 125-137.
7. Lewis D M, 2004. Dyes, Reactive. Kirk-Othmer Encyclopedia of chemical
technology 9:463-465.
8. Frijters C T M J, Vos R H, Scheffer G, Mulder R, 2006. Decolorizing and detoxifying
textile waste water, containing both soluble and insoluble dyes, in a full scale
combined anaerobic/aerobic systems. Water Research 40: 1249-1257.
9. Vander zee F P, 2002. Anaerobic dye reduction. Ph. D thesis, Waginingen University,
The Netherlands.
10. International Agency of Research and Cancer (IARC), 1990. Exposures in Textile
Manufacturing Industry. IARC Monnographs, 48: 216-220
11. Bisschops I, Spanjers H, 2003. Literature review on textile waste water
charecterisation. Environmental Technology 24: 1399-1411
12. Walling C, 1975. Fenton Reagent Revisited. Accounts of Chemical Research 8:125-
131.
13. http://www.sophied.net/about-colour-industry/water-company/ [sited on 06-01-2012]
14. http://h2o2.com/industrial/fentons-reagent.aspx?pid=143&name=General-Chemistry-
of-Fenton-s-Reagent [sited on 06-01-2012]
15. http://www.statensnet.dk/pligtarkiv/fremvis.pl?vaerkid=4601&reprid=0&filid=44&iar
kiv=1 [sited on 25-01-2012]
16. Jonstrup M, Kumar N, Murto M, Mattiasson B, 2011. Sequential anaerobic-aerobic
treatment of azo dyes: decolurisation and amine degradability. Desalination 280:2-8
17. Jonstrup M, Punzi M, Mattiasson B, 2011. Comparison of anaerobic pre-treatment
and aerobic post-treatment coupled to photo-Fenton oxidation for degradation of azo
dyes. Journal of Photochemistry and Photobiology A: Chemistry 224: 55-61.
18. http://www.paques.nl/pageid=167/Textile_and_Tanneries.html [sited on 01-02-2012]
19. Kang Y W, Cho M J, Hwang KY, 1999. Correction of hydrogen peroxide interference
on standard chemical oxygen demand test. Water research 33:1247-1251.
20. Georgiou D, Metallinou C, Aivasidis A, Voudrias E, Gimouhopoulos K, 2004.
Decolourization of azo-reactive dyes and cotton-textile wastewater using anaerobic
digestion and acetate-consuming bacteria. Biochemical Engineering Journal 19: 75-
79.
21. Sarioglu M, Bisgin T, 2009. Decolourisation of Basic Red 46 (BR46; Azo Dye) and
Methylene Blue (Cationic Dye) Dyes by Anaerobic Sludge: Biotic and Abiotic

46
Process. 11th
International Conference on Environmental Science and Technology,
Chania, Greece.
22. Garcia- Montano J, 2007. Combination of advanced oxidation process and biological
treatment for removal of reactive azo dye groups. Ph.D. Thesis. Universitat autonima
de Barcelona,Barcelona, Spain
23. Papi´c S, Vujevi ´c D, Koprivanac N, Sinko D, 2009. Decolourization and
mineralization of commercial reactive dyes by using homogeneous and heterogeneous
Fenton and UV/Fenton processes. Journal of Hazardous Materials 164: 1137–1145.
24. Greenpeace international, 2011. Dirty laundry: unravelling the corporate connections
to toxic water pollution in China 1: 6-15.
25. Bandala E R, Palaez M A, Garci-Lopez J, Salgado M, Moeller G, 2008.
Photocatalytic decolurisation of synthetic and real textile waste water containing
benzidine based azo dyes. Chemical engineering processing 47: 169-176
26. Primo O, Rivero J M, Ortiz I, 2008. Photo-Fenton processes as an efficient alternative
to the treatment of land fill leachates. Journal of hazardous materials.
27. Ntuli F, Ikhu-Omoregbe D,Kuipa K P, Muzenda E, Belaid M, 2009. Characterization
of effluent from Textile Wet finishing Operations.Proceedings of the world congress
on engineeering and computer science 1: 1-6.
28. Garcia-Montano J, Domenech X, Garcia-Hortal A J, Torrades F, Peral J, 2008. The
testing of several biological and chemical coupled treatments for cibacron Red FN-R
azo dye removal. Journal of hazardous materials 154: 484-490.
29. Manu B, Chaudhari S, 2002. Anaerobic decolourisation of simulated textile waste
water containing azo dyes. Bioresource technology 82: 225-231.
30. Mass R, Chaudhari S, 2005. Adsorption and biological decolurisation of azo dye
Reactive Red 2 in semicontinuous anaerobic reactors. Process biochemistry 40: 699-
705.
31. Marisa P, 2010. Assessment of biological, chemical and combined treatments for
colour removal and COD reduction of azo dyes at lab scale. Masters thesis. Lund
University, Lund.
32. http://www.ecouterre.com/swedish-student-turns-toxic-textile-effluent-into-clean-dye-
free-water/ [sited on 06-03-2012]
33. Cao G M, Sheng M, Niu WF, Fei YL, Li D, 2009. Regeneration and reuse of iron
catalyst for fenton like reaction. Journal of hazardous materials A: Chemistry 172:
1446-1449.
34. Harrelkas F, Paulo A, Alves M M, Khadir L E, Zahraa O, Pond M N, Van der zee F P,
2008. Photocatalytic and anerobic-photocatalytic treatment of textile dyes.
Chemosphere 72: 1816-1822.
35. Alalewi A, Cuiling J, 2010. Over view of some colour removal technologies in the
textile waste water. Bioinformatics and Biomedical Engineering (iCBBE), 2010 4th
International Conference, Chengdu, China.
36. Dos Santos A B, 2005. Reductive decolourisation of dyes by thermophilic anaerobic
granular sludge. Ph. D Thesis, Waginingen University, Waginingen, The Netherlands.
37. http://www.dailymotion.com/video/xeywrz_pollution-in-bangladesh-caused-by-t_tech
[Sited on 29-03-12].
38. http://www.search.com/reference/Fenton’s_reagent [sited on 10-04-2012]

47
7 Acknowledgements
Although my name appears lonely to represent this thesis, I am lifelong thankful to three
most important personalities those who are responsible for successful execution of this
project work.
Professor Bo Mattiasson, thanks for forwarding my interest to Maria. She trusted and
accepted me as project student. . . . During my first visit to the department, she introduced me
her fellow worker of dye remediation group, Marisa Punzi, who followed me throughout this
project. After starting my work, Maria and Marisa handled me with care by helping me to
understand and plan this project better and also assisted me with constructive feedbacks to
improve my scientific abilities. Both of them gave me a positive support and encouragement
continuously to try new things without “saying no”. This is the whole story to connect my
gratitude to those three precious persons in my thesis box.
I would like to thank the whole environmental family and other members (Lovisa, Marika,
Mohseen, Maryam, Emma, Linda, Carla, Malik, Ivo, Valentine, Rosa, Reza, Naresh, Ravi,
Roya, Govind, Nihir, Frans, Zeeshan, Max…) for making me always to smile and to drive out
my shyness.
Last but not least, I am always thankful to my dear friends (Jothikumar, Dinesh Kumar,
Prabhakaran) those who helped me both academically and personally by positively
supporting me.
I would like to thank my family for their endless care and support.
I would like to contribute this work to mouth and mouth less living communities in textile
producing nations who are severely suffered due to textile waste water pollution and also to
my dear grandmother who left this world when i begin to work on this project.
It is like searching for water in the desert if I have missed his friendship, I am always
thankful to Prashanth, who encouraged and supported me in all circumstances.

48
8 Appendix
8.1 Comparison of Fenton and photo-Fenton using aqueous dye solution
a)
b)
0.0
0.5
1.0
1.5
2.0
2.5
3.0
0 60 120 180 240 300
Ab
sorb
an
ce a
t 5
18
nm
Time(Minutes)
Control
Fenton reaction
Photo-Fenton reaction
0.0
0.5
1.0
1.5
2.0
2.5
3.0
3.5
4.0
0 60 120 180 240 300
Ab
sorb
an
ce a
t 2
67
nm
Time (minutes)
Control
Fenton reaction
Photo-Fenton reaction

49
c)
d)
Fig. 8.1: Comparative study of photo-Fenton and Fenton reaction using Remazol dyes. a) Decolourisation of
Remazol Red RR at 518nm, b) Mineralisation of Remazol Red RR at 290 nm, c) Decolourisation of Remazol
Blue RR at 603nm and d) Mineralisation of Remazol Blue RR at 306 nm.
Table 5. Summary of absorbance studies between photo-Fenton and Fenton experiment using Remazol dyes.
Experiment Decolourisation (%) Mineralisation (%)
Fenton 97a, 85
b 89.5
a, 81.5
b
Photo-Fenton 98a, 100
b 94.5
a,90
b
a - Remazol Red RR; b - Remazol Blue RR
0.0
0.5
1.0
1.5
2.0
2.5
0 60 120 180 240 300
Ab
sorb
an
ce a
t 6
03
nm
Time (minutes)
Control
Fenton reaction
Photo-Fenton reaction
0.0
0.5
1.0
1.5
2.0
2.5
0 60 120 180 240 300
Ab
sorb
an
ce a
t 3
06
nm
Time (mInutes)
Control
Fenton reaction
Photo-Fenton reaction

50
8.2 pH of anaerobic biofilm reactors
a)
b)
Fig 8.2: pH of the anaerobic biofilm reactors during different HRTs (a) and phosphate study (b).
6.0
7.0
8.0
9.0
0 5 10 15
pH
Time (days)
HRT- 6 days (Reactor A) HRT- 6 days (Reactor B) HRT- 4 days (Reactor A) HRT- 4 days (Reactor B) HRT- 2 days (Reactor A) HRT- 2 days (Reactor B)
6
7
8
9
0 2 4 6 8 10 12 14
pH
Time(days)
Reactor A
Reactor B

51
8.3 Screening test for photo-Fenton oxidation of anaerobically treated synthetic waste
water
a)
b)
Fig. 8.3: screening test to determine iron concentration for photo-Fenton oxidation of reactor effluent a)
Reduction of absorbance at 267 nm with different iron concentration b) Total COD before and after treatment.
0.0
0.5
1.0
1.5
2.0
2.5
3.0
0 30 60 90 120 150 180 210 240
Ab
sorb
an
ce a
t 2
67
nm
Time (hours)
3mM of Fe2+
5mM of Fe2+
7mM of Fe2+
0
10
20
30
40
50
60
70
80
3mM 5mM 7mM
CO
D (
mg
/l)
Iron concentration
Initial
Final