combination of feature extraction methods for svm pedestrian … · parra alonso etal.: combination...
TRANSCRIPT

292 IEEE TRANSACTIONS ON INTELLIGENT TRANSPORTATION SYSTEMS, VOL. 8, NO. 2, JUNE 2007
Combination of Feature Extraction Methodsfor SVM Pedestrian Detection
Ignacio Parra Alonso, David Fernández Llorca, Miguel Ángel Sotelo, Member, IEEE,Luis M. Bergasa, Associate Member, IEEE, Pedro Revenga de Toro, Jesús Nuevo,
Manuel Ocaña, and Miguel Ángel García Garrido
Abstract—This paper describes a comprehensive combinationof feature extraction methods for vision-based pedestrian detec-tion in Intelligent Transportation Systems. The basic componentsof pedestrians are first located in the image and then combinedwith a support-vector-machine-based classifier. This poses theproblem of pedestrian detection in real cluttered road images.Candidate pedestrians are located using a subtractive clusteringattention mechanism based on stereo vision. A components-basedlearning approach is proposed in order to better deal with pedes-trian variability, illumination conditions, partial occlusions, androtations. Extensive comparisons have been carried out using dif-ferent feature extraction methods as a key to image understandingin real traffic conditions. A database containing thousands ofpedestrian samples extracted from real traffic images has beencreated for learning purposes at either daytime or nighttime. Theresults achieved to date show interesting conclusions that suggesta combination of feature extraction methods as an essential cluefor enhanced detection performance.
Index Terms—Features combination, pedestrian detection,stereo vision, subtractive clustering, support vector machine(SVM) classifier.
I. INTRODUCTION
THIS PAPER describes a comprehensive combination offeature extraction methods for vision-based pedestrian
detection in Intelligent Transportation Systems (ITS). Vision-based pedestrian detection is a challenging problem in realtraffic scenarios since pedestrian detection must perform ro-bustly under variable illumination conditions, variable rotatedpositions and pose, and even if some of the pedestrian parts orlimbs are partially occluded. An additional difficulty is givenby the fact that the camera is installed on a fast-moving vehicle.
Manuscript received February 20, 2006; revised July 12, 2006, October 3,2006, and December 11, 2006. This work was supported in part by theSpanish Ministry of Education and Science under Grants DPI2002-04064-C05-04 and DPI2005-07980-C03-02 and in part by the Spanish Ministry ofPublic Works under Grant FOM2002-002. The Associate Editor for this paperwas N. Papanikolopoulos.
The authors are with the Department of Electronics, Escuela PolitécnicaSuperior, University of Alcalá, Madrid 28801, Spain (e-mail: [email protected]; [email protected]; [email protected]; [email protected];[email protected]; [email protected]; [email protected];[email protected]).
Color versions of one or more of the figures in this paper are available onlineat http://ieeexplore.ieee.org.
Digital Object Identifier 10.1109/TITS.2007.894194
As a consequence of this, the background is no longer static,and pedestrians significantly vary in scale. This makes theproblem of pedestrian detection for ITS quite different from thatof detecting and tracking people in the context of surveillanceapplications, where the cameras are fixed and the backgroundis stationary.
To ease the pedestrian recognition task in vision-based sys-tems, a candidate selection mechanism is normally applied.The selection of candidates can be implemented by performingan object segmentation in either a 3-D scene or a 2-D imageplane. Not many authors have tackled the problem of monocularpedestrian recognition [1]–[3]. The advantages of the monocu-lar solution are well known. It constitutes a cheap solution thatmakes mass production a viable option for car manufacturers.Monocular systems are less demanding from the computationalpoint of view and ease the calibration maintenance process. Onthe contrary, the main problem with candidate selection mecha-nisms in monocular systems is that, on average, they are boundto yield a large amount of candidates per frame in order toensure a low false negative ratio (i.e., the number of pedestriansthat are not selected by the attention mechanism). Anotherproblem in monocular systems is the fact that depth cues are lostunless some constraints are applied, such as the flat terrain as-sumption, which is not always applicable. These problems canbe easily overcome by using stereo vision systems, althoughother problems arise such as the need to maintain calibrationand the high computational cost required to implement densealgorithms.
In this paper, we present a full solution for pedestrian detec-tion at daytime, which is also applicable, although constrained,to nighttime driving. Other systems already exist for pedestriandetection using infrared images [4]–[6] and infrared stereo [7].Nighttime detection is usually carried out using infrared cam-eras as long as they provide better visibility at night and underadverse weather conditions. However, the use of infrared cam-eras is quite an expensive option that makes mass production anuntraceable problem nowadays, especially for the case of stereovision systems where two cameras are needed. They provideimages that strongly depend on both weather conditions and theseason of the year. Additionally, infrared cameras (consideredas a monocular system) do not provide depth information andneed periodic recalibration (normally once a year). In prin-ciple, the algorithm described in this paper has been testedusing cameras in the visible spectrum. Nonetheless, as soonas the technology for night-vision camera production becomes
1524-9050/$25.00 © 2007 IEEE

PARRA ALONSO et al.: COMBINATION OF FEATURE EXTRACTION METHODS FOR SVM PEDESTRIAN DETECTION 293
cheaper, the results could easily be extended to a stereo night-vision system.
Concerning the various approaches proposed in the literature,most of them are based on shape analysis. Some authorsuse feature-based techniques, such as recognition by verticallinear features, symmetry, and human templates [2], [8], Haarwavelet representation [9], [10], hierarchical shape templateson Chamfer distance [3], [11], correlation with probabilistichuman templates [12], sparse Gabor filters and support vectormachines (SVMs) [13], graph kernels [14], motion analysis[15], [16], and principal component analysis [17]. Neural-network-based classifiers [18] and convolutional neural net-works [19] are also considered by some authors. In [4], aninteresting discussion is presented about the use of binary orgray-level images as well as the use of the so-called hotspotsin infrared images versus the use of the whole candidate regioncontaining both the human body and the road. Using single ormultiple classifiers is another topic of study. As experimentallydemonstrated in this paper and supported by other authors [1],[4], [20], the option of multiple classifiers is definitely needed.Another crucial factor, which is not well documented in theliterature, is the effect of pedestrian bounding box accuracy.Candidate selection mechanisms tend to produce pedestriancandidates that are not exactly similar to the pedestrian ex-amples that were used for training in the sense that onlinecandidates extracted by the attention mechanism may containsome part of the ground or may cut the pedestrians’ feet,arms, or heads. This results in significant differences betweencandidates and examples. As a consequence, a decrease inDetection Rate (DR) takes place. The use of multiple classifierscan also provide a means to cope with day and nighttime scenes,variable pose, and nonentire pedestrians (when they are veryclose to the cameras). In sum, a single classifier cannot beexpected to robustly deal with the whole classification problem.
In the last years, SVMs have been widely used by manyresearchers [1], [9], [10], [20], [21] as they provide a supervisedlearning approach for object recognition as well as a separationbetween two classes of objects. This is particularly useful forthe case of pedestrian recognition. Combinations of shape andmotion are used as an alternative to improve the classifierrobustness [1], [22]. Some authors have demonstrated that therecognition of pedestrians by components is more effective thanthe recognition of the entire body [10], [21]. In our approach,the basic components of pedestrians are first located in theimage and then combined with an SVM-based classifier. Thepedestrian searching space is reduced in an intelligent mannerto increase the performance of the detection module. Accord-ingly, road lane markings are detected and used as the mainguidelines that drive the pedestrian searching process. The areacontained by the limits of the lanes determines the zone of thereal 3-D scene from which pedestrians are searched. In the casewhere no lane markings are detected, a basic area of interest isused instead of covering the front part ahead of the ego-vehicle.A description of the lane marking detection system is providedin [23]. The authors have also developed lane tracking systemsfor unmarked roads [24], [25] in the past. Nonetheless, a keyproblem is to find out the most discriminating features in orderto significantly represent pedestrians. For this purpose, several
feature extraction methods have been implemented, compared,and combined. While a large amount of effort in the literatureis dedicated to developing more powerful learning machines,the choice of the most appropriate features for pedestriancharacterization remains a challenging problem nowadays tosuch an extent that it is still uncertain how the human brainperforms pedestrian recognition using visual information. Anextensive study of feature extraction methods is therefore aworthwhile topic for a more comprehensive approach to imageunderstanding.
The rest of the paper is organized as follows: Section IIprovides a description of the candidate selection mecha-nism. Section III describes the component-based approach andthe optimal combination of feature extraction methods. InSection IV, the SVM-based pedestrian classification system ispresented. In Section V, the multiframe validation and track-ing system is described. The implementation and compara-tive results achieved to date are presented and discussed inSection VI. Finally, Section VII summarizes the conclusionsand future work.
II. CANDIDATE SELECTION
An efficient candidate selection mechanism is a crucialfactor in the global performance of the pedestrian detectionsystem. The candidate selection method must assure that nomisdetection occurs. Candidates, which are usually describedby a bounding box in the image plane, must be detectedas precisely as possible since the detection accuracy has aremarkable effect on the performance of the recognition stage,as demonstrated in Section VI. In order to extract informationfrom the 3-D scene, most authors use disparity map techniques[18] as well as segmentation based on v-disparity [20], [26].The use of disparity-based techniques is likely to yield usefulresults in open roadways. However, depth disparity clues areunlikely to be useful for segmenting out pedestrians in citytraffic due to the heavy disparity clutter. We disregarded thisoption because of the disadvantages associated with disparitycomputation algorithms, since the image pair has to be rectifiedprior to the disparity map generation to ensure good corre-spondence matching. In addition, the computation of accuratedisparity maps requires fine grain texture images in order toavoid noise generation. Otherwise, disparity-based methodsare prone to produce many outliers that affect the segmentationprocess. Concerning the v-disparity image, the informationfor performing generic obstacles detection is defined with avertical line. This implies managing very little information todetect obstacles, which may work well for big object detection,such as vehicles [26], but might not be enough for small thinobject detection, such as pedestrians. Conversely, we proposea candidate selection method based on the direct computationof the 3-D coordinates of relevant points in the scene. Accord-ingly, a nondense 3-D geometrical representation is createdand used for candidate segmentation purposes. This kind ofrepresentation allows for robust object segmentation wheneverthe number of relevant points in the image is high enough. Amajor advantage is that outliers can be easily filtered out in 3-Dspace, which makes the method less sensitive to noise.

294 IEEE TRANSACTIONS ON INTELLIGENT TRANSPORTATION SYSTEMS, VOL. 8, NO. 2, JUNE 2007
Fig. 1. (Left) Two-dimensional points overlayed on left image. (Right) Three-dimensional coordinates of detected pixels.
A. Three-Dimensional Computation of Relevant Points
The 3-D representation of relevant points in the scene iscomputed in two stages. In the first stage, the intensities ofthe left and right images are normalized, and the radial andtangential distortions are compensated for. Relevant points inthe image are extracted using a well-known Canny algorithmwith adaptive thresholds. Features such as heads, arms, andlegs are distinguishable, when visible, and are not heavilyaffected by different colors or clothes. In the second stage, a 3-Dmap is created after solving the correspondence problem. Thematching computational cost is further reduced in two ways.First, the matching searching area is greatly decreased by usingthe parameters of the fundamental matrix. Second, pixels in theright image are considered for matching only if they are alsorelevant points. Otherwise, they are discarded, and correlationsare not computed for that pixel. Computation time is abruptlydecreased while maintaining similar detection results. Amongthe wide spectrum of matching techniques that can be usedto solve the correspondence problem, we implemented theZero Mean Normalized Cross Correlation [27] because of itsrobustness. The Normalized Cross Correlation between twoimage windows can be computed as follows:
ZMNCC(p, p′) =
n∑i=−n
n∑j=−n
A ·B√n∑
i=−n
n∑j=−n
A2n∑
i=−n
n∑j=−n
B2
(1)
where A and B are defined by
A =(I(x + i, y + j) − I(x, y)
)(2)
B =(I ′(x′ + i, y′ + j) − I ′(x′, y′)
)(3)
where I(x, y) is the intensity level of pixel with coordinates(x, y), and I(x, y) is the average intensity of a (2n + 1) ×(2n + 1) window centered around that point. As the windowsize decreases, the discriminatory power of the area-based
criterion is decreased, and some local maxima appear in thesearching regions. An increase in the window size causes theperformance to degrade due to occlusion regions and smoothingof disparity values across boundaries. According to the previousstatements, a filtering criterion is needed in order to provideoutlier rejection. First, a selection of 3-D points within thepedestrian searching area is carried out. Second, road surfacepoints as well as high points (points with a Y coordinate above2 m) are removed. Finally, an XZ map (bird’s eye view of the3-D scene) is filtered following a neighborhood criterion. Asdepicted in Fig. 1, the appearance of pedestrians in 3-D spaceis represented by a uniformly distributed set of points.
B. Subtractive Clustering
Data clustering techniques are related to the partitioning ofa data set into several groups in such a way that the similaritywithin a group is larger than that among groups. Normally, thenumber of clusters is known beforehand. This is the case ofK-means-based algorithms. In this paper, the number of clustersis considered unknown since no a priori estimate about thenumber of pedestrians in scene can be reasonably made. Theeffects of outliers have to be reduced or completely removed,being necessary to define specific space characteristics in orderto group different pedestrians in the scene. For these reasons,a Subtractive Clustering method [28] is proposed, which is awell-known approach in the field of Fuzzy Model IdentificationSystems. Clustering is carried out in 3-D space based on adensity measure of data points. The idea is to find high-densityregions in 3-D space. Objects in the 3-D space are roughlymodeled by means of Gaussian functions. It implies that, inprinciple, each Gaussian distribution represents a single objectin 3-D space. Nonetheless, objects that get too close to eachother can be modeled by the system as a single one and, thus,represented by a single Gaussian distribution. The completerepresentation is the addition of all Gaussian distributions foundin the 3-D reconstructed scene. Accordingly, the parameters ofthe Gaussian functions are adapted by the clustering algorithmto best represent the 3-D coordinates of the detected pixels. The3-D coordinates of all detected pixels are then considered ascandidate cluster centers. Thus, each point pi with coordinates

PARRA ALONSO et al.: COMBINATION OF FEATURE EXTRACTION METHODS FOR SVM PEDESTRIAN DETECTION 295
(xi, yi, zi) is potentially a cluster center whose 3-D spatialdistribution Di is given by the following equation:
Di =N∑
j=1
exp
(− (xi − xj)2(
rax
2
)2 − (yi − yj)2( ray
2
)2 − (zi − zj)2(raz
2
)2)
(4)
where N represents the number of 3-D points contained in aneighborhood defined by radii rax, ray , and raz . Cluster shapecan then be tuned by properly selecting the parameters rax, ray ,and raz . As can be observed, candidates pi surrounded by alarge number of points within the defined neighborhood willexhibit a high value of Di. Points located at a distance wellabove the radius defined by (rax, ray · raz) will have almostno influence over the value of Di. Equation (4) is computedfor all 3-D points measured by the stereovision algorithm. Letpcl = (xcl, ycl, zcl) represent the point exhibiting the maximumdensity denoted by Dcl. This point is selected as the clustercenter at the current iteration of the algorithm. The densitiesof all points Di are corrected based on pcl and Dcl. For thispurpose, the subtraction represented as
Di =Di −Dcl exp
(− (xi − zj)2(
rbx
2
)2 − (yi − yj)2( rby
2
)2 − (zi − zj)2(rbz
2
)2)
(5)
is computed for all points, where the parameters (rbx, rby, rbz)define the neighborhood where the correction of point densi-ties will have the largest influence. Normally, the parameters(rbx, rby, rbz) are larger than (rax, ray, raz) in order to preventclosely spaced cluster centers. Typically, rbx = 1.5 rax, rby =1.5 ray , and rbz = 1.5 raz . In this paper, these parameters havebeen set to rax = raz = 1 m, ray = 1.5 m, rbx = rbz = 1.5 m,and rby = 2.25 m. After the subtraction process, the densitycorresponding to the cluster center pcl gets strongly decreased.Similarly, densities corresponding to points in the neighbor-hood of pcl also get decreased by an amount that is a functionof the distance to pcl. All these points are associated with thefirst cluster computed by the algorithm, which is representedby its center pcl, and will have almost no effect in the next stepof the subtractive clustering. After the correction of densities,a new cluster center pcl,new is selected, which corresponds tothe new density maximum Dcl,new, and the process is repeatedwhenever the condition expressed as
if Urel >Dcl
Dcl,newDcl,new > Umin ⇒ new cluster (6)
is met, where Urel and Umin are experimentally tuned parame-ters that permit the establishment of a termination conditionbased on the relation between the previous cluster densityand the new one, as well as a minimum value of the densityfunction. In this paper, this parameter has been set to Umin =40. The process is repeated until the termination condition givenby (6) is not met. After applying subtractive clustering to a set
of input data, each cluster finally represents a candidate. Thealgorithm can be summarized as follows.
1) The parameters (rax, ray, raz) and (rbx, rby, rbz) areinitialized.
2) The densities of all points are computed using (4).3) The point pcl that exhibits the highest density value Dcl
is selected as a cluster center.4) Densities are corrected according to (5).5) A new maximum density Dcl,new is computed.6) If the condition given by (6) is met, a new cluster is
considered, which is represented by its center pcl,new, andthe algorithm is resumed from Point 4. Otherwise, thealgorithm is stopped.
Pedestrian candidates are then considered as the 2-D regionof interest (ROI) defined by the projection in the image plane ofthe 3-D candidate regions. The number of candidates is boundto change depending on traffic conditions, since some carscan be considered as candidates by the subtractive clusteringalgorithm.
C. Multicandidate (MC) Generation
In practice, a multiple candidate selection strategy has beenimplemented. The purpose is to produce several candidatesaround each selected cluster in an attempt to compensate forthe effect of the candidate bounding box accuracy in the recog-nition step. Accordingly, several candidates are generated foreach candidate cluster by slightly shifting the original candidatebounding box in the u and v axes in the image plane. The candi-date selection method yields generic obstacles with a 3-D shapethat is similar to that of pedestrians. The 2-D candidates are thenproduced by projecting the 3-D points over the left image andcomputing their bounding box. Two bounding box limits aredefined, i.e., for the maximum and minimum values of widthand height, respectively, taking into account people taller than2 m or shorter than 1 m. The 3-D candidate position is givenby the stereo-based candidate selection approach (subtractiveclustering), which provides the 3-D cluster center coordinates.Nonetheless, the 2-D bounding box corresponding to a 3-Dcandidate might not perfectly match the candidate appearancein the image plane due to several effects: body parts that arepartially occluded or camouflaged with the background, 3-Dobjects that have been subtracted together with a pedestrian(for example, pedestrians beside traffic signals, trees, cars, etc.),low contrast pedestrians represented by a low number of 3-Dpoints, etc. These badly bounded pedestrians will be classifiedas nonpedestrians if the positive samples used to train theclassifier are well fitted. Let us note that this problem alsoappears with 2-D candidate selection mechanisms [1] with theadditional drawback of losing the actual pedestrian depth.
Two strategies are proposed to solve the “bounding accuracyeffect.” The first one consists of training the classifier withadditional badly fitted pedestrians in an attempt to absorb eitherthe extra information due to large bounding boxes containingpart of the background or the loss of information due to smallbounding boxes in which part of the pedestrian is not visible. Inother words, the positive samples yielded by the candidate se-lection method are included in the training set. For that purpose,
296 IEEE TRANSACTIONS ON INTELLIGENT TRANSPORTATION SYSTEMS, VOL. 8, NO. 2, JUNE 2007
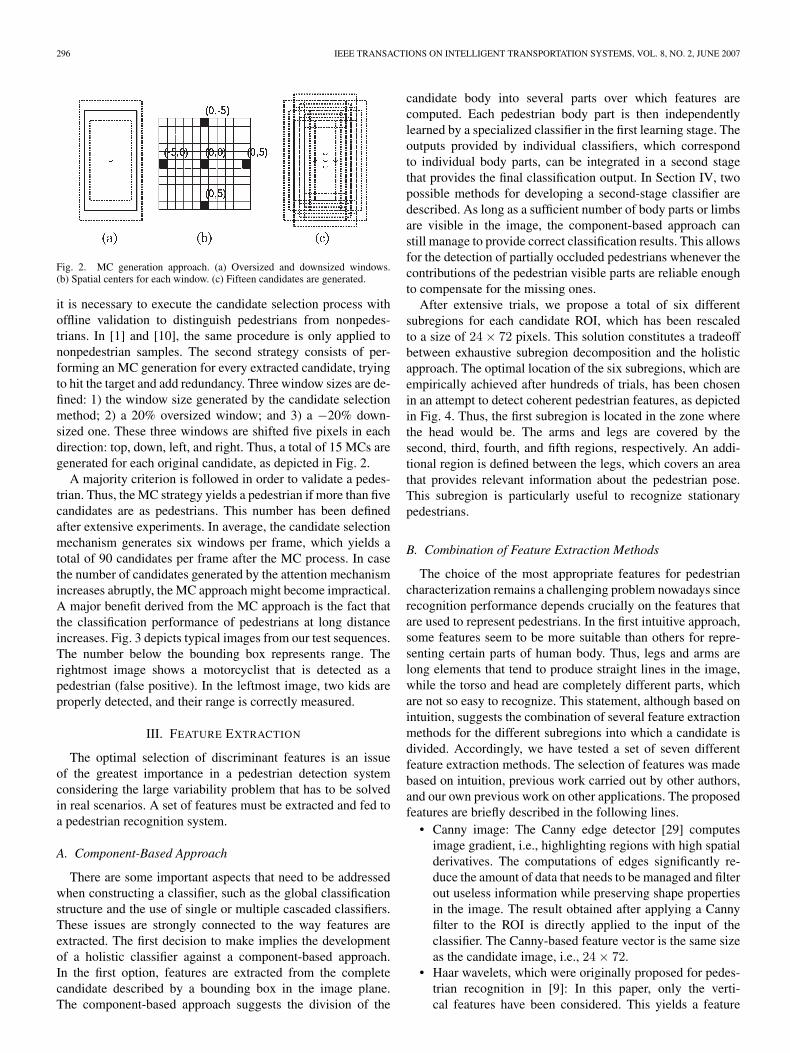
Fig. 2. MC generation approach. (a) Oversized and downsized windows.(b) Spatial centers for each window. (c) Fifteen candidates are generated.
it is necessary to execute the candidate selection process withoffline validation to distinguish pedestrians from nonpedes-trians. In [1] and [10], the same procedure is only applied tononpedestrian samples. The second strategy consists of per-forming an MC generation for every extracted candidate, tryingto hit the target and add redundancy. Three window sizes are de-fined: 1) the window size generated by the candidate selectionmethod; 2) a 20% oversized window; and 3) a −20% down-sized one. These three windows are shifted five pixels in eachdirection: top, down, left, and right. Thus, a total of 15 MCs aregenerated for each original candidate, as depicted in Fig. 2.
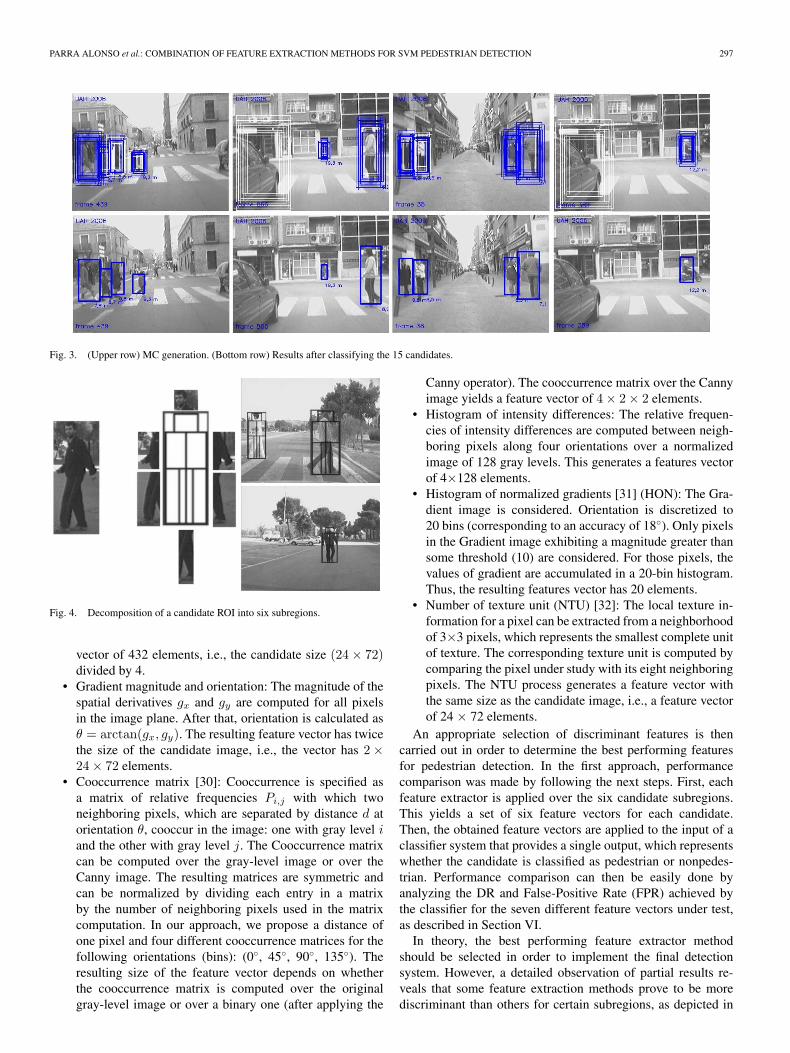
A majority criterion is followed in order to validate a pedes-trian. Thus, the MC strategy yields a pedestrian if more than fivecandidates are as pedestrians. This number has been definedafter extensive experiments. In average, the candidate selectionmechanism generates six windows per frame, which yields atotal of 90 candidates per frame after the MC process. In casethe number of candidates generated by the attention mechanismincreases abruptly, the MC approach might become impractical.A major benefit derived from the MC approach is the fact thatthe classification performance of pedestrians at long distanceincreases. Fig. 3 depicts typical images from our test sequences.The number below the bounding box represents range. Therightmost image shows a motorcyclist that is detected as apedestrian (false positive). In the leftmost image, two kids areproperly detected, and their range is correctly measured.
III. FEATURE EXTRACTION
The optimal selection of discriminant features is an issueof the greatest importance in a pedestrian detection systemconsidering the large variability problem that has to be solvedin real scenarios. A set of features must be extracted and fed toa pedestrian recognition system.
A. Component-Based Approach
There are some important aspects that need to be addressedwhen constructing a classifier, such as the global classificationstructure and the use of single or multiple cascaded classifiers.These issues are strongly connected to the way features areextracted. The first decision to make implies the developmentof a holistic classifier against a component-based approach.In the first option, features are extracted from the completecandidate described by a bounding box in the image plane.The component-based approach suggests the division of the
candidate body into several parts over which features arecomputed. Each pedestrian body part is then independentlylearned by a specialized classifier in the first learning stage. Theoutputs provided by individual classifiers, which correspondto individual body parts, can be integrated in a second stagethat provides the final classification output. In Section IV, twopossible methods for developing a second-stage classifier aredescribed. As long as a sufficient number of body parts or limbsare visible in the image, the component-based approach canstill manage to provide correct classification results. This allowsfor the detection of partially occluded pedestrians whenever thecontributions of the pedestrian visible parts are reliable enoughto compensate for the missing ones.
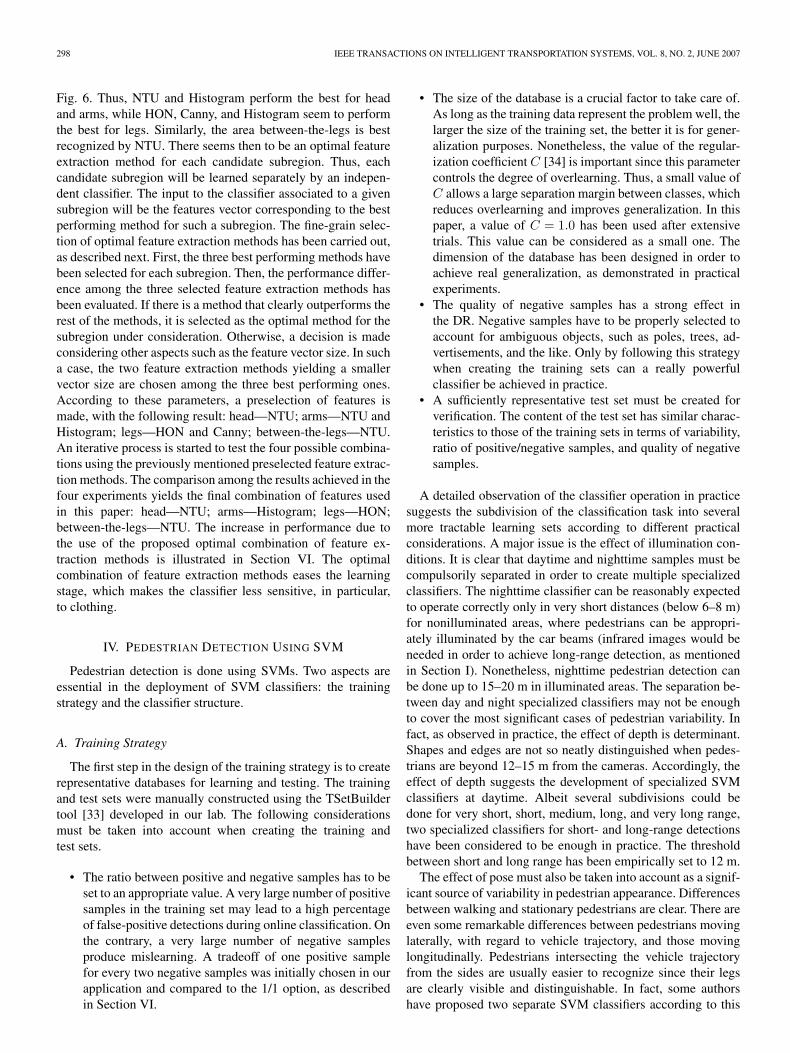
After extensive trials, we propose a total of six differentsubregions for each candidate ROI, which has been rescaledto a size of 24 × 72 pixels. This solution constitutes a tradeoffbetween exhaustive subregion decomposition and the holisticapproach. The optimal location of the six subregions, which areempirically achieved after hundreds of trials, has been chosenin an attempt to detect coherent pedestrian features, as depictedin Fig. 4. Thus, the first subregion is located in the zone wherethe head would be. The arms and legs are covered by thesecond, third, fourth, and fifth regions, respectively. An addi-tional region is defined between the legs, which covers an areathat provides relevant information about the pedestrian pose.This subregion is particularly useful to recognize stationarypedestrians.
B. Combination of Feature Extraction Methods
The choice of the most appropriate features for pedestriancharacterization remains a challenging problem nowadays sincerecognition performance depends crucially on the features thatare used to represent pedestrians. In the first intuitive approach,some features seem to be more suitable than others for repre-senting certain parts of human body. Thus, legs and arms arelong elements that tend to produce straight lines in the image,while the torso and head are completely different parts, whichare not so easy to recognize. This statement, although based onintuition, suggests the combination of several feature extractionmethods for the different subregions into which a candidate isdivided. Accordingly, we have tested a set of seven differentfeature extraction methods. The selection of features was madebased on intuition, previous work carried out by other authors,and our own previous work on other applications. The proposedfeatures are briefly described in the following lines.
• Canny image: The Canny edge detector [29] computesimage gradient, i.e., highlighting regions with high spatialderivatives. The computations of edges significantly re-duce the amount of data that needs to be managed and filterout useless information while preserving shape propertiesin the image. The result obtained after applying a Cannyfilter to the ROI is directly applied to the input of theclassifier. The Canny-based feature vector is the same sizeas the candidate image, i.e., 24 × 72.
• Haar wavelets, which were originally proposed for pedes-trian recognition in [9]: In this paper, only the verti-cal features have been considered. This yields a feature
PARRA ALONSO et al.: COMBINATION OF FEATURE EXTRACTION METHODS FOR SVM PEDESTRIAN DETECTION 297
Fig. 3. (Upper row) MC generation. (Bottom row) Results after classifying the 15 candidates.
Fig. 4. Decomposition of a candidate ROI into six subregions.
vector of 432 elements, i.e., the candidate size (24 × 72)divided by 4.
• Gradient magnitude and orientation: The magnitude of thespatial derivatives gx and gy are computed for all pixelsin the image plane. After that, orientation is calculated asθ = arctan(gx, gy). The resulting feature vector has twicethe size of the candidate image, i.e., the vector has 2 ×24 × 72 elements.
• Cooccurrence matrix [30]: Cooccurrence is specified asa matrix of relative frequencies Pi,j with which twoneighboring pixels, which are separated by distance d atorientation θ, cooccur in the image: one with gray level iand the other with gray level j. The Cooccurrence matrixcan be computed over the gray-level image or over theCanny image. The resulting matrices are symmetric andcan be normalized by dividing each entry in a matrixby the number of neighboring pixels used in the matrixcomputation. In our approach, we propose a distance ofone pixel and four different cooccurrence matrices for thefollowing orientations (bins): (0◦, 45◦, 90◦, 135◦). Theresulting size of the feature vector depends on whetherthe cooccurrence matrix is computed over the originalgray-level image or over a binary one (after applying the
Canny operator). The cooccurrence matrix over the Cannyimage yields a feature vector of 4 × 2 × 2 elements.
• Histogram of intensity differences: The relative frequen-cies of intensity differences are computed between neigh-boring pixels along four orientations over a normalizedimage of 128 gray levels. This generates a features vectorof 4×128 elements.
• Histogram of normalized gradients [31] (HON): The Gra-dient image is considered. Orientation is discretized to20 bins (corresponding to an accuracy of 18◦). Only pixelsin the Gradient image exhibiting a magnitude greater thansome threshold (10) are considered. For those pixels, thevalues of gradient are accumulated in a 20-bin histogram.Thus, the resulting features vector has 20 elements.
• Number of texture unit (NTU) [32]: The local texture in-formation for a pixel can be extracted from a neighborhoodof 3×3 pixels, which represents the smallest complete unitof texture. The corresponding texture unit is computed bycomparing the pixel under study with its eight neighboringpixels. The NTU process generates a feature vector withthe same size as the candidate image, i.e., a feature vectorof 24 × 72 elements.
An appropriate selection of discriminant features is thencarried out in order to determine the best performing featuresfor pedestrian detection. In the first approach, performancecomparison was made by following the next steps. First, eachfeature extractor is applied over the six candidate subregions.This yields a set of six feature vectors for each candidate.Then, the obtained feature vectors are applied to the input of aclassifier system that provides a single output, which representswhether the candidate is classified as pedestrian or nonpedes-trian. Performance comparison can then be easily done byanalyzing the DR and False-Positive Rate (FPR) achieved bythe classifier for the seven different feature vectors under test,as described in Section VI.
In theory, the best performing feature extractor methodshould be selected in order to implement the final detectionsystem. However, a detailed observation of partial results re-veals that some feature extraction methods prove to be morediscriminant than others for certain subregions, as depicted in
298 IEEE TRANSACTIONS ON INTELLIGENT TRANSPORTATION SYSTEMS, VOL. 8, NO. 2, JUNE 2007
Fig. 6. Thus, NTU and Histogram perform the best for headand arms, while HON, Canny, and Histogram seem to performthe best for legs. Similarly, the area between-the-legs is bestrecognized by NTU. There seems then to be an optimal featureextraction method for each candidate subregion. Thus, eachcandidate subregion will be learned separately by an indepen-dent classifier. The input to the classifier associated to a givensubregion will be the features vector corresponding to the bestperforming method for such a subregion. The fine-grain selec-tion of optimal feature extraction methods has been carried out,as described next. First, the three best performing methods havebeen selected for each subregion. Then, the performance differ-ence among the three selected feature extraction methods hasbeen evaluated. If there is a method that clearly outperforms therest of the methods, it is selected as the optimal method for thesubregion under consideration. Otherwise, a decision is madeconsidering other aspects such as the feature vector size. In sucha case, the two feature extraction methods yielding a smallervector size are chosen among the three best performing ones.According to these parameters, a preselection of features ismade, with the following result: head—NTU; arms—NTU andHistogram; legs—HON and Canny; between-the-legs—NTU.An iterative process is started to test the four possible combina-tions using the previously mentioned preselected feature extrac-tion methods. The comparison among the results achieved in thefour experiments yields the final combination of features usedin this paper: head—NTU; arms—Histogram; legs—HON;between-the-legs—NTU. The increase in performance due tothe use of the proposed optimal combination of feature ex-traction methods is illustrated in Section VI. The optimalcombination of feature extraction methods eases the learningstage, which makes the classifier less sensitive, in particular,to clothing.
IV. PEDESTRIAN DETECTION USING SVM
Pedestrian detection is done using SVMs. Two aspects areessential in the deployment of SVM classifiers: the trainingstrategy and the classifier structure.
A. Training Strategy
The first step in the design of the training strategy is to createrepresentative databases for learning and testing. The trainingand test sets were manually constructed using the TSetBuildertool [33] developed in our lab. The following considerationsmust be taken into account when creating the training andtest sets.
• The ratio between positive and negative samples has to beset to an appropriate value. A very large number of positivesamples in the training set may lead to a high percentageof false-positive detections during online classification. Onthe contrary, a very large number of negative samplesproduce mislearning. A tradeoff of one positive samplefor every two negative samples was initially chosen in ourapplication and compared to the 1/1 option, as describedin Section VI.
• The size of the database is a crucial factor to take care of.As long as the training data represent the problem well, thelarger the size of the training set, the better it is for gener-alization purposes. Nonetheless, the value of the regular-ization coefficient C [34] is important since this parametercontrols the degree of overlearning. Thus, a small value ofC allows a large separation margin between classes, whichreduces overlearning and improves generalization. In thispaper, a value of C = 1.0 has been used after extensivetrials. This value can be considered as a small one. Thedimension of the database has been designed in order toachieve real generalization, as demonstrated in practicalexperiments.
• The quality of negative samples has a strong effect inthe DR. Negative samples have to be properly selected toaccount for ambiguous objects, such as poles, trees, ad-vertisements, and the like. Only by following this strategywhen creating the training sets can a really powerfulclassifier be achieved in practice.
• A sufficiently representative test set must be created forverification. The content of the test set has similar charac-teristics to those of the training sets in terms of variability,ratio of positive/negative samples, and quality of negativesamples.
A detailed observation of the classifier operation in practicesuggests the subdivision of the classification task into severalmore tractable learning sets according to different practicalconsiderations. A major issue is the effect of illumination con-ditions. It is clear that daytime and nighttime samples must becompulsorily separated in order to create multiple specializedclassifiers. The nighttime classifier can be reasonably expectedto operate correctly only in very short distances (below 6–8 m)for nonilluminated areas, where pedestrians can be appropri-ately illuminated by the car beams (infrared images would beneeded in order to achieve long-range detection, as mentionedin Section I). Nonetheless, nighttime pedestrian detection canbe done up to 15–20 m in illuminated areas. The separation be-tween day and night specialized classifiers may not be enoughto cover the most significant cases of pedestrian variability. Infact, as observed in practice, the effect of depth is determinant.Shapes and edges are not so neatly distinguished when pedes-trians are beyond 12–15 m from the cameras. Accordingly, theeffect of depth suggests the development of specialized SVMclassifiers at daytime. Albeit several subdivisions could bedone for very short, short, medium, long, and very long range,two specialized classifiers for short- and long-range detectionshave been considered to be enough in practice. The thresholdbetween short and long range has been empirically set to 12 m.
The effect of pose must also be taken into account as a signif-icant source of variability in pedestrian appearance. Differencesbetween walking and stationary pedestrians are clear. There areeven some remarkable differences between pedestrians movinglaterally, with regard to vehicle trajectory, and those movinglongitudinally. Pedestrians intersecting the vehicle trajectoryfrom the sides are usually easier to recognize since their legsare clearly visible and distinguishable. In fact, some authorshave proposed two separate SVM classifiers according to this
PARRA ALONSO et al.: COMBINATION OF FEATURE EXTRACTION METHODS FOR SVM PEDESTRIAN DETECTION 299
statement [20]. A more complicated case occurs when a pedes-trian crouches or bends down. Changes due to different clothingalso contribute to further complexity in the variability problem.Thus, large skirts and coats make pedestrians look very dif-ferent from those in trousers and suits. Likewise, pedestriansbringing trolleys or bags make the recognition problem evenmore difficult. Had it not been enough, the pedestrians’ legs arenot always visible in the image, especially when pedestriansare very close to the vehicle. This is a critical case of greatimportance for precrash protection systems.
In order to handle all these variability cases, we have createdseparate training sets intended to perform pedestrian learningin short and long range at daytime and nighttime, respectively.Four training sets were built for this purpose, which contain anumber of negative samples that double the number of posi-tive ones: a training set of 9000 daytime long-range samples(denoted by DL), a training set with 15 000 daytime short-range samples (denoted by DS), a third training set containing6000 nighttime samples (denoted by N), and a global trainingset containing the concatenation of all samples in DL andDS (denoted by G, 24 000 samples). Similarly, four test setswere created and denoted by test set for daytime short range(TDS, 5505 samples), test set for daytime long range (TDL,4320 samples), test set for nighttime (TN, 3225 samples), andglobal test set composed by the concatenation of TDS and TDL(TG, 9825 samples), respectively. In order to test the effect ofthe positive/negative ratio in the training process, the originaltraining sets were modified to contain the same number ofpositive and negative samples. Accordingly, the modified setshave a size that is two thirds the size of the original sets, as longas half of the negative samples were removed while the positiveones remained untouched. Variability due to pose, clothing,and other artifacts is handled by creating adequate trainingdatabases containing as many representative cases as possible.In this stage, pedestrians in different poses (standing, walking,ducked, etc.) and clothing (coats, skirts, etc.) are included inthe database as well as pedestrians with handbags and otherartifacts. In total, the training sets contain up to 30 000 samples,while the test sets amount up to 13 050 samples.
B. Classifier Structure
A two-stage classifier is proposed in order to cope with thecomponents-based approach. In the first stage of the classifier,features computed over each individual fixed subregion arefed to the input of individual SVM classifiers. Thus, thereare six individual SVM classifiers corresponding to the sixcandidate subregions. These individual classifiers are special-ized in recognizing separate body parts corresponding to theprespecified candidate subregions. It must be clearly stated thatno matching of parts is carried out. Instead, each individualSVM is fed with features computed over its correspondingcandidate subregion and provides an output that indicateswhether the analyzed subregion corresponds to a pedestrianpart (+1, in theory) or not (−1, in theory). In the second stageof the classifier, the outputs provided by the six individualSVMs are combined. Two different methods have been testedto carry out this operation. The first method implements what
we denote as simple-distance criterion. A simple addition iscomputed as
Sdistance-based =6∑
i=1
Si (7)
where Si represents the real output of the SVM classifier (notstrictly contained in the ideal range [−1, +1]) that correspondsto subregion i. In theory, subregions corresponding to non-pedestrians or missing parts should contribute with negativevalues to Sdistance-based. Likewise, subregions correspondingto pedestrian parts should contribute with positive values tothe final sum. A threshold value T is then established in orderto perform candidate classification. This threshold is parame-terized for producing the Receiver Operating Characteristic(ROC). The difference between pedestrians and nonpedestriansis set depending on the distance between T and Sdistance-based.Thus, if Sdistance-based is greater than T , the candidate isconsidered to be pedestrian. Otherwise, it is regarded as non-pedestrian. This simple mechanism is what we denote asdistance-based criterion.
The second method that has been tested to implement thesecond stage of the classifier relies on the use of anotherSVM classifier. A second-stage SVM merges the outputs ofthe six individual first-stage SVM classifiers and provides asingle output representing the candidate classification result.The resulting global structure is denoted as two-stage SVMclassifier. Obviously, the second-stage SVM classifier has to betrained with supervised data. The training set for the second-stage SVM classifier has been built as follows. First, the sixindividual first-stage SVM classifiers are properly trained usingtraining set DS (which contains 15 000 samples) in whichthe desired outputs (pedestrian or nonpedestrian) are set in asupervised way. Then, a new training set is created by taking asinputs the outputs produced by the six already trained first-stageSVM classifiers (in theory, between −1 and +1) after applyingthe 15 000 samples contained in DS and taking as outputs thesupervised outputs of DS. The test set for the second-stageSVM classifier is created in a similar way using test set TDS(containing 5505 samples).
Additionally, an optimal kernel selection for the SVMclassifiers has been performed. For this purpose, we used asmall training set of 2000 samples for which the well-knownGaussian (Radial Basis Function), sigmoid, polynomial, andlinear kernels [34] were tested. The Gaussian kernel was finallychosen as the optimal one after the trials.
V. MULTIFRAME VALIDATION AND TRACKING
Once candidates are validated by the SVM classifier, a track-ing stage takes place. Pedestrian tracking is needed to filterdetection results and minimize the effect of both false-positiveand false-negative detections. For this purpose, detection resultsare temporally accumulated. The multiframe validation andtracking algorithm relies on Kalman filter theory to providespatial estimates of detected pedestrians and Bayesian probabil-ity to provide an estimate of pedestrian detection certainty over

300 IEEE TRANSACTIONS ON INTELLIGENT TRANSPORTATION SYSTEMS, VOL. 8, NO. 2, JUNE 2007
time. Spatial estimates of the detected pedestrians are given bya linear Kalman filter. Tracking is done in 3-D space. The statevector is composed of five elements, which contain the 3-Dpedestrian position (X,Y,Z) (indeed, the position of the masscenter) and the pedestrian width W and height H . Thus, x =(X,Y,Z,W,H)T . The 3-D relative velocity between the carand the target pedestrian vR = (vRx, vRy, vRz) is consideredin the state transition matrix A together with the samplingrate of the complete algorithm ∆t for predicting x−
k . Relativevelocity is computed as a function of the 3-D relative distance(∆x,∆y,∆z) between the ego-vehicle and the target pedestrianin two consecutive frames. Each newly detected pedestrian istracked by an individual Kalman filter. Multiframe validationis needed to endow the tracking system with robustness. Theuse of Bayesian probability is proposed to provide estimatesof pedestrian detection certainty over time. In other words, asort of low-pass filter has been designed based on Bayesianprobability. The process is divided in two stages: pretrackingand tracking. Newly detected pedestrians enter the pretrackingstage. Only after consolidation in the pretracking stage do theystart to be tracked by the system. The process followed inthe pretracking stage after detecting a pedestrian candidate isdescribed next.
1) The 3-D position of the newly detected pedestrian is com-pared to the 3-D position of all pedestrians that are beingtracked by the system at time k. The system maintainsa list of tracked pedestrians. The candidate pedestrianis validated using Probabilistic Data Association. Theidea is to provide matching between newly detected can-didates and already existing pedestrians under tracking.For that purpose, the detected pedestrian is associatedwith the closest already existing pedestrian following theEuclidean distance criterion. Association with the closestpedestrian is done whenever the condition established as
pda(s−i,k,mj,k
)= e−
(s−i,k
mj,k
)22σ2 > 0.7 (8)
is met, where s−i,k represents the 3-D predicted position ofthe closest pedestrian i (the first three elements of vectorx−
i,k), mj,k is the 3-D position of the measured candidatej (the first three elements of vector zj,k), and σ2 is thecovariance of the Gaussian distribution representing thepredicted position of the target pedestrian (the followingassumption has been made: σx = σy = σz = σ). Onlycandidates meeting (8) are validated by the system andenter the pretracking stage. Otherwise, the candidate isconsidered to be a new pedestrian appearing in the scene.
2) If the candidate is considered to be a new pedestrian, it isannotated in the tracked pedestrian list as a new elementdenoted by j, and its probability of being a pedestrian isinitialized according to the classification value given bythe SVM classifier at frame k (Sdistance-based,j,k), i.e.,
P (jk) =
1.0, if 0.5 + Dj,k > 1.00.0, if 0.5 + Dj,k < 0.00.5 + Dj,k, otherwise
(9)
where Dj,k = Sdistance-based,j,k − T . The value ofP (jk) is saturated to be limited between 0.0 and 1.0.After that, the position of the new pedestrian is initializedas xj,k = zj,k, and pretracking is activated.
A pedestrian entering the pretracking stage must be validatedin several iterations before entering the tracking stage. Thealgorithm followed to implement pedestrian validation duringpretracking is described in the following.
1) Let s−j,k represent the predicted position of the prevali-dated pedestrian j at frame k, and let mj,k represent theassociated measure at frame k after performing Proba-bilistic Data Association. The probability of precandidatej to be considered as pedestrian at frame k, denoted byP (jk), is given by
P (jk) =P (jk/jk−1)P (jk−1)
=Cn · f(Dj,k)pda(s−j,k,mj,k)P (jk−1) (10)
where Cn is a normalizing factor.2) The precandidate is validated as a pedestrian when its
probability is above 0.8 during three consecutive itera-tions. Once a precandidate is validated, pretracking stops,and tracking starts.
3) Pretracking is stopped if the precandidate probability isbelow 0.5 during three consecutive iterations.
The same condition applies during tracking, i.e., trackinga pedestrian stops if its probability is below 0.5 during threeconsecutive iterations. The implementation of the multiframevalidation and tracking algorithm described in this section per-mits the achievement of a compromise between robustness innew pedestrian detections and accuracy in pedestrian tracking.
VI. EXPERIMENTAL RESULTS
The system was implemented on a Pentium IV PC at2.4 GHz running the Knoppix GNU/Linux Operating Systemand Libsvm libraries [35]. Using 320 × 240 pixel images, thecomplete algorithm runs at an average rate of 20 frames/s,depending on the number of pedestrians being tracked andtheir position. The average rate has a strong dependency onthe number of pixels being matched because of the correlationof computational cost, which consumes, on average, 80% ofthe whole processing time. The candidate selection system hasproved to be robust in various illumination conditions, differentscenes, and distances up to 25 m. The quality of the classifi-cation system is mainly measured by means of the DR/falsepositive ratio (DR/FPR). These two indicators are graphicallybounded together in an ROC.
We created several training and test sets containing thou-sands of positive and negative samples (pedestrians and non-pedestrians, respectively) in different situations, as describedin Section IV-A. In order to evaluate the influence of thepositive/negative ratio in the training process, two differenttypes of training sets were created. In the first type, the numberof nonpedestrian samples was chosen to be twice the number of
PARRA ALONSO et al.: COMBINATION OF FEATURE EXTRACTION METHODS FOR SVM PEDESTRIAN DETECTION 301
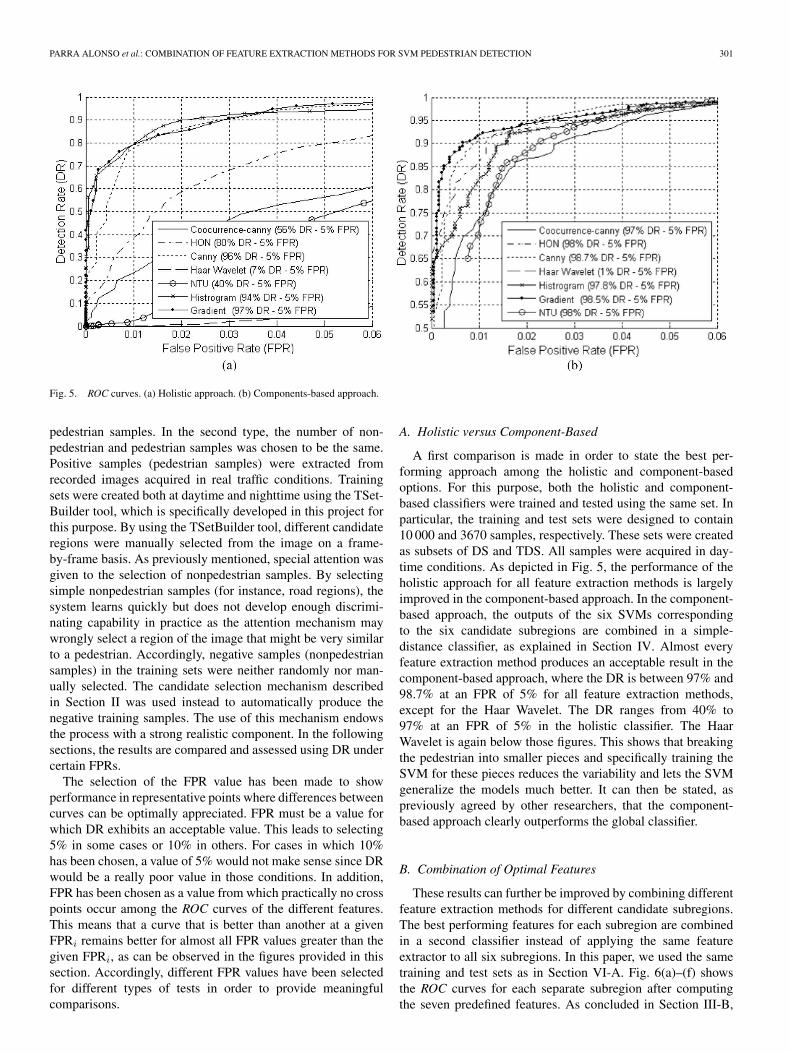
Fig. 5. ROC curves. (a) Holistic approach. (b) Components-based approach.
pedestrian samples. In the second type, the number of non-pedestrian and pedestrian samples was chosen to be the same.Positive samples (pedestrian samples) were extracted fromrecorded images acquired in real traffic conditions. Trainingsets were created both at daytime and nighttime using the TSet-Builder tool, which is specifically developed in this project forthis purpose. By using the TSetBuilder tool, different candidateregions were manually selected from the image on a frame-by-frame basis. As previously mentioned, special attention wasgiven to the selection of nonpedestrian samples. By selectingsimple nonpedestrian samples (for instance, road regions), thesystem learns quickly but does not develop enough discrimi-nating capability in practice as the attention mechanism maywrongly select a region of the image that might be very similarto a pedestrian. Accordingly, negative samples (nonpedestriansamples) in the training sets were neither randomly nor man-ually selected. The candidate selection mechanism describedin Section II was used instead to automatically produce thenegative training samples. The use of this mechanism endowsthe process with a strong realistic component. In the followingsections, the results are compared and assessed using DR undercertain FPRs.
The selection of the FPR value has been made to showperformance in representative points where differences betweencurves can be optimally appreciated. FPR must be a value forwhich DR exhibits an acceptable value. This leads to selecting5% in some cases or 10% in others. For cases in which 10%has been chosen, a value of 5% would not make sense since DRwould be a really poor value in those conditions. In addition,FPR has been chosen as a value from which practically no crosspoints occur among the ROC curves of the different features.This means that a curve that is better than another at a givenFPRi remains better for almost all FPR values greater than thegiven FPRi, as can be observed in the figures provided in thissection. Accordingly, different FPR values have been selectedfor different types of tests in order to provide meaningfulcomparisons.
A. Holistic versus Component-Based
A first comparison is made in order to state the best per-forming approach among the holistic and component-basedoptions. For this purpose, both the holistic and component-based classifiers were trained and tested using the same set. Inparticular, the training and test sets were designed to contain10 000 and 3670 samples, respectively. These sets were createdas subsets of DS and TDS. All samples were acquired in day-time conditions. As depicted in Fig. 5, the performance of theholistic approach for all feature extraction methods is largelyimproved in the component-based approach. In the component-based approach, the outputs of the six SVMs correspondingto the six candidate subregions are combined in a simple-distance classifier, as explained in Section IV. Almost everyfeature extraction method produces an acceptable result in thecomponent-based approach, where the DR is between 97% and98.7% at an FPR of 5% for all feature extraction methods,except for the Haar Wavelet. The DR ranges from 40% to97% at an FPR of 5% in the holistic classifier. The HaarWavelet is again below those figures. This shows that breakingthe pedestrian into smaller pieces and specifically training theSVM for these pieces reduces the variability and lets the SVMgeneralize the models much better. It can then be stated, aspreviously agreed by other researchers, that the component-based approach clearly outperforms the global classifier.
B. Combination of Optimal Features
These results can further be improved by combining differentfeature extraction methods for different candidate subregions.The best performing features for each subregion are combinedin a second classifier instead of applying the same featureextractor to all six subregions. In this paper, we used the sametraining and test sets as in Section VI-A. Fig. 6(a)–(f) showsthe ROC curves for each separate subregion after computingthe seven predefined features. As concluded in Section III-B,

302 IEEE TRANSACTIONS ON INTELLIGENT TRANSPORTATION SYSTEMS, VOL. 8, NO. 2, JUNE 2007
Fig. 6. ROC curves. (a) Head. (b) Left arm. (c) Right arm. (d) Left leg. (e) Right leg. (f) Between-the-legs.
Fig. 7. ROC curves. (a) Comparison between features combination and Canny’s extractor. (b) Comparison between simple-distance classifier andtwo-stage SVM.
the selection of optimal features for each subregion is carriedout as follows: head—NTU, arms—Histogram, legs—HON,between-the-legs—NTU. The combined use of optimal featuresleads to a clear increase in the overall classifier performancewith regard to individual feature extractors, as depicted in
Fig. 7(a), where a DR of 99.1% is achieved for an FPR of 2%.These results improve the performance of Canny’s detector,which is the best performing feature extractor (in the conditionsof the experiment conducted and described in Section VI-A),which exhibits a DR of 95% at an FPR of 2%.
PARRA ALONSO et al.: COMBINATION OF FEATURE EXTRACTION METHODS FOR SVM PEDESTRIAN DETECTION 303
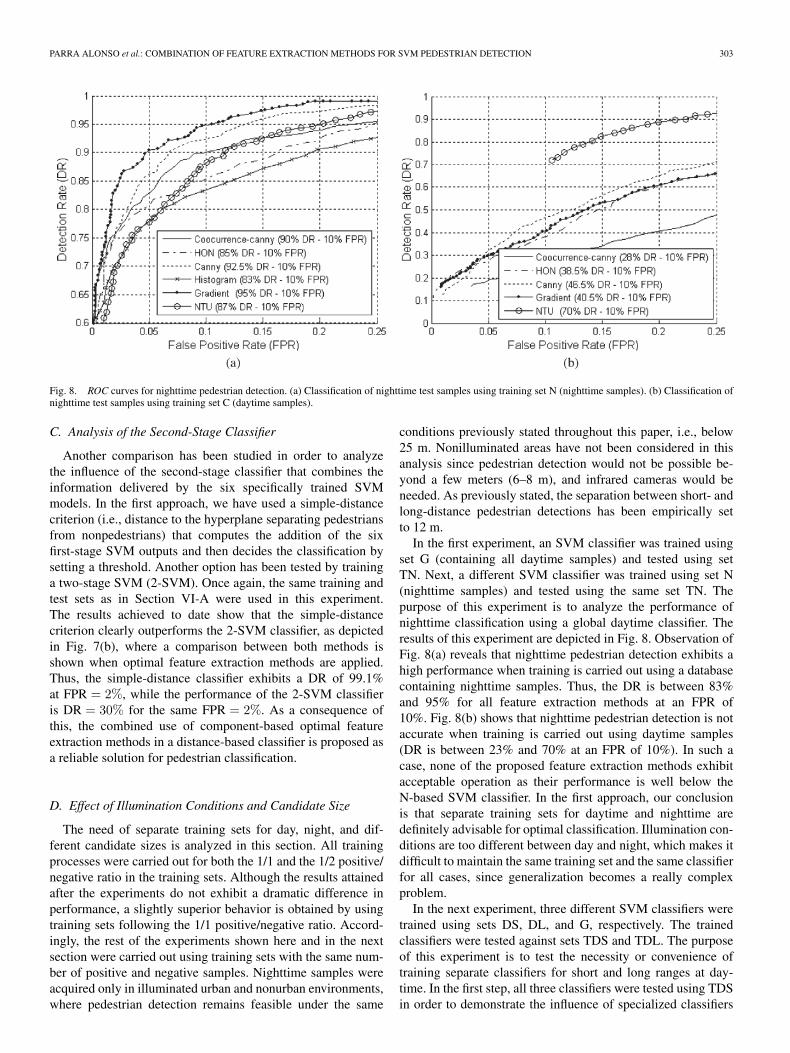
Fig. 8. ROC curves for nighttime pedestrian detection. (a) Classification of nighttime test samples using training set N (nighttime samples). (b) Classification ofnighttime test samples using training set C (daytime samples).
C. Analysis of the Second-Stage Classifier
Another comparison has been studied in order to analyzethe influence of the second-stage classifier that combines theinformation delivered by the six specifically trained SVMmodels. In the first approach, we have used a simple-distancecriterion (i.e., distance to the hyperplane separating pedestriansfrom nonpedestrians) that computes the addition of the sixfirst-stage SVM outputs and then decides the classification bysetting a threshold. Another option has been tested by traininga two-stage SVM (2-SVM). Once again, the same training andtest sets as in Section VI-A were used in this experiment.The results achieved to date show that the simple-distancecriterion clearly outperforms the 2-SVM classifier, as depictedin Fig. 7(b), where a comparison between both methods isshown when optimal feature extraction methods are applied.Thus, the simple-distance classifier exhibits a DR of 99.1%at FPR = 2%, while the performance of the 2-SVM classifieris DR = 30% for the same FPR = 2%. As a consequence ofthis, the combined use of component-based optimal featureextraction methods in a distance-based classifier is proposed asa reliable solution for pedestrian classification.
D. Effect of Illumination Conditions and Candidate Size
The need of separate training sets for day, night, and dif-ferent candidate sizes is analyzed in this section. All trainingprocesses were carried out for both the 1/1 and the 1/2 positive/negative ratio in the training sets. Although the results attainedafter the experiments do not exhibit a dramatic difference inperformance, a slightly superior behavior is obtained by usingtraining sets following the 1/1 positive/negative ratio. Accord-ingly, the rest of the experiments shown here and in the nextsection were carried out using training sets with the same num-ber of positive and negative samples. Nighttime samples wereacquired only in illuminated urban and nonurban environments,where pedestrian detection remains feasible under the same
conditions previously stated throughout this paper, i.e., below25 m. Nonilluminated areas have not been considered in thisanalysis since pedestrian detection would not be possible be-yond a few meters (6–8 m), and infrared cameras would beneeded. As previously stated, the separation between short- andlong-distance pedestrian detections has been empirically setto 12 m.
In the first experiment, an SVM classifier was trained usingset G (containing all daytime samples) and tested using setTN. Next, a different SVM classifier was trained using set N(nighttime samples) and tested using the same set TN. Thepurpose of this experiment is to analyze the performance ofnighttime classification using a global daytime classifier. Theresults of this experiment are depicted in Fig. 8. Observation ofFig. 8(a) reveals that nighttime pedestrian detection exhibits ahigh performance when training is carried out using a databasecontaining nighttime samples. Thus, the DR is between 83%and 95% for all feature extraction methods at an FPR of10%. Fig. 8(b) shows that nighttime pedestrian detection is notaccurate when training is carried out using daytime samples(DR is between 23% and 70% at an FPR of 10%). In such acase, none of the proposed feature extraction methods exhibitacceptable operation as their performance is well below theN-based SVM classifier. In the first approach, our conclusionis that separate training sets for daytime and nighttime aredefinitely advisable for optimal classification. Illumination con-ditions are too different between day and night, which makes itdifficult to maintain the same training set and the same classifierfor all cases, since generalization becomes a really complexproblem.
In the next experiment, three different SVM classifiers weretrained using sets DS, DL, and G, respectively. The trainedclassifiers were tested against sets TDS and TDL. The purposeof this experiment is to test the necessity or convenience oftraining separate classifiers for short and long ranges at day-time. In the first step, all three classifiers were tested using TDSin order to demonstrate the influence of specialized classifiers
304 IEEE TRANSACTIONS ON INTELLIGENT TRANSPORTATION SYSTEMS, VOL. 8, NO. 2, JUNE 2007
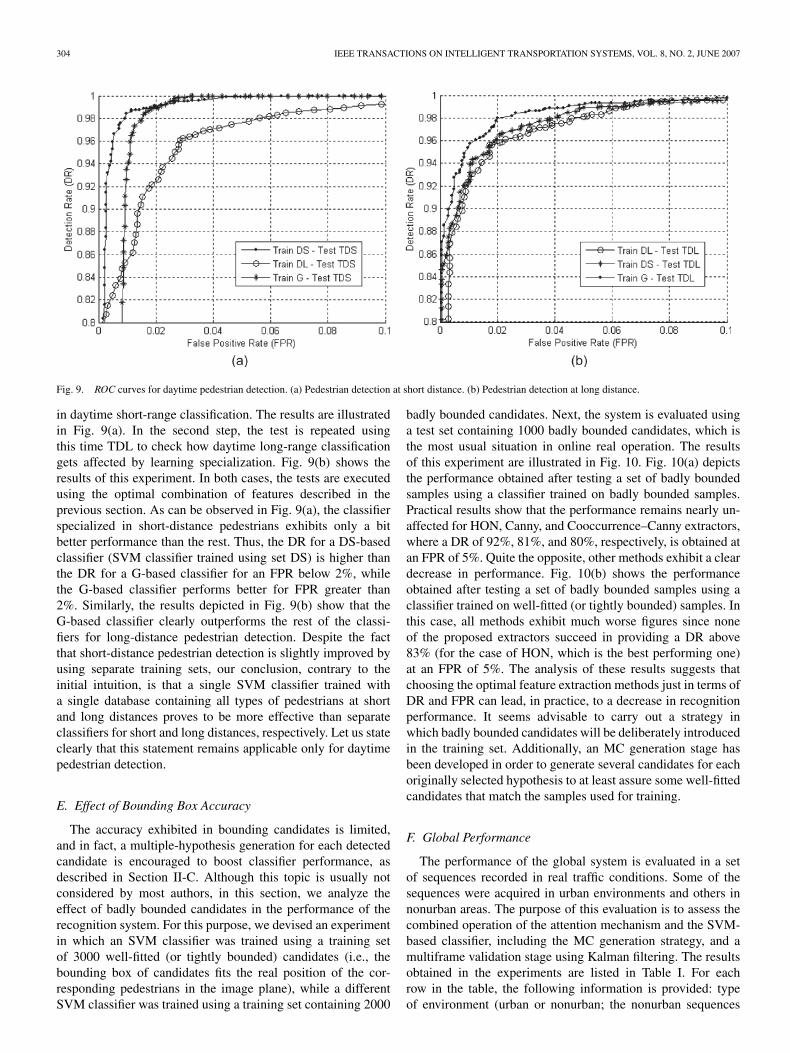
Fig. 9. ROC curves for daytime pedestrian detection. (a) Pedestrian detection at short distance. (b) Pedestrian detection at long distance.
in daytime short-range classification. The results are illustratedin Fig. 9(a). In the second step, the test is repeated usingthis time TDL to check how daytime long-range classificationgets affected by learning specialization. Fig. 9(b) shows theresults of this experiment. In both cases, the tests are executedusing the optimal combination of features described in theprevious section. As can be observed in Fig. 9(a), the classifierspecialized in short-distance pedestrians exhibits only a bitbetter performance than the rest. Thus, the DR for a DS-basedclassifier (SVM classifier trained using set DS) is higher thanthe DR for a G-based classifier for an FPR below 2%, whilethe G-based classifier performs better for FPR greater than2%. Similarly, the results depicted in Fig. 9(b) show that theG-based classifier clearly outperforms the rest of the classi-fiers for long-distance pedestrian detection. Despite the factthat short-distance pedestrian detection is slightly improved byusing separate training sets, our conclusion, contrary to theinitial intuition, is that a single SVM classifier trained witha single database containing all types of pedestrians at shortand long distances proves to be more effective than separateclassifiers for short and long distances, respectively. Let us stateclearly that this statement remains applicable only for daytimepedestrian detection.
E. Effect of Bounding Box Accuracy
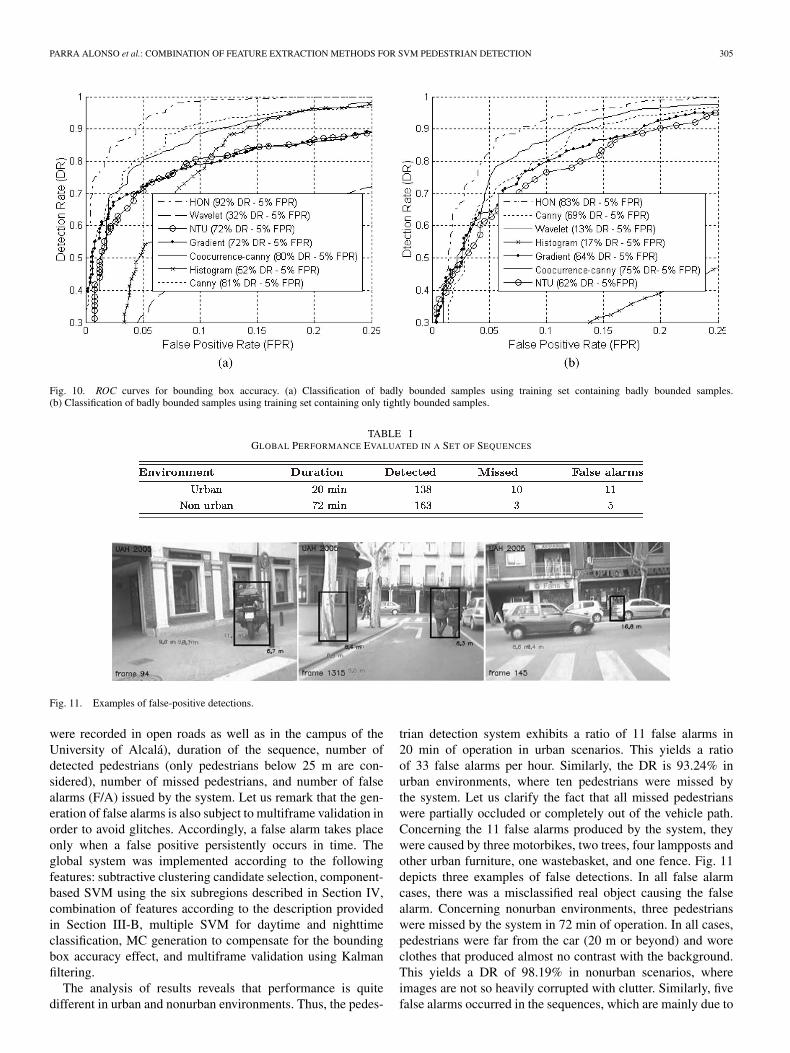
The accuracy exhibited in bounding candidates is limited,and in fact, a multiple-hypothesis generation for each detectedcandidate is encouraged to boost classifier performance, asdescribed in Section II-C. Although this topic is usually notconsidered by most authors, in this section, we analyze theeffect of badly bounded candidates in the performance of therecognition system. For this purpose, we devised an experimentin which an SVM classifier was trained using a training setof 3000 well-fitted (or tightly bounded) candidates (i.e., thebounding box of candidates fits the real position of the cor-responding pedestrians in the image plane), while a differentSVM classifier was trained using a training set containing 2000
badly bounded candidates. Next, the system is evaluated usinga test set containing 1000 badly bounded candidates, which isthe most usual situation in online real operation. The resultsof this experiment are illustrated in Fig. 10. Fig. 10(a) depictsthe performance obtained after testing a set of badly boundedsamples using a classifier trained on badly bounded samples.Practical results show that the performance remains nearly un-affected for HON, Canny, and Cooccurrence–Canny extractors,where a DR of 92%, 81%, and 80%, respectively, is obtained atan FPR of 5%. Quite the opposite, other methods exhibit a cleardecrease in performance. Fig. 10(b) shows the performanceobtained after testing a set of badly bounded samples using aclassifier trained on well-fitted (or tightly bounded) samples. Inthis case, all methods exhibit much worse figures since noneof the proposed extractors succeed in providing a DR above83% (for the case of HON, which is the best performing one)at an FPR of 5%. The analysis of these results suggests thatchoosing the optimal feature extraction methods just in terms ofDR and FPR can lead, in practice, to a decrease in recognitionperformance. It seems advisable to carry out a strategy inwhich badly bounded candidates will be deliberately introducedin the training set. Additionally, an MC generation stage hasbeen developed in order to generate several candidates for eachoriginally selected hypothesis to at least assure some well-fittedcandidates that match the samples used for training.
F. Global Performance
The performance of the global system is evaluated in a setof sequences recorded in real traffic conditions. Some of thesequences were acquired in urban environments and others innonurban areas. The purpose of this evaluation is to assess thecombined operation of the attention mechanism and the SVM-based classifier, including the MC generation strategy, and amultiframe validation stage using Kalman filtering. The resultsobtained in the experiments are listed in Table I. For eachrow in the table, the following information is provided: typeof environment (urban or nonurban; the nonurban sequences
PARRA ALONSO et al.: COMBINATION OF FEATURE EXTRACTION METHODS FOR SVM PEDESTRIAN DETECTION 305
Fig. 10. ROC curves for bounding box accuracy. (a) Classification of badly bounded samples using training set containing badly bounded samples.(b) Classification of badly bounded samples using training set containing only tightly bounded samples.
TABLE IGLOBAL PERFORMANCE EVALUATED IN A SET OF SEQUENCES
Fig. 11. Examples of false-positive detections.
were recorded in open roads as well as in the campus of theUniversity of Alcalá), duration of the sequence, number ofdetected pedestrians (only pedestrians below 25 m are con-sidered), number of missed pedestrians, and number of falsealarms (F/A) issued by the system. Let us remark that the gen-eration of false alarms is also subject to multiframe validation inorder to avoid glitches. Accordingly, a false alarm takes placeonly when a false positive persistently occurs in time. Theglobal system was implemented according to the followingfeatures: subtractive clustering candidate selection, component-based SVM using the six subregions described in Section IV,combination of features according to the description providedin Section III-B, multiple SVM for daytime and nighttimeclassification, MC generation to compensate for the boundingbox accuracy effect, and multiframe validation using Kalmanfiltering.
The analysis of results reveals that performance is quitedifferent in urban and nonurban environments. Thus, the pedes-
trian detection system exhibits a ratio of 11 false alarms in20 min of operation in urban scenarios. This yields a ratioof 33 false alarms per hour. Similarly, the DR is 93.24% inurban environments, where ten pedestrians were missed bythe system. Let us clarify the fact that all missed pedestrianswere partially occluded or completely out of the vehicle path.Concerning the 11 false alarms produced by the system, theywere caused by three motorbikes, two trees, four lampposts andother urban furniture, one wastebasket, and one fence. Fig. 11depicts three examples of false detections. In all false alarmcases, there was a misclassified real object causing the falsealarm. Concerning nonurban environments, three pedestrianswere missed by the system in 72 min of operation. In all cases,pedestrians were far from the car (20 m or beyond) and woreclothes that produced almost no contrast with the background.This yields a DR of 98.19% in nonurban scenarios, whereimages are not so heavily corrupted with clutter. Similarly, fivefalse alarms occurred in the sequences, which are mainly due to

306 IEEE TRANSACTIONS ON INTELLIGENT TRANSPORTATION SYSTEMS, VOL. 8, NO. 2, JUNE 2007
lampposts and trees located by the edge of the road, yielding anaverage ratio of four false alarms per hour. As happens in urbanenvironments, false alarms are caused by real objects. Althoughthese figures are still unacceptable for the deployment of areal pedestrian detection system, the results described in thispaper point to the possible application of a robust pedestrianprotection system in roads and other open environments. Inany case, the results can be largely improved by incorporatingmotion- and position-dependent features.
VII. CONCLUSION AND FUTURE WORK
In this paper, we have carried out a comparative study of fea-ture extraction methods for vision-based pedestrian detection.Candidates are first selected by an attention mechanism basedon subtractive clustering and stereo vision. This helps reducethe number of false candidates and enhance the performanceof the recognition stage. In order to reduce the variability ofpedestrians, the learning process has been simplified by de-composing selected candidates into six local subregions that areeasily learned by individual SVM classifiers. The component-based approach has been demonstrated to outperform the globalclassifier in practice. In addition, the combination of differentfeature extraction methods for different subregions leads to anincrease in classifier performance. Accordingly, the so-calledoptimal features have been identified for each subregion andcombined in a more discriminant components-based classifier.Likewise, the effects of illumination conditions and candidatesize have been studied. Several training and test sets havebeen created for empirically demonstrating the suitability ofmultiple classifiers for daytime and nighttime at short and longranges, respectively. At nighttime, the use of the pedestrian-detection system is limited to well-illuminated areas. Anotherimportant factor, usually disregarded by most authors, is theeffect of the candidate bounding box accuracy. Experimentalresults support the use of features based on contrast or edges,such as HON or cooccurrence over Canny images, as well as thedevelopment of an MC generation strategy, in order to assurethat the issuance of some well-fitted candidates matches thesamples used for training. Finally, we have presented the globalperformance of the system described in this paper, includingcandidate selection, MC generation, candidate detection usingSVM, and pedestrian multiframe validation and tracking usingKalman filtering.
Although experimental results show that progress is beingmade in the right direction, further improvement needs to bemade before deploying a really robust vision-based pedestriandetection system for assisted driving in real traffic conditions.For this purpose, motion-based and position-dependent featureswill be incorporated, which aim at enhancing the shape-basedpedestrian detection algorithm developed in this paper. Twofurther actions are being carried out at the moment in order toimprove the presented system. Additional classifiers are beingintroduced to detect motorbikes, urban furniture, and so on.This measure aims at decreasing the false alarm rate. Thesystem is also being ported to an Apple MiniMac computerwhere optimization using ALTIVEC is being carried out inorder to reduce the correlation computational cost.
REFERENCES
[1] A. Shashua, Y. Gdalyahu, and G. Hayun, “Pedestrian detection fordriving assistance systems: Single-frame classification and system levelperformance,” in Proc. IEEE Intell. Veh. Symp., Parma, Italy, Jun. 2004,pp. 1–6.
[2] A. Broggi, M. Bertozzi, A. Fascioli, and M. Sechi, “Shape-basedpedestrian detection,” in Proc. IEEE Intell. Veh. Symp., Dearborn, MI,Oct. 2000, pp. 215–220.
[3] D. M. Gavrila and V. Philomin, “Real-time object detection for smartvehicles,” in Proc. 7th IEEE Int. Conf. Comput. Vis., 1999, pp. 87–93.
[4] F. Xu, X. Liu, and K. Fujimura, “Pedestrian detection and tracking withnight vision,” IEEE Trans. Intell. Transp. Syst., vol. 6, no. 1, pp. 63–71,Mar. 2005.
[5] F. Xu and K. Fujimura, “Pedestrian detection and tracking with nightvision,” in Proc. IEEE Intell. Veh. Symp., Versailles, France, Jun. 2002,pp. 21–30.
[6] B. Fardi, U. Schuenert, and G. Wanielik, “Shape and motion-based pedes-trian detection in infrared images,” in Proc. IEEE Intell. Veh. Symp.,Las Vegas, NV, Jun. 2005, pp. 18–23.
[7] M. Bertozzi, A. Broggi, A. Lasagni, and M. D. Rose, “Infrared stereovision-based pedestrian detection,” in Proc. IEEE Intell. Veh. Symp.,Las Vegas, NV, Jun. 2005, pp. 24–29.
[8] M. Bertozzi, A. Broggi, R. Chapuis, F. Chausse, A. Fascioli, andA. Tibaldi, “Shape-based pedestrian detection and localization,” in Proc.IEEE ITS Conf., Shanghai, China, Oct. 2003, pp. 328–333.
[9] C. Papageorgiou and T. Poggio, “A trainable system for object detection,”Int. J. Comput. Vis., vol. 38, no. 1, pp. 15–33, 2000.
[10] A. Mohan, C. Papageorgiou, and T. Poggio, “Example-based object detec-tion in images by components,” IEEE Trans. Pattern Anal. Mach. Intell.,vol. 23, no. 4, pp. 349–361, Apr. 2001.
[11] D. M. Gavrila, J. Giebel, and S. Munder, “Vision-based pedestrian de-tection: The protector system,” in Proc. IEEE Intell. Veh. Symp., Parma,Italy, Jun. 2004, pp. 13–18.
[12] H. Nanda and L. Davis, “Probabilistic template based pedestrian detectionin infrared videos,” in Proc. IEEE Intell. Veh. Symp., Versailles, France,Jun. 2002, pp. 15–20.
[13] H. Cheng, N. Zheng, and J. Qin, “Pedestrian detection using sparse Gaborfilter and support vector machine,” in Proc. IEEE Intell. Veh. Symp.,Las Vegas, NV, Jun. 2005, pp. 583–587.
[14] F. Suard, A. Rakotomamonjy, A. Bensrhair, and V. Guigue, “Pedestriandetection using stereo-vision and graph kernels,” in Proc. IEEE Intell.Veh. Symp., Las Vegas, NV, Jun. 2005, pp. 267–272.
[15] U. Franke and S. Heinrich, “Fast obstacle detection for urban trafficsituations,” IEEE Trans. Intell. Transp. Syst., vol. 3, no. 3, pp. 173–181,Sep. 2002.
[16] C. Curio, J. Edelbrunner, T. Kalinke, C. Tzomakas, and W. V. Seelen,“Walking pedestrian recognition,” IEEE Trans. Intell. Transp. Syst., vol. 1,no. 3, pp. 155–163, Sep. 2000.
[17] U. Franke, D. Gavrila, S. Gorzig, F. Lindner, F. Puetzold, and C. Wohler,“Autonomous driving goes downtown,” IEEE Intell. Syst. Their Appl.,vol. 13, no. 6, pp. 40–48, Nov./Dec. 1998.
[18] L. Zhao and C. E. Thorpe, “Stereo and neural network-based pedestriandetection,” IEEE Trans. Intell. Transp. Syst., vol. 1, no. 3, pp. 148–154,Sep. 2000.
[19] M. Szarvas, A. Yoshizawa, M. Yamamoto, and J. Ogata, “Pedestriandetection with convolutional neural networks,” in Proc. IEEE Intell. Veh.Symp., Las Vegas, NV, Jun. 2005, pp. 224–229.
[20] G. Grubb, A. Zelinsky, L. Nilsson, and M. Rilbe, “3d vision sensing forimproved pedestrian safety,” in Proc. IEEE Intell. Veh. Symp., Parma,Italy, Jun. 2004, pp. 19–24.
[21] D. Fernández, I. Parra, M. A. Sotelo, L. M. Bergasa, P. Revenga,J. Nuevo, and M. Ocaña, “Pedestrian recognition for intelligent trans-portation systems,” in Proc. ICINCO, Barcelona, Spain, Sep. 2005,pp. 292–297.
[22] P. Viola, M. J. Jones, and D. Snow, “Detecting pedestrians using patternsof motion and appearance,” in Proc. ICCV, 2003, pp. 734–741.
[23] C. Hernández, “Sistema de asistencia a la conducción de vehículos decarretera mediante la detección y aviso de la salida del carril,” M.S. thesis,Univ. Alcalá, Madrid, Spain, 2005.
[24] M. A. Sotelo, F. J. Rodríguez, and L. Magdalena, “Virtuous: Vision-basedroad transportation for unmanned operation on urban-like scenarios,”IEEE Trans. Intell. Transp. Syst., vol. 5, no. 2, pp. 69–83, Jun. 2004.
[25] M. A. Sotelo, F. J. Rodríguez, L. Magdalena, L. M. Bergasa, andL. Boquete, “A color vision-based lane tracking system for autonomousdriving on unmarked roads,” Auton. Robots, vol. 16, no. 1, pp. 95–116,Jan. 2004.

PARRA ALONSO et al.: COMBINATION OF FEATURE EXTRACTION METHODS FOR SVM PEDESTRIAN DETECTION 307
[26] R. Labayrade, C. Royere, D. Gruyer, and D. Aubert, “Cooperative fusionfor multi-obstacles detection with use of stereovision and laser scanner,”in Proc. Int. Conf. Adv. Robot., 2003, pp. 1538–1543.
[27] B. Boufama, “Reconstruction tridimensionnelle en vision par ordinateur:Cas des cameras non etalonnees,” Ph.D. dissertation, INP de Grenoble,Grenoble, France, 1994.
[28] S. Chiu, “Fuzzy model identification based on cluster estimation,”J. Intell. Fuzzy Syst., vol. 2, no. 3, pp. 267–278, 1994.
[29] F. J. Canny, “A computational approach to edge detection,” IEEE Trans.Pattern Anal. Mach. Intell., vol. PAMI-8, no. 6, pp. 679–698, Nov. 1986.
[30] R. M. Haralick, “Statistical and structural approaches to texture,”Proc. IEEE, vol. 67, no. 5, pp. 786–804, May 1979.
[31] N. Dalai and B. Triggs, “Histogram of oriented gradients for humandetection,” in Proc. IEEE Comput. Soc. Conf. Comput. Vis. and PatternRecog., 2005, pp. 886–893.
[32] L. Wang, “Texture unit, texture spectrum and texture analysis,” IEEETrans. Geosci. Remote Sens., vol. 28, no. 4, pp. 509–512, Jul. 1990.
[33] J. Nuevo. (2005). Tsetbuilder Tutorial, Technical Report. [Online].Available: ftp://www.depeca.uah.es/pub/vision/SVM/manual.pdf
[34] J. C. Christopher, “A tutorial on support vector machines for patternrecognition,” Data Mining Knowl. Discov., vol. 2, no. 2, pp. 121–167,Jun. 1998.
[35] C. C. Chang and C.-J. Lin. (2001). LIBSVM: A Library for Support VectorMachines. [Online]. Available: http://www.csie.nut.edu.tw/ cjlin/libsvm
Ignacio Parra Alonso was born in Madrid, Spain,in 1979. He received the M.S. degree in telecommu-nications engineering from the University of Alcalá(UAH), Madrid, in 2005. He is currently workingtoward the Ph.D. degree in egomotion computingonboard a road vehicle at UAH.
He is currently a member of the research staffat UAH. His areas of interest include intelligenttransportation systems, intelligent vehicles, artificialvision, and operating systems. He has run severalcourses on GNU/Linux.
Mr. Parra Alonso was the recipient of the Master Thesis Award in eSafetyfrom ADA Lectureship at the Technical University of Madrid in 2006.
David Fernández Llorca was born in Madrid,Spain, in November 1980. He received the M.S.degree in telecommunications engineering from theUniversity of Alcalá (UAH), Madrid, in 2003. He iscurrently working toward the Ph.D. degree at UAH.
He is currently a Teaching Assistant at UAH.His research interests are mainly focused on theapplication of image processing to eSafety and ITSapplications.
Mr. Llorca was the recipient of the Master The-sis Award in eSafety from ADA Lectureship at the
Technical University of Madrid in 2004 and the Best TelecommunicationEngineering Student award, also in 2004.
Miguel Ángel Sotelo (M’02) received the Dr. Ing.degree in electrical engineering from the TechnicalUniversity of Madrid, Madrid, Spain, in 1996 andthe Ph.D. degree in electrical engineering from theUniversity of Alcalá (UAH), Madrid, in 2001.
From 1993 to 1994, he was a Researcher at theDepartment of Electronics, UAH. He is currently anAssociate Professor at the UAH. He is the author ofmore than 100 refereed publications in internationaljournals, book chapters, and conference proceedings.His research interests include real-time computer vi-
sion and control systems for autonomous and assisted intelligent road vehicles.Dr. Sotelo is a member of the IEEE ITS Society and the ITS-Spain Commit-
tee. He has been serving as Auditor and Expert at the FITSA Foundation forR+D Projects in the domain of automotive applications since September 2004.He was the recipient of the Best Research Award in the domain of Automotiveand Vehicle Applications in Spain in 2002, the 3M Foundation Awards in thecategory of eSafety in 2003 and 2004, and the Best Young Researcher Awardfrom the UAH in 2004.
Luis M. Bergasa (M’04–A’05) received the M.S.degree in electrical engineering from the TechnicalUniversity of Madrid, Madrid, Spain, in 1995 andthe Ph.D. degree in electrical engineering from theUniversity of Alcalá (UAH), Madrid, in 1999.
He is currently an Associate Professor at the De-partment of Electronics, UAH. He is the author ofmore than 80 publications in international journals,book chapters, and conference proceedings. His re-search interests include real-time computer visionand its applications, particularly in the field of the
robotics, assistance systems for elderly people, and intelligent transportationsystems.
Dr. Bergasa is a member of the Computer Science Society. He was the recip-ient of the Best Research Award of the 3M Foundation Awards in the Industrialcategory in 2004 and of the Best Spanish Ph.D. Thesis Award in Robotics fromthe Automatic Spanish Committee in 2005 as Director of the work.
Pedro Revenga de Toro received the Technicaldegree in telecommunications engineering from theUniversity of Alcalá (UAH), Madrid, Spain, in 1989and the Dr. Ing. degree in electronics engineeringfrom the Technical University of Valencia, Valencia,Spain, in 2000.
Since 1990, he has been a Lecturer in the De-partment of Electronics, UAH. He is the author ofmore than 50 refereed publications in internationaljournals, book chapters, and conference proceedings.His research interests include robotics, multisensor-
ial integration, control electronics, parallel processing systems, and mobilityassistance systems.
Jesús Nuevo received the M.S. degree in telecom-munications engineering from the University ofAlcalá (UAH), Madrid, Spain, in 2004, where he iscurrently working toward the Ph.D. degree.
His research interests include computer vision, au-tonomous vehicles, pattern recognition, and machinelearning.
Manuel Ocaña received the Ing. degree in 2002and the Ph.D. degree from the University ofAlcalá (UAH), Madrid, Spain, both in electricalengineering.
From 2002 to 2005, he was a Researcher in theDepartment of Electronics, UAH, where he is cur-rently an Associate Professor. He is the author ofmore than 20 refereed publications in internationaljournals, book chapters, and conference proceed-ing. His research interests include robotics localiza-tion and navigation, assistant robotics and computer
vision, and control systems for autonomous and assisted intelligent vehicles.Dr. Ocaña was the recipient of the Best Research Award for the 3M
Foundation Awards in the category of eSafety in 2003 and 2004.
Miguel Ángel García Garrido received the Indus-trial Engineering middle degree and the ElectronicEngineering degree from the University of Alcalá(UAH), Madrid, Spain, in 1998 and 2001, respec-tively. He is currently working toward the Ph.D.degree in artificial vision at the UAH.
Since 2003, he has been a Lecturer in the Elec-tronics Department, UAH. His research interests arein the area of intelligent transportation systems, in-cluding, driver assistance systems.