combination of hsv and rgb histograms and mpeg-7 descriptor
TRANSCRIPT

Artículo Científico / Scientific Paper
Combination of HSV and RGBhistograms and MPEG-7 Descriptor:
Preliminar Results and Future WorkJavier Poveda Figueroa1,∗ y Vladímir Robles Bykbaev2
Abstract
In this paper we present the partial results obtainedwith a new approach to combine HSV and RGB histo-grams and MPEG-7 CLD descriptor. The combinationwas conducted using Borda Voting-Schemes in threedatabases: Wang, ZuBud an UW. Despite the poorinitial classification performed with CLD descriptor,our proposal has achieved good results for the Wangdatabase (82.66%), outperforming the precision ofHSV (72.33%) and RGB histograms (79.33%), andCLD descriptor (53%). In the other databases (ZuBudand UW) the combination approach was unable toperform a significant improvement.
Keywords: HSV histogram, RGB histogram, Colourlayout descriptor, Borda voting schemes, KNN.
Resumen
En este artículo presentamos los resultados parcialesobtenidos con un nuevo enfoque para combinar los his-togramas RGB, HSV y el descriptor CLD del estándarMPEG-7. La combinación fue realizada usando esque-mas de votación Borda en tres bases de datos: Wang,UW y ZuBud. A pesar de la baja clasificación inicialrealizada con el descriptor CLD, nuestra propuesta haalcanzado mejores resultados para la base de datosWang (82.66%) que los histogramas HSV (72.33%),RGB (79.33%) y el descriptor CLD (53%). En lasotras bases de datos (ZuBud y UW) la combinaciónno generó mejoras significativas.
Palabras clave: histograma HSV, histograma RGB,colour layout descriptor, esquemas de votación Borda,KNN.
1,∗Colaborador del Laboratorio de Investigación en Sistemas Informáticos e Inteligencia Artificial, Carrera de Ingenieríade Sistemas, Universidad Politécnica Salesiana, sede Cuenca. Autor para correspondencia ): [email protected]áster en Inteligencia Artificial, Reconocimiento de Formas e Imagen Digital, Ingeniero en Sistemas, Estudiante deDoctorado en Informática, Universidad Politécnica de Valencia, Encargado del Laboratorio de Investigación en SistemasInformáticos e Inteligencia Artificial, Universidad Politécnica Salesiana, sede Cuenca.Recibido: 30 - Octubre - 2012 , Aprobado tras revisión: 21 - Noviembre - 2012Forma sugerida de citación: Poveda, J. y Robles, V. (2012). “Combination of HSV and RGB histograms and MPEG-7Descriptor: Preliminar Results and Future Work”. INGENIUS . N.◦8, (Julio/Diciembre). pp. 3-10. ISSN: 1390-650X
3

4 INGENIUS N.◦8, Julio/Diciembre de 2012
1. IntroductionAt present several descriptors exist to extract re-
levant features from images. One of the most useddescriptors is the color histogram, because it is sim-ple to implement and understand. However, the colorhistograms have limitations when they are used toclassify images with a similar color distribution butdifferent content.Other descriptors are more robust toclassify image using textures, color distribution andshape descriptors.
Several approaches have been presented to performimage retrieval through the combination of differentdescriptors. Some proposals use the machine-learningapproach (Support Vector Machines and Neuro-FuzzyNetworks) [1], while others directly combine the featu-res set [2],[3] to show the improvement achieved withcombination.
In this paper we introduce the results of a newapproach presented in [4], to combine HSV and RGBhistograms and MPEG-7 CLD descriptor. In the pre-vious paper we explained the color histograms RGBand HSV and the MPEG-7 color Layout descriptor.Then, we applied the supervised learning algorithmK-Nearest Neighbors to get the votes of each image,so that we can classify them and use the votes withthe Borda Voting Scheme. Finally, we use the BordaVoting Scheme to combine the votes to classify thedata we are working with.
The results achieved with our approach have ob-tained good results for the Wang database, improvingthe precision to 82.66%. With the other two databasesthat we used, the combination has not significantlyimproved the precision.
The rest of the paper is organized as follows. InSection 2 we review the databases and tools used,and the process followed to extract the features. Thetechnical details of the approach’s implementation arereviewed in Section 3. In Section 4 we present theresults obtained. Finally, discussion and future workare described in Section 5.
2. Design phase of theexperiment
2.1 Corpus selectionThe process selected to choose the corpus images
is explained in the next steps. UW, Wang and ZuBudcorpuses were chosen because of their features. Eachof these corpuses was made by a group of experts inthe area of computer vision to apply machine-learning
algorithms to them so that they can classify the classesof images that the image corpus has.
The University of Washington made the UW data-base and it contains 1109 images. The images werechosen from 18 vacation places. As [3] points out, theclassification process is made with annotations, so thatthe image could be classified in a category based onits annotations.
For example, given a query image of a categorythat is going to be compared with all the categoriesin order to determine to which category they belongto. A retrieval task could be looking for the imageof the same building, or the image of any place ofvacation. Figure 1 illustrates the UW database withits annotations.
Figure 1. Description of the UW Database, whichcan be found at: http://www.cs.washington.edu/research/imagedatabase/groundtruth.
The Wang database is a collection of 1000 imagesfrom theCorel database, which are divided in 10 ca-tegories of 100 images each one. The Content-BasedImage Retrieval process for this database searchesfrom a query database comparing all the images of thedatabase to seek where it belongs to so that it can beclassified in any category. Figure 2 shows this databasewith its categories [3].
The ZuBud database was created at the Swiss Fe-deral Institute of Technology in Zurich and it contains1005 images of 201 buildings. Each building is represen-ted in this database by 5 images; each one was takenby different viewpoints, under different conditions and

Poveda y Robles / Combination of HSV and RGB histograms and MPEG-7 Descriptor 5
Figure 2. Images of the Wang database, which can befound at: wang.ist.psu.edu/docs/related
with two different cameras. The Content Based Imageretrieval process is the same process that was explai-ned with the UW and Wang databases. The differencebeing that the query image, which is used must recoveran image from the same building. Figure 3 shows thisdatabase with its categories [3].
2.2 Tools which were used to do theexperiment
The tools that were used to do the experimentare: OpenCV 2.4.0 for UNIX, the C++ version 4.6 forUNIX, Visual Studio 2008 Express Edition, Java 1.6.1and Net Beans 5.5. OpenCV2.4.0 was used to get theimage features from the color spaces RGB, HSV andthe MPEG-7 standard Color Layout Descriptor. Also,we used the OpenCV tool for transforming RGB toHSV color space and to the YCbCr Color space. Afterthat, the GUI Visual Studio Standard Edition wasused to program the K-Nearest Neighbors Algorithm.Then, the GUI NetBeans 5.5 with the programming
Figure 3. Images of ZuBud database, which can be foundat: http://www.vision.ee.ethz.ch/showroom/zubud/
language Java 1.6.1 to program the Borda Voting Sche-mes. Finally, the results of the experiment were savedon a Microsoft Word 2007 text document to analyzethem and get the results.
2.3 Process followed to do theexperiment
The process of the experiment was divided in twoparts. The first part consists in the extraction of thecharacteristics of the images, the quantization andshuffle of them. The second part is the application ofthe machine-learning algorithm K-Nearest Neighborsand the Borda Voting Schemes. In this subsectionwe willexplain in more detail the design phase of theexperiment.
The process goes as follows:
Features Extraction: This process generates the co-lor RGB and HSV histograms and CLD descriptor.To obtain the bins of the HSV and the CLD it is ne-cessary to convert the RGB color space of the imagesto the color spaces HSV and YCbCr. This process isdone because the RGB histogram is the most basichistogram that can be converted to any color space[5].
To covert the RGB to the HSV color space we haveto use the following formulas [5]:
H = cos−1 0,5 [(R−G) + (R−B)]√(R−G)2 + (R−G) (R−B)
(1)
Equation 1. Conversion from RGB to Hue.
S = 1− 3R + G + B
[min (R, G, B)] (2)
Equation 2. Conversion from RGB to Saturation.

6 INGENIUS N.◦8, Julio/Diciembre de 2012
V = 13 (R + G + B) (3)
Equation 3. Conversion from RGB to Value.
To convert RGB to YCbCr we use the followingformulas [6]:
Y = 0,299R + 0,587G + 0,1148B (4)
Equation 4. Conversion from RGB to Value.
Cb = −0,127R− 0,339G + 0,5211B + 128 (5)
Equation 5. Conversion of RGB to Cb.
Cr = 0,511R− 0,428G− 0,083B + 128 (6)
Equation 6. Conversion RGB to Cr.
Quantization: The quantization process is used toreduce the dimensionality of the color features [4] andimprove the performance of the system.The processingtime needed to analyze them is limited because of thecomputer memory and the time to process them mustbe as shorter as possible. For this reason, the colordata bins of each image are quantized to facilitate theelements that were explained.
The color data bins are reduced the next form.RGB is reduced to 32 bins for each color channel, butfor the experiment they were reduced to 256 bins forall the channels, instead of reducing them to 32 binsfor each color channel; HSV is reduced to 16 bins inH, 4 bins in S, and 4 bins in V; finally, the CLD colordescriptor produces 12 bins because its structure wasdefined previously.
Shuffle: The objective of this process is to mix theimage set of features as a necessary stage for the exper-iment, because the system must not learn the imagefeatures in the same order each time [4].
Test and Train for experimentation: The set ofcolor features is divided in two subtests, which aregoing to be used in the experiment: train and test.The train subset has 70% of the features that aregoing to be used as a base to compare the features to anew one, and the test subset of images that is going tobe compared with the training set to determine whichcategory the images belong to [7].
K-Nearest Neighbors Algorithm: The K-NearestNeighbor Algorithm was chosen to do the experimentbecause of its characteristics. The K-Nearest NeighborAlgorithm uses two sets of data, one as a standardand the other to compare each group of data with the
standard set of data. Another important characteristicof this algorithm is the structure, because it processesthe group of data without any loss of it [7].
Because of the nature of the KNN algorithm, whichis a machine-learning supervised algorithm, it uses twosubsets of data that are the train and the test sets.As it was explained previously in the Test and Trainsubarea of experimentation we use the train subsetas a base to compare features and the test subset tocompare the images with the train subset so that wecan determine which image belongs to each categoryof the set of images.
In this case, the train and test set are used for com-paring each color feature of the test set with each one ofthe training set, in this method the next equations [8]are applied, Equation 7 represents the Euclidean dis-tance which is used for measuring the distance on theRGB and HSV histogram, and Equation 8 measuresthe distance of the CLD color descriptor:
Euclidean =
√√√√ n∑i=1
(xi − yi)2 (7)
Equation 7. Euclidean distance formula which determinesthe distance between two points. In this case xi representsthe value of the test subset, while the yi represents thevalue of the train subset.
Dcld =
√∑i
wYi
(Yi − Y
′i
)2+
√∑i
wcbi
(Cbi − Cb
′i
)2+ . . .
. . . +√∑
i
wCri
(Cri − Cr
′i
)2 (8)
Equation 8. Formula which compares the distance bet-ween the color values of YCbCr.
Where:
• Yi represents the value of Y of the test imageand represents the value of Y of the train image.
• Cbi represents the value of Cb of the test imageand Cb
′
i represents the value of Cb of the trainimage.
• Cri represents the value of Cr of the test imageand Cr
′
i represents the value of Cr of the trainimage.
• wYi represents the weights of Cb, and the Equa-
tion 9 represents the weight of Cb where j andk are the positions of the train and test imagesrespectively :
wYi = 0,4
(j + k)2 (9)
Equation 9. Weight of the Cb value.

Poveda y Robles / Combination of HSV and RGB histograms and MPEG-7 Descriptor 7
• wCbi represents the weights of Y , and the equa-
tion 10 represents the weight of Y where j andk are the positions of the train and test imagesrespectively :
wYi = 0,2
(j + k)2 (10)
Equation 10. Weight of the Y value.
• wCri represents the weights of Cr, and the Equa-
tion 11 represents the weight of Cr where j andk are the positions of the train and test imagesrespectively :
wCri = 0,4
(j + k)2 (11)
Equation 11. Weight of the Cr value.
Borda Voting Schemes: The Borda Voting Sche-mes are an ensemble technique developed in France inthe 18h century by the french Mathematician CharlesBorda. This method was developed because the votersmade very bad decisions in the voting process. Thiswas because the voters chose the candidate not for itsmerits, but for his popularity. Because of this reason,Borda developed a method, which helped to choosethe correct candidate by his merits [9].
The process of the Borda Voting Scheme goes asfollows. The Borda Voting scheme consists of a groupof candidates X = {1, 2, 3, . . . , xn} where n ≥ 32 andm voters where m ≥ 3 [7]. Defined in a formal waysas [9] explains: “The relationship P k represent thepreference of the voter k, k = {1, 2, 3, . . . , m}, over thecollection of n alternatives of X”. The relationship canbe represented by the matrix [9]:
P k =
rk
11 rk12 . . . rk
1n
rk21 rk
22 . . . rk2n
......
. . ....
rkn1 rk
n2 . . . rknn
Where
rkij =
{1 (if [xiPxj ])0 (in [other] {case})
It can be defined by the next Equation [9]:
rk (xi) =n∑
j=1rk
ij (12)
Equation 12. The Borda Voting Schemes formula. If youwant to know how it resolves a problem please go to [4].
3. Approach implementationThis section will explain the process done to make
the experiment. First, the processing of each corpuswill be explained. Second, how the KNN and BordaVoting schemes algorithms were programmed.
3.1 Preprocessing of each corpusAs it was explained in section one, we used 3 image
corpuses UW, Wang and ZuBud, each one of thesecorpuses are divided in categories which are: 23 for UW,10 for Wang and 201 for ZuBud. Every image of thecorpuses was processed with OpenCv 2.4.0. However,some categories of the UW database could not beprocessed and others must be converted to the jpegimage format in order to process them and extractinformation.To do this the ImageMagick program wasused. The categories which could not be processedwere: Barcelona2 and those which were converted are:Columbia George and Green lake and those whichended in a different format than JPEG. ColumbiaGeorge in its original form could not be processed,so it was necessary to reconvert it to the jpeg formatagain.
3.2 Programming of the modules of thesystem
The module that extracts the characteristics of theRGB histogram was programmed in OpenCV 2.4.0 inUbuntu Hardy and it had the following characteristics.First, the features of the images are extracted. Second,the image features are quantized in 256 bins. Finally,the quantized bins are written on a word processor,so that they can be used by the K-Nearest NeighborsAlgorithm.
The HSV module is like the RGB module, but it hastwo differences. The first difference is the conversionof the RGB color space to the HSV color space. Thesecond difference is the way the HSV histogram wasquantized by the OpenCv standard for HSV, the valuefor H is 180 and for S and V is 256. The results of thismodule are written in a word processor so that theycan be used by the K-Nearest Neighbors.
The module of the Color Layout Descriptor wasprogrammed in C++ with OpenCV in Ubuntu Hardyand it follows the next process. Firstly, it extracts thecolor features on the RGB color space. Secondly, ittransforms the color features of RGB in the color spaceYCbCr. After that, it divides the image in a matrixof 8x8. Then, the Discrete Cosine Transformation isapplied to reduce the low-frequency noises. Finally, thecoefficients of the CLD are written in a word processorso that they can be used by the K-Nearest Neighbors.
8 INGENIUS N.◦8, Julio/Diciembre de 2012
The K-Nearest Neighbors module was programmedin Visual Studio 2008 express edition. It follows thenext steps. First, a model for extracting the color fea-tures of the color descriptors and the Color LayoutDescriptor is defined. For this the word processor do-cuments which were explained on the previous sectionwere used. Second, those color features are shuffledin order to reduce error from the experiment. Afterthat, the features are separated in two subsections: thetrain subsection that has 70% of the color featuresand the test subsection that has the 30% of the colorfeatures. After that, the elements of the test subsectionare compared with the elements of the train subsection.Finally, the results are written in a word processor tobe used by the Borda Voting Schemes.
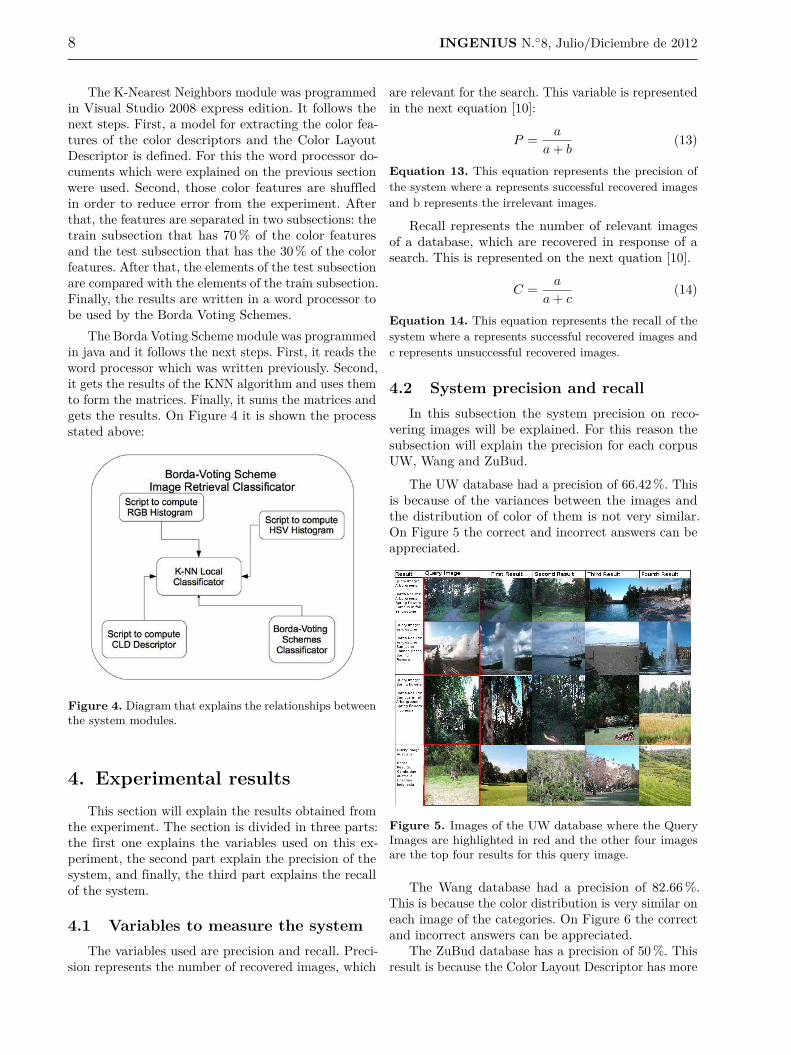
The Borda Voting Scheme module was programmedin java and it follows the next steps. First, it reads theword processor which was written previously. Second,it gets the results of the KNN algorithm and uses themto form the matrices. Finally, it sums the matrices andgets the results. On Figure 4 it is shown the processstated above:
Figure 4. Diagram that explains the relationships betweenthe system modules.
4. Experimental resultsThis section will explain the results obtained from
the experiment. The section is divided in three parts:the first one explains the variables used on this ex-periment, the second part explain the precision of thesystem, and finally, the third part explains the recallof the system.
4.1 Variables to measure the systemThe variables used are precision and recall. Preci-
sion represents the number of recovered images, which
are relevant for the search. This variable is representedin the next equation [10]:
P = a
a + b(13)
Equation 13. This equation represents the precision ofthe system where a represents successful recovered imagesand b represents the irrelevant images.
Recall represents the number of relevant imagesof a database, which are recovered in response of asearch. This is represented on the next quation [10].
C = a
a + c(14)
Equation 14. This equation represents the recall of thesystem where a represents successful recovered images andc represents unsuccessful recovered images.
4.2 System precision and recallIn this subsection the system precision on reco-
vering images will be explained. For this reason thesubsection will explain the precision for each corpusUW, Wang and ZuBud.
The UW database had a precision of 66.42%. Thisis because of the variances between the images andthe distribution of color of them is not very similar.On Figure 5 the correct and incorrect answers can beappreciated.
Figure 5. Images of the UW database where the QueryImages are highlighted in red and the other four imagesare the top four results for this query image.
The Wang database had a precision of 82.66%.This is because the color distribution is very similar oneach image of the categories. On Figure 6 the correctand incorrect answers can be appreciated.
The ZuBud database has a precision of 50%. Thisresult is because the Color Layout Descriptor has more

Poveda y Robles / Combination of HSV and RGB histograms and MPEG-7 Descriptor 9
Figure 6. Images of the Wang database where the QueryImages are highlighted in red and the other four imagesare the top four results for this query image.
precision with images that have better color distribu-tion and less border structure. On Figure 7 the correctand incorrect answers can be appreciated.
Figure 7. Images of the ZuBuddatabase where the QueryImages are highlighted in red and the other four imagesare the top four results for this query image.
The recall of the system was 100% because of thecharacteristics of the K-Nearest Neighbors.
4.3 Comparing Precision with othersystems
4.3.1 General Results of the system
The results of the designed system were:
Table 1. Results of the experiment with RGB, HSV, CLDand the Borda Voting Schemes done with the experiments.
Corpus RGB HSV CLD BordaRGB+HSV+CLD
UW 87.31 94.72 31.11 50Wang 79.33 72.33 53 82.66ZuBud 77.18 82.08 38.39 66.42
5. Conclusion and future workThe approach presented in this paper has outperfor-
med the precision level of HSV and RGB Histograms,and MPEG-7 CLD Descriptor (Wang database). Theprecision of CLD descriptor was poor, and this factsignificantly affected the overall process of classifica-tion.
In the same way, the classification process in theother databases presents low level of precision, due toCLD descriptor precision level.
Given the above, is important to count on descrip-tors with similar levels of precision or recall. In thisway, one descriptor can be good to classify some typesof images, and other descriptor can be good to classifyother types, giving us better results in higher globalprecision.
For future work we will incorporate the Boosting-Based classification, using uncorrelated MPEG-7 des-criptors to analyze if is possible to improve precisionin CBIR tasks.
AcknowledgmentThis work was funded by the project “Using visual
MPEG-7 descriptors for Content - Based Image Re-trieval” of the Fifth Call for Research Founds of theUniversidad Politécnica Salesiana.
References[1] E. Spyrou, H. Le Borgne, T. Mailis, E. Cooke,
Y. Avrithis, and N. O’Connor, “Fusing mpeg-7visual descriptors for image classification,” Artifi-cial Neural Networks: Formal Models and TheirApplications–ICANN 2005, pp. 747–747, 2005.
[2] P. Reddy, A. Reddy, and K. Devi, “HSV colorhistogram and directional binary wavelet patternsfor content based image retrieval,” InternationalJournal on Computer Science and Engineering(IJCSE), vol. 4, 2012.

10 INGENIUS N.◦8, Julio/Diciembre de 2012
[3] T. Deselaers, D. Keysers, and H. Ney, “Featuresfor image retrieval: an experimental comparison,”Information Retrieval, vol. 11, no. 2, pp. 77–107,2008.
[4] J. Poveda and V. Robles, “Image retrieval basedon the conbination of RGB and HSV’s and colorlayout descriptor,” Ingenius N-7, pp. 3–10, 2012.
[5] K. Mekaldji and S. Boucherka, “Color quanti-zation and its impact on color histogram basedimage retrieval,” in Procedings of the Second Con-ference International sur l’Informatique et sesApplications (CIIA’09), Saida, Algeria, May 3-4,2009.
[6] Intersil, “YCbCr to RGB considerations.” [Online].Available: http://www.intersil.com/content/dam/Intersil/documents/an97/an9717.pdf
[7] P. Harrington, Machine Learning in Action. NewYork: Manning Publications, 2012.
[8] O. Boullosa García, “Estudio comparativo de des-criptores visuales para la deteccion de escenascuasi-duplicadas,” Madrid, Spain, 2011, Proyectode fin de carrera.
[9] V. Robles, “Esquemas de votación borda aplicadosal etiquetado de roles semánticos,” Master’s thesis,Universidad Politécnica de Valencia, Valencia,Spain, 2010.
[10] S. Jeong, “Histogram-Based Color Image Retrie-val,” Psych221/EE362 Project Report. Palo Alto,CA: Stanford University, 2001.