combination of measurements of inclusive deep inelastic e ... · eur. phys. j. c (2015) 75:580 page...
TRANSCRIPT

Eur. Phys. J. C (2015) 75:580 DOI 10.1140/epjc/s10052-015-3710-4
Regular Article - Experimental Physics
Combination of measurements of inclusive deep inelastic e± pscattering cross sections and QCD analysis of HERA data
This paper is dedicated to the memory of Professor Guido Altarelli who sadly passed away as it went topress. The results which it presents are founded on the principles and the formalism which he developed inhis pioneering theoretical work on Quantum Chromodynamics in deep-inelastic lepton-nucleon scatteringnearly four decades ago
H1 and ZEUS Collaborations
H. Abramowicz54,a1, I. Abt40, L. Adamczyk25, M. Adamus64, V. Andreev37, S. Antonelli8, B. Antunovic4,V. Aushev28,29,b22, Y. Aushev29,a2, A. Baghdasaryan66, K. Begzsuren60, O. Behnke21, A. Behrendt Dubak40,47,U. Behrens21, A. Belousov37, P. Belov21,a3, A. Bertolin44, I. Bloch68, E. G. Boos2, K. Borras21, V. Boudry46,G. Brandt19, V. Brisson42, D. Britzger21, I. Brock9, N. H. Brook33, R. Brugnera45, A. Bruni7, A. Buniatyan6,P. J. Bussey18, A. Bylinkin36,a4, L. Bystritskaya36, A. Caldwell40, A. J. Campbell21, K. B. Cantun Avila35,M. Capua12, C. D. Catterall41, F. Ceccopieri3, K. Cerny49, V. Chekelian40, J. Chwastowski24, J. Ciborowski63,a5,R. Ciesielski21,a6, J. G. Contreras35, A. M. Cooper-Sarkar43, M. Corradi7, F. Corriveau50, J. Cvach48,J. B. Dainton31, K. Daum65,a7, R. K. Dementiev39, R. C. E. Devenish43, C. Diaconu34, M. Dobre10, V. Dodonov21,G. Dolinska21, S. Dusini44, G. Eckerlin21, S. Egli62, E. Elsen21, L. Favart3, A. Fedotov36, J. Feltesse17, J. Ferencei23,J. Figiel24, M. Fleischer21, A. Fomenko37, B. Foster20,a8, E. Gabathuler31, G. Gach25,a9, E. Gallo20,21,A. Garfagnini45, J. Gayler21, A. Geiser21, S. Ghazaryan21, A. Gizhko21, L. K. Gladilin39, L. Goerlich24,N. Gogitidze37, Yu. A. Golubkov39, M. Gouzevitch61, C. Grab69, A. Grebenyuk3, J. Grebenyuk21, T. Greenshaw31,I. Gregor21, G. Grindhammer40, G. Grzelak63, O. Gueta54, M. Guzik25, C. Gwenlan43, D. Haidt21, W. Hain21,R. C. W. Henderson30, P. Henkenjohann5, J. Hladky48, D. Hochman51, D. Hoffmann34, R. Hori59, R. Horisberger62,T. Hreus3, F. Huber22, Z. A. Ibrahim27, Y. Iga55, M. Ishitsuka56, A. Iudin29,a2, M. Jacquet42, X. Janssen3,F. Januschek21,a10, N. Z. Jomhari27, H. Jung3,21, I. Kadenko29, S. Kananov54, M. Kapichine15, U. Karshon51,J. Katzy21, M. Kaur11, P. Kaur11,b23, C. Kiesling40, D. Kisielewska25, R. Klanner20, M. Klein31, U. Klein21,31,C. Kleinwort21, R. Kogler20, N. Kondrashova29,a11, O. Kononenko29, Ie. Korol21, I. A. Korzhavina39, P. Kostka31,A. Kotanski26, U. Kötz21, N. Kovalchuk20, H. Kowalski21, J. Kretzschmar31, D. Krücker21, K. Krüger21, B. Krupa24,O. Kuprash21, M. Kuze56, M. P. J. Landon32, W. Lange68, P. Laycock31, A. Lebedev37, B. B. Levchenko39,S. Levonian21, A. Levy54, V. Libov21, S. Limentani45, K. Lipka21, M. Lisovyi22, B. List21, J. List21, E. Lobodzinska21,B. Lobodzinski40, B. Löhr21, E. Lohrmann20, A. Longhin44,a12, D. Lontkovskyi21, O. Yu. Lukina39, I. Makarenko21,E. Malinovski37, J. Malka21, H.-U. Martyn1, S. J. Maxfield31, A. Mehta31, S. Mergelmeyer9, A. B. Meyer21,H. Meyer65, J. Meyer21, S. Mikocki24, F. Mohamad Idris27,a13, A. Morozov15, N. Muhammad Nasir27, K. Müller70,V. Myronenko21,b24, K. Nagano59, Th. Naumann68, P. R. Newman6, C. Niebuhr21, A. Nikiforov21,a14, T. Nobe56,D. Notz21,†, G. Nowak24, R. J. Nowak63, J. E. Olsson21, Yu. Onishchuk29, D. Ozerov21, P. Pahl21, C. Pascaud42,G. D. Patel31, E. Paul9, E. Perez16, W. Perlanski63,a15, A. Petrukhin61, I. Picuric47, H. Pirumov21, D. Pitzl21,B. Pokorny49, N. S. Pokrovskiy2, R. Polifka49,a16, M. Przybycien25, V. Radescu22, N. Raicevic47, T. Ravdandorj60,P. Reimer48, E. Rizvi32, P. Robmann70, P. Roloff16,21, R. Roosen3, A. Rostovtsev38, M. Rotaru10, I. Rubinsky21,S. Rusakov37, M. Ruspa58, D. Šálek49, D. P. C. Sankey13, M. Sauter22, E. Sauvan34,a17, D. H. Saxon18,M. Schioppa12, W. B. Schmidke40,a18, S. Schmitt21,a , U. Schneekloth21, L. Schoeffel17, A. Schöning22,T. Schörner-Sadenius21, F. Sefkow21, L. M. Shcheglova39, R. Shevchenko29,a2, O. Shkola29,a19, S. Shushkevich21,Yu. Shyrma28, I. Singh11,b25, I. O. Skillicorn18, W. Słominski26,b26, A. Solano57, Y. Soloviev21,37, P. Sopicki24,D. South21, V. Spaskov15, A. Specka46, L. Stanco44, M. Steder21, N. Stefaniuk21, B. Stella52, A. Stern54, P. Stopa24,U. Straumann70, T. Sykora3,49, J. Sztuk-Dambietz20,a10, D. Szuba20, J. Szuba21, E. Tassi12, P. D. Thompson6,K. Tokushuku59,a20, J. Tomaszewska63,a21, D. Traynor32, A. Trofymov29,a11, P. Truöl70, I. Tsakov53,B. Tseepeldorj60,a22, T. Tsurugai67, M. Turcato20,a10, O. Turkot21,b24, J. Turnau24, T. Tymieniecka64,A. Valkárová49, C. Vallée34, P. Van Mechelen3, Y. Vazdik37, A. Verbytskyi40, O. Viazlo29, R. Walczak43,
123
580 Page 2 of 98 Eur. Phys. J. C (2015) 75:580
W. A. T. Wan Abdullah27, D. Wegener14, K. Wichmann21,b24, M. Wing33,a23, G. Wolf21, E. Wünsch21, S. Yamada59,Y. Yamazaki59,a24, J. Žácek49, N. Zakharchuk29,a11, A. F. Zarnecki63, L. Zawiejski24, O. Zenaiev21, Z. Zhang42,B. O. Zhautykov2, N. Zhmak28,b22, R. Žlebcík49, H. Zohrabyan66, F. Zomer42, D. S. Zotkin39
1 I. Physikalisches Institut der RWTH, Aachen, Germany2 Institute of Physics and Technology of Ministry of Education and Science of Kazakhstan, Almaty, Kazakhstan3 Inter-University Institute for High Energies ULB-VUB, Brussels and Universiteit Antwerpen, Antwerpen, Belgiumb1
4 Univerzitet u Banjoj Luci, Arhitektonsko-gradko-geodetski fakultet, Banja Luka, Bosnia-Herzegovina5 Universität Bielefeld, Bielefeld, Germany6 School of Physics and Astronomy, University of Birmingham, Birmingham, UKb2
7 INFN Bologna, Bologna, Italyb3
8 University and INFN Bologna, Bologna, Italyb3
9 Physikalisches Institut der Universität Bonn, Bonn, Germanyb4
10 National Institute for Physics and Nuclear Engineering (NIPNE), Bucharest, Romaniab5
11 Department of Physics, Panjab University, Chandigarh, India12 Physics Department and INFN, Calabria University, Cosenza, Italyb3
13 STFC, Rutherford Appleton Laboratory, Didcot, Oxfordshire, UKb2
14 Institut für Physik, TU Dortmund, Dortmund, Germanyb6
15 Joint Institute for Nuclear Research, Dubna, Russia16 CERN, Geneva, Switzerland17 CEA, DSM/Irfu, CE-Saclay, Gif-sur-Yvette, France18 School of Physics and Astronomy, University of Glasgow, Glasgow, UKb2
19 II. Physikalisches Institut, Universität Göttingen, Göttingen, Germany20 Institut für Experimentalphysik, Universität Hamburg, Hamburg, Germanyb6,b7
21 Deutsches Elektronen-Synchrotron DESY, Hamburg, Germany22 Physikalisches Institut, Universität Heidelberg, Heidelberg, Germanyb6
23 Institute of Experimental Physics, Slovak Academy of Sciences, Košice, Slovak Republicb8
24 The Henryk Niewodniczanski Institute of Nuclear Physics, Polish Academy of Sciences, Kraków, Polandb9,b16
25 Faculty of Physics and Applied Computer Science, AGH-University of Science and Technology, Kraków, Polandb9
26 Department of Physics, Jagellonian University, Kraków, Poland27 National Centre for Particle Physics, Universiti Malaya, Kuala Lumpur 50603, Malaysiab10
28 Institute for Nuclear Research, National Academy of Sciences, Kyiv, Ukraine29 Department of Nuclear Physics, National Taras Shevchenko University of Kyiv, Kyiv, Ukraine30 Department of Physics, University of Lancaster, Lancaster, UKb2
31 Department of Physics, University of Liverpool, Liverpool, UKb2
32 School of Physics and Astronomy, Queen Mary, University of London, London, UKb2
33 Physics and Astronomy Department, University College London, London, UKb2
34 Aix Marseille Université, CNRS/IN2P3, CPPM UMR 7346, Marseille 13288, France35 Departamento de Fisica Aplicada, CINVESTAV, Mérida, Yucatán, Mexicob11
36 Institute for Theoretical and Experimental Physics, Moscow, Russiab12
37 Lebedev Physical Institute, Moscow, Russia38 Institute for Information Transmission Problems RAS, Moscow, Russiab13
39 Skobeltsyn Institute of Nuclear Physics, Lomonosov Moscow State University, Moscow, Russiab14
40 Max-Planck-Institut für Physik, Munich, Germany41 Department of Physics, York University, Ontario M3J 1P3, Canadab15
42 LAL, Université Paris-Sud, CNRS/IN2P3, Orsay, France43 Department of Physics, University of Oxford, Oxford, UKb2
44 INFN Padova, Padova, Italyb3
45 Dipartimento di Fisica e Astronomia dell’ Università and INFN, Padua, Italyb3
46 LLR, Ecole Polytechnique, CNRS/IN2P3, Palaiseau, France47 Faculty of Science, University of Montenegro, Podgorica, Montenegrob17
48 Institute of Physics, Academy of Sciences of the Czech Republic, Praha, Czech Republicb18
49 Faculty of Mathematics and Physics, Charles University, Praha, Czech Republicb18
50 Department of Physics, McGill University, Montreal, QC H3A 2T8, Canadab15
51 Department of Particle Physics and Astrophysics, Weizmann Institute, Rehovot, Israel52 Dipartimento di Fisica, Università di Roma Tre and INFN Roma 3, Rome, Italy53 Institute for Nuclear Research and Nuclear Energy, Sofia, Bulgaria54 Raymond and Beverly Sackler Faculty of Exact Sciences, School of Physics, Tel Aviv University, Tel Aviv, Israelb19
55 Polytechnic University, Tokyo, Japanb20
56 Department of Physics, Tokyo Institute of Technology, Tokyo, Japanb20
57 Università di Torino and INFN, Turin, Italyb3
58 Università del Piemonte Orientale, Novara, and INFN, Turin, Italyb3
59 Institute of Particle and Nuclear Studies, KEK, Tsukuba, Japanb20
60 Institute of Physics and Technology of the Mongolian Academy of Sciences, Ulaanbaatar, Mongolia61 IPNL, Université Claude Bernard Lyon 1, CNRS/IN2P3, Villeurbanne, France62 Paul Scherrer Institut, Villigen, Switzerland
123

Eur. Phys. J. C (2015) 75:580 Page 3 of 98 580
63 Faculty of Physics, University of Warsaw, Warsaw, Poland64 National Centre for Nuclear Research, Warsaw, Poland65 Fachbereich C, Universität Wuppertal, Wuppertal, Germany66 Yerevan Physics Institute, Yerevan, Armenia67 Faculty of General Education, Meiji Gakuin University, Yokohama, Japanb20
68 Deutsches Elektronen-Synchrotron DESY, Zeuthen, Germany69 Institut für Teilchenphysik, ETH, Zurich, Switzerlandb21
70 Physik-Institut der Universität Zürich, Zurich, Switzerlandb21
† Deceased
Received: 22 June 2015 / Accepted: 29 September 2015© The Author(s) 2015. This article is published with open access at Springerlink.com
a e-mail: [email protected]
a1 Also at Max Planck Institute for Physics, Munich, Germany,External Scientific Member
a2 Member of National Technical University of Ukraine, KyivPolytechnic Institute, Kyiv, Ukraine
a3 Now at Department of Physics, Saint-Petersburg State University,Saint-Petersburg, Russia
a4 Also at Moscow Institute of Physics and Technology,Moscow, Russia
a5 Also at Łódz University, Polanda6 Now at Rockefeller University, New York, NY 10065, USAa7 Also at Rechenzentrum, Universität Wuppertal, Wuppertal, Ger-
manya8 Alexander von Humboldt Professor; also at DESY and University
of Oxforda9 Now at School of Physics and Astronomy, University of Birming-
ham, UKa10 Now at European X-ray Free-Electron Laser facility GmbH, Ham-
burg, Germanya11 Now at DESYa12 Now at LNF, Frascati, Italya13 Also at Agensi Nuklear Malaysia, 43000 Kajang, Bangi, Malaysiaa14 Now at Humboldt-Universität zu Berlin, Berlin, Germanya15 Member of Łódz University, Polanda16 Also at Department of Physics, University of Toronto, Toronto,
ON M5S 1A7, Canadaa17 Also at LAPP, Université de Savoie, CNRS/IN2P3, Annecy-le-
Vieux, Francea18 Now at BNL, USAa19 Member of National University of Kyiv-Mohyla Academy, Kyiv,
Ukrainea20 Also at University of Tokyo, Japana21 Now at Polish Air Force Academy in Deblina22 Also at Ulaanbaatar University, Ulaanbaatar, Mongoliaa23 Also at Universität Hamburg and supported by DESY and the
Alexander von Humboldt Foundationa24 Now at Kobe University, Japanb1 Supported by FNRS-FWO-Vlaanderen, IISN-IIKW and IWT and
by InteruniversityAttraction Poles Programme, Belgian SciencePolicy
b2 Supported by the UK Science and Technology Facilities Council,and formerly by the UK Particle Physics and Astronomy ResearchCouncil
b3 Supported by the Italian National Institute for Nuclear Physics(INFN)
b4 Supported by the German Federal Ministry for Education andResearch (BMBF), under contract No. 05 H09PDF
Abstract A combination is presented of all inclusive deepinelastic cross sections previously published by the H1 andZEUS collaborations at HERA for neutral and charged cur-
b5 Supported by the Romanian National Authority for ScientificResearch under the contract PN 09370101
b6 Supported by the Bundesministerium für Bildung und Forschung,FRG, under contract numbers 05H09GUF, 05H09VHC,05H09VHF, 05H16PEA
b7 Supported by the SFB 676 of the Deutsche Forschungsgemeinschaft(DFG)
b8 Supported by VEGA SR grant no. 2/7062/ 27b9 Supported by the National Science Centre under contract No. DEC-
2012/06/M/ST2/00428b10 Supported by HIR grant UM.C/625/1/HIR/149 and UMRG grants
RU006-2013, RP012A-13AFR and RP012B-13AFR from Univer-siti Malaya, and ERGS grant ER004-2012A from the Ministry ofEducation, Malaysia
b11 Supported by CONACYT, México, grant 48778-Fb12 Russian Foundation for Basic Research (RFBR), grant no
1329.2008.2 and Rosatomb13 Russian Foundation for Sciences, project no 14-50-00150b14 Supported by RF Presidential grant N 3042.2014.2 for the Leading
Scientific Schools and by the Russian Ministry of Education andScience through its grant for Scientific Research on High EnergyPhysics
b15 Supported by the Natural Sciences and Engineering Research Coun-cil of Canada (NSERC)
b16 Partially Supported by Polish Ministry of Science and Higher Edu-cation, grant DPN/N168/DESY/2009
b17 Partially Supported by Ministry of Science of Montenegro, no. 05-1/3-3352
b18 Supported by the Ministry of Education of the Czech Republic underthe project INGO-LG14033
b19 Supported by the Israel Science Foundationb20 Supported by the Japanese Ministry of Education, Culture, Sports,
Science and Technology (MEXT) and its grants for ScientificResearch
b21 Supported by the Swiss National Science Foundationb22 Supported by DESY, Germanyb23 Also funded by Max Planck Institute for Physics, Munich, Germany,
now at Sant Longowal Institute of Engineering and Technology,Longowal, Punjab, India
b24 Supported by the Alexander von Humboldt Foundationb25 Also funded by Max Planck Institute for Physics, Munich, Germany,
now at Sri Guru Granth Sahib World University, Fatehgarh Sahib,India
b26 Partially supported by the Polish National Science Centre projectsDEC-2011/01/B/ST2/03643 and DEC-2011/03/B/ST2/00220
123

580 Page 4 of 98 Eur. Phys. J. C (2015) 75:580
rent e± p scattering for zero beam polarisation. The data weretaken at proton beam energies of 920, 820, 575 and 460 GeVand an electron beam energy of 27.5 GeV. The data corre-spond to an integrated luminosity of about 1 fb−1 and spansix orders of magnitude in negative four-momentum-transfersquared, Q2, and Bjorken x . The correlations of the system-atic uncertainties were evaluated and taken into account forthe combination. The combined cross sections were inputto QCD analyses at leading order, next-to-leading order andat next-to-next-to-leading order, providing a new set of par-ton distribution functions, called HERAPDF2.0. In additionto the experimental uncertainties, model and parameterisa-tion uncertainties were assessed for these parton distribu-tion functions. Variants of HERAPDF2.0 with an alternativegluon parameterisation, HERAPDF2.0AG, and using fixed-flavour-number schemes, HERAPDF2.0FF, are presented.The analysis was extended by including HERA data on charmand jet production, resulting in the variant HERAPDF2.0Jets.The inclusion of jet-production cross sections made a simul-taneous determination of these parton distributions and thestrong coupling constant possible, resulting in αs(M2
Z ) =0.1183±0.0009(exp)±0.0005(model/parameterisation)±0.0012(hadronisation)+0.0037
−0.0030(scale). An extraction of xFγ Z3
and results on electroweak unification and scaling violationsare also presented.
1 Introduction
Deep inelastic scattering (DIS) of electrons1 on protons atcentre-of-mass energies of up to
√s � 320 GeV at HERA
has been central to the exploration of proton structure andquark–gluon dynamics as described by perturbative Quan-tum Chromo Dynamics (pQCD) [1]. The two collabora-tions, H1 and ZEUS, have explored a large phase spacein Bjorken x , xBj, and negative four-momentum-transfersquared, Q2. Cross sections for neutral current (NC) interac-tions have been published for 0.045 ≤ Q2 ≤ 50,000 GeV2
and 6 × 10⁻⁷ ≤ xBj ≤ 0.65 at values of the inelasticity,y = Q2/(sxBj), between 0.005 and 0.95. Cross sections forcharged current (CC) interactions have been published for200 ≤ Q2 ≤ 50,000 GeV2 and 1.3 × 10⁻² ≤ xBj ≤ 0.40 atvalues of y between 0.037 and 0.76.
HERA was operated in two phases: HERA I, from 1992 to2000, and HERA II, from 2002 to 2007. From 1994 onwards,and for all data used here, HERA operated with an elec-tron beam energy of Ee � 27.5 GeV. For most of HERA Iand II, the proton beam energy was Ep = 920 GeV, result-ing in the highest centre-of-mass energy of
√s � 320 GeV.
During the HERA I period, each experiment collected about
1 In this paper, the word “electron” refers to both electrons andpositrons, unless otherwise stated.
100 pb−1 of e+ p and 15 pb−1 of e− p data. These HERA Idata were the basis of a combination and pQCD analysis pub-lished previously [2]. During the HERA II period, each exper-iment added about 150 pb−1 of e+ p and 235 pb−1 of e− pdata. As a result, the H1 and ZEUS collaborations collectedtotal integrated luminosities of approximately 500 pb−1 each,divided about equally between e+ p and e− p scattering.The paper presented here is based on the combination ofall published H1 [3–10] and ZEUS [11–24] measurementsfrom both HERA I and II on inclusive DIS in NC and CCreactions. This includes data taken with proton beam ener-gies of Ep = 920, 820, 575 and 460 GeV correspondingto
√s �320, 300, 251 and 225 GeV. During the HERA II
period, the electron beam was longitudinally polarised. Thedata considered in this paper are cross sections corrected tozero beam polarisation as published by the collaborations.
The combination of the data and the pQCD analysis wereperformed using the packages HERAverager [25] and HER-AFitter [26,27]. The method [3,28] also allowed a model-independent demonstration of the consistency of the data.The correlated systematic uncertainties and global normal-isations were treated such that one coherent data set wasobtained. Since H1 and ZEUS employed different experi-mental techniques, using different detectors and methods ofkinematic reconstruction, the combination also led to a sig-nificantly reduced systematic uncertainty.
Within the framework of pQCD, the proton is describedin terms of parton density functions, f (x), which providethe probability to find a parton, either gluon or quark, with afraction x of the proton’s momentum. This probability is pre-dicted to depend on the scale at which the proton is probed,called the factorisation scale, μ2
f , which for inclusive DIS isusually taken as Q2. These functions are usually presented asparton momentum distributions, x f (x), and are called partondistribution functions (PDFs). The PDFs are convoluted withthe fundamental point-like scattering cross sections for par-tons to calculate cross sections. Perturbative QCD providesthe framework to evolve the PDFs to other scales once theyare provided at a starting scale. However, pQCD does not pre-dict the PDFs at the starting scale. They must be determinedby fits to data using ad hoc parameterisations.
The name HERAPDF stands for a pQCD analysis withinthe DGLAP [29–33] formalism. The xBj and Q2 dependencesof the NC and CC DIS cross sections from both the H1 andZEUS collaborations are used to determine sets of quark andgluon momentum distributions in the proton. The set of PDFsdenoted as HERAPDF1.0 [2] was based on the combinationof all inclusive DIS scattering cross sections obtained fromHERA I data. A preliminary set of PDFs, HERAPDF1.5 [34],was obtained using HERA I and selected HERA II data, someof which were still preliminary. In this paper, a new set ofPDFs, HERAPDF2.0, is presented, based on combined inclu-sive DIS cross sections from all of HERA I and HERA II.
123

Eur. Phys. J. C (2015) 75:580 Page 5 of 98 580
Several groups, JR [35], MSTW/MMHT [36,37], CTEQ/CT [38,39], ABM [40–42] and NNPDF [43,44], providePDF sets using HERA, fixed-target and hadron-collider data.The strength of the HERAPDF approach is that a singlecoherent high-precision data set containing NC and CC crosssections is used as input. The new combined data used forthe HERAPDF2.0 analysis span four orders of magnitude inQ2 and xBj. The availability of precision NC and CC crosssections over this large phase space allows HERAPDF touse only ep scattering data and thus makes HERAPDF inde-pendent of any heavy nuclear (or deuterium) corrections.The difference between the NC e+ p and e− p cross sectionsat high Q2, together with the high-Q2 CC data, constrainthe valence-quark distributions. The CC e+ p data especiallyconstrain the valence down-quark distribution in the protonwithout assuming strong isospin symmetry as done in theanalysis of deuterium data. The lower-Q2 NC data constrainthe low-x sea-quark distributions and through their preciselymeasured Q2 variations they also constrain the gluon distri-bution. A further constraint on the gluon distribution comesfrom the inclusion of NC data at different beam energies suchthat the longitudinal structure function is probed through they dependence of the cross sections [45].
The consistency of the input data allowed the determina-tion of the experimental uncertainties of the HERAPDF2.0parton distributions using rigorous statistical methods. Theuncertainties resulting from model assumptions and from thechoice of the parameterisation of the PDFs were consideredseparately.
Both H1 and ZEUS also published charm production crosssections, some of which were combined and analysed previ-ously [46], and jet production cross sections [47–51]. Thesedata were included to obtain the variant HERAPDF2.0Jets.The inclusion of jet cross sections allowed for a simultaneousdetermination of the PDFs and the strong coupling constant.
The paper is structured as follows. Section 2 gives anintroduction to the connection between cross sections andthe partonic structure of the proton. Section 3 introduces thedata used in the analyses presented here. Section 4 describesthe combination of data while Sect. 5 presents the resultsof the combination. Section 6 describes the pQCD analysisto extract PDFs from the combined inclusive cross sections.The PDF set HERAPDF2.0 and its variants are presentedin Sect. 7. In Sect. 8, results on electroweak unification aswell as scaling violations and the extraction of xFγ Z
3 arepresented. The paper closes with a summary.
2 Cross sections and parton distributions
The reduced NC deep inelastic e± p scattering cross sec-tions are given by a linear combination of generalised struc-ture functions. For unpolarised e± p scattering, reduced cross
sections after correction for QED radiative effects may beexpressed in terms of structure functions as
σ±r,NC = d2σ
e± pNC
dxBjdQ2 · Q4xBj
2πα2Y+= F2 ∓ Y−
Y+x F3 − y2
Y+FL,
(1)
where the fine-structure constant, α, which is defined at zeromomentum transfer, the photon propagator and a helicityfactor are absorbed in the definitions of σ±
r,NC and Y± =1 ± (1 − y)2. The overall structure functions, F2, FL andx F3, are sums of structure functions, FX, Fγ Z
X and FZX ,
relating to photon exchange, photon–Z interference andZ exchange, respectively, and depend on the electroweakparameters as [52]
F2 = F2 − κZve · Fγ Z2 + κ2
Z (v2e + a2
e ) · FZ2 ,
FL = FL − κZve · Fγ ZL + κ2
Z (v2e + a2
e ) · FZL , (2)
x F3 = −κZae · xFγ Z3 + κ2
Z · 2veae · xF Z3 ,
where ve and ae are the vector and axial-vector weak cou-plings of the electron to the Z boson, and κZ (Q2) =Q2/[(Q2 + M2
Z )(4 sin2 θW cos2 θW )]. In the analysis pre-sented here, electroweak effects were treated at leading order.The values of sin2 θW = 0.23127 and MZ = 91.1876 GeVwere used for the electroweak mixing angle and the Z -bosonmass [52].
At low Q2, i.e. Q2 � M2Z , the contribution of Z exchange
is negligible and
σ±r,NC = F2 − y2
Y+FL. (3)
The contribution of the term containing the longitudinalstructure function FL is only significant for values of y largerthan approximately 0.5.
In the analysis presented in this paper, the full formulaeof pQCD at the relevant order in the strong coupling, αs ,are used. However, to demonstrate the sensitivity of the data,it is useful to discuss the simplified equations of the QuarkParton Model (QPM), where gluons are not present and FL =0 [53]. In the QPM, the kinematic variable xBj is equal to thefractional momentum of the struck quark, x . The structurefunctions in Eq. 2 become
(F2, Fγ Z2 , FZ
2 ) ≈ [(e2u, 2euvu, v
2u + a2
u)(xU + xU )
+ (e2d , 2edvd , v
2d + a2
d)(xD + x D)],(xFγ Z
3 , xF Z3 ) ≈ 2[(euau, vuau)(xU − xU )
+ (edad , vdad)(xD − x D)],
(4)
where eu and ed denote the electric charge of up- and down-type quarks, while vu,d and au,d are the vector and axial-vector weak couplings of the up- and down-type quarks tothe Z boson. The terms xU , xD, xU and x D denote the sums
123

580 Page 6 of 98 Eur. Phys. J. C (2015) 75:580
of parton distributions for up-type and down-type quarks andanti-quarks, respectively. Below the b-quark mass threshold,these sums are related to the quark distributions as follows
xU = xu + xc, xU = xu + xc,
xD = xd + xs, x D = xd + xs,(5)
where xs and xc are the strange- and charm-quark distri-butions. Assuming symmetry between the quarks and anti-quarks in the sea, the valence-quark distributions can beexpressed as
xuv = xU − xU , xdv = xD − x D. (6)
It follows from Eq. 1 that the structure function x F3 canbe determined from the difference between the e+ p and e− preduced cross sections:
x F3 = Y+2Y−
(σ−r,NC − σ+
r,NC). (7)
Equations 2, 4 and 6 demonstrate that in the QPM, x F3
is directly related to the valence-quark distributions. In theHERA kinematic range, its dominant contribution is fromthe photon–Z exchange interference and the simple relation
xFγ Z3 ≈ x
3(2uv + dv) (8)
emerges. The measurement of xFγ Z3 therefore provides
access to the lower-x behaviour of the valence-quark distri-bution, under the assumption that sea-quark and anti-quarkdistributions are the same.
The reduced cross sections for inclusive unpolarised CCe± p scattering are defined as
σ±r,CC = 2πxBj
G2F
[M2
W + Q2
M2W
]2d2σ
e± pCC
dxBjdQ2 . (9)
The values of GF = 1.16638 × 10⁻⁵ GeV−2 and MW =80.385 GeV [52] were used for the Fermi constant and W -boson mass. In analogy to Eq. 1, CC structure functions aredefined such that
σ±r,CC = Y+
2W±
2 ∓ Y−2xW±
3 − y2
2W±
L . (10)
In the QPM, W±L = 0 and W±
2 , xW±3 represent sums and
differences of quark and anti-quark distributions, dependingon the charge of the lepton beam:
W+2 ≈ xU + xD, xW+
3 ≈ xD − xU ,
W−2 ≈ xU + x D, xW−
3 ≈ xU − x D.(11)
From these equations, it follows that
σ+r,CC ≈ (xU + (1 − y)2xD),
σ−r,CC ≈ (xU + (1 − y)2x D).
(12)
The combination of NC and CC measurements makes it pos-sible to determine both the combined sea-quark distributions,xU and x D, and the valence-quark distributions, xuv andxdv .
The relations within the QPM illustrate in a simple waywhich data contribute which information. However, the par-ton distributions are determined by a fit to the xBj andQ2 dependence of the new combined data using the lin-ear DGLAP equations [29–33] at leading order (LO), next-to-leading order (NLO) and next-to-next-to-leading order(NNLO) in pQCD. These are convoluted with coefficientfunctions (matrix elements) at the appropriate order [54,55].Already at LO, the gluon PDF enters the equations givingrise to logarithmic scaling violations which make the partondistributions depend on the scale of the process. This factori-sation scale, μ2
f , is taken as Q2 and the experimentally mea-sured scaling violations determine the gluon distribution.2
3 Measurements
3.1 Detectors
The H1 [56–58] and ZEUS [59–62] detectors were bothmulti-purpose detectors with an almost 4π hermetic cov-erage.3 They were built following similar physics consid-erations but the collaborations opted for different technicalsolutions resulting in slightly different capabilities [63]. Thediscussion here focuses on general ideas; details of the con-struction and performance are not discussed.
In both detectors, the calorimeters had an inner part tomeasure electromagnetic energy and identify electrons andan outer, less-segmented, part to measure hadronic energyand determine missing energy. Both main calorimeters weredivided into barrel and forward sections. The H1 collabora-tion chose a liquid-argon calorimeter while the ZEUS col-laboration opted for a uranium–scintillator device. Thesechoices are somewhat complementary. The liquid-argontechnology allowed a finer segmentation and thus the identi-fication of electrons down to lower energies. The uranium–scintillator calorimeter was intrinsically “compensating”
2 The definition of what is meant by LO can differ; it can be taken tomean O(1) in αs , or it can be taken to mean the first non-zero order.For example, the longitudinal structure function FL is zero at O(1) suchthat its first non-zero order is O(αs ). This is what is meant by LO hereunless otherwise stated. Higher orders follow suit such that at NLO,F2 has coefficient functions calculated up to O(αs), whereas FL hascoefficient functions calculated up to O(α2
s ).3 Both experiments used a right-handed Cartesian coordinate system,with the Z axis pointing in the proton beam direction, referred to asthe “forward direction”, and the X axis pointing towards the centre ofHERA. The coordinate origins were at the nominal interaction points.The polar angle, θ , was measured with respect to the proton beam direc-tion.
123

Eur. Phys. J. C (2015) 75:580 Page 7 of 98 580
making jet studies easier. In the backward region, ZEUS alsoopted for a uranium–scintillator device. The H1 collabora-tion chose a lead–scintillating fibre or so-called “spaghetti”calorimeter. The backward region is particularly importantto identify electrons in events with Q2 < 100 GeV2.
Both detectors were operated with a solenoidal magneticfield. The field strength was 1.16 and 1.43 T within the track-ing volumes of the H1 and ZEUS detectors, respectively.The main tracking devices were in both cases cylindricaldrift chambers. The H1 device consisted of two concentricdrift chambers while ZEUS featured one large chamber. Bothtracking systems were augmented with special devices in theforward and backward region. Over time, both collabora-tions upgraded their tracking systems by installing siliconmicrovertex detectors to enhance the capability to identifyevents with heavy-quark production. In the backward direc-tion, the vertex detectors were also important to identify theelectrons in low-Q2 events.
During the HERA I running period, special devices tomeasure very backward electrons were operated and eventswith very low Q2 were reconstructed. This became impossi-ble after the luminosity upgrade for HERA II due to the place-ment of final-focus magnets further inside the detectors. Thisalso required some significant changes in both main detec-tors. Detector elements had to be retracted, and as a resultthe acceptance for low-Q2 events in the main detectors wasreduced.
Both experiments measured the luminosity using theBethe–Heitler reaction ep → eγ p. In HERA I, H1 and ZEUSboth had photon taggers positioned about 100 m down theelectron beam line. For the higher luminosity of the HERA IIperiod, both H1 [8,64,65] and ZEUS [66–68] had to upgradetheir luminosity detectors and analysis methods. The uncer-tainties on the integrated luminosities were typically about2 %.
3.2 Reconstruction of kinematics
The usage of different reconstruction techniques, due to dif-ferences in the strengths of the detector components of thetwo experiments, contributes to the reduction of system-atic uncertainties when combining data sets. The choice ofthe most appropriate kinematic reconstruction method for agiven phase-space region and experiment is based on reso-lution, possible biases of the measurements and effects dueto initial- or final-state radiation. The different methods aredescribed in the following.
The deep inelastic ep scattering cross sections of the inclu-sive neutral and charged current reactions depend on thecentre-of-mass energy,
√s, and on the two kinematic vari-
ables Q2 and xBj. The variable xBj is related to y, Q2 and sthrough the relationship xBj = Q2/(sy). The HERA colliderexperiments were able to determine the NC event kinemat-
ics from the scattered electron, e, or from the hadronic finalstate, h, or from a combination of the two.
The “electron method” was applied to NC scatteringevents for which the quantities y and Q2 were calcu-lated using only the variables measured for the scatteredelectron:
ye = 1 − �e
2Ee, Q2
e = P2T,e
1 − ye, xe = Q2
e
sye, (13)
where �e = E ′e(1−cos θe), E ′
e is the energy of the scatteredelectron, θe is its angle with respect to the proton beam, andPT,e is its transverse momentum.
The “hadron method” was applied to CC scattering events.The reconstruction of the hadronic final state h allowed theusage of similar relations [69]:
yh = �h
2Ee, Q2
h = P2T,h
1 − yh, xh = Q2
h
syh, (14)
where �h = (E − PZ)h = ∑i (Ei − pZ,i ) is the hadronic
E−PZ variable with the sum extending over the energies, Ei ,and the longitudinal components of the momentum, pZ,i ofthe reconstructed hadronic final-state particles, i . The quan-tity PT,h = ∣∣∑
i pT,i
∣∣ is the total transverse momentumof the hadronic final state with pT,i being the transverse-momentum vector of the particle i . A hadronic scatteringangle, θh , was defined as
tanθh
2= �h
PT,h. (15)
In the framework of the QPM, θh corresponds to the directionof the struck quark.
In the “sigma method” [70], the total E − PZ variable,
E − PZ = E ′e(1 − cos θe) +
∑i
(Ei − pZ,i ) = �e + �h,
(16)
was introduced. For events without initial- or final-state radi-ation, the relation E − PZ = 2Ee holds. Thus, Eqs. 13 and14 become
y� = �h
E − PZ, Q2
� = P2T,e
1 − y�, x� = Q2
�
sy�. (17)
An extension of the sigma method [3,4] introduced the vari-ables
y�′ = y�, Q2�′ = Q2
�,
x�′ = Q2�
2Ep(E − PZ)y�= Q2
�
2Ep�h.
(18)
This method allowed radiation at the lepton vertex to be takeninto account by replacing the electron beam energy in thecalculation of x�′ in a way similar to its replacement in thecalculation of y� .
123

580 Page 8 of 98 Eur. Phys. J. C (2015) 75:580
In the hybrid “e-sigma method” [5,12,70], Q2e and x� are
used to reconstruct the event kinematics as
ye� = Q2e
sx�
= 2Ee
E − PZy�, Q2
e� = Q2e, xe� = x�.
(19)
The “double-angle method” [71,72] is used to reconstructQ2 and xBj from the electron and hadronic scattering anglesas
yDA = tan (θh/2)
tan (θe/2) + tan (θh/2),
Q2DA = 4E 2
e × cot (θe/2)
tan (θe/2) + tan (θh/2), (20)
xDA = Q2DA
syDA.
This method is largely insensitive to hadronisation effects.To first order, it is also independent of the detector energyscales. However, the hadronic angle is experimentally not aswell determined as the electron angle due to particle loss inthe beampipe.
In the “PT method” of reconstruction [73], the well-measured electron variables are used to obtain a good event-by-event estimate of the loss of hadronic energy by employ-ing δPT = PT,h/PT,e. This improves both the resolution anduncertainties on the reconstructed y and Q2. The PT methoduses all measured variables to optimise the resolution overthe entire kinematic range measured. A variable θPT is intro-duced as
tanθPT
2= �PT
PT,e, where
�PT = 2EeC(θh, PT,h, δPT ) · �h
�e + C(θh, PT,h, δPT ) · �h.
(21)
The variable θPT is then substituted for θh in the formulaefor the double-angle method to determine xBj, y and Q2.The detector-specific function, C , is calculated using MonteCarlo simulations as �true,h/�h , depending on θh , PT,h andδPT .
3.3 Inclusive data samples
A summary of the 41 data sets used in the combination ispresented in Table 1. From 1994 onwards, HERA was oper-ated with an electron beam energy of Ee � 27.5 GeV. In thefirst years, until 1997, the proton beam energy, Ep, was setto 820 GeV. In 1998, it was increased to 920 GeV. In 2007,it was lowered to 575 GeV and 460 GeV. The values for thecentre-of-mass energies given in Table 1 are those for whichthe cross sections are quoted in the individual publications.The two collaborations did not always choose the same ref-erence values for
√s for the same Ep. The methods of recon-
struction used by H1 and ZEUS for the individual data sets
are also given in the table. The integrated luminosities for agiven period as provided by the collaborations can be differ-ent. One reason is the fact that H1 quotes luminosities for thedata within the Z -vertex acceptance and ZEUS luminositiesare given without any acceptance cut.
The very low-Q2 region is covered by data from bothexperiments taken during the HERA I period. The lowest,Q2 ≥ 0.045 GeV2, data come from measurements withthe ZEUS detector using special tagging devices. They arenamed ZEUS BPT in Table 1. During the course of this anal-ysis, it was discovered that in the HERA I analysis [2], valuesgiven for F2 were erroneously treated as reduced cross sec-tions. This was corrected for the analysis presented in thispaper. All other individual data sets from HERA I were usedin the new combination exactly as in the previously publishedcombination [2].
The Q2 range from 0.2 to 1.5 GeV2 was covered usingspecial HERA I runs, in which the interaction vertex positionwas shifted forward, bringing backward scattered electronswith small scattering angles into the acceptance of the detec-tors [3,13,74]. The lowest-Q2 values for these shifted-vertexdata were reached using events in which the electron energywas reduced by initial-state radiation [3].
The Q2 ≥ 1.5 GeV2 range was covered by HERA I andHERA II data in various configurations. The high-statisticsHERA II data sets increase the accuracy at high Q2, particu-larly for e− p scattering, for which the integrated luminosityfor HERA I was very limited.
The 2007 running periods with lowered proton energies [9,10,24] were included in the combination and provide datawith reduced
√s and Q2 up to 800 GeV2. These data were
originally taken to measure FL.
3.4 Data on charm, beauty and jet production
The QCD analyses presented in Sect. 6 also used selectedresults on heavy-quark and jet production.
The charm production cross sections were taken from apublication [46] in which data from nine data sets publishedby H1 and ZEUS, covering both the HERA I and II periods,were combined. The beauty production cross sections weretaken from two publications, one from ZEUS [75] and onefrom H1 [76]. The heavy-quark events form small subsets ofthe inclusive data. Correlations between the charm and theinclusive data are small and were not taken into account.
The data on jet production cross sections were takenfrom selected publications: ZEUS inclusive-jet productiondata from HERA I [47], ZEUS dijet production data fromHERA II [48], H1 inclusive-jet production data at lowQ2 [49] and high Q2 from HERA I [50] and HERA II [51].The HERA II H1 publication provides inclusive-jet, dijet andtrijet cross sections normalised to the inclusive NC DIS crosssections in the respective Q2 range. This largely reduces the
123
Eur. Phys. J. C (2015) 75:580 Page 9 of 98 580
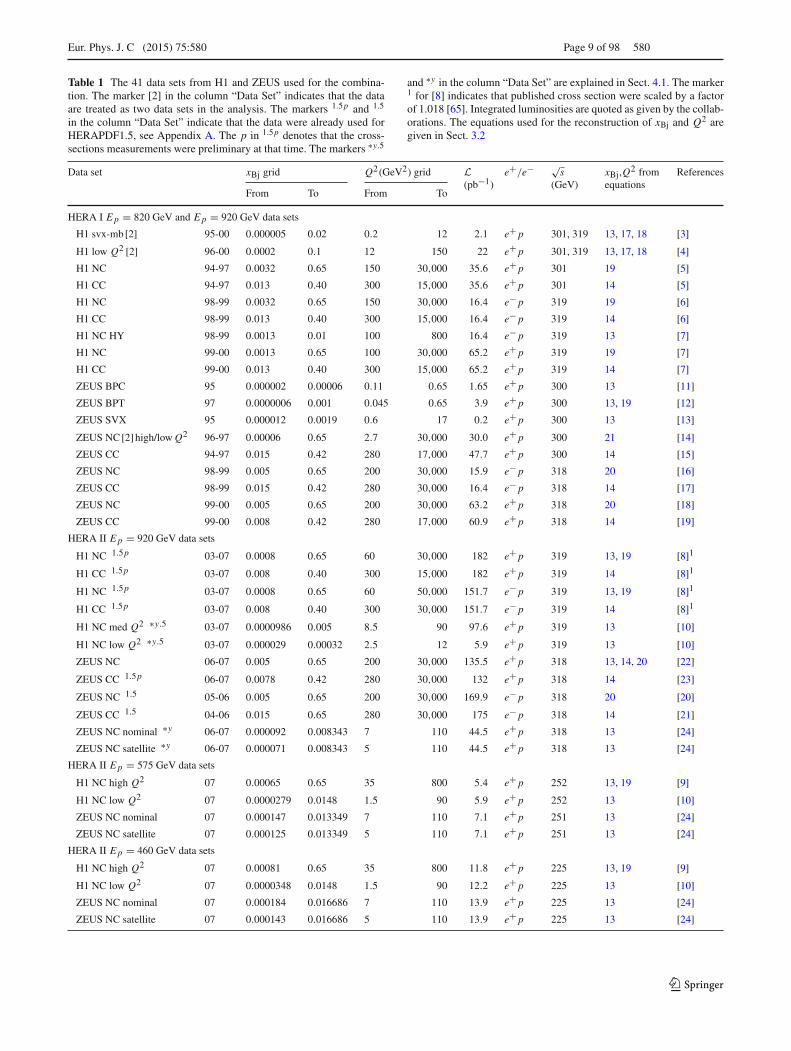
Table 1 The 41 data sets from H1 and ZEUS used for the combina-tion. The marker [2] in the column “Data Set” indicates that the dataare treated as two data sets in the analysis. The markers 1.5p and 1.5
in the column “Data Set” indicate that the data were already used forHERAPDF1.5, see Appendix A. The p in 1.5p denotes that the cross-sections measurements were preliminary at that time. The markers ∗y.5
and ∗y in the column “Data Set” are explained in Sect. 4.1. The marker1 for [8] indicates that published cross section were scaled by a factorof 1.018 [65]. Integrated luminosities are quoted as given by the collab-orations. The equations used for the reconstruction of xBj and Q2 aregiven in Sect. 3.2
Data set xBj grid Q2(GeV2) grid L(pb−1)
e+/e− √s
(GeV)xBj,Q2 fromequations
References
From To From To
HERA I Ep = 820 GeV and Ep = 920 GeV data sets
H1 svx-mb [2] 95-00 0.000005 0.02 0.2 12 2.1 e+ p 301, 319 13, 17, 18 [3]
H1 low Q2 [2] 96-00 0.0002 0.1 12 150 22 e+ p 301, 319 13, 17, 18 [4]
H1 NC 94-97 0.0032 0.65 150 30,000 35.6 e+ p 301 19 [5]
H1 CC 94-97 0.013 0.40 300 15,000 35.6 e+ p 301 14 [5]
H1 NC 98-99 0.0032 0.65 150 30,000 16.4 e− p 319 19 [6]
H1 CC 98-99 0.013 0.40 300 15,000 16.4 e− p 319 14 [6]
H1 NC HY 98-99 0.0013 0.01 100 800 16.4 e− p 319 13 [7]
H1 NC 99-00 0.0013 0.65 100 30,000 65.2 e+ p 319 19 [7]
H1 CC 99-00 0.013 0.40 300 15,000 65.2 e+ p 319 14 [7]
ZEUS BPC 95 0.000002 0.00006 0.11 0.65 1.65 e+ p 300 13 [11]
ZEUS BPT 97 0.0000006 0.001 0.045 0.65 3.9 e+ p 300 13, 19 [12]
ZEUS SVX 95 0.000012 0.0019 0.6 17 0.2 e+ p 300 13 [13]
ZEUS NC [2] high/low Q2 96-97 0.00006 0.65 2.7 30,000 30.0 e+ p 300 21 [14]
ZEUS CC 94-97 0.015 0.42 280 17,000 47.7 e+ p 300 14 [15]
ZEUS NC 98-99 0.005 0.65 200 30,000 15.9 e− p 318 20 [16]
ZEUS CC 98-99 0.015 0.42 280 30,000 16.4 e− p 318 14 [17]
ZEUS NC 99-00 0.005 0.65 200 30,000 63.2 e+ p 318 20 [18]
ZEUS CC 99-00 0.008 0.42 280 17,000 60.9 e+ p 318 14 [19]
HERA II Ep = 920 GeV data sets
H1 NC 1.5p 03-07 0.0008 0.65 60 30,000 182 e+ p 319 13, 19 [8]1
H1 CC 1.5p 03-07 0.008 0.40 300 15,000 182 e+ p 319 14 [8]1
H1 NC 1.5p 03-07 0.0008 0.65 60 50,000 151.7 e− p 319 13, 19 [8]1
H1 CC 1.5p 03-07 0.008 0.40 300 30,000 151.7 e− p 319 14 [8]1
H1 NC med Q2 ∗y.5 03-07 0.0000986 0.005 8.5 90 97.6 e+ p 319 13 [10]
H1 NC low Q2 ∗y.5 03-07 0.000029 0.00032 2.5 12 5.9 e+ p 319 13 [10]
ZEUS NC 06-07 0.005 0.65 200 30,000 135.5 e+ p 318 13, 14, 20 [22]
ZEUS CC 1.5p 06-07 0.0078 0.42 280 30,000 132 e+ p 318 14 [23]
ZEUS NC 1.5 05-06 0.005 0.65 200 30,000 169.9 e− p 318 20 [20]
ZEUS CC 1.5 04-06 0.015 0.65 280 30,000 175 e− p 318 14 [21]
ZEUS NC nominal ∗y 06-07 0.000092 0.008343 7 110 44.5 e+ p 318 13 [24]
ZEUS NC satellite ∗y 06-07 0.000071 0.008343 5 110 44.5 e+ p 318 13 [24]
HERA II Ep = 575 GeV data sets
H1 NC high Q2 07 0.00065 0.65 35 800 5.4 e+ p 252 13, 19 [9]
H1 NC low Q2 07 0.0000279 0.0148 1.5 90 5.9 e+ p 252 13 [10]
ZEUS NC nominal 07 0.000147 0.013349 7 110 7.1 e+ p 251 13 [24]
ZEUS NC satellite 07 0.000125 0.013349 5 110 7.1 e+ p 251 13 [24]
HERA II Ep = 460 GeV data sets
H1 NC high Q2 07 0.00081 0.65 35 800 11.8 e+ p 225 13, 19 [9]
H1 NC low Q2 07 0.0000348 0.0148 1.5 90 12.2 e+ p 225 13 [10]
ZEUS NC nominal 07 0.000184 0.016686 7 110 13.9 e+ p 225 13 [24]
ZEUS NC satellite 07 0.000143 0.016686 5 110 13.9 e+ p 225 13 [24]
123

580 Page 10 of 98 Eur. Phys. J. C (2015) 75:580
correlations with the H1 inclusive DIS reduced cross sec-tions. The HERA I H1 high-Q2 jet data are similarly nor-malised. The other ZEUS and H1 jet data sets are small sub-samples of the respective inclusive sample; correlations aresmall and are thus ignored.
For the heavy-quark and jet data sets used, the statistical,uncorrelated systematic and correlated systematic uncertain-ties were used as published.
4 Combination of the inclusive cross sections
In order to combine the published cross sections from the 41data sets listed in Table 1, they were translated onto commongrids and averaged.
4.1 Common√s values, common (xBj, Q2) grids and
translation of data
The data were taken with several Ep values and the double-differential cross sections were published by the two experi-ments for different reference
√s and (xBj, Q2) grids. In order
to average a set of data points, the points had to be translatedto common
√scom values and common (xBj,grid, Q2
grid) grids.The following choices were made.
Three common centre-of-mass values,√scom,i , were cho-
sen to combine data onto two common grids:
Ep = 920 GeV → √scom,1 = 318 GeV → grid 1,
Ep = 820 GeV → √scom,1 = 318 GeV → grid 1,
Ep = 575 GeV → √scom,2 = 251 GeV → grid 2,
Ep = 460 GeV → √scom,3 = 225 GeV → grid 2.
Exceptions were made for data with Ep = 820 GeV and y ≥0.35. These cross sections were not translated to
√scom,1,
but were kept separately in grid 1 in order to retain their ydependence.
The two grids have a different structure in y such that thecorrections due to translation were minimised. The grids aredepicted in Fig. 1. For a given data point with
√scom,1, the
grid point was in general chosen to be closest in Q2 and thenin xBj. However, for some data points, the grid point closestin y was chosen. This occurs for data sets marked with ∗y or∗y.5 in Table 1. The markers indicate that it happens for ally or y > 0.5, respectively. For a given data point at
√scom,2
or√scom,3, the grid point closest in Q2 and then closest in
y was always chosen.In most of the phase space, separate measurements from
the same data set were not translated to the same grid point.Only 9 out of 1307 grid points accumulated two and in onecase three points from the same data set. Up to 10 data setswere available for a given process. The vast majority of gridpoints accumulated data from both H1 and ZEUS measure-
-710 -610 -510 -410 -310 -210 -110 1-210
-110
1
10
210
310
410
510
Bjx
2/G
eV2
Q
H1 and ZEUS
Fig. 1 The points of the two grids used for the combination. Grid 1(open circles) was used for data with
√scom,1 = 318 GeV. Grid 2 (dots)
was used for data with√scom,2 = 251 GeV or
√scom,3 = 225 GeV.
The latter grid has a finer binning in xBj in accordance with its specialstructure in y
ments; the typical case is six measurements from six differentdata sets. However, 22 % of all grid points have only one mea-surement, predominantly at low Q2. For Q2 above 3.5 GeV2,only 13 % of the grid points have only one measurement.
For the translation of the cross-section values, predic-tions for the ratios of the double-differential cross sectionat the (xBj, Q2) and
√s where the measurements took place,
and the (xBj,grid, Q2grid) to which they were translated, were
needed. These predictions, Tgrid, were obtained from the datathemselves by performing fits to the data using the HER-AFitter [26,27] tool. For Q2 ≥ 3 GeV2, a next-to-leading-order QCD fit using the DGLAP formalism was performed.4
In addition, a fit using the fractal model5 [3,77] was per-formed for Q2 ≤ 4.9 GeV2. For Q2 < 3 GeV2, the fit tothe fractal model was used6 to obtain factors Tgrid,FM. ForQ2 > 4.9 GeV2, the QCD fit was used to provide Tgrid,QCD.For 3 ≤ Q2 ≤ 4.9 GeV2, the factors were averaged asTgrid = Tgrid,FM(1− (Q2 −3)/1.9)+Tgrid,QCD(Q2 −3)/1.9where Q2 is in GeV2. The upper edge of the application ofthe fractal fit was varied between 3 GeV2 and 5 GeV2; theeffect was negligible.
4 As a cross check, predictions using HERAPDF1.0 were used instead.The induced changes were negligible.5 The ansatz of the fractal model is based on the self-similar propertiesin xBj and Q2 of the proton structure function at low xBj. They are rep-resented by two continuous, variable and correlated fractal dimensions.6 A cross check was performed using the colour dipole model [78] asimplemented in HERAFitter. The results did not change significantly.
123

Eur. Phys. J. C (2015) 75:580 Page 11 of 98 580
4.2 Averaging cross sections
The original double-differential cross-section measurementswere published with their statistical and systematic uncer-tainties. The systematic uncertainties were classified as eitherpoint-to-point correlated or point-to-point uncorrelated. Foreach data set, all uncorrelated systematic uncertainties wereadded in quadrature before averaging. Correlated systematicuncertainties were kept separately. Some of the systematicuncertainties were originally reported as asymmetric. Theywere symmetrised by the collaborations before entering theaveraging procedure.
The averaging of the data points was performed using theHERAverager [25] tool which is based on a χ2 minimisationmethod [3]. This method imposes that there is one and onlyone correct value for the cross section of each process at eachpoint of the phase space. These values are estimated by opti-mising a vector, m, which is the result of the averaging forthe cross sections. The χ2 definition used takes into accountthe correlated and uncorrelated systematic uncertainties ofthe H1 and ZEUS cross-section measurements and allowsfor shifts of the data to accommodate the correlated uncer-tainties. For a single data set, ds, the χ2 is defined as
χ2exp,ds (m, b)
=ds∑i
+b∑j
=∑i
[mi −∑
j γi,dsj mib j −μi,ds
]2
δ2i,ds,stat μ
i,ds(mi −∑
j γi,dsj mib j
)+(δi,ds,uncor mi )2
+∑j
b2j , (22)
where μi,ds is the measured value at the point i and γi,dsj ,
δi,ds,stat and δi,ds,uncor are the relative correlated systematic,relative statistical and relative uncorrelated systematic uncer-tainties, respectively. For the reduced cross-section mea-surements, μi,ds = σ
i,dsr , i runs over all points on the
(xBj,grid, Q2grid) plane for which a measurement exists in ds.
The components b j of the vector b represent correlated shiftsof the cross sections in units of sigma of the respective corre-lated systematic uncertainties; the summations over j extendover all correlated systematic uncertainties.
The leading systematic uncertainties on the cross-sectionmeasurements used for the combination arose from theuncertainties on the acceptance corrections and luminos-ity determinations. Thus, both the correlated and uncorre-lated systematic uncertainties are multiplicative in nature,i.e. they increase proportionally to the central values. InEq. 22, the multiplicative nature of these uncertainties istaken into account by multiplying the relative errors γ
i,dsj
and δi,ds,uncor by the estimate mi . The denominator in thefirst right-hand-side term in Eq. 22 contains an estimate of thesquared statistical uncertainty of the cross-section measure-ment, δ2
i,ds,statμi,ds(mi−∑
j γi,dsj mib j ), which is assumed7
to scale with the expected number of events in bin i , as cal-culated from mi . Corrections due to the shifts to accommo-date the correlated systematic uncertainties are introducedthrough the term
∑j γ
i,dsj mib j .
For several data sets, a total χ2 function is defined as
χ2tot =
∑ds
ds∑i
+b∑j
, (23)
with∑ds
i and∑b
j as introduced for a single measurement in
Eq. 22. The total χ2 function in Eq. 23 can be approximatedby
χ2tot ≈ χ2
min
+∑
i=1,NM
[mi − ∑
j γij m
ib′j −μi
]2
δ2i,stat μ
i(mi −∑
j γij m
ib′j
)+(δi,uncor mi )2
+∑j
(b′j )
2, (24)
where χ2min is the minimum of χ2
tot, NM is the number ofcombined measurements, μi is the average value at point i ,and γ i
j , δi,stat and δi,uncor are its relative correlated system-atic, relative statistical and relative uncorrelated systematicuncertainties, respectively. To determine the average of thedata as defined in Eq. 24, an iterative procedure is used. Forthe first iteration, for all terms in Eqs. 22 and 24 related touncertainties or correlated shifts of the data, the expectationvaluesmi are replaced by μi,ds and the term
∑j γ
ij m
ib′j is set
to zero for the calculation of the statistical uncertainty.8 Theaverage values μi and systematic shifts b j are determinedanalytically from a system of linear equations ∂χ2
tot/∂mi = 0
and ∂χ2tot/∂b j = 0. For the next iterations, the average val-
ues μi from the previous iteration are used.9 The procedureconverges after two iterations. The shifts b′
j , also called nui-sance parameters, are related to the original shifts b j through
7 For the DIS cross-section measurements, the background contribu-tions were small and thus it is justified to take the square root of thenumber of events as the statistical uncertainty.8 For the first iteration, terms are modified as γ
i,dsj mi →
γi,dsj μi,ds , δi,ds,uncor mi → δi,ds,uncor μi,ds and δ2
i,ds,stat μi,ds
(mi −∑
j γi,dsj mi b j
)→ (δi,ds,stat μ
i,ds)2, respectively.
9 For subsequent iterations, terms are modified as γi,dsj mi →
γi,dsj μi , δi,ds,uncor mi → δi,ds,uncor μi and δ2
i,ds,stat μi,ds
(mi −∑
j γi,dsj mi b j
)→ δ2
i,ds,stat μi,ds
(μi − ∑
j γi,dsj μi b j
), respectively.
123

580 Page 12 of 98 Eur. Phys. J. C (2015) 75:580
an orthogonal transformation which is also used to determineγ ij [2].
The ratio of χ2min and the number of degrees of freedom,
χ2min/d.o.f., is a measure of the consistency of the data sets.
The number d.o.f. is the difference between the total numberof measurements and the number of averaged points NM .
Some systematic uncertainties γ ij , which were treated as
having point-to-point correlations, may be common for sev-eral data sets. A full table of the correlations of the systematicuncertainties across the data sets can be found elsewhere [79].The systematic uncertainties were in general treated as inde-pendent between H1 and ZEUS. However, an overall normal-isation uncertainty of 0.5 %, due to uncertainties on higher-order corrections to the Bethe–Heitler cross-section calcula-tions, was assumed for all data sets which were normalisedwith data from the luminosity monitors.
All the NC and CC cross-section data from H1 and ZEUSare combined in one simultaneous minimisation. Therefore,the resulting shifts of the correlated systematic uncertaintiespropagate coherently to both NC and CC data. Even in caseswhere there are data only from a single data set, the pro-cedure can still produce shifts with respect to the originalmeasurement due to the correlation of systematic uncertain-ties.
4.3 Combination procedure
The combination procedure is iterative. Each iteration hastwo steps:
1. the data are translated to the common√scom values and
(xBj,grid, Q2grid) grids as described in Sect. 4.1;
2. the data are averaged as described in Sect. 4.2.
In the first iteration, the fits to provide the predictionsneeded for the translation were performed on the uncom-bined data. Starting with the second iteration, the fits wereperformed on combined data. The process was stopped afterthe third iteration. An investigation showed that further itera-tions did not induce significant changes in the resulting aver-aged cross sections.
4.4 Consistency of the data
The 2927 published cross sections were combined to become1307 combined cross-section measurements. For the result-ing 1620 degrees of freedom, a χ2
min = 1687 was obtained.For data points k contributing to point i on the (xBj,grid,
Q2grid), pulls pi,k were defined as
pi,k =μi,k − μi
(1 − ∑
j γi,kj b′
j
)√
�2i,k − �2
i
, (25)
where �i,k and �i are the statistical and uncorrelated sys-tematic uncertainties added in quadrature for the point k andthe average, respectively. The pull distribution for the dif-ferent data sets is shown Fig. 2. The RMS values of thesedistributions are close to unity, indicating good consistencyof all data.
4.5 Procedural uncertainties
Procedural uncertainties are introduced by the choices madefor the combination. Three kinds of such uncertainties wereconsidered.
4.5.1 Multiplicative versus additive treatment of systematicuncertainties
The χ2 definition from Eq. 22 treats all systematic uncertain-ties as multiplicative, i.e. their size is expected to be propor-tional to the “true” values m. While this is a good assumptionfor normalisation uncertainties, this might not be the casefor other uncertainties. Therefore an alternative combinationwas performed, in which only the normalisation uncertain-ties were taken as multiplicative, while all other uncertaintieswere treated as additive. The differences between this alterna-tive combination and the nominal combination were definedas correlated procedural uncertainties δrel. This is a conser-vative approach but still yields quite small uncertainties. Thetypical values of δrel for the
√scom,1 = 318 GeV (
√scom,2/3)
combination were below 0.5 % (1 %) for medium-Q2 data,increasing to a few percent for low- and high-Q2 data.
4.5.2 Correlations between systematic uncertaintieson different data sets
Similar methods were often used to calibrate different datasets obtained by one or by both collaborations. In addition, thesame Monte Carlo simulation packages were used to analysedifferent data sets. These similar approaches might have ledto correlations between data sets from one or both collabora-tions. This was investigated in depth for the combination ofHERA I data [2]. The important correlations for this periodwere found to be related to the background from photopro-duction and the hadronic energy scales. The correlations forthe HERA I period were taken into account as before [2].
The correlations between the experiments for the HERA IIperiod were considered much less important, because bothexperiments developed different methods to address calibra-tion and normalisation. In the case of H1, some potentialcorrelations between the data from the HERA I and HERA IIperiods were identified. In the case of ZEUS, no such corre-lations were found; this is due to significant changes in thedetector and in the data processing.
123

Eur. Phys. J. C (2015) 75:580 Page 13 of 98 580
02468
101214161820
pull
Ent
ries
RMS = 1.06
p+NC e2 3.5 GeV≤2 Q
0
10
20
30
40
50
60
70
80
90
pull
Ent
ries
RMS = 1.07
p+NC e2 100 GeV≤2 3.5 < Q
0
10
20
30
40
50
60
70
80
90
pull
Ent
ries
RMS = 0.97
p+NC e2 50000 GeV≤2 100 < Q
0
10
20
30
40
50
pull
Ent
ries
RMS = 0.95
p-NC e
02468
101214161820
pull
Ent
ries
RMS = 1.04
p+CC e
-4 -3 -2 -1 0 1 2 3 4 -4 -3 -2 -1 0 1 2 3 4 -4 -3 -2 -1 0 1 2 3 4
-4 -3 -2 -1 0 1 2 3 4 -4 -3 -2 -1 0 1 2 3 4 -4 -3 -2 -1 0 1 2 3 40
2
4
6
8
10
12
14
16
pullE
ntri
es
RMS = 0.97
p-CC e
H1 and ZEUS
(c)(b)(a)
(f)(e)(d)
Fig. 2 Distributions of pulls p for: a NC e+ p for Q2 ≤ 3.5 GeV2;b NC e+ p for 3.5 < Q2 ≤ 100 GeV2; c NC e+ p for 100 < Q2 ≤50,000 GeV2; d NC e− p for 60 ≤ Q2 ≤ 50,000 GeV2; e CC e+ p
for 300 ≤ Q2 ≤ 30,000 GeV2; and f CC e− p for 300 ≤ Q2 ≤30,000 GeV2. There are no entries outside the histogram ranges. Theroot mean square, RMS, of each distribution is given
The differences between the nominal combination and thecombinations, in which systematic sources for the photopro-duction background and hadronic energy scale were taken ascorrelated across data sets, were defined as additional signedprocedural uncertainties δγ p and δhad. Typical values of δγ p
and δhad are below 1 % (0.5 %) for NC (CC) scattering. Forthe data at low Q2, they can reach a few percent.
4.5.3 Pull distribution of correlated systematicuncertainties
There are in total 162 sources of correlated systematic uncer-tainty including global normalisations characterising the sep-arate data sets. In the procedure applied, all these sourceswere assumed to be fully point-to-point correlated. None ofthese sources was shifted by more than 2.4 σ from its nomi-nal value in the combination procedure. The pull on any suchsource j is defined as p j = b′
j/(1 − �2b′j)1/2, where �b′
jis
the uncertainty on the source j after the averaging. The dis-tribution of p j is shown in Fig. 3. Some large values for |p j |are observed. They are connected to small relative uncertain-
ties, below 1 %, for which there is only a small reduction inthe uncertainty. Such cases are, for example, expected if thepoint-to-point correlation within a data set is not 100 % aswas assumed.
The distribution of pulls shown in Fig. 3 is not Gaussian; ithas a root-mean-square value of 1.34. Out of the 162 point-to-point correlated uncertainties, 40 were identified with p j >
1.3. This might indicate that these uncertainties were eitherunderestimated or do not fulfil the implicit assumptions ofthe linear procedure applied. Scaling these 40 uncertaintiesby a factor of two would reduce the root-mean-square valueto 1.03 and the χ2
min of the combination would be reducedfrom 1687 to 1614 for the 1620 degrees of freedom.
Each of these 40 uncertainties could give rise to an individ-ual procedural uncertainty if scaled. However, an extensivestudy revealed cross correlations between them. These crosscorrelations were used to form four groups related to
1. very low-Q2 data from HERA I (14 uncertainties);2. low-Q2 data from HERA II with lowered proton beam
energies (10 uncertainties);
123

580 Page 14 of 98 Eur. Phys. J. C (2015) 75:580
-6 -4 -2 0 2 4 602468
101214161820
systematic pull
Ent
ries RMS = 1.34
H1 and ZEUS
Fig. 3 Distribution of pulls p j for the correlated systematic uncertain-ties including global normalisations. There are no entries outside thehistogram range. The root mean square, RMS, of the distribution isgiven
3. medium- and high-Q2 data from HERA I and II (11uncertainties);
4. normalisation issues from HERA I and II (5 uncertain-ties).
The normalisation related uncertainties were also found tobe correlated to some of the uncertainties in the other groupsbut they were kept separate. Signed procedural uncertain-ties δ(1,2,3,4) were assigned to the four groups by scalingthe uncertainties within each group by a factor of two andtaking the difference between the result of this combinationand that of the nominal combination as the uncertainty. Suchcross correlations as observed here between different sys-tematic uncertainties are not unexpected, even though differ-ent methods were used for different regions of phase spaceby two different experiments. Both experiments contributeabout equally to the 40 sources discussed.
Since H1 and ZEUS used, as described for example inSect. 3.2, different reconstruction methods, similar system-atic sources influence the measured cross section differentlyas a function of xBj and Q2. Therefore, requiring the crosssections to agree at all xBj and Q2 constrains the systemat-ics efficiently. In addition, for certain regions of the phasespace, one of the two experiments has superior precisioncompared to the other. For these regions, the less precisemeasurement is fitted to the more precise measurement, witha simultaneous reduction of the correlated systematic uncer-tainty. This reduction propagates to the other points, includ-ing those which are based solely on the measurement fromthe less precise experiment. However, over most of the phasespace, the precision of the H1 and ZEUS measurements isvery similar and the systematic uncertainties are reduced uni-formly.
H1 and ZEUS
0
0.2
0.4
0.6
0.8
1
1.2
1.4
1.6
1.8
1 10 102 103 104 105
σ r, N
C
Q2/GeV2
+ HERA NC e+p 0.5 fb–1
√s = 318 GeVZEUS HERA IIZEUS HERA IH1 HERA IIH1 HERA I
xBj = 0.0002
xBj = 0.002
xBj = 0.008
xBj = 0.032
xBj = 0.08
xBj = 0.25
xBj = 0.008 xBj = 0.08
Fig. 4 The combined HERA data for the inclusive NC e+ p reducedcross sections as a function of Q2 for six selected values of xBj comparedto the individual H1 and ZEUS data. The individual measurements aredisplaced horizontally for better visibility.Error bars represent the totaluncertainties. The two labelled entries at xBj = 0.008 and 0.08 comefrom data which were taken at
√s = 300 GeV and y < 0.35 and were
translated to√s = 318 GeV, see Sect. 4.1
5 Combined inclusive e± p cross sections
The combined reduced cross sections for NC and CC ep scat-tering together with their statistical, uncorrelated and totalcorrelated systematic uncertainties, as well as proceduraluncertainties as defined in Sect. 4, are given in Appendix C10.The new values supersede those published previously [2].
The total uncertainties are below 1.5 % over the Q2 rangeof 3 ≤ Q2 ≤ 500 GeV2 and below 3 % up to Q2 =3000 GeV2. Cross sections are provided for values of Q2
between Q2 = 0.045 GeV2 and Q2 = 50,000 GeV2 andvalues of xBj between xBj = 6 × 10⁻⁷ and xBj = 0.65.The events have a minimum invariant mass of the hadronicsystem, W , of 15 GeV.
In Fig. 4, the individual and the combined reduced crosssections for NC e+ pDIS scattering are shown as a function ofQ2 for selected values of xBj. The improvement due to com-bination is clearly visible. In Fig. 5, a comparison betweenthe new combination and the combination of HERA I dataalone is shown. The improvement is especially significant athigh Q2. The results for NC e− p scattering are depicted inFigs. 6 and 7. As the integrated luminosity for e− p scattering
10 The full information about correlations between cross-section mea-surements is available elsewhere [79].
123

Eur. Phys. J. C (2015) 75:580 Page 15 of 98 580
H1 and ZEUS
0
0.2
0.4
0.6
0.8
1
1.2
1.4
1.6
1 10 102 103 104 105
σ r, N
C
Q2/GeV2
+ HERA NC e+p 0.5 fb–1
HERA I√s = 318 GeVxBj = 0.0002
xBj = 0.002
xBj = 0.008
xBj = 0.032
xBj = 0.08
xBj = 0.25
xBj = 0.008xBj = 0.08
Fig. 5 The combined HERA data for the inclusive NC e+ p reducedcross sections as a function of Q2 for six selected values of xBj com-pared to the results from HERA I alone [2]. The two measurements aredisplaced horizontally for better visibility.Error bars represent the totaluncertainties. The two labelled entries at xBj = 0.008 and 0.08 comefrom data which were taken at
√s = 300 GeV and y < 0.35 and were
translated to√s = 318 GeV, see Sect. 4.1
H1 and ZEUS
0
0.2
0.4
0.6
0.8
1
1.2
103 104
σ r, N
C–
Q2/GeV2
HERA NC e p 0.4 fb–1–
√s = 318 GeVZEUS HERA IIZEUS HERA IH1 HERA IIH1 HERA I
xBj = 0.008
xBj = 0.032
xBj = 0.08
xBj = 0.25
Fig. 6 The combined HERA data for the inclusive NC e− p reducedcross sections as a function of Q2 for four selected values of xBj com-pared to the individual H1 and ZEUS data. The individual measurementsare displaced horizontally for better visibility. Error bars represent thetotal uncertainties
was very limited for the HERA I period, the improvementsdue to the new combination are even more substantial thanfor e+ p scattering.
H1 and ZEUS
0
0.2
0.4
0.6
0.8
1
1.2
103 104
σ r, N
C–
Q2/GeV2
HERA NC e p 0.4 fb–1–
HERA I
√s = 318 GeV
xBj = 0.008
xBj = 0.032
xBj = 0.08
xBj = 0.25
Fig. 7 The combined HERA data for the inclusive NC e− p reducedcross section as a function of Q2 for four selected values of xBj com-pared to the results from HERA I alone [2]. The two measurements aredisplaced horizontally for better visibility.Error bars represent the totaluncertainties
The results of the combination of the data with lower pro-ton beam energies are shown in Figs. 8 and 9 as a functionof xBj in selected bins of Q2. These data augment the datawith standard proton energy to provide increased sensitivityto the gluon density in the proton.
The combined NC e+ p data for very low Q2 with protonbeam energies of 920 and 820 GeV are shown in Figs. 10 and11. These data were taken during the HERA I period, but dueto the systematic shifts introduced by the combination withHERA II data, the numbers are not always the same as in theold HERA I combination.
The combined CC cross sections are shown in Figs. 12,13, 14 and 15, together with the input data from H1 andZEUS and the comparison to the HERA I combination resultsfor e+ p and e− p scattering. As for the NC data, the powerof combination and the improved precision due to the highstatistics data from HERA II are demonstrated.
The high-precision DIS cross sections provided here forma coherent set spanning six orders of magnitude, both in Q2
and xBj. They are a major legacy of HERA.
6 QCD analysis
In this section, the pQCD analysis of the combined dataresulting in the PDF set HERAPDF2.0 and its released vari-ants is presented. The framework established for HERA-PDF1.0 [2] was followed in this analysis. A breakdown ofpQCD is expected for Q2 approaching 1 GeV2. To safelyremain in the kinematic region where pQCD is expected
123

580 Page 16 of 98 Eur. Phys. J. C (2015) 75:580
Fig. 8 The combined HERAdata for the inclusive NC e+ preduced cross sections at√s = 251 GeV as a function of
xBj for five selected values ofQ2 compared to the individualH1 and ZEUS data. Theindividual measurements aredisplaced horizontally for bettervisibility. The ZEUS points atthe same xBj and Q2 values arefrom two different data sets.Error bars represent the totaluncertainties
H1 and ZEUS
0.5
1
1.5 Q2 = 12 GeV2
σ r, N
C
+ Q2 = 15 GeV2
0.5
1
1.5 Q2 = 25 GeV2
10-3 10-2
Q2 = 35 GeV2
xBj
0.5
1
1.5
10-3 10-2
xBj
Q2 = 60 GeV2
HERA NC e+p 13 pb–1
√s = 251 GeVZEUSH1
to be applicable, only cross sections for Q2 starting fromQ2
min = 3.5 GeV2 were used in the analysis. In this kine-matic region, target-mass corrections are expected to be neg-ligible. Since the centre-of-mass energy at the γ p vertex W isabove 15 GeV for all the data, large-xBj higher-twist correc-tions are also expected to be negligible. The Q2 range of thecross sections entering the fit is 3.5 ≤ Q2 ≤ 50,000 GeV2.The corresponding xBj range is 0.651 × 10⁻⁴ ≤ xBj ≤ 0.65.
In addition to experimental uncertainties, model andparameterisation uncertainties were also considered. The lat-ter were evaluated by variations of the values of various inputsettings at the starting scale and the form of the parameteri-sation.
6.1 Theoretical formalism and settings
Predictions from pQCD are fitted to data. These predic-tions were obtained by solving the DGLAP evolution equa-tions [29–33] at LO, NLO and NNLO in the MS scheme [80].This was done using the programme QCDNUM [81] withinthe HERAFitter framework [26,27] and an independent pro-gramme, which was already used to analyse the combinedHERA I data [2]. The results obtained by the two programmeswere in excellent agreement, well within fit uncertainties. The
numbers on fit quality and resulting parameters given in thispaper were obtained using HERAFitter.
The DGLAP equations yield the PDFs at all scales μ2f
and x , if they are provided as functions of x at some start-ing scale, μ2
f0. In variable-flavour schemes, this scale has
to be below the charm-quark mass parameter, Mc, squared.It was chosen to be μ2
f0= 1.9 GeV2 as for HERAPDF1.0.
The renormalisation and factorisation scales were chosen tobe μ2
r = μ2f = Q2. The predictions for the structure func-
tions [1] which appear in the calculation of the cross sections,see Eq. 1, were obtained by convoluting the parton distribu-tion functions with coefficient functions appropriate to theorder of the calculation. The light-quark coefficient functionswere calculated using QCDNUM. The heavy-quark coeffi-cient functions were calculated in the general-mass variable-flavour-number scheme called RTOPT [82–84] for the NCstructure functions. For the CC structure functions, the zero-mass approximation was used, since all HERA CC data haveQ2 � M2
b , where Mb is the beauty-quark mass parameter inthe calculation.
The value of Mc was chosen after performing χ2 scansof NLO and NNLO pQCD fits to the combined inclusivedata from the analysis presented here and the HERA com-bined charm data [46]. The procedure is described in detailin the context of the combination of the reduced charm cross-
123

Eur. Phys. J. C (2015) 75:580 Page 17 of 98 580
Fig. 9 The combined HERAdata for the inclusive NC e+ preduced cross sections at√s = 225 GeV as a function of
xBj for five selected values ofQ2 compared to the individualH1 and ZEUS data. Theindividual measurements aredisplaced horizontally for bettervisibility. The ZEUS points atthe same xBj and Q2 values arefrom two different data sets.Error bars represent the totaluncertainties
H1 and ZEUS
0.5
1
1.5 Q2 = 12 GeV2
σ r, N
C
+ Q2 = 15 GeV2
0.5
1
1.5 Q2 = 25 GeV2
10-3 10-2
Q2 = 35 GeV2
xBj
0.5
1
1.5
10-3 10-2
Q2 = 60 GeV2
xBj
HERA NC e+p 26 pb–1
√s = 225 GeVZEUSH1
section measurements [46]. All correlations of the inclusiveand of the charm data were considered in the fits. Figure 16shows the �χ2 = χ2 − χ2
min, where χ2min is the minimum
χ2 obtained, of these fits versus Mc at NLO and NNLO. Asa result, the value of Mc was chosen as Mc = 1.47 GeV atNLO and Mc = 1.43 GeV at NNLO. The settings for LOwere chosen as for NLO unless otherwise stated.
The value of the beauty-quark mass parameter Mb waschosen after performing χ2 scans of NLO and NNLO pQCDfits using the combined inclusive data and data on beautyproduction from ZEUS [75] and H1 [76]. The χ2 scans areshown in Fig. 17. The value of Mb was chosen to be Mb =4.5 GeV at LO, NLO and NNLO. The value of the top-quarkmass parameter was chosen to be 173 GeV [52] at all orders.
The value of the strong coupling constant was chosento be αs(M2
Z ) = 0.118 [52] at both NLO and NNLO andαs(M2
Z ) = 0.130 [38] for the LO fit.
6.2 Parameterisation
In the approach of HERAPDF, the PDFs of the proton, x f ,are generically parameterised at the starting scale μ2
f0as
x f (x) = AxB(1 − x)C (1 + Dx + Ex2), (26)
where x is the fraction of the proton’s momentum taken bythe struck parton in the infinite momentum frame. The PDFsparameterised are the gluon distribution, xg, the valence-quark distributions, xuv , xdv , and the u-type and d-type anti-quark distributions, xU , x D. The relations xU = xu andx D = xd + xs are assumed at the starting scale μ2
f0.
The central parameterisation is
xg(x) = AgxBg (1 − x)Cg − A′
gxB′g (1 − x)C
′g , (27)
xuv(x) = Auv xBuv (1 − x)Cuv
(1 + Euv x
2)
, (28)
xdv(x) = Adv xBdv (1 − x)Cdv , (29)
xU (x) = AU xBU (1 − x)CU
(1 + DU x
), (30)
x D(x) = ADxBD (1 − x)CD . (31)
The gluon distribution, xg, is an exception from Eq. 26,for which an additional term of the form A′
gxB′g (1 − x)C
′g is
subtracted.11 This additional term was added to make theparameterisation more flexible at low x , such that it is not con-
11 In the analysis presented here, C ′g is fixed to C ′
g = 25 [36]. The fitsare not sensitive to the exact value of C ′
g once C ′g � Cg , such that the
term does not contribute at large x .
123

580 Page 18 of 98 Eur. Phys. J. C (2015) 75:580
Fig. 10 The combined HERAdata for the inclusive NC e+ preduced cross sections at√s = 318 GeV at very low Q2.
Error bars represent the totaluncertainties
0
0.2
0.4
0
0.5
0
0.5
1
H1 and ZEUS
Q2 = 0.15 GeV2
σ r, N
C
+ Q2 = 0.2 GeV2 Q2 = 0.25 GeV2
Q2 = 0.35 GeV2
Q2 = 0.4 GeV2 Q2 = 0.5 GeV2 Q2 = 0.65 GeV2
10-5 10-3
Q2 = 0.85 GeV2
10-5 10-3
xBjQ2 = 1.2 GeV2
10-5 10-3
Q2 = 1.5 GeV2
10-5 10-3
xBj
HERA NC e+p√s = 318 GeV
trolled by the single power Bg as x approaches zero [36]. Thisrequires that the powers Bg and B ′
g are different. Therefore arestriction was placed on B ′
g , such that B ′g values in the range
0.95 < B ′g/Bg < 1.05 were excluded for all PDFs released.
The term A′gx
B′g (1−x)C
′g was subtracted at NLO and NNLO,
but not at LO, since such a term could lead to xg(x) becom-ing negative which is not physical at LO, because the LOgluon distribution function at low x is directly related to theobservable longitudinal structure function FL [45].
The normalisation parameters, Auv , Adv , Ag , are con-strained by the quark-number sum rules and the momen-tum sum rule. The B parameters BU and BD were set asequal, BU = BD , such that there is a single B parameterfor the sea distributions. The strange-quark distribution isexpressed as an x-independent fraction, fs , of the d-type sea,xs = fs x D at μ2
f0. The value fs = 0.4 was chosen as a com-
promise between the determination of a suppressed strangesea from neutrino-induced di-muon production [36,85] anda recent determination of an unsuppressed strange sea, pub-lished by the ATLAS collaboration [86]. A further constraintwas applied by setting AU = AD(1 − fs). This, together
with the requirement BU = BD , ensures that xu → xd asx → 0.
The parameters appearing in Eqs. 27–31 were selected byfirst fitting with all D and E parameters and A′
g set to zero.This left 10 free parameters. The other parameters were thenincluded in the fit one at a time. The improvement of the χ2
of the fits was monitored and the procedure was ended whenno further improvement in χ2 was observed. This led to a15-parameter fit at NLO and a 14-parameter fit at NNLO. Acommon parameterisation with 14-parameters was chosen as“central”, both at NLO and at NNLO, such that any differ-ences between these fits reflect only the change in order. Thecentral fits satisfy the criterion that all the PDFs are positivein the measured region. The 15-parameter NLO fit was usedas a parameterisation variation, see Sect. 6.5.
6.3 Definition of χ2
The pQCD predictions were fit to the data using a χ2 methodsimilar to that described in Sect. 4.2. The definition of χ2 is
123

Eur. Phys. J. C (2015) 75:580 Page 19 of 98 580
Fig. 11 The combined HERAdata for the inclusive NC e+ preduced cross sections at√s = 300 GeV at very low Q2.
Error bars represent the totaluncertainties
0
0.1
0.2
0
0.2
0.4
0
0.25
0.5
0.75
0
0.5
1
H1 and ZEUS
Q2 = 0.045 GeV2
σ r, N
C
+Q2 = 0.065 GeV2 Q2 = 0.085 GeV2 Q2 = 0.11 GeV2
Q2 = 0.15 GeV2 Q2 = 0.2 GeV2 Q2 = 0.25 GeV2 Q2 = 0.35 GeV2
Q2 = 0.4 GeV2 Q2 = 0.5 GeV2 Q2 = 0.65 GeV2
10-510-6
Q2 = 0.85 GeV2
xBj
10-510-6
Q2 = 1.2 GeV2
10-510-6
Q2 = 1.5 GeV2
10-510-6
xBj
HERA NC e+p√s = 300 GeV
Fig. 12 The combined HERAdata for the inclusive CC e+ preduced cross sections as afunction of xBj for the tendifferent values of Q2 comparedto the individual H1 and ZEUSdata. The individualmeasurements are displacedhorizontally for better visibility.Error bars represent the totaluncertainties
H1 and ZEUS
0.5
1
1.5
Q2 = 300 GeV2
σ r, C
C
+
Q2 = 500 GeV2 Q2 = 1000 GeV2 Q2 = 1500 GeV2
0
0.2
0.4
0.6 Q2 = 2000 GeV2 Q2 = 3000 GeV2 Q2 = 5000 GeV2
10 -110 -2
Q2 = 8000 GeV2
10 -110 -2
xBj
0
0.05
0.1
Q2 = 15000 GeV2
10 -110 -2
Q2 = 30000 GeV2
10 -110 -2
xBj
HERA CC e+p 0.5 fb–1
√s = 318 GeVZEUS HERA IIZEUS HERA IH1 HERA IIH1 HERA I
123

580 Page 20 of 98 Eur. Phys. J. C (2015) 75:580
Fig. 13 The combined HERAdata for the inclusive CC e+ preduced cross sections as afunction of xBj for the tendifferent values of Q2 comparedto the results from HERA Ialone [2]. The individualmeasurements are displacedhorizontally for better visibility.Error bars represent the totaluncertainties
H1 and ZEUS
0
0.5
1
1.5 Q2 = 300 GeV2
σ r, C
C
+Q2 = 500 GeV2 Q2 = 1000 GeV2 Q2 = 1500 GeV2
0
0.2
0.4
0.6 Q2 = 2000 GeV2 Q2 = 3000 GeV2 Q2 = 5000 GeV2
10 -110 -2
Q2 = 8000 GeV2
10 -110 -2
xBj
0
0.05
0.1
Q2 = 15000 GeV2
10 -110 -2
Q2 = 30000 GeV2
10 -110 -2
xBj
HERA CC e+p 0.5 fb–1
√s = 318 GeV
HERA I
Fig. 14 The combined HERAdata for the inclusive CC e− preduced cross sections as afunction of xBj for the tendifferent values of Q2 comparedto the individual H1 and ZEUSdata. The individualmeasurements are displacedhorizontally for better visibility.Error bars represent the totaluncertainties
H1 and ZEUS
0
1
2
3Q2 = 300 GeV2
σ r, C
C–
Q2 = 500 GeV2 Q2 = 1000 GeV2 Q2 = 1500 GeV2
0
0.5
1
Q2 = 2000 GeV2 Q2 = 3000 GeV2 Q2 = 5000 GeV2 Q2 = 8000 GeV2
xBj
0
0.2
0.4
0.6Q2 = 15000 GeV2
10 -110 -2
Q2 = 30000 GeV2
10 -110 -2
10 -110 -2 10 -110 -2
xBj
HERA CC e p 0.4 fb–1–
√s = 318 GeVZEUS HERA IIZEUS HERA IH1 HERA IIH1 HERA I
123

Eur. Phys. J. C (2015) 75:580 Page 21 of 98 580
Fig. 15 The combined HERAdata for the inclusive CC e− preduced cross sections as afunction of xBj for the tendifferent values of Q2 comparedto the results from HERA Ialone [2]. The individualmeasurements are displacedhorizontally for better visibility.Error bars represent the totaluncertainties
H1 and ZEUS
0
1
2
3Q2 = 300 GeV2
σ r, C
C–
Q2 = 500 GeV2 Q2 = 1000 GeV2 Q2 = 1500 GeV2
0
0.5
1
Q2 = 2000 GeV2 Q2 = 3000 GeV2 Q2 = 5000 GeV2 Q2 = 8000 GeV2
xBj
0
0.2
0.4
0.6 Q2 = 15000 GeV2
10 -110 -2
Q2 = 30000 GeV2
10 -110 -2
10 -110 -2 10 -110 -2
xBj
HERA CC e p 0.4 fb–1–
√s = 318 GeV
HERA I
H1 and ZEUS
0
0.5
1
1.5
2
2.5
3
1.4 1.42 1.44 1.46 1.48 1.5 1.52
χ2 -χm
in
2
NLO
0
0.5
1
1.5
2
2.5
3
1.4 1.42 1.44 1.46 1.48 1.5 1.52
Mc /GeV
χ2 -χm
in
2
NNLO
Fig. 16 The �χ2 = χ2 − χ2min versus the charm mass parameter
Mc for NLO and NNLO fits based on the combined data on charmproduction in addition to the combined inclusive data
H1 and ZEUS
0
2
4
6
8
10
12
14
4 4.2 4.4 4.6 4.8 5
NLO
χ2 -χm
in
2
02468
1012141618
4 4.2 4.4 4.6 4.8 5
NNLO
Mb /GeV
χ2 -χm
in
2
Fig. 17 The �χ2 = χ2 − χ2min versus the beauty mass parameter
Mb for NLO and NNLO fits based on H1 and ZEUS data on beautyproduction in addition to the combined inclusive data
123

580 Page 22 of 98 Eur. Phys. J. C (2015) 75:580
Fig. 18 Comparison of thePDF uncertainties as determinedby the Hessian and Monte Carlo(MC) methods at NNLO for thevalence distributions xuv andxdv , the gluon distribution xgand the sea distribution,xS = 2x(U + D), at the scaleμ2
f = 10 GeV2
x -410 -310 -210 -110 1
xu
/ xu
(cen
tral
)v
v
0.9
0.95
1
1.05
1.1
2 = 10 GeVf2μ
MC NNLOHessian NNLO
x -410 -310 -210 -110 1
xd
/ xd
(cen
tral
)v
v
0.8
1
1.2
x -410 -310 -210 -110 1
xg
/ xg(
cent
ral)
0.96
0.98
1
1.02
1.04
x -410 -310 -210 -110 1
xS
/ xS(
cent
ral)
0.9
1
1.1
H1 and ZEUS
χ2exp (m, s) =
∑i
[mi − ∑
j γij m
i s j − μi]2
δ2i,stat μ
imi + δ2i,uncor (mi )2
+∑j
s2j +
∑i
lnδ2i,statμ
imi +(δi,uncormi )2
(δ2i,stat+δ2
i,uncor)(μi )2
,
(32)
where the notation is equivalent to that in Eq. 22; here s isused to denote systematic shifts. The additional logarithmicterm in Eq. 32 compared to Eq. 22 was introduced to min-imise biases [8].
Correlated systematic uncertainties were treated as for thecombination of data, see Sect. 4.2. For the combined inclu-sive data, the correlated systematic uncertainties are smalleror comparable to the statistical and uncorrelated uncertain-ties. Nevertheless, the remaining correlations are significantand thus the 162 systematic uncertainties present for the H1and ZEUS data sets plus the seven sources of proceduraluncertainty which resulted from the combination procedure,see Sect. 4.5, were all individually treated as correlated uncer-tainties.
Table 2 Input parameters for HERAPDF2.0 fits and the variations con-sidered to evaluate model and parameterisation (μ f0 ) uncertainties
Variation Standardvalue
Lowerlimit
Upperlimit
Q2min (GeV2) 3.5 2.5 5.0
Q2min (GeV2) HiQ2 10.0 7.5 12.5
Mc (NLO) (GeV) 1.47 1.41 1.53
Mc (NNLO) (GeV) 1.43 1.37 1.49
Mb (GeV) 4.5 4.25 4.75
fs 0.4 0.3 0.5
αs(M2Z ) 0.118 – –
μ f0 (GeV) 1.9 1.6 2.2
6.4 Experimental uncertainties
Experimental uncertainties were determined using the Hes-sian method with the criterion �χ2 = 1. The use of a con-sistent input data set with common correlations justifies thisapproach.
A cross check was performed using the Monte Carlomethod [87,88]. It is based on analysing a large number ofpseudo data sets called replicas. For this cross check, 1000
123

Eur. Phys. J. C (2015) 75:580 Page 23 of 98 580
replicas were created by taking the combined data and fluc-tuating the values of the reduced cross sections randomlywithin their given statistical and systematic uncertainties tak-ing into account correlations. All uncertainties were assumedto follow Gaussian distributions. The PDF central values anduncertainties were estimated using the mean and RMS valuesover the replicas.
The uncertainties obtained by the Monte Carlo methodand the Hessian method were consistent within the kinematicreach of HERA. This is demonstrated in Fig. 18 where exper-imental uncertainties obtained for HERAPDF2.0 NNLO bythe Hessian and Monte Carlo methods are compared for thevalence, the gluon and the total sea-quark distributions. TheRMS values taken as Monte Carlo uncertainties tend to beslightly larger than the standard deviations obtained in theHessian approach.
6.5 Model and parameterisation uncertainties
For the NLO and NNLO PDFs, the uncertainties on HERA-PDF2.0 due to the choice of model settings and the form ofthe parameterisation were evaluated by varying the assump-tions. A summary of the variations on model parameters isgiven in Table 2. The variations of Mc and Mb were cho-sen in accordance with the χ2 scans related to the heavy-quark mass parameters as shown in Figs. 16 and 17. The dataon heavy-quark production from HERA II led to a consider-ably reduced uncertainty on the heavy-quark mass parame-ters compared to the HERAPDF1.0 and HERAPDF1.5 anal-yses, see Appendix A.
The variation of fs was chosen to span the rangesbetween a suppressed strange sea [36,85] and an unsup-pressed strange sea [86]. In addition to this, two more vari-ations of the assumptions about the strange sea were made.Instead of assuming that the strange contribution is a fixedfraction of the d-type sea, an x-dependent shape, xs =f ′s 0.5 tanh(−20(x − 0.07)) x D, was used in which high-x
strangeness is highly suppressed. This was suggested by mea-surements published by the HERMES collaboration [89,90].The normalisation of f ′
s was also varied between f ′s = 0.3
and f ′s = 0.5.
In addition to these model variations, Q2min was varied
as for the HERAPDF1.0 and HERAPDF1.5 analyses, seeAppendix A. The differences between the central fit and thefits corresponding to the variations of Q2
min, fs , Mc and Mb
are added in quadrature, separately for positive and nega-tive deviations, and represent the model uncertainty of theHERAPDF2.0 sets.
Two kinds of parameterisation uncertainties were consid-ered, the variation in μ2
f0and the addition of parameters D
and E , see Eq. 26. The variation in μ2f0
mostly increasedthe PDF uncertainties of the sea and gluon at small x . The
Table 3 Input parameters for HERAPDF2.0FF fits. All other parame-ters were set as for the standard HERAPDF2.0 NLO fit
Scheme αs (M2Z ) FL mc (GeV) mb (GeV)
FF3A αNF=3s = 0.106375 O(α2
s ) mpolec = 1.44 m
poleb = 4.5
FF3B αNF=5s = 0.118 O(αs ) mc(mc) = 1.26 mb(mb) = 4.07
Table 4 The values of χ2 per degree of freedom for HERAPDF2.0 andits variants
HERAPDF Q2min (GeV2) χ2 d.o.f. χ2/d.o.f.
2.0 NLO 3.5 1357 1131 1.200
2.0HiQ2 NLO 10.0 1156 1002 1.154
2.0 NNLO 3.5 1363 1131 1.205
2.0HiQ2 NNLO 10.0 1146 1002 1.144
2.0 AG NLO 3.5 1359 1132 1.201
2.0HiQ2 AG NLO 10.0 1161 1003 1.158
2.0 AG NNLO 3.5 1385 1132 1.223
2.0HiQ2 AG NNLO 10.0 1175 1003 1.171
2.0 NLO FF3A 3.5 1351 1131 1.195
2.0 NLO FF3B 3.5 1315 1131 1.163
2.0Jets αs(M2Z ) fixed 3.5 1568 1340 1.170
2.0Jets αs(M2Z ) free 3.5 1568 1339 1.171
H1 and ZEUS
0.9
1
1.1
1.2
1.3
5 10 15 20 25
Q2 /GeV2
χ2 /d.o
.f.
min
RTOPT LO
RTOPT NNLORTOPT NLO
RTOPT NLO HERA I
Fig. 19 The dependence of χ2/d.o.f. on Q2min of the LO, NLO and
NNLO fits to the HERA combined inclusive data. Also shown are valuesfor an NLO fit to the combined HERA I data [2]. All fits were performedusing the RTOPT heavy-flavour scheme
parameters D and E were added separately for each PDF.The only significant difference from the 14-parameter cen-tral fit came from the 15-parameter fit, for which Duv wasnon zero. This affected the shape of the U -type sea as well
123

580 Page 24 of 98 Eur. Phys. J. C (2015) 75:580
H1 and ZEUS
1
1.05
1.1
1.15
1.2
1.25
χ2 /d.o
.f.
Q2 /GeV2min
FONLL-B NLO, FL O(αs)
FONLL-C NNLO, FL O(αs2)
RTOPT NLO, FL O(αs2)
RTOPT NNLO, FL O(αs3)
H1 and ZEUS
1
1.05
1.1
1.15
1.2
1.25
5 10 15 20 25
5 10 15 20 25
χ2 /d.o
.f.
Q2 /GeV2min
ACOT NLO, FL O(αs)
FONLL-B NLO, FL O(αs)
FF3B NLO, FL O(αs)
RTOPT NLO, FL O(αs2)
FF3A NLO, FL O(αs2)
(a)
(b)
Fig. 20 The dependence of χ2/d.o.f. on Q2min for HERAPDF2.0 fits
using a the RTOPT [84], FONNL-B [91], ACOT [110] and fixed-flavour(FF) schemes at NLO and b the RTOPT and FONNL-B/C [92] schemesat NLO and NNLO. The FL contributions are calculated using matrixelements of the order of αs indicated in the legend. The number ofdegrees of freedom drops from 1148 for Q2
min = 2.7 GeV2 to 1131 forthe nominal Q2
min = 3.5 GeV2 and to 868 for Q2min = 25 GeV2
as the shape of uv . The final parameterisation uncertainty fora given quantity is taken as the largest of the uncertainties.This uncertainty is valid in the x-range covered by the QCDfits to HERA data.
6.6 Total uncertainties
The total PDF uncertainty is obtained by adding in quadraturethe experimental, the model and the parameterisation uncer-tainties described in Sects. 6.4 and 6.5. Differences arisingfrom using alternative values of αs(M2
Z ), alternative formsof parameterisations, different heavy-flavour schemes or avery different Q2
min are not included in these uncertainties.Such changes result in the different variants of the PDFs tobe discussed in the subsequent sections.
0.2
0.4
0.6
0.8
1
-410 -310 -210 -110 1
HERAPDF2.0 NLO uncertainties: experimental model parameterisation
HERAPDF2.0AG NLO
xxf 2 = 10 GeV2
fμ
vxu
vxd
0.05)×xS (
0.05)×xg (
H1 and ZEUS
Fig. 21 The parton distribution functions xuv , xdv , xS = 2x(U + D)
and xg of HERAPDF2.0 NLO at μ2f = 10 GeV2. The gluon and sea
distributions are scaled down by a factor of 20. The experimental, modeland parameterisation uncertainties are shown. The dotted lines representHERAPDF2.0AG NLO with the alternative gluon parameterisation, seeSect. 6.8
6.7 Alternative values of αs(M2Z)
The HERAPDF2.0 NLO and NNLO standard fits were addi-tionally made for a series of αs(M2
Z ) values from αs(M2Z ) =
0.110 to αs(M2Z ) = 0.130 in steps of 0.001. These variants
are also released. They can be used to assess the uncertaintyon any predicted cross section due to the choice of αs(M2
Z )
and for αs(M2Z ) determinations using independent data.
6.8 Alternative forms of parameterisation
An “alternative gluon parameterisation”, AG, was consideredat NNLO and NLO. The value of A′
g in Eq. 27 was set to zeroand a polynominal term for xg(x) as in Eq. 26 was substi-tuted. This potentially resulted in a different 14-parameterfit. However, in practice a 13-parameter fit with a non-zeroDg was sufficient for the AG parameterisation, since therewas no improvement in χ2 for a non-zero Eg . Note that AGwas the only parameterisation considered at LO.
The standard parameterisation fits the HERA data better;however, especially at NNLO, it produces a negative gluondistribution for very low x , i.e. x < 10−4. This is outsidethe kinematic region of the fit, but may cause problems ifthe PDFs are used at very low x within the conventionalformalism. Therefore, a variant HERAPDF2.0AG using the
123

Eur. Phys. J. C (2015) 75:580 Page 25 of 98 580
Fig. 22 The flavour breakdownof the sea distribution ofHERAPDF2.0 NLO at μ2
f =10 GeV2. Shown are thedistributions xu, xd , xc and xstogether with their experimental,model and parameterisationuncertainties. The fractionaluncertainties are also shown
0
0.5
1
1.5
22 =10 GeV2
fμ
ux-0.2
0
0.2
-410 -310 -210 -110 1x
0
0.5
1
1.5
22 =10 GeV2
fμcx
HERAPDF2.0 NLO uncertainties: experimental model parameterisation
-0.2
0
0.2
-410 -310 -210 -110 1x
0
0.5
1
1.5
22 =10 GeV2
fμ
dx
-0.2
0
0.2
-410 -310 -210 -110 1x
0
0.5
1
1.5
22 =10 GeV2
fμs x
-0.2
0
0.2
-410 -310 -210 -110 1x
H1 and ZEUS
alternative gluon parameterisation is provided for predictionsof cross sections at very low x , such as very high-energyneutrino cross sections.
HERAPDF has a certain ansatz for the parameterisation ofthe PDFs, see Sect. 6.2. Different ways of using the polyno-mial form, such as parameterising xg, xuv , xdv , xd+xu andxd − xu or xg, xU , xD, xU and x D were investigated. Theresulting PDFs agreed with the standard PDFs within uncer-tainties and no improvement of fit quality resulted. Therefore,these alternative parameterisations were not pursued further.
6.9 Alternative heavy-flavour schemes
The standard choice of heavy-flavour scheme for HERA-PDF2.0 is the variable-flavour-number scheme RTOPT [84].Investigations using other heavy-flavour schemes were alsocarried out.
Two other variable-flavour-number schemes, FONLL [91,92] and ACOT [93], were considered, as implemented inHERAFitter at the time of the analysis. The FONLL scheme
is implemented via an interface to the APFEL program [94]and was used at NLO and NNLO. The ACOT scheme isimplemented using k-factors for the NLO corrections. Thethree heavy-flavour schemes differ in the order at whichFL is evaluated. At NLO, the massless contribution toFL is evaluated to O(α2
s ) for RTOPT and to O(αs) forFONNL-B and ACOT. At NNLO, the massless contributionto FL is evaluated to O(α3
s ) for RTOPT and to O(α2s ) for
FONNL-C. Fixed-flavour-number schemes were also inves-tigated. In such schemes, the number of (massless) lightflavours in the PDFs remains fixed across “flavour thresh-olds” and (massive) heavy flavours only occur in the matrixelements.
For some calculations, e.g. charm production at HERA,the availability of fixed-flavour variants of the PDFs is usefulor even mandatory. Many PDF groups provide either fixed-flavour fits only, or variable-flavour fits only, with a fixed-flavour variant calculated from the variable-flavour partondistributions at the starting scale using theory. For HERA-PDF2.0, fixed-flavour variants are provided which were actu-ally fitted to the data.
123

580 Page 26 of 98 Eur. Phys. J. C (2015) 75:580
Two schemes with three active flavours in the PDFs, FF3Aand FF3B, were considered:
• scheme FF3A:
– Three-flavour running of αs ;– FL calculated to O(α2
s );
– pole masses for charm, mpolec , and beauty, mpole
b ;
• scheme FF3B:
– Variable-flavour running of αs [95]. This is some-times called the “mixed scheme” [81];
– massless (light flavour) part of the FL contributioncalculated to O(αs);
– MS [80] running masses for charm, mc(mc), andbeauty mb(mb).
The input parameters to the fits are given in Table 3.The fits providing the variants HERAPDF2.0FF3A and
HERAPDF2.0FF3B were obtained using the OPENQC-DRAD [96] package as implemented in HERAFitter, par-tially interfaced to QCDNUM. This was proven to be consis-tent with the standalone version of OPENQCDRAD and, inthe case of the A variant, with the FFNS definition used bythe ABM [40–42] fitting group. The HERAFitter implemen-tation allows an external steering of the order of αs in FL, aslisted in Table 3.
6.10 Adding data on charm productionto the HERAPDF2.0 fit
The data on charm production described in Sect. 3.4 wereused to find the optimal value of Mc for the HERAPDF2.0fits as described in Sect. 6.1.
The impact of adding charm data to inclusive data as inputto NLO QCD fits has been extensively discussed in a previ-ous publication [46]. This previous analysis was based on theHERA I combined inclusive data and combined charm data.It was established that the main impact of the charm data onthe PDF fits is a reduction of the uncertainty on Mc. It was alsoestablished that the optimal value of Mc can differ accord-ing to the particular general-mass variable-flavour-numberscheme chosen for the fit. The fits for all schemes consideredwere of similar quality.
For the HERAPDF2.0 analysis, a total of 47 data points oncharm production [46] with Q2 larger than Q2
min = 3.5 GeV2
were added as input to the NLO fits. The 42 sources of corre-lated systematic uncertainty from the H1 and ZEUS data setson charm production and two additional sources due to thecombination procedure were taken into account. The correla-tions between the normalisation of the inclusive data and thenormalisation of the charm data was not taken into account
Table 5 Central values of the HERAPDF2.0 parameters at NLO
A B C D E A′ B ′
xg 4.34 −0.015 9.11 1.048 −0.167
xuv 4.07 0.714 4.84 13.4
xdv 3.15 0.806 4.08
xU 0.105 −0.172 8.06 11.9
x D 0.176 −0.172 4.88
0.2
0.4
0.6
0.8
1
-410 -310 -210 -110 1
HERAPDF2.0 NNLO uncertainties: experimental model parameterisation
HERAPDF2.0AG NNLO
x
xf 2 = 10 GeV2f
μ
vxu
vxd
0.05)×xS (
0.05)×xg (
H1 and ZEUS
Fig. 23 The parton distribution functions xuv , xdv , xS = 2x(U + D)
and xg of HERAPDF2.0 NNLO at μ2f = 10 GeV2. The gluon and sea
distributions are scaled down by a factor 20. The experimental, modeland parameterisation uncertainties are shown. The dotted lines representHERAPDF2.0AG NNLO with the alternative gluon parameterisation,see Sect. 6.8
Table 6 Central values of the HERAPDF2.0 parameters at NNLO
A B C D E A′ B ′
xg 2.27 −0.062 5.56 0.167 −0.383
xuv 5.55 0.811 4.82 9.92
xdv 6.29 1.03 4.85
xU 0.161 −0.127 7.09 1.58
x D 0.269 −0.127 9.58
in the PDF fits but it was verified that this has a negligibleeffect.
The inclusion of the charm data had little influence onthe result of the fit. This was not unexpected, since the maineffect of the charm data, i.e. to constrain Mc, was alreadyused for the fit to the inclusive data. The charm data wereproven to be consistent with the inclusive data, but only a
123

Eur. Phys. J. C (2015) 75:580 Page 27 of 98 580
Fig. 24 The flavour breakdownof the sea distribution ofHERAPDF2.0 NNLO at μ2
f =10 GeV2. Shown are thedistributions xu, xd , xc and xstogether with their experimental,model and parameterisationuncertainties. The fractionaluncertainties are also shown
0
0.5
1
1.5
22 =10 GeV2
fμ
ux
-0.2
0
0.2
-410 -310 -210 -110 1x
0
0.5
1
1.5
22 =10 GeV2
fμcx
HERAPDF2.0 NNLO uncertainties: experimental model parameterisation
-0.2
0
0.2
-410 -310 -210 -110 1x
0
0.5
1
1.5
22 =10 GeV2
fμ
dx
-0.2
0
0.2
-410 -310 -210 -110 1x
0
0.5
1
1.5
22 =10 GeV2
fμsx
-0.2
0
0.2
-410 -310 -210 -110 1x
H1 and ZEUS
marginal reduction in the uncertainty on the low-x gluon PDFwas obtained. The situation is similar at NNLO. Thereforeno HERAPDF2.0 variants with only the addition of data oncharm production are released.
6.11 Adding data on jet production to the HERAPDF2.0 fit
In pQCD fits to inclusive DIS data only, the gluon PDF isdetermined via the DGLAP equations using the observedscaling violations. This results in a strong correlationbetween the shape of the gluon distribution and the valueof αs(M2
Z ). In most PDF fits, the value of αs(M2Z ) is not
fitted but taken from external information [52]. The uncer-tainty on the gluon distribution is reduced for fits with fixedαs(M2
Z ) compared to fits with free αs(M2Z ). Data on jet pro-
duction cross sections provide an independent measurementof the gluon distribution. They are sensitive to αs(M2
Z ) andalready at LO to the gluon distribution at lower Q2 and tothe valence-quark distribution at higher Q2. Therefore theinclusion of jet data not only reduces the uncertainty on thehigh-x gluon distribution in fits with fixed αs(M2
Z ) but also
allows the accurate simultaneous determination of αs(M2Z )
and the gluon distribution.The jet data were included in the fits at NLO by calculating
predictions for the jet cross sections with NLOjet++ [97,98],which was interfaced to FastNLO [99–101] in order toachieve the speed necessary for iterative PDF fits. The predic-tions were multiplied by corrections for hadronisation and Z0
exchange before they were used to fit the data [47–51]. A run-ning electro-magnetic α as implemented in the 2012 versionof the programme EPRC [102] was used for the treatment ofjet cross sections when they were included in the PDF fits.The factorisation scale was chosen as μ2
f = Q2, while therenormalisation scale was linked to the transverse momenta,pT , of the jets by μ2
r = (Q2 + p2T )/2. Jet data could not be
included at NNLO for the analysis presented here, becausethe matrix elements were not available at the time of writing.
The normalisations of the ZEUS jet data [47,48] and theH1 low-Q2 jet data [49] are correlated with the inclusivesamples but because of the combination procedure these cor-relations cannot be recovered. Thus they are treated conser-vatively as uncorrelated. However, cross checks performed
123
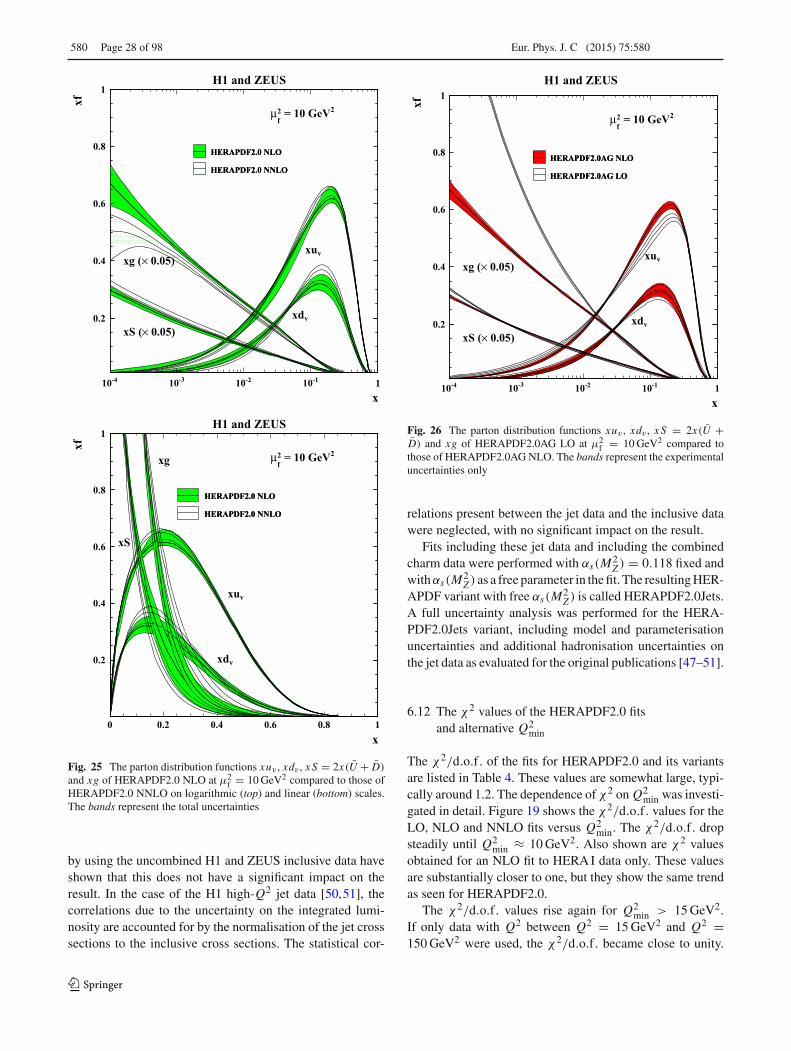
580 Page 28 of 98 Eur. Phys. J. C (2015) 75:580
0.2
0.4
0.6
0.8
1
-410 -310 -210 -110 1
HERAPDF2.0 NLO
HERAPDF2.0 NNLO
HERAPDF2.0 NLO
HERAPDF2.0 NNLO
x
xf
2 = 10 GeV2f
μ
vxu
vxd 0.05)×xS (
0.05)×xg (
H1 and ZEUS
0.2
0.4
0.6
0.8
1
0 0.2 0.4 0.6 0.8 1
HERAPDF2.0 NLO
HERAPDF2.0 NNLO
HERAPDF2.0 NLO
HERAPDF2.0 NNLO
x
xf
2 = 10 GeV2f
μ
vxu
vxd
xS
xg
H1 and ZEUS
Fig. 25 The parton distribution functions xuv , xdv , xS = 2x(U + D)
and xg of HERAPDF2.0 NLO at μ2f = 10 GeV2 compared to those of
HERAPDF2.0 NNLO on logarithmic (top) and linear (bottom) scales.The bands represent the total uncertainties
by using the uncombined H1 and ZEUS inclusive data haveshown that this does not have a significant impact on theresult. In the case of the H1 high-Q2 jet data [50,51], thecorrelations due to the uncertainty on the integrated lumi-nosity are accounted for by the normalisation of the jet crosssections to the inclusive cross sections. The statistical cor-
0.2
0.4
0.6
0.8
1
-410 -310 -210 -110 1
HERAPDF2.0AG NLO
HERAPDF2.0AG LO
HERAPDF2.0AG NLO
HERAPDF2.0AG LO
xxf
2 = 10 GeV2f
μ
vxu
vxd 0.05)×xS (
0.05)×xg (
H1 and ZEUS
Fig. 26 The parton distribution functions xuv , xdv , xS = 2x(U +D) and xg of HERAPDF2.0AG LO at μ2
f = 10 GeV2 compared tothose of HERAPDF2.0AG NLO. The bands represent the experimentaluncertainties only
relations present between the jet data and the inclusive datawere neglected, with no significant impact on the result.
Fits including these jet data and including the combinedcharm data were performed with αs(M2
Z ) = 0.118 fixed andwithαs(M2
Z ) as a free parameter in the fit. The resulting HER-APDF variant with free αs(M2
Z ) is called HERAPDF2.0Jets.A full uncertainty analysis was performed for the HERA-PDF2.0Jets variant, including model and parameterisationuncertainties and additional hadronisation uncertainties onthe jet data as evaluated for the original publications [47–51].
6.12 The χ2 values of the HERAPDF2.0 fitsand alternative Q2
min
The χ2/d.o.f. of the fits for HERAPDF2.0 and its variantsare listed in Table 4. These values are somewhat large, typi-cally around 1.2. The dependence of χ2 on Q2
min was investi-gated in detail. Figure 19 shows the χ2/d.o.f. values for theLO, NLO and NNLO fits versus Q2
min. The χ2/d.o.f. dropsteadily until Q2
min ≈ 10 GeV2. Also shown are χ2 valuesobtained for an NLO fit to HERA I data only. These valuesare substantially closer to one, but they show the same trendas seen for HERAPDF2.0.
The χ2/d.o.f. values rise again for Q2min > 15 GeV2.
If only data with Q2 between Q2 = 15 GeV2 and Q2 =150 GeV2 were used, the χ2/d.o.f. became close to unity.
123

Eur. Phys. J. C (2015) 75:580 Page 29 of 98 580
Fig. 27 The combinedhigh-Q2 HERA inclusive NCe+ p reduced cross sections at√s = 318 GeV with overlaid
predictions from HERAPDF2.0NNLO. The bands represent thetotal uncertainties on thepredictions 0
1
0
1
0
1
0
0.5
0
0.2
H1 and ZEUS
Q2 = 150 GeV2
σ r, N
C
+Q2 = 200 GeV2 Q2 = 250 GeV2 Q2 = 300 GeV2
Q2 = 400 GeV2 Q2 = 500 GeV2 Q2 = 650 GeV2 Q2 = 800 GeV2
Q2 = 1000 GeV2 Q2 = 1200 GeV2 Q2 = 1500 GeV2 Q2 = 2000 GeV2
Q2 = 3000 GeV2 Q2 = 5000 GeV2 Q2 = 8000 GeV2
10-2 10-1
Q2 = 12000 GeV2
10-2 10-1
xBjQ2 = 20000 GeV2
10-2 10-1
Q2 = 30000 GeV2
10-2 10-1
xBj
HERA NC e+p 0.5 fb–1
√s = 318 GeVHERAPDF2.0 NNLO
Fig. 28 The combinedhigh-Q2 HERA inclusive NCe+ p reduced cross sections at√s = 318 GeV with overlaid
predictions of the HERAPDF2.0NLO. The bands represent thetotal uncertainties on thepredictions 0
1
0
1
0
1
0
0.5
0
0.2
H1 and ZEUS
Q2 = 150 GeV2
σ r, N
C
+Q2 = 200 GeV2 Q2 = 250 GeV2 Q2 = 300 GeV2
Q2 = 400 GeV2 Q2 = 500 GeV2 Q2 = 650 GeV2 Q2 = 800 GeV2
Q2 = 1000 GeV2 Q2 = 1200 GeV2 Q2 = 1500 GeV2 Q2 = 2000 GeV2
Q2 = 3000 GeV2 Q2 = 5000 GeV2 Q2 = 8000 GeV2
10-2 10-1
Q2 = 12000 GeV2
10-2 10-1
xBjQ2 = 20000 GeV2
10-2 10-1
Q2 = 30000 GeV2
10-2 10-1
xBj
HERA NC e+p 0.5 fb–1
√s = 318 GeVHERAPDF2.0 NLO
123

580 Page 30 of 98 Eur. Phys. J. C (2015) 75:580
Fig. 29 The combinedhigh-Q2 HERA inclusive NCe+ p reduced cross sections at√s = 318 GeV with overlaid
predictions of theHERAPDF2.0AG LO. Thebands represent theexperimental uncertainties onthe predictions
0
1
0
1
0
1
0
0.5
0
0.2
H1 and ZEUS
Q2 = 150 GeV2
σ r, N
C
+Q2 = 200 GeV2 Q2 = 250 GeV2 Q2 = 300 GeV2
Q2 = 400 GeV2 Q2 = 500 GeV2 Q2 = 650 GeV2 Q2 = 800 GeV2
Q2 = 1000 GeV2 Q2 = 1200 GeV2 Q2 = 1500 GeV2 Q2 = 2000 GeV2
Q2 = 3000 GeV2 Q2 = 5000 GeV2 Q2 = 8000 GeV2
10-2 10-1
Q2 = 12000 GeV2
10-2 10-1
xBjQ2 = 20000 GeV2
10-2 10-1
Q2 = 30000 GeV2
10-2 10-1
xBj
HERA NC e+p 0.5 fb–1
√s = 318 GeVHERAPDF2.0AG LO
The addition of either data with lower or higher Q2 increasedthe χ2/d.o.f.. The lower- and middle-Q2 data clearly showtension. The higher-Q2 data generally cannot be fitted verywell. It was not possible to attribute this to any particu-lar region in xBj or a particular NC or CC process. Forthe standard value Q2
min = 3.5 GeV2, the data betweenQ2 = 3.5 GeV2 and Q2 = 15 GeV2 create about one thirdof the excess χ2/d.o.f. while two thirds originate from thedata with Q2 > 150 GeV2.
The influence of the choice of heavy-flavour scheme, andthe order at which the massless contribution to FL is evalu-ated, on the χ2/d.o.f. behaviour was also investigated. Scansat NLO and NNLO of the χ2/d.o.f. versus Q2
min for fitsdone with the heavy-flavour schemes described in Sect. 6.9are illustrated in Fig. 20. The decrease of the χ2/d.o.f. withincreasing Q2
min is observed for every scheme. At NLO andlow Q2
min, all fits using schemes for which the FL contri-butions are calculated using matrix elements of the order ofαs result in slightly lower χ2/d.o.f. than fits for schemesusing matrix elements of the order of α2
s . The increase ofχ2/d.o.f. for lower Q2
min is also less pronounced for fitsusing the “O(αs)-schemes”. However, at NNLO, the trendreverses and RTOPT, which uses matrix elements of order α3
sin the calculation of FL, results in lower χ2/d.o.f. than the
H1 and ZEUS
0
0.2
0.4
0.6
0.8
1
1.2
1.4
1 10 102 103 104 105
HERA NC e+p 0.5 fb–1
HERAPDF2.0 NLO
HERAPDF2.0 NNLO
√s = 318 GeVxBj = 0.0002xBj = 0.002
xBj = 0.008
xBj = 0.032
xBj = 0.08
xBj = 0.13
xBj = 0.25
xBj = 0.4
Q2/ GeV2
σ r, N
C
+
Fig. 30 The combined high-Q2 HERA inclusive NC e+ p reducedcross sections as partially shown already in Fig. 5 with overlaid predic-tions of HERAPDF2.0 NLO and NNLO. The two differently shadedbands represent the total uncertainties on the two predictions
123

Eur. Phys. J. C (2015) 75:580 Page 31 of 98 580
Fig. 31 The combined HERAinclusive NC e− p reduced crosssections at
√s = 318 GeV with
overlaid predictions fromHERAPDF2.0 NNLO. Thebands represent the totaluncertainties on the predictions 0
1
0
1
0
1
0
1
0
1
0
0.25
0.5
10-3 10-2 10-1
H1 and ZEUS
σ r, N
C Q2 = 60 GeV2
–
Q2 = 90 GeV2 Q2 = 120 GeV2 Q2 = 150 GeV2
Q2 = 200 GeV2 Q2 = 250 GeV2 Q2 = 300 GeV2 Q2 = 400 GeV2
Q2 = 500 GeV2 Q2 = 650 GeV2 Q2 = 800 GeV2 Q2 = 1000 GeV2
Q2 = 1200 GeV2 Q2 = 1500 GeV2 Q2 = 2000 GeV2 Q2 = 3000 GeV2
Q2 = 5000 GeV2 Q2 = 8000 GeV2
10-2 10-1
Q2 = 12000 GeV2
10-2 10-1
Q2 = 20000 GeV2
xBjQ2 = 30000 GeV2 Q2 = 50000 GeV2
xBj
HERA NC e p 0.4 fb–1–
√s = 318 GeVHERAPDF2.0 NNLO
10-3 10-2 10-1
Fig. 32 The combined HERAinclusive NC e− p reduced crosssections at
√s = 318 GeV with
overlaid predictions fromHERAPDF2.0 NLO. The bandsrepresent the total uncertaintieson the predictions 0
1
0
1
0
1
0
1
0
1
0
0.25
0.5
10-3 10-2 10-1
H1 and ZEUS
σ r, N
C Q2 = 60 GeV2
–
Q2 = 90 GeV2 Q2 = 120 GeV2 Q2 = 150 GeV2
Q2 = 200 GeV2 Q2 = 250 GeV2 Q2 = 300 GeV2 Q2 = 400 GeV2
Q2 = 500 GeV2 Q2 = 650 GeV2 Q2 = 800 GeV2 Q2 = 1000 GeV2
Q2 = 1200 GeV2 Q2 = 1500 GeV2 Q2 = 2000 GeV2 Q2 = 3000 GeV2
Q2 = 5000 GeV2 Q2 = 8000 GeV2
10-2 10-1
Q2 = 12000 GeV2
10-2 10-1
Q2 = 20000 GeV2
xBjQ2 = 30000 GeV2 Q2 = 50000 GeV2
xBj
HERA NC e p 0.4 fb–1–
√s = 318 GeVHERAPDF2.0 NLO
10-3 10-2 10-1
123

580 Page 32 of 98 Eur. Phys. J. C (2015) 75:580
Fig. 33 The combined HERAinclusive NC e− p reduced crosssections at
√s = 318 GeV with
overlaid predictions fromHERAPDF2.0AG LO. Thebands represent theexperimental uncertainties onthe predictions
0
1
0
1
0
1
0
1
0
1
0
0.25
0.5
10-3 10-2 10-1
H1 and ZEUS
σ r, N
C Q2 = 60 GeV2
–
Q2 = 90 GeV2 Q2 = 120 GeV2 Q2 = 150 GeV2
Q2 = 200 GeV2 Q2 = 250 GeV2 Q2 = 300 GeV2 Q2 = 400 GeV2
Q2 = 500 GeV2 Q2 = 650 GeV2 Q2 = 800 GeV2 Q2 = 1000 GeV2
Q2 = 1200 GeV2 Q2 = 1500 GeV2 Q2 = 2000 GeV2 Q2 = 3000 GeV2
Q2 = 5000 GeV2 Q2 = 8000 GeV2
10-2 10-1
Q2 = 12000 GeV2
10-2 10-1
Q2 = 20000 GeV2
xBjQ2 = 30000 GeV2 Q2 = 50000 GeV2
xBj
HERA NC e p 0.4 fb–1–
√s = 318 GeVHERAPDF2.0AG LO
10-3 10-2 10-1
Fig. 34 The combined low-Q2
HERA inclusive NC e+ preduced cross sections at√s = 318 GeV with overlaid
predictions from HERAPDF2.0NNLO. The bands represent thetotal uncertainties on thepredictions. Dotted linesindicate extrapolation intokinematic regions not includedin the fit
0
1
0
1
0
1
0
1
0
1
H1 and ZEUS
Q2 = 2 GeV2
σ r, N
C
+Q2 = 2.7 GeV2 Q2 = 3.5 GeV2 Q2 = 4.5 GeV2
Q2 = 6.5 GeV2 Q2 = 8.5 GeV2 Q2 = 10 GeV2 Q2 = 12 GeV2
Q2 = 15 GeV2 Q2 = 18 GeV2 Q2 = 22 GeV2 Q2 = 27 GeV2
Q2 = 35 GeV2 Q2 = 45 GeV2
10-3 10-1
Q2 = 60 GeV2
10-3 10-1
Q2 = 70 GeV2
xBjQ2 = 90 GeV2
10-3 10-1
Q2 = 120 GeV2
10-3 10-1
xBj
HERA NC e+p 0.5 fb–1
√s = 318 GeVHERAPDF2.0 NNLO
123

Eur. Phys. J. C (2015) 75:580 Page 33 of 98 580
Fig. 35 The combined low-Q2
HERA inclusive NC e+ preduced cross sections at√s = 318 GeV with overlaid
predictions from HERAPDF2.0NLO. The bands represent thetotal uncertainties on thepredictions. Dotted linesindicate extrapolation intokinematic regions not includedin the fit
0
1
0
1
0
1
0
1
0
1
H1 and ZEUS
Q2 = 2 GeV2
σ r, N
C
+Q2 = 2.7 GeV2 Q2 = 3.5 GeV2 Q2 = 4.5 GeV2
Q2 = 6.5 GeV2 Q2 = 8.5 GeV2 Q2 = 10 GeV2 Q2 = 12 GeV2
Q2 = 15 GeV2 Q2 = 18 GeV2 Q2 = 22 GeV2 Q2 = 27 GeV2
Q2 = 35 GeV2 Q2 = 45 GeV2
10-3 10-1
Q2 = 60 GeV2
10-3 10-1
Q2 = 70 GeV2
xBjQ2 = 90 GeV2
10-3 10-1
Q2 = 120 GeV2
10-3 10-1
xBj
HERA NC e+p 0.5 fb–1
√s = 318 GeVHERAPDF2.0 NLO
Fig. 36 The combined low-Q2
HERA inclusive NC e+ preduced cross sections at√s = 318 GeV with overlaid
predictions fromHERAPDF2.0AG LO. Thebands represent theexperimental uncertainties onthe predictions. Dotted linesindicate extrapolation intokinematic regions not includedin the fit
0
1
0
1
0
1
0
1
0
1
H1 and ZEUS
Q2 = 2 GeV2
σ r, N
C
+Q2 = 2.7 GeV2 Q2 = 3.5 GeV2 Q2 = 4.5 GeV2
Q2 = 6.5 GeV2 Q2 = 8.5 GeV2 Q2 = 10 GeV2 Q2 = 12 GeV2
Q2 = 15 GeV2 Q2 = 18 GeV2 Q2 = 22 GeV2 Q2 = 27 GeV2
Q2 = 35 GeV2 Q2 = 45 GeV2
10-3 10-1
Q2 = 60 GeV2
10-3 10-1
Q2 = 70 GeV2
xBjQ2 = 90 GeV2
10-3 10-1
Q2 = 120 GeV2
10-3 10-1
xBj
HERA NC e+p 0.5 fb–1
√s = 318 GeVHERAPDF2.0AG LO
123
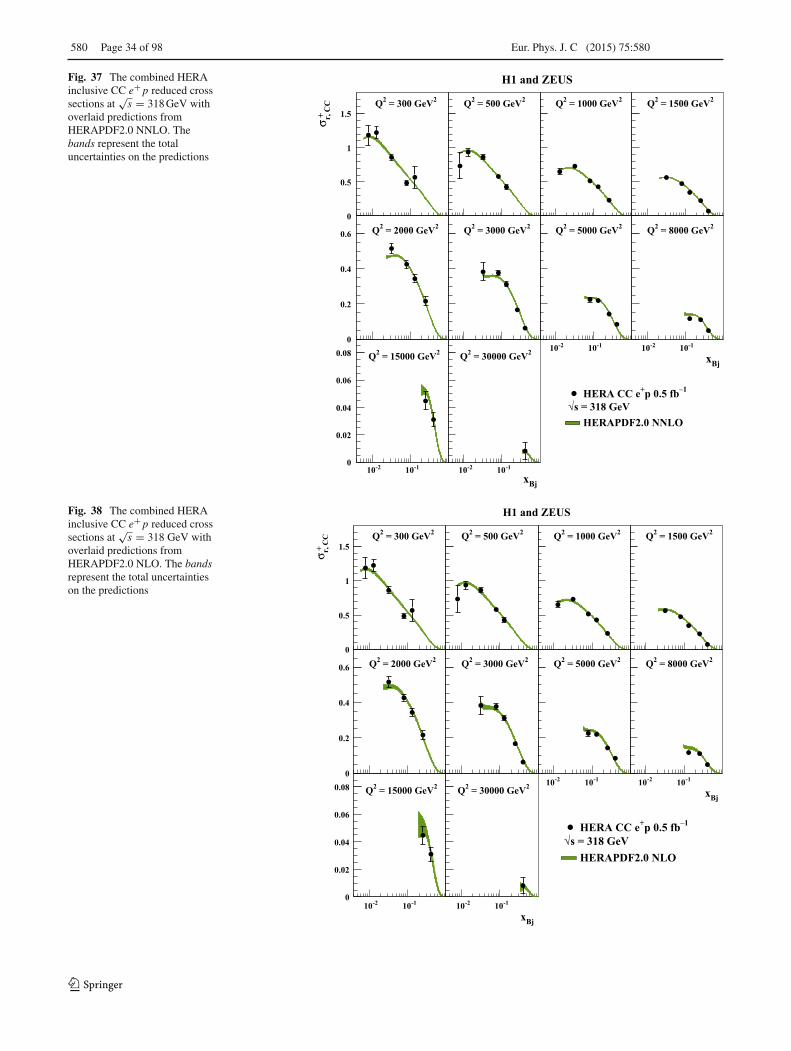
580 Page 34 of 98 Eur. Phys. J. C (2015) 75:580
Fig. 37 The combined HERAinclusive CC e+ p reduced crosssections at
√s = 318 GeV with
overlaid predictions fromHERAPDF2.0 NNLO. Thebands represent the totaluncertainties on the predictions
0
0.5
1
1.5
0
0.2
0.4
0.6
0
0.02
0.04
0.06
0.08
H1 and ZEUS
σ r, C
C Q2 = 300 GeV2
+Q2 = 500 GeV2 Q2 = 1000 GeV2 Q2 = 1500 GeV2
Q2 = 2000 GeV2 Q2 = 3000 GeV2 Q2 = 5000 GeV2 Q2 = 8000 GeV2
xBj
10-2 10-1
Q2 = 15000 GeV2
10-2 10-1
10-2 10-1 10-2 10-1
Q2 = 30000 GeV2
xBj
HERA CC e+p 0.5 fb–1
√s = 318 GeVHERAPDF2.0 NNLO
Fig. 38 The combined HERAinclusive CC e+ p reduced crosssections at
√s = 318 GeV with
overlaid predictions fromHERAPDF2.0 NLO. The bandsrepresent the total uncertaintieson the predictions
0
0.5
1
1.5
0
0.2
0.4
0.6
0
0.02
0.04
0.06
0.08
H1 and ZEUS
σ r, C
C Q2 = 300 GeV2
+Q2 = 500 GeV2 Q2 = 1000 GeV2 Q2 = 1500 GeV2
Q2 = 2000 GeV2 Q2 = 3000 GeV2 Q2 = 5000 GeV2 Q2 = 8000 GeV2
xBj
10-2 10-1
Q2 = 15000 GeV2
10-2 10-1
10-2 10-1 10-2 10-1
Q2 = 30000 GeV2
xBj
HERA CC e+p 0.5 fb–1
√s = 318 GeVHERAPDF2.0 NLO
123

Eur. Phys. J. C (2015) 75:580 Page 35 of 98 580
Fig. 39 The combined HERAinclusive CC e− p reduced crosssections at
√s = 318 GeV with
overlaid predictions fromHERAPDF2.0 NNLO. Thebands represent the totaluncertainties on the predictions
0
1
2
0
0.5
1
0
0.2
0.4
0.6
0.8
H1 and ZEUS
σ r, C
C Q2 = 300 GeV2
–
Q2 = 500 GeV2 Q2 = 1000 GeV2 Q2 = 1500 GeV2
Q2 = 2000 GeV2 Q2 = 3000 GeV2
10-2 10-1
Q2 = 5000 GeV2
10-2 10-1
Q2 = 8000 GeV2
xBj
10-2 10-1
Q2 = 15000 GeV2
10-2 10-1
Q2 = 30000 GeV2
xBj
HERA CC e p 0.4 fb–1–
√s = 318 GeVHERAPDF2.0 NNLO
FONNL scheme, for which matrix elements of order α2s are
used. The χ2/d.o.f. values for fits with the RTOPT schemeare quite similar at NLO and NNLO.
The two fixed-flavour-number schemes considered, seeSect. 6.9, also differ in using light-flavour matrix elements oforder αs (FF3B) and α2
s (FF3A). The FF3A fit variant resultsin χ2/d.o.f. values very similar to the values from the stan-dard fit using RTOPT while the values for the FF3B variantclosely follow the results for fits using the FONNL scheme.This suggests that the determining factor for the χ2 of the fitsis the order of αs of the matrix elements used to calculate themassless FL contribution. Other differences between FF3Aand FF3B as well as differences [103] between differentvariable-flavour-number schemes, and differences betweenfixed-flavour-number and variable-flavour-number schemes,seem to have less influence on χ2.
At HERA, the low-Q2 data are also dominantly at low xBj.Some of the poor χ2 values in this kinematic region couldbe due to low-xBj physics not accounted for in the currentframework [1,104]. This could mean that the inclusion oflow-xBj, low-Q2 data into the fits introduces bias. To studythis, NLO and NNLO fits with Q2
min = 10 GeV2 were alsofully evaluated. This variant is called HERAPDF2.0HiQ2.As part of the evaluation, the settings were reexamined. No
significant changes for the optimal parameterisation or forthe optimal value of Mc or Mb were observed. Model andparameterisation variations were also performed in order tobetter assess possible bias. For the NLO fits, the χ2/d.o.f.of 1156/1002 for the Q2
min = 10 GeV2 fit can be comparedto the 1357/1131 for the Q2
min = 3.5 GeV2 fit. This is asignificant improvement, but still larger than observed forHERAPDF1.0. The values are similar at NNLO, see Table 4.In particular, the NNLO fit does not fit the lower-Q2 databetter than the NLO fit, see Fig. 19, just as, at NLO, thehigher-order evaluation of FL does not fit these data better,see Fig. 20.
Fits were also performed with the alternative gluon param-eterisation and Q2
min = 10 GeV2. The χ2/d.o.f. was alwaysworse than for the standard parameterisation, see Table 4.
The χ2/d.o.f. values obtained for HERAPDF2.0Jets, bothfor fixed and for free αs(M2
Z ) are better than the value for thestandard HERAPDF2.0 NLO fit, see Table 4. The partial χ2
for the jet data is 161 for 162 data points, while it is 41 for 47data points for the charm data. The partial χ2 for the inclusivedata remains practically the same as for HERAPDF2.0 NLO.This demonstrates the compatibility of the data on charm andjet production with the inclusive data.
123

580 Page 36 of 98 Eur. Phys. J. C (2015) 75:580
Fig. 40 The combined HERAinclusive CC e− p reduced crosssections at
√s = 318 GeV with
overlaid predictions of theHERAPDF2.0 NLO. The bandsrepresent the total uncertaintieson the predictions
0
1
2
0
0.5
1
0
0.2
0.4
0.6
0.8
H1 and ZEUS
σ r, C
C Q2 = 300 GeV2
–
Q2 = 500 GeV2 Q2 = 1000 GeV2 Q2 = 1500 GeV2
Q2 = 2000 GeV2 Q2 = 3000 GeV2 Q2 = 5000 GeV2 Q2 = 8000 GeV2
xBj
10-2 10-1
Q2 = 15000 GeV2
10-2 10-1
10-2 10-1 10-2 10-1
Q2 = 30000 GeV2
xBj
HERA CC e p 0.4 fb–1–
√s = 318 GeVHERAPDF2.0 NLO
7 HERAPDF2.0
The analysis described in Sect. 6 resulted in a set of PDFscalled HERAPDF2.0. The HERAPDF2.0 analysis has thefollowing notable features:
• the data include four different processes, NC and CCfor e+ p and e− p scattering, such that there is sufficientinformation to extract the xdv , xuv , xU and x D PDFs,and the gluon PDF from the scaling violations;
• the NC e+ p data include data at centre-of-mass energiessufficiently different to access different values of y at thesame xBj and Q2; this makes the data sensitive to FL
and thus gives further information on the low-x gluondistribution;
• it is based on a consistent data set with small correlatedsystematic uncertainties;
• the experimental uncertainties are Hessian uncertainties;• the uncertainties introduced both by model assumptions
and by assumptions about the form of the parameterisa-tion are provided;
• no heavy-target corrections were needed as all data areon ep scattering; the assumption of uneutron = dproton wasnot needed.
An overview about HERAPDF2.0 and its variants asreleased is given in Appendix B.
7.1 HERAPDF2.0 NLO, NNLO and 2.0AG
A summary of HERAPDF2.0 NLO is shown in Fig. 21 at thescale μ2
f = 10 GeV2. The experimental, model and param-eterisation uncertainties, see Sects. 6.4 and 6.5, are shownseparately. The model and parameterisation uncertainties areasymmetric. The uncertainties arising from the variation ofμ2
f0= 1.9 GeV2 and Q2
min = 3.5 GeV2 affect predominantlythe low-x region of the sea and gluon distributions. Theparameterisation uncertainty from adding the Duv parameteris important for the valence distributions for all x .
The gluon distribution of HERAPDF2.0 NLO does notbecome negative within the fitted kinematic region. The dis-tributions of HERAPDF2.0AG with the alternative gluonparameterisation as described in Sect. 6.2 and discussed inSect. 6.8 are shown superimposed on the standard PDFs.
The flavour breakdown of the sea into xu, xd , xc and xsfor HERAPDF2.0 NLO at the scale μ2
f = 10 GeV2 is shownin Fig. 22. The fractional uncertainties are also shown. Themodel uncertainties from the variation of fs and Mc affectthe xs and xc distributions. The xc uncertainties also derive
123

Eur. Phys. J. C (2015) 75:580 Page 37 of 98 580
Fig. 41 The combined low-Q2
HERA inclusive NC e+ preduced cross sections at√s = 300 GeV with overlaid
predictions of HERAPDF2.0NLO. The bands represent thetotal uncertainties on thepredictions. Dotted linesindicate extrapolation intokinematic regions not includedin the fit
0
1
0
1
0
1
0
1
0
1
H1 and ZEUS
Q2 = 2 GeV2
σ r, N
C
+Q2 = 2.7 GeV2 Q2 = 3.5 GeV2 Q2 = 4.5 GeV2
Q2 = 6.5 GeV2 Q2 = 8.5 GeV2 Q2 = 10 GeV2 Q2 = 12 GeV2
Q2 = 15 GeV2 Q2 = 18 GeV2 Q2 = 22 GeV2 Q2 = 27 GeV2
Q2 = 35 GeV2 Q2 = 45 GeV2
10-3 10-1
Q2 = 60 GeV2
10-3 10-1
Q2 = 70 GeV2
xBjQ2 = 90 GeV2
10-3 10-1
Q2 = 120 GeV2
10-3 10-1
xBj
HERA NC e+p√s = 300 GeV
HERAPDF2.0 NLO
Fig. 42 The combinedhigh-Q2 HERA inclusive NCe+ p reduced cross sections at√s = 300 GeV with overlaid
predictions of HERAPDF2.0NLO. The bands represent thetotal uncertainties on thepredictions
0
1
0
1
0
1
0
0.5
0
0.2
H1 and ZEUS
Q2 = 150 GeV2
σ r, N
C
+Q2 = 200 GeV2 Q2 = 250 GeV2 Q2 = 300 GeV2
Q2 = 400 GeV2 Q2 = 500 GeV2 Q2 = 650 GeV2 Q2 = 800 GeV2
Q2 = 1000 GeV2 Q2 = 1200 GeV2 Q2 = 1500 GeV2 Q2 = 2000 GeV2
Q2 = 3000 GeV2 Q2 = 5000 GeV2 Q2 = 8000 GeV2
10-2 10-1
Q2 = 12000 GeV2
10-2 10-1
xBjQ2 = 20000 GeV2
10-2 10-1
Q2 = 30000 GeV2
10-2 10-1
xBj
HERA NC e+p√s = 300 GeV
HERAPDF2.0 NLO
123

580 Page 38 of 98 Eur. Phys. J. C (2015) 75:580
Fig. 43 The combined low-Q2
HERA inclusive NC e+ preduced cross sections at√s = 251 GeV with overlaid
predictions from HERAPDF2.0NLO. The bands represent thetotal uncertainties on thepredictions. Dotted linesindicate extrapolation intokinematic regions not includedin the fit
0
0.5
1
1.5
0
0.5
1
1.5
0
0.5
1
1.5
0
0.5
1
1.5
H1 and ZEUS
Q2 = 1.5 GeV2
σ r, N
C
+Q2 = 2 GeV2 Q2 = 2.5 GeV2 Q2 = 3.5 GeV2
Q2 = 5 GeV2 Q2 = 6.5 GeV2 Q2 = 8.5 GeV2 Q2 = 12 GeV2
Q2 = 15 GeV2 Q2 = 20 GeV2 Q2 = 25 GeV2
10-3 10-1
Q2 = 35 GeV2
10-3 10-1
xBjQ2 = 45 GeV2
10-3 10-1
Q2 = 60 GeV2
10-3 10-1
xBj
HERA NC e+p 13 pb–1
√s = 251 GeVHERAPDF2.0 NLO
Fig. 44 The combinedhigh-Q2 HERA inclusive NCe+ p reduced cross sections at√s = 251 GeV with overlaid
predictions from HERAPDF2.0NLO. The bands represent thetotal uncertainties on thepredictions
0
0.5
1
1.5
0
0.5
1
1.5
10-3
10-2
10-1
10-3
10-2
10-1
0
0.5
1
1.5
10-3
10-2
10-1
H1 and ZEUS
Q2 = 90 GeV2
σ r, N
C
+ Q2 = 120 GeV2 Q2 = 150 GeV2 Q2 = 200 GeV2
Q2 = 250 GeV2 Q2 = 300 GeV2 Q2 = 400 GeV2 Q2 = 500 GeV2
xBjQ2 = 650 GeV2 Q2 = 800 GeV2
xBj
HERA NC e+p 13 pb–1
√s = 251 GeV
HERAPDF2.0 NLO
10-3
10-2
10-1
123

Eur. Phys. J. C (2015) 75:580 Page 39 of 98 580
Fig. 45 The combined low-Q2
HERA inclusive NC e+ preduced cross sections at√s = 225 GeV with overlaid
predictions from HERAPDF2.0NLO. The bands represent thetotal uncertainties on thepredictions. Dotted linesindicate extrapolation intokinematic regions not includedin the fit
0
0.5
1
1.5
0
0.5
1
1.5
0
0.5
1
1.5
0
0.5
1
1.5
H1 and ZEUSQ2 = 1.5 GeV2
σ r, N
C
+Q2 = 2 GeV2 Q2 = 2.5 GeV2 Q2 = 3.5 GeV2
Q2 = 5 GeV2 Q2 = 6.5 GeV2 Q2 = 8.5 GeV2 Q2 = 12 GeV2
Q2 = 15 GeV2 Q2 = 20 GeV2 Q2 = 25 GeV2
10-3 10-1
Q2 = 35 GeV2
10-3 10-1
xBjQ2 = 45 GeV2
10-3 10-1
Q2 = 60 GeV2
10-3 10-1
xBj
HERA NC e+p 26 pb–1
√s = 225 GeVHERAPDF2.0 NLO
Fig. 46 The combinedhigh-Q2 HERA inclusive NCe+ p reduced cross sections at√s = 225 GeV with overlaid
predictions from HERAPDF2.0NLO. The bands represent thetotal uncertainties on thepredictions
0
0.5
1
1.5
0
0.5
1
1.5
10-2
10-1
10-2
10-1
0
0.5
1
1.5
10-2
10-1
H1 and ZEUS
Q2 = 90 GeV2
σ r, N
C
+ Q2 = 120 GeV2 Q2 = 150 GeV2 Q2 = 200 GeV2
Q2 = 250 GeV2 Q2 = 300 GeV2 Q2 = 400 GeV2 Q2 = 500 GeV2
xBjQ2 = 650 GeV2 Q2 = 800 GeV2
xBj
HERA NC e+p 26 pb–1
√s = 225 GeV
HERAPDF2.0 NLO
10-2
10-1
123

580 Page 40 of 98 Eur. Phys. J. C (2015) 75:580
from the uncertainty on the gluon distribution, since charmis generated from g → cc splitting. The variation of Mc alsoaffects the xu distribution since the suppression (enhance-ment) of xc results in an enhancement (suppression) of xu inthe u-type sea. Similarly the strangeness variations also affectxd , since the suppressed strangeness must be compensatedby enhanced xd in the d-type sea. However, since xd is fixedto xu at low x , this mostly affects the high-x uncertaintyon xd . The central fit gives xd − xu negative at x ≈ 0.1.However, the uncertainty is very large because HERA dataare not very sensitive to this difference. The uncertainty onxu has a significant contribution from the parameterisationuncertainties. The values of the parameters of HERAPDF2.0NLO are given in Table 5.
A summary of HERAPDF2.0 NNLO is shown in Fig. 23at the scale μ2
f = 10 GeV2. At NNLO, the gluon distributionof HERAPDF2.0 ceases to rise at low x . Consequently, xgfrom HERAPDF2.0AG NNLO deviates significantly. As atNLO, the uncertainties arising from the variation of μ2
f0and
Q2min affect predominantly the low-x region of the sea and
gluon distributions. The parameterisation uncertainty fromadding the Duv parameter is not important for the NNLO fit,since there was no significant improvement in χ2 from theaddition of the 15th parameter. The parameters of the NNLOfit are listed in Table 6.
The flavour breakdown of the sea into xu, xd , xc and xsfor HERAPDF2.0 NNLO is shown in Fig. 24. The uncer-tainties are also shown as fractional uncertainties. They aredominated by model uncertainties and derive from the samesources as already described at NLO. The parameterisationuncertainties are less important at NNLO than at NLO.
A comparison between HERAPDF2.0 NNLO and NLOis shown in Fig. 25 with total uncertainties, using both linearand logarithmic x scales. The main difference is the differ-ent shapes of the gluon distributions as expected from thediffering evolution at NLO and NNLO.
At leading order, HERAPDF2.0 is only available as HER-APDF2.0AG LO with the alternative gluon parameterisation.It has thus to be compared to HERAPDF2.0AG NLO. HER-APDF2.0AG LO was determined with experimental uncer-tainties only, because its main purpose is to be used in LOMonte Carlo programmes. A comparison between the distri-butions of HERAPDF2.0AG LO and HERAPDF2.0AG NLOis shown in Fig. 26. The gluon distribution at LO rises muchfaster than at NLO, as expected from the different evolution.The xuv distribution is softer at LO than at NLO.
7.1.1 Comparisons to inclusive HERA data
The data with the proton beam energy of 920 GeV (√s =
318 GeV) are the most precise data due to the large integrated
0.2
0.4
0.6
0.8
1
-410 -310 -210 -110 1
HERAPDF2.0 NLO
HERAPDF1.0 NLO
HERAPDF2.0 NLO
HERAPDF1.0 NLO
xxf
2 = 10 GeV2f
μ
vxu
vxd 0.05)×xS (
0.05)×xg (
H1 and ZEUS
0.2
0.4
0.6
0.8
1
0 0.2 0.4 0.6 0.8 1
HERAPDF2.0 NLO
HERAPDF1.0 NLO
HERAPDF2.0 NLO
HERAPDF1.0 NLO
x
xf
2 = 10 GeV2f
μ
vxu
vxd
xS
xg
H1 and ZEUS
Fig. 47 The parton distribution functions xuv , xdv , xS = 2x(U + D)
and xg of HERAPDF2.0 NLO at μ2f = 10 GeV2 compared to those
of HERAPDF1.0 on logarithmic (top) and linear (bottom) scales. Thebands represent the total uncertainties
luminosity, see Table 1. HERAPDF2.0 predictions are com-pared at NNLO, NLO and LO to these high-precision data.
The predictions of HERAPDF2.0 NNLO, NLO and AGLO are compared to the high-Q2 NC e+ p data in Figs. 27, 28and 29. The data are well described by the predictions at allorders. Figure 30 shows the cross sections already shown in
123

Eur. Phys. J. C (2015) 75:580 Page 41 of 98 580
0.2
0.4
0.6
0.8
1
-410 -310 -210 -110 1
HERAPDF2.0 NLO
HERAPDF1.5 NLO
HERAPDF2.0 NLO
HERAPDF1.5 NLO
x
xf
2 = 10 GeV2f
μ
vxu
vxd 0.05)×xS (
0.05)×xg (
H1 and ZEUS
0.2
0.4
0.6
0.8
1
0 0.2 0.4 0.6 0.8 1
HERAPDF2.0 NLO
HERAPDF1.5 NLO
HERAPDF2.0 NLO
HERAPDF1.5 NLO
x
xf
2 = 10 GeV2f
μ
vxu
vxd
xS
xg
H1 and ZEUS
Fig. 48 The parton distribution functions xuv , xdv , xS = 2x(U + D)
and xg of HERAPDF2.0 NLO at μ2f = 10 GeV2 compared to those
of HERAPDF1.5 on logarithmic (top) and linear (bottom) scales. Thebands represent the total uncertainties
Fig. 5 together with the predictions of HERAPDF2.0 NNLOand NLO. The predictions at NNLO and NLO are very sim-ilar.
The predictions of HERAPDF2.0 NNLO, NLO and AGLO are compared to the NC e− p data in Figs. 31, 32 and 33.The description of the e− p data is as good as for the e+ pdata.
0.2
0.4
0.6
0.8
1
-410 -310 -210 -110 1
HERAPDF2.0 NNLO
HERAPDF1.5 NNLO
HERAPDF2.0 NNLO
HERAPDF1.5 NNLO
xxf
2 = 10 GeV2f
μ
vxu
vxd 0.05)×xS (
0.05)×xg (
H1 and ZEUS
0.2
0.4
0.6
0.8
1
0 0.2 0.4 0.6 0.8 1
HERAPDF2.0 NNLO
HERAPDF1.5 NNLO
HERAPDF2.0 NNLO
HERAPDF1.5 NNLO
x
xf
2 = 10 GeV2f
μ
vxu
vxd
xS
xg
H1 and ZEUS
Fig. 49 The parton distribution functions xuv , xdv , xS = 2x(U + D)
and xg of HERAPDF2.0 NNLO at μ2f = 10 GeV2 compared to the
ones of HERAPDF1.5 on logarithmic (top) and linear (bottom) scales.The bands represent the total uncertainties
For e+ p scattering, data at low Q2 are available. Fig-ures 34, 35, and 36 show comparisons between the predic-tions of HERAPDF2.0 NNLO, NLO and AG LO and theselow-Q2 data. The description of the data is generally goodand for the predictions at NNLO and NLO, it remains soeven for Q2 below the fitted kinematic region. However, atlow xBj and low Q2, the turnover in the cross sections related
123

580 Page 42 of 98 Eur. Phys. J. C (2015) 75:580
Fig. 50 The parton distributionfunctions xuv , xdv , xg andxS = 2x(U + D) ofHERAPDF2.0 NLO atμ2
f = 10 GeV2 compared tothose of MMHT2014 [37],CT10 [39] and NNPDF3.0 [44].The top panel shows thedistribution with uncertaintiesonly for HERAPDF2.0. Thebottom panel shows the PDFsnormalised to HERAPDF2.0and with uncertainties for allPDFs
x -410 -310 -210 -110 1
xuv
0
0.2
0.4
0.6
0.8
1 2 = 10 GeVf2μ
HERAPDF2.0 NLOMMHT2014 NLOCT10 NLONNPDF3.0 NLO
x -410 -310 -210 -110 1
xdv
0
0.1
0.2
0.3
0.4
0.5
x -410 -310 -210 -110 1
xg
0
5
10
15
20
x -410 -310 -210 -110 1
xS
0
0.5
1
1.5
2
2.5
3
3.5
4
4.5
H1 and ZEUS
x -410 -310 -210 -110 1
xu
/ xu
(HE
RA
PDF2
.0)
vv
0.8
1
1.2
1.4
1.6
1.8
2 = 10 GeVf2μ
HERAPDF2.0 NLOMMHT2014 NLOCT10 NLO (68% CL)NNPDF3.0 NLO
x -410 -310 -210 -110 1
xd
/ xd
(HE
RA
PDF2
.0)
vv
1
2
3
x -410 -310 -210 -110 1
xg /
xg(H
ER
APD
F2.0
)
0.8
1
1.2
1.4
x -410 -310 -210 -110 1
xS /
xS(H
ER
APD
F2.0
)
0.8
0.9
1
1.1
1.2
1.3
H1 and ZEUS
123

Eur. Phys. J. C (2015) 75:580 Page 43 of 98 580
Fig. 51 The parton distributionfunctions xuv , xdv , xg andxS = 2x(U + D) ofHERAPDF2.0 NNLO atμ2
f = 10 GeV2 compared tothose of MMHT2014 [37],CT10 [105] andNNPDF3.0 [44]. The top panelshows the distribution withuncertainties only forHERAPDF2.0. The bottompanel shows the PDFsnormalised to HERAPDF2.0and with uncertainties for allPDFs
x -410 -310 -210 -110 1
xuv
0
0.2
0.4
0.6
0.8
1 2 = 10 GeVf2μ
HERAPDF2.0 NNLOMMHT2014 NNLOCT10 NNLONNPDF3.0 NNLO
x -410 -310 -210 -110 1
xdv
0
0.1
0.2
0.3
0.4
0.5
0.6
x -410 -310 -210 -110 1
xg
0
2
4
6
8
10
12
14
16
x -410 -310 -210 -110 1
xS
0
1
2
3
4
5
H1 and ZEUS
x -410 -310 -210 -110 1
xu
/ xu
(HE
RA
PDF2
.0)
vv
1
1.5
2
2 = 10 GeVf2μ
HERAPDF2.0 NNLOMMHT2014 NNLOCT10 NNLO (68% CL)NNPDF3.0 NNLO
x -410 -310 -210 -110 1
xd
/ xd
(HE
RA
PDF2
.0)
vv
0
1
2
3
4
5
x -410 -310 -210 -110 1
xg /
xg(H
ER
APD
F2.0
)
0.8
0.9
1
1.1
1.2
x -410 -310 -210 -110 1
xS /
xS(H
ER
APD
F2.0
)
0.6
0.8
1
1.2
1.4
1.6
1.8
H1 and ZEUS
123

580 Page 44 of 98 Eur. Phys. J. C (2015) 75:580
0.2
0.4
0.6
0.8
1
-410 -310 -210 -110 1
HERAPDF2.0 NLO uncertainties: experimental model parameterisation
HERAPDF2.0AG NLO
x
xf 2 = 10 GeV2f
μ
vxu
vxd
0.05)×xS (
0.05)×xg (
H1 and ZEUS
0.2
0.4
0.6
0.8
1
-410 -310 -210 -110 1
HERAPDF2.0HiQ2 NLO uncertainties: experimental model parameterisation
HERAPDF2.0HiQ2AG NLO
x
xf 2 = 10 GeV2f
μ
vxu
vxd
0.05)×xS (
0.05)×xg (
H1 and ZEUS
Fig. 52 The parton distribution functions xuv , xdv , xS = 2x(U + D)
and xg of HERAPDF2.0 NLO at μ2f = 10 GeV2 with Q2
min = 3.5 GeV2
(top) and of HERAPDF2.0HiQ2 NLO with Q2min = 10 GeV2 (bottom).
The gluon and sea distributions are scaled down by a factor of 20. Theexperimental, model and parameterisation uncertainties are shown. Thedotted lines represent HERAPDF2.0AG NLO and HERAPDF2.0AGHiQ2 NLO
to FL is not well described, and HERAPDF2.0 NNLO doesnot describe these data better than HERAPDF2.0 NLO. TheHERAPDF2.0AG LO predictions show a clear turnover, but
0.2
0.4
0.6
0.8
1
-410 -310 -210 -110 1
HERAPDF2.0 NNLO uncertainties: experimental model parameterisation
HERAPDF2.0AG NNLO
xxf 2 = 10 GeV2
fμ
vxu
vxd
0.05)×xS (
0.05)×xg (
H1 and ZEUS
0.2
0.4
0.6
0.8
1
-410 -310 -210 -110 1
HERAPDF2.0HiQ2 NNLO uncertainties: experimental model parameterisation
HERAPDF2.0HiQ2AG NNLO
x
xf 2 = 10 GeV2f
μ
vxu
vxd
0.05)×xS (
0.05)×xg (
H1 and ZEUS
Fig. 53 The parton distribution functions xuv , xdv , xS = 2x(U + D)
and xg of HERAPDF2.0 NNLO at μ2f =10 GeV2 with Q2
min =3.5 GeV2
(top) and of HERAPDF2.0HiQ2 NNLO with Q2min =10 GeV2 (bottom).
The gluon and sea distributions are scaled down by a factor 20. Theexperimental, model and parameterisation uncertainties are shown. Thedotted lines represent HERAPDF2.0AG NNLO and HERAPDF2.0AGHiQ2 NNLO
the prediction is significantly too high at all xBj for the lowestQ2.
The predictions of the NNLO and NLO fits are comparedto the CC e+ p data with
√s = 318 GeV in Figs. 37 and 38
123

Eur. Phys. J. C (2015) 75:580 Page 45 of 98 580
0.2
0.4
0.6
0.8
1
-410 -310 -210 -110 1
HERAPDF2.0 NLO
HERAPDF2.0HiQ2 NLO
HERAPDF2.0 NLO
HERAPDF2.0HiQ2 NLO
x
xf
2 = 10 GeV2f
μ
vxu
vxd 0.05)×xS (
0.05)×xg (
H1 and ZEUS
0.2
0.4
0.6
0.8
1
0 0.2 0.4 0.6 0.8 1
HERAPDF2.0 NLO
HERAPDF2.0HiQ2 NLO
HERAPDF2.0 NLO
HERAPDF2.0HiQ2 NLO
x
xf
2 = 10 GeV2f
μ
vxu
vxd
xS
xg
H1 and ZEUS
Fig. 54 The parton distribution functions xuv , xdv , xS = 2x(U + D)
and xg of HERAPDF2.0 NLO at μ2f = 10 GeV2 compared to those
of HERAPDF2.0HiQ2 NLO on logarithmic (top) and linear (bottom)scales. The bands represent the total uncertainties
and to CC e− p data in Figs. 39 and 40. The precise predic-tions describe the CC cross sections well. The CC data arein general less precise than the NC data.
The predictions of HERAPDF2.0 NLO compared to low-Q2 and high-Q2 NC e+ p data for
√s = 300 GeV are
0.5
1
1.5
2
2.5
-410 -310 -210 -110 1
HERAPDF2.0 NLO
HERAPDF2.0HiQ2 NLO
HERAPDF2.0 NLO
HERAPDF2.0HiQ2 NLO
xxf
2 = 10000 GeV2f
μ
vxu
vxd
0.05)×xS (
0.05)×xg (
H1 and ZEUS
0.2
0.4
0.6
0.8
1
0 0.2 0.4 0.6 0.8 1
HERAPDF2.0 NLO
HERAPDF2.0HiQ2 NLO
HERAPDF2.0 NLO
HERAPDF2.0HiQ2 NLO
x
xf
2 = 10000 GeV2f
μ
vxu
vxd
xSxg
H1 and ZEUS
Fig. 55 The parton distribution functions xuv , xdv , xS = 2x(U + D)
and xg of HERAPDF2.0 NLO at μ2f = 10,000 GeV2 compared to those
of HERAPDF2.0HiQ2 NLO on logarithmic (top) and linear (bottom)scales. The bands represent the total uncertainties
shown in Figs. 41 and 42. Equivalent comparisons for√s =
251 GeV and√s = 225 GeV are shown in Figs. 43 and 44,
and Figs. 45 and 46, respectively. The data with reduced pro-ton beam energy are also reasonably well described.
123

580 Page 46 of 98 Eur. Phys. J. C (2015) 75:580
0.2
0.4
0.6
0.8
1
-410 -310 -210 -110 1
HERAPDF2.0 NNLO
HERAPDF2.0HiQ2 NNLO
HERAPDF2.0 NNLO
HERAPDF2.0HiQ2 NNLO
x
xf
2 = 10 GeV2f
μ
vxu
vxd 0.05)×xS (
0.05)×xg (
H1 and ZEUS
0.2
0.4
0.6
0.8
1
0 0.2 0.4 0.6 0.8 1
HERAPDF2.0 NNLO
HERAPDF2.0HiQ2 NNLO
HERAPDF2.0 NNLO
HERAPDF2.0HiQ2 NNLO
x
xf
2 = 10 GeV2f
μ
vxu
vxd
xS
xg
H1 and ZEUS
Fig. 56 The parton distribution functions xuv , xdv , xS = 2x(U + D)
and xg of HERAPDF2.0 NLO at μ2f = 10 GeV2 compared to those
of HERAPDF2.0HiQ2 NLO on logarithmic (top) and linear (bottom)scales. The bands represent the total uncertainties
7.1.2 Comparisons to HERAPDF1.0 and 1.5
Comparisons of HERAPDF2.0 NLO to HERAPDF1.0 NLOand HERAPDF1.5 NLO are shown in Figs. 47 and 48,respectively. Whereas HERAPDF1.5 already had a some-what smaller uncertainty than HERAPDF1.0, the use of allHERA II data for HERAPDF2.0 has led to a much larger
0.5
1
1.5
2
2.5
-410 -310 -210 -110 1
HERAPDF2.0 NNLO
HERAPDF2.0HiQ2 NNLO
HERAPDF2.0 NNLO
HERAPDF2.0HiQ2 NNLO
x
xf
2 = 10000 GeV2f
μ
vxu
vxd
0.05)×xS (
0.05)×xg (
H1 and ZEUS
0.2
0.4
0.6
0.8
1
0 0.2 0.4 0.6 0.8 1
HERAPDF2.0 NNLO
HERAPDF2.0HiQ2 NNLO
HERAPDF2.0 NNLO
HERAPDF2.0HiQ2 NNLO
x
xf
2 = 10000 GeV2f
μ
vxu
vxd
xSxg
H1 and ZEUS
Fig. 57 The parton distribution functions xuv , xdv , xS = 2x(U + D)
and xg of HERAPDF2.0 NNLO at μ2f = 10,000 GeV2 compared to
those of HERAPDF2.0HiQ2 NNLO on logarithmic (top) and linear(bottom) scales. The bands represent the total uncertainties
reduction of the uncertainties on all PDFs. The shapes of thePDFs have also changed somewhat. The shape of the valencedistributions have become a little harder. This was caused bythe additional data with high xBj which were not yet availablefor HERAPDF1.5. The HERAPDF2.0 high-x gluon distri-bution is also slightly harder than HERAPDF1.5 while thesea distribution of HERAPDF2.0 at high x is considerablysofter.
123
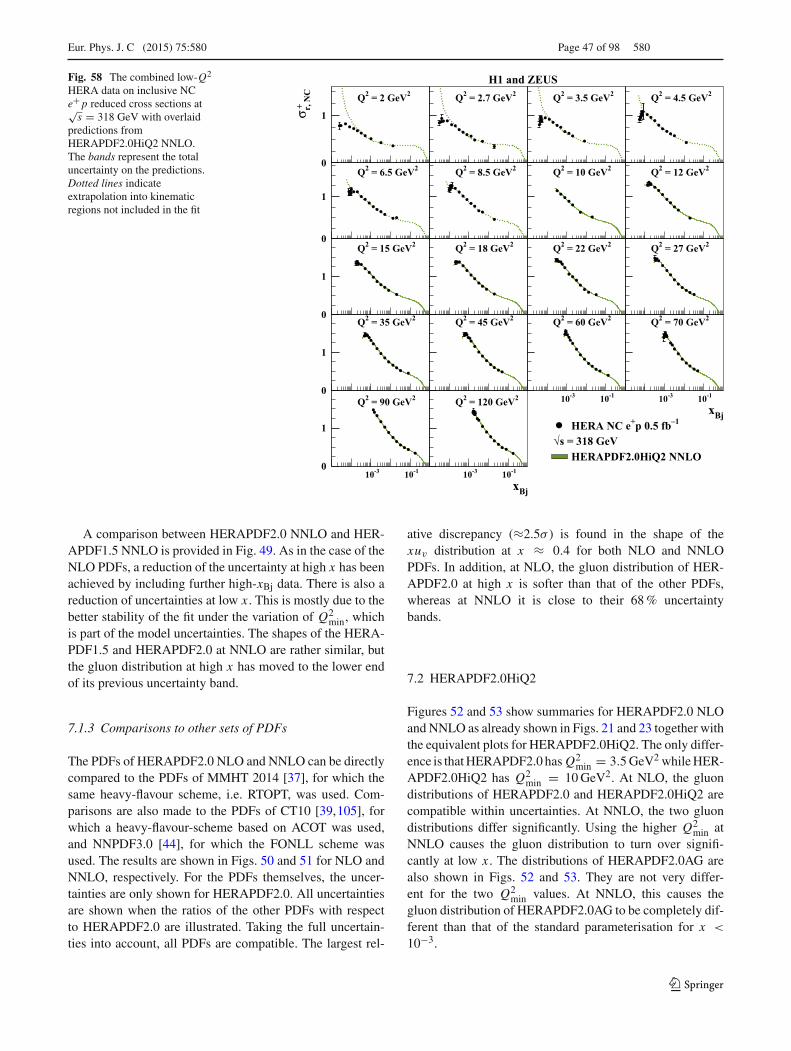
Eur. Phys. J. C (2015) 75:580 Page 47 of 98 580
Fig. 58 The combined low-Q2
HERA data on inclusive NCe+ p reduced cross sections at√s = 318 GeV with overlaid
predictions fromHERAPDF2.0HiQ2 NNLO.The bands represent the totaluncertainty on the predictions.Dotted lines indicateextrapolation into kinematicregions not included in the fit
0
1
0
1
0
1
0
1
0
1
H1 and ZEUSQ2 = 2 GeV2
σ r, N
C
+Q2 = 2.7 GeV2 Q2 = 3.5 GeV2 Q2 = 4.5 GeV2
Q2 = 6.5 GeV2 Q2 = 8.5 GeV2 Q2 = 10 GeV2 Q2 = 12 GeV2
Q2 = 15 GeV2 Q2 = 18 GeV2 Q2 = 22 GeV2 Q2 = 27 GeV2
Q2 = 35 GeV2 Q2 = 45 GeV2
10-3 10-1
Q2 = 60 GeV2
10-3 10-1
Q2 = 70 GeV2
xBjQ2 = 90 GeV2
10-3 10-1
Q2 = 120 GeV2
10-3 10-1
xBj
HERA NC e+p 0.5 fb–1
√s = 318 GeVHERAPDF2.0HiQ2 NNLO
A comparison between HERAPDF2.0 NNLO and HER-APDF1.5 NNLO is provided in Fig. 49. As in the case of theNLO PDFs, a reduction of the uncertainty at high x has beenachieved by including further high-xBj data. There is also areduction of uncertainties at low x . This is mostly due to thebetter stability of the fit under the variation of Q2
min, whichis part of the model uncertainties. The shapes of the HERA-PDF1.5 and HERAPDF2.0 at NNLO are rather similar, butthe gluon distribution at high x has moved to the lower endof its previous uncertainty band.
7.1.3 Comparisons to other sets of PDFs
The PDFs of HERAPDF2.0 NLO and NNLO can be directlycompared to the PDFs of MMHT 2014 [37], for which thesame heavy-flavour scheme, i.e. RTOPT, was used. Com-parisons are also made to the PDFs of CT10 [39,105], forwhich a heavy-flavour-scheme based on ACOT was used,and NNPDF3.0 [44], for which the FONLL scheme wasused. The results are shown in Figs. 50 and 51 for NLO andNNLO, respectively. For the PDFs themselves, the uncer-tainties are only shown for HERAPDF2.0. All uncertaintiesare shown when the ratios of the other PDFs with respectto HERAPDF2.0 are illustrated. Taking the full uncertain-ties into account, all PDFs are compatible. The largest rel-
ative discrepancy (≈2.5σ ) is found in the shape of thexuv distribution at x ≈ 0.4 for both NLO and NNLOPDFs. In addition, at NLO, the gluon distribution of HER-APDF2.0 at high x is softer than that of the other PDFs,whereas at NNLO it is close to their 68 % uncertaintybands.
7.2 HERAPDF2.0HiQ2
Figures 52 and 53 show summaries for HERAPDF2.0 NLOand NNLO as already shown in Figs. 21 and 23 together withthe equivalent plots for HERAPDF2.0HiQ2. The only differ-ence is that HERAPDF2.0 has Q2
min = 3.5 GeV2 while HER-APDF2.0HiQ2 has Q2
min = 10 GeV2. At NLO, the gluondistributions of HERAPDF2.0 and HERAPDF2.0HiQ2 arecompatible within uncertainties. At NNLO, the two gluondistributions differ significantly. Using the higher Q2
min atNNLO causes the gluon distribution to turn over signifi-cantly at low x . The distributions of HERAPDF2.0AG arealso shown in Figs. 52 and 53. They are not very differ-ent for the two Q2
min values. At NNLO, this causes thegluon distribution of HERAPDF2.0AG to be completely dif-ferent than that of the standard parameterisation for x <
10−3.
123

580 Page 48 of 98 Eur. Phys. J. C (2015) 75:580
Fig. 59 The combined low-Q2
HERA data on inclusive NCe+ p reduced cross sections at√s = 318 GeV with overlaid
predictions fromHERAPDF2.0HiQ2 NLO. Thebands represent the totaluncertainty on the predictions.Dotted lines indicateextrapolation into kinematicregions not included in the fit
0
1
0
1
0
1
0
1
0
1
H1 and ZEUSQ2 = 2 GeV2
σ r, N
C
+Q2 = 2.7 GeV2 Q2 = 3.5 GeV2 Q2 = 4.5 GeV2
Q2 = 6.5 GeV2 Q2 = 8.5 GeV2 Q2 = 10 GeV2 Q2 = 12 GeV2
Q2 = 15 GeV2 Q2 = 18 GeV2 Q2 = 22 GeV2 Q2 = 27 GeV2
Q2 = 35 GeV2 Q2 = 45 GeV2
10-3 10-1
Q2 = 60 GeV2
10-3 10-1
Q2 = 70 GeV2
xBjQ2 = 90 GeV2
10-3 10-1
Q2 = 120 GeV2
10-3 10-1
xBj
HERA NC e+p 0.5 fb–1
√s = 318 GeVHERAPDF2.0HiQ2 NLO
7.2.1 Comparison of HERADPF2.0HiQ2 to HERAPDF2.0
A comparison of the NLO PDFs of HERAPDF2.0 to HER-APDF2.0HiQ2 at the scale μ2
f = 10 GeV2 is shown inFig. 54. The different shapes of the gluon distribution atlow x are compatible within uncertainties. In Sect. 6.12,the question arose whether including data from the kine-matic region of low xBj and low Q2, i.e. below 10 GeV2,in the PDF fits would introduce a bias on predictions forhigh xBj and high Q2. Figure 55 demonstrates that at thehigh scale of μ2
f = 10,000 GeV2, the PDFs resulting fromthe two fits are very similar. This confirms that the value ofQ2
min = 3.5 GeV2 is a safe value for pQCD fits to HERA dataand no bias is introduced for applications at higher scales likecross-section predictions for LHC.
A comparison of the NNLO PDFs of HERAPDF2.0 tothose of HERAPDF2.0HiQ2 at the scale μ2
f = 10 GeV2
is shown in Fig. 56. The differences in the gluon distri-butions are pronounced. The gluon distribution of HER-APDF2.0HiQ2 NNLO turns over for x < 10−3. Thevalence distributions at NNLO also differ between HER-APDF2.0HiQ2 and HERAPDF2.0, but they are compatiblewithin uncertainties. At the high scale of μ2
f = 10,000 GeV2,the PDFs resulting from the two fits are, as at NLO, verysimilar, see Fig. 57. This demonstrates that again no bias is
introduced at higher scales when low-xBj and low-Q2 dataare included in the fit at NNLO .
7.2.2 Comparison of HERAPDF2.0HiQ2 to data
Figures 58 and 59 show the predictions of HERAPDF2.0HiQ2 NNLO and NLO compared to the data, which werealready presented and compared to HERAPDF2.0 NNLOand NLO in Figs. 34 and 35. In the region 3.5 ≤ Q2 ≤10 GeV2, the standard HERAPDF2.0 NLO fit compromisesbetween describing the low-xBj (high-y) turnover, for whichit is too high, and the data at slightly higher xBj, for whichit is too low. In the corresponding HERAPDF2.0HiQ2 fit,these data are not fitted. The resulting fit, when extrapolatedto the excluded region, is systematically lower than the dataat lower xBj and lower Q2, but then is significantly abovethe data at very low xBj, where the contribution from FL
becomes important. This implies that the pQCD fit evolvesmore strongly towards lower xBj and Q2 than does the data.The situation is not improved at NNLO where the fit evolveseven more strongly. This suggests that the conventionalDGLAP resummation may not be fully adequate. This obser-vation was also made during investigations of the HERA Idata [104].
123

Eur. Phys. J. C (2015) 75:580 Page 49 of 98 580
x-410 -310 -210 -110 1
xf
0.2
0.4
0.6
0.8
1
vxu
vxd
0.05)×(xg
0.05)×(xS
2 = 10 GeV2f
μHERAPDF2.0FF3A NLOuncertainties:experimentalmodelparameterisation
H1 and ZEUS
x-410 -310 -210 -110 1
xf
0.2
0.4
0.6
0.8
1
vxu
vxd
0.05)×(xg
0.05)×(xS
2 = 10 GeV2f
μHERAPDF2.0FF3B NLOuncertainties:experimentalmodelparameterisation
H1 and ZEUS
Fig. 60 The parton distribution functions xuv , xdv , xS = 2x(U + D)
and xg of HERAPDF2.0FF3A NLO and HERAPDF2.0FF3B NLO, atμ2
f = 10 GeV2. The experimental, model and parameterisation uncer-tainties are shown
7.3 HERAPDF2.0FF
Summaries of HERAPDF2.0FF3A and HERAPDF2.0FF3Bas introduced in Sect. 6.9 are shown in Fig. 60. The experi-mental, model and parameterisation uncertainties were eval-uated as for the standard HERAPDF2.0 NLO, see Sects. 6.4and 6.5, and are shown separately.
A comparison of the PDFs of HERAPDF2.0FF3A andHERAPDF2.0FF3B to the standard HERAPDF2.0 NLO
using the RTOPT heavy-flavour scheme is shown in Fig. 61.This comparison is presented at the starting scale μf0 ,because a meaningful comparison can only be done at scalesbelow the charm mass. There are differences in the valenceand in the gluon distributions. The latter originate mainlyfrom the different O(αs) at which the massless contributionto FL is calculated and on theαs evolution scheme. A compar-ison of the predictions from HERAPDF2.0FF3B and HER-APDF2.0 NLO to selected data as already used for Fig. 30is shown in Fig. 62. The predictions are very similar. How-ever, at low xBj and low Q2, the Q2 dependence predictedfrom HERAPDF2.0FF3B is a bit less steep than the predic-tion from HERAPDF2.0 NLO. The predictions of HERA-PDF2.0FF3A are also very similar. The Q2 dependence pre-dicted from HERAPDF2.0FF3A is however slightly steeperthan the prediction from HERAPDF2.0 NLO at low xBj andlow Q2.
A comparison of the PDFs of HERAPDF2.0FF3A to thePDFs of ABM11 FF [42] is shown in Fig. 63. These twosets of PDFs can be directly compared as they use the sameorder for the description of FL and the same αs evolution.The largest difference is observed for the xdv distribution.However, overall the two sets of PDFs are quite similar.
A comparison of the PDFs of HERAPDF2.0FF3B to thePDFs of NNPDF3.0 FF(3N) [44] is shown in Fig. 64. Thesetwo sets of PDFs can be directly compared at the startingscale due to their equivalent treatment of the FL contributionand of the αs evolution.12 The gluon distributions are quitesimilar. Some differences are observed in the xuv and xdv
valence distributions.
7.4 HERAPDF2.0Jets
Data on jet production were included in the analysis asdescribed in Sect. 6.11. This inclusion was first used to vali-date the choice of αs(M2
Z ) = 0.118 for HERAPDF by inves-tigating the dependence of the χ2s of the HERAPDF pQCDfits on αs(M2
Z ). Three χ2 scans vs. the value of αs(M2Z )
were performed at NLO for three values of Q2min. The result
is depicted in the top panel of Fig. 65. A distinct minimum atαs(M2
Z ) ≈ 0.118 is observed, which is basically independentof Q2
min. This validates the choice of αs(M2Z ) = 0.118 for
HERAPDF2.0 NLO. Scans at NLO and NNLO were alsoperformed for fits to inclusive data only. The middle andbottom panels of Fig. 65 show that these scans yielded sim-ilar shallow χ2 dependences and the minima were strongly
12 The NNPDF3.0FF(3N) is based on a fixed number of flavours, NF=3,evolution, but it is calculated from the FONLL-B fit, which is based ona variable NF evolution [44,106]. Thus, close to the starting scale, thePDFs of NNPDF3.0FF(3N) can be directly compared to the PDFs ofHERAPDF2.0FF3B, which are also based on a variable NF evolution.
123

580 Page 50 of 98 Eur. Phys. J. C (2015) 75:580
Fig. 61 The parton distributionfunctions xuv , xdv , xg andxS = 2x(U + D) ofHERAPDF2.0FF3A and FF3Bat the starting scaleμ2
f0= 1.9 GeV2 compared to
those of HERAPDF2.0 NLO.The top panel shows thedistributions. The bottom panelshows the PDFs normalised toHERAPDF2.0 NLO. Theuncertainties are given asdifferently hatched bands inboth panels
x-410 -310 -210 -110 1
xuv
0
0.2
0.4
0.6
0.8
1 2 = 1.9 GeVf2μ
HERAPDF2.0 NLOHERAPDF2.0 FF3A NLOHERAPDF2.0 FF3B NLO
x-410 -310 -210 -110 1
xdv
0
0.1
0.2
0.3
0.4
0.5
x-410 -310 -210 -110 1
xg
-1
0
1
2
3
4
x-410 -310 -210 -110 1
xS
0
0.5
1
1.5
2
H1 and ZEUS
x -410 -310 -210 -110 1
xu
/ xu
(HE
RA
PDF2
.0)
vv
0
0.5
1
1.5
2
2.5
x -410 -310 -210 -110 1
xd
/ xd
(HE
RA
PDF2
.0)
vv
0
0.5
1
1.5
2
2.5 2 = 1.9 GeVf2μ
HERAPDF2.0 NLOHERAPDF2.0 FF3A NLOHERAPDF2.0 FF3B NLO
x -410 -310 -210 -110 1
xg /
xg(H
ER
APD
F2.0
)
0
0.5
1
1.5
2
2.5
x -410 -310 -210 -110 1
xS /
xS(H
ER
APD
F2.0
)
0
0.5
1
1.5
2
2.5
H1 and ZEUS
123

Eur. Phys. J. C (2015) 75:580 Page 51 of 98 580
H1 and ZEUS
0
0.2
0.4
0.6
0.8
1
1.2
1.4
1 10 102 103 104 105
HERA NC e+p 0.5 fb–1
HERAPDF2.0 FF3B
HERAPDF2.0 NLO
√s = 318 GeVxBj = 0.0002xBj = 0.002
xBj = 0.008
xBj = 0.032
xBj = 0.08
xBj = 0.13
xBj = 0.25
xBj = 0.4
Q2/ GeV2
σ r, N
C
+
Fig. 62 Selected combined HERA inclusive NC e+ p reduced crosssections compared to predictions of HERAPDF2.0 NLO and HER-APDF2.0FF3B. The two differently shaded bands represent the totaluncertainties on the two predictions
dependent on the Q2min. This demonstrates that the inclusive
data alone cannot constrain αs(M2Z ) reasonably.
7.4.1 PDFs and measurement of αs(M2Z )
The PDFs resulting from a fit with free αs(M2Z ), HERA-
PDF2.0Jets, and from a fit with fixed αs(M2Z ) = 0.118 are
shown in Fig. 66. A full uncertainty analysis was performedin both cases, including model and parameterisation uncer-tainties as well as additional hadronisation uncertainties onthe jet data. The PDFs are very similar, because the HERA-PDF2.0Jets fit with free αs(M2
Z ) yields a value which is veryclose to the value used for the fit with fixed αs(M2
Z ). The jetdata determine the value of αs(M2
Z ) very well in the HER-APDF2.0Jets fit. Thus, the uncertainty on αs(M2
Z ) in this fitdoes not significantly increase the uncertainty on the gluonPDF with respect to the fit with αs(M2
Z ) fixed. The differ-ence in the αs(M2
Z ) free fit is mostly due to extra uncertaintycoming from the hadronisation corrections.
The PDFs from the HERAPDF2.0Jets fit with αs(M2Z ) =
0.118 fixed are also very similar to the standard PDFs fromHERAPDF2.0 NLO. This is demonstrated in Fig. 67. Thisis again the result of the choice of αs(M2
Z ) = 0.118 forHERAPDF2.0 which is also the preferred value for HERA-PDF2.0Jets. Consequently, there is only a small reduction ofthe uncertainty on the gluon distribution observed for HER-APDF2.0Jets.
Theχ2 of the HERAPDF2.0Jets fit with freeαs(M2Z ) is the
same as for the fit with fixed αs(M2Z ) = 0.118, see Table 4.
This is again due the fact that the value of αs(M2Z ) obtained
from the fit is very close to the value previously fixed. Thestrong coupling constant obtained is
αs(M2Z ) = 0.1183 ± 0.0009(exp)
±0.0005(model/parameterisation)
±0.0012(hadronisation)+0.0037−0.0030(scale).
The uncertainty on αs(M2Z ) due to scale uncertainties was
evaluated by varying the renormalisation and factorisationscales by a factor of two, both separately and simultane-ously, and taking the maximal positive and negative devi-ations. The uncertainties were assumed to be 50 % corre-lated and 50 % uncorrelated between bins and data sets.This resulted in an asymmetric uncertainty of +0.0037 and−0.0030. The result on αs(M2
Z ) is compatible with the worldaverage [52] and it is competitive with other determinations atNLO.
7.4.2 Comparison of HERAPDF2.0Jets to data
The predictions of HERAPDF2.0Jets with free αs(M2Z ) are
shown together with the charm input data [46] in Fig. 68. Thedescription of the data is excellent.
Comparisons of the predictions of HERAPDF2.0Jets tothe data on jet production used as input are shown in Figs. 69,70, 71, 72 and 73. All analyses were performed using theassumption of massless jets, i.e. the transverse energy, ET ,and the transverse momentum of a jet, pT , are equivalent. Forinclusive jet analyses, each jet is entered separately with itspT . For dijet and trijet analyses, the average of the transversemomenta is used as pT . These different definitions of pTwere also used to set the renormalisation scale to μ2
r = (Q2+p2T )/2 for calculating predictions. The factorisation scale was
chosen as μ2f = Q2. Scale uncertainties were not considered
for the comparisons to data.Data from H1 on differential cross sections, dσ/dpT , at
low Q2 [49] and high Q2 [50] are presented in Fig. 69together with the predictions of HERAPDF2.0Jets. The high-Q2 data are normalised to the inclusive NC cross sections.Each event causes as many entries as there are jets. Data fromZEUS on differential cross-sections, dσ/dpT , at high Q2 forinclusive [47] and dijet [48] production are shown in Fig. 70together with the predictions of HERAPDF2.0Jets. Finally,H1 inclusive-jet, dijet and trijet cross sections normalised toinclusive NC cross sections [51] are presented in Figs. 71,72 and 73. The description of all the data on jet productionby HERAPDF2.0Jets NLO is excellent.
123
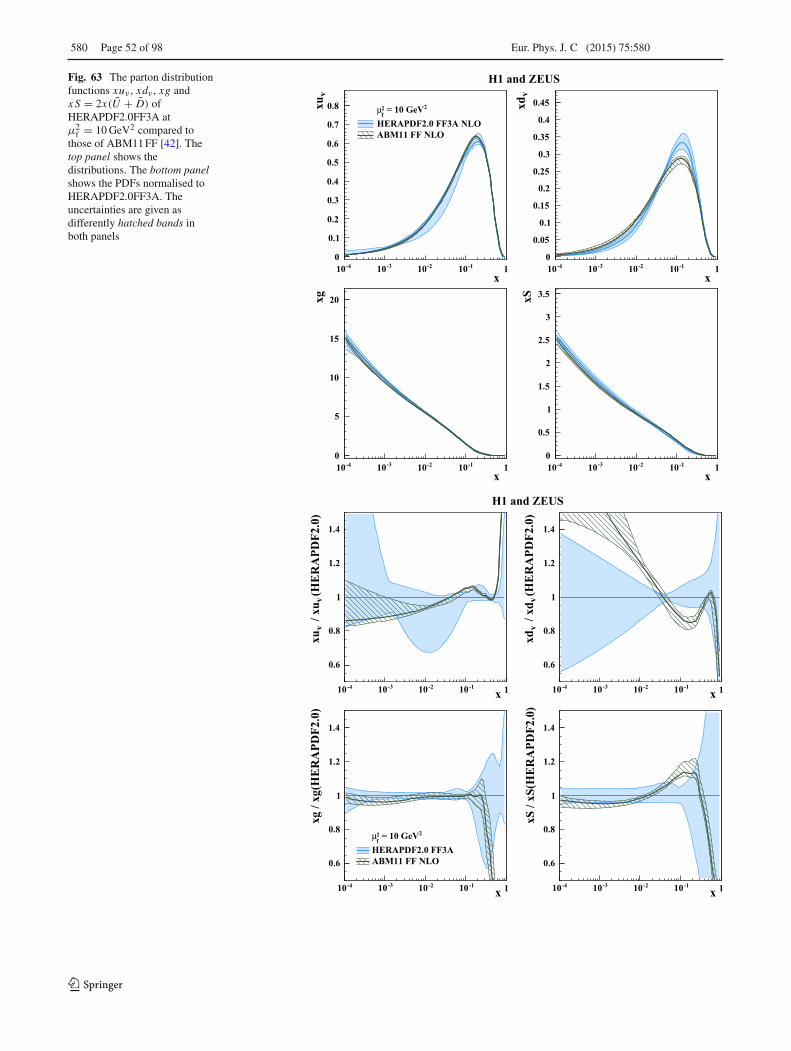
580 Page 52 of 98 Eur. Phys. J. C (2015) 75:580
Fig. 63 The parton distributionfunctions xuv , xdv , xg andxS = 2x(U + D) ofHERAPDF2.0FF3A atμ2
f = 10 GeV2 compared tothose of ABM11 FF [42]. Thetop panel shows thedistributions. The bottom panelshows the PDFs normalised toHERAPDF2.0FF3A. Theuncertainties are given asdifferently hatched bands inboth panels
x-410 -310 -210 -110 1
xuv
0
0.1
0.2
0.3
0.4
0.5
0.6
0.7
0.8 2 = 10 GeVf2μ
HERAPDF2.0 FF3A NLOABM11 FF NLO
x-410 -310 -210 -110 1
xdv
0
0.05
0.1
0.15
0.2
0.25
0.3
0.35
0.4
0.45
x-410 -310 -210 -110 1
xg
0
5
10
15
20
x-410 -310 -210 -110 1
xS
0
0.5
1
1.5
2
2.5
3
3.5
H1 and ZEUS
x -410 -310 -210 -110 1
xu
/ xu
(HE
RA
PDF2
.0)
vv
0.6
0.8
1
1.2
1.4
x -410 -310 -210 -110 1
xd
/ xd
(HE
RA
PDF2
.0)
vv
0.6
0.8
1
1.2
1.4
x -410 -310 -210 -110 1
xg /
xg(H
ER
APD
F2.0
)
0.6
0.8
1
1.2
1.4
2 = 10 GeVf2μ
HERAPDF2.0 FF3AABM11 FF NLO
x -410 -310 -210 -110 1
xS /
xS(H
ER
APD
F2.0
)
0.6
0.8
1
1.2
1.4
H1 and ZEUS
123

Eur. Phys. J. C (2015) 75:580 Page 53 of 98 580
Fig. 64 The parton distributionfunctions xuv , xdv , xg andxS = 2x(U + D) ofHERAPDF2.0FF3B at thestarting scale μ2
f0= 1.9 GeV2
compared to those ofNNPDF3.0FF (3N). The toppanel shows the distributions.The bottom panel shows thePDFs normalised toHERAPDF2.0FF3B. Theuncertainties are given asdifferently hatched bands inboth panels
x-410 -310 -210 -110 1
xuv
0
0.2
0.4
0.6
0.8
1 2 = 1.9 GeVf2μ
HERAPDF2.0 FF3B NLONNPDF3.0FF(3N) NLO
x-410 -310 -210 -110 1
xdv
0
0.1
0.2
0.3
0.4
0.5
x-410 -310 -210 -110 1
xg
-1
0
1
2
3
x-410 -310 -210 -110 1
xS
0
0.2
0.4
0.6
0.8
1
1.2
1.4
1.6
1.8
H1 and ZEUS
x -410 -310 -210 -110
xu
/ xu
(HE
RA
PDF2
.0)
vv
0
0.5
1
1.5
2
2.5 2 = 1.9 GeVf2μHERAPDF2.0 FF3B NLONNPDF3.0FF(3N) NLO
x -410 -310 -210 -110 11
xd
/ xd
(HE
RA
PDF2
.0)
vv
0
0.5
1
1.5
2
2.5
x -410 -310 -210 -110 1
xg /
xg(H
ER
APD
F2.0
)
0
0.5
1
1.5
2
2.5
x -410 -310 -210 -110 1
xS /
xS(H
ER
APD
F2.0
)
0
0.5
1
1.5
2
2.5
H1 and ZEUS
123
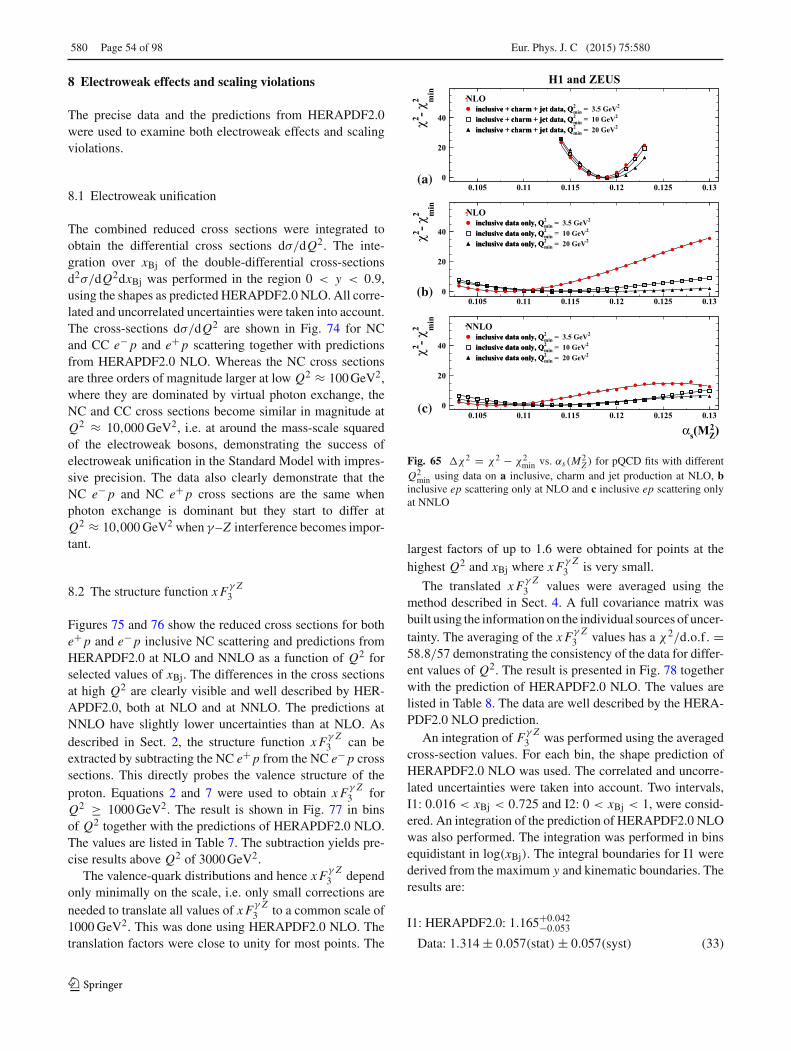
580 Page 54 of 98 Eur. Phys. J. C (2015) 75:580
8 Electroweak effects and scaling violations
The precise data and the predictions from HERAPDF2.0were used to examine both electroweak effects and scalingviolations.
8.1 Electroweak unification
The combined reduced cross sections were integrated toobtain the differential cross sections dσ/dQ2. The inte-gration over xBj of the double-differential cross-sectionsd2σ/dQ2dxBj was performed in the region 0 < y < 0.9,using the shapes as predicted HERAPDF2.0 NLO. All corre-lated and uncorrelated uncertainties were taken into account.The cross-sections dσ/dQ2 are shown in Fig. 74 for NCand CC e− p and e+ p scattering together with predictionsfrom HERAPDF2.0 NLO. Whereas the NC cross sectionsare three orders of magnitude larger at low Q2 ≈ 100 GeV2,where they are dominated by virtual photon exchange, theNC and CC cross sections become similar in magnitude atQ2 ≈ 10,000 GeV2, i.e. at around the mass-scale squaredof the electroweak bosons, demonstrating the success ofelectroweak unification in the Standard Model with impres-sive precision. The data also clearly demonstrate that theNC e− p and NC e+ p cross sections are the same whenphoton exchange is dominant but they start to differ atQ2 ≈ 10,000 GeV2 when γ –Z interference becomes impor-tant.
8.2 The structure function xFγ Z3
Figures 75 and 76 show the reduced cross sections for bothe+ p and e− p inclusive NC scattering and predictions fromHERAPDF2.0 at NLO and NNLO as a function of Q2 forselected values of xBj. The differences in the cross sectionsat high Q2 are clearly visible and well described by HER-APDF2.0, both at NLO and at NNLO. The predictions atNNLO have slightly lower uncertainties than at NLO. Asdescribed in Sect. 2, the structure function xFγ Z
3 can beextracted by subtracting the NC e+ p from the NC e− p crosssections. This directly probes the valence structure of theproton. Equations 2 and 7 were used to obtain xFγ Z
3 forQ2 ≥ 1000 GeV2. The result is shown in Fig. 77 in binsof Q2 together with the predictions of HERAPDF2.0 NLO.The values are listed in Table 7. The subtraction yields pre-cise results above Q2 of 3000 GeV2.
The valence-quark distributions and hence xFγ Z3 depend
only minimally on the scale, i.e. only small corrections areneeded to translate all values of xFγ Z
3 to a common scale of1000 GeV2. This was done using HERAPDF2.0 NLO. Thetranslation factors were close to unity for most points. The
H1 and ZEUS
0
20
40
0.105 0.11 0.115 0.12 0.125 0.13
χ2 -χm
in
2 NLOinclusive + charm + jet data, Q2inclusive + charm + jet data, Qmin = 3.5 GeV2
inclusive + charm + jet data, Q2inclusive + charm + jet data, Qmin = 10 GeV2
inclusive + charm + jet data, Q2inclusive + charm + jet data, Qmin = 20 GeV2
0
20
40
0.105 0.11 0.115 0.12 0.125 0.13
χ2 -χm
in
2 NLOinclusive data only, Q2inclusive data only, Qmin = 3.5 GeV2
inclusive data only, Q2inclusive data only, Qmin = 10 GeV2
inclusive data only, Q2inclusive data only, Qmin = 20 GeV2
0
20
40
0.105 0.11 0.115 0.12 0.125 0.13
αs(MZ2)
χ2 -χm
in
2 NNLOinclusive data only, Q2inclusive data only, Qmin = 3.5 GeV2
inclusive data only, Q2inclusive data only, Qmin = 10 GeV2
inclusive data only, Q2inclusive data only, Qmin = 20 GeV2
(a)
(b)
(c)
Fig. 65 �χ2 = χ2 − χ2min vs. αs(M2
Z ) for pQCD fits with differentQ2
min using data on a inclusive, charm and jet production at NLO, binclusive ep scattering only at NLO and c inclusive ep scattering onlyat NNLO
largest factors of up to 1.6 were obtained for points at thehighest Q2 and xBj where xFγ Z
3 is very small.
The translated xFγ Z3 values were averaged using the
method described in Sect. 4. A full covariance matrix wasbuilt using the information on the individual sources of uncer-tainty. The averaging of the xFγ Z
3 values has a χ2/d.o.f. =58.8/57 demonstrating the consistency of the data for differ-ent values of Q2. The result is presented in Fig. 78 togetherwith the prediction of HERAPDF2.0 NLO. The values arelisted in Table 8. The data are well described by the HERA-PDF2.0 NLO prediction.
An integration of Fγ Z3 was performed using the averaged
cross-section values. For each bin, the shape prediction ofHERAPDF2.0 NLO was used. The correlated and uncorre-lated uncertainties were taken into account. Two intervals,I1: 0.016 < xBj < 0.725 and I2: 0 < xBj < 1, were consid-ered. An integration of the prediction of HERAPDF2.0 NLOwas also performed. The integration was performed in binsequidistant in log(xBj). The integral boundaries for I1 werederived from the maximum y and kinematic boundaries. Theresults are:
I1: HERAPDF2.0: 1.165+0.042−0.053
Data: 1.314 ± 0.057(stat) ± 0.057(syst) (33)
123

Eur. Phys. J. C (2015) 75:580 Page 55 of 98 580
0.2
0.4
0.6
0.8
1
-410 -310 -210 -110 1
) = 0.118 Z2(Msα HERAPDF2.0Jets NLO, fixed
uncertainties:
experimental
model
hadronisation
parameterisation
x
xf 2 = 10 GeV2f
μ
vxu
vxd
0.05)×xS (
0.05)×xg (
H1 and ZEUS
0.2
0.4
0.6
0.8
1
-410 -310 -210 -110 1
) Z2(Msα HERAPDF2.0Jets NLO, free
uncertainties:
experimental
model
hadronisation
parameterisation
x
xf 2 = 10 GeV2f
μ
vxu
vxd
0.05)×xS (
0.05)×xg (
H1 and ZEUS
Fig. 66 The parton distribution functions xuv , xdv , xS = 2x(U +D) and xg of HERAPDF2.0Jets NLO at μ2
f = 10 GeV2 with fixedαs(M2
Z ) = 0.118 (top) and free αs(M2Z ) (bottom). The experimental,
model and parameterisation uncertainties are shown. The hadronisationuncertainty is also included, but it is only visible for the fit with freeαs(M2
Z )
I2: HERAPDF2.0: 1.588+0.078−0.100
Data: 1.790 ± 0.078(stat) ± 0.078(syst) (34)
The values from HERAPDF2.0 and data agree within uncer-tainties. For I2, they are also close to the QPM prediction of5/3 from the integration of Eq. 8.
0.2
0.4
0.6
0.8
1
-410 -310 -210 -110 1
HERAPDF2.0 NLO
) = 0.118Z
(Msα HERAPDF2.0Jets NLO, fixed
HERAPDF2.0 NLO
HERAPDF2.0Jets NLO
xxf
2 = 10 GeV2f
μ
vxu
vxd 0.05)×xS (
0.05)×xg (
H1 and ZEUS
0.2
0.4
0.6
0.8
1
0 0.2 0.4 0.6 0.8 1
HERAPDF2.0 NLO
) = 0.118 Z
(Msα HERAPDF2.0Jets NLO, fixed
HERAPDF2.0 NLO
HERAPDF2.0Jets NLO
x
xf
2 = 10 GeV2f
μ
vxu
vxd
xS
xg
H1 and ZEUS
Fig. 67 The parton distribution functions xuv , xdv , xS = 2x(U + D)
and xg of HERAPDF2.0Jets NLO at μ2f = 10 GeV2 compared to those
of HERAPDF2.0 NLO on logarithmic (top) and linear (bottom) scales.The fits were done with fixed αs(M2
Z ) = 0.118. The bands representthe total uncertainties
8.3 Helicity effects in CC interactions
Figures 79 and 80 present the reduced cross sections for CCinclusive e+ p and e− p scattering. The e+ p cross sections areaffected strongly by the helicity factor (1 − y)2, see Eq. 12.
123

580 Page 56 of 98 Eur. Phys. J. C (2015) 75:580
Fig. 68 The HERA reducedcross sections for charmproduction with overlaidpredictions of theHERAPDF2.0Jets NLO fit. Thebands represent the totaluncertainty on the predictionsexcluding scale uncertainties.Dotted lines indicateextrapolation into kinematicregions not included in the fit
0
0.1
0.2
0.3
0.4
0
0.2
0.4
0
0.1
0.2
0.3
H1 and ZEUS
Q2 = 2.5 GeV2
σ r, c
harm
Q2 = 5 GeV2 Q2 = 7 GeV2 Q2 = 12 GeV2 Q2 = 18 GeV2
Q2 = 32 GeV2 Q2 = 60 GeV2 Q2 = 120 GeV2
10-4 10-2
Q2 = 200 GeV2
10-4 10-2
xBj
Q2 = 350 GeV2
10-4 10-2
Q2 = 650 GeV2
10-4 10-2 10-4 10-2
Q2 = 2000 GeV2
xBj
HERA charm
HERAPDF2.0Jets NLO
Therefore, the contribution of the valence quarks is supressedat high y which translates to high Q2 for fixed xBj. The e− pcross section is almost unaffected, because the helicity factorapplies to the anti-quarks which as part of the sea are alreadysupressed at high xBj.
8.4 Scaling violations
Scaling violations, i.e. the dependence of the structure func-tions on Q2 at fixed xBj, are a consequence of the stronginteractions between the partons in the nucleon. The largerthe kinematic range, the more clearly these violations aredemonstrated. They have been used to extract the gluon con-tent of the proton.
Figures 81 and 82 show the inclusive NC e+ p and e− pHERA data together with fixed-target data [107,108] and thepredictions of HERAPDF2.0 NLO and NNLO, respectively.The data presented span more than four orders of magnitude,both in Q2 and xBj. The scaling violations are clearly visibleand are well described by HERAPDF2.0, both at NLO andNNLO. The scaling violations were also already clearly vis-ible in Fig. 30, in which a close-up for a particular kinematicrange was presented.
The structure function F2, see Eq. 1, can be displayed asa function of xBj at fixed Q2. For the part of the phase spacewhere both x F3 and FL are small, the simple expression
F2 = σ±r,NC · Fpredicted
2
σ±r,NC
predicted= σ±
r,NC · (1 + CF ) (35)
can be used to extract the values of F2. Selected values andHERAPDF2.0 NLO predictions for F2, for which the cor-rection |CF | < 0.1, are shown in Fig. 83.
The function F2 rises toward low xBj at fixed Q2. Thescaling violations manifest themselves by the rise becomingsteeper as Q2 increases. In the conventional framework ofpQCD, this implies an increasing gluon density. The predic-tions of HERAPDF2.0 NLO describe the data well.
9 Summary and conclusions
The H1 and ZEUS collaborations measured inclusive e± pscattering cross sections at HERA from 1994 to 2007, col-lecting a total integrated luminosity of about 1 fb−1. Thedata were taken in two different beam configurations, calledHERA I and HERA II, at four different centre-of-mass ener-gies and with two different detectors changing and improv-ing over time. All inclusive data were combined to create oneconsistent set of NC and CC cross-section measurements forunpolarised e± p scattering, spanning six orders of magnitudein both negative four-momentum-transfer squared, Q2, andBjorken x . The data from many measurements made inde-pendently by the two collaborations proved to be consistentwith a χ2 per degree of freedom being 1.04 for the combina-tion. Combined cross sections are provided for values of Q2
between Q2 = 0.045 GeV2 and Q2 = 50,000 GeV2 and val-ues of xBj between xBj = 6×10⁻⁷ and xBj = 0.65. They arethe most precise measurements ever published for ep scat-tering over such a large kinematic range and have been used
123

Eur. Phys. J. C (2015) 75:580 Page 57 of 98 580
Fig. 69 a Differential jet crosssections, dσ/dpT , normalised toNC inclusive cross sections, inbins of Q2 between 150 and15,000 GeV2 as measured byH1. b Differential jet crosssections, dσ/dpT , in bins of Q2
between 5 and 100 GeV2 asmeasured by H1. Also shownare predictions fromHERAPDF2.0Jets. The bandsrepresent the total uncertaintieson the predictions excludingscale uncertainties
H1 and ZEUS
10-2
10-1
1
10
dσ/d
p T (p
b/G
eV)
5 < Q2 < 7 GeV2 7 < Q2 < 10 GeV2 10 < Q2 < 15 GeV2
10-2
10-1
1
10
15 < Q2 < 20 GeV2 20 < Q2 < 30 GeV2
10 50
30 < Q2 < 40 GeV2
10 50
pT / GeV
10-310-210-1
1
10
40 < Q2 < 100 GeV2
10 50
pT / GeV
H1 low Q2 jets
HERAPDF2.0Jets NLO
(a)
(b)
H1 and ZEUS
10-3
10-2
10-1
σ jet /
σ NC
150 < Q2 < 200 GeV2 200 < Q2 < 270 GeV2 270 < Q2 < 400 GeV2
10 30
pT / GeV
400 < Q2 < 700 GeV2
10 30
10-3
10-2
10-1
700 < Q2 < 5000 GeV2
10 30
5000 < Q2 < 15000 GeV2
10 30
pT / GeV
H1 HERA I normalised jets
HERAPDF2.0Jets NLO
to illustrate scaling violation. The precision of the data hasalso been exploited to illustrate electroweak unification andextract xFγ Z
3 above Q2 = 1000 GeV2.The inclusive cross sections were used as input to a QCD
analysis within the DGLAP formalism. In order to con-strain the heavy-quark mass parameters, additional informa-tion from data on charm and beauty production at HERAwas used. The resulting parton distribution functions aredenoted HERAPDF2.0 and are available at LO, NLO andNNLO. They were calculated for a series of fixed values ofαs(M2
Z ) around the central value of 0.118. HERAPDF2.0has small experimental uncertainties due to the high preci-sion and coherence of the input data. Parameterisation and
model uncertainties have also been estimated. HERAPDF2.0makes precise predictions which describe the input data well.
The heavy-flavour scheme used for HERAPDF2.0 isRTOPT, a variable-flavour number scheme. Two variantsHERAPDF2.0 FF3A and FF3B, using fixed-flavour numberschemes, are also available at NLO.
The perturbative QCD fits yielding HERAPDF2.0 arebased on data with Q2 above 3.5 GeV2. Their χ2/d.o.f.values are around 1.2. An extensive investigation includedfits with different Q2
min, below which data were excluded.For Q2
min = 10 GeV2, a full set of PDFs named HERA-PDF2.0HiQ2 is also released. These fits have an improvedχ2/d.o.f. of about 1.15. However, the resulting PDFs do
123

580 Page 58 of 98 Eur. Phys. J. C (2015) 75:580
Fig. 70 a Differential jet crosssections, dσ/dpT , in bins of Q2
between 125 and 10,000 GeV2
as measured by ZEUS. bDifferential dijet cross sections,dσ/d〈pT 〉2, in bins of Q2
between 125 and 20,000 GeV2
as measured by ZEUS. Thevariable 〈pT 〉2 denotes theaverage pT of the two jets. Alsoshown are predictions fromHERAPDF2.0Jets. The bandsrepresent the total uncertaintyon the predictions excludingscale uncertainties
H1 and ZEUS
10-2
10-1
1
10
d σ/d
<pT> 2 (
pb/G
eV)
125 < Q2 < 250 GeV2 250 < Q2 < 500 GeV2 500 < Q2 < 1000 GeV2
<pT>2 / GeV
1000 < Q2 < 2000 GeV2
10-3
10-2
10-1
2000 < Q2 < 5000 GeV2 5000 < Q2 < 20000 GeV2
<pT>2 / GeV
ZEUS dijetsHERAPDF2.0Jets NLO
H1 and ZEUS
10-3
10-2
10-1
1
10
dσ/d
p T (p
b/G
eV)
125 < Q2 < 250 GeV2 250 < Q2 < 500 GeV2 500 < Q2 < 1000 GeV2
pT / GeV
1000 < Q2 < 2000 GeV2
10 50 10 50
10 50 10 50
10-3
10-2
10-1
1
2000 < Q2 < 5000 GeV2 5000 < Q2 < 10000 GeV2
10 50 10 50
10 50 10 50
pT / GeV
ZEUS inclusive jets
HERAPDF2.0Jets NLO
(a)
(b)
Fig. 71 Differential jet crosssections, dσ/dpT . All crosssections are normalised to NCinclusive cross sections. Alsoshown are predictions fromHERAPDF2.0Jets. The bandsrepresent the total uncertaintieson the predictions excludingscale uncertainties
H1 and ZEUS
10-3
10-2
10-1
150 < Q2 < 200 GeV2
σ jet /
σ NC
200 < Q2 < 270 GeV2 270 < Q2 < 400 GeV2
pT / GeV
400 < Q2 < 700 GeV2
10-2
10-1
700 < Q2 < 5000 GeV2
10 40 10 40
10 40
5000 < Q2 < 15000 GeV2
10 40
pT / GeV
H1 normalised inclusive jets
HERAPDF2.0Jets NLO
123

Eur. Phys. J. C (2015) 75:580 Page 59 of 98 580
Fig. 72 Differential dijet crosssections, dσ/d〈pT 〉2, in bins ofQ2 between 150 and15,000 GeV2 as measured byH1. The variable 〈pT 〉2 denotesthe average pT of the two jets.All cross sections arenormalised to NC inclusivecross sections. Also shown arepredictions fromHERAPDF2.0Jets. The bandsrepresent the total uncertaintieson the predictions excludingscale uncertainties
H1 and ZEUS
10-3
10-2
10-1
σ jet /
σ NC
150 < Q2 < 200 GeV2 200 < Q2 < 270 GeV2 270 < Q2 < 400 GeV2
<pT>2 / GeV
400 < Q2 < 700 GeV2
10-3
10-2
10-1
700 < Q2 < 5000 GeV2 5000 < Q2 < 15000 GeV2
<pT>2 / GeV
10 40 10 40
10 40 10 40
H1 normalised dijetsHERAPDF2.0Jets NLO
Fig. 73 Differential trijet crosssections, dσ/d〈pT 〉3, in bins ofQ2 between 150 and15,000 GeV2 as measured byH1. The variable 〈pT 〉3 denotesthe average pT of the three jets.All cross sections arenormalised to NC inclusivecross sections. Also shown arepredictions fromHERAPDF2.0Jets. The bandsrepresent the total uncertaintieson the predictions excludingscale uncertainties
H1 and ZEUS
10-3
10-2
σ jet /
σ NC
150 < Q2 < 200 GeV2 200 < Q2 < 270 GeV2
10
270 < Q2 < 400 GeV2
10<pT>3 / GeV
400 < Q2 < 700 GeV2
10-3
10-2
10
700 < Q2 < 5000 GeV2
10
5000 < Q2 < 15000 GeV2
<pT>3 / GeV
H1 normalised trijets
HERAPDF2.0Jets NLO
not describe the data in the excluded low-Q2 region well.HERAPDF2.0 shows tensions between data and fit, indepen-dent of the heavy-flavour scheme used, at low Q2, i.e. belowQ2 = 15 GeV2, and at high Q2, i.e. above Q2 = 150 GeV2.Comparisons between the behaviour of the fits with differ-ent Q2
min values indicate that the NLO theory evolves fasterthan the data towards lower Q2 and x . Fits at NNLO donot improve the agreement. HERAPDF2.0 NNLO and NLOhave a similar fit quality.
A measurement of αs(M2Z ) was made using a perturba-
tive QCD fit for which the inclusive cross sections were aug-
mented with selected jet- and charm-production cross sec-tions as measured by both the H1 and ZEUS collaborations.The value obtained is αs(M2
Z ) = 0.1183 ± 0.0009(exp) ±0.0005(model/parameterisation) ± 0.0012(hadronisation)+0.0037−0.0030(scale). This value is in excellent agreement with thevalue of the world average αs(M2
Z ) = 0.1185 [109]. Theset of PDFs obtained from the analysis with free αs(M2
Z ) isreleased as HERAPDF2.0Jets.
The precision data on inclusive ep scattering presented inthis paper are one of the main legacies of HERA.
123

580 Page 60 of 98 Eur. Phys. J. C (2015) 75:580
2 / GeV2Q310 410
)2 (p
b/G
eV2
/dQ
σd
-710
-510
-310
-110
H1 and ZEUS
y < 0.9 = 318 GeVs
-1p 0.4 fb-HERA NC e-1p 0.5 fb+HERA NC e
p-HERAPDF2.0 NC e
p+HERAPDF2.0 NC e
-1p 0.4 fb-HERA CC e-1p 0.5 fb+HERA CC e
p-HERAPDF2.0 CC e
p+HERAPDF2.0 CC e
2 / GeV2Q310 410
)2 (p
b/G
eV2
/dQ
σd
-710
-510
-310
-110
10
Fig. 74 The combined HERA NC and CC e− p and e+ p cross sec-tions, dσ/dQ2, together with predictions from HERAPDF2.0 NLO.The bands represent the total uncertainty on the predictions
H1 and ZEUS
xBj = 0.02 (x575)xBj = 0.032 (x400)
xBj = 0.05 (x270)
xBj = 0.08 (x170)
xBj = 0.13 (x80)
xBj = 0.18 (x20)
xBj = 0.25 (x6)
xBj = 0.40 (x2)
xBj = 0.65
Q2/ GeV2
σ r, N
C HERA√s = 318 GeV
HERAPDF2.0 NLO√s = 318 GeV
NC e+p 0.5 fb–1
NC e p 0.4 fb–1–NC e+pNC e p–
10-2
10-1
1
10
102
103
102 103 104 105
Fig. 75 The combined HERA data for the inclusive NC e+ p and e− preduced cross sections as a function of Q2 for selected values of xBj at√s = 318 GeV with overlaid predictions of HERAPDF2.0 NLO. The
bands represent the total uncertainties of the predictions
H1 and ZEUS
xBj = 0.02 (x575)xBj = 0.032 (x400)
xBj = 0.05 (x270)
xBj = 0.08 (x170)
xBj = 0.13 (x80)
xBj = 0.18 (x20)
xBj = 0.25 (x6)
xBj = 0.40 (x2)
xBj = 0.65
Q2/ GeV2
σ r, N
C HERA√s = 318 GeV
HERAPDF2.0 NNLO√s = 318 GeV
NC e+p 0.5 fb–1
NC e p 0.4 fb–1–NC e+pNC e p–
10-2
10-1
1
10
102
103
102 103 104 105
Fig. 76 The combined HERA data for the inclusive NC e+ p and e− preduced cross sections as a function of Q2 for selected values of xBjat
√s = 318 GeV with overlaid predictions of HERAPDF2.0 NNLO.
The bands represent the total uncertainties of the predictions
123

Eur. Phys. J. C (2015) 75:580 Page 61 of 98 580
Zγ 3xF
0
5
2 = 1000 GeV2Q 2 = 1200 GeV2Q 2 = 1500 GeV2Q 2 = 2000 GeV2Q
0
0.5
1
1.5 2 = 3000 GeV2Q 2 = 5000 GeV2Q 2 = 8000 GeV2Q
Bjx-110 1
2 = 12000 GeV2Q
0
0.5
1
1.5 2 = 20000 GeV2Q
Bjx-110 1
2 = 30000 GeV2Q
H1 and ZEUS
-1HERA 1 fb
HERAPDF2.0 NLO
Fig. 77 The structure function x Fγ Z3 for ten values of Q2 together with predictions from HERAPDF2.0 NLO. The bands represent the total
uncertainties on the predictions
Table 7 Structure function x Fγ Z3 for different values of Q2 and xBj;
δstat , δsyst and δtot represent the statistical, systematic and total uncer-tainties, respectively
Q2 (GeV2) xBj x Fγ Z3 δstat δsyst δtot
1000 0.013 0.293 0.227 0.144 0.269
1000 0.020 0.378 0.254 0.141 0.290
1000 0.032 0.619 0.357 0.214 0.416
1000 0.050 −0.472 −0.500 −0.341 −0.606
1000 0.080 −0.342 −0.760 −0.396 −0.857
1000 0.130 0.567 1.256 0.650 1.415
1000 0.180 3.669 1.622 0.903 1.853
1000 0.250 4.189 2.044 1.265 2.404
1000 0.400 0.657 2.477 1.886 3.113
1200 0.014 0.497 0.142 0.107 0.178
1200 0.020 0.362 0.137 0.087 0.162
1200 0.032 0.089 0.178 0.107 0.208
1200 0.050 0.826 0.227 0.139 0.266
1200 0.080 0.763 0.329 0.192 0.382
1200 0.130 0.919 0.509 0.261 0.573
1200 0.180 −0.709 −1.288 −0.618 −1.429
1200 0.250 −0.574 −0.763 −0.377 −0.851
1200 0.400 −1.128 −0.996 −0.767 −1.258
1500 0.020 0.511 0.121 0.081 0.146
1500 0.032 0.487 0.149 0.070 0.164
1500 0.050 0.009 0.193 0.100 0.218
1500 0.080 0.852 0.268 0.135 0.300
1500 0.130 0.897 0.443 0.187 0.481
Table 7 continued
Q2 (GeV2) xBj x Fγ Z3 δstat δsyst δtot
1500 0.180 −0.001 −1.013 −0.407 −1.092
1500 0.250 0.855 0.725 0.300 0.785
1500 0.400 0.444 0.871 0.583 1.048
1500 0.650 0.042 0.456 0.267 0.528
2000 0.022 0.630 0.234 0.103 0.255
2000 0.032 0.340 0.103 0.055 0.116
2000 0.050 0.426 0.134 0.055 0.145
2000 0.080 0.211 0.180 0.078 0.196
2000 0.130 0.181 0.296 0.110 0.315
2000 0.180 0.335 0.374 0.142 0.400
2000 0.250 0.316 0.483 0.179 0.515
2000 0.400 −0.371 −0.542 −0.236 −0.591
2000 0.650 −0.739 −0.296 −0.166 −0.340
3000 0.032 0.347 0.096 0.049 0.108
3000 0.050 0.303 0.068 0.033 0.075
3000 0.080 0.463 0.095 0.041 0.104
3000 0.130 0.440 0.150 0.059 0.161
3000 0.180 0.279 0.194 0.073 0.208
3000 0.250 0.723 0.241 0.102 0.262
3000 0.400 0.227 0.268 0.128 0.297
3000 0.650 −0.022 −0.106 −0.053 −0.118
5000 0.055 0.320 0.078 0.033 0.084
5000 0.080 0.333 0.041 0.019 0.045
5000 0.130 0.548 0.072 0.027 0.077
123

580 Page 62 of 98 Eur. Phys. J. C (2015) 75:580
Table 7 continued
Q2 (GeV2) xBj x Fγ Z3 δstat δsyst δtot
5000 0.180 0.500 0.087 0.030 0.092
5000 0.250 0.207 0.115 0.035 0.120
5000 0.400 0.132 0.124 0.046 0.132
5000 0.650 0.096 0.055 0.027 0.062
8000 0.087 0.425 0.084 0.029 0.089
8000 0.130 0.493 0.043 0.016 0.046
8000 0.180 0.415 0.056 0.018 0.059
8000 0.250 0.321 0.070 0.022 0.074
8000 0.400 0.120 0.072 0.025 0.077
8000 0.650 −0.004 −0.031 −0.013 −0.034
12,000 0.130 0.637 0.125 0.038 0.131
12,000 0.180 0.385 0.040 0.013 0.042
12,000 0.250 0.379 0.049 0.013 0.050
12,000 0.400 0.272 0.056 0.019 0.059
12,000 0.650 −0.012 −0.027 −0.009 −0.028
20,000 0.250 0.388 0.040 0.013 0.042
20,000 0.400 0.218 0.040 0.012 0.041
20,000 0.650 0.016 0.019 0.009 0.021
30,000 0.400 0.178 0.036 0.008 0.037
30,000 0.650 0.060 0.025 0.009 0.026
Bjx-110 1
Zγ 3xF
0
0.5
1H1 and ZEUS
2 = 1000 GeV2Q -1HERA 1 fb
HERAPDF2.0 NLO
Fig. 78 The structure function x Fγ Z3 averaged over Q2 ≥ 1000 GeV2
at the scale Q2 = 1000 GeV2 together with the prediction from HER-APDF2.0 NLO. The band represents the total uncertainty on the pre-diction
Table 8 Structure function x Fγ Z3 averaged over Q2 ≥ 1000 GeV2 at
the scale 1000 GeV2; δstat , δsyst and δtot represent the statistical, sys-tematic and total uncertainties, respectively
Q2 (GeV2) xBj x Fγ Z3 δstat δsyst δtot
1000 0.014 0.422 0.120 0.082 0.146
1000 0.020 0.443 0.080 0.051 0.094
1000 0.032 0.334 0.058 0.034 0.067
1000 0.050 0.312 0.045 0.023 0.050
1000 0.080 0.365 0.033 0.016 0.037
1000 0.130 0.523 0.035 0.014 0.038
1000 0.180 0.423 0.032 0.011 0.034
1000 0.250 0.407 0.031 0.011 0.032
1000 0.400 0.245 0.028 0.009 0.029
1000 0.650 0.026 0.017 0.007 0.018
H1 and ZEUS
xBj = 0.008 (x15000)
xBj = 0.013 (x3000)
xBj = 0.032 (x700)
xBj = 0.08 (x170)
xBj = 0.13 (x20)
xBj = 0.25 (x2)
xBj = 0.40 (x0.1)
Q2/ GeV2
σ r, C
C HERA√s = 318 GeV
HERAPDF2.0 NLO√s = 318 GeV
CC e+p 0.5 fb–1
CC e p 0.4 fb–1–CC e+pCC e p–
10-4
10-3
10-2
10-1
1
10
102
103
104
105
106
10 2 10 3 10 4 10 5
Fig. 79 The combined HERA data for inclusive CC e+ p and e− preduced cross sections at
√s = 318 GeV with overlaid predictions of
HERAPDF2.0 NLO. The bands represent the total uncertainties on thepredictions
123

Eur. Phys. J. C (2015) 75:580 Page 63 of 98 580
H1 and ZEUS
xBj = 0.008 (x15000)
xBj = 0.013 (x3000)
xBj = 0.032 (x700)
xBj = 0.08 (x170)
xBj = 0.13 (x20)
xBj = 0.25 (x2)
xBj = 0.40 (x0.1)
Q2/ GeV2
σ r, C
C HERA√s = 318 GeV
HERAPDF2.0 NNLO√s = 318 GeV
CC e+p 0.5 fb–1
CC e p 0.4 fb–1–CC e+pCC e p–
10-4
10-3
10-2
10-1
1
10
102
103
104
105
106
102 103 104 105
Fig. 80 The combined HERA data for inclusive CC e+ p and e− preduced cross sections at
√s = 318 GeV with overlaid predictions of
HERAPDF2.0 NNLO. The bands represent the total uncertainty on thepredictions
H1 and ZEUS
xBj = 0.00005, i=21xBj = 0.00008, i=20
xBj = 0.00013, i=19xBj = 0.00020, i=18
xBj = 0.00032, i=17xBj = 0.0005, i=16
xBj = 0.0008, i=15xBj = 0.0013, i=14
xBj = 0.0020, i=13xBj = 0.0032, i=12
xBj = 0.005, i=11xBj = 0.008, i=10
xBj = 0.013, i=9xBj = 0.02, i=8
xBj = 0.032, i=7xBj = 0.05, i=6
xBj = 0.08, i=5
xBj = 0.13, i=4xBj = 0.18, i=3
xBj = 0.25, i=2
xBj = 0.40, i=1
xBj = 0.65, i=0
Q2/ GeV2
σ r, N
C x
2i
HERA NC e+p 0.5 fb–1HERA NC e p 0.4 fb–1–
√s = 318 GeVFixed Target
HERAPDF2.0 e+p NLOHERAPDF2.0 e p NLO–
10-3
10-2
10-1
1
10
102
103
104
105
106
107
1 10 102 103 104 105
Fig. 81 The combined HERA data for the inclusive NC e+ p and e− preduced cross sections together with fixed-target data [107,108] andthe predictions of HERAPDF2.0 NLO. The bands represent the totaluncertainties on the predictions. Dashed lines indicate extrapolationinto kinematic regions not included in the fit
H1 and ZEUS
xBj = 0.00005, i=21xBj = 0.00008, i=20
xBj = 0.00013, i=19xBj = 0.00020, i=18
xBj = 0.00032, i=17xBj = 0.0005, i=16
xBj = 0.0008, i=15xBj = 0.0013, i=14
xBj = 0.0020, i=13xBj = 0.0032, i=12
xBj = 0.005, i=11xBj = 0.008, i=10
xBj = 0.013, i=9xBj = 0.02, i=8
xBj = 0.032, i=7xBj = 0.05, i=6
xBj = 0.08, i=5
xBj = 0.13, i=4xBj = 0.18, i=3
xBj = 0.25, i=2
xBj = 0.40, i=1
xBj = 0.65, i=0
Q2/ GeV2
σ r, N
C x
2i
HERA NC e+p 0.5 fb–1HERA NC e p 0.4 fb–1–
√s = 318 GeVFixed Target
HERAPDF2.0 e+p NNLOHERAPDF2.0 e p NNLO–
10-3
10-2
10-1
1
10
102
103
104
105
106
107
1 10 102 103 104 105
Fig. 82 The combined HERA data for the inclusive NC e+ p and e− preduced cross sections together with fixed-target data [107,108] andthe predictions of HERAPDF2.0 NNLO. The bands represent the totaluncertainties on the predictions. Dashed lines indicate extrapolationinto kinematic regions not included in the fit
H1 and ZEUS
Q2 = 6.5 GeV2
F 2~
Q2 = 12 GeV2
Q2 = 120 GeV2
Q2 = 1200 GeV2
xBj
HERA NC e+p 0.5 fb–1
√s = 318 GeVHERAPDF2.0 NLO
0
0.2
0.4
0.6
0.8
1
1.2
1.4
1.6
10-4 10-3 10-2 10-1
Fig. 83 The structure function F2 as extracted from the measuredreduced cross sections for four values of Q2 together with the predic-tions of HERAPDF2.0 NLO. The bands represent the total uncertaintyon the predictions
123

580 Page 64 of 98 Eur. Phys. J. C (2015) 75:580
Acknowledgments We are grateful to the HERA machine groupwhose outstanding efforts have made these experiments possible. Weappreciate the contributions to the construction, maintenance and oper-ation of the H1 and ZEUS detectors of many people who are not listed asauthors. We thank our funding agencies for financial support, the DESYtechnical staff for continuous assistance and the DESY directorate fortheir support and for the hospitality they extended to the non-DESYmembers of the collaborations. We would like to give credit to all part-ners contributing to the EGI computing infrastructure for their support.
Open Access This article is distributed under the terms of the CreativeCommons Attribution 4.0 International License (http://creativecommons.org/licenses/by/4.0/), which permits unrestricted use, distribution,and reproduction in any medium, provided you give appropriate creditto the original author(s) and the source, provide a link to the CreativeCommons license, and indicate if changes were made.Funded by SCOAP3.
Appendix A: HERAPDF1.5
HERAPDF1.5 NLO and NNLO were released in 2010 [34].They were obtained from all HERA I data sets and theselected HERA II data sets marked in Table 1. Some cross-section measurements were preliminary at the time; this isalso marked in Table 1. All these data sets were combinedas described in Sect. 4. However, only the three proceduraluncertainties described in Sects. 4.5.1 and 4.5.2 were con-sidered. Table 9 provides a comparison between the mainsettings for HERAPDF2.0 and 1.5.
Appendix B: PDFs released
The following sets of PDFs are released [79] and availableon LHAPDF:
(https://lhapdf.hepforge.org/pdfsets.html).
• HERAPDF2.0
– based on the combination of all inclusive data fromthe H1 and ZEUS collaborations;
– with Q2min = 3.5 GeV2;
– at NLO and NNLO;– using the RTOPT variable-flavour-number scheme;– with αs(M2
Z ) = 0.118;– 14 eigenvector pairs give the Hessian experimental
uncertainties;– for the NLO and NNLO fits, grids of 13 variations are
released to describe the model and parameterisationuncertainties;
– grids with alternative values of αs(M2Z ) are released
for αs(M2Z ) = 0.110 to αs(M2
Z ) = 0.130 in steps of0.001;
• HERAPDF2.0HiQ2
– as HERAPDF2.0, but with Q2min = 10.0 GeV2;
– only at αs(M2Z ) = 0.118;
Table 9 Settings forHERAPDF2.0 andHERAPDF1.5
∗ Setting was chosen exactly asfor HERAPDF1.0∗∗ Parameter number 14 wasDuv and not DUa Mc = 1.49 GeV to assureμ2
f0 < M2c
b Mc = 1.53 GeV to assureμ2
f0 < M2c
c Mc = 1.6 GeV to assureμ2
f0 < M2c
d For μ2f0 = 1.5 GeV2, also A
′g
and B′g were introduced (as for
HERAPDF1.0 NLO)e μ2
f0 = 1.6 GeV2 to assureμ2
f0 < M2c
f μ2f0 = 1.8 GeV2 to assure
μ2f0 < M2
c
HERAPDF2.0 HERAPDF1.5
NNLO NLO NNLO NLO
Data as in Table 1 Combination Preliminary combination
Uncertainties
Experimental Hessian Hessian
Procedural 7 3
Parameterisation As in Eqs. 27–31 As in Eqs. 27–31
Number of parameters 14 14 14∗∗ 10∗
Variations 15 [Duv ] 15 [Duv ] None 11 [Duv ], 12 [DU ]
μ2f0
(GeV2) 1.9 1.9 1.9 1.9
Variations 1.6, 2.2a 1.6, 2.2b 1.5, 2.5c 1.5d, 2.5c
Mc (GeV) 1.43 1.47 1.4 1.4
Variations 1.37e, 1.49 1.41, 1.53 1.35f , 1.65 1.35f , 1.65a
Mb (GeV) 4.5 4.5 4.75 4.75
Variations 4.25, 4.75 4.25, 4.75 4.30, 5.00 4.30, 5.00
fs (GeV) 0.40 0.40 0.31 0.31
Variations 0.30, 0.50 0.30, 0.50 0.23, 0.38 0.23, 0.38
Q2min (GeV2) of data 3.5 3.5 3.5 3.5
Variations 2.5, 5.0 2.5, 5.0 2.5, 5.0 2.5, 5.0
Fixed αs 0.118 0.118 0.1176 0.1176
123

Eur. Phys. J. C (2015) 75:580 Page 65 of 98 580
• HERAPDF2.0AG
– based on the combination of all inclusive data fromthe H1 and ZEUS collaborations;
– with Q2min = 3.5 GeV2;
– at LO, NLO and NNLO;– using the alternative gluon parameterisation as defined
in Sect. 6.8;– with αs(M2
Z ) = 0.130 for LO and αs(M2Z ) = 0.118
for NLO and NNLO;– experimental uncertainties provided at LO;– no uncertainties provided at NLO and NNLO;
• HERAPDF2.0FF3A and FF3B
– based on the combination of all inclusive data fromthe H1 and ZEUS collaborations;
– with Q2min = 3.5 GeV2;
– at NLO;– using the fixed-flavour-number schemes as described
in Table 3;– with αs(M2
Z )NF=3 = 0.106375, equivalent toαs(M2
Z )NF=5 = 0.118 for FF3A, and with αs(M2Z ) =
0.118 for FF3B;– 14 eigenvector pairs give the Hessian experimental
uncertainties;
– grids of 13 variations are released to describe themodel and parameterisation uncertainties;
• HERAPDF2.0Jets
– based on the combination of all inclusive data fromthe H1 and ZEUS collaborations and selected data oncharm and jet production;
– with Q2min = 3.5 GeV2;
– at NLO;– with free αs(M2
Z );– 15 eigenvector pairs give Hessian experimental uncer-
tainties including the uncertainty on αs(M2Z );
– grids of 15 variations are released to describe themodel, parameterisation and hadronisation uncer-tainties.
Appendix C: Data tables
Tables 10, 11, 12, 13, 14, 15 and 16 summarise the combinedcross section measurements and uncertainties. The full infor-mation about correlations between cross-section measure-ments is available elsewhere [78]. The new values supersedethose published previously [2].
123

580 Page 66 of 98 Eur. Phys. J. C (2015) 75:580
Table 10 HERA combined reduced cross sections σ+r,NC for NC e+ p
scattering at√s = 318 GeV; δstat , δuncor and δcor represent the statis-
tical, uncorrelated systematic and correlated systematic uncertainties,respectively; δrel, δγ p , δhad and δ1 – δ4 are the correlated sources of
uncertainties arising from the combination procedure. The total uncer-tainty δtot is calculated by adding δstat , δuncor, δcor and the proceduraluncertainties in quadrature. The uncertainties are quoted in percent rel-ative to σ+
r,NC
Q2
(GeV2)xBj σ+
r,NC δstat(%)
δuncor(%)
δcor(%)
δrel(%)
δγ p(%)
δhad(%)
δ1(%)
δ2(%)
δ3(%)
δ4(%)
δtot(%)
0.15 0.502 × 10⁻⁵ 0.185 3.79 1.50 3.62 1.39 0.35 −0.21 −0.17 −0.01 0.00 0.01 5.65
0.2 0.669 × 10⁻⁵ 0.227 1.65 0.78 1.70 0.86 0.57 0.00 0.00 0.00 0.00 0.01 2.70
0.2 0.849 × 10⁻⁵ 0.223 1.61 0.61 2.19 1.06 0.55 −0.26 −0.06 0.00 0.00 0.00 3.04
0.2 0.110 × 10⁻⁴ 0.208 2.79 1.50 2.83 1.01 0.34 −0.08 −0.18 0.00 0.00 0.01 4.38
0.2 0.398 × 10⁻⁴ 0.211 14.93 11.96 5.18 0.33 4.70 2.93 1.57 −0.03 −0.02 0.15 20.64
0.2 0.251 × 10⁻³ 0.180 13.49 6.17 3.00 0.32 1.39 −1.67 1.19 0.01 0.02 0.02 15.34
0.25 0.836 × 10⁻⁵ 0.265 1.46 0.73 1.92 1.17 0.63 −0.23 0.45 0.00 0.00 0.01 2.89
0.25 0.106 × 10⁻⁴ 0.260 1.29 0.66 1.84 1.11 0.63 −0.10 0.32 0.00 0.00 0.01 2.69
0.25 0.138 × 10⁻⁴ 0.249 1.27 0.72 1.85 1.24 0.61 −0.22 0.08 0.00 0.00 0.00 2.74
0.25 0.230 × 10⁻⁴ 0.243 1.41 1.50 2.37 2.23 0.38 −0.60 0.43 0.00 −0.02 0.01 3.94
0.25 0.398 × 10⁻⁴ 0.236 3.32 1.54 2.79 0.50 1.03 0.29 0.21 0.00 0.01 0.02 4.76
0.25 0.110 × 10⁻³ 0.199 3.96 1.50 2.50 0.77 0.32 0.06 −0.58 0.00 0.00 0.01 5.02
0.25 0.251 × 10⁻³ 0.196 3.75 1.44 3.26 −0.23 0.35 0.51 −0.21 0.01 0.02 0.02 5.22
0.25 0.394 × 10⁻³ 0.194 4.16 1.50 3.61 1.65 0.46 −0.29 −0.20 0.00 0.00 0.02 5.97
0.25 0.158 × 10⁻² 0.198 11.00 5.29 2.41 0.29 0.01 −1.76 1.08 0.01 0.03 0.02 12.61
0.35 0.512 × 10⁻⁵ 0.436 22.08 12.79 1.83 0.22 1.82 −0.44 1.33 −0.03 0.00 0.03 25.68
0.35 0.100 × 10⁻⁴ 0.345 1.63 0.80 1.80 1.11 0.60 −0.38 0.12 0.00 0.00 0.01 2.87
0.35 0.127 × 10⁻⁴ 0.324 1.44 0.79 1.86 1.16 0.58 −0.16 −0.03 0.00 0.00 0.01 2.81
0.35 0.165 × 10⁻⁴ 0.313 1.21 0.63 1.88 1.19 0.63 0.06 0.52 0.00 0.00 0.01 2.74
0.35 0.320 × 10⁻⁴ 0.296 1.14 0.72 2.54 2.55 0.72 −0.77 1.05 −0.01 −0.02 0.01 4.12
0.35 0.662 × 10⁻⁴ 0.282 2.62 1.50 1.72 0.42 0.42 −0.06 1.19 0.00 0.01 0.01 3.72
0.35 0.130 × 10⁻³ 0.257 2.53 1.43 1.54 0.81 0.59 −0.11 0.70 0.00 0.00 0.02 3.50
0.35 0.220 × 10⁻³ 0.240 2.67 1.50 2.01 1.13 0.53 −0.31 0.14 0.00 0.00 0.01 3.88
0.35 0.500 × 10⁻³ 0.240 2.52 1.42 1.81 1.49 0.44 −0.46 0.28 0.00 0.00 0.01 3.79
0.35 0.251 × 10⁻² 0.201 10.00 4.55 1.54 0.55 −0.32 −0.44 0.34 0.00 0.02 0.04 11.12
0.4 0.133 × 10⁻⁴ 0.355 1.97 0.88 2.04 1.36 0.67 −0.31 0.64 0.00 0.00 0.01 3.42
0.4 0.170 × 10⁻⁴ 0.354 1.66 0.83 1.87 1.15 0.61 −0.05 0.29 0.00 0.01 0.01 2.96
0.4 0.220 × 10⁻⁴ 0.334 1.45 0.78 1.86 1.28 0.64 −0.34 0.38 0.00 0.00 0.01 2.91
0.4 0.368 × 10⁻⁴ 0.330 1.26 0.77 2.52 2.58 0.65 −0.84 1.12 −0.01 −0.02 0.01 4.19
0.4 0.883 × 10⁻⁴ 0.320 2.72 1.50 1.57 1.03 0.48 −0.23 0.41 0.00 0.00 0.01 3.69
0.4 0.176 × 10⁻³ 0.287 2.79 1.50 1.76 0.68 0.49 −0.16 0.22 0.00 0.01 0.01 3.73
0.4 0.294 × 10⁻³ 0.277 2.75 1.50 1.66 1.03 0.47 −0.30 0.74 0.00 0.00 0.01 3.81
0.4 0.631 × 10⁻³ 0.260 2.74 1.50 2.06 1.33 0.43 −0.32 0.54 0.00 0.00 0.01 4.04
0.5 0.732 × 10⁻⁵ 0.428 5.55 5.74 4.16 −0.02 4.04 0.31 1.90 −0.05 −0.01 0.05 10.05
0.5 0.158 × 10⁻⁴ 0.426 3.53 1.48 2.38 1.22 0.46 −0.20 0.70 0.00 0.00 0.00 4.75
0.5 0.212 × 10⁻⁴ 0.390 2.06 0.80 2.01 1.07 0.58 0.21 0.33 0.00 0.00 0.01 3.25
0.5 0.276 × 10⁻⁴ 0.377 1.71 0.76 2.00 1.38 0.64 −0.18 0.31 0.00 0.00 0.01 3.15
0.5 0.398 × 10⁻⁴ 0.364 1.48 0.81 2.60 2.64 0.85 −0.97 1.03 −0.01 −0.01 0.01 4.40
0.5 0.100 × 10⁻³ 0.348 1.74 1.45 1.57 0.65 0.54 −0.07 0.73 0.00 0.01 0.01 2.98
0.5 0.251 × 10⁻³ 0.308 1.87 1.43 1.62 0.36 0.38 0.01 0.02 0.00 0.01 0.01 2.91
0.5 0.368 × 10⁻³ 0.300 2.03 1.50 1.68 0.83 0.43 −0.12 0.35 0.00 0.00 0.01 3.19
0.5 0.800 × 10⁻³ 0.287 2.05 1.38 1.54 0.98 0.37 −0.27 0.09 0.00 0.00 0.01 3.11
0.5 0.320 × 10⁻² 0.182 11.38 6.39 1.30 0.38 −0.40 −0.77 −0.48 −0.01 0.01 0.08 13.16
123

Eur. Phys. J. C (2015) 75:580 Page 67 of 98 580
Table 10 continued
Q2
(GeV2)xBj σ+
r,NC δstat(%)
δuncor(%)
δcor(%)
δrel(%)
δγ p(%)
δhad(%)
δ1(%)
δ2(%)
δ3(%)
δ4(%)
δtot(%)
0.65 0.952 × 10⁻⁵ 0.464 4.02 2.90 2.57 0.22 2.36 −0.10 1.52 −0.04 0.00 0.04 6.25
0.65 0.158 × 10⁻⁴ 0.462 3.10 5.44 1.56 0.40 0.34 −0.41 0.15 −0.02 0.01 0.05 6.48
0.65 0.398 × 10⁻⁴ 0.472 2.73 0.68 2.37 1.26 0.55 0.15 0.46 0.00 0.00 0.00 3.96
0.65 0.598 × 10⁻⁴ 0.416 1.99 0.74 3.16 2.93 0.60 −0.67 1.56 0.00 −0.01 0.01 5.13
0.65 0.100 × 10⁻³ 0.409 2.09 1.47 2.04 0.93 0.66 −0.19 1.59 0.00 0.00 0.01 3.81
0.65 0.251 × 10⁻³ 0.361 2.14 1.39 1.69 0.88 0.32 −0.32 1.13 0.00 0.00 0.01 3.41
0.65 0.478 × 10⁻³ 0.332 2.29 1.50 1.93 0.88 0.43 −0.36 0.94 0.00 0.00 0.01 3.63
0.65 0.800 × 10⁻³ 0.318 2.14 1.35 1.64 0.71 0.23 −0.39 0.56 0.00 0.01 0.03 3.18
0.65 0.320 × 10⁻² 0.224 5.82 3.18 1.27 0.39 −0.10 −0.56 0.54 0.00 0.02 0.06 6.81
0.85 0.124 × 10⁻⁴ 0.552 2.57 2.52 2.21 0.27 1.92 0.02 1.03 −0.04 0.00 0.04 4.76
0.85 0.200 × 10⁻⁴ 0.611 1.96 5.36 1.63 0.49 −0.13 −0.40 −0.04 −0.02 0.01 0.05 5.97
0.85 0.398 × 10⁻⁴ 0.558 2.03 1.86 1.77 0.44 −0.45 −0.39 −1.05 −0.01 0.00 0.03 3.51
0.85 0.500 × 10⁻⁴ 0.541 2.93 4.52 2.36 0.62 −0.28 −0.09 −0.25 0.00 0.01 0.06 5.93
0.85 0.100 × 10⁻³ 0.503 2.65 3.78 3.73 0.43 −1.31 0.49 −0.55 −0.05 0.00 0.03 6.14
0.85 0.251 × 10⁻³ 0.397 6.01 2.98 2.33 0.38 −0.76 −0.54 0.96 −0.02 0.02 0.04 7.23
0.85 0.800 × 10⁻³ 0.349 4.61 2.67 1.46 0.55 −0.41 −0.28 −0.85 −0.01 0.02 0.07 5.64
0.85 0.320 × 10⁻² 0.308 4.54 2.83 1.04 0.39 −0.21 −0.15 −0.67 0.00 0.02 0.08 5.51
1.2 0.176 × 10⁻⁴ 0.592 2.56 2.16 2.53 0.31 1.55 0.01 0.67 −0.07 −0.01 0.03 4.54
1.2 0.200 × 10⁻⁴ 0.667 2.63 2.51 1.36 0.37 0.49 −0.41 0.47 −0.02 0.01 0.04 3.98
1.2 0.320 × 10⁻⁴ 0.685 1.67 2.73 1.33 0.44 0.03 −0.36 0.18 −0.02 0.01 0.05 3.52
1.2 0.631 × 10⁻⁴ 0.649 1.39 1.47 1.43 0.61 −0.47 −0.33 0.26 0.00 0.00 0.05 2.63
1.2 0.800 × 10⁻⁴ 0.595 2.05 1.36 1.88 0.61 −0.38 −0.15 −0.47 0.00 0.01 0.06 3.21
1.2 0.130 × 10⁻³ 0.543 2.43 4.97 1.61 0.37 −0.38 0.22 −0.27 −0.01 0.01 0.04 5.79
1.2 0.158 × 10⁻³ 0.533 1.54 1.35 1.43 0.68 −0.55 −0.29 −0.96 −0.02 0.01 0.07 2.83
1.2 0.398 × 10⁻³ 0.493 2.12 3.36 1.38 0.38 −0.59 −0.44 0.77 0.00 0.01 0.03 4.36
1.2 0.130 × 10⁻² 0.372 3.55 2.67 1.41 0.58 −0.36 −0.14 −0.34 0.00 0.02 0.08 4.72
1.2 0.500 × 10⁻² 0.298 4.51 2.61 1.55 0.30 −0.61 0.01 −0.79 0.00 0.01 0.09 5.53
1.5 0.185 × 10⁻⁴ 0.619 3.14 3.48 5.44 0.82 −7.49 −0.06 −5.81 −0.30 −0.04 −0.04 11.92
1.5 0.220 × 10⁻⁴ 0.696 1.94 1.78 1.62 0.43 −0.29 −0.06 −0.29 −0.06 0.00 0.03 3.16
1.5 0.320 × 10⁻⁴ 0.753 1.73 2.15 1.20 0.38 0.07 −0.24 0.13 −0.02 0.00 0.05 3.05
1.5 0.500 × 10⁻⁴ 0.760 1.05 1.98 1.15 0.54 −0.63 −0.40 0.10 0.00 0.00 0.03 2.68
1.5 0.800 × 10⁻⁴ 0.699 1.26 2.15 1.37 0.55 −0.33 −0.37 −0.08 −0.01 0.01 0.05 2.94
1.5 0.130 × 10⁻³ 0.646 1.46 2.43 1.55 0.53 −0.48 −0.48 −0.47 −0.01 0.01 0.05 3.38
1.5 0.200 × 10⁻³ 0.612 2.08 2.86 1.65 0.57 −0.47 0.22 0.39 0.00 0.01 0.04 4.00
1.5 0.320 × 10⁻³ 0.577 1.49 2.26 1.61 0.43 −0.68 −0.67 0.23 −0.01 0.01 0.04 3.33
1.5 0.500 × 10⁻³ 0.547 2.52 7.05 1.89 0.37 −0.29 −0.15 −0.41 0.00 0.01 0.04 7.74
1.5 0.800 × 10⁻³ 0.490 2.36 2.47 1.37 0.57 −0.54 −0.04 0.36 0.00 0.01 0.05 3.78
1.5 0.100 × 10⁻² 0.462 5.22 3.74 1.37 0.55 −0.04 −0.66 −0.04 0.00 0.03 0.08 6.63
1.5 0.320 × 10⁻² 0.410 2.31 2.04 1.41 0.61 −0.28 0.16 −0.67 0.00 0.01 0.10 3.53
1.5 0.130 × 10⁻¹ 0.324 4.01 2.50 4.84 −0.07 −1.12 0.53 1.69 −0.01 −0.03 0.06 7.08
2 0.247 × 10⁻⁴ 0.781 2.31 2.70 4.11 0.85 −5.29 0.14 −3.43 −0.22 −0.03 −0.02 8.37
2 0.293 × 10⁻⁴ 0.788 1.49 1.65 1.47 0.44 −0.34 0.02 −0.46 −0.06 0.00 0.03 2.76
2 0.500 × 10⁻⁴ 0.823 1.52 1.93 1.00 0.42 −0.18 −0.18 0.13 −0.01 0.01 0.05 2.71
2 0.800 × 10⁻⁴ 0.762 0.97 1.34 0.98 0.53 −0.20 −0.38 0.27 0.00 0.00 0.05 2.06
2 0.130 × 10⁻³ 0.723 1.11 1.30 1.07 0.50 −0.20 −0.26 0.36 0.00 0.00 0.05 2.13
123

580 Page 68 of 98 Eur. Phys. J. C (2015) 75:580
Table 10 continued
Q2
(GeV2)xBj σ+
r,NC δstat(%)
δuncor(%)
δcor(%)
δrel(%)
δγ p(%)
δhad(%)
δ1(%)
δ2(%)
δ3(%)
δ4(%)
δtot(%)
2 0.200 × 10⁻³ 0.679 1.12 1.32 1.18 0.56 −0.36 0.28 0.18 0.00 0.01 0.06 2.22
2 0.320 × 10⁻³ 0.627 1.01 1.65 1.31 0.45 −0.33 −0.10 0.58 0.00 0.01 0.06 2.47
2 0.500 × 10⁻³ 0.575 1.17 2.04 1.38 0.44 0.02 0.07 0.22 0.00 0.02 0.03 2.77
2 0.100 × 10⁻² 0.510 0.99 1.79 1.10 0.45 −0.15 0.24 −0.33 0.00 0.01 0.05 2.41
2 0.320 × 10⁻² 0.426 1.07 1.89 1.47 0.57 −0.25 0.48 −0.90 0.00 0.01 0.10 2.89
2 0.130 × 10⁻¹ 0.358 2.39 2.14 3.99 0.07 −0.92 0.53 1.87 −0.01 −0.02 0.07 5.55
2.7 0.309 × 10⁻⁴ 0.845 2.28 2.30 2.40 0.80 −3.17 −0.36 −2.05 −0.37 0.00 −0.04 5.60
2.7 0.366 × 10⁻⁴ 0.866 1.99 1.88 1.27 0.57 −1.32 −0.16 −0.97 −0.28 0.01 −0.04 3.50
2.7 0.409 × 10⁻⁴ 0.937 6.84 4.76 2.44 1.50 −0.37 0.17 −0.08 −1.68 0.00 0.14 8.98
2.7 0.500 × 10⁻⁴ 0.883 1.51 1.65 0.98 0.43 −0.17 −0.04 −0.04 −0.02 0.01 0.04 2.48
2.7 0.800 × 10⁻⁴ 0.889 0.72 1.03 0.85 0.47 −0.30 −0.31 0.26 0.00 0.00 0.04 1.67
2.7 0.130 × 10⁻³ 0.805 0.62 0.87 0.82 0.46 0.02 −0.26 0.18 0.00 0.01 0.05 1.46
2.7 0.200 × 10⁻³ 0.781 0.76 1.61 0.94 0.46 −0.31 0.02 0.19 0.00 0.01 0.06 2.10
2.7 0.320 × 10⁻³ 0.700 0.84 1.27 0.96 0.55 −0.27 −0.02 0.82 0.00 0.02 0.05 2.07
2.7 0.500 × 10⁻³ 0.645 0.69 1.35 1.05 0.46 −0.21 −0.11 0.40 0.00 0.02 0.04 1.96
2.7 0.800 × 10⁻³ 0.594 0.88 1.84 0.92 0.42 −0.17 0.00 0.04 0.00 0.02 0.06 2.28
2.7 0.130 × 10⁻² 0.567 0.69 1.63 1.00 0.46 −0.10 0.28 −0.20 0.00 0.02 0.07 2.12
2.7 0.200 × 10⁻² 0.481 0.91 2.74 0.99 0.43 −0.27 −0.41 0.04 0.01 0.00 0.14 3.12
2.7 0.500 × 10⁻² 0.453 0.74 1.82 1.43 0.53 −0.32 0.43 −0.84 0.01 0.01 0.12 2.69
2.7 0.200 × 10⁻¹ 0.345 2.54 2.45 7.41 −0.30 −1.28 0.77 3.85 −0.01 −0.04 0.08 9.20
3.5 0.406 × 10⁻⁴ 0.806 6.14 4.17 1.18 1.09 −0.25 −0.46 −0.04 −0.75 −0.01 −0.15 7.65
3.5 0.432 × 10⁻⁴ 0.881 3.08 2.83 3.31 0.70 −4.07 0.56 −2.62 −0.18 −0.01 −0.05 7.26
3.5 0.460 × 10⁻⁴ 0.965 3.05 2.99 1.10 0.35 −0.21 −0.41 −0.05 −0.15 −0.01 −0.22 4.45
3.5 0.512 × 10⁻⁴ 0.940 2.16 2.25 1.53 0.52 −1.61 0.05 −1.16 −0.07 0.01 0.01 4.04
3.5 0.531 × 10⁻⁴ 0.880 3.10 2.64 0.91 0.48 −0.20 −0.30 −0.03 −0.01 −0.01 −0.21 4.22
3.5 0.800 × 10⁻⁴ 0.952 1.25 1.55 0.88 0.43 −0.26 −0.09 −0.08 −0.09 0.01 0.03 2.24
3.5 0.130 × 10⁻³ 0.918 0.66 0.86 0.80 0.45 −0.13 −0.28 0.18 0.00 0.02 0.06 1.46
3.5 0.200 × 10⁻³ 0.854 0.68 0.83 0.81 0.44 0.09 −0.22 0.26 0.00 0.01 0.08 1.46
3.5 0.320 × 10⁻³ 0.791 0.72 0.88 0.86 0.50 −0.21 −0.01 0.11 0.00 0.01 0.07 1.53
3.5 0.500 × 10⁻³ 0.749 0.76 1.17 0.89 0.37 −0.23 −0.26 0.30 0.00 0.03 0.05 1.75
3.5 0.800 × 10⁻³ 0.659 0.67 1.16 0.91 0.37 0.15 −0.17 0.20 0.00 0.03 0.05 1.69
3.5 0.130 × 10⁻² 0.623 0.87 1.38 0.97 0.42 −0.27 0.00 0.12 0.00 0.02 0.07 1.96
3.5 0.200 × 10⁻² 0.568 0.51 0.87 0.85 0.44 −0.11 −0.16 −0.02 0.01 0.02 0.11 1.41
3.5 0.800 × 10⁻² 0.462 0.59 1.12 1.11 0.45 −0.15 −0.36 −0.48 0.01 −0.02 0.21 1.86
4.5 0.522 × 10⁻⁴ 0.916 6.40 4.13 1.20 1.15 −0.29 −0.48 −0.05 −1.15 −0.01 −0.11 7.90
4.5 0.592 × 10⁻⁴ 0.971 2.84 2.87 1.01 0.56 −0.23 −0.46 −0.05 −0.43 −0.01 −0.19 4.26
4.5 0.618 × 10⁻⁴ 0.970 2.97 2.73 2.94 1.00 −3.82 −0.90 −2.59 −0.18 0.00 0.03 6.93
4.5 0.683 × 10⁻⁴ 1.080 1.67 2.23 0.98 0.70 −0.23 −0.33 −0.05 −0.33 −0.01 −0.17 3.08
4.5 0.732 × 10⁻⁴ 1.019 1.60 2.21 1.10 0.43 −0.80 0.04 −0.67 −0.04 0.01 0.01 3.15
4.5 0.818 × 10⁻⁴ 1.080 10.38 11.67 1.17 0.69 −0.20 −0.20 −0.03 −0.08 0.02 −0.09 15.69
4.5 0.130 × 10⁻³ 1.020 1.20 0.91 0.81 0.55 −0.32 −0.19 −0.02 −0.10 0.04 −0.02 1.84
4.5 0.200 × 10⁻³ 0.961 0.74 0.91 0.83 0.51 0.00 −0.30 0.32 0.01 0.01 0.05 1.58
4.5 0.320 × 10⁻³ 0.893 0.80 0.96 0.79 0.35 −0.01 −0.23 0.03 0.00 0.02 0.08 1.54
4.5 0.500 × 10⁻³ 0.797 0.83 0.89 0.86 0.56 −0.01 −0.27 0.06 0.00 0.02 0.08 1.61
4.5 0.800 × 10⁻³ 0.720 0.82 1.29 0.88 0.33 0.04 −0.14 0.30 0.00 0.03 0.05 1.82
123

Eur. Phys. J. C (2015) 75:580 Page 69 of 98 580
Table 10 continued
Q2
(GeV2)xBj σ+
r,NC δstat(%)
δuncor(%)
δcor(%)
δrel(%)
δγ p(%)
δhad(%)
δ1(%)
δ2(%)
δ3(%)
δ4(%)
δtot(%)
4.5 0.130 × 10⁻² 0.665 0.85 1.31 0.97 0.38 −0.07 0.02 0.42 0.00 0.03 0.06 1.93
4.5 0.200 × 10⁻² 0.615 0.88 1.31 0.91 0.35 0.31 −0.24 0.18 0.00 0.03 0.04 1.90
4.5 0.320 × 10⁻² 0.572 0.67 1.23 0.97 0.41 −0.17 −0.33 −0.09 0.00 0.03 0.08 1.79
4.5 0.130 × 10⁻¹ 0.430 0.71 1.86 1.52 0.40 −0.36 −1.30 −0.96 0.00 0.01 0.10 3.03
6.5 0.754 × 10⁻⁴ 1.117 6.27 4.15 1.14 0.64 −0.18 −0.42 −0.02 0.04 −0.02 −0.27 7.65
6.5 0.803 × 10⁻⁴ 1.085 3.10 2.64 2.25 0.56 −2.84 −0.01 −1.89 −0.11 0.00 0.03 5.80
6.5 0.855 × 10⁻⁴ 1.097 2.29 2.61 1.16 1.78 −0.28 −0.45 −0.05 −0.69 −0.01 0.05 4.17
6.5 0.951 × 10⁻⁴ 1.084 2.62 2.28 1.37 0.91 −1.47 −0.04 −1.12 0.08 0.01 0.02 4.26
6.5 0.986 × 10⁻⁴ 1.177 1.94 2.19 0.91 0.99 −0.22 −0.32 −0.03 −0.22 −0.01 −0.18 3.25
6.5 0.130 × 10⁻³ 1.113 1.08 1.37 0.80 0.49 −0.17 −0.12 −0.08 0.01 0.00 −0.11 2.00
6.5 0.200 × 10⁻³ 1.112 0.93 0.63 0.79 0.42 −0.29 −0.15 0.04 0.02 0.04 −0.02 1.48
6.5 0.320 × 10⁻³ 1.001 0.75 0.66 0.79 0.42 0.13 −0.17 0.06 0.02 0.01 0.07 1.36
6.5 0.500 × 10⁻³ 0.933 0.75 1.16 0.85 0.38 −0.17 −0.15 0.12 0.00 0.02 0.07 1.68
6.5 0.800 × 10⁻³ 0.849 0.79 0.85 0.85 0.52 −0.06 −0.31 0.15 −0.01 0.04 0.06 1.57
6.5 0.130 × 10⁻² 0.758 0.80 1.08 0.84 0.28 −0.05 −0.19 0.07 0.00 0.03 0.13 1.63
6.5 0.200 × 10⁻² 0.695 0.76 0.87 0.81 0.28 −0.02 −0.23 0.08 −0.01 0.04 0.07 1.46
6.5 0.320 × 10⁻² 0.641 0.67 1.21 0.94 0.37 −0.14 −0.02 −0.10 0.00 0.03 0.07 1.72
6.5 0.500 × 10⁻² 0.579 0.94 0.85 0.97 0.32 −0.14 −0.31 −0.04 0.00 0.04 0.23 1.68
6.5 0.130 × 10⁻¹ 0.483 0.68 1.82 1.32 0.39 −0.27 −1.34 −0.95 0.00 0.01 0.09 2.91
6.5 0.200 × 10⁻¹ 0.498 1.14 1.89 1.60 0.45 0.07 −0.66 −0.17 0.03 −0.07 0.46 2.89
8.5 0.986 × 10⁻⁴ 1.161 2.31 2.99 0.93 0.71 −0.23 −0.44 −0.04 −0.47 −0.01 −0.18 4.02
8.5 0.105 × 10⁻³ 1.183 3.72 2.80 2.01 0.52 −2.47 −0.62 −2.14 −0.09 0.00 0.06 6.08
8.5 0.112 × 10⁻³ 1.180 1.94 2.48 1.11 2.21 −0.27 −0.35 −0.05 −0.14 0.00 0.07 4.03
8.5 0.124 × 10⁻³ 1.259 1.57 1.95 0.93 1.21 −0.52 −0.06 −0.40 0.23 0.01 0.07 3.01
8.5 0.129 × 10⁻³ 1.232 1.40 1.92 0.91 1.14 −0.24 −0.26 −0.04 −0.15 −0.01 −0.11 2.82
8.5 0.139 × 10⁻³ 1.257 3.23 4.77 1.12 1.44 −0.24 −0.15 −0.02 0.87 0.00 −0.20 6.11
8.5 0.200 × 10⁻³ 1.195 0.91 1.29 0.77 0.56 −0.13 −0.09 −0.02 0.07 0.01 −0.12 1.86
8.5 0.320 × 10⁻³ 1.107 0.71 0.75 0.75 0.52 0.04 −0.16 0.09 0.05 0.02 −0.02 1.40
8.5 0.500 × 10⁻³ 1.014 0.81 0.93 0.79 0.37 0.17 −0.18 0.13 −0.01 0.05 −0.01 1.54
8.5 0.800 × 10⁻³ 0.931 0.88 0.80 0.81 0.31 0.02 −0.15 0.12 0.00 0.03 0.14 1.49
8.5 0.130 × 10⁻² 0.839 0.91 0.83 0.81 0.37 −0.09 −0.26 0.09 0.00 0.05 0.07 1.55
8.5 0.200 × 10⁻² 0.769 0.99 1.32 0.88 0.31 −0.03 −0.12 0.09 0.00 0.03 0.05 1.90
8.5 0.320 × 10⁻² 0.661 1.03 1.33 0.94 0.30 0.18 −0.28 −0.05 0.00 0.03 0.04 1.98
8.5 0.500 × 10⁻² 0.632 0.76 1.25 0.92 0.37 −0.09 −0.47 −0.21 0.00 0.03 0.07 1.85
8.5 0.200 × 10⁻¹ 0.456 0.83 1.85 1.64 0.29 −0.42 −0.91 −0.94 0.00 0.01 0.07 2.96
10 0.320 × 10⁻³ 1.138 1.92 1.12 0.92 0.66 −0.06 −0.04 −0.02 −0.01 0.01 −0.07 2.50
10 0.500 × 10⁻³ 1.058 1.78 1.19 0.86 0.34 0.09 0.16 0.03 −0.01 0.06 0.05 2.34
10 0.800 × 10⁻³ 0.977 1.84 1.31 0.84 0.30 0.07 0.05 0.02 −0.02 0.09 0.15 2.44
10 0.130 × 10⁻² 0.888 2.13 1.21 1.01 0.11 −0.16 0.01 0.02 −0.06 0.22 −0.02 2.66
10 0.200 × 10⁻² 0.802 2.04 1.77 0.89 0.42 −0.14 −0.42 0.05 −0.04 0.13 0.02 2.91
10 0.500 × 10⁻² 0.628 1.12 0.77 0.91 0.41 −0.11 −0.48 −0.02 −0.03 0.10 0.10 1.76
10 0.200 × 10⁻¹ 0.513 1.05 1.27 1.32 0.58 −0.04 −0.54 −0.13 0.00 0.04 0.22 2.27
12 0.139 × 10⁻³ 1.281 1.78 2.91 0.92 0.73 −0.23 −0.36 −0.04 −0.44 −0.01 −0.17 3.67
12 0.161 × 10⁻³ 1.340 0.91 1.42 1.02 1.35 −0.26 −0.34 −0.05 0.02 0.00 −0.04 2.42
12 0.182 × 10⁻³ 1.295 1.31 1.68 0.90 1.40 −0.24 −0.26 −0.03 0.40 −0.01 −0.11 2.76
123

580 Page 70 of 98 Eur. Phys. J. C (2015) 75:580
Table 10 continued
Q2
(GeV2)xBj σ+
r,NC δstat(%)
δuncor(%)
δcor(%)
δrel(%)
δγ p(%)
δhad(%)
δ1(%)
δ2(%)
δ3(%)
δ4(%)
δtot(%)
12 0.200 × 10⁻³ 1.294 0.82 0.70 1.22 1.08 −0.90 −0.19 −0.03 0.25 −0.02 −0.19 2.19
12 0.320 × 10⁻³ 1.223 0.76 0.57 0.78 0.57 −0.28 −0.21 −0.01 0.07 0.07 −0.11 1.41
12 0.500 × 10⁻³ 1.145 0.53 0.65 0.76 0.47 −0.10 −0.13 −0.01 0.00 0.01 −0.10 1.24
12 0.800 × 10⁻³ 1.045 0.67 0.56 0.75 0.44 −0.01 −0.17 0.05 −0.03 0.10 −0.09 1.25
12 0.130 × 10⁻² 0.935 1.03 0.83 0.78 0.33 0.01 −0.18 −0.19 −0.01 0.06 0.04 1.59
12 0.200 × 10⁻² 0.851 1.03 0.94 0.79 0.23 −0.04 −0.17 −0.02 −0.01 0.06 0.07 1.63
12 0.320 × 10⁻² 0.754 1.13 1.36 0.87 0.30 0.10 −0.33 −0.01 0.00 0.03 0.05 2.02
12 0.500 × 10⁻² 0.679 0.85 1.26 0.92 0.34 −0.14 −0.08 −0.20 0.00 0.03 0.07 1.83
12 0.200 × 10⁻¹ 0.490 0.90 1.85 1.35 0.30 −0.38 −0.84 −0.95 0.00 0.01 0.08 2.81
15 0.174 × 10⁻³ 1.340 1.37 3.71 0.93 0.75 −0.22 −0.45 −0.04 −0.37 −0.01 −0.19 4.18
15 0.200 × 10⁻³ 1.386 0.93 2.64 0.93 0.47 −0.19 −0.36 −0.03 0.06 −0.01 −0.25 3.02
15 0.228 × 10⁻³ 1.330 1.81 2.33 0.92 0.44 −0.19 −0.38 −0.04 0.05 −0.02 −0.23 3.16
15 0.320 × 10⁻³ 1.313 0.85 0.70 1.08 0.72 −0.68 −0.18 −0.02 0.14 −0.02 −0.18 1.85
15 0.500 × 10⁻³ 1.207 0.47 0.65 0.76 0.51 −0.13 −0.16 0.00 0.02 0.04 −0.12 1.24
15 0.800 × 10⁻³ 1.105 0.48 0.63 0.76 0.45 −0.06 −0.09 0.01 −0.01 0.02 −0.11 1.19
15 0.130 × 10⁻² 0.979 0.51 0.65 0.79 0.45 −0.07 −0.09 0.01 −0.03 0.09 −0.10 1.25
15 0.200 × 10⁻² 0.868 0.53 0.67 0.83 0.37 −0.11 −0.14 0.00 −0.05 0.43 −0.05 1.33
15 0.320 × 10⁻² 0.783 0.56 0.78 0.80 0.38 −0.09 −0.15 −0.01 −0.03 0.25 −0.09 1.34
15 0.500 × 10⁻² 0.713 0.59 0.62 0.77 0.36 −0.09 −0.19 0.00 −0.03 0.28 −0.01 1.26
15 0.800 × 10⁻² 0.632 0.51 0.73 0.78 0.38 −0.07 −0.13 −0.01 −0.02 0.18 −0.07 1.26
15 0.200 × 10⁻¹ 0.529 0.69 0.93 1.15 0.47 −0.06 −0.54 −0.10 0.01 0.09 0.13 1.79
18 0.209 × 10⁻³ 1.370 1.52 3.73 0.91 0.72 −0.21 −0.40 −0.04 −0.28 −0.01 −0.20 4.23
18 0.237 × 10⁻³ 1.379 0.78 2.00 1.00 0.93 −0.23 −0.36 −0.05 −0.21 −0.01 −0.14 2.59
18 0.268 × 10⁻³ 1.372 0.65 1.18 0.89 1.08 −0.23 −0.28 −0.04 0.41 −0.01 −0.20 2.03
18 0.328 × 10⁻³ 1.383 0.75 1.05 0.90 1.19 −0.21 −0.15 −0.02 0.66 0.00 −0.20 2.11
18 0.500 × 10⁻³ 1.281 0.59 0.61 0.79 0.75 −0.26 −0.17 −0.02 0.20 0.02 −0.14 1.44
18 0.800 × 10⁻³ 1.155 0.45 0.58 0.75 0.48 −0.09 −0.14 −0.03 −0.03 −0.01 −0.13 1.17
18 0.130 × 10⁻² 1.038 0.45 0.62 0.76 0.47 −0.08 −0.09 0.01 −0.03 0.01 −0.13 1.19
18 0.200 × 10⁻² 0.940 0.51 0.62 0.79 0.43 −0.08 −0.08 0.04 −0.03 0.07 −0.12 1.22
18 0.320 × 10⁻² 0.829 0.53 0.65 0.77 0.38 −0.10 −0.12 0.00 −0.03 0.28 −0.06 1.24
18 0.500 × 10⁻² 0.744 0.56 0.60 0.77 0.38 −0.07 −0.16 −0.01 −0.03 0.14 −0.04 1.20
18 0.800 × 10⁻² 0.664 0.45 0.66 0.81 0.37 −0.08 −0.17 −0.01 −0.02 0.38 −0.06 1.27
18 0.200 × 10⁻¹ 0.536 0.56 1.76 1.18 0.46 −0.05 −0.85 −0.04 0.02 0.80 −0.02 2.52
22 0.290 × 10⁻³ 1.434 1.43 2.21 1.22 0.86 −0.23 −0.33 −0.06 0.00 0.01 −0.43 3.08
22 0.320 × 10⁻³ 1.431 1.26 2.81 0.96 0.80 −0.20 −0.26 −0.04 0.10 0.00 −0.38 3.36
22 0.345 × 10⁻³ 1.410 1.10 1.50 0.84 0.80 −0.18 −0.20 −0.03 0.38 0.00 −0.39 2.27
22 0.388 × 10⁻³ 1.393 0.87 1.03 0.83 0.88 −0.19 −0.17 −0.02 0.63 0.00 −0.38 1.97
22 0.500 × 10⁻³ 1.382 0.82 0.98 0.86 0.98 −0.19 −0.14 −0.01 0.50 0.00 −0.33 1.94
22 0.592 × 10⁻³ 1.327 0.80 0.89 0.88 1.03 −0.19 −0.13 −0.01 0.54 0.00 −0.28 1.92
22 0.800 × 10⁻³ 1.229 0.64 0.76 0.84 0.93 −0.20 −0.11 0.00 0.22 0.00 −0.16 1.64
22 0.130 × 10⁻² 1.057 2.27 1.40 0.93 0.45 0.06 0.21 0.02 −0.02 0.10 −0.08 2.87
22 0.200 × 10⁻² 0.990 1.15 1.24 0.84 0.90 −0.16 −0.22 0.00 −0.37 0.05 −0.02 2.14
22 0.320 × 10⁻² 0.900 2.56 1.18 0.85 0.07 −0.14 0.07 0.06 −0.02 0.11 0.10 2.95
22 0.500 × 10⁻² 0.769 2.37 0.89 0.83 0.37 −0.09 −0.44 0.05 −0.03 0.12 0.14 2.74
22 0.800 × 10⁻² 0.656 2.43 0.93 0.86 0.55 −0.17 −0.54 0.04 −0.02 0.10 0.19 2.86
123

Eur. Phys. J. C (2015) 75:580 Page 71 of 98 580
Table 10 continued
Q2
(GeV2)xBj σ+
r,NC δstat(%)
δuncor(%)
δcor(%)
δrel(%)
δγ p(%)
δhad(%)
δ1(%)
δ2(%)
δ3(%)
δ4(%)
δtot(%)
22 0.130 × 10⁻¹ 0.586 1.94 1.83 1.13 0.37 −0.07 −0.18 −0.08 −0.01 0.08 0.08 2.93
22 0.320 × 10⁻¹ 0.519 1.81 1.61 1.42 0.75 0.00 −0.87 −0.15 −0.01 0.04 0.21 3.04
27 0.314 × 10⁻³ 1.480 2.47 3.86 0.91 0.58 −0.22 −0.47 −0.04 −0.23 −0.01 −0.20 4.74
27 0.355 × 10⁻³ 1.441 0.88 2.64 0.91 0.54 −0.19 −0.35 −0.03 0.07 −0.01 −0.24 3.01
27 0.410 × 10⁻³ 1.462 0.73 2.16 0.90 0.66 −0.20 −0.34 −0.02 −0.07 −0.01 −0.21 2.58
27 0.500 × 10⁻³ 1.411 0.70 0.74 0.87 0.64 −0.43 −0.23 −0.02 0.04 −0.07 −0.16 1.57
27 0.800 × 10⁻³ 1.289 0.44 0.67 0.74 0.49 −0.12 −0.16 −0.01 0.02 −0.02 −0.13 1.22
27 0.130 × 10⁻² 1.154 0.47 0.65 0.76 0.48 −0.07 −0.12 0.00 −0.01 −0.03 −0.13 1.22
27 0.200 × 10⁻² 1.044 0.52 0.64 0.77 0.42 −0.08 −0.10 0.01 −0.03 0.06 −0.13 1.22
27 0.320 × 10⁻² 0.913 0.53 0.66 0.78 0.36 −0.10 −0.18 0.00 −0.04 0.22 −0.08 1.25
27 0.500 × 10⁻² 0.800 0.54 0.65 0.78 0.39 −0.10 −0.18 −0.01 −0.04 0.23 −0.07 1.26
27 0.800 × 10⁻² 0.707 0.58 0.66 0.78 0.39 −0.07 −0.11 −0.01 −0.01 0.09 −0.07 1.25
27 0.130 × 10⁻¹ 0.635 0.55 0.67 0.82 0.36 −0.08 −0.15 −0.01 −0.02 0.42 −0.04 1.32
27 0.200 × 10⁻¹ 0.576 0.85 0.77 0.94 0.38 −0.09 −0.37 0.00 −0.03 0.78 −0.09 1.76
27 0.320 × 10⁻¹ 0.527 0.62 1.78 1.39 0.51 −0.03 −0.85 −0.07 0.04 0.13 0.00 2.55
35 0.460 × 10⁻³ 1.427 1.01 1.99 0.94 0.53 −0.20 −0.39 −0.04 −0.02 0.00 −0.43 2.55
35 0.500 × 10⁻³ 1.472 1.38 1.91 0.92 0.26 −0.16 −0.23 −0.03 −0.01 0.01 −0.59 2.63
35 0.531 × 10⁻³ 1.440 0.78 1.24 0.80 0.46 −0.17 −0.28 −0.03 0.26 −0.01 −0.45 1.84
35 0.616 × 10⁻³ 1.458 0.99 1.23 0.79 0.56 −0.16 −0.16 −0.01 0.48 0.01 −0.57 2.01
35 0.657 × 10⁻³ 1.433 0.88 0.97 0.80 0.66 −0.16 −0.14 −0.01 0.57 0.00 −0.52 1.85
35 0.800 × 10⁻³ 1.386 0.49 0.59 0.76 0.62 −0.19 −0.17 −0.01 0.14 −0.02 −0.24 1.30
35 0.100 × 10⁻² 1.312 0.70 0.75 0.84 0.83 −0.18 −0.12 −0.01 0.35 0.00 −0.37 1.66
35 0.130 × 10⁻² 1.222 0.42 0.48 0.74 0.55 −0.11 −0.06 0.00 0.04 −0.02 −0.20 1.14
35 0.200 × 10⁻² 1.099 0.52 0.55 0.74 0.47 −0.10 −0.05 0.00 −0.04 −0.01 −0.15 1.18
35 0.320 × 10⁻² 0.963 0.49 0.56 0.77 0.44 −0.08 −0.11 0.00 −0.14 0.07 −0.17 1.19
35 0.500 × 10⁻² 0.851 0.60 0.54 0.77 0.37 −0.09 −0.18 −0.01 −0.04 0.13 −0.09 1.21
35 0.800 × 10⁻² 0.746 0.60 0.58 0.78 0.36 −0.08 −0.22 −0.01 −0.04 0.21 −0.09 1.24
35 0.130 × 10⁻¹ 0.661 0.66 0.62 0.79 0.37 −0.05 −0.15 −0.01 −0.01 0.11 −0.09 1.27
35 0.200 × 10⁻¹ 0.591 0.65 0.63 0.87 0.30 −0.12 −0.15 −0.02 −0.05 0.66 −0.08 1.47
35 0.320 × 10⁻¹ 0.517 0.80 0.93 1.25 0.59 −0.06 −0.52 −0.14 −0.02 −0.03 −0.03 1.93
35 0.800 × 10⁻¹ 0.448 1.79 3.54 2.42 0.53 −0.04 −1.03 −0.07 0.01 1.96 0.00 5.18
45 0.590 × 10⁻³ 1.468 1.79 2.82 1.08 0.14 −0.16 −0.28 −0.04 0.09 0.01 −0.84 3.63
45 0.634 × 10⁻³ 1.451 0.87 1.70 0.83 0.42 −0.19 −0.34 −0.03 −0.12 −0.01 −0.47 2.21
45 0.700 × 10⁻³ 1.485 1.42 2.05 0.80 0.15 −0.13 −0.18 −0.01 0.34 0.01 −0.81 2.77
45 0.800 × 10⁻³ 1.460 0.72 0.80 0.75 0.47 −0.21 −0.23 −0.02 0.06 −0.08 −0.34 1.47
45 0.920 × 10⁻³ 1.388 0.98 1.22 0.77 0.35 −0.13 −0.13 −0.01 0.57 0.00 −0.70 2.00
45 0.110 × 10⁻² 1.371 0.84 1.17 0.77 0.43 −0.14 −0.12 −0.01 0.41 0.00 −0.62 1.85
45 0.130 × 10⁻² 1.294 0.48 0.53 0.74 0.50 −0.13 −0.13 −0.01 0.17 −0.01 −0.33 1.21
45 0.200 × 10⁻² 1.152 0.44 0.53 0.73 0.49 −0.10 −0.06 0.00 0.04 −0.01 −0.21 1.14
45 0.320 × 10⁻² 1.005 0.49 0.52 0.74 0.48 −0.09 −0.11 0.00 −0.18 0.00 −0.20 1.18
45 0.500 × 10⁻² 0.896 0.65 0.52 0.76 0.31 −0.05 −0.21 0.00 −0.04 0.07 −0.10 1.19
45 0.800 × 10⁻² 0.780 0.67 0.53 0.76 0.29 −0.10 −0.09 0.00 −0.04 0.06 −0.10 1.19
45 0.130 × 10⁻¹ 0.679 0.71 0.60 0.76 0.38 −0.06 −0.23 −0.01 −0.03 0.17 −0.05 1.29
45 0.200 × 10⁻¹ 0.601 0.72 0.56 0.83 0.29 −0.08 −0.04 −0.02 −0.04 0.40 −0.04 1.34
45 0.320 × 10⁻¹ 0.533 1.10 0.85 0.87 0.37 −0.09 −0.31 −0.02 −0.01 0.55 −0.05 1.79
123

580 Page 72 of 98 Eur. Phys. J. C (2015) 75:580
Table 10 continued
Q2
(GeV2)xBj σ+
r,NC δstat(%)
δuncor(%)
δcor(%)
δrel(%)
δγ p(%)
δhad(%)
δ1(%)
δ2(%)
δ3(%)
δ4(%)
δtot(%)
45 0.500 × 10⁻¹ 0.485 0.92 1.82 1.49 0.47 −0.08 −0.48 −0.08 −0.02 −0.16 0.02 2.62
60 0.800 × 10⁻³ 1.470 0.82 1.66 0.88 0.03 −0.07 −0.15 −0.01 −0.14 0.14 0.05 2.07
60 0.860 × 10⁻³ 1.546 1.80 2.18 0.88 −0.12 −0.12 −0.20 −0.02 0.19 0.01 −0.85 3.10
60 0.940 × 10⁻³ 1.525 1.66 2.28 0.85 −0.12 −0.11 −0.19 −0.01 0.41 0.01 −0.92 3.12
60 0.110 × 10⁻² 1.459 1.29 1.39 0.83 −0.21 −0.09 −0.16 −0.01 0.56 0.01 −1.04 2.40
60 0.130 × 10⁻² 1.391 0.66 0.73 0.73 0.36 −0.12 −0.19 −0.01 0.19 −0.04 −0.39 1.37
60 0.150 × 10⁻² 1.317 0.99 1.36 0.76 0.17 −0.11 −0.13 0.00 0.21 0.01 −0.80 2.04
60 0.200 × 10⁻² 1.234 0.46 0.47 0.72 0.41 −0.11 −0.06 0.00 0.12 −0.02 −0.35 1.13
60 0.320 × 10⁻² 1.077 0.49 0.52 0.72 0.39 −0.09 −0.05 0.00 −0.03 −0.02 −0.23 1.12
60 0.500 × 10⁻² 0.932 0.55 0.52 0.74 0.30 −0.11 −0.09 0.01 −0.21 0.05 −0.25 1.16
60 0.800 × 10⁻² 0.819 0.73 0.56 0.76 0.37 −0.11 −0.30 0.00 −0.04 0.16 −0.08 1.30
60 0.130 × 10⁻¹ 0.705 0.78 0.62 0.79 0.39 −0.10 −0.16 0.00 −0.04 0.06 −0.09 1.35
60 0.200 × 10⁻¹ 0.631 0.82 0.67 0.81 0.32 −0.11 −0.19 −0.02 −0.04 0.36 −0.07 1.43
60 0.320 × 10⁻¹ 0.552 0.90 0.70 0.84 0.35 −0.10 0.00 −0.02 −0.03 0.46 −0.04 1.53
60 0.500 × 10⁻¹ 0.509 0.95 1.46 1.22 0.45 −0.04 −0.40 −0.11 −0.02 −0.31 0.07 2.24
60 0.130 0.395 2.95 3.88 2.09 0.44 −0.04 −0.76 −0.07 0.01 1.99 0.05 5.73
70 0.922 × 10⁻³ 1.385 2.57 5.67 1.10 0.12 −0.16 −0.29 −0.04 −0.29 0.01 −0.80 6.39
70 0.100 × 10⁻² 1.434 2.18 2.55 0.86 −0.08 −0.11 −0.20 −0.02 0.08 0.01 −0.93 3.60
70 0.110 × 10⁻² 1.506 1.88 2.10 0.81 −0.08 −0.11 −0.17 −0.01 0.48 0.01 −0.97 3.14
70 0.124 × 10⁻² 1.445 1.48 1.80 0.80 −0.15 −0.10 −0.16 −0.01 0.24 0.01 −0.95 2.66
70 0.130 × 10⁻² 1.414 1.32 1.32 0.82 −0.16 −0.08 −0.12 0.00 0.45 0.00 −1.09 2.37
70 0.200 × 10⁻² 1.246 1.15 1.36 0.78 −0.03 −0.09 −0.12 0.00 0.22 0.01 −0.96 2.19
70 0.250 × 10⁻² 1.190 0.96 0.97 0.77 0.03 −0.09 −0.12 0.00 0.13 0.01 −0.91 1.82
70 0.320 × 10⁻² 1.084 0.91 0.78 0.74 0.26 −0.10 0.00 0.01 −0.13 0.03 −0.52 1.53
70 0.500 × 10⁻² 0.958 0.83 0.74 0.75 0.23 −0.09 −0.09 −0.01 −0.49 0.05 −0.43 1.51
70 0.800 × 10⁻² 0.819 1.62 0.48 0.77 0.26 −0.05 −0.11 0.01 −0.06 0.07 −0.05 1.88
70 0.130 × 10⁻¹ 0.716 1.89 0.51 0.86 0.46 −0.07 −0.62 0.01 −0.06 0.05 −0.04 2.27
70 0.200 × 10⁻¹ 0.637 1.77 0.67 0.80 0.37 −0.11 −0.46 −0.01 −0.06 0.07 −0.05 2.14
70 0.320 × 10⁻¹ 0.561 2.10 0.92 0.85 −0.02 −0.05 0.26 −0.04 −0.05 0.07 −0.08 2.46
70 0.500 × 10⁻¹ 0.512 1.61 0.90 1.19 0.35 −0.16 −0.37 −0.12 −0.03 0.00 0.02 2.27
90 0.130 × 10⁻² 1.479 0.66 1.49 0.87 0.06 −0.04 −0.13 0.00 −0.05 0.15 0.24 1.87
90 0.150 × 10⁻² 1.418 1.12 1.03 1.33 1.02 −1.18 −0.21 0.01 −0.04 0.08 0.12 2.56
90 0.200 × 10⁻² 1.328 0.79 0.95 0.76 0.53 −0.25 −0.01 −0.01 0.06 0.07 −0.10 1.57
90 0.320 × 10⁻² 1.165 0.66 0.63 0.75 0.45 −0.10 −0.08 0.00 0.08 −0.01 −0.20 1.29
90 0.500 × 10⁻² 1.023 0.71 0.58 0.74 0.46 −0.09 −0.06 0.00 0.04 −0.03 −0.13 1.27
90 0.800 × 10⁻² 0.883 0.87 0.56 0.78 0.38 −0.07 −0.12 0.00 −0.07 0.06 −0.16 1.37
90 0.130 × 10⁻¹ 0.754 0.91 0.69 0.80 0.33 −0.08 −0.22 −0.01 −0.05 −0.22 −0.09 1.47
90 0.200 × 10⁻¹ 0.649 0.95 0.62 0.81 0.36 −0.09 −0.19 0.00 −0.04 0.19 −0.08 1.47
90 0.320 × 10⁻¹ 0.557 1.01 0.73 0.83 0.29 −0.09 0.00 −0.02 −0.04 0.25 −0.06 1.55
90 0.500 × 10⁻¹ 0.488 1.27 0.71 1.00 0.12 −0.13 0.06 −0.06 −0.05 0.38 −0.01 1.82
90 0.800 × 10⁻¹ 0.436 1.24 0.93 1.03 0.42 −0.11 −0.29 −0.06 −0.04 −0.17 0.03 1.94
90 0.180 0.343 3.06 3.04 1.84 1.53 0.29 −1.38 −0.05 −0.05 0.04 0.09 5.13
120 0.160 × 10⁻² 1.410 0.76 1.42 0.87 0.01 −0.04 −0.14 0.00 −0.04 0.13 0.19 1.85
120 0.172 × 10⁻² 1.444 2.56 3.08 0.82 −0.12 −0.10 −0.18 −0.01 0.01 0.01 −0.94 4.20
120 0.188 × 10⁻² 1.413 2.23 2.63 0.79 −0.17 −0.08 −0.14 −0.01 0.16 0.01 −1.01 3.69
123
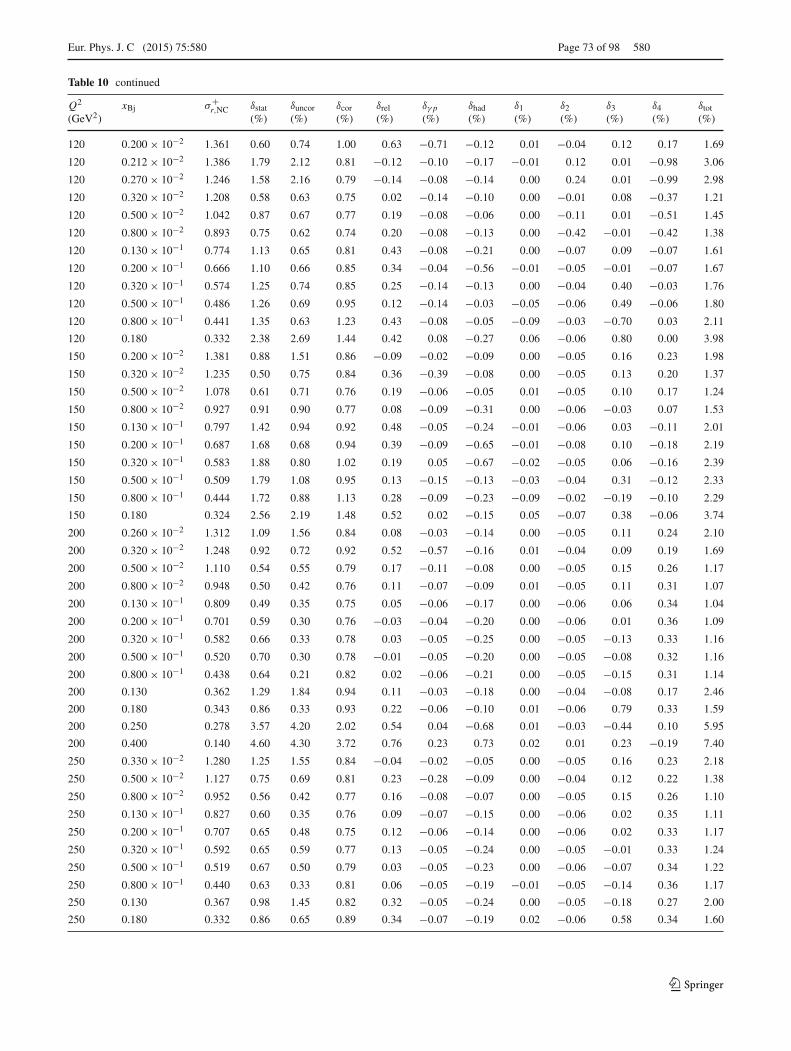
Eur. Phys. J. C (2015) 75:580 Page 73 of 98 580
Table 10 continued
Q2
(GeV2)xBj σ+
r,NC δstat(%)
δuncor(%)
δcor(%)
δrel(%)
δγ p(%)
δhad(%)
δ1(%)
δ2(%)
δ3(%)
δ4(%)
δtot(%)
120 0.200 × 10⁻² 1.361 0.60 0.74 1.00 0.63 −0.71 −0.12 0.01 −0.04 0.12 0.17 1.69
120 0.212 × 10⁻² 1.386 1.79 2.12 0.81 −0.12 −0.10 −0.17 −0.01 0.12 0.01 −0.98 3.06
120 0.270 × 10⁻² 1.246 1.58 2.16 0.79 −0.14 −0.08 −0.14 0.00 0.24 0.01 −0.99 2.98
120 0.320 × 10⁻² 1.208 0.58 0.63 0.75 0.02 −0.14 −0.10 0.00 −0.01 0.08 −0.37 1.21
120 0.500 × 10⁻² 1.042 0.87 0.67 0.77 0.19 −0.08 −0.06 0.00 −0.11 0.01 −0.51 1.45
120 0.800 × 10⁻² 0.893 0.75 0.62 0.74 0.20 −0.08 −0.13 0.00 −0.42 −0.01 −0.42 1.38
120 0.130 × 10⁻¹ 0.774 1.13 0.65 0.81 0.43 −0.08 −0.21 0.00 −0.07 0.09 −0.07 1.61
120 0.200 × 10⁻¹ 0.666 1.10 0.66 0.85 0.34 −0.04 −0.56 −0.01 −0.05 −0.01 −0.07 1.67
120 0.320 × 10⁻¹ 0.574 1.25 0.74 0.85 0.25 −0.14 −0.13 0.00 −0.04 0.40 −0.03 1.76
120 0.500 × 10⁻¹ 0.486 1.26 0.69 0.95 0.12 −0.14 −0.03 −0.05 −0.06 0.49 −0.06 1.80
120 0.800 × 10⁻¹ 0.441 1.35 0.63 1.23 0.43 −0.08 −0.05 −0.09 −0.03 −0.70 0.03 2.11
120 0.180 0.332 2.38 2.69 1.44 0.42 0.08 −0.27 0.06 −0.06 0.80 0.00 3.98
150 0.200 × 10⁻² 1.381 0.88 1.51 0.86 −0.09 −0.02 −0.09 0.00 −0.05 0.16 0.23 1.98
150 0.320 × 10⁻² 1.235 0.50 0.75 0.84 0.36 −0.39 −0.08 0.00 −0.05 0.13 0.20 1.37
150 0.500 × 10⁻² 1.078 0.61 0.71 0.76 0.19 −0.06 −0.05 0.01 −0.05 0.10 0.17 1.24
150 0.800 × 10⁻² 0.927 0.91 0.90 0.77 0.08 −0.09 −0.31 0.00 −0.06 −0.03 0.07 1.53
150 0.130 × 10⁻¹ 0.797 1.42 0.94 0.92 0.48 −0.05 −0.24 −0.01 −0.06 0.03 −0.11 2.01
150 0.200 × 10⁻¹ 0.687 1.68 0.68 0.94 0.39 −0.09 −0.65 −0.01 −0.08 0.10 −0.18 2.19
150 0.320 × 10⁻¹ 0.583 1.88 0.80 1.02 0.19 0.05 −0.67 −0.02 −0.05 0.06 −0.16 2.39
150 0.500 × 10⁻¹ 0.509 1.79 1.08 0.95 0.13 −0.15 −0.13 −0.03 −0.04 0.31 −0.12 2.33
150 0.800 × 10⁻¹ 0.444 1.72 0.88 1.13 0.28 −0.09 −0.23 −0.09 −0.02 −0.19 −0.10 2.29
150 0.180 0.324 2.56 2.19 1.48 0.52 0.02 −0.15 0.05 −0.07 0.38 −0.06 3.74
200 0.260 × 10⁻² 1.312 1.09 1.56 0.84 0.08 −0.03 −0.14 0.00 −0.05 0.11 0.24 2.10
200 0.320 × 10⁻² 1.248 0.92 0.72 0.92 0.52 −0.57 −0.16 0.01 −0.04 0.09 0.19 1.69
200 0.500 × 10⁻² 1.110 0.54 0.55 0.79 0.17 −0.11 −0.08 0.00 −0.05 0.15 0.26 1.17
200 0.800 × 10⁻² 0.948 0.50 0.42 0.76 0.11 −0.07 −0.09 0.01 −0.05 0.11 0.31 1.07
200 0.130 × 10⁻¹ 0.809 0.49 0.35 0.75 0.05 −0.06 −0.17 0.00 −0.06 0.06 0.34 1.04
200 0.200 × 10⁻¹ 0.701 0.59 0.30 0.76 −0.03 −0.04 −0.20 0.00 −0.06 0.01 0.36 1.09
200 0.320 × 10⁻¹ 0.582 0.66 0.33 0.78 0.03 −0.05 −0.25 0.00 −0.05 −0.13 0.33 1.16
200 0.500 × 10⁻¹ 0.520 0.70 0.30 0.78 −0.01 −0.05 −0.20 0.00 −0.05 −0.08 0.32 1.16
200 0.800 × 10⁻¹ 0.438 0.64 0.21 0.82 0.02 −0.06 −0.21 0.00 −0.05 −0.15 0.31 1.14
200 0.130 0.362 1.29 1.84 0.94 0.11 −0.03 −0.18 0.00 −0.04 −0.08 0.17 2.46
200 0.180 0.343 0.86 0.33 0.93 0.22 −0.06 −0.10 0.01 −0.06 0.79 0.33 1.59
200 0.250 0.278 3.57 4.20 2.02 0.54 0.04 −0.68 0.01 −0.03 −0.44 0.10 5.95
200 0.400 0.140 4.60 4.30 3.72 0.76 0.23 0.73 0.02 0.01 0.23 −0.19 7.40
250 0.330 × 10⁻² 1.280 1.25 1.55 0.84 −0.04 −0.02 −0.05 0.00 −0.05 0.16 0.23 2.18
250 0.500 × 10⁻² 1.127 0.75 0.69 0.81 0.23 −0.28 −0.09 0.00 −0.04 0.12 0.22 1.38
250 0.800 × 10⁻² 0.952 0.56 0.42 0.77 0.16 −0.08 −0.07 0.00 −0.05 0.15 0.26 1.10
250 0.130 × 10⁻¹ 0.827 0.60 0.35 0.76 0.09 −0.07 −0.15 0.00 −0.06 0.02 0.35 1.11
250 0.200 × 10⁻¹ 0.707 0.65 0.48 0.75 0.12 −0.06 −0.14 0.00 −0.06 0.02 0.33 1.17
250 0.320 × 10⁻¹ 0.592 0.65 0.59 0.77 0.13 −0.05 −0.24 0.00 −0.05 −0.01 0.33 1.24
250 0.500 × 10⁻¹ 0.519 0.67 0.50 0.79 0.03 −0.05 −0.23 0.00 −0.06 −0.07 0.34 1.22
250 0.800 × 10⁻¹ 0.440 0.63 0.33 0.81 0.06 −0.05 −0.19 −0.01 −0.05 −0.14 0.36 1.17
250 0.130 0.367 0.98 1.45 0.82 0.32 −0.05 −0.24 0.00 −0.05 −0.18 0.27 2.00
250 0.180 0.332 0.86 0.65 0.89 0.34 −0.07 −0.19 0.02 −0.06 0.58 0.34 1.60
123

580 Page 74 of 98 Eur. Phys. J. C (2015) 75:580
Table 10 continued
Q2
(GeV2)xBj σ+
r,NC δstat(%)
δuncor(%)
δcor(%)
δrel(%)
δγ p(%)
δhad(%)
δ1(%)
δ2(%)
δ3(%)
δ4(%)
δtot(%)
250 0.250 0.267 2.11 3.68 1.68 0.90 0.00 −0.16 0.01 −0.03 −0.19 0.15 4.67
250 0.400 0.142 3.11 3.97 3.13 1.72 0.09 0.57 0.02 −0.01 0.06 −0.01 6.21
300 0.390 × 10⁻² 1.218 1.40 1.55 0.82 −0.06 −0.02 −0.04 0.00 −0.06 0.19 0.24 2.26
300 0.500 × 10⁻² 1.142 1.26 0.81 0.86 0.26 −0.44 −0.16 0.00 −0.04 0.09 0.20 1.82
300 0.800 × 10⁻² 0.969 0.69 0.42 0.78 0.20 −0.10 −0.09 0.00 −0.05 0.11 0.25 1.19
300 0.130 × 10⁻¹ 0.813 0.65 0.37 0.76 0.10 −0.06 −0.09 0.00 −0.05 0.09 0.30 1.12
300 0.200 × 10⁻¹ 0.703 0.72 0.42 0.76 0.15 −0.06 −0.14 0.00 −0.05 0.09 0.31 1.19
300 0.320 × 10⁻¹ 0.598 0.75 0.67 0.76 0.12 −0.05 −0.24 0.00 −0.06 0.03 0.31 1.33
300 0.500 × 10⁻¹ 0.507 0.77 0.55 0.77 0.14 −0.05 −0.16 0.00 −0.05 0.03 0.32 1.28
300 0.800 × 10⁻¹ 0.433 0.74 0.46 0.81 0.12 −0.07 −0.20 0.00 −0.05 −0.09 0.31 1.26
300 0.130 0.371 1.06 1.59 0.84 0.40 −0.06 −0.21 0.00 −0.05 −0.20 0.29 2.16
300 0.180 0.327 0.95 0.39 0.84 0.24 −0.08 −0.19 0.00 −0.06 −0.19 0.33 1.42
300 0.250 0.268 2.10 4.45 1.77 1.44 −0.04 −0.20 0.01 −0.04 −0.26 0.21 5.44
300 0.400 0.159 1.74 3.03 1.67 1.50 −0.04 0.13 0.01 −0.04 −0.11 0.19 4.16
400 0.530 × 10⁻² 1.181 1.48 1.58 0.80 0.01 −0.02 −0.08 0.01 −0.05 0.16 0.25 2.33
400 0.800 × 10⁻² 1.018 0.85 0.59 0.80 0.23 −0.21 −0.09 0.00 −0.06 0.09 0.26 1.38
400 0.130 × 10⁻¹ 0.844 0.80 0.55 0.76 0.07 −0.06 −0.08 0.00 −0.05 0.11 0.30 1.28
400 0.200 × 10⁻¹ 0.714 0.85 0.54 0.76 0.10 −0.06 −0.09 0.00 −0.05 0.08 0.25 1.30
400 0.320 × 10⁻¹ 0.602 0.85 0.49 0.76 0.18 −0.05 −0.16 0.00 −0.05 −0.01 0.29 1.30
400 0.500 × 10⁻¹ 0.512 0.87 0.44 0.77 0.19 −0.06 −0.23 0.00 −0.05 −0.07 0.30 1.32
400 0.800 × 10⁻¹ 0.436 0.90 0.40 0.78 0.02 −0.06 −0.18 0.00 −0.05 −0.01 0.30 1.31
400 0.130 0.367 0.94 0.53 0.78 0.17 −0.06 −0.19 0.00 −0.05 −0.08 0.30 1.39
400 0.180 0.320 1.82 2.40 1.20 0.62 −0.04 −0.07 0.01 −0.05 −0.21 0.27 3.32
400 0.250 0.261 1.37 0.60 0.88 0.42 −0.06 −0.13 0.02 −0.05 −0.25 0.28 1.83
400 0.400 0.160 1.96 2.45 1.75 1.26 −0.02 0.12 0.02 −0.04 −0.09 0.17 3.81
500 0.660 × 10⁻² 1.052 1.67 1.55 0.80 −0.01 −0.02 −0.06 0.00 −0.05 0.17 0.26 2.43
500 0.800 × 10⁻² 0.998 1.74 0.89 0.81 0.20 −0.31 −0.15 0.00 −0.05 0.09 0.22 2.16
500 0.130 × 10⁻¹ 0.875 1.23 0.77 0.78 0.17 −0.07 −0.05 0.00 −0.05 0.15 0.25 1.68
500 0.200 × 10⁻¹ 0.741 1.16 0.90 0.78 0.02 −0.03 −0.09 0.00 −0.05 0.14 0.23 1.69
500 0.320 × 10⁻¹ 0.619 1.20 0.86 0.78 0.11 −0.04 −0.12 0.00 −0.05 0.10 0.28 1.71
500 0.500 × 10⁻¹ 0.533 1.25 0.98 0.81 0.28 −0.05 −0.08 0.00 −0.05 −0.08 0.30 1.83
500 0.800 × 10⁻¹ 0.443 1.34 0.88 0.82 0.03 −0.04 −0.22 0.00 −0.05 −0.01 0.30 1.84
500 0.130 0.377 1.54 1.14 0.85 0.09 −0.06 −0.31 0.00 −0.05 −0.15 0.31 2.15
500 0.180 0.313 1.72 1.50 0.85 0.36 −0.05 −0.22 0.00 −0.05 −0.20 0.30 2.50
500 0.250 0.261 2.08 2.16 1.36 0.98 −0.03 0.06 0.01 −0.05 −0.11 0.23 3.45
500 0.400 0.172 5.01 5.86 3.24 2.88 −0.09 0.03 0.02 −0.03 −0.39 0.19 8.85
650 0.850 × 10⁻² 1.000 1.91 1.67 0.78 −0.04 −0.01 −0.08 0.00 −0.05 0.16 0.25 2.68
650 0.130 × 10⁻¹ 0.862 1.02 0.63 0.79 0.15 −0.12 −0.09 0.00 −0.05 0.10 0.27 1.48
650 0.200 × 10⁻¹ 0.746 1.05 0.55 0.75 0.09 −0.07 −0.07 0.01 −0.05 0.08 0.30 1.45
650 0.320 × 10⁻¹ 0.627 1.09 0.56 0.76 0.15 −0.06 −0.11 0.00 −0.05 0.05 0.26 1.48
650 0.500 × 10⁻¹ 0.520 1.12 0.49 0.76 0.13 −0.04 −0.21 0.00 −0.06 0.02 0.33 1.50
650 0.800 × 10⁻¹ 0.438 1.18 0.48 0.76 0.10 −0.07 −0.17 0.00 −0.06 −0.02 0.32 1.53
650 0.130 0.362 1.31 0.52 0.79 0.14 −0.07 −0.22 0.00 −0.05 −0.14 0.28 1.67
650 0.180 0.334 1.92 1.47 0.85 0.42 −0.06 −0.21 0.00 −0.05 −0.25 0.31 2.63
650 0.250 0.248 1.55 0.75 0.84 0.40 −0.08 −0.15 0.00 −0.05 0.19 0.31 2.00
123

Eur. Phys. J. C (2015) 75:580 Page 75 of 98 580
Table 10 continued
Q2
(GeV2)xBj σ+
r,NC δstat(%)
δuncor(%)
δcor(%)
δrel(%)
δγ p(%)
δhad(%)
δ1(%)
δ2(%)
δ3(%)
δ4(%)
δtot(%)
650 0.400 0.145 3.28 2.49 1.61 1.35 0.02 0.21 0.05 −0.05 −0.20 0.27 4.64
650 0.650 0.023 13.74 7.80 4.08 2.37 0.12 1.43 0.02 0.00 0.40 −0.08 16.55
800 0.105 × 10⁻¹ 0.932 2.28 1.77 0.79 0.11 −0.03 −0.11 0.00 −0.05 0.15 0.27 3.01
800 0.130 × 10⁻¹ 0.844 1.36 0.79 0.84 0.27 −0.18 −0.12 0.00 −0.05 0.07 0.26 1.83
800 0.200 × 10⁻¹ 0.733 1.28 0.67 0.76 −0.01 −0.06 −0.09 0.00 −0.05 0.08 0.32 1.67
800 0.320 × 10⁻¹ 0.627 1.23 0.60 0.75 0.04 −0.06 −0.12 0.00 −0.05 0.11 0.30 1.60
800 0.500 × 10⁻¹ 0.525 1.23 0.49 0.76 0.10 −0.04 −0.19 0.00 −0.05 0.01 0.29 1.57
800 0.800 × 10⁻¹ 0.458 1.30 0.52 0.76 0.09 −0.05 −0.22 0.00 −0.06 −0.07 0.38 1.66
800 0.130 0.358 1.48 0.55 0.78 0.18 −0.07 −0.18 0.01 −0.05 −0.11 0.29 1.81
800 0.180 0.331 2.22 1.45 0.81 0.29 −0.05 −0.21 0.00 −0.05 −0.14 0.30 2.82
800 0.250 0.252 1.76 0.69 0.84 0.38 −0.07 −0.18 0.00 −0.05 −0.16 0.25 2.13
800 0.400 0.132 3.68 2.70 1.59 1.06 −0.04 0.11 0.05 −0.05 −0.23 0.28 4.96
800 0.650 0.021 11.93 7.21 3.81 2.83 0.03 0.58 0.02 −0.01 −0.12 0.01 14.74
1000 0.130 × 10⁻¹ 0.823 2.34 1.36 1.16 0.71 −0.97 −0.15 0.00 −0.04 0.08 0.15 3.20
1000 0.200 × 10⁻¹ 0.736 1.93 0.89 0.79 0.16 −0.13 −0.02 0.00 −0.05 0.16 0.24 2.29
1000 0.320 × 10⁻¹ 0.625 1.82 0.98 0.79 0.15 −0.04 −0.03 0.00 −0.05 0.15 0.25 2.24
1000 0.500 × 10⁻¹ 0.532 1.89 1.26 0.78 0.07 −0.03 −0.05 0.00 −0.05 0.15 0.23 2.42
1000 0.800 × 10⁻¹ 0.447 2.03 1.01 0.78 0.03 −0.04 −0.18 0.00 −0.05 −0.11 0.29 2.43
1000 0.130 0.362 2.54 1.21 0.86 0.06 −0.02 −0.09 0.00 −0.06 0.07 0.31 2.96
1000 0.180 0.313 2.60 1.30 0.79 0.14 −0.04 −0.20 0.00 −0.05 −0.18 0.29 3.04
1000 0.250 0.255 2.87 1.74 0.91 0.47 −0.05 −0.23 0.00 −0.05 −0.19 0.29 3.53
1000 0.400 0.134 4.59 3.11 1.51 1.26 −0.05 0.04 0.01 −0.05 −0.33 0.27 5.90
1000 0.650 0.020 13.69 7.72 3.81 2.79 −0.06 −0.28 0.02 −0.02 −0.63 0.10 16.42
1200 0.140 × 10⁻¹ 0.832 1.96 1.22 1.42 0.75 −0.60 −0.11 0.00 −0.04 −0.09 0.06 2.88
1200 0.200 × 10⁻¹ 0.755 1.54 0.79 0.80 0.18 −0.14 −0.09 0.00 −0.05 0.09 0.28 1.95
1200 0.320 × 10⁻¹ 0.632 1.46 0.58 0.77 0.08 −0.05 −0.07 0.00 −0.06 0.05 0.33 1.78
1200 0.500 × 10⁻¹ 0.519 1.31 0.46 0.76 0.11 −0.05 −0.16 0.00 −0.05 0.01 0.28 1.62
1200 0.800 × 10⁻¹ 0.441 1.37 0.42 0.75 0.14 −0.06 −0.17 0.00 −0.06 −0.04 0.32 1.67
1200 0.130 0.361 1.51 0.41 0.76 0.11 −0.04 −0.15 0.00 −0.06 −0.05 0.35 1.79
1200 0.180 0.328 3.01 1.29 0.81 0.13 −0.05 −0.29 0.00 −0.05 −0.20 0.31 3.41
1200 0.250 0.252 1.72 0.50 0.77 0.16 −0.07 −0.14 0.00 −0.06 −0.06 0.38 1.99
1200 0.400 0.131 2.61 1.07 0.93 0.65 −0.07 −0.08 0.02 −0.05 0.35 0.34 3.08
1200 0.650 0.022 13.48 7.83 3.19 3.62 −0.03 0.13 0.03 −0.03 −0.43 0.30 16.33
1500 0.200 × 10⁻¹ 0.709 2.05 0.98 1.24 0.71 −0.43 −0.12 0.01 −0.04 0.05 −0.02 2.72
1500 0.320 × 10⁻¹ 0.603 1.94 0.67 0.84 0.17 −0.07 −0.07 0.00 −0.05 0.06 0.21 2.23
1500 0.500 × 10⁻¹ 0.544 1.59 0.53 0.75 −0.02 −0.04 −0.09 0.00 −0.06 0.08 0.36 1.88
1500 0.800 × 10⁻¹ 0.453 1.64 0.55 0.75 0.11 −0.04 −0.18 0.00 −0.06 −0.03 0.33 1.93
1500 0.130 0.355 2.04 0.59 0.77 0.04 −0.06 −0.17 0.00 −0.06 −0.02 0.37 2.29
1500 0.180 0.313 2.08 0.55 0.77 0.17 −0.05 −0.13 −0.01 −0.05 0.01 0.32 2.32
1500 0.250 0.248 2.40 0.88 0.79 0.29 −0.07 −0.16 0.00 −0.05 −0.19 0.31 2.72
1500 0.400 0.126 3.38 1.35 1.05 0.51 −0.06 −0.18 0.02 −0.06 −1.18 0.43 4.03
1500 0.650 0.016 9.00 5.25 2.52 2.11 −0.11 0.29 −0.02 −0.03 −0.51 0.33 10.95
2000 0.219 × 10⁻¹ 0.710 5.58 2.40 1.43 0.96 −1.31 −0.22 0.00 −0.04 0.03 0.15 6.45
2000 0.320 × 10⁻¹ 0.589 2.30 1.02 1.09 0.41 −0.15 −0.04 0.00 −0.04 0.07 0.08 2.78
2000 0.500 × 10⁻¹ 0.516 2.17 0.65 0.79 0.11 −0.05 −0.08 0.00 −0.05 −0.04 0.29 2.42
123

580 Page 76 of 98 Eur. Phys. J. C (2015) 75:580
Table 10 continued
Q2
(GeV2)xBj σ+
r,NC δstat(%)
δuncor(%)
δcor(%)
δrel(%)
δγ p(%)
δhad(%)
δ1(%)
δ2(%)
δ3(%)
δ4(%)
δtot(%)
2000 0.800 × 10⁻¹ 0.449 1.94 0.54 0.75 0.01 −0.04 −0.15 0.00 −0.05 0.05 0.34 2.18
2000 0.130 0.362 2.36 0.66 0.76 0.17 −0.06 −0.15 0.01 −0.06 −0.07 0.30 2.60
2000 0.180 0.300 2.50 0.64 0.77 0.07 −0.06 −0.12 0.01 −0.05 0.05 0.35 2.72
2000 0.250 0.244 2.77 0.90 0.80 0.26 −0.08 −0.13 0.00 −0.06 −0.14 0.35 3.06
2000 0.400 0.129 3.78 1.56 0.95 0.75 −0.09 −0.11 0.02 −0.06 −0.44 0.31 4.31
2000 0.650 0.017 10.10 6.04 2.74 2.56 −0.05 −0.03 0.02 −0.06 −0.66 0.26 12.37
3000 0.320 × 10⁻¹ 0.603 3.71 1.72 1.03 0.57 −0.74 −0.17 0.00 −0.05 0.07 0.20 4.33
3000 0.500 × 10⁻¹ 0.518 2.21 0.86 0.78 0.13 −0.08 −0.03 0.00 −0.05 0.14 0.29 2.53
3000 0.800 × 10⁻¹ 0.433 2.26 0.71 0.76 0.11 −0.05 −0.07 0.00 −0.06 0.08 0.34 2.52
3000 0.130 0.352 2.49 0.79 0.77 0.06 −0.04 −0.18 0.00 −0.05 0.00 0.32 2.75
3000 0.180 0.298 2.78 0.90 0.80 0.18 −0.06 −0.14 0.01 −0.05 −0.07 0.33 3.06
3000 0.250 0.231 2.96 0.96 0.79 0.11 −0.05 −0.14 0.01 −0.06 −0.08 0.39 3.25
3000 0.400 0.124 3.81 1.79 0.94 0.48 −0.09 −0.15 0.01 −0.06 −0.24 0.35 4.37
3000 0.650 0.016 7.74 4.02 1.77 1.99 −0.12 0.11 0.01 −0.05 −1.59 0.33 9.26
5000 0.547 × 10⁻¹ 0.477 5.04 2.01 1.15 0.77 −0.94 −0.20 0.00 −0.04 0.08 0.18 5.69
5000 0.800 × 10⁻¹ 0.415 2.37 0.82 0.85 0.28 −0.12 −0.06 0.00 −0.05 0.04 0.22 2.67
5000 0.130 0.343 2.95 0.88 0.77 0.08 −0.05 −0.10 0.00 −0.06 0.04 0.36 3.19
5000 0.180 0.283 2.98 0.85 0.76 −0.01 −0.05 −0.17 0.00 −0.05 0.01 0.36 3.21
5000 0.250 0.225 3.47 1.01 0.78 0.21 −0.05 −0.14 0.00 −0.06 −0.05 0.35 3.72
5000 0.400 0.121 4.38 1.43 0.82 0.31 −0.07 −0.07 0.01 −0.06 −0.22 0.35 4.71
5000 0.650 0.011 12.94 5.80 1.87 1.55 −0.08 −0.30 0.01 −0.07 −1.10 0.35 14.44
8000 0.875 × 10⁻¹ 0.356 8.65 2.69 1.69 1.25 −1.65 −0.25 0.01 −0.04 0.03 0.10 9.45
8000 0.130 0.309 3.84 1.02 1.00 0.23 −0.13 −0.11 0.00 −0.05 −0.07 0.28 4.12
8000 0.180 0.267 4.28 1.07 0.81 0.10 −0.04 −0.08 0.00 −0.06 0.06 0.43 4.51
8000 0.250 0.217 5.03 1.38 0.84 0.14 −0.03 −0.05 0.00 −0.06 0.06 0.41 5.30
8000 0.400 0.103 6.13 2.04 0.93 0.34 −0.06 −0.07 −0.01 −0.06 −0.09 0.36 6.54
8000 0.650 0.016 10.35 4.99 1.37 2.01 −0.10 −0.09 0.02 −0.06 −0.83 0.35 11.78
12,000 0.130 0.212 19.86 5.03 1.33 0.86 −1.16 −0.17 0.00 −0.04 0.12 0.11 20.59
12,000 0.180 0.229 6.07 1.21 1.05 0.22 −0.23 −0.15 0.00 −0.05 −0.03 0.32 6.30
12,000 0.250 0.155 7.64 1.44 1.01 0.00 −0.05 −0.05 0.01 −0.06 0.08 0.42 7.85
12,000 0.400 0.095 8.52 3.04 0.87 0.16 −0.07 −0.06 0.00 −0.06 −0.02 0.34 9.10
12,000 0.650 0.017 17.58 6.81 1.49 0.95 −0.08 −0.28 0.01 −0.06 −0.85 0.44 18.96
20,000 0.250 0.126 11.42 3.08 1.33 0.64 −0.16 −0.06 0.01 −0.05 −0.10 0.19 11.92
20,000 0.400 0.078 15.35 5.55 1.22 −0.22 0.03 −0.02 0.00 −0.06 0.10 0.49 16.38
20,000 0.650 0.012 32.50 13.66 2.15 1.84 −0.03 0.09 0.01 −0.08 −0.17 0.59 35.37
30,000 0.400 0.060 24.46 2.34 4.42 0.34 −0.16 −0.18 0.01 −0.06 0.16 0.43 24.97
30,000 0.650 0.009 69.03 9.87 1.71 0.02 0.04 −0.16 0.01 −0.08 −0.17 0.47 69.75
123

Eur. Phys. J. C (2015) 75:580 Page 77 of 98 580
Table 11 HERA combined reduced cross sections σ+r,NC for NC e+ p scattering at
√s = 300 GeV. The uncertainties are quoted in percent relative
to σ+r,NC. Other details as for Table 10
Q2
(GeV2)xBj σ+
r,NC δstat(%)
δuncor(%)
δcor(%)
δrel(%)
δγ p(%)
δhad(%)
δ1(%)
δ2(%)
δ3(%)
δ4(%)
δtot(%)
0.045 0.621 × 10⁻⁶ 0.078 5.06 1.50 7.30 3.16 1.25 −0.75 −7.46 0.00 −0.02 0.02 12.20
0.065 0.897 × 10⁻⁶ 0.109 2.99 1.50 6.28 3.03 1.42 −0.90 −7.40 0.00 −0.02 0.02 10.83
0.065 0.102 × 10⁻⁵ 0.110 4.70 1.50 5.99 3.78 1.54 −0.79 −4.23 −0.01 −0.02 0.01 9.77
0.085 0.117 × 10⁻⁵ 0.133 2.96 1.50 5.55 2.86 1.49 −0.83 −6.30 0.00 −0.02 0.01 9.62
0.085 0.134 × 10⁻⁵ 0.128 2.28 1.50 4.03 2.02 1.20 −0.53 −4.09 0.00 −0.02 0.01 6.79
0.085 0.156 × 10⁻⁵ 0.125 4.79 1.50 4.55 1.08 1.14 0.07 −1.47 0.00 0.00 0.02 7.11
0.11 0.151 × 10⁻⁵ 0.161 3.49 1.50 5.49 3.46 1.60 −0.83 −5.99 0.00 −0.02 0.01 9.79
0.11 0.173 × 10⁻⁵ 0.162 1.82 0.99 3.28 2.46 1.44 −0.71 −2.84 −0.01 −0.02 0.01 5.64
0.11 0.202 × 10⁻⁵ 0.155 1.80 0.89 2.48 1.70 1.31 −0.41 −1.07 0.00 −0.01 0.01 4.01
0.11 0.243 × 10⁻⁵ 0.148 3.76 1.50 3.52 1.18 0.92 −0.28 −0.37 0.00 0.00 0.01 5.59
0.15 0.207 × 10⁻⁵ 0.220 4.37 1.50 4.59 2.68 1.68 −0.91 −4.20 0.00 −0.02 0.01 8.42
0.15 0.236 × 10⁻⁵ 0.194 2.02 1.02 3.08 1.88 1.39 −0.44 −1.89 0.00 −0.02 0.01 4.88
0.15 0.276 × 10⁻⁵ 0.197 1.63 0.92 2.28 1.46 1.25 −0.07 −0.78 0.00 −0.01 0.01 3.61
0.15 0.331 × 10⁻⁵ 0.198 1.54 0.78 2.15 1.35 1.15 −0.33 0.04 0.00 0.00 0.01 3.29
0.15 0.414 × 10⁻⁵ 0.186 1.98 0.83 2.37 0.86 0.56 −0.12 −0.15 0.00 0.00 0.01 3.36
0.2 0.315 × 10⁻⁵ 0.243 2.50 0.95 2.99 2.11 1.42 −1.04 −1.82 0.00 −0.02 0.01 5.19
0.2 0.368 × 10⁻⁵ 0.242 1.99 0.95 2.16 1.46 1.29 −0.35 −0.74 0.00 0.00 0.01 3.74
0.2 0.441 × 10⁻⁵ 0.236 1.63 0.75 2.03 1.16 1.02 −0.04 −0.20 0.00 0.00 0.01 3.12
0.2 0.552 × 10⁻⁵ 0.233 1.48 0.65 1.90 1.20 0.71 −0.23 0.21 0.00 0.00 0.01 2.88
0.25 0.394 × 10⁻⁵ 0.270 4.11 1.50 2.86 1.95 1.70 −0.48 −0.07 0.00 −0.01 0.01 5.85
0.25 0.460 × 10⁻⁵ 0.274 2.10 0.93 2.62 1.67 1.19 −0.30 −0.11 0.00 −0.01 0.01 4.05
0.25 0.552 × 10⁻⁵ 0.278 1.79 0.93 1.93 1.27 1.06 −0.27 0.00 0.00 0.00 0.01 3.25
0.25 0.690 × 10⁻⁵ 0.273 1.57 0.79 1.91 1.18 0.70 −0.26 0.12 0.00 0.00 0.01 2.95
0.35 0.512 × 10⁻⁵ 0.332 3.43 1.50 3.36 2.02 1.64 −0.52 0.81 0.00 −0.01 0.01 5.74
0.35 0.610 × 10⁻⁵ 0.358 5.74 11.03 4.73 1.00 −1.88 −1.73 4.03 0.01 −0.07 0.01 14.17
0.35 0.662 × 10⁻⁵ 0.327 2.07 0.92 1.94 1.24 1.01 −0.32 −0.31 0.00 0.00 0.01 3.42
0.35 0.828 × 10⁻⁵ 0.329 1.83 0.93 1.97 1.26 0.74 −0.23 0.07 0.00 0.00 0.01 3.21
0.4 0.883 × 10⁻⁵ 0.346 3.87 1.50 2.61 1.30 1.02 −0.26 0.45 0.00 0.00 0.00 5.20
0.4 0.110 × 10⁻⁴ 0.367 2.19 0.89 2.25 1.49 0.66 −0.36 0.21 0.00 0.00 0.01 3.67
0.5 0.860 × 10⁻⁵ 0.441 3.75 9.17 3.54 0.92 −1.56 −0.96 3.31 0.01 −0.05 0.02 11.22
0.65 0.112 × 10⁻⁴ 0.510 4.25 2.61 2.74 1.09 −1.44 −0.90 2.01 0.01 −0.05 0.03 6.36
0.65 0.164 × 10⁻⁴ 0.507 3.02 7.28 2.37 0.69 −0.87 −0.33 1.22 0.00 −0.02 0.03 8.40
0.85 0.138 × 10⁻⁴ 0.614 5.20 9.45 5.02 1.10 −2.04 −1.73 4.69 0.02 −0.08 0.01 13.11
0.85 0.200 × 10⁻⁴ 0.606 2.33 1.23 2.05 0.97 −0.97 −0.50 0.68 0.01 −0.04 0.03 3.71
1.2 0.200 × 10⁻⁴ 0.740 3.60 8.36 3.60 0.89 −1.55 −1.44 3.22 0.01 −0.05 0.02 10.56
1.2 0.320 × 10⁻⁴ 0.665 2.14 1.09 2.05 0.64 −1.07 −0.61 0.00 0.01 −0.05 0.03 3.45
1.5 0.320 × 10⁻⁴ 0.817 1.18 3.20 2.12 0.97 −4.33 −0.33 0.23 0.02 −0.12 −0.03 6.00
2 0.327 × 10⁻⁴ 0.856 2.65 2.11 2.55 1.19 −2.36 −0.82 −0.04 0.02 −0.09 −0.02 5.06
2 0.500 × 10⁻⁴ 0.854 1.31 1.64 1.22 0.68 −1.21 −0.45 0.49 0.01 −0.03 0.03 2.87
2.7 0.409 × 10⁻⁴ 0.961 1.54 6.21 1.94 0.95 −3.84 −0.81 −0.50 0.03 −0.13 −0.05 7.83
2.7 0.500 × 10⁻⁴ 0.886 1.06 1.27 1.31 0.81 −1.82 −0.57 0.50 0.02 −0.08 0.02 3.00
2.7 0.800 × 10⁻⁴ 0.905 3.27 1.00 1.65 0.71 −0.43 −0.85 −0.10 0.01 −0.03 0.01 3.98
3.5 0.573 × 10⁻⁴ 1.008 1.94 3.35 2.62 0.98 −2.97 −0.90 −0.26 0.09 −0.39 −0.39 5.73
3.5 0.800 × 10⁻⁴ 0.980 0.99 1.05 1.06 0.68 −1.21 −0.58 −0.23 0.00 −0.03 0.00 2.34
123
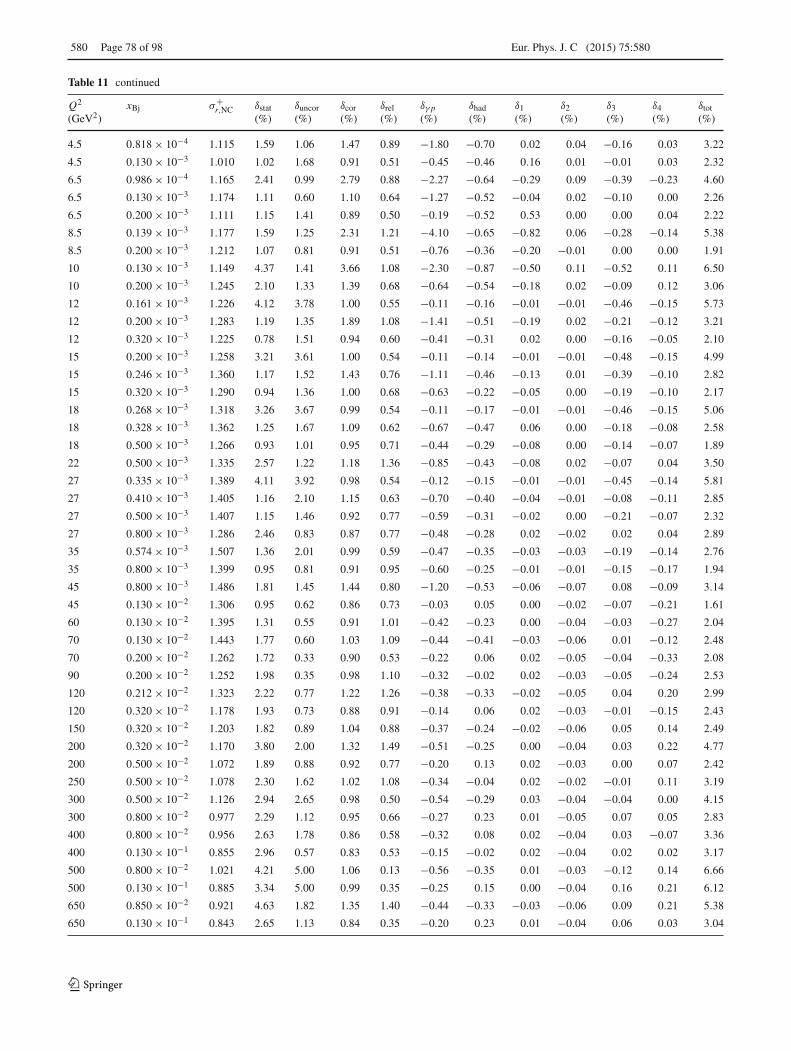
580 Page 78 of 98 Eur. Phys. J. C (2015) 75:580
Table 11 continued
Q2
(GeV2)xBj σ+
r,NC δstat(%)
δuncor(%)
δcor(%)
δrel(%)
δγ p(%)
δhad(%)
δ1(%)
δ2(%)
δ3(%)
δ4(%)
δtot(%)
4.5 0.818 × 10⁻⁴ 1.115 1.59 1.06 1.47 0.89 −1.80 −0.70 0.02 0.04 −0.16 0.03 3.22
4.5 0.130 × 10⁻³ 1.010 1.02 1.68 0.91 0.51 −0.45 −0.46 0.16 0.01 −0.01 0.03 2.32
6.5 0.986 × 10⁻⁴ 1.165 2.41 0.99 2.79 0.88 −2.27 −0.64 −0.29 0.09 −0.39 −0.23 4.60
6.5 0.130 × 10⁻³ 1.174 1.11 0.60 1.10 0.64 −1.27 −0.52 −0.04 0.02 −0.10 0.00 2.26
6.5 0.200 × 10⁻³ 1.111 1.15 1.41 0.89 0.50 −0.19 −0.52 0.53 0.00 0.00 0.04 2.22
8.5 0.139 × 10⁻³ 1.177 1.59 1.25 2.31 1.21 −4.10 −0.65 −0.82 0.06 −0.28 −0.14 5.38
8.5 0.200 × 10⁻³ 1.212 1.07 0.81 0.91 0.51 −0.76 −0.36 −0.20 −0.01 0.00 0.00 1.91
10 0.130 × 10⁻³ 1.149 4.37 1.41 3.66 1.08 −2.30 −0.87 −0.50 0.11 −0.52 0.11 6.50
10 0.200 × 10⁻³ 1.245 2.10 1.33 1.39 0.68 −0.64 −0.54 −0.18 0.02 −0.09 0.12 3.06
12 0.161 × 10⁻³ 1.226 4.12 3.78 1.00 0.55 −0.11 −0.16 −0.01 −0.01 −0.46 −0.15 5.73
12 0.200 × 10⁻³ 1.283 1.19 1.35 1.89 1.08 −1.41 −0.51 −0.19 0.02 −0.21 −0.12 3.21
12 0.320 × 10⁻³ 1.225 0.78 1.51 0.94 0.60 −0.41 −0.31 0.02 0.00 −0.16 −0.05 2.10
15 0.200 × 10⁻³ 1.258 3.21 3.61 1.00 0.54 −0.11 −0.14 −0.01 −0.01 −0.48 −0.15 4.99
15 0.246 × 10⁻³ 1.360 1.17 1.52 1.43 0.76 −1.11 −0.46 −0.13 0.01 −0.39 −0.10 2.82
15 0.320 × 10⁻³ 1.290 0.94 1.36 1.00 0.68 −0.63 −0.22 −0.05 0.00 −0.19 −0.10 2.17
18 0.268 × 10⁻³ 1.318 3.26 3.67 0.99 0.54 −0.11 −0.17 −0.01 −0.01 −0.46 −0.15 5.06
18 0.328 × 10⁻³ 1.362 1.25 1.67 1.09 0.62 −0.67 −0.47 0.06 0.00 −0.18 −0.08 2.58
18 0.500 × 10⁻³ 1.266 0.93 1.01 0.95 0.71 −0.44 −0.29 −0.08 0.00 −0.14 −0.07 1.89
22 0.500 × 10⁻³ 1.335 2.57 1.22 1.18 1.36 −0.85 −0.43 −0.08 0.02 −0.07 0.04 3.50
27 0.335 × 10⁻³ 1.389 4.11 3.92 0.98 0.54 −0.12 −0.15 −0.01 −0.01 −0.45 −0.14 5.81
27 0.410 × 10⁻³ 1.405 1.16 2.10 1.15 0.63 −0.70 −0.40 −0.04 −0.01 −0.08 −0.11 2.85
27 0.500 × 10⁻³ 1.407 1.15 1.46 0.92 0.77 −0.59 −0.31 −0.02 0.00 −0.21 −0.07 2.32
27 0.800 × 10⁻³ 1.286 2.46 0.83 0.87 0.77 −0.48 −0.28 0.02 −0.02 0.02 0.04 2.89
35 0.574 × 10⁻³ 1.507 1.36 2.01 0.99 0.59 −0.47 −0.35 −0.03 −0.03 −0.19 −0.14 2.76
35 0.800 × 10⁻³ 1.399 0.95 0.81 0.91 0.95 −0.60 −0.25 −0.01 −0.01 −0.15 −0.17 1.94
45 0.800 × 10⁻³ 1.486 1.81 1.45 1.44 0.80 −1.20 −0.53 −0.06 −0.07 0.08 −0.09 3.14
45 0.130 × 10⁻² 1.306 0.95 0.62 0.86 0.73 −0.03 0.05 0.00 −0.02 −0.07 −0.21 1.61
60 0.130 × 10⁻² 1.395 1.31 0.55 0.91 1.01 −0.42 −0.23 0.00 −0.04 −0.03 −0.27 2.04
70 0.130 × 10⁻² 1.443 1.77 0.60 1.03 1.09 −0.44 −0.41 −0.03 −0.06 0.01 −0.12 2.48
70 0.200 × 10⁻² 1.262 1.72 0.33 0.90 0.53 −0.22 0.06 0.02 −0.05 −0.04 −0.33 2.08
90 0.200 × 10⁻² 1.252 1.98 0.35 0.98 1.10 −0.32 −0.02 0.02 −0.03 −0.05 −0.24 2.53
120 0.212 × 10⁻² 1.323 2.22 0.77 1.22 1.26 −0.38 −0.33 −0.02 −0.05 0.04 0.20 2.99
120 0.320 × 10⁻² 1.178 1.93 0.73 0.88 0.91 −0.14 0.06 0.02 −0.03 −0.01 −0.15 2.43
150 0.320 × 10⁻² 1.203 1.82 0.89 1.04 0.88 −0.37 −0.24 −0.02 −0.06 0.05 0.14 2.49
200 0.320 × 10⁻² 1.170 3.80 2.00 1.32 1.49 −0.51 −0.25 0.00 −0.04 0.03 0.22 4.77
200 0.500 × 10⁻² 1.072 1.89 0.88 0.92 0.77 −0.20 0.13 0.02 −0.03 0.00 0.07 2.42
250 0.500 × 10⁻² 1.078 2.30 1.62 1.02 1.08 −0.34 −0.04 0.02 −0.02 −0.01 0.11 3.19
300 0.500 × 10⁻² 1.126 2.94 2.65 0.98 0.50 −0.54 −0.29 0.03 −0.04 −0.04 0.00 4.15
300 0.800 × 10⁻² 0.977 2.29 1.12 0.95 0.66 −0.27 0.23 0.01 −0.05 0.07 0.05 2.83
400 0.800 × 10⁻² 0.956 2.63 1.78 0.86 0.58 −0.32 0.08 0.02 −0.04 0.03 −0.07 3.36
400 0.130 × 10⁻¹ 0.855 2.96 0.57 0.83 0.53 −0.15 −0.02 0.02 −0.04 0.02 0.02 3.17
500 0.800 × 10⁻² 1.021 4.21 5.00 1.06 0.13 −0.56 −0.35 0.01 −0.03 −0.12 0.14 6.66
500 0.130 × 10⁻¹ 0.885 3.34 5.00 0.99 0.35 −0.25 0.15 0.00 −0.04 0.16 0.21 6.12
650 0.850 × 10⁻² 0.921 4.63 1.82 1.35 1.40 −0.44 −0.33 −0.03 −0.06 0.09 0.21 5.38
650 0.130 × 10⁻¹ 0.843 2.65 1.13 0.84 0.35 −0.20 0.23 0.01 −0.04 0.06 0.03 3.04
123

Eur. Phys. J. C (2015) 75:580 Page 79 of 98 580
Table 11 continued
Q2
(GeV2)xBj σ+
r,NC δstat(%)
δuncor(%)
δcor(%)
δrel(%)
δγ p(%)
δhad(%)
δ1(%)
δ2(%)
δ3(%)
δ4(%)
δtot(%)
650 0.200 × 10⁻¹ 0.704 4.14 3.70 0.97 0.35 −0.19 0.02 0.00 −0.05 0.08 0.23 5.66
800 0.130 × 10⁻¹ 0.890 3.45 1.49 0.92 0.82 −0.26 −0.01 0.01 −0.04 0.00 0.10 3.96
800 0.200 × 10⁻¹ 0.736 4.12 2.31 0.89 0.30 −0.19 0.26 0.02 −0.05 0.16 0.06 4.83
1000 0.200 × 10⁻¹ 0.740 5.45 3.70 1.03 0.25 −0.38 0.13 0.00 −0.04 0.16 0.15 6.69
1200 0.140 × 10⁻¹ 0.872 5.51 1.05 1.31 1.43 −0.44 −0.03 0.00 −0.04 0.06 0.14 5.95
1200 0.200 × 10⁻¹ 0.703 4.19 1.13 0.81 0.42 −0.33 0.20 0.04 −0.03 0.04 −0.01 4.45
1200 0.320 × 10⁻¹ 0.589 3.96 1.51 0.79 −0.08 −0.15 −0.03 0.03 −0.05 0.10 0.03 4.32
1500 0.200 × 10⁻¹ 0.734 5.99 3.87 0.93 −0.02 −0.38 −0.34 0.04 −0.04 −0.19 −0.05 7.21
1500 0.320 × 10⁻¹ 0.556 6.45 2.29 0.85 0.22 −0.26 0.27 0.03 −0.04 0.18 0.06 6.92
2000 0.320 × 10⁻¹ 0.596 6.11 2.45 0.83 0.16 −0.23 0.16 −0.01 −0.04 0.05 0.08 6.64
2000 0.500 × 10⁻¹ 0.496 5.68 1.70 0.80 0.26 −0.13 0.10 0.00 −0.05 0.17 0.13 6.00
3000 0.500 × 10⁻¹ 0.522 5.63 2.20 0.85 0.18 −0.29 0.29 0.03 −0.04 0.14 0.02 6.12
3000 0.800 × 10⁻¹ 0.444 5.78 1.98 0.80 −0.02 −0.07 0.01 0.02 −0.05 0.17 0.12 6.17
5000 0.800 × 10⁻¹ 0.362 6.86 2.22 0.85 0.38 −0.33 0.33 0.00 −0.03 0.14 0.06 7.29
5000 0.130 0.332 7.82 2.14 0.92 0.29 −0.10 −0.33 0.01 −0.06 0.08 0.10 8.18
8000 0.130 0.257 10.93 3.07 0.79 0.30 −0.26 0.05 0.01 −0.04 0.13 0.12 11.39
8000 0.180 0.278 10.93 3.44 0.94 0.59 −0.15 −0.28 −0.04 −0.04 0.11 0.19 11.52
8000 0.250 0.232 11.77 3.15 1.30 0.29 −0.20 0.03 0.11 −0.08 0.13 0.21 12.26
12,000 0.180 0.209 17.34 2.43 0.92 0.85 −0.32 −0.05 0.00 −0.04 −0.01 0.14 17.56
12,000 0.250 0.150 20.21 3.46 0.81 0.24 −0.17 0.04 −0.01 −0.04 0.17 0.11 20.52
20,000 0.250 0.136 30.61 3.58 0.99 0.74 −0.40 −0.34 0.01 −0.04 −0.15 0.17 30.85
20,000 0.400 0.116 31.61 7.66 1.23 1.07 −0.32 0.70 0.02 −0.03 0.42 0.19 32.58
30,000 0.400 0.111 65.50 5.27 1.39 −0.41 −0.52 −0.07 −0.01 −0.03 −0.08 0.27 65.73
123

580 Page 80 of 98 Eur. Phys. J. C (2015) 75:580
Table 12 HERA combined reduced cross sections σ+r,NC for NC e+ p scattering at
√s = 251 GeV. The uncertainties are quoted in percent relative
to σ+r,NC. Other details as for Table 10
Q2
(GeV2)xBj σ+
r,NC δstat(%)
δuncor(%)
δcor(%)
δrel(%)
δγ p(%)
δhad(%)
δ1(%)
δ2(%)
δ3(%)
δ4(%)
δtot(%)
1.5 0.279 × 10⁻⁴ 0.702 9.08 4.93 3.52 2.22 −0.37 −0.41 −0.12 −8.43 0.08 0.80 14.00
2 0.372 × 10⁻⁴ 0.796 6.22 4.33 2.91 1.91 −0.31 −0.76 −0.10 −7.05 0.07 0.66 10.97
2 0.415 × 10⁻⁴ 0.680 7.33 3.97 2.54 0.57 −0.19 −0.34 −0.08 −2.55 0.08 0.49 9.12
2.5 0.465 × 10⁻⁴ 0.865 5.31 4.12 2.76 2.11 −0.31 −0.39 −0.08 −6.40 0.07 0.70 9.94
2.5 0.519 × 10⁻⁴ 0.852 3.81 3.10 1.59 1.44 −0.23 −0.50 −0.05 −2.39 0.06 0.50 5.92
2.5 0.580 × 10⁻⁴ 0.771 4.97 3.14 1.33 0.80 −0.13 −0.18 −0.02 −0.48 0.06 0.40 6.12
3.5 0.651 × 10⁻⁴ 0.913 5.43 4.04 2.82 2.13 −0.34 −0.65 −0.10 −6.78 0.07 0.71 10.26
3.5 0.727 × 10⁻⁴ 0.894 3.47 2.92 1.72 1.46 −0.25 −0.37 −0.06 −2.53 0.07 0.57 5.70
3.5 0.812 × 10⁻⁴ 0.889 3.11 2.49 1.87 1.15 −0.24 −0.34 −0.07 −1.72 0.07 0.56 4.91
3.5 0.921 × 10⁻⁴ 0.944 3.35 2.66 1.48 0.58 −0.14 −0.42 −0.04 −0.18 0.07 0.37 4.61
3.5 0.106 × 10⁻³ 0.970 5.35 3.27 2.09 0.56 −0.20 −0.01 −0.06 −0.14 0.07 0.50 6.66
5 0.931 × 10⁻⁴ 0.887 6.33 3.99 3.01 1.99 −0.29 −0.59 −0.08 −7.35 0.07 0.65 11.14
5 0.104 × 10⁻³ 0.896 3.49 2.84 1.51 1.10 −0.19 −0.42 −0.05 −1.93 0.06 0.46 5.28
5 0.116 × 10⁻³ 1.019 2.64 2.37 1.43 1.06 −0.20 −0.22 −0.04 −1.01 0.07 0.48 4.14
5 0.132 × 10⁻³ 0.965 2.54 2.33 1.44 1.12 −0.20 −0.23 −0.05 −0.77 0.07 0.49 4.02
5 0.152 × 10⁻³ 1.020 2.42 2.04 1.45 0.79 −0.18 −0.21 −0.04 −0.19 0.07 0.44 3.61
5 0.201 × 10⁻³ 0.949 2.57 2.06 1.59 0.61 −0.16 −0.20 −0.05 −0.10 0.07 0.42 3.74
6.5 0.121 × 10⁻³ 0.937 7.04 4.03 3.42 1.81 −0.21 −0.42 −0.05 −7.69 0.06 0.56 11.85
6.5 0.135 × 10⁻³ 1.005 3.22 2.79 1.46 1.57 −0.22 −0.37 −0.05 −1.53 0.06 0.52 5.06
6.5 0.151 × 10⁻³ 1.105 2.44 2.28 1.37 1.38 −0.20 −0.39 −0.05 −0.95 0.05 0.48 4.03
6.5 0.163 × 10⁻³ 1.180 10.62 12.01 1.81 0.95 −0.15 −0.14 −0.02 0.71 0.07 0.50 16.19
6.5 0.171 × 10⁻³ 1.057 2.29 2.32 1.45 0.73 −0.15 −0.24 −0.04 −0.29 0.07 0.43 3.69
6.5 0.183 × 10⁻³ 1.184 9.84 13.94 1.98 1.28 −0.18 −0.14 −0.02 0.81 0.05 0.30 17.25
6.5 0.197 × 10⁻³ 1.112 2.04 1.96 1.33 0.89 −0.16 −0.23 −0.03 −0.12 0.06 0.43 3.30
6.5 0.228 × 10⁻³ 1.138 9.66 9.40 1.79 0.76 −0.12 −0.11 −0.01 −0.83 0.07 0.45 13.65
6.5 0.262 × 10⁻³ 1.010 1.37 1.81 1.38 0.83 −0.16 −0.09 −0.03 −0.05 0.07 0.45 2.83
8.5 0.158 × 10⁻³ 1.031 6.90 3.99 3.87 2.57 −0.32 −0.34 −0.09 −9.71 0.06 0.78 13.42
8.5 0.177 × 10⁻³ 1.058 3.18 2.81 1.46 1.25 −0.17 −0.39 −0.03 −0.77 0.06 0.48 4.77
8.5 0.197 × 10⁻³ 1.112 2.46 2.24 1.36 1.37 −0.21 −0.32 −0.04 −0.76 0.06 0.56 3.98
8.5 0.224 × 10⁻³ 1.154 2.11 2.05 1.26 1.26 −0.16 −0.22 −0.03 0.00 0.05 0.46 3.48
8.5 0.240 × 10⁻³ 1.146 5.87 6.26 1.44 1.31 −0.17 −0.13 −0.03 0.43 0.06 0.63 8.84
8.5 0.258 × 10⁻³ 1.041 2.02 1.93 1.53 1.07 −0.19 −0.19 −0.03 −0.30 0.06 0.47 3.42
8.5 0.299 × 10⁻³ 1.217 6.86 6.25 1.68 1.13 −0.15 −0.10 −0.02 0.90 0.05 0.39 9.55
8.5 0.342 × 10⁻³ 1.091 1.19 1.76 1.31 0.79 −0.15 −0.08 −0.03 0.15 0.06 0.41 2.66
8.5 0.433 × 10⁻³ 1.092 6.83 7.45 1.78 0.79 −0.12 −0.08 −0.01 −0.14 0.06 0.38 10.31
8.5 0.541 × 10⁻³ 1.022 1.30 1.80 1.27 0.80 −0.12 0.05 −0.01 0.37 0.07 0.39 2.74
8.5 0.838 × 10⁻³ 0.946 1.47 1.85 1.42 0.73 −0.14 0.06 −0.03 0.18 0.07 0.44 2.89
8.5 0.103 × 10⁻² 0.678 12.90 13.65 1.77 0.48 −0.10 −0.10 −0.01 −0.47 0.07 0.32 18.88
8.5 0.140 × 10⁻² 0.823 2.57 2.07 1.41 0.85 −0.16 0.07 −0.03 0.06 0.07 0.46 3.72
12 0.223 × 10⁻³ 1.293 5.39 4.00 2.80 2.10 −0.30 −0.61 −0.09 −6.55 0.07 0.69 10.06
12 0.249 × 10⁻³ 1.148 2.95 2.72 1.44 1.80 −0.22 −0.31 −0.05 −1.38 0.06 0.62 4.89
12 0.278 × 10⁻³ 1.199 2.35 2.17 1.31 1.35 −0.17 −0.30 −0.03 −0.26 0.05 0.49 3.77
12 0.295 × 10⁻³ 1.176 3.77 3.74 1.43 1.78 −0.23 −0.20 −0.04 0.60 0.06 0.75 5.87
12 0.316 × 10⁻³ 1.193 2.54 2.37 1.37 1.15 −0.16 −0.27 −0.02 −0.41 0.06 0.42 3.97
123

Eur. Phys. J. C (2015) 75:580 Page 81 of 98 580
Table 12 continued
Q2
(GeV2)xBj σ+
r,NC δstat(%)
δuncor(%)
δcor(%)
δrel(%)
δγ p(%)
δhad(%)
δ1(%)
δ2(%)
δ3(%)
δ4(%)
δtot(%)
12 0.343 × 10⁻³ 1.228 3.43 3.12 1.36 1.44 −0.20 −0.14 −0.02 0.78 0.05 0.68 5.15
12 0.364 × 10⁻³ 1.176 2.12 1.96 1.35 0.90 −0.14 −0.26 −0.02 0.10 0.06 0.39 3.35
12 0.423 × 10⁻³ 1.226 4.09 3.32 1.37 1.39 −0.17 −0.10 −0.02 0.52 0.06 0.62 5.68
12 0.483 × 10⁻³ 1.124 1.18 1.71 1.26 0.92 −0.14 −0.04 −0.02 0.12 0.06 0.42 2.64
12 0.592 × 10⁻³ 1.145 5.23 4.72 1.64 0.89 −0.13 −0.08 −0.01 0.33 0.06 0.39 7.31
12 0.764 × 10⁻³ 1.054 1.23 1.82 1.28 0.80 −0.12 0.06 −0.02 0.34 0.06 0.40 2.72
12 0.910 × 10⁻³ 0.965 5.51 6.78 1.80 0.86 −0.13 −0.08 0.00 0.46 0.06 0.33 8.98
12 0.118 × 10⁻² 1.020 1.29 1.83 1.30 0.85 −0.13 0.06 −0.01 0.25 0.07 0.42 2.77
12 0.146 × 10⁻² 0.828 5.42 7.17 1.83 0.70 −0.12 −0.11 −0.01 −1.04 0.07 0.53 9.27
12 0.197 × 10⁻² 0.880 2.24 2.00 1.49 1.04 −0.18 0.07 −0.04 −0.22 0.07 0.50 3.56
15 0.279 × 10⁻³ 1.147 6.20 4.04 2.44 1.78 −0.24 −0.46 −0.06 −5.39 0.07 0.60 9.67
15 0.312 × 10⁻³ 1.284 2.62 2.56 1.37 1.08 −0.19 −0.41 −0.05 −0.89 0.07 0.55 4.21
15 0.348 × 10⁻³ 1.187 2.40 2.11 1.25 0.86 −0.16 −0.22 −0.03 −0.06 0.06 0.46 3.58
15 0.394 × 10⁻³ 1.174 2.19 2.01 1.27 1.24 −0.17 −0.29 −0.03 −0.11 0.06 0.53 3.52
15 0.422 × 10⁻³ 1.242 2.61 2.13 1.32 1.33 −0.18 −0.14 −0.02 0.64 0.06 0.59 3.96
15 0.455 × 10⁻³ 1.259 2.33 2.01 1.32 0.98 −0.15 −0.24 −0.02 −0.06 0.06 0.41 3.52
15 0.529 × 10⁻³ 1.204 2.72 1.94 1.32 1.25 −0.17 −0.12 −0.02 0.26 0.06 0.66 3.87
15 0.604 × 10⁻³ 1.168 1.22 1.46 1.26 1.13 −0.16 −0.07 −0.02 0.07 0.05 0.48 2.60
15 0.763 × 10⁻³ 1.145 3.30 2.60 1.36 1.27 −0.15 −0.08 −0.02 0.35 0.05 0.61 4.65
15 0.955 × 10⁻³ 1.042 1.28 1.82 1.28 0.73 −0.12 0.05 −0.01 0.52 0.06 0.37 2.75
15 0.114 × 10⁻² 1.093 3.78 3.31 1.44 1.05 −0.15 −0.09 −0.02 0.12 0.06 0.59 5.37
15 0.148 × 10⁻² 0.976 1.32 1.83 1.36 1.07 −0.14 0.07 −0.01 0.07 0.06 0.44 2.89
15 0.182 × 10⁻² 0.847 4.43 3.95 1.54 0.87 −0.14 −0.10 −0.01 −0.64 0.07 0.62 6.26
15 0.247 × 10⁻² 0.861 2.16 1.98 1.48 1.25 −0.17 0.08 −0.02 −0.15 0.06 0.48 3.56
20 0.372 × 10⁻³ 1.332 6.47 4.25 2.21 1.82 −0.29 −0.38 −0.08 −4.26 0.08 0.66 9.33
20 0.415 × 10⁻³ 1.261 3.63 2.93 1.39 1.06 −0.18 −0.37 −0.04 −1.21 0.06 0.45 5.16
20 0.464 × 10⁻³ 1.294 3.04 2.46 1.31 0.79 −0.12 −0.24 −0.02 −0.09 0.06 0.36 4.22
20 0.526 × 10⁻³ 1.142 3.16 2.46 1.33 1.09 −0.17 −0.35 −0.03 −0.60 0.06 0.42 4.44
20 0.607 × 10⁻³ 1.226 2.57 2.06 1.53 1.17 −0.16 −0.25 −0.01 −0.07 0.05 0.41 3.85
20 0.805 × 10⁻³ 1.211 1.41 1.84 1.31 0.91 −0.12 −0.10 −0.01 0.25 0.06 0.38 2.85
20 0.127 × 10⁻² 1.091 1.39 1.84 1.33 0.93 −0.11 0.05 0.00 0.38 0.06 0.39 2.87
20 0.197 × 10⁻² 0.982 1.44 1.85 1.35 1.04 −0.14 0.06 −0.01 0.15 0.06 0.43 2.94
20 0.329 × 10⁻² 0.858 2.38 2.03 1.40 1.09 −0.16 0.07 −0.02 −0.10 0.06 0.47 3.64
25 0.493 × 10⁻³ 1.300 2.79 2.55 1.30 1.03 −0.17 −0.36 −0.04 −0.66 0.06 0.40 4.22
25 0.570 × 10⁻³ 1.330 3.15 2.69 1.38 0.74 −0.15 −0.21 −0.04 −0.25 0.07 0.48 4.48
25 0.616 × 10⁻³ 1.259 1.77 1.83 1.21 0.83 −0.15 −0.29 −0.03 −0.07 0.06 0.42 2.98
25 0.700 × 10⁻³ 1.325 2.27 1.88 1.25 0.90 −0.14 −0.12 −0.02 0.18 0.07 0.45 3.37
25 0.759 × 10⁻³ 1.227 2.60 2.06 1.34 0.99 −0.17 −0.24 −0.02 −0.16 0.07 0.45 3.76
25 0.880 × 10⁻³ 1.248 2.16 1.62 1.28 1.03 −0.14 −0.10 −0.02 0.28 0.06 0.48 3.21
25 0.101 × 10⁻² 1.231 1.25 1.23 1.21 0.99 −0.14 −0.07 −0.01 0.43 0.06 0.45 2.44
25 0.127 × 10⁻² 1.120 2.00 1.70 1.32 1.09 −0.14 −0.08 −0.01 −0.03 0.06 0.56 3.18
25 0.159 × 10⁻² 1.128 1.55 1.87 1.28 0.75 −0.11 0.05 −0.01 0.50 0.05 0.37 2.92
25 0.184 × 10⁻² 1.042 2.05 2.20 1.33 1.17 −0.14 −0.08 −0.01 0.04 0.06 0.58 3.54
25 0.247 × 10⁻² 1.020 1.58 1.88 1.48 1.25 −0.16 0.08 −0.01 −0.10 0.06 0.46 3.16
25 0.300 × 10⁻² 0.920 2.16 2.25 1.36 1.07 −0.15 −0.09 −0.01 −0.62 0.06 0.70 3.69
123
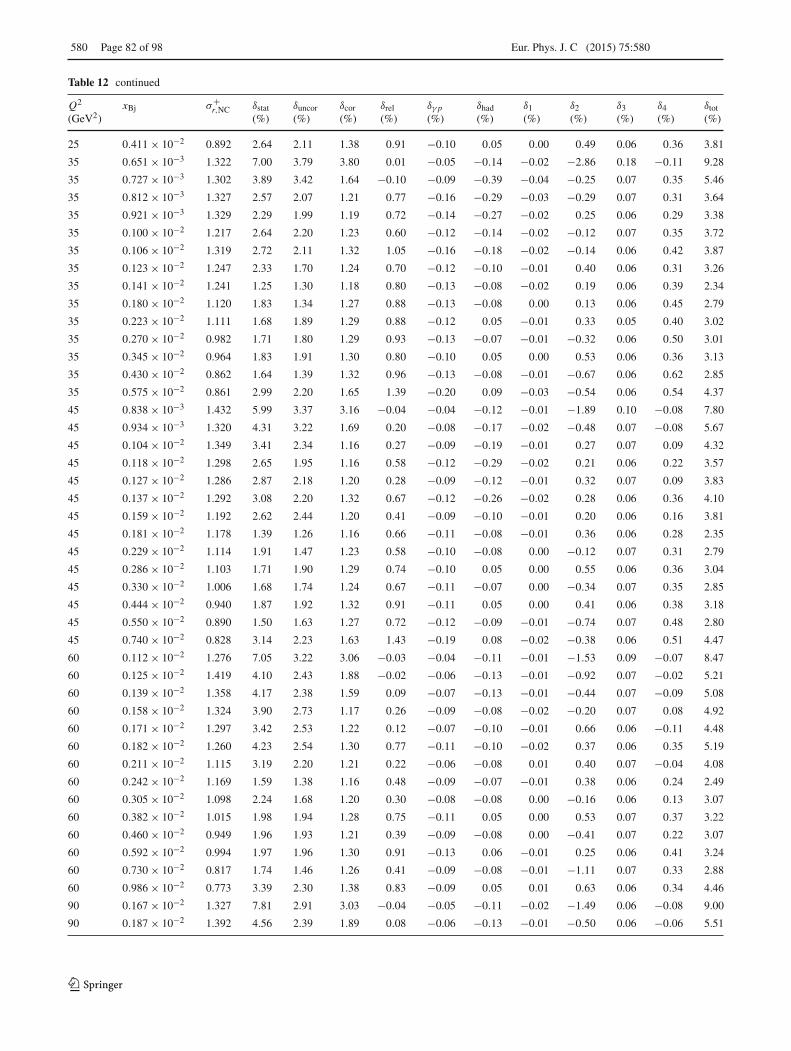
580 Page 82 of 98 Eur. Phys. J. C (2015) 75:580
Table 12 continued
Q2
(GeV2)xBj σ+
r,NC δstat(%)
δuncor(%)
δcor(%)
δrel(%)
δγ p(%)
δhad(%)
δ1(%)
δ2(%)
δ3(%)
δ4(%)
δtot(%)
25 0.411 × 10⁻² 0.892 2.64 2.11 1.38 0.91 −0.10 0.05 0.00 0.49 0.06 0.36 3.81
35 0.651 × 10⁻³ 1.322 7.00 3.79 3.80 0.01 −0.05 −0.14 −0.02 −2.86 0.18 −0.11 9.28
35 0.727 × 10⁻³ 1.302 3.89 3.42 1.64 −0.10 −0.09 −0.39 −0.04 −0.25 0.07 0.35 5.46
35 0.812 × 10⁻³ 1.327 2.57 2.07 1.21 0.77 −0.16 −0.29 −0.03 −0.29 0.07 0.31 3.64
35 0.921 × 10⁻³ 1.329 2.29 1.99 1.19 0.72 −0.14 −0.27 −0.02 0.25 0.06 0.29 3.38
35 0.100 × 10⁻² 1.217 2.64 2.20 1.23 0.60 −0.12 −0.14 −0.02 −0.12 0.07 0.35 3.72
35 0.106 × 10⁻² 1.319 2.72 2.11 1.32 1.05 −0.16 −0.18 −0.02 −0.14 0.06 0.42 3.87
35 0.123 × 10⁻² 1.247 2.33 1.70 1.24 0.70 −0.12 −0.10 −0.01 0.40 0.06 0.31 3.26
35 0.141 × 10⁻² 1.241 1.25 1.30 1.18 0.80 −0.13 −0.08 −0.02 0.19 0.06 0.39 2.34
35 0.180 × 10⁻² 1.120 1.83 1.34 1.27 0.88 −0.13 −0.08 0.00 0.13 0.06 0.45 2.79
35 0.223 × 10⁻² 1.111 1.68 1.89 1.29 0.88 −0.12 0.05 −0.01 0.33 0.05 0.40 3.02
35 0.270 × 10⁻² 0.982 1.71 1.80 1.29 0.93 −0.13 −0.07 −0.01 −0.32 0.06 0.50 3.01
35 0.345 × 10⁻² 0.964 1.83 1.91 1.30 0.80 −0.10 0.05 0.00 0.53 0.06 0.36 3.13
35 0.430 × 10⁻² 0.862 1.64 1.39 1.32 0.96 −0.13 −0.08 −0.01 −0.67 0.06 0.62 2.85
35 0.575 × 10⁻² 0.861 2.99 2.20 1.65 1.39 −0.20 0.09 −0.03 −0.54 0.06 0.54 4.37
45 0.838 × 10⁻³ 1.432 5.99 3.37 3.16 −0.04 −0.04 −0.12 −0.01 −1.89 0.10 −0.08 7.80
45 0.934 × 10⁻³ 1.320 4.31 3.22 1.69 0.20 −0.08 −0.17 −0.02 −0.48 0.07 −0.08 5.67
45 0.104 × 10⁻² 1.349 3.41 2.34 1.16 0.27 −0.09 −0.19 −0.01 0.27 0.07 0.09 4.32
45 0.118 × 10⁻² 1.298 2.65 1.95 1.16 0.58 −0.12 −0.29 −0.02 0.21 0.06 0.22 3.57
45 0.127 × 10⁻² 1.286 2.87 2.18 1.20 0.28 −0.09 −0.12 −0.01 0.32 0.07 0.09 3.83
45 0.137 × 10⁻² 1.292 3.08 2.20 1.32 0.67 −0.12 −0.26 −0.02 0.28 0.06 0.36 4.10
45 0.159 × 10⁻² 1.192 2.62 2.44 1.20 0.41 −0.09 −0.10 −0.01 0.20 0.06 0.16 3.81
45 0.181 × 10⁻² 1.178 1.39 1.26 1.16 0.66 −0.11 −0.08 −0.01 0.36 0.06 0.28 2.35
45 0.229 × 10⁻² 1.114 1.91 1.47 1.23 0.58 −0.10 −0.08 0.00 −0.12 0.07 0.31 2.79
45 0.286 × 10⁻² 1.103 1.71 1.90 1.29 0.74 −0.10 0.05 0.00 0.55 0.06 0.36 3.04
45 0.330 × 10⁻² 1.006 1.68 1.74 1.24 0.67 −0.11 −0.07 0.00 −0.34 0.07 0.35 2.85
45 0.444 × 10⁻² 0.940 1.87 1.92 1.32 0.91 −0.11 0.05 0.00 0.41 0.06 0.38 3.18
45 0.550 × 10⁻² 0.890 1.50 1.63 1.27 0.72 −0.12 −0.09 −0.01 −0.74 0.07 0.48 2.80
45 0.740 × 10⁻² 0.828 3.14 2.23 1.63 1.43 −0.19 0.08 −0.02 −0.38 0.06 0.51 4.47
60 0.112 × 10⁻² 1.276 7.05 3.22 3.06 −0.03 −0.04 −0.11 −0.01 −1.53 0.09 −0.07 8.47
60 0.125 × 10⁻² 1.419 4.10 2.43 1.88 −0.02 −0.06 −0.13 −0.01 −0.92 0.07 −0.02 5.21
60 0.139 × 10⁻² 1.358 4.17 2.38 1.59 0.09 −0.07 −0.13 −0.01 −0.44 0.07 −0.09 5.08
60 0.158 × 10⁻² 1.324 3.90 2.73 1.17 0.26 −0.09 −0.08 −0.02 −0.20 0.07 0.08 4.92
60 0.171 × 10⁻² 1.297 3.42 2.53 1.22 0.12 −0.07 −0.10 −0.01 0.66 0.06 −0.11 4.48
60 0.182 × 10⁻² 1.260 4.23 2.54 1.30 0.77 −0.11 −0.10 −0.02 0.37 0.06 0.35 5.19
60 0.211 × 10⁻² 1.115 3.19 2.20 1.21 0.22 −0.06 −0.08 0.01 0.40 0.07 −0.04 4.08
60 0.242 × 10⁻² 1.169 1.59 1.38 1.16 0.48 −0.09 −0.07 −0.01 0.38 0.06 0.24 2.49
60 0.305 × 10⁻² 1.098 2.24 1.68 1.20 0.30 −0.08 −0.08 0.00 −0.16 0.06 0.13 3.07
60 0.382 × 10⁻² 1.015 1.98 1.94 1.28 0.75 −0.11 0.05 0.00 0.53 0.07 0.37 3.22
60 0.460 × 10⁻² 0.949 1.96 1.93 1.21 0.39 −0.09 −0.08 0.00 −0.41 0.07 0.22 3.07
60 0.592 × 10⁻² 0.994 1.97 1.96 1.30 0.91 −0.13 0.06 −0.01 0.25 0.06 0.41 3.24
60 0.730 × 10⁻² 0.817 1.74 1.46 1.26 0.41 −0.09 −0.08 −0.01 −1.11 0.07 0.33 2.88
60 0.986 × 10⁻² 0.773 3.39 2.30 1.38 0.83 −0.09 0.05 0.01 0.63 0.06 0.34 4.46
90 0.167 × 10⁻² 1.327 7.81 2.91 3.03 −0.04 −0.05 −0.11 −0.02 −1.49 0.06 −0.08 9.00
90 0.187 × 10⁻² 1.392 4.56 2.39 1.89 0.08 −0.06 −0.13 −0.01 −0.50 0.06 −0.06 5.51
123

Eur. Phys. J. C (2015) 75:580 Page 83 of 98 580
Table 12 continued
Q2
(GeV2)xBj σ+
r,NC δstat(%)
δuncor(%)
δcor(%)
δrel(%)
δγ p(%)
δhad(%)
δ1(%)
δ2(%)
δ3(%)
δ4(%)
δtot(%)
90 0.209 × 10⁻² 1.299 4.15 2.10 1.83 0.00 −0.06 −0.13 −0.02 −0.31 0.06 −0.05 5.01
90 0.237 × 10⁻² 1.305 4.12 2.53 1.81 0.05 −0.06 −0.11 −0.01 0.05 0.06 −0.09 5.16
90 0.250 × 10⁻² 1.153 4.13 3.26 1.22 −0.04 −0.06 −0.11 0.00 −0.17 0.07 −0.14 5.41
90 0.300 × 10⁻² 1.159 3.56 2.80 1.23 −0.05 −0.05 −0.09 0.00 0.52 0.07 −0.21 4.73
90 0.362 × 10⁻² 1.124 2.13 1.63 1.15 0.34 −0.07 −0.07 0.00 0.22 0.06 0.15 2.96
90 0.460 × 10⁻² 1.018 2.62 1.96 1.20 0.10 −0.06 −0.08 0.00 −0.33 0.07 −0.05 3.50
90 0.573 × 10⁻² 0.922 2.37 2.01 1.29 0.72 −0.12 0.05 −0.02 0.41 0.06 0.39 3.49
90 0.640 × 10⁻² 0.948 2.20 2.10 1.20 0.15 −0.06 −0.07 0.00 −0.64 0.07 0.04 3.34
90 0.888 × 10⁻² 0.871 2.31 2.02 1.30 0.91 −0.13 0.06 −0.01 0.23 0.06 0.42 3.49
90 0.109 × 10⁻¹ 0.758 2.02 1.65 1.22 0.17 −0.07 −0.08 0.00 −0.99 0.07 0.15 3.06
90 0.148 × 10⁻¹ 0.756 3.84 2.47 1.29 0.82 −0.13 0.06 −0.01 0.31 0.06 0.41 4.84
120 0.220 × 10⁻² 1.390 8.37 2.74 2.88 −0.04 −0.04 −0.10 −0.01 −1.22 0.09 −0.07 9.35
120 0.250 × 10⁻² 1.184 7.69 2.05 2.76 −0.06 −0.03 −0.08 −0.01 −0.50 0.06 −0.06 8.44
120 0.270 × 10⁻² 1.081 7.61 5.88 1.23 −0.08 −0.06 −0.15 −0.01 −0.12 0.07 −0.05 9.70
120 0.280 × 10⁻² 1.176 6.90 1.92 2.75 0.07 −0.04 −0.10 0.00 −0.21 0.03 −0.03 7.68
120 0.300 × 10⁻² 1.181 6.42 4.62 1.30 0.05 −0.06 −0.11 0.00 0.91 0.07 −0.25 8.07
120 0.320 × 10⁻² 1.118 6.47 1.83 2.77 0.05 −0.04 −0.08 −0.01 0.09 0.05 −0.06 7.27
120 0.340 × 10⁻² 1.134 4.87 3.53 1.23 −0.07 −0.06 −0.12 −0.01 0.39 0.07 −0.10 6.15
120 0.360 × 10⁻² 1.192 5.65 1.83 2.78 0.13 −0.06 −0.08 −0.01 0.20 0.07 −0.07 6.56
120 0.420 × 10⁻² 1.139 4.34 2.96 1.21 −0.13 −0.04 −0.09 0.00 0.04 0.07 −0.15 5.39
120 0.480 × 10⁻² 1.071 2.99 1.65 1.50 0.05 −0.05 −0.07 0.00 −0.19 0.07 −0.13 3.74
120 0.590 × 10⁻² 0.985 3.06 2.06 1.20 −0.14 −0.04 −0.08 0.00 −0.38 0.07 −0.14 3.90
120 0.800 × 10⁻² 0.869 2.66 1.90 1.21 −0.22 −0.03 −0.08 0.00 −0.76 0.07 −0.16 3.58
120 0.130 × 10⁻¹ 0.722 2.37 2.04 1.23 −0.06 −0.04 −0.08 0.00 −1.17 0.07 0.02 3.56
150 0.280 × 10⁻² 1.313 10.23 2.60 3.06 −0.05 −0.03 −0.11 −0.01 −1.86 0.08 −0.08 11.14
150 0.310 × 10⁻² 1.184 9.42 2.04 2.79 0.02 −0.04 −0.09 −0.01 −0.69 0.08 −0.07 10.06
150 0.350 × 10⁻² 1.335 7.52 2.29 2.75 0.04 −0.04 −0.09 0.00 −0.09 0.06 −0.04 8.33
150 0.390 × 10⁻² 1.257 6.92 1.79 2.76 0.03 −0.04 −0.08 −0.01 0.12 0.05 −0.05 7.66
150 0.450 × 10⁻² 1.050 6.83 1.79 2.76 0.07 −0.05 −0.09 −0.01 0.13 0.06 −0.06 7.58
150 0.600 × 10⁻² 1.025 3.61 1.41 2.77 0.05 −0.05 −0.08 0.00 0.26 0.06 −0.06 4.77
150 0.800 × 10⁻² 0.973 3.93 1.15 2.78 0.14 −0.06 −0.08 −0.01 0.28 0.07 −0.07 4.97
150 0.130 × 10⁻¹ 0.863 5.20 1.84 2.79 0.04 −0.05 −0.02 −0.01 0.28 −0.10 −0.08 6.19
150 0.200 × 10⁻¹ 0.794 6.97 2.81 2.86 0.12 −0.07 0.01 −0.01 0.28 −0.15 −0.13 8.05
200 0.370 × 10⁻² 1.318 12.81 2.59 3.15 −0.06 −0.04 −0.11 −0.01 −2.14 0.06 −0.08 13.62
200 0.410 × 10⁻² 1.311 11.44 2.11 2.85 0.08 −0.05 −0.11 −0.01 −0.86 0.05 −0.05 12.01
200 0.460 × 10⁻² 1.068 10.99 2.20 2.75 0.03 −0.03 −0.08 0.00 −0.08 0.03 −0.03 11.54
200 0.520 × 10⁻² 1.180 8.89 1.82 2.76 0.00 −0.04 −0.08 −0.01 0.24 0.06 −0.04 9.49
200 0.610 × 10⁻² 1.116 8.08 1.80 2.76 0.01 −0.04 −0.08 −0.01 0.21 0.05 −0.04 8.73
200 0.800 × 10⁻² 0.969 4.60 1.26 2.77 0.10 −0.05 −0.08 −0.01 0.24 0.05 −0.06 5.52
200 0.130 × 10⁻¹ 0.876 4.42 1.26 2.78 0.10 −0.05 −0.07 −0.01 0.28 0.08 −0.08 5.38
200 0.200 × 10⁻¹ 0.765 4.91 0.90 2.78 0.12 −0.05 −0.11 −0.01 0.28 −0.09 −0.03 5.72
200 0.320 × 10⁻¹ 0.619 5.46 0.98 2.77 −0.01 −0.04 −0.07 −0.01 0.27 −0.06 −0.04 6.21
200 0.500 × 10⁻¹ 0.507 6.34 1.17 2.78 0.07 −0.05 −0.06 −0.01 0.28 −0.11 −0.06 7.03
200 0.800 × 10⁻¹ 0.419 7.37 1.70 2.80 −0.09 −0.05 −0.07 −0.01 0.27 −0.09 −0.05 8.07
200 0.130 0.384 7.16 1.89 2.82 0.11 −0.07 −0.09 −0.01 0.28 −0.21 −0.07 7.94
123

580 Page 84 of 98 Eur. Phys. J. C (2015) 75:580
Table 12 continued
Q2
(GeV2)xBj σ+
r,NC δstat(%)
δuncor(%)
δcor(%)
δrel(%)
δγ p(%)
δhad(%)
δ1(%)
δ2(%)
δ3(%)
δ4(%)
δtot(%)
200 0.180 0.311 9.17 2.63 2.94 0.44 −0.05 0.04 0.00 0.29 −0.03 −0.13 10.00
200 0.400 0.198 10.78 3.72 3.24 0.81 −0.07 0.11 0.01 0.29 0.06 −0.20 11.89
250 0.460 × 10⁻² 0.875 19.23 2.51 3.41 −0.01 −0.04 −0.13 −0.01 −2.81 0.04 −0.09 19.89
250 0.520 × 10⁻² 1.098 13.92 2.15 2.97 0.04 −0.05 −0.11 −0.01 −1.19 0.05 −0.06 14.45
250 0.580 × 10⁻² 0.956 13.65 2.26 2.76 −0.03 −0.04 −0.07 −0.01 0.09 0.04 −0.04 14.11
250 0.660 × 10⁻² 0.954 11.44 1.84 2.76 0.02 −0.04 −0.08 −0.01 0.22 0.06 −0.04 11.91
250 0.760 × 10⁻² 1.025 9.60 1.81 2.76 0.04 −0.05 −0.08 −0.01 0.19 0.05 −0.05 10.15
250 0.100 × 10⁻¹ 0.960 5.09 1.24 2.77 0.04 −0.05 −0.07 −0.01 0.28 0.06 −0.05 5.94
250 0.130 × 10⁻¹ 0.854 5.09 1.07 2.77 −0.01 −0.04 −0.06 −0.01 0.28 0.07 −0.06 5.90
250 0.200 × 10⁻¹ 0.770 5.22 1.47 2.78 −0.01 −0.05 −0.05 −0.01 0.28 0.10 −0.08 6.10
250 0.320 × 10⁻¹ 0.630 5.65 1.36 2.79 0.17 −0.05 −0.13 −0.01 0.28 −0.08 −0.02 6.45
250 0.500 × 10⁻¹ 0.549 5.84 1.35 2.78 0.17 −0.05 −0.12 −0.01 0.28 −0.10 −0.02 6.62
250 0.800 × 10⁻¹ 0.465 6.39 1.25 2.79 0.03 −0.05 −0.13 −0.01 0.28 −0.15 −0.01 7.09
250 0.130 0.393 6.18 1.36 2.81 −0.01 −0.05 −0.14 −0.01 0.28 −0.18 0.00 6.93
250 0.180 0.365 6.77 2.50 2.86 0.46 −0.05 −0.04 0.00 0.29 −0.31 −0.05 7.79
250 0.400 0.167 9.74 4.15 3.40 1.35 −0.06 0.05 0.01 0.30 −0.11 −0.12 11.21
300 0.560 × 10⁻² 1.226 15.58 2.52 3.24 −0.08 −0.03 −0.10 −0.01 −2.01 0.07 −0.09 16.24
300 0.620 × 10⁻² 0.882 17.86 2.13 2.87 −0.02 −0.04 −0.10 −0.01 −1.13 0.09 −0.07 18.25
300 0.690 × 10⁻² 0.979 14.75 2.08 2.77 0.06 −0.04 −0.09 −0.01 0.28 0.06 −0.04 15.16
300 0.790 × 10⁻² 1.046 12.67 1.86 2.77 0.09 −0.05 −0.10 0.00 0.28 0.05 −0.03 13.10
300 0.910 × 10⁻² 0.868 11.94 1.84 2.76 0.03 −0.04 −0.07 −0.01 0.28 0.06 −0.05 12.40
300 0.121 × 10⁻¹ 0.912 5.97 1.25 2.76 0.01 −0.04 −0.06 −0.01 0.28 0.05 −0.05 6.71
300 0.200 × 10⁻¹ 0.667 6.31 1.01 2.78 0.07 −0.05 −0.06 −0.01 0.28 0.07 −0.07 6.97
300 0.320 × 10⁻¹ 0.625 6.55 0.97 2.77 0.08 −0.04 −0.11 −0.01 0.28 −0.07 −0.02 7.18
300 0.500 × 10⁻¹ 0.545 6.74 1.17 2.78 0.17 −0.05 −0.12 −0.01 0.28 −0.14 −0.02 7.40
300 0.800 × 10⁻¹ 0.487 7.19 1.26 2.79 0.15 −0.06 −0.13 −0.01 0.28 −0.15 −0.01 7.83
300 0.130 0.379 7.19 1.52 2.82 0.07 −0.06 −0.15 −0.01 0.28 −0.23 0.00 7.88
300 0.180 0.330 7.91 2.50 2.87 0.58 −0.07 −0.10 0.00 0.29 −0.26 −0.04 8.81
300 0.400 0.160 11.50 4.80 3.65 1.68 −0.06 0.08 0.01 0.31 −0.14 −0.14 13.10
400 0.740 × 10⁻² 0.827 22.66 2.56 3.33 −0.08 −0.04 −0.11 −0.01 −2.42 0.09 −0.10 23.17
400 0.830 × 10⁻² 0.602 22.83 2.26 2.79 −0.06 −0.03 −0.08 −0.01 −0.49 0.04 −0.05 23.11
400 0.930 × 10⁻² 1.026 15.89 1.95 2.76 −0.02 −0.04 −0.09 0.00 0.15 0.03 −0.02 16.24
400 0.105 × 10⁻¹ 0.887 15.40 1.91 2.76 −0.01 −0.04 −0.07 −0.01 0.28 0.06 −0.04 15.76
400 0.121 × 10⁻¹ 1.013 12.81 1.85 2.76 0.06 −0.04 −0.09 −0.01 0.28 0.02 −0.03 13.24
400 0.161 × 10⁻¹ 0.884 6.97 1.22 2.77 0.04 −0.05 −0.07 −0.01 0.28 0.06 −0.05 7.60
400 0.320 × 10⁻¹ 0.650 7.15 1.15 2.78 0.04 −0.05 −0.05 −0.01 0.28 0.09 −0.08 7.76
400 0.500 × 10⁻¹ 0.519 7.83 1.07 2.79 0.19 −0.05 −0.13 −0.01 0.28 −0.11 −0.01 8.39
400 0.800 × 10⁻¹ 0.453 8.42 1.10 2.79 0.18 −0.06 −0.13 −0.01 0.28 −0.18 −0.01 8.95
400 0.130 0.380 8.17 1.26 2.80 0.00 −0.05 −0.15 −0.01 0.28 −0.11 0.00 8.73
400 0.180 0.353 8.44 1.98 2.82 0.40 −0.05 −0.08 0.00 0.29 −0.34 −0.03 9.14
400 0.400 0.163 12.84 4.55 3.65 1.70 −0.06 0.09 0.01 0.31 −0.29 −0.13 14.21
500 0.930 × 10⁻² 0.744 27.27 2.71 3.25 −0.10 −0.03 −0.11 −0.01 −2.16 0.07 −0.07 27.68
500 0.104 × 10⁻¹ 0.739 22.59 2.27 2.76 −0.02 −0.04 −0.08 −0.01 0.20 0.08 −0.04 22.87
500 0.116 × 10⁻¹ 1.188 16.00 1.95 2.76 −0.01 −0.04 −0.08 −0.01 0.28 0.05 −0.03 16.36
500 0.131 × 10⁻¹ 0.862 17.53 1.94 2.76 0.00 −0.04 −0.08 −0.01 0.13 0.05 −0.04 17.86
123

Eur. Phys. J. C (2015) 75:580 Page 85 of 98 580
Table 12 continued
Q2
(GeV2)xBj σ+
r,NC δstat(%)
δuncor(%)
δcor(%)
δrel(%)
δγ p(%)
δhad(%)
δ1(%)
δ2(%)
δ3(%)
δ4(%)
δtot(%)
500 0.152 × 10⁻¹ 1.047 14.03 1.88 2.76 −0.05 −0.03 −0.06 −0.01 0.27 0.06 −0.05 14.43
500 0.201 × 10⁻¹ 0.738 8.97 1.28 2.76 −0.02 −0.04 −0.06 −0.01 0.28 0.05 −0.05 9.48
500 0.320 × 10⁻¹ 0.691 8.29 1.09 2.77 −0.04 −0.04 −0.05 −0.01 0.28 0.08 −0.06 8.81
500 0.500 × 10⁻¹ 0.567 8.78 0.98 2.77 −0.04 −0.04 −0.11 −0.01 0.28 0.01 −0.01 9.27
500 0.800 × 10⁻¹ 0.454 9.61 1.05 2.77 0.03 −0.04 −0.10 −0.01 0.28 −0.14 0.00 10.06
500 0.130 0.387 11.29 1.30 2.79 0.02 −0.04 −0.14 −0.01 0.28 0.00 0.00 11.70
500 0.180 0.351 11.27 1.46 2.81 0.07 −0.05 −0.14 −0.01 0.28 −0.29 0.01 11.71
500 0.250 0.237 13.29 2.04 2.82 0.31 −0.04 −0.05 0.00 0.28 −0.32 −0.03 13.75
500 0.400 0.182 15.67 4.22 3.33 1.26 −0.04 0.06 0.01 0.30 −0.52 −0.08 16.62
500 0.650 0.023 27.31 5.50 4.11 2.21 −0.04 0.15 0.02 0.31 −0.10 −0.16 28.25
650 0.121 × 10⁻¹ 0.501 38.13 2.96 2.82 −0.11 −0.02 −0.09 −0.01 −0.92 0.02 −0.03 38.36
650 0.135 × 10⁻¹ 0.705 28.06 2.22 2.77 −0.09 −0.03 −0.07 −0.01 −0.01 0.09 −0.04 28.29
650 0.151 × 10⁻¹ 0.688 24.91 2.08 2.77 −0.02 −0.03 −0.08 −0.01 0.04 0.03 −0.03 25.15
650 0.171 × 10⁻¹ 0.701 21.18 2.04 2.76 −0.01 −0.04 −0.07 −0.01 0.28 0.07 −0.04 21.46
650 0.197 × 10⁻¹ 0.484 22.49 1.98 2.76 −0.04 −0.04 −0.06 −0.01 0.27 0.06 −0.05 22.75
650 0.261 × 10⁻¹ 0.640 10.68 1.31 2.76 0.03 −0.04 −0.07 −0.01 0.28 0.04 −0.05 11.11
650 0.500 × 10⁻¹ 0.469 11.58 1.27 2.78 0.00 −0.04 −0.05 −0.01 0.28 0.09 −0.07 11.98
650 0.800 × 10⁻¹ 0.461 11.19 1.08 2.78 0.13 −0.05 −0.12 −0.01 0.28 −0.15 −0.01 11.58
650 0.130 0.404 13.15 1.40 2.79 0.12 −0.05 −0.14 −0.01 0.28 −0.05 0.00 13.51
650 0.180 0.332 13.80 1.43 2.79 −0.10 −0.04 −0.12 −0.01 0.27 −0.17 0.01 14.16
650 0.250 0.248 15.04 2.03 2.81 0.35 −0.05 −0.11 0.00 0.28 −0.31 −0.01 15.44
650 0.400 0.169 18.17 4.47 3.33 1.42 −0.07 0.01 0.01 0.30 −0.74 −0.07 19.07
650 0.650 0.025 31.51 6.03 4.15 2.25 −0.05 0.17 0.02 0.31 −0.18 −0.17 32.43
800 0.149 × 10⁻¹ 0.672 31.65 3.07 2.76 −0.16 −0.03 −0.06 −0.01 0.14 0.10 −0.04 31.91
800 0.166 × 10⁻¹ 0.493 38.09 2.69 2.77 0.09 −0.04 −0.12 −0.01 0.28 0.03 −0.01 38.28
800 0.185 × 10⁻¹ 0.683 26.86 2.22 2.76 −0.04 −0.04 −0.07 −0.01 0.28 0.03 −0.04 27.09
800 0.210 × 10⁻¹ 0.666 24.26 2.06 2.77 0.07 −0.05 −0.09 −0.01 0.28 0.07 −0.04 24.51
800 0.242 × 10⁻¹ 0.651 21.70 1.94 2.77 0.12 −0.05 −0.09 −0.01 0.28 0.02 −0.04 21.96
800 0.322 × 10⁻¹ 0.496 13.46 1.39 2.76 −0.07 −0.03 −0.06 −0.01 0.27 0.04 −0.04 13.81
800 0.500 × 10⁻¹ 0.585 11.87 1.22 2.77 0.03 −0.05 −0.06 −0.01 0.28 0.08 −0.06 12.26
800 0.800 × 10⁻¹ 0.562 11.86 1.08 2.78 0.13 −0.04 −0.12 −0.01 0.28 0.08 −0.01 12.23
800 0.130 0.297 18.11 1.34 2.77 −0.01 −0.03 −0.09 −0.01 0.28 −0.20 0.00 18.37
800 0.180 0.267 18.44 1.55 2.80 0.12 −0.05 −0.15 −0.01 0.28 −0.10 0.00 18.72
800 0.250 0.187 20.10 1.92 2.81 0.34 −0.05 −0.11 −0.01 0.28 −0.29 −0.01 20.39
800 0.400 0.172 20.66 3.77 3.09 0.87 −0.04 0.02 0.00 0.29 −0.38 −0.05 21.25
800 0.650 0.024 38.28 6.65 4.28 2.44 −0.02 0.22 0.02 0.31 −0.62 −0.14 39.17
123

580 Page 86 of 98 Eur. Phys. J. C (2015) 75:580
Table 13 HERA combined reduced cross sections σ+r,NC for NC e+ p scattering at
√s = 225 GeV. The uncertainties are quoted in percent relative
to σ+r,NC. Other details as for Table 10
Q2
(GeV2)xBj σ+
r,NC δstat(%)
δuncor(%)
δcor(%)
δrel(%)
δγ p(%)
δhad(%)
δ1(%)
δ2(%)
δ3(%)
δ4(%)
δtot(%)
1.5 0.348 × 10⁻⁴ 0.542 7.92 4.96 3.65 1.81 −0.24 −0.58 −0.07 −8.62 0.06 0.58 13.38
2 0.464 × 10⁻⁴ 0.733 4.48 4.31 2.83 1.48 −0.26 −0.66 −0.09 −6.25 0.07 0.58 9.42
2 0.526 × 10⁻⁴ 0.737 4.53 3.93 1.90 1.32 −0.25 −0.40 −0.08 −2.96 0.07 0.57 7.11
2.5 0.580 × 10⁻⁴ 0.815 4.08 4.15 2.93 2.07 −0.33 −0.82 −0.10 −7.28 0.07 0.69 10.05
2.5 0.658 × 10⁻⁴ 0.780 2.62 3.03 1.54 1.27 −0.20 −0.57 −0.05 −2.19 0.06 0.47 5.04
2.5 0.759 × 10⁻⁴ 0.725 4.28 3.45 1.84 0.89 −0.21 −0.28 −0.07 −1.48 0.07 0.51 6.08
3.5 0.812 × 10⁻⁴ 0.819 4.14 4.05 2.65 1.70 −0.23 −0.47 −0.05 −5.90 0.06 0.54 8.87
3.5 0.921 × 10⁻⁴ 0.838 2.19 2.86 1.69 1.53 −0.25 −0.38 −0.06 −2.47 0.07 0.56 4.98
3.5 0.106 × 10⁻³ 0.875 2.01 2.47 1.69 1.24 −0.24 −0.41 −0.07 −1.58 0.07 0.55 4.19
3.5 0.141 × 10⁻³ 0.810 2.53 2.45 2.27 0.62 −0.22 −0.27 −0.07 −0.38 0.07 0.52 4.30
5 0.116 × 10⁻³ 0.980 4.10 4.01 2.85 2.15 −0.30 −0.57 −0.08 −6.92 0.07 0.67 9.71
5 0.132 × 10⁻³ 0.940 2.05 2.80 1.53 1.41 −0.22 −0.44 −0.05 −1.98 0.06 0.50 4.56
5 0.143 × 10⁻³ 1.048 10.24 9.23 1.66 1.38 −0.22 −0.18 −0.05 0.98 0.05 0.55 14.01
5 0.152 × 10⁻³ 0.984 1.65 2.20 1.41 0.98 −0.19 −0.30 −0.05 −0.78 0.07 0.46 3.39
5 0.201 × 10⁻³ 0.920 1.16 1.87 1.58 0.63 −0.16 −0.22 −0.04 0.05 0.06 0.42 2.83
6.5 0.151 × 10⁻³ 1.070 4.19 4.02 2.88 1.87 −0.23 −0.52 −0.06 −6.52 0.06 0.56 9.42
6.5 0.171 × 10⁻³ 1.012 1.96 2.54 1.46 1.98 −0.23 −0.49 −0.05 −1.43 0.06 0.56 4.36
6.5 0.183 × 10⁻³ 1.043 6.82 7.36 2.23 2.44 −0.29 −0.34 −0.09 −0.63 0.08 1.26 10.67
6.5 0.197 × 10⁻³ 1.026 1.57 2.19 1.30 1.06 −0.17 −0.28 −0.03 −0.45 0.06 0.43 3.25
6.5 0.228 × 10⁻³ 1.067 6.81 7.39 1.62 1.03 −0.18 −0.15 −0.04 −0.33 0.07 0.62 10.26
6.5 0.262 × 10⁻³ 1.009 0.91 1.76 1.35 0.91 −0.17 −0.22 −0.03 −0.15 0.06 0.44 2.62
6.5 0.330 × 10⁻³ 0.990 9.32 6.57 1.50 0.80 −0.12 −0.03 −0.01 0.04 0.06 0.23 11.53
6.5 0.414 × 10⁻³ 0.969 1.14 1.85 1.44 0.74 −0.15 0.06 −0.03 0.13 0.07 0.44 2.75
8.5 0.197 × 10⁻³ 1.011 4.58 4.01 3.30 2.08 −0.27 −0.49 −0.07 −7.94 0.06 0.63 10.77
8.5 0.224 × 10⁻³ 1.064 1.92 2.40 1.47 2.14 −0.22 −0.26 −0.05 −0.96 0.06 0.64 4.20
8.5 0.240 × 10⁻³ 1.195 3.52 3.88 1.65 2.39 −0.28 −0.25 −0.07 0.47 0.05 0.91 6.09
8.5 0.258 × 10⁻³ 1.119 1.58 1.90 1.42 1.54 −0.21 −0.23 −0.04 −0.55 0.05 0.56 3.35
8.5 0.299 × 10⁻³ 1.188 4.20 3.72 1.39 1.10 −0.18 −0.08 −0.03 0.55 0.05 0.53 5.94
8.5 0.342 × 10⁻³ 1.057 0.88 1.70 1.33 0.97 −0.17 −0.20 −0.04 −0.20 0.06 0.44 2.59
8.5 0.433 × 10⁻³ 1.151 4.88 5.71 1.51 0.90 −0.14 −0.06 −0.02 0.10 0.06 0.42 7.73
8.5 0.541 × 10⁻³ 1.020 0.92 1.73 1.27 0.73 −0.12 0.03 −0.01 0.40 0.06 0.37 2.51
8.5 0.838 × 10⁻³ 0.943 1.01 1.76 1.31 0.85 −0.14 0.05 −0.02 0.12 0.06 0.43 2.61
8.5 0.140 × 10⁻² 0.864 1.20 1.83 1.47 0.75 −0.15 0.06 −0.03 −0.01 0.07 0.45 2.78
12 0.278 × 10⁻³ 1.162 3.84 3.98 2.47 1.55 −0.22 −0.42 −0.06 −5.29 0.06 0.54 8.22
12 0.316 × 10⁻³ 1.178 1.80 2.20 1.48 1.88 −0.23 −0.39 −0.06 −1.04 0.07 0.66 3.94
12 0.343 × 10⁻³ 1.166 2.70 3.32 1.54 1.94 −0.26 −0.23 −0.05 0.59 0.05 0.75 5.05
12 0.364 × 10⁻³ 1.127 1.52 1.86 1.30 1.41 −0.18 −0.23 −0.03 −0.04 0.05 0.52 3.14
12 0.423 × 10⁻³ 1.235 2.44 2.23 1.36 1.56 −0.19 −0.10 −0.02 0.85 0.06 0.66 4.05
12 0.483 × 10⁻³ 1.120 0.95 1.52 1.29 1.10 −0.15 −0.15 −0.02 0.14 0.05 0.45 2.52
12 0.592 × 10⁻³ 1.142 3.46 2.55 1.35 1.16 −0.16 −0.04 −0.01 0.16 0.06 0.55 4.69
12 0.764 × 10⁻³ 1.033 0.92 1.61 1.28 0.95 −0.14 0.04 −0.01 0.14 0.07 0.44 2.50
12 0.118 × 10⁻² 0.979 0.93 1.69 1.30 0.83 −0.14 0.05 −0.02 0.13 0.06 0.42 2.51
12 0.197 × 10⁻² 0.880 1.04 1.71 1.39 1.04 −0.16 0.06 −0.03 −0.27 0.06 0.48 2.72
15 0.348 × 10⁻³ 1.243 3.86 4.06 2.02 1.26 −0.18 −0.36 −0.03 −3.58 0.06 0.47 7.09
123

Eur. Phys. J. C (2015) 75:580 Page 87 of 98 580
Table 13 continued
Q2
(GeV2)xBj σ+
r,NC δstat(%)
δuncor(%)
δcor(%)
δrel(%)
δγ p(%)
δhad(%)
δ1(%)
δ2(%)
δ3(%)
δ4(%)
δtot(%)
15 0.394 × 10⁻³ 1.138 1.83 2.09 1.38 1.32 −0.19 −0.35 −0.05 −0.61 0.05 0.47 3.48
15 0.422 × 10⁻³ 1.191 2.51 2.30 1.43 1.41 −0.21 −0.19 −0.04 0.40 0.06 0.61 4.03
15 0.455 × 10⁻³ 1.174 1.54 1.62 1.32 1.37 −0.20 −0.23 −0.03 −0.23 0.06 0.52 3.01
15 0.529 × 10⁻³ 1.254 1.89 1.35 1.32 1.32 −0.18 −0.10 −0.02 0.64 0.06 0.59 3.11
15 0.604 × 10⁻³ 1.170 1.03 1.18 1.28 1.15 −0.17 −0.17 −0.03 0.14 0.06 0.51 2.40
15 0.763 × 10⁻³ 1.168 2.14 1.52 1.33 1.29 −0.17 −0.06 −0.02 0.45 0.05 0.62 3.31
15 0.955 × 10⁻³ 1.083 0.97 1.38 1.26 1.08 −0.14 0.02 −0.01 0.30 0.06 0.46 2.44
15 0.148 × 10⁻² 0.943 0.97 1.52 1.28 0.99 −0.14 0.04 −0.01 0.12 0.06 0.45 2.48
20 0.464 × 10⁻³ 1.030 5.27 4.21 2.03 1.64 −0.24 −0.62 −0.06 −4.18 0.06 0.54 8.39
20 0.526 × 10⁻³ 1.214 2.26 2.87 1.39 1.01 −0.18 −0.36 −0.05 −1.10 0.06 0.44 4.22
20 0.607 × 10⁻³ 1.180 1.97 2.39 1.31 0.77 −0.13 −0.31 −0.03 −0.17 0.06 0.36 3.49
20 0.805 × 10⁻³ 1.171 1.06 1.85 1.35 1.08 −0.17 −0.13 −0.03 −0.13 0.05 0.44 2.79
20 0.127 × 10⁻² 1.089 1.00 1.84 1.30 0.93 −0.13 0.06 −0.02 0.27 0.06 0.40 2.68
20 0.197 × 10⁻² 0.986 1.02 1.85 1.28 0.84 −0.12 0.05 −0.01 0.38 0.06 0.39 2.67
20 0.329 × 10⁻² 0.877 1.14 1.87 1.34 1.03 −0.14 0.06 −0.01 0.15 0.06 0.43 2.81
25 0.616 × 10⁻³ 1.211 2.42 2.94 1.41 1.00 −0.14 −0.46 −0.02 −0.69 0.05 0.37 4.28
25 0.657 × 10⁻³ 1.210 2.81 2.80 1.61 1.03 −0.19 −0.27 −0.06 −0.42 0.07 0.48 4.47
25 0.700 × 10⁻³ 1.251 2.42 2.14 1.34 0.96 −0.18 −0.17 −0.04 0.35 0.06 0.35 3.67
25 0.759 × 10⁻³ 1.223 1.50 1.44 1.26 0.83 −0.14 −0.19 −0.02 0.33 0.06 0.39 2.63
25 0.880 × 10⁻³ 1.237 1.68 1.52 1.27 1.00 −0.15 −0.09 −0.02 0.48 0.06 0.44 2.87
25 0.101 × 10⁻² 1.188 1.00 1.09 1.26 1.04 −0.16 −0.14 −0.02 0.20 0.06 0.47 2.27
25 0.127 × 10⁻² 1.146 1.52 1.02 1.30 1.13 −0.16 −0.06 −0.01 0.48 0.06 0.53 2.61
25 0.159 × 10⁻² 1.078 0.97 1.04 1.26 1.06 −0.14 0.00 −0.02 0.18 0.06 0.50 2.25
25 0.247 × 10⁻² 0.989 0.94 1.24 1.28 1.08 −0.14 0.01 −0.01 0.16 0.06 0.50 2.35
25 0.411 × 10⁻² 0.852 1.03 1.28 1.29 1.07 −0.14 0.01 −0.01 −0.28 0.06 0.55 2.43
35 0.812 × 10⁻³ 1.336 4.48 3.79 2.90 0.52 −0.10 −0.04 −0.01 −2.01 0.28 0.25 6.88
35 0.921 × 10⁻³ 1.210 2.44 2.07 1.41 0.98 −0.18 −0.41 −0.06 −0.92 0.07 0.38 3.79
35 0.100 × 10⁻² 1.363 2.63 1.87 1.27 0.41 −0.12 −0.14 −0.03 0.16 0.07 0.21 3.51
35 0.106 × 10⁻² 1.237 1.70 1.46 1.24 0.83 −0.15 −0.17 −0.02 −0.09 0.06 0.32 2.73
35 0.123 × 10⁻² 1.222 1.93 1.40 1.23 0.65 −0.12 −0.08 −0.02 0.24 0.06 0.27 2.79
35 0.141 × 10⁻² 1.219 1.06 1.05 1.23 0.88 −0.14 −0.15 −0.02 0.23 0.06 0.36 2.18
35 0.180 × 10⁻² 1.143 1.53 1.18 1.25 0.85 −0.14 −0.06 −0.01 0.35 0.06 0.39 2.51
35 0.223 × 10⁻² 1.066 0.99 0.83 1.24 0.84 −0.12 −0.02 0.00 0.38 0.07 0.41 2.06
35 0.310 × 10⁻² 0.984 1.27 1.59 1.28 0.97 −0.14 −0.04 −0.01 −0.17 0.06 0.50 2.65
35 0.345 × 10⁻² 0.977 1.27 1.91 1.36 0.69 −0.08 0.04 0.01 0.77 0.06 0.32 2.88
35 0.575 × 10⁻² 0.833 0.94 1.19 1.31 1.07 −0.15 0.00 −0.02 −0.46 0.06 0.55 2.39
45 0.104 × 10⁻² 1.169 4.71 3.41 2.64 0.60 −0.11 −0.03 −0.01 −1.65 0.19 0.26 6.63
45 0.118 × 10⁻² 1.205 2.98 2.17 1.37 0.43 −0.11 −0.11 −0.02 −0.37 0.07 0.16 3.98
45 0.127 × 10⁻² 1.281 3.08 2.27 1.30 0.08 −0.09 −0.15 −0.02 −0.09 0.07 −0.03 4.05
45 0.137 × 10⁻² 1.243 2.09 1.47 1.21 0.37 −0.10 −0.16 −0.02 0.20 0.06 0.16 2.87
45 0.159 × 10⁻² 1.257 2.12 1.34 1.22 0.32 −0.10 −0.09 −0.02 0.29 0.07 0.14 2.83
45 0.181 × 10⁻² 1.158 1.17 1.14 1.21 0.67 −0.13 −0.12 −0.02 0.08 0.07 0.29 2.17
45 0.229 × 10⁻² 1.094 1.69 1.00 1.21 0.56 −0.11 −0.05 −0.01 0.22 0.06 0.23 2.40
45 0.286 × 10⁻² 1.085 1.01 0.89 1.21 0.66 −0.11 −0.01 −0.01 0.30 0.06 0.31 1.98
45 0.444 × 10⁻² 0.929 0.92 1.23 1.22 0.77 −0.12 0.00 −0.01 0.05 0.06 0.38 2.15
123

580 Page 88 of 98 Eur. Phys. J. C (2015) 75:580
Table 13 continued
Q2
(GeV2)xBj σ+
r,NC δstat(%)
δuncor(%)
δcor(%)
δrel(%)
δγ p(%)
δhad(%)
δ1(%)
δ2(%)
δ3(%)
δ4(%)
δtot(%)
45 0.740 × 10⁻² 0.802 0.92 1.07 1.26 0.86 −0.14 −0.01 −0.02 −0.57 0.07 0.49 2.21
60 0.139 × 10⁻² 1.185 4.98 3.05 2.26 0.55 −0.11 −0.03 −0.01 −1.14 0.14 0.27 6.39
60 0.158 × 10⁻² 1.142 2.97 1.78 1.47 0.53 −0.11 −0.08 −0.02 −0.44 0.10 0.13 3.83
60 0.171 × 10⁻² 1.255 3.64 2.63 1.28 0.14 −0.10 −0.14 −0.02 0.19 0.06 −0.07 4.68
60 0.182 × 10⁻² 1.190 3.42 3.10 1.26 0.02 −0.09 −0.13 −0.02 0.02 0.07 −0.10 4.79
60 0.211 × 10⁻² 1.209 2.57 1.64 1.20 0.12 −0.07 −0.07 −0.01 0.22 0.07 −0.05 3.29
60 0.242 × 10⁻² 1.184 1.38 1.28 1.21 0.57 −0.13 −0.16 −0.03 0.01 0.06 0.23 2.33
60 0.305 × 10⁻² 1.097 1.98 1.28 1.20 0.29 −0.08 −0.05 −0.01 0.21 0.06 0.07 2.68
60 0.382 × 10⁻² 1.021 1.16 1.00 1.20 0.48 −0.09 −0.01 0.00 0.35 0.07 0.22 2.04
60 0.592 × 10⁻² 0.894 1.05 1.23 1.20 0.53 −0.09 −0.01 0.00 0.17 0.06 0.27 2.11
60 0.986 × 10⁻² 0.758 1.04 1.02 1.23 0.61 −0.11 −0.01 −0.01 −0.68 0.07 0.37 2.15
90 0.209 × 10⁻² 1.262 5.29 2.88 2.09 0.58 −0.11 −0.02 −0.01 −1.01 0.16 0.27 6.49
90 0.237 × 10⁻² 1.206 3.13 1.75 1.41 0.48 −0.11 −0.06 −0.02 −0.08 0.10 0.17 3.89
90 0.250 × 10⁻² 1.078 4.52 3.22 1.28 0.09 −0.08 −0.10 −0.01 0.58 0.06 −0.16 5.73
90 0.273 × 10⁻² 1.149 2.72 1.53 1.28 0.43 −0.10 −0.03 −0.01 0.38 0.09 0.07 3.42
90 0.317 × 10⁻² 1.094 3.02 2.07 1.22 0.02 −0.06 −0.05 0.00 0.26 0.06 −0.17 3.87
90 0.362 × 10⁻² 1.106 2.10 1.26 1.19 0.30 −0.08 −0.12 −0.01 0.01 0.07 0.05 2.74
90 0.460 × 10⁻² 1.021 2.31 1.26 1.20 0.08 −0.06 −0.05 0.00 −0.04 0.07 −0.07 2.90
90 0.573 × 10⁻² 0.957 1.37 1.05 1.18 0.34 −0.08 −0.02 0.00 0.17 0.07 0.15 2.13
90 0.800 × 10⁻² 0.906 1.64 1.48 1.19 0.21 −0.07 −0.05 0.00 −0.41 0.07 0.07 2.56
90 0.888 × 10⁻² 0.836 1.71 2.03 1.29 0.87 −0.13 0.06 −0.01 0.27 0.06 0.41 3.12
90 0.136 × 10⁻¹ 0.712 1.51 1.26 1.22 0.23 −0.08 −0.05 −0.01 −0.89 0.07 0.18 2.50
90 0.148 × 10⁻¹ 0.717 1.90 2.10 1.29 0.88 −0.13 0.06 −0.01 0.30 0.06 0.41 3.28
120 0.280 × 10⁻² 1.246 6.08 2.66 2.01 0.59 −0.11 −0.02 −0.01 −1.08 0.12 0.27 7.05
120 0.320 × 10⁻² 1.054 4.29 1.94 1.44 0.47 −0.10 −0.03 −0.01 0.08 0.11 0.20 4.95
120 0.340 × 10⁻² 1.185 5.29 3.23 1.26 0.01 −0.08 −0.11 −0.02 0.40 0.07 −0.06 6.34
120 0.360 × 10⁻² 1.096 3.22 1.82 1.27 0.41 −0.09 −0.02 −0.01 0.36 0.10 0.15 3.96
120 0.420 × 10⁻² 1.044 3.68 1.84 1.22 −0.06 −0.06 −0.06 −0.01 0.27 0.07 −0.15 4.30
120 0.480 × 10⁻² 1.029 2.67 1.80 1.47 0.72 −0.12 0.01 −0.01 0.70 0.12 0.28 3.69
120 0.500 × 10⁻² 1.098 3.11 1.67 1.21 −0.02 −0.05 −0.05 0.00 0.19 0.07 −0.12 3.74
120 0.590 × 10⁻² 0.993 2.70 1.47 1.20 −0.04 −0.05 −0.05 0.00 −0.13 0.07 −0.13 3.31
120 0.760 × 10⁻² 0.894 2.33 1.15 1.20 −0.05 −0.04 −0.04 0.00 −0.30 0.07 −0.17 2.89
120 0.110 × 10⁻¹ 0.818 1.97 1.44 1.21 −0.13 −0.04 −0.04 0.00 −0.66 0.07 −0.17 2.81
120 0.180 × 10⁻¹ 0.671 1.76 1.54 1.23 0.00 −0.06 −0.05 −0.01 −1.12 0.07 0.06 2.87
150 0.350 × 10⁻² 1.227 7.11 2.64 2.19 0.52 −0.11 −0.02 −0.01 −1.38 0.14 0.27 8.04
150 0.390 × 10⁻² 1.017 5.78 1.88 1.51 0.62 −0.11 0.00 −0.01 0.11 0.12 0.29 6.30
150 0.450 × 10⁻² 1.001 4.99 2.00 1.42 0.62 −0.10 0.01 −0.01 0.62 0.11 0.30 5.64
150 0.600 × 10⁻² 1.048 2.57 1.77 1.45 0.67 −0.11 0.01 −0.01 0.73 0.10 0.29 3.59
150 0.800 × 10⁻² 0.964 2.58 1.36 1.50 0.76 −0.12 0.01 −0.01 0.77 0.12 0.28 3.47
150 0.130 × 10⁻¹ 0.823 3.33 1.48 1.49 0.70 −0.12 0.03 −0.01 0.78 0.14 0.26 4.09
150 0.200 × 10⁻¹ 0.690 4.51 2.16 1.61 0.82 −0.13 0.07 −0.01 0.79 −0.19 0.24 5.38
200 0.460 × 10⁻² 1.117 9.08 2.52 2.37 0.61 −0.11 −0.03 −0.01 −1.58 0.10 0.26 9.87
200 0.520 × 10⁻² 1.011 7.74 1.92 1.68 0.63 −0.11 −0.02 −0.01 −0.28 0.09 0.31 8.19
200 0.610 × 10⁻² 0.989 6.49 2.03 1.43 0.66 −0.11 0.00 −0.01 0.67 0.12 0.30 7.02
200 0.800 × 10⁻² 0.947 3.40 1.73 1.44 0.68 −0.11 0.01 −0.01 0.73 0.10 0.29 4.21
123

Eur. Phys. J. C (2015) 75:580 Page 89 of 98 580
Table 13 continued
Q2
(GeV2)xBj σ+
r,NC δstat(%)
δuncor(%)
δcor(%)
δrel(%)
δγ p(%)
δhad(%)
δ1(%)
δ2(%)
δ3(%)
δ4(%)
δtot(%)
200 0.130 × 10⁻¹ 0.831 3.13 1.05 1.48 0.72 −0.12 0.02 −0.01 0.78 0.11 0.28 3.78
200 0.200 × 10⁻¹ 0.638 3.52 1.76 1.50 0.67 −0.12 0.04 −0.01 0.78 0.16 0.26 4.35
200 0.320 × 10⁻¹ 0.523 4.04 0.85 1.44 0.68 −0.11 0.01 −0.01 0.79 −0.01 0.31 4.50
200 0.500 × 10⁻¹ 0.523 4.13 1.23 1.42 0.55 −0.11 0.04 −0.01 0.78 −0.05 0.29 4.65
200 0.800 × 10⁻¹ 0.452 4.76 1.34 1.50 0.71 −0.12 0.02 −0.01 0.78 −0.09 0.28 5.28
200 0.130 0.352 5.13 1.89 1.54 0.63 −0.12 0.01 −0.01 0.77 −0.01 0.27 5.77
200 0.180 0.319 5.82 2.28 1.65 0.91 −0.13 0.11 0.00 0.79 −0.10 0.23 6.59
200 0.400 0.178 7.99 4.50 2.84 1.82 −0.12 0.26 0.01 0.84 0.12 0.15 9.81
250 0.580 × 10⁻² 1.050 10.44 2.45 2.42 0.50 −0.10 −0.02 −0.02 −1.69 0.08 0.27 11.13
250 0.660 × 10⁻² 1.029 8.85 1.93 1.78 0.58 −0.11 −0.01 −0.01 −0.52 0.13 0.27 9.27
250 0.760 × 10⁻² 0.938 7.74 2.03 1.42 0.59 −0.10 0.01 −0.01 0.65 0.10 0.30 8.18
250 0.100 × 10⁻¹ 0.874 3.95 1.73 1.43 0.65 −0.11 0.01 −0.01 0.74 0.10 0.29 4.67
250 0.130 × 10⁻¹ 0.818 3.72 1.29 1.43 0.64 −0.11 0.02 −0.01 0.76 0.11 0.29 4.32
250 0.200 × 10⁻¹ 0.670 3.84 1.04 1.47 0.70 −0.12 0.02 −0.01 0.78 0.12 0.28 4.38
250 0.320 × 10⁻¹ 0.579 4.07 1.30 1.48 0.76 −0.12 −0.04 −0.01 0.79 0.06 0.32 4.67
250 0.500 × 10⁻¹ 0.499 4.15 1.26 1.47 0.72 −0.12 −0.03 −0.01 0.79 0.01 0.33 4.72
250 0.800 × 10⁻¹ 0.441 4.41 1.33 1.48 0.75 −0.12 −0.03 −0.01 0.79 −0.14 0.33 4.97
250 0.130 0.371 4.40 1.39 1.49 0.62 −0.11 −0.04 −0.01 0.78 −0.12 0.34 4.97
250 0.180 0.361 4.47 2.06 1.53 0.93 −0.12 0.01 −0.01 0.80 −0.20 0.32 5.31
250 0.400 0.180 6.37 4.91 2.95 2.18 −0.12 0.23 0.01 0.85 −0.07 0.22 8.88
300 0.690 × 10⁻² 0.872 13.29 2.39 2.69 0.48 −0.10 −0.02 −0.01 −2.12 0.08 0.26 13.94
300 0.790 × 10⁻² 0.823 10.93 1.96 1.65 0.53 −0.10 0.01 −0.01 −0.32 0.11 0.29 11.24
300 0.910 × 10⁻² 0.835 9.58 1.89 1.42 0.65 −0.11 0.00 −0.01 0.67 0.09 0.31 9.92
300 0.121 × 10⁻¹ 0.895 4.50 1.73 1.41 0.60 −0.10 0.02 −0.01 0.76 0.10 0.30 5.12
300 0.200 × 10⁻¹ 0.719 4.23 1.04 1.44 0.63 −0.11 0.03 −0.01 0.78 0.12 0.28 4.71
300 0.320 × 10⁻¹ 0.620 4.53 0.94 1.42 0.62 −0.10 −0.02 −0.01 0.79 0.10 0.33 4.96
300 0.500 × 10⁻¹ 0.519 4.74 1.08 1.46 0.72 −0.11 −0.03 −0.01 0.79 0.05 0.33 5.20
300 0.800 × 10⁻¹ 0.458 4.93 1.38 1.50 0.81 −0.12 −0.03 −0.01 0.79 −0.13 0.33 5.47
300 0.130 0.367 5.09 1.54 1.54 0.74 −0.13 −0.06 −0.01 0.79 −0.11 0.34 5.65
300 0.180 0.335 5.22 2.22 1.57 0.97 −0.13 −0.02 −0.01 0.80 −0.28 0.32 6.04
300 0.400 0.168 7.39 5.16 2.96 2.37 −0.14 0.16 0.01 0.86 −0.11 0.23 9.82
400 0.930 × 10⁻² 1.026 13.30 2.43 2.68 0.56 −0.11 −0.02 −0.01 −1.99 0.06 0.25 13.94
400 0.105 × 10⁻¹ 1.071 10.14 2.19 1.49 0.61 −0.10 −0.01 −0.01 0.18 0.11 0.31 10.51
400 0.121 × 10⁻¹ 0.918 9.82 1.88 1.40 0.55 −0.10 0.02 −0.01 0.69 0.10 0.31 10.14
400 0.161 × 10⁻¹ 0.806 5.45 1.72 1.42 0.64 −0.11 0.01 −0.01 0.79 0.09 0.30 5.98
400 0.320 × 10⁻¹ 0.621 5.08 1.02 1.45 0.64 −0.11 0.03 −0.01 0.78 0.12 0.28 5.48
400 0.500 × 10⁻¹ 0.568 5.21 1.03 1.46 0.74 −0.11 −0.03 −0.01 0.79 −0.07 0.33 5.63
400 0.800 × 10⁻¹ 0.448 5.66 0.99 1.43 0.66 −0.11 −0.02 −0.01 0.79 0.09 0.33 6.02
400 0.130 0.427 5.36 1.24 1.45 0.61 −0.11 −0.03 −0.01 0.79 −0.13 0.34 5.79
400 0.180 0.339 5.84 1.69 1.49 0.83 −0.12 −0.01 −0.01 0.80 −0.21 0.33 6.37
400 0.400 0.160 8.44 4.64 2.75 2.10 −0.13 0.19 0.01 0.85 −0.26 0.25 10.28
500 0.116 × 10⁻¹ 1.006 14.56 2.44 2.50 0.55 −0.09 −0.02 −0.01 −1.44 0.05 0.28 15.06
500 0.131 × 10⁻¹ 0.750 13.71 2.06 1.40 0.55 −0.10 0.02 −0.01 0.66 0.11 0.31 13.97
500 0.152 × 10⁻¹ 0.686 12.27 1.93 1.40 0.59 −0.10 0.01 −0.01 0.78 0.13 0.31 12.54
500 0.201 × 10⁻¹ 0.733 6.52 1.71 1.41 0.61 −0.10 0.02 −0.01 0.79 0.08 0.31 6.96
123

580 Page 90 of 98 Eur. Phys. J. C (2015) 75:580
Table 13 continued
Q2
(GeV2)xBj σ+
r,NC δstat(%)
δuncor(%)
δcor(%)
δrel(%)
δγ p(%)
δhad(%)
δ1(%)
δ2(%)
δ3(%)
δ4(%)
δtot(%)
500 0.320 × 10⁻¹ 0.649 6.05 0.97 1.43 0.64 −0.11 0.02 −0.01 0.78 0.10 0.29 6.38
500 0.500 × 10⁻¹ 0.599 5.92 1.29 1.46 0.60 −0.11 0.05 −0.01 0.78 0.15 0.27 6.32
500 0.800 × 10⁻¹ 0.471 6.34 1.03 1.44 0.70 −0.11 −0.02 −0.01 0.79 −0.04 0.34 6.68
500 0.130 0.410 7.51 1.35 1.49 0.72 −0.12 −0.05 −0.01 0.79 −0.09 0.34 7.86
500 0.180 0.304 8.44 1.49 1.48 0.68 −0.11 −0.05 −0.01 0.79 −0.13 0.35 8.77
500 0.250 0.278 8.21 1.88 1.52 0.90 −0.12 −0.02 −0.01 0.80 −0.21 0.33 8.66
500 0.400 0.138 11.44 4.14 2.18 1.66 −0.12 0.12 0.00 0.84 −0.52 0.30 12.51
500 0.650 0.019 21.66 6.96 4.15 3.47 −0.14 0.32 0.02 0.90 −0.28 0.18 23.40
650 0.151 × 10⁻¹ 0.804 19.43 2.67 1.66 0.32 −0.07 0.02 −0.01 −0.38 0.13 0.32 19.69
650 0.171 × 10⁻¹ 0.914 13.91 2.02 1.40 0.58 −0.10 0.01 −0.01 0.68 0.09 0.32 14.15
650 0.197 × 10⁻¹ 0.905 12.02 1.92 1.41 0.60 −0.10 0.01 −0.01 0.70 0.09 0.31 12.29
650 0.261 × 10⁻¹ 0.602 7.81 1.78 1.41 0.60 −0.10 0.02 −0.01 0.78 0.10 0.30 8.20
650 0.500 × 10⁻¹ 0.488 7.87 1.12 1.45 0.66 −0.11 0.03 −0.01 0.78 0.12 0.28 8.15
650 0.800 × 10⁻¹ 0.451 7.78 1.04 1.44 0.69 −0.11 −0.03 −0.01 0.79 0.06 0.34 8.06
650 0.130 0.374 9.33 1.41 1.45 0.72 −0.11 −0.02 −0.01 0.79 −0.16 0.34 9.62
650 0.180 0.339 9.52 1.48 1.47 0.69 −0.12 −0.04 −0.01 0.79 −0.07 0.34 9.81
650 0.250 0.252 10.12 1.70 1.44 0.69 −0.10 −0.04 −0.01 0.79 0.06 0.35 10.42
650 0.400 0.201 10.92 3.94 2.05 1.58 −0.13 0.07 0.00 0.83 −0.61 0.32 11.94
650 0.650 0.027 21.00 7.78 4.11 3.66 −0.13 0.30 0.02 0.90 −0.62 0.24 23.09
800 0.185 × 10⁻¹ 0.286 36.97 3.94 1.43 0.62 −0.10 0.00 −0.01 0.51 0.08 0.32 37.22
800 0.210 × 10⁻¹ 0.658 19.13 2.27 1.38 0.51 −0.09 0.02 −0.01 0.78 0.12 0.32 19.34
800 0.242 × 10⁻¹ 0.656 15.94 2.08 1.38 0.49 −0.09 0.03 −0.01 0.78 0.10 0.31 16.17
800 0.322 × 10⁻¹ 0.610 8.63 1.82 1.39 0.54 −0.10 0.03 −0.01 0.78 0.10 0.31 8.98
800 0.500 × 10⁻¹ 0.479 9.02 1.23 1.40 0.55 −0.10 0.04 −0.01 0.78 0.11 0.30 9.26
800 0.800 × 10⁻¹ 0.447 9.22 1.31 1.44 0.65 −0.11 0.03 −0.01 0.78 0.11 0.28 9.48
800 0.130 0.388 10.60 1.43 1.46 0.74 −0.11 −0.02 −0.01 0.79 −0.18 0.35 10.85
800 0.180 0.363 10.93 1.46 1.42 0.62 −0.10 −0.02 −0.01 0.79 0.04 0.34 11.17
800 0.250 0.276 11.53 1.74 1.46 0.72 −0.11 −0.03 −0.01 0.79 −0.22 0.35 11.81
800 0.400 0.131 15.53 3.53 1.81 1.23 −0.11 0.09 −0.01 0.82 −0.53 0.33 16.10
800 0.650 0.022 27.39 7.13 3.40 2.79 −0.11 0.26 0.02 0.88 −0.50 0.27 28.66
123

Eur. Phys. J. C (2015) 75:580 Page 91 of 98 580
Table 14 HERA combined reduced cross sections σ−r,NC for NC e− p scattering at
√s = 318 GeV. The uncertainties are quoted in percent relative
to σ−r,NC. Other details as for Table 10
Q2
(GeV2)xBj σ−
r,NC δstat(%)
δuncor(%)
δcor(%)
δrel(%)
δγ p(%)
δhad(%)
δ1(%)
δ2(%)
δ3(%)
δ4(%)
δtot(%)
60 0.800 × 10⁻³ 1.483 1.01 1.84 1.19 0.16 −0.04 −0.03 0.00 −0.04 0.01 −0.07 2.42
90 0.130 × 10⁻² 1.466 0.82 1.63 1.12 0.03 −0.02 −0.02 0.00 −0.04 0.03 −0.08 2.14
90 0.150 × 10⁻² 1.422 1.20 1.10 1.43 0.98 −1.09 −0.13 0.00 −0.04 −0.11 −0.21 2.63
90 0.200 × 10⁻² 1.270 3.41 3.30 1.46 0.95 −0.82 0.24 0.01 −0.03 0.06 −0.17 5.13
120 0.160 × 10⁻² 1.439 0.92 1.71 1.10 0.05 −0.02 −0.02 0.00 −0.04 −0.01 −0.07 2.23
120 0.200 × 10⁻² 1.356 0.70 0.91 1.20 0.61 −0.71 −0.10 0.00 −0.04 −0.08 −0.18 1.92
120 0.320 × 10⁻² 1.218 0.96 1.08 1.03 0.25 −0.17 −0.02 0.00 −0.04 −0.02 −0.11 1.81
150 0.200 × 10⁻² 1.355 1.03 1.77 1.07 0.04 −0.02 0.00 0.00 −0.04 0.01 −0.07 2.31
150 0.320 × 10⁻² 1.229 0.59 0.85 1.07 0.37 −0.38 −0.02 0.00 −0.04 −0.02 −0.14 1.59
150 0.500 × 10⁻² 1.109 0.71 1.13 1.03 0.15 −0.07 0.01 0.00 −0.05 −0.01 −0.12 1.70
150 0.800 × 10⁻² 0.952 0.97 1.72 1.09 0.07 −0.10 −0.01 0.00 −0.04 −0.27 −0.13 2.28
150 0.130 × 10⁻¹ 0.806 1.38 2.98 1.21 0.10 −0.12 0.07 0.00 −0.04 −0.21 −0.17 3.51
200 0.260 × 10⁻² 1.284 1.30 1.85 1.06 0.06 −0.02 −0.01 0.00 −0.04 0.01 −0.06 2.50
200 0.320 × 10⁻² 1.250 1.08 0.84 1.09 0.39 −0.44 −0.06 0.01 −0.04 −0.06 −0.14 1.85
200 0.500 × 10⁻² 1.111 0.59 0.53 1.00 0.14 −0.10 0.00 0.00 −0.04 −0.09 −0.09 1.30
200 0.800 × 10⁻² 0.944 0.60 0.66 1.01 0.11 −0.06 0.00 0.00 −0.05 −0.12 −0.07 1.36
200 0.130 × 10⁻¹ 0.799 0.59 0.54 1.00 0.05 −0.05 −0.04 0.00 −0.05 −0.20 −0.06 1.30
200 0.200 × 10⁻¹ 0.696 0.67 0.62 1.00 0.03 −0.04 −0.04 0.00 −0.05 −0.17 −0.10 1.37
200 0.320 × 10⁻¹ 0.580 0.74 0.68 1.07 0.09 −0.04 −0.09 0.00 −0.04 −0.29 −0.16 1.51
200 0.500 × 10⁻¹ 0.513 0.81 0.74 1.02 0.08 −0.04 −0.07 0.00 −0.04 −0.20 −0.12 1.52
200 0.800 × 10⁻¹ 0.438 0.77 0.74 1.17 0.18 −0.04 −0.05 0.00 −0.04 −0.21 −0.11 1.61
200 0.130 0.364 1.67 2.15 1.17 0.29 −0.05 0.03 0.00 −0.04 −0.21 −0.15 2.99
200 0.180 0.329 1.08 0.77 1.22 0.26 −0.05 −0.02 0.00 −0.05 −0.15 −0.08 1.83
250 0.330 × 10⁻² 1.270 1.49 1.84 1.06 0.05 −0.01 0.00 0.00 −0.05 0.02 −0.06 2.60
250 0.500 × 10⁻² 1.124 0.88 0.78 1.03 0.20 −0.23 0.01 0.00 −0.04 −0.02 −0.11 1.60
250 0.800 × 10⁻² 0.961 0.66 0.56 1.00 0.09 −0.05 −0.01 0.00 −0.05 −0.06 −0.08 1.33
250 0.130 × 10⁻¹ 0.817 0.69 0.54 1.02 0.17 −0.06 −0.03 0.00 −0.05 −0.18 −0.06 1.37
250 0.200 × 10⁻¹ 0.690 0.75 0.63 1.00 0.16 −0.05 −0.08 0.00 −0.04 −0.17 −0.09 1.43
250 0.320 × 10⁻¹ 0.589 0.78 0.67 1.04 0.19 −0.04 −0.11 0.00 −0.04 −0.26 −0.13 1.51
250 0.500 × 10⁻¹ 0.508 0.83 0.60 1.04 0.07 −0.04 −0.10 0.00 −0.05 −0.14 −0.10 1.48
250 0.800 × 10⁻¹ 0.431 0.78 0.57 1.11 0.15 −0.04 −0.08 0.00 −0.04 −0.20 −0.09 1.50
250 0.130 0.371 1.23 1.66 1.05 0.34 −0.04 −0.09 0.00 −0.05 −0.34 −0.07 2.37
250 0.180 0.328 1.07 0.81 1.21 0.28 −0.04 −0.06 0.00 −0.05 −0.02 −0.09 1.83
250 0.250 0.235 7.33 8.60 1.50 0.96 −0.05 −0.78 0.00 −0.05 −0.63 −0.01 11.48
250 0.400 0.141 9.20 6.80 1.27 0.18 0.04 −0.10 0.00 −0.04 −0.19 −0.12 11.52
300 0.390 × 10⁻² 1.216 1.71 1.83 1.05 −0.02 −0.01 −0.03 0.01 −0.04 −0.01 −0.07 2.72
300 0.500 × 10⁻² 1.157 1.49 0.89 1.05 0.31 −0.32 −0.05 0.00 −0.04 −0.04 −0.12 2.08
300 0.800 × 10⁻² 0.987 0.79 0.54 1.04 0.17 −0.10 0.00 0.00 −0.04 −0.07 −0.09 1.43
300 0.130 × 10⁻¹ 0.827 0.75 0.55 1.03 0.08 −0.05 0.00 0.00 −0.05 −0.01 −0.07 1.40
300 0.200 × 10⁻¹ 0.712 0.84 0.50 0.99 0.16 −0.06 −0.06 0.00 −0.05 −0.13 −0.07 1.41
300 0.320 × 10⁻¹ 0.608 0.87 0.58 1.01 0.12 −0.05 −0.06 0.00 −0.05 −0.11 −0.07 1.46
300 0.500 × 10⁻¹ 0.517 0.90 0.57 1.03 0.11 −0.04 −0.08 0.00 −0.05 −0.08 −0.09 1.49
300 0.800 × 10⁻¹ 0.436 0.88 0.59 1.01 0.11 −0.04 −0.09 0.00 −0.05 −0.12 −0.08 1.48
300 0.130 0.366 1.36 1.78 1.06 0.30 −0.04 −0.10 0.00 −0.04 −0.35 −0.06 2.53
123

580 Page 92 of 98 Eur. Phys. J. C (2015) 75:580
Table 14 continued
Q2
(GeV2)xBj σ−
r,NC δstat(%)
δuncor(%)
δcor(%)
δrel(%)
δγ p(%)
δhad(%)
δ1(%)
δ2(%)
δ3(%)
δ4(%)
δtot(%)
300 0.180 0.314 1.12 0.68 1.34 0.30 −0.04 −0.07 0.00 −0.04 −0.19 −0.12 1.92
300 0.250 0.293 6.71 9.39 1.78 1.39 −0.05 −0.93 0.01 −0.05 −0.74 0.00 11.82
300 0.400 0.157 2.17 3.28 1.68 1.10 −0.04 0.02 0.01 −0.04 −0.25 −0.12 4.43
400 0.530 × 10⁻² 1.153 1.85 1.83 1.03 0.01 −0.01 −0.03 0.00 −0.04 0.01 −0.08 2.81
400 0.800 × 10⁻² 1.032 0.93 0.47 1.14 0.29 −0.16 0.00 0.00 −0.04 −0.56 −0.15 1.69
400 0.130 × 10⁻¹ 0.866 0.93 0.54 1.02 0.10 −0.06 −0.01 0.00 −0.04 −0.14 −0.10 1.50
400 0.200 × 10⁻¹ 0.712 1.01 0.72 1.03 0.05 −0.03 −0.04 0.00 −0.04 −0.12 −0.12 1.62
400 0.320 × 10⁻¹ 0.608 0.99 0.63 1.01 0.16 −0.04 −0.05 0.00 −0.04 −0.15 −0.08 1.57
400 0.500 × 10⁻¹ 0.519 0.99 0.57 1.03 0.05 −0.04 −0.08 0.00 −0.05 0.03 −0.06 1.54
400 0.800 × 10⁻¹ 0.431 1.08 0.54 1.02 −0.01 −0.03 −0.08 0.00 −0.05 0.05 −0.06 1.59
400 0.130 0.367 1.14 0.61 1.09 0.17 −0.04 −0.08 0.00 −0.05 −0.07 −0.07 1.71
400 0.180 0.321 1.94 2.44 1.32 0.59 −0.03 0.02 0.01 −0.05 −0.46 −0.08 3.47
400 0.250 0.264 1.81 0.82 1.43 0.19 −0.05 −0.07 0.00 −0.05 0.19 −0.04 2.47
400 0.400 0.157 2.51 3.00 1.78 1.05 −0.03 0.03 0.01 −0.04 −0.17 −0.13 4.43
500 0.660 × 10⁻² 1.059 2.05 1.79 1.03 −0.08 −0.01 −0.01 0.00 −0.05 0.03 −0.07 2.91
500 0.800 × 10⁻² 1.007 2.06 0.93 1.02 0.14 −0.18 −0.01 0.00 −0.05 −0.03 −0.11 2.49
500 0.130 × 10⁻¹ 0.899 1.46 0.88 1.02 0.13 −0.07 0.01 0.00 −0.04 −0.03 −0.10 2.00
500 0.200 × 10⁻¹ 0.731 1.46 1.07 1.04 0.02 −0.02 0.03 0.00 −0.05 0.01 −0.10 2.09
500 0.320 × 10⁻¹ 0.630 1.49 0.99 1.03 0.14 −0.03 −0.07 0.00 −0.05 −0.08 −0.05 2.07
500 0.500 × 10⁻¹ 0.551 1.57 1.06 1.03 0.15 −0.03 −0.08 0.00 −0.05 −0.27 −0.05 2.18
500 0.800 × 10⁻¹ 0.432 1.78 1.06 1.06 0.15 −0.04 −0.12 0.00 −0.05 −0.21 −0.04 2.34
500 0.130 0.377 2.06 1.27 1.05 0.08 −0.03 −0.14 0.00 −0.05 −0.30 −0.04 2.66
500 0.180 0.338 2.21 1.76 1.09 0.44 −0.04 −0.10 0.00 −0.05 −0.48 −0.05 3.10
500 0.250 0.267 2.61 2.41 1.39 0.74 −0.03 −0.02 0.01 −0.04 −0.41 −0.09 3.91
500 0.400 0.149 14.88 11.98 2.70 3.17 −0.14 −0.47 0.01 −0.07 −0.64 0.13 19.57
500 0.650 0.027 19.18 10.50 1.74 −0.73 0.02 −1.52 0.00 −0.03 −0.92 −0.13 22.02
650 0.850 × 10⁻² 0.987 2.19 1.54 1.02 −0.02 −0.03 −0.05 0.00 −0.04 −0.04 −0.07 2.87
650 0.130 × 10⁻¹ 0.905 1.05 0.40 1.04 0.14 −0.12 −0.01 0.00 −0.04 −0.10 −0.10 1.55
650 0.200 × 10⁻¹ 0.778 1.20 0.43 1.00 0.07 −0.05 0.00 0.00 −0.05 −0.12 −0.08 1.63
650 0.320 × 10⁻¹ 0.625 1.32 0.55 1.03 0.09 −0.04 −0.02 0.00 −0.04 −0.12 −0.11 1.77
650 0.500 × 10⁻¹ 0.534 1.31 0.52 0.99 0.13 −0.03 −0.05 0.00 −0.05 −0.19 −0.07 1.74
650 0.800 × 10⁻¹ 0.435 1.45 0.71 1.01 0.08 −0.04 −0.09 0.00 −0.05 −0.13 −0.06 1.92
650 0.130 0.362 1.59 0.77 1.03 0.14 −0.04 −0.02 0.00 −0.05 −0.08 −0.02 2.06
650 0.180 0.333 2.49 1.60 1.05 0.23 −0.03 −0.12 0.00 −0.05 −0.34 −0.04 3.16
650 0.250 0.256 1.86 1.00 1.29 0.36 −0.05 −0.04 0.00 −0.04 −0.23 −0.08 2.51
650 0.400 0.126 4.75 3.33 1.56 0.83 −0.04 0.10 0.02 −0.04 −0.45 −0.09 6.09
800 0.105 × 10⁻¹ 0.963 2.70 1.87 1.02 −0.08 −0.01 −0.02 0.00 −0.05 0.00 −0.08 3.44
800 0.130 × 10⁻¹ 0.888 1.45 0.36 1.11 0.23 −0.13 −0.02 0.00 −0.04 −0.37 −0.10 1.92
800 0.200 × 10⁻¹ 0.752 1.42 0.52 1.00 0.10 −0.07 −0.01 0.00 −0.05 −0.14 −0.08 1.83
800 0.320 × 10⁻¹ 0.641 1.45 0.54 1.00 0.06 −0.05 0.01 0.00 −0.05 −0.08 −0.07 1.85
800 0.500 × 10⁻¹ 0.547 1.42 0.42 1.01 0.12 −0.04 −0.08 0.00 −0.05 −0.22 −0.11 1.81
800 0.800 × 10⁻¹ 0.452 1.56 0.48 1.05 0.05 −0.04 −0.07 0.00 −0.05 −0.12 −0.06 1.95
800 0.130 0.373 1.80 0.49 1.00 0.12 −0.04 −0.07 0.00 −0.05 −0.16 −0.07 2.13
800 0.180 0.326 3.07 1.68 1.05 0.25 −0.03 −0.10 0.00 −0.05 −0.40 −0.04 3.69
800 0.250 0.254 2.16 0.64 1.14 0.28 −0.04 −0.04 0.00 −0.05 −0.22 −0.08 2.56
800 0.400 0.141 4.71 3.85 1.82 1.19 −0.04 0.01 0.01 −0.05 −0.75 −0.10 6.51
123

Eur. Phys. J. C (2015) 75:580 Page 93 of 98 580
Table 14 continued
Q2
(GeV2)xBj σ−
r,NC δstat(%)
δuncor(%)
δcor(%)
δrel(%)
δγ p(%)
δhad(%)
δ1(%)
δ2(%)
δ3(%)
δ4(%)
δtot(%)
800 0.650 0.016 21.20 12.49 2.51 2.80 −0.10 −0.25 0.01 −0.07 −0.46 0.09 24.89
1000 0.130 × 10⁻¹ 0.862 2.75 1.50 1.38 0.73 −1.03 −0.17 0.00 −0.04 −0.13 −0.18 3.66
1000 0.200 × 10⁻¹ 0.770 2.30 0.96 1.01 0.14 −0.11 0.03 0.00 −0.05 −0.02 −0.09 2.70
1000 0.320 × 10⁻¹ 0.658 2.32 1.05 1.01 0.06 −0.03 0.02 0.00 −0.05 −0.02 −0.09 2.74
1000 0.500 × 10⁻¹ 0.517 2.50 1.38 1.03 0.09 −0.03 0.00 0.00 −0.04 0.00 −0.11 3.04
1000 0.800 × 10⁻¹ 0.440 2.72 1.01 1.02 0.06 −0.02 −0.09 0.00 −0.05 −0.09 −0.05 3.08
1000 0.130 0.369 3.21 1.30 1.04 −0.04 −0.02 −0.07 0.00 −0.05 −0.31 −0.04 3.63
1000 0.180 0.345 3.23 1.59 1.03 0.19 −0.03 −0.06 0.00 −0.05 −0.37 −0.05 3.78
1000 0.250 0.281 3.57 1.97 1.12 0.37 −0.03 −0.11 0.00 −0.05 −0.46 −0.05 4.27
1000 0.400 0.137 5.13 4.02 1.76 1.04 −0.03 0.04 0.01 −0.05 −0.54 −0.10 6.85
1200 0.140 × 10⁻¹ 0.916 1.93 0.46 1.51 0.40 −0.44 −0.01 0.00 −0.04 −0.12 −0.12 2.57
1200 0.200 × 10⁻¹ 0.801 1.62 0.40 1.04 0.17 −0.15 −0.01 0.00 −0.04 −0.15 −0.10 1.99
1200 0.320 × 10⁻¹ 0.639 1.58 0.48 1.00 0.09 −0.05 −0.01 0.00 −0.05 −0.12 −0.08 1.94
1200 0.500 × 10⁻¹ 0.557 1.47 0.39 1.00 0.06 −0.03 −0.04 0.00 −0.05 −0.13 −0.11 1.83
1200 0.800 × 10⁻¹ 0.462 1.53 0.39 1.00 0.08 −0.04 −0.06 0.00 −0.05 −0.18 −0.09 1.88
1200 0.130 0.376 1.77 0.38 1.01 0.02 −0.03 −0.05 0.00 −0.05 −0.06 −0.07 2.08
1200 0.180 0.319 3.76 1.60 1.03 0.14 −0.03 −0.09 0.00 −0.05 −0.32 −0.03 4.23
1200 0.250 0.247 2.01 0.52 1.02 0.18 −0.04 −0.05 0.00 −0.05 −0.19 −0.09 2.33
1200 0.400 0.125 3.25 1.15 2.69 0.55 −0.03 −0.03 0.01 −0.05 −0.58 −0.10 4.45
1500 0.200 × 10⁻¹ 0.805 2.18 0.64 1.42 0.31 −0.45 −0.04 0.00 −0.04 0.13 −0.14 2.74
1500 0.320 × 10⁻¹ 0.661 2.01 0.41 0.99 0.06 −0.06 0.00 0.00 −0.05 −0.05 −0.08 2.28
1500 0.500 × 10⁻¹ 0.545 1.86 0.42 1.00 0.10 −0.04 −0.03 0.00 −0.05 −0.10 −0.09 2.16
1500 0.800 × 10⁻¹ 0.490 1.83 0.41 0.99 0.05 −0.04 −0.03 0.00 −0.05 −0.08 −0.06 2.12
1500 0.130 0.378 2.36 0.46 1.05 0.04 −0.04 −0.02 0.00 −0.05 −0.02 −0.02 2.62
1500 0.180 0.313 2.48 0.57 1.01 0.04 −0.04 −0.02 0.00 −0.05 −0.04 −0.02 2.74
1500 0.250 0.260 2.85 0.74 1.01 0.17 −0.04 −0.06 0.00 −0.05 −0.21 −0.07 3.13
1500 0.400 0.130 4.34 1.39 3.03 0.55 −0.04 −0.02 0.01 −0.05 −0.49 −0.05 5.52
1500 0.650 0.016 11.10 6.33 2.89 2.36 −0.03 0.09 0.02 −0.06 −0.71 −0.11 13.33
2000 0.219 × 10⁻¹ 0.878 5.51 2.19 1.60 1.01 −1.35 −0.14 0.00 −0.03 −0.14 −0.21 6.38
2000 0.320 × 10⁻¹ 0.658 2.41 0.56 1.16 0.16 −0.17 −0.01 0.00 −0.04 0.10 −0.10 2.74
2000 0.500 × 10⁻¹ 0.570 2.24 0.39 0.99 0.07 −0.04 0.00 0.00 −0.05 −0.08 −0.06 2.49
2000 0.800 × 10⁻¹ 0.464 2.24 0.44 1.00 0.08 −0.03 −0.05 0.00 −0.05 −0.15 −0.12 2.50
2000 0.130 0.370 2.69 0.54 1.00 0.06 −0.04 −0.06 0.00 −0.05 −0.08 −0.07 2.93
2000 0.180 0.310 2.94 0.69 1.08 0.11 −0.05 −0.03 0.00 −0.05 −0.04 −0.05 3.21
2000 0.250 0.251 3.35 0.80 1.02 0.15 −0.04 −0.04 0.00 −0.05 −0.19 −0.06 3.60
2000 0.400 0.123 4.60 1.58 1.17 0.24 −0.03 −0.04 0.00 −0.05 −0.44 −0.09 5.03
2000 0.650 0.011 15.90 7.83 3.03 2.20 −0.02 0.22 0.03 −0.05 −0.82 −0.14 18.13
3000 0.320 × 10⁻¹ 0.731 3.76 1.74 1.14 0.41 −0.56 −0.06 0.00 −0.04 −0.07 −0.14 4.36
3000 0.500 × 10⁻¹ 0.599 2.34 0.69 1.05 0.20 −0.15 0.02 0.00 −0.04 −0.01 −0.09 2.67
3000 0.800 × 10⁻¹ 0.508 2.34 0.56 0.99 0.05 −0.03 −0.02 0.00 −0.05 −0.06 −0.09 2.61
3000 0.130 0.394 2.82 0.71 0.98 0.00 −0.03 −0.04 0.00 −0.05 −0.05 −0.07 3.07
3000 0.180 0.317 3.13 0.75 1.00 0.03 −0.03 −0.03 0.00 −0.05 −0.06 −0.03 3.37
3000 0.250 0.265 3.40 1.02 1.19 0.35 −0.03 −0.04 0.00 −0.05 −0.26 −0.04 3.77
3000 0.400 0.131 4.60 1.90 1.12 0.35 −0.04 −0.08 0.00 −0.05 −0.34 −0.05 5.12
3000 0.650 0.015 8.82 3.78 1.89 1.39 −0.03 0.02 0.01 −0.05 −1.01 −0.18 9.93
123
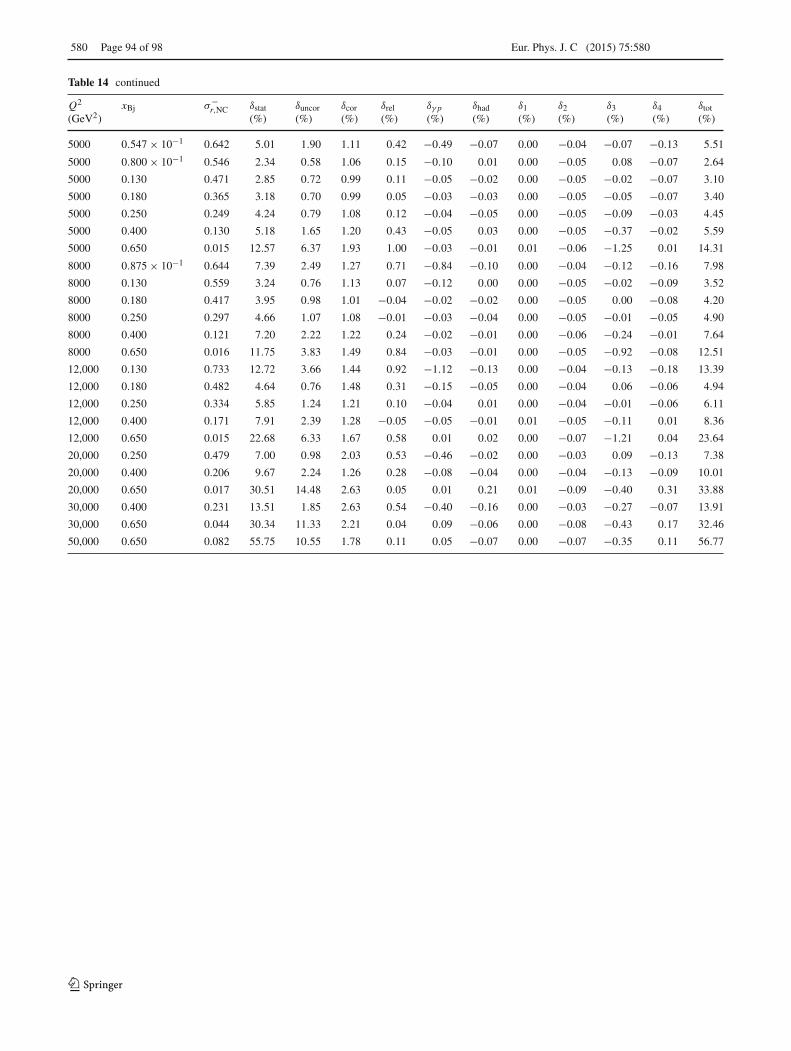
580 Page 94 of 98 Eur. Phys. J. C (2015) 75:580
Table 14 continued
Q2
(GeV2)xBj σ−
r,NC δstat(%)
δuncor(%)
δcor(%)
δrel(%)
δγ p(%)
δhad(%)
δ1(%)
δ2(%)
δ3(%)
δ4(%)
δtot(%)
5000 0.547 × 10⁻¹ 0.642 5.01 1.90 1.11 0.42 −0.49 −0.07 0.00 −0.04 −0.07 −0.13 5.51
5000 0.800 × 10⁻¹ 0.546 2.34 0.58 1.06 0.15 −0.10 0.01 0.00 −0.05 0.08 −0.07 2.64
5000 0.130 0.471 2.85 0.72 0.99 0.11 −0.05 −0.02 0.00 −0.05 −0.02 −0.07 3.10
5000 0.180 0.365 3.18 0.70 0.99 0.05 −0.03 −0.03 0.00 −0.05 −0.05 −0.07 3.40
5000 0.250 0.249 4.24 0.79 1.08 0.12 −0.04 −0.05 0.00 −0.05 −0.09 −0.03 4.45
5000 0.400 0.130 5.18 1.65 1.20 0.43 −0.05 0.03 0.00 −0.05 −0.37 −0.02 5.59
5000 0.650 0.015 12.57 6.37 1.93 1.00 −0.03 −0.01 0.01 −0.06 −1.25 0.01 14.31
8000 0.875 × 10⁻¹ 0.644 7.39 2.49 1.27 0.71 −0.84 −0.10 0.00 −0.04 −0.12 −0.16 7.98
8000 0.130 0.559 3.24 0.76 1.13 0.07 −0.12 0.00 0.00 −0.05 −0.02 −0.09 3.52
8000 0.180 0.417 3.95 0.98 1.01 −0.04 −0.02 −0.02 0.00 −0.05 0.00 −0.08 4.20
8000 0.250 0.297 4.66 1.07 1.08 −0.01 −0.03 −0.04 0.00 −0.05 −0.01 −0.05 4.90
8000 0.400 0.121 7.20 2.22 1.22 0.24 −0.02 −0.01 0.00 −0.06 −0.24 −0.01 7.64
8000 0.650 0.016 11.75 3.83 1.49 0.84 −0.03 −0.01 0.00 −0.05 −0.92 −0.08 12.51
12,000 0.130 0.733 12.72 3.66 1.44 0.92 −1.12 −0.13 0.00 −0.04 −0.13 −0.18 13.39
12,000 0.180 0.482 4.64 0.76 1.48 0.31 −0.15 −0.05 0.00 −0.04 0.06 −0.06 4.94
12,000 0.250 0.334 5.85 1.24 1.21 0.10 −0.04 0.01 0.00 −0.04 −0.01 −0.06 6.11
12,000 0.400 0.171 7.91 2.39 1.28 −0.05 −0.05 −0.01 0.01 −0.05 −0.11 0.01 8.36
12,000 0.650 0.015 22.68 6.33 1.67 0.58 0.01 0.02 0.00 −0.07 −1.21 0.04 23.64
20,000 0.250 0.479 7.00 0.98 2.03 0.53 −0.46 −0.02 0.00 −0.03 0.09 −0.13 7.38
20,000 0.400 0.206 9.67 2.24 1.26 0.28 −0.08 −0.04 0.00 −0.04 −0.13 −0.09 10.01
20,000 0.650 0.017 30.51 14.48 2.63 0.05 0.01 0.21 0.01 −0.09 −0.40 0.31 33.88
30,000 0.400 0.231 13.51 1.85 2.63 0.54 −0.40 −0.16 0.00 −0.03 −0.27 −0.07 13.91
30,000 0.650 0.044 30.34 11.33 2.21 0.04 0.09 −0.06 0.00 −0.08 −0.43 0.17 32.46
50,000 0.650 0.082 55.75 10.55 1.78 0.11 0.05 −0.07 0.00 −0.07 −0.35 0.11 56.77
123

Eur. Phys. J. C (2015) 75:580 Page 95 of 98 580
Table 15 HERA combined reduced cross sections σ+r,CC for CC e+ p scattering at
√s = 318 GeV. The uncertainties are quoted in percent relative
to σ+r,CC. Other details as for Table 10
Q2
(GeV2)xBj σ+
r,CC δstat(%)
δuncor(%)
δcor(%)
δrel(%)
δγ p(%)
δhad(%)
δ1(%)
δ2(%)
δ3(%)
δ4(%)
δtot(%)
300 0.800 × 10⁻² 1.187 11.56 3.56 2.57 1.19 −0.49 −0.11 0.01 −0.04 1.60 0.23 12.54
300 0.130 × 10⁻¹ 1.225 5.92 1.97 2.20 1.62 −0.71 −0.28 0.00 −0.04 1.11 0.20 6.94
300 0.320 × 10⁻¹ 0.859 5.40 1.49 1.54 1.00 −0.72 −0.10 0.00 −0.04 0.68 0.20 5.98
300 0.800 × 10⁻¹ 0.486 7.07 1.91 1.35 0.95 −0.73 −0.36 0.00 −0.05 −0.46 0.24 7.57
300 0.130 0.569 27.42 1.50 1.81 0.68 −0.11 −0.01 0.01 −0.06 0.47 0.38 27.54
500 0.800 × 10⁻² 0.733 24.79 5.57 4.13 2.09 −0.19 0.14 0.01 −0.04 3.27 0.17 26.04
500 0.130 × 10⁻¹ 0.938 5.27 1.96 1.90 1.10 −0.27 −0.28 0.00 −0.05 1.05 0.28 6.15
500 0.320 × 10⁻¹ 0.863 4.15 1.23 1.13 0.86 −0.22 −0.30 0.00 −0.05 0.53 0.30 4.61
500 0.800 × 10⁻¹ 0.582 4.64 1.34 0.94 0.15 −0.15 −0.07 0.01 −0.05 0.32 0.28 4.94
500 0.130 0.428 8.45 1.72 1.74 0.75 −0.13 −0.17 0.01 −0.05 −1.63 0.29 8.98
1000 0.130 × 10⁻¹ 0.652 6.17 2.37 2.07 0.47 0.04 −0.38 −0.01 −0.06 1.37 0.32 7.09
1000 0.320 × 10⁻¹ 0.730 3.44 0.97 1.01 0.20 −0.04 −0.35 0.00 −0.06 0.62 0.30 3.79
1000 0.800 × 10⁻¹ 0.515 3.85 1.10 0.82 −0.02 −0.03 −0.22 0.00 −0.05 0.43 0.31 4.12
1000 0.130 0.431 5.52 1.45 0.91 0.21 −0.02 −0.20 0.00 −0.05 −0.28 0.32 5.80
1000 0.250 0.232 11.66 2.58 1.13 0.24 −0.01 0.42 0.01 −0.04 0.58 0.25 12.02
1500 0.320 × 10⁻¹ 0.566 5.49 0.77 1.18 0.08 −0.04 0.09 0.01 −0.05 1.44 0.31 5.86
1500 0.800 × 10⁻¹ 0.475 5.17 0.47 0.92 0.05 −0.02 −0.23 0.00 −0.06 0.85 0.36 5.35
1500 0.130 0.346 7.37 0.49 0.89 −0.16 −0.03 0.04 0.01 −0.05 0.57 0.33 7.47
1500 0.250 0.227 9.22 0.94 0.89 0.10 −0.02 −0.15 0.00 −0.05 0.40 0.33 9.33
1500 0.400 0.072 41.90 3.35 1.35 0.42 −0.09 −0.05 0.00 −0.06 0.16 0.43 42.06
2000 0.320 × 10⁻¹ 0.517 4.91 1.98 1.30 0.43 0.07 −0.18 0.00 −0.06 0.45 0.29 5.50
2000 0.800 × 10⁻¹ 0.427 4.69 1.68 0.89 0.10 −0.05 −0.20 0.00 −0.05 0.42 0.27 5.09
2000 0.130 0.344 6.47 2.39 0.87 −0.30 −0.05 −0.38 0.01 −0.05 0.42 0.28 6.99
2000 0.250 0.216 10.29 3.28 2.48 1.27 −0.01 −0.51 0.00 −0.05 −2.99 0.26 11.56
3000 0.320 × 10⁻¹ 0.384 12.67 1.25 2.38 1.03 −0.13 0.00 0.00 −0.05 2.25 0.32 13.19
3000 0.800 × 10⁻¹ 0.377 3.52 1.09 0.99 0.14 −0.03 0.25 0.01 −0.05 1.03 0.25 3.97
3000 0.130 0.312 4.41 1.00 0.87 0.06 −0.02 0.03 0.00 −0.05 0.66 0.28 4.66
3000 0.250 0.166 6.33 1.50 0.95 0.45 0.00 −0.02 0.00 −0.05 0.18 0.28 6.60
3000 0.400 0.063 15.90 2.86 1.94 3.20 0.04 0.11 0.00 −0.04 −1.23 0.19 16.63
5000 0.800 × 10⁻¹ 0.225 5.76 1.64 1.49 0.68 −0.05 0.38 0.01 −0.05 1.54 0.23 6.41
5000 0.130 0.219 5.08 1.35 1.21 0.40 −0.04 0.44 0.01 −0.04 0.99 0.21 5.52
5000 0.250 0.143 6.19 1.42 1.23 0.42 −0.01 −0.01 0.00 −0.05 0.56 0.24 6.51
5000 0.400 0.084 10.70 2.60 2.03 −0.42 0.05 0.20 0.00 −0.04 −0.45 0.20 11.22
8000 0.130 0.116 8.17 2.52 2.39 1.03 −0.07 1.03 0.03 −0.03 1.52 0.10 9.13
8000 0.250 0.110 7.37 2.15 1.72 0.76 −0.01 0.60 0.01 −0.04 1.23 0.17 8.02
8000 0.400 0.049 13.87 3.88 2.46 0.95 0.06 0.33 0.00 −0.04 0.83 0.15 14.67
15,000 0.250 0.045 13.71 3.82 3.44 1.65 −0.10 1.66 0.04 −0.03 1.88 −0.03 14.95
15,000 0.400 0.031 15.37 4.56 2.50 2.26 0.03 0.66 0.00 −0.04 1.74 0.12 16.49
30,000 0.400 0.008 69.33 2.49 18.37 9.46 −0.50 1.29 0.02 0.01 −2.94 −0.69 72.46
123

580 Page 96 of 98 Eur. Phys. J. C (2015) 75:580
Table 16 HERA combined reduced cross sections σ−r,CC for CC e− p scattering at
√s = 318 GeV. The uncertainties are quoted in percent relative
to σ−r,CC. Other details as for Table 10
Q2
(GeV2)xBj σ−
r,CC δstat(%)
δuncor(%)
δcor(%)
δrel(%)
δγ p(%)
δhad(%)
δ1(%)
δ2(%)
δ3(%)
δ4(%)
δtot(%)
300 0.800 × 10⁻² 1.934 31.94 23.82 8.56 5.28 −2.92 −0.69 0.00 −0.01 0.49 −0.35 41.21
300 0.130 × 10⁻¹ 1.188 7.18 4.71 2.41 0.93 −0.30 −0.17 0.00 −0.05 −0.35 −0.05 8.98
300 0.320 × 10⁻¹ 1.091 6.58 4.18 1.89 1.51 −0.66 −0.19 0.00 −0.05 −0.08 −0.10 8.19
300 0.800 × 10⁻¹ 0.946 7.26 2.94 2.31 2.59 −1.00 −0.26 0.00 −0.05 −1.95 −0.14 8.84
300 0.130 0.643 26.28 3.48 2.15 0.40 −0.11 −0.12 0.00 −0.06 −0.36 −0.03 26.60
500 0.130 × 10⁻¹ 1.093 5.71 2.70 2.34 0.70 −0.02 −0.16 0.00 −0.05 −0.30 −0.02 6.78
500 0.320 × 10⁻¹ 0.968 4.93 2.92 1.59 0.67 −0.24 −0.14 0.00 −0.05 −0.36 −0.06 6.00
500 0.800 × 10⁻¹ 0.699 5.57 2.34 1.32 0.51 −0.15 −0.12 0.00 −0.05 −0.58 −0.05 6.23
500 0.130 0.828 8.30 2.06 2.69 3.30 −0.10 −0.29 0.00 −0.06 −2.72 −0.03 9.94
1000 0.130 × 10⁻¹ 0.889 5.65 3.26 2.31 0.64 0.06 −0.13 0.00 −0.06 −0.26 −0.02 6.96
1000 0.320 × 10⁻¹ 0.918 3.96 2.60 1.31 0.18 −0.02 −0.10 0.00 −0.06 −0.19 −0.04 4.92
1000 0.800 × 10⁻¹ 0.743 4.13 1.92 1.18 0.08 −0.07 −0.08 0.00 −0.05 0.00 −0.04 4.71
1000 0.130 0.681 5.32 1.42 1.43 0.64 −0.07 −0.14 0.00 −0.05 −1.02 −0.04 5.82
1000 0.250 0.519 10.81 3.33 1.19 0.10 −0.05 −0.06 0.00 −0.05 −0.02 −0.04 11.37
1500 0.320 × 10⁻¹ 0.827 4.99 5.42 1.30 0.16 −0.07 −0.08 0.01 −0.05 −0.09 −0.03 7.49
1500 0.800 × 10⁻¹ 0.751 4.95 3.15 1.18 0.11 −0.06 −0.07 0.00 −0.05 −0.04 −0.04 5.99
1500 0.130 0.652 5.91 1.80 1.46 0.20 −0.08 −0.08 0.00 −0.05 −0.13 −0.04 6.36
1500 0.250 0.518 7.16 1.59 1.05 −0.11 −0.03 −0.02 0.00 −0.05 0.25 −0.03 7.41
1500 0.400 0.348 16.43 4.08 1.59 −0.21 0.01 0.02 0.00 −0.05 0.55 −0.04 17.01
2000 0.320 × 10⁻¹ 0.805 4.93 2.36 1.40 0.29 0.08 −0.11 0.00 −0.06 −0.52 −0.04 5.67
2000 0.800 × 10⁻¹ 0.754 4.48 1.92 1.11 −0.14 0.00 −0.03 0.00 −0.05 0.24 −0.05 5.00
2000 0.130 0.613 6.39 2.69 1.09 −0.09 −0.03 −0.07 0.00 −0.05 −0.71 −0.05 7.06
2000 0.250 0.514 10.66 3.37 4.26 2.17 0.03 −0.38 0.00 −0.05 −5.67 −0.05 13.42
3000 0.320 × 10⁻¹ 0.700 8.57 8.30 1.48 0.21 −0.07 −0.08 0.00 −0.06 −0.13 −0.03 12.02
3000 0.800 × 10⁻¹ 0.661 3.20 1.90 1.04 −0.07 −0.02 −0.06 0.00 −0.05 0.37 −0.05 3.88
3000 0.130 0.610 4.06 1.96 1.03 −0.04 −0.02 0.00 0.01 −0.05 0.23 −0.05 4.62
3000 0.250 0.478 4.55 2.27 1.08 0.10 −0.07 −0.09 0.00 −0.05 −0.38 −0.05 5.21
3000 0.400 0.265 8.14 3.84 2.10 −0.24 0.05 0.18 0.00 −0.05 0.76 −0.06 9.28
5000 0.800 × 10⁻¹ 0.629 4.13 2.09 1.13 0.05 0.01 0.01 0.00 −0.05 0.60 −0.05 4.80
5000 0.130 0.581 3.89 2.16 1.05 −0.01 −0.01 0.02 0.01 −0.05 0.44 −0.05 4.59
5000 0.250 0.433 4.46 1.99 1.13 −0.08 −0.04 −0.03 0.00 −0.05 0.47 −0.06 5.04
5000 0.400 0.284 6.68 3.90 2.17 0.46 0.06 0.18 0.00 −0.05 −0.18 −0.06 8.06
5000 0.650 0.078 27.12 12.82 7.03 −0.38 0.24 0.31 0.01 −0.05 2.38 −0.05 30.91
8000 0.130 0.633 4.51 2.97 1.48 −0.09 0.02 0.11 0.00 −0.05 1.36 −0.07 5.76
8000 0.250 0.419 4.71 2.77 1.33 −0.20 0.02 0.08 0.00 −0.05 1.10 −0.07 5.73
8000 0.400 0.244 7.12 3.77 2.25 −0.14 0.07 0.22 0.00 −0.05 1.11 −0.08 8.44
8000 0.650 0.035 46.57 27.23 9.72 −0.05 0.36 0.45 0.01 −0.05 3.32 −0.06 54.92
15,000 0.250 0.454 5.17 4.05 2.62 0.30 0.08 0.23 0.01 −0.04 2.03 −0.07 7.37
15,000 0.400 0.204 7.20 4.18 2.79 −0.17 0.09 0.29 0.01 −0.04 2.23 −0.08 9.07
15,000 0.650 0.036 46.02 24.89 11.35 0.28 0.44 0.54 0.01 −0.05 3.91 −0.07 53.68
30,000 0.400 0.231 11.22 9.16 4.69 −1.32 0.13 0.12 0.01 −0.04 4.37 −0.10 15.89
30,000 0.650 0.040 43.25 29.71 19.04 3.06 0.83 1.02 0.01 −0.04 6.96 −0.10 56.35
123

Eur. Phys. J. C (2015) 75:580 Page 97 of 98 580
References
1. A. Cooper-Sarkar, R. Devenish,Deep Inelastic Scattering (OxfordUniversity Press, Oxford, 2011). ISBN 978-0-19-960225-4
2. F. Aaron et al., [H1 and ZEUS Collaborations], JHEP 1001, 109(2010a). arXiv:0911.0884
3. F. Aaron et al., [H1 Collaboration], Eur. Phys. J. C 63, 625 (2009a).arXiv:0904.0929
4. F. Aaron et al., [H1 Collaboration], Eur. Phys. J. C 64, 562 (2009b).arXiv:0904.3513
5. C. Adloff et al. [H1 Collaboration], Eur. Phys. J. C 13, 609 (2000).arXiv:hep-ex/9908059
6. C. Adloff et al. [H1 Collaboration], Eur. Phys. J. C 19, 269 (2001a).arXiv:hep-ex/0012052
7. C. Adloff et al. [H1 Collaboration], Eur. Phys. J. C 30, 1 (2003).arXiv:hep-ex/0304003
8. F. Aaron et al., [H1 Collaboration], JHEP 1209, 061 (2012a).arXiv:1206.7007
9. V. Andreev et al., [H1 Collaboration], Eur. Phys. J. C 74, 2814(2014). arXiv:1312.4821
10. F. Aaron et al., [H1 Collaboration], Eur. Phys. J. C 71, 1579 (2011).arXiv:1012.4355
11. J. Breitweg et al. [ZEUS Collaboration], Phys. Lett. B 407, 432(1997). arXiv:hep-ex/9707025
12. J. Breitweg et al. [ZEUS Collaboration], Phys. Lett. B 487, 53(2000a). arXiv:hep-ex/0005018
13. J. Breitweg et al. [ZEUS Collaboration], Eur. Phys. J. C 7, 609(1999). arXiv:hep-ex/9809005
14. S. Chekanov et al. [ZEUS Collaboration], Eur. Phys. J. C 21, 443(2001). arXiv:hep-ex/0105090
15. J. Breitweg et al. [ZEUS Collaboration], Eur. Phys. J. C 12,411 (2000b). arXiv:hep-ex/9907010. (Erratum-ibid. C 27, 305(2003))
16. S. Chekanov et al. [ZEUS Collaboration], Eur. Phys. J. C 28, 175(2003a). arXiv:hep-ex/0208040
17. S. Chekanov et al. [ZEUS Collaboration], Phys. Lett. B 539,197 (2002a). arXiv:hep-ex/0205091. (Erratum-ibid. B 552, 308(2003))
18. S. Chekanov et al. [ZEUS Collaboration], Phys. Rev. D 70, 052001(2004). arXiv:hep-ex/0401003
19. S. Chekanov et al. [ZEUS Collaboration], Eur. Phys. J. C 32, 1(2003b). arXiv:hep-ex/0307043
20. S. Chekanov et al., [ZEUS Collaboration]. Eur. Phys. J. C 62, 625(2009a). arXiv:0901.2385
21. S. Chekanov et al., [ZEUS Collaboration], Eur. Phys. J. C 61, 223(2009b). arXiv:0812.4620
22. H. Abramowicz et al., [ZEUS Collaboration], Phys. Rev. D 87,052014 (2013). arXiv:1208.6138
23. H. Abramowicz et al., [ZEUS Collaboration], Eur. Phys. J. C 70,945 (2010a). arXiv:1008.3493
24. H. Abramowicz et al., [ZEUS Collaboration], Phys. Rev. D 90,072002 (2014a). arXiv:1404.6376
25. The documentation and the package can be found at: https://wiki-zeuthen.desy.de/HERAverager
26. S. Alekhin et al. (2014). arXiv:1410.441227. The documentation and the package can be found at: http://www.
herafitter.org28. A. Glazov, A.I.P. Conf. Proc. 792, 237 (2005)29. V.N. Gribov, L.N. Lipatov, Sov. J. Nucl. Phys. 15, 438 (1972a)30. V.N. Gribov, L.N. Lipatov, Sov. J. Nucl. Phys. 15, 675 (1972b)31. L.N. Lipatov, Sov. J. Nucl. Phys. 20, 94 (1975)32. Y.L. Dokshitzer, Sov. Phys. JETP 46, 641 (1977)33. G. Altarelli, G. Parisi, Nucl. Phys. B 126, 298 (1977)34. HERAPDF1.5. https://www.desy.de/h1zeus/combined_results/
herapdftable/
35. P. Jimenez-Delgado, E. Reya, Phys. Rev. D 89, 074049 (2014).arXiv:1403.1852
36. A.D. Martin, W.J. Stirling, R.S. Thorne, G. Watt, Eur. Phys. J. C63, 189 (2009). arXiv:0901.0002
37. L. Harland-Lang, A.D. Martin, P. Motylinski, R. Thorne (2014).arXiv:1412.3989
38. J. Pumplin et al., JHEP 0207, 012 (2002). arXiv:hep-ph/020119539. M. Guzzi et al., Phys. Rev. D 82, 074024 (2010). arXiv:1007.224140. S. Alekhin et al., Phys. Lett. B 672, 166 (2009a). arXiv:0811.141241. S. Alekhin et al., in Proc. of 17th International Workshop on Deep
Inelastic Scattering (DIS 2009), ed. by C. Glasman, J. Terron, p.135 (2009b). arXiv:0908.3128
42. S. Alekhin et al., Phys. Rev. D 86, 054009 (2012).arXiv:1202.2281
43. R.D. Ball et al., [NNPDF Collaboration], Nucl. Phys. B 809, 1(2009). arXiv:0808.1231
44. R.D. Ball et al. [NNPDF Collaboration], JHEP 1004, 040 (2015).arXiv:1410.8849v2
45. A.M. Cooper-Sarkar et al., Z. Phys. C 39, 281 (1988)46. F. Aaron et al., [H1 and ZEUS Collaborations], Eur. Phys. J. C
73, 2311 (2013). arXiv:1211.118247. S. Chekanov et al. [ZEUS Collaboration], Phys. Lett. B 547, 164
(2002b). arXiv:hep-ex/020803748. H. Abramowicz et al., [ZEUS Collaboration], Eur. Phys. J. C 70,
965 (2010b). arXiv:1010.616749. F. Aaron et al., [H1 Collaboration], Eur. Phys. J. C 67, 1 (2010b).
arXiv:0911.567850. A. Aktas et al., [H1 Collaboration], Phys. Lett. B 653, 134 (2007).
arXiv:0706.372251. V. Andreev et al., [H1 Collaboration], Eur. Phys. J. C 65, 2 (2015).
arXiv:1406.470952. J. Beringer et al., Particle Data Group, Phys. Rev. D 86, 010001
(2012)53. C.G. Callan, D.J. Gross, Phys. Rev. Lett. 22, 156 (1969)54. W. van Neerven, A. Vogt, Phys. Lett. B 490, 111 (2000)55. S. Moch, J. Vermaseren, A. Vogt, Nucl. Phys. Proc. Suppl. 152,
111 (2006). arXiv:hep-ph/040732156. I. Abt et al., [H1 Collaboration], Nucl. Instr. and Meth. A 386,
310 (1997a)57. I. Abt et al., [H1 Collaboration], Nucl. Instr. and Meth. A 386,
348 (1997b)58. R.D. Appuhn et al., [H1 Collaboration], Nucl. Instr. and Meth. A
386, 397 (1997)59. ZEUS Collaboration, U. Holm (editor), The ZEUS Detector. Sta-
tus Report (unpublished), DESY (1993). http://www-zeus.desy.de/bluebook/bluebook.html
60. M. Derrick et al., Nucl. Instr. Meth. A 309, 77 (1991)61. B. Foster et al., Nucl. Instr. Meth. A 338, 254 (1994)62. A. Polini et al., Nucl. Instr. Meth. A 581, 656 (2007).
arXiv:0708.301163. M. Klein, R. Yoshida, Prog. Part. Nucl. Phys. 61, 343 (2008).
arXiv:0805.333464. V. Andreev et al., Nucl. Instr. Meth. A 494, 45 (2002)65. F. Aaron et al. [H1 Collaboration], Eur. Phys. J. C 77, 2163
(2012b). arXiv:1205.2448. (Erratum-ibid. C 74, 2733 (2014))66. J. Andruszków et al., Acta Phys. Pol. B 32, 2025 (2001)67. M. Derrick et al., Z. Phys. C 63, 391 (1994)68. L. Adamczyk et al., Nucl. Instr. Meth. A 744, 80 (2014).
arXiv:1306.139169. F. Jacquet, A. Blondel, in The Study of an ep Facility for Europe,
Amsterdam, 1979, ed. by U. Amaldi, p. 39170. U. Bassler, G. Bernardi, Nucl. Instr. Meth. A 361, 197 (1995).
arXiv:hep-ex/941200471. S. Bentvelsen et al., in Proceedings of the Workshop on HERA
Physics, ed. by W. Buchmüller, G. Ingelman, DESY, vol. 1, p. 23,Hamburg (1992)
123

580 Page 98 of 98 Eur. Phys. J. C (2015) 75:580
72. K. Hoeger, in Proceedings of the Workshop on HERA Physics,ed. by W. Buchmüller, G. Ingelman, DESY, vol. 1, p. 43, Hamburg(1992)
73. M. Derrick et al. [ZEUS Collaboration], Z. Phys. C 72, 399 (1996).arXiv:hep-ex/9607002
74. C. Adloff et al. [H1 Collaboration], Nucl. Phys. B 497, 3 (1997).arXiv:hep-ex/9703012
75. H. Abramowicz et al., [ZEUS Collaboration], JHEP 1409, 127(2014b). arXiv:1405.6915
76. F. Aaron et al., [H1 Collaboration], Eur. Phys. J. C 65, 89 (2009c).arXiv:0907.2643
77. T. Lastovicka, Eur. Phys. J. C 24, 529 (2002).arXiv:hep-ph/0203260
78. K.J. Golec-Biernat, M. Wüsthoff, Phys. Rev. D 59, 014017 (1998).arXiv:hep-ph/9807513
79. The combined data together with the full correlation informationand the grids for HERAPDF2.0 are provided at http://www.desy.de/h1zeus/herapdf20/
80. B. Fanchiotti, S. Kniehl, A. Sirlin, Phys. Rev. D 48, 307 (1993).arXiv:hep-ph/9803393
81. M. Botje, Comput. Phys. Commun. 182, 490 (2011).arXiv:1005.1481
82. R.S. Thorne, R.G. Roberts, Phys. Rev. D 57, 6871 (1998).arXiv:hep-ph/9709442
83. R.S. Thorne, Phys. Rev. D 73, 054019 (2006).arXiv:hep-ph/0601245
84. R.S. Thorne, Phys. Rev. D 86, 074017 (2012). arXiv:1201.618085. P.M. Nadolsky et al., Phys. Rev. D 78, 013004 (2008).
arXiv:0802.000786. K.J. Golec-Biernat, M. Wüsthoff, Phys. Rev. Lett. 109, 012001
(2012). arXiv:1203.405187. W.T. Giele, S. Keller, Phys. Rev. D 58, 094023 (1998).
arXiv:hep-ph/980339388. W.T. Giele, S.A. Keller, D.A. Kosower (2001).
arXiv:hep-ph/010405289. A. Airapetian et al., [HERMES Collaboration], Phys. Lett. B 666,
446 (2008). arXiv:0803.299390. A. Airapetian et al., [HERMES Collaboration], Phys. Rev. D 89,
097101 (2014). arXiv:1312.702891. M. Cacciari, M. Greco, P. Nason, JHEP 9805, 007 (1998).
arXiv:hep-ph/9803400
92. S. Forte, E. Laenen, P. Nason, J. Rojo, Nucl. Phys. B 834, 116(2010). arXiv:1001.2312
93. M. Aivazis et al., Phys. Rev. D 50, 3102 (1994).arXiv:hep-ph/9312319
94. V. Bertone, S. Carrazza, J. Rojo, Comput. Phys. Commun. 185,1647 (2014). arXiv:1310.1394
95. M. Glück, E. Reya, M. Stratmann, Nucl. Phys. B 422, 37 (1994)96. S. Alekhin. http://www-zeuthen.desy.de/~alekhin/
OPENQCDRAD97. Z. Nagy, Z. Trocsany, Phys. Rev. D 59, 014020 (1999).
arXiv:hep-ph/980631798. Z. Nagy, Phys. Rev. Lett. 88, 122003 (2002).
arXiv:hep-ph/011031599. C. Adloff et al., Eur. Phys. J. C 19, 289 (2001b).
arXiv:hep-ph/0010054100. T. Kluge et al., in Proc. of 14th International Workshop on Deep
Inelastic Scattering (DIS 2006), ed. by M. Kuze, K. Nagano,K. Tokushuku, p. 483 (2007). arXiv:hep-ph/0609285
101. D. Britzger et al., in Proceedings of the 20th International Work-shop on Deep Inelastic Scattering and Related Subjects, DIS, ed.by I. Brock, vol. 2013, p. 217 (2012). arXiv:1208.3641
102. H. Spiesberger, in Proceedings of Future Physics at HERA, ed.by G. Ingelman, A. De Roeck, R. Klanner, p. 227 (1995)
103. R. Thorne, W. Tung, in Proceedings of the 4th Workshop onthe Implications of HERA for LHC Physics, ed. by A.D. Roeck,H. Jung, p. 332 (2008). arXiv:0809.0714
104. F. Caola et al., Phys. Lett. B 686, 127 (2010). arXiv:0910.3143105. M. Guzzi et al., Phys. Rev. D 89, 033009 (2014). arXiv:1302.6246106. R.D. Ball et al. [NNPDF Collaboration], Nucl. Phys. B 849, 296
(2011). arXiv:1101.1300v3107. A. Benvenuti et al., [BCDMS Collaboration], Phys. Lett. B 223,
485 (1989)108. M. Arneodo et al., [NMC Collaboration], Nucl. Phys. B 483, 3
(1997)109. K.A. Olive et al., Particle Data Group, Chin. Phys. C 38, 090001
(2014)110. M. Kramer, F.I. Olness, D.E. Soper, Phys. Rev. D 62, 096007
(2000). arXiv:hep-ph/0003035
123