combination of metso minerals and outotec · “intends,” “may,” “plans,” “should,”...
TRANSCRIPT
Combination of Metso
Minerals and Outotec
Metso Flow Control to Become a Separately
Listed Company

2
Content
(Top Alignment)
Subtitles
(bottom alignment)
Page Titles
(bottom alignment
Page Content
Left Alignment Page Content
Right Alignment
Content
(Bottom Alignment)
Footnotes
(Top Alignment)
224/101/44
205/220/233
127/127/127
255/255/255
0/0/0
230/230/230
Chart 7
Chart 8
Chart 9
Chart 1
Chart 2
Chart 3
Chart 4
Chart 5
Chart 6
0/0/0
22/155/214
207/207/207
235/241/246
192/192/202
Body Text
Background
Message Box
Table Highlights
Titles
235/235/235
135/135/135
252/238/224
Joint Disclaimer / Safe Harbour Statement
Important information
This presentation has been prepared by, and the information contained herein (unless otherwise indicated) has been provided by Metso Corporation (“Metso”) and Outotec Oyj (“Outotec”).
This presentation is for information purposes only. This presentation does not constitute a notice to an EGM or a demerger prospectus and as such, does not constitute or form part of and should not be construed as, an offer to sell, or the solicitation or invitation of any offer to buy,
acquire or subscribe for, any securities or an inducement to enter into investment activity. Any decision with respect to the proposed partial demerger of Metso in which all assets and liabilities of Metso that relate to, or primarily serve, Metso Minerals will transfer without liquidation of
Metso to Outotec should be made solely on the basis of information to be contained in the actual notices to the EGM of Metso and Outotec, as applicable, and the demerger prospectus related to the demerger as well as on an independent analysis of the information contained therein.
You should consult the demerger prospectus for more complete information about Metso Minerals, Outotec, Outotec’s securities and the demerger.
The distribution of this presentation may be restricted by law and persons into whose possession any document or other information referred to herein comes should inform themselves about and observe any such restrictions. The information contained herein is not for publication or
distribution, in whole or in part, directly or indirectly, in or into the United States, Australia, Canada, Hong Kong, Japan, South Africa or any other jurisdiction where such publication or distribution would violate applicable laws or rules or would require additional documents to be
completed or registered or require any measure to be undertaken in addition to the requirements under Finnish law. Any failure to comply with these restrictions may constitute a violation of the securities laws of any such jurisdiction. This presentation is not directed to, and is not
intended for distribution to or use by, any person or entity that is a citizen or resident or located in any locality, state, country or other jurisdiction where such distribution, publication, availability or use would be contrary to law or regulation or which would require any registration or
licensing within such jurisdiction.
The shares referred to in this presentation have not been, and will not be, registered under the United States Securities Act of 1933, as amended (the “U.S. Securities Act”), or the securities laws of any state of the United States (as such term is defined in Regulation S under the U.S.
Securities Act), and may not be offered, sold or delivered, directly or indirectly, in or into the United States absent registration, except pursuant to an exemption from, or in a transaction not subject to, the registration requirements of the U.S. Securities Act and in compliance with any
applicable state and other securities laws of the United States. This presentation does not constitute an offer to sell or solicitation of an offer to buy any of the shares in the United States.
No part of this presentation, nor the fact of its distribution, should form the basis of, or be relied on in connection with, any contract or commitment or investment decision whatsoever. The information contained in this presentation has not been independently verified. No representation,
warranty or undertaking, expressed or implied, is made as to, and no reliance should be placed on, the fairness, accuracy, completeness or correctness of the information or the opinions contained herein. Neither Metso nor Outotec, nor any of their respective affiliates, advisors or
representatives or any other person, shall have any liability whatsoever (in negligence or otherwise) for any loss however arising from any use of this presentation or its contents or otherwise arising in connection with this presentation. Each person must rely on their own examination
and analysis of Metso, Outotec, their respective securities and the demerger, including the merits and risks involved. The transaction may have tax consequences for Metso shareholders, who should seek their own tax advice.
This presentation includes “forward-looking statements”. These statements may not be based on historical facts, but are statements about future expectations. When used in this presentation, the words “aims,” “anticipates,” “assumes,” “believes,” “could,” “estimates,” “expects,”
“intends,” “may,” “plans,” “should,” “will,” “would” and similar expressions as they relate to Metso Minerals, Outotec, Neles or the demerger identify certain of these forward-looking statements. Other forward-looking statements can be identified in the context in which the statements are
made. Forward-looking statements are set forth in a number of places in this presentation, including wherever this presentation include information on the future results, plans and expectations with regard to the Combined Company’s or Neles’ business, including their strategic plans
and plans on growth and profitability, and the general economic conditions. These forward-looking statements are based on present plans, estimates, projections and expectations and are not guarantees of future performance. They are based on certain expectations, which may turn
out to be incorrect. Such forward-looking statements are based on assumptions and are subject to various risks and uncertainties. Shareholders should not rely on these forward-looking statements. Numerous factors may cause the actual results of operations or financial condition of
the Combined Company or Neles to differ materially from those expressed or implied in the forward-looking statements. Neither Metso nor Outotec, nor any of their respective affiliates, advisors or representatives or any other person undertakes any obligation to review or confirm or to
release publicly any revisions to any forward-looking statements to reflect events that occur or circumstances that arise after the date of this presentation.
This presentation includes combined financial information presented for illustrative purposes only. The illustrative combined financial information of Metso Outotec are presented assuming the activities were included in the same group from the beginning of each period. The illustrative
combined Sales, Operating profit, EBITDA and Adjusted EBITA have been calculated as a sum of Metso’s and Outotec’s financial information for the year ended December 31, 2018 and for the three months ended March 31, 2019 and aligning the EBITDA and Adjusted EBITA
definitions. The illustrative combined statement of financial position information and net debt illustrate the impact of the demerger and the combination as if the transactions had taken place on March 31, 2019. The illustrative combined financial information presented herein is based on a
hypothetical situation and should not be viewed as pro forma financial information as any transactions between Metso Minerals and Outotec have not been eliminated nor have any purchase consideration, purchase price allocation, differences in accounting principles, adjustments
related to transaction costs, tax impacts and impacts of any refinancing transactions by Metso Outotec been taken into account.
This presentation contains financial information regarding the businesses and assets of Metso and Outotec and their consolidated subsidiaries. Such financial information may not have been audited, reviewed or verified by any independent accounting firm. Certain financial data included
in this presentation consists of “alternative performance measures.” These alternative performance measures, as defined by Metso and Outotec, may not be comparable to similarly-titled measures as presented by other companies, nor should they be considered as an alternative to the
historical financial results or other indicators of Metso and Outotec cash flows based on IFRS. Even though the alternative performance measures are used by the management of Metso and Outotec to assess the financial position, financial results and liquidity and these types of
measures are commonly used by investors, they have important limitations as analytical tools and should not be considered in isolation or as substitutes for analysis of Metso’s or Outotec’s financial position or results of operations as reported under IFRS.
This presentation includes estimates relating to the cost and revenue synergy benefits expected to arise from the demerger as well as the related integration costs (which are forward-looking statements), which have been prepared by Metso and Outotec and are based on a number of
assumptions and judgments. Such estimates present the expected future impact of the demerger on the Combined Company’s business, financial condition and results of operations. The assumptions relating to the estimated cost and revenue synergy benefits and related integration
costs are inherently uncertain and are subject to a wide variety of significant business, economic, and competitive risks and uncertainties that could cause the actual cost and revenue synergy benefits from the demerger, if any, and related integration costs to differ materially from the
estimates in this presentation. Further, there can be no certainty that the demerger will be completed in the manner and timeframe described in this presentation, or at all.
Outotec and Metso are Finnish companies. The transaction, including the information distributed in connection with the demerger and the related shareholder votes, is subject to disclosure, timing and procedural requirements applicable in Finland, which are different from those in the
United States. The financial information included in this presentation has been prepared in accordance with accounting standards in Finland, which may not be comparable to the financial statements or financial information applicable in the United States or by U.S. companies.
The new shares in Outotec have not been and will not be listed on a U.S. securities exchange or quoted on any inter‐dealer quotation system in the United States. Neither Outotec nor Metso intends to take any action to facilitate a market in the new shares in Outotec in the United
States.
The new shares in Outotec have not been approved or disapproved by the U.S. Securities and Exchange Commission, any state securities commission in the United States or any other regulatory authority in the United States, nor have any of the foregoing authorities passed comment
upon, or endorsed the merit of, the demerger or the accuracy or the adequacy of this presentation. Any representation to the contrary is a criminal offence in the United States.
It may be difficult for U.S. shareholders of Metso to enforce their rights and any claim they may have arising under U.S. federal or state securities laws, since Outotec and Metso are located in Finland, and all or some of their officers and directors are residents of, non-U.S. jurisdictions.
Judgements of U.S. courts are generally not enforceable in Finland. U.S. shareholders of Metso may not be able to sue Outotec or Metso or their respective officers and directors in a court in Finland for violations of the U.S. laws, including the federal securities laws, or at the least it
may prove to be difficult to evidence such claims. Further, it may be difficult to compel Outotec or Metso and their affiliates to subject themselves to the jurisdiction of a U.S. court. In addition, there is substantial doubt as to the enforceability in Finland in original actions, or in actions for
the enforcement of judgments of U.S. courts, based on the civil liability provisions of the U.S. federal securities laws.
3
Content
(Top Alignment)
Subtitles
(bottom alignment)
Page Titles
(bottom alignment
Page Content
Left Alignment Page Content
Right Alignment
Content
(Bottom Alignment)
Footnotes
(Top Alignment)
224/101/44
205/220/233
127/127/127
255/255/255
0/0/0
230/230/230
Chart 7
Chart 8
Chart 9
Chart 1
Chart 2
Chart 3
Chart 4
Chart 5
Chart 6
0/0/0
22/155/214
207/207/207
235/241/246
192/192/202
Body Text
Background
Message Box
Table Highlights
Titles
235/235/235
135/135/135
252/238/224
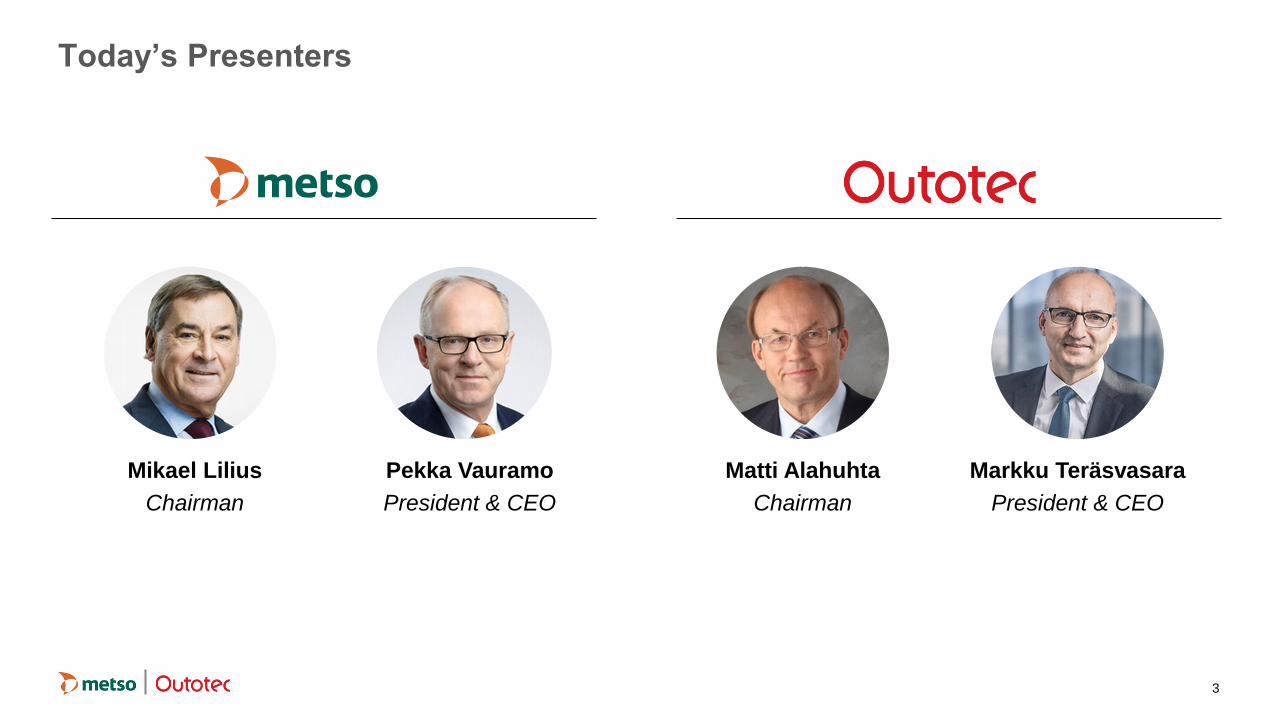
Today’s Presenters
Matti Alahuhta
Chairman
Markku Teräsvasara
President & CEO
Mikael Lilius
Chairman
Pekka Vauramo
President & CEO

4
Content
(Top Alignment)
Subtitles
(bottom alignment)
Page Titles
(bottom alignment
Page Content
Left Alignment Page Content
Right Alignment
Content
(Bottom Alignment)
Footnotes
(Top Alignment)
224/101/44
205/220/233
127/127/127
255/255/255
0/0/0
230/230/230
Chart 7
Chart 8
Chart 9
Chart 1
Chart 2
Chart 3
Chart 4
Chart 5
Chart 6
0/0/0
22/155/214
207/207/207
235/241/246
192/192/202
Body Text
Background
Message Box
Table Highlights
Titles
235/235/235
135/135/135
252/238/224
Creating Two Leading Companies…
... in Process Technology, Equipment and Services … and in Flow Control
€2.9 billion(1)
2018 Sales
€1.3 billion 2018 Sales
€4.2 billion(1)
2018 Sales
Notes 1. Including €315 million McCloskey estimated calendar year 2018 sales due to September 2018 fiscal year end
Minerals
~€600 million
2018 Sales
Neles
Flow Control
5
Content
(Top Alignment)
Subtitles
(bottom alignment)
Page Titles
(bottom alignment
Page Content
Left Alignment Page Content
Right Alignment
Content
(Bottom Alignment)
Footnotes
(Top Alignment)
224/101/44
205/220/233
127/127/127
255/255/255
0/0/0
230/230/230
Chart 7
Chart 8
Chart 9
Chart 1
Chart 2
Chart 3
Chart 4
Chart 5
Chart 6
0/0/0
22/155/214
207/207/207
235/241/246
192/192/202
Body Text
Background
Message Box
Table Highlights
Titles
235/235/235
135/135/135
252/238/224
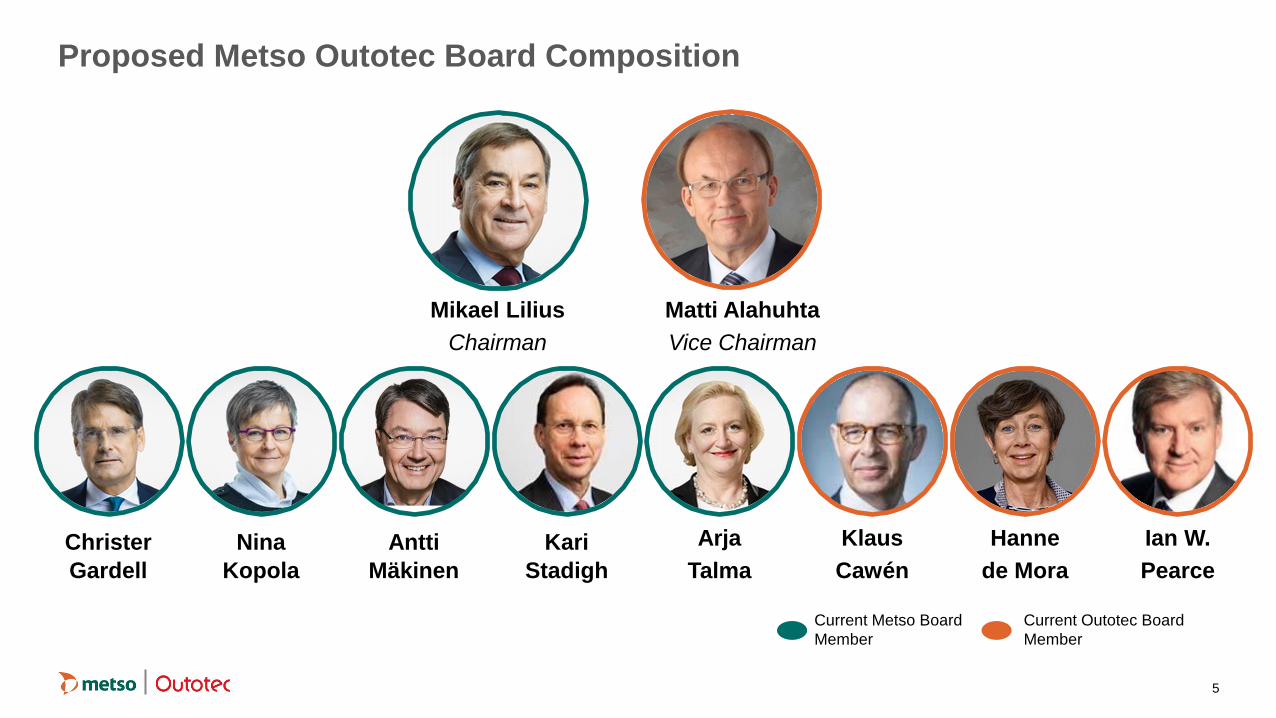
Proposed Metso Outotec Board Composition
Christer
Gardell
Nina
Kopola
Antti
Mäkinen
Kari
Stadigh
Arja
Talma
Mikael Lilius
Chairman
Matti Alahuhta
Vice Chairman
Klaus
Cawén
Hanne
de Mora
Ian W.
Pearce
Current Metso Board
Member
Current Outotec Board
Member

6
Content
(Top Alignment)
Subtitles
(bottom alignment)
Page Titles
(bottom alignment
Page Content
Left Alignment Page Content
Right Alignment
Content
(Bottom Alignment)
Footnotes
(Top Alignment)
224/101/44
205/220/233
127/127/127
255/255/255
0/0/0
230/230/230
Chart 7
Chart 8
Chart 9
Chart 1
Chart 2
Chart 3
Chart 4
Chart 5
Chart 6
0/0/0
22/155/214
207/207/207
235/241/246
192/192/202
Body Text
Background
Message Box
Table Highlights
Titles
235/235/235
135/135/135
252/238/224
Transaction Summary: All-Share Combination of Metso Minerals and
Outotec, Separate Listing of Metso Flow Control
• Combined Company to be named “Metso Outotec”
• Metso shareholders to receive 4.3 newly issued Outotec shares for 1 Metso share; Metso / Outotec shareholders to own approximately 78.0% / 22.0% of the Combined Company
• Metso to become pure-play flow control business under the name of Neles, separately listed and 100% owned by Metso shareholders
Structure, Exchange
Ratio and Ownership
• Metso Outotec:
− Chairman will be Mikael Lilius and Vice Chairman will be Matti Alahuhta
− Board Composition: 10 directors, with 6 from Metso and 4 from Outotec
− CEO: Pekka Vauramo, Deputy CEO: Markku Teräsvasara, CFO and Deputy CEO: Eeva Sipilä
Governance of Metso
Outotec and Neles
• Metso Outotec(1) combined net debt of €331 million at 31 March 2019
• Neles net cash of €45 million at 31 March 2019
• Dividend policy to be determined by the board of Metso Outotec following completion of the transaction
• Metso Outotec expected to have the capacity for an attractive dividend policy consistent with Metso’s current policy, while maintaining a strong balance sheet and aiming for an investment grade credit rating in line with current Metso rating
Capital Structure and
Dividends
• Unanimously recommended by the boards of both Metso and Outotec
• Irrevocable undertakings from shareholders representing 33.6% of Metso and 24.8% of Outotec shares
Shareholder and
Board Support
• Run-rate annual pre-tax cost synergies of at least €100 million and run-rate annual revenue synergies of at least €150 million
• Run-rate synergies expected to be fully realised by the end of the third year following completion Expected Synergies
• EGMs for Metso and Outotec are expected to be held in October 2019 • Expected closing during Q2 2020, subject to satisfaction of customary closing conditions, including shareholder approval at the EGMs of both Metso and Outotec and regulatory
approvals Timing
Notes 1. Does not include acquisition debt for McCloskey International
• Metso shareholders to receive 2018 dividend of €0.60 per share, payable in November 2019
• Metso board may propose a dividend of up to €221 million in aggregate to be payable in 2020 before closing of the transaction, implying €1.47 dividend per share
• Outotec board may propose a dividend of up to €20 million in aggregate to be payable in 2020 before closing of the transaction, implying €0.11 dividend per share
Pre-Closing
Dividends
• Neles: − CEO: Olli Isotalo

New Combined Company
Metso Outotec
A Leading Company in Process Technology,
Equipment and Services Serving the Minerals,
Metals and Aggregates Industries

8
Content
(Top Alignment)
Subtitles
(bottom alignment)
Page Titles
(bottom alignment
Page Content
Left Alignment Page Content
Right Alignment
Content
(Bottom Alignment)
Footnotes
(Top Alignment)
224/101/44
205/220/233
127/127/127
255/255/255
0/0/0
230/230/230
Chart 7
Chart 8
Chart 9
Chart 1
Chart 2
Chart 3
Chart 4
Chart 5
Chart 6
0/0/0
22/155/214
207/207/207
235/241/246
192/192/202
Body Text
Background
Message Box
Table Highlights
Titles
235/235/235
135/135/135
252/238/224
Highly Complementary Combination Leveraging the Capabilities of Metso
Minerals and Outotec
Minerals
Creation of a Unique Company in the Industry
Technology
and R&D
Product &
Process
Excellence
Scale
Global
Service
Footprint

9
Content
(Top Alignment)
Subtitles
(bottom alignment)
Page Titles
(bottom alignment
Page Content
Left Alignment Page Content
Right Alignment
Content
(Bottom Alignment)
Footnotes
(Top Alignment)
224/101/44
205/220/233
127/127/127
255/255/255
0/0/0
230/230/230
Chart 7
Chart 8
Chart 9
Chart 1
Chart 2
Chart 3
Chart 4
Chart 5
Chart 6
0/0/0
22/155/214
207/207/207
235/241/246
192/192/202
Body Text
Background
Message Box
Table Highlights
Titles
235/235/235
135/135/135
252/238/224
Overview of Metso Outotec
Minerals
Process solutions and equipment
for comminution, beneficiation,
pyroprocessing and material
handling
Equipment, spare and wear parts
and services for aggregates
production
Leading manufacturer of recycling
machinery for processing metal
scrap and shredding of waste
Complete portfolio of leading process
solutions and services, as well as full
plant delivery capability
Sustainable solutions for metals
processing, renewable energy
production and industrial water
treatment
Minerals
services
Metals, Energy & Water
Sales: ~€520 million
Recycling
Sales: ~€140 million
Minerals Processing
Sales: ~€1,550 million
Minerals Processing
Sales: ~€760 million
Services Minerals
Equipment
Recycling
Aggregates
Equipment
Metals, Energy &
Water Equipment
2018
Sales
Notes 1. Including €315 million McCloskey estimated calendar year 2018 sales due to September 2018 fiscal year end
52%
19%
19%
9%
1%
Aggregates(1)
Sales: ~€1,200 million(1)
Supported by ~15,600 employees

10
Content
(Top Alignment)
Subtitles
(bottom alignment)
Page Titles
(bottom alignment
Page Content
Left Alignment Page Content
Right Alignment
Content
(Bottom Alignment)
Footnotes
(Top Alignment)
224/101/44
205/220/233
127/127/127
255/255/255
0/0/0
230/230/230
Chart 7
Chart 8
Chart 9
Chart 1
Chart 2
Chart 3
Chart 4
Chart 5
Chart 6
0/0/0
22/155/214
207/207/207
235/241/246
192/192/202
Body Text
Background
Message Box
Table Highlights
Titles
235/235/235
135/135/135
252/238/224
4.2 4.2
3.7
2.8
2.6
1.4 1.3
Sandvik (Mining and RockTechnology)
Metso Outotec Epiroc Weir Metso Min. FLSmidth (Minerals) Outotec
Creation of a Leading Company in Process Technology, Equipment and
Services Serving the Minerals, Metals and Aggregates Industries
Key Industry Participants by 2018A Sales (€ billion)(1)
Source: Company filings Notes 1. Financials converted to EUR using 2018 calendar year average FX rates: EUR/DKK 7.4533; EUR/SEK 10.2596; EUR/GBP 0.8847; EUR/CAD 1.5297 2. Represents Sandvik’s Mining and Rock Technology segment sales. Corresponds to 43% of 2018 group sales, as per 2018 Annual Report 3. Including €315 million McCloskey estimated calendar year 2018 sales due to September 2018 fiscal year end 4. Represents 56% of 2018 group sales, as per split between Minerals (56%) and Cement (44%) in the 2018 Annual Report
(2)
(4)
Minerals
(3)
McCloskey Sales( 3)
2.9
GS to align footnotes
format, should be in ( )
See McCloskey
example

11
Content
(Top Alignment)
Subtitles
(bottom alignment)
Page Titles
(bottom alignment
Page Content
Left Alignment Page Content
Right Alignment
Content
(Bottom Alignment)
Footnotes
(Top Alignment)
224/101/44
205/220/233
127/127/127
255/255/255
0/0/0
230/230/230
Chart 7
Chart 8
Chart 9
Chart 1
Chart 2
Chart 3
Chart 4
Chart 5
Chart 6
0/0/0
22/155/214
207/207/207
235/241/246
192/192/202
Body Text
Background
Message Box
Table Highlights
Titles
235/235/235
135/135/135
252/238/224
Enlarged Installed Base Coupled with Advanced Service Offering to Drive
Significant Benefits
Minerals
Sales Contribution from Services
2018A
• Complementary footprint of service centres enabling closer proximity to customers
• Significant service sales upside
• Potential for cross-selling through combined installed base
Key Combination Benefits
Services 58%
Services 39% Services
52%
(1)
Notes 1. Adjusted for McCloskey services revenue estimate
(1)

12
Content
(Top Alignment)
Subtitles
(bottom alignment)
Page Titles
(bottom alignment
Page Content
Left Alignment Page Content
Right Alignment
Content
(Bottom Alignment)
Footnotes
(Top Alignment)
224/101/44
205/220/233
127/127/127
255/255/255
0/0/0
230/230/230
Chart 7
Chart 8
Chart 9
Chart 1
Chart 2
Chart 3
Chart 4
Chart 5
Chart 6
0/0/0
22/155/214
207/207/207
235/241/246
192/192/202
Body Text
Background
Message Box
Table Highlights
Titles
235/235/235
135/135/135
252/238/224
Wide Presence Across the Minerals Processing Value Chain
End-to-End Offering in Minerals Processing
Crushing Grinding Tailings
Handling
Dewatering Beneficiation Screening Classification

13
Content
(Top Alignment)
Subtitles
(bottom alignment)
Page Titles
(bottom alignment
Page Content
Left Alignment Page Content
Right Alignment
Content
(Bottom Alignment)
Footnotes
(Top Alignment)
224/101/44
205/220/233
127/127/127
255/255/255
0/0/0
230/230/230
Chart 7
Chart 8
Chart 9
Chart 1
Chart 2
Chart 3
Chart 4
Chart 5
Chart 6
0/0/0
22/155/214
207/207/207
235/241/246
192/192/202
Body Text
Background
Message Box
Table Highlights
Titles
235/235/235
135/135/135
252/238/224
Leadership in Technology and R&D
Yield maximisation and plant performance optimisation
Metals production from secondary raw materials and tailings
Resource
Efficiency
Energy-efficient process technologies, gas handling and heat
recovery
Solutions for significant reduction in freshwater consumption
Energy and Water
Efficiency
Remote monitoring
Process optimisation
“Digital twin”
Digital to Drive
Productivity
CO2 reduction
Emissions elimination through clean technologies Climate Change
Processes for producing lithium hydroxide for battery industry Battery Raw
Materials
Total R&D expenditure of
~€100 million across Metso
Minerals and Outotec in
2018
Decades of process and
minerals know-how
Unique R&D centres
Pilot plant capabilities
Metso Outotec Capabilities

14
Content
(Top Alignment)
Subtitles
(bottom alignment)
Page Titles
(bottom alignment
Page Content
Left Alignment Page Content
Right Alignment
Content
(Bottom Alignment)
Footnotes
(Top Alignment)
224/101/44
205/220/233
127/127/127
255/255/255
0/0/0
230/230/230
Chart 7
Chart 8
Chart 9
Chart 1
Chart 2
Chart 3
Chart 4
Chart 5
Chart 6
0/0/0
22/155/214
207/207/207
235/241/246
192/192/202
Body Text
Background
Message Box
Table Highlights
Titles
235/235/235
135/135/135
252/238/224
Sustainability at the Core of Operations
Customer Focus Points
Strong Focus on Sustainability
at Both Companies
Included in the Global
100 Index of most
sustainable companies
in the world seven
consecutive years
(2013-2019)
Minimise
environmental risks
Responsible
procurement and
productivity
Lower water
consumption
Better
environmental
efficiency
R&D projects with
sustainability
targets
Individual HSE
targets
Employee
engagement, culture
and processes
Lost time incidents
In 2018, customers
generated six million
tonnes less of CO2-e
using Outotec’s
technologies
compared to annual
baselines
86% of R&D projects
had sustainability targets
CO2 emissions
reduction in 2018
through
the use of Metso
VertimillTM
technologies
652,000 tCO2
Minerals
Mention Culture and Processes
Change to picture
Metso Truck Body
decreases fuel
consumption per hauled
ton and the rubber lining
decreases noise level by
50% and vibrations as
much as 95%

15
Content
(Top Alignment)
Subtitles
(bottom alignment)
Page Titles
(bottom alignment
Page Content
Left Alignment Page Content
Right Alignment
Content
(Bottom Alignment)
Footnotes
(Top Alignment)
224/101/44
205/220/233
127/127/127
255/255/255
0/0/0
230/230/230
Chart 7
Chart 8
Chart 9
Chart 1
Chart 2
Chart 3
Chart 4
Chart 5
Chart 6
0/0/0
22/155/214
207/207/207
235/241/246
192/192/202
Body Text
Background
Message Box
Table Highlights
Titles
235/235/235
135/135/135
252/238/224
Based on 2018 Financials
Sales by Segment
Sales by Geography
Sales by Application
Breadth Across Verticals, Geography and Application to Provide Enhanced
Performance
Notes 1. Including €315 million McCloskey estimated calendar year 2018 sales due to September 2018 fiscal year end. Sales by Application excluding Recycling 2. Other includes Non-Ferrous Minerals, Fertilizers, Fuel Minerals, Iron, Zinc and Energy and environmental solutions (incl. water, sulfuric acid and off-gas) 3. Includes Copper, Nickel, Lithium, Cobalt and Tungsten
~20% battery metals(3) ~40% battery metals(3) ~25% battery metals(3)
Minerals(1)
54% 41%
5% Minerals Processing
Aggregates
Recycling
59%
41% Minerals Processing
Metals, Energy & Water
37%
39%
24% EMEA
Americas
APAC
54% 27%
19% EMEA
Americas
APAC
42%
35%
23% EMEA
Americas
APAC
21%
14%
6%
7%
2%
1% 1%
18%
30%
CopperFerrous MetalsIndustrial MineralsPrecious MetalsAluminiumNickelLithiumOtherAggregates
35%
17% 8% 4%
3% 2%
31%
Copper
Precious Metals
Aluminium
Nickel
Lithium
Ferroalloys
Other
14%
19%
9%
2%
12%
44%
Copper
Ferrous Metals
Industrial Minerals
Precious Metals
Other
Aggregates
52%
19%
19%
9%
1% Services
Aggregates Equipment
Minerals Equipment
Metals, Energy & WaterEquipmentRecycling
(2)
(2) (2)

16
Content
(Top Alignment)
Subtitles
(bottom alignment)
Page Titles
(bottom alignment
Page Content
Left Alignment Page Content
Right Alignment
Content
(Bottom Alignment)
Footnotes
(Top Alignment)
224/101/44
205/220/233
127/127/127
255/255/255
0/0/0
230/230/230
Chart 7
Chart 8
Chart 9
Chart 1
Chart 2
Chart 3
Chart 4
Chart 5
Chart 6
0/0/0
22/155/214
207/207/207
235/241/246
192/192/202
Body Text
Background
Message Box
Table Highlights
Titles
235/235/235
135/135/135
252/238/224
Significant Cost Synergy Opportunities…
At least €100
million run-rate
annual pre-tax
cost synergies
Full realisation
expected by the
end of the third
year following
completion
~60%
of Run-Rate Operations
Procurement
• HQ and administration
• Footprint
• Service utilisation
• IS / IT
• Supply chain optimisation
• Leveraging combined scale
~40%
of Run-Rate
• Implementation costs estimated at ~€100
million to be largely incurred in the first 12-
24 months post-closing
• Well-defined synergy targets
• Integration process to leverage the best
talent from both Metso Minerals and
Outotec businesses
• Implementation to minimise disruption to the
Combined Company's operations and
customers
• Executive oversight with clear priorities
Established Integration Framework
17
Content
(Top Alignment)
Subtitles
(bottom alignment)
Page Titles
(bottom alignment
Page Content
Left Alignment Page Content
Right Alignment
Content
(Bottom Alignment)
Footnotes
(Top Alignment)
224/101/44
205/220/233
127/127/127
255/255/255
0/0/0
230/230/230
Chart 7
Chart 8
Chart 9
Chart 1
Chart 2
Chart 3
Chart 4
Chart 5
Chart 6
0/0/0
22/155/214
207/207/207
235/241/246
192/192/202
Body Text
Background
Message Box
Table Highlights
Titles
235/235/235
135/135/135
252/238/224
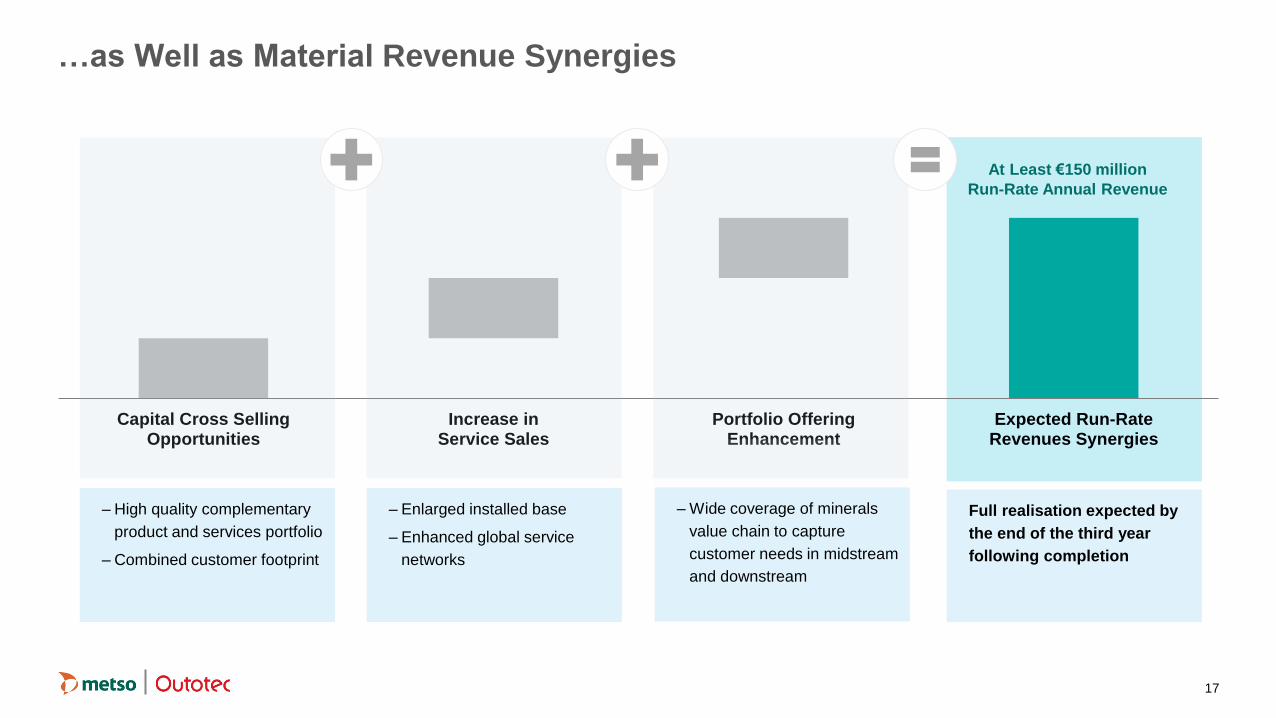
Capital Cross SellingOpportunities
Increase inService Sales
Portfolio OfferingEnhancement
Expected Run-RateRevenues Synergies
…as Well as Material Revenue Synergies
At Least €150 million
Run-Rate Annual Revenue
– High quality complementary
product and services portfolio
– Combined customer footprint
– Enlarged installed base
– Enhanced global service
networks
– Wide coverage of minerals
value chain to capture
customer needs in midstream
and downstream
Full realisation expected by
the end of the third year
following completion

18
Content
(Top Alignment)
Subtitles
(bottom alignment)
Page Titles
(bottom alignment
Page Content
Left Alignment Page Content
Right Alignment
Content
(Bottom Alignment)
Footnotes
(Top Alignment)
224/101/44
205/220/233
127/127/127
255/255/255
0/0/0
230/230/230
Chart 7
Chart 8
Chart 9
Chart 1
Chart 2
Chart 3
Chart 4
Chart 5
Chart 6
0/0/0
22/155/214
207/207/207
235/241/246
192/192/202
Body Text
Background
Message Box
Table Highlights
Titles
235/235/235
135/135/135
252/238/224
Solid Capital Structure and Attractive Dividend Policy
Notes 1. Does not include acquisition debt for McCloskey International
• Metso Outotec(1) with illustrative combined net debt of €331 million at 31 March 2019
• Metso Outotec to benefit from strong free cash flow, a solid capital structure and will aim for an investment grade credit rating in line with current Metso rating Capital Structure
• Metso to seek certain consents, waivers and amendments in respect of bonds outstanding at the time of the combination
• Bonds to become obligations of Metso Outotec, in accordance with demerger plan
• €1.55 billion backup facilities have been agreed with Nordea Bank Abp for the benefit of Metso and subsequently Metso Outotec in connection with the transaction
Financing
• Dividend policy to be determined by the board of Metso Outotec following completion of the transaction
• Metso Outotec expected to have the capacity for an attractive dividend policy, consistent with Metso’s current policy, while maintaining a strong balance sheet Dividend Policy
• Metso shareholders to receive previously declared 2018 dividend of €0.60 per share, payable in November 2019
• Metso board may propose a dividend of up to €221 million in aggregate to be payable in 2020 before closing of the transaction, implying €1.47 dividends per share
• Outotec board may propose a dividend of up to €20 million in aggregate to be payable in 2020 before closing of the transaction, implying €0.11 dividends per share
Pre-Closing
Dividends

19
Content
(Top Alignment)
Subtitles
(bottom alignment)
Page Titles
(bottom alignment
Page Content
Left Alignment Page Content
Right Alignment
Content
(Bottom Alignment)
Footnotes
(Top Alignment)
224/101/44
205/220/233
127/127/127
255/255/255
0/0/0
230/230/230
Chart 7
Chart 8
Chart 9
Chart 1
Chart 2
Chart 3
Chart 4
Chart 5
Chart 6
0/0/0
22/155/214
207/207/207
235/241/246
192/192/202
Body Text
Background
Message Box
Table Highlights
Titles
235/235/235
135/135/135
252/238/224
A Complementary and Compelling Combination for Stakeholders
Scale and
Breadth
• Combination of two highly complementary global businesses with wide presence across the value chain
• Enlarged installed base and enhanced services focus
• Strong presence across verticals, geography and applications
Technology
and R&D
• Leverage combined group’s technology and R&D
• Sustainability at the core of Metso Outotec’s customer offering and operations
People and
Governance
• Strong cultural fit, including customer focus and innovation
• Greater scale offers opportunities for industry experts
• Experienced board and management
Attractive
Shareholder
Returns
• Significant revenue and cost synergies
• Strong balance sheet
• Attractive dividend profile

Neles
A Leading Pure-Play
Flow Control Company
21
Content
(Top Alignment)
Subtitles
(bottom alignment)
Page Titles
(bottom alignment
Page Content
Left Alignment Page Content
Right Alignment
Content
(Bottom Alignment)
Footnotes
(Top Alignment)
224/101/44
205/220/233
127/127/127
255/255/255
0/0/0
230/230/230
Chart 7
Chart 8
Chart 9
Chart 1
Chart 2
Chart 3
Chart 4
Chart 5
Chart 6
0/0/0
22/155/214
207/207/207
235/241/246
192/192/202
Body Text
Background
Message Box
Table Highlights
Titles
235/235/235
135/135/135
252/238/224
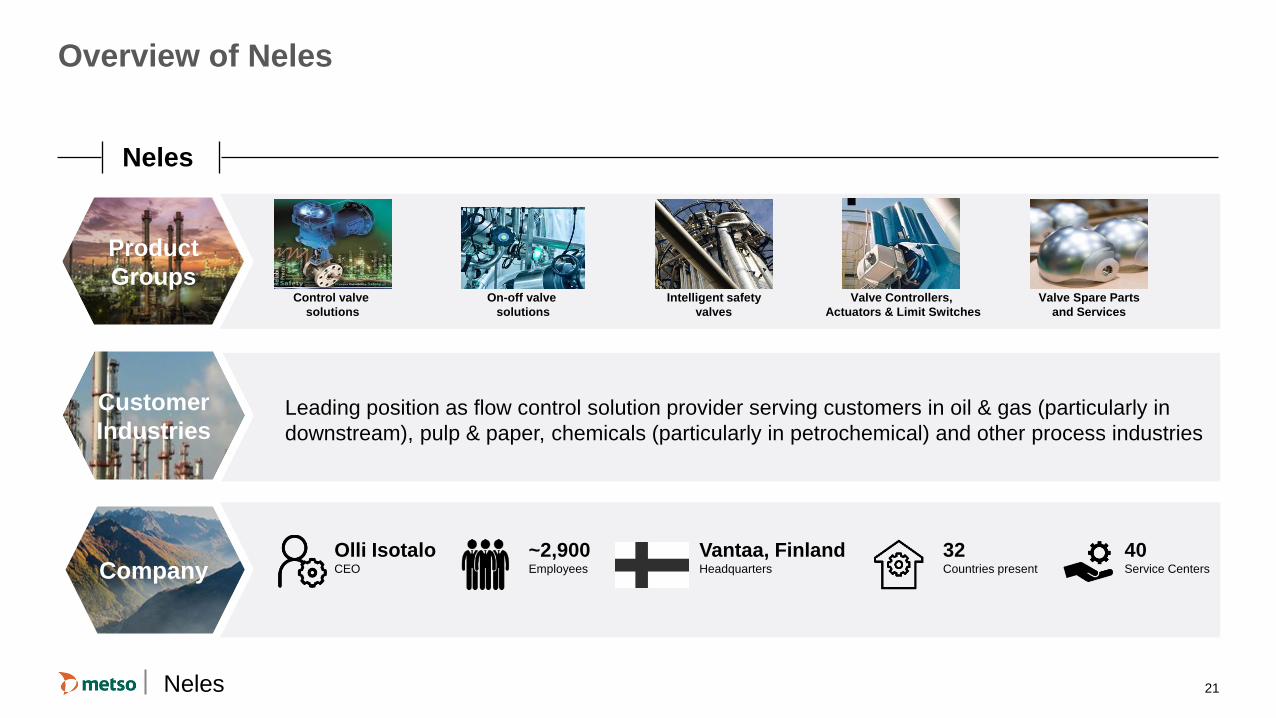
Overview of Neles
Leading position as flow control solution provider serving customers in oil & gas (particularly in
downstream), pulp & paper, chemicals (particularly in petrochemical) and other process industries
Customer
Industries
Company ~2,900 Employees
Vantaa, Finland Headquarters
Olli Isotalo CEO
32 Countries present
40 Service Centers
Neles
Product
Groups Control valve
solutions
On-off valve
solutions
Intelligent safety
valves
Valve Controllers,
Actuators & Limit Switches
Valve Spare Parts
and Services
Neles
22
Content
(Top Alignment)
Subtitles
(bottom alignment)
Page Titles
(bottom alignment
Page Content
Left Alignment Page Content
Right Alignment
Content
(Bottom Alignment)
Footnotes
(Top Alignment)
224/101/44
205/220/233
127/127/127
255/255/255
0/0/0
230/230/230
Chart 7
Chart 8
Chart 9
Chart 1
Chart 2
Chart 3
Chart 4
Chart 5
Chart 6
0/0/0
22/155/214
207/207/207
235/241/246
192/192/202
Body Text
Background
Message Box
Table Highlights
Titles
235/235/235
135/135/135
252/238/224
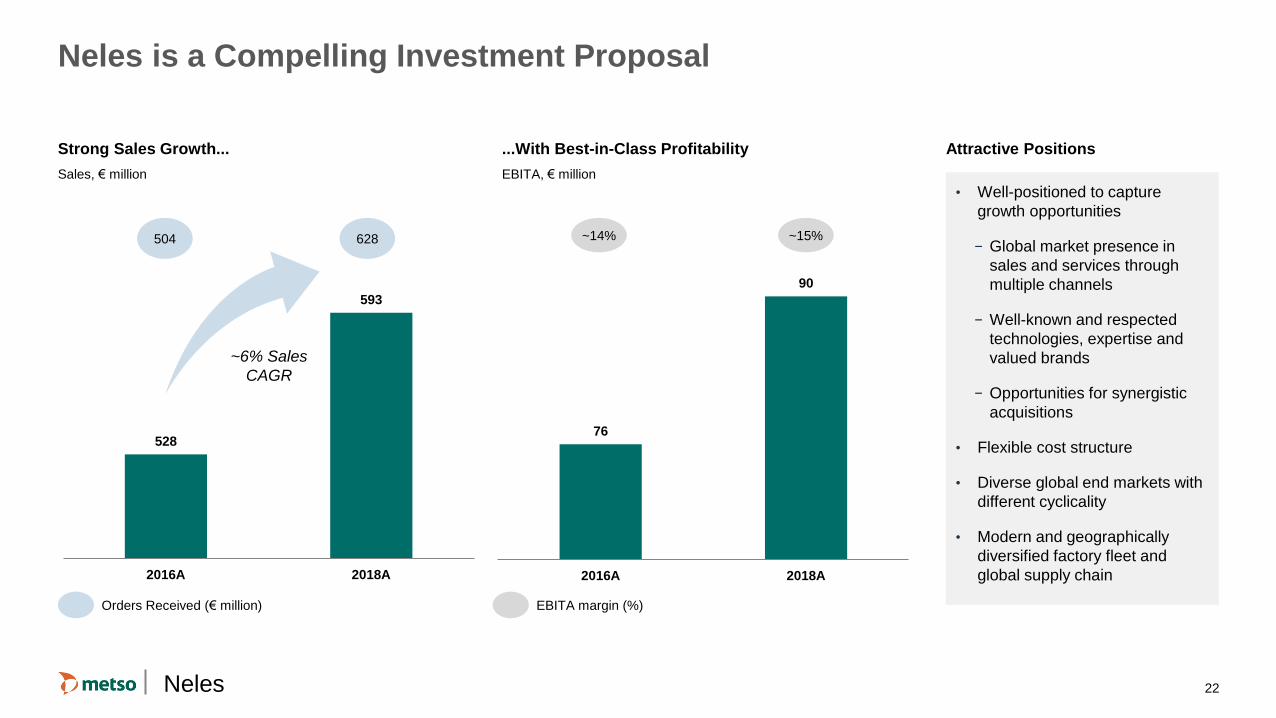
Neles is a Compelling Investment Proposal
• Well-positioned to capture
growth opportunities
− Global market presence in
sales and services through
multiple channels
− Well-known and respected
technologies, expertise and
valued brands
− Opportunities for synergistic
acquisitions
• Flexible cost structure
• Diverse global end markets with
different cyclicality
• Modern and geographically
diversified factory fleet and
global supply chain
528
593
2016A 2018A
~6% Sales
CAGR
504 628
76
90
2016A 2018A
~14% ~15%
Neles
Orders Received (€ million) EBITA margin (%)
Strong Sales Growth...
Sales, € million
...With Best-in-Class Profitability
EBITA, € million
Attractive Positions

23
Content
(Top Alignment)
Subtitles
(bottom alignment)
Page Titles
(bottom alignment
Page Content
Left Alignment Page Content
Right Alignment
Content
(Bottom Alignment)
Footnotes
(Top Alignment)
224/101/44
205/220/233
127/127/127
255/255/255
0/0/0
230/230/230
Chart 7
Chart 8
Chart 9
Chart 1
Chart 2
Chart 3
Chart 4
Chart 5
Chart 6
0/0/0
22/155/214
207/207/207
235/241/246
192/192/202
Body Text
Background
Message Box
Table Highlights
Titles
235/235/235
135/135/135
252/238/224
Overview of Neles’ End Markets
Neles
Notes 1. Maintenance, repairs and operations
Recent
Development
Oil & Gas 37%
Chemicals 22%
Pulp & Paper 27%
Other Industries
14%
Sales Split by End Markets
Global Market
Drivers
Oil and gas upstream, midstream and downstream Opex and
Capex
Pulp & paper and bioproducts Opex and Capex
Petrochemicals and Other Chemicals Opex and Capex
Flow Control End Markets Have Strong Long-Term Growth Potential
Strong Long-Term Market Drivers
2018A
Overall process industry Opex and Capex
24
Content
(Top Alignment)
Subtitles
(bottom alignment)
Page Titles
(bottom alignment
Page Content
Left Alignment Page Content
Right Alignment
Content
(Bottom Alignment)
Footnotes
(Top Alignment)
224/101/44
205/220/233
127/127/127
255/255/255
0/0/0
230/230/230
Chart 7
Chart 8
Chart 9
Chart 1
Chart 2
Chart 3
Chart 4
Chart 5
Chart 6
0/0/0
22/155/214
207/207/207
235/241/246
192/192/202
Body Text
Background
Message Box
Table Highlights
Titles
235/235/235
135/135/135
252/238/224
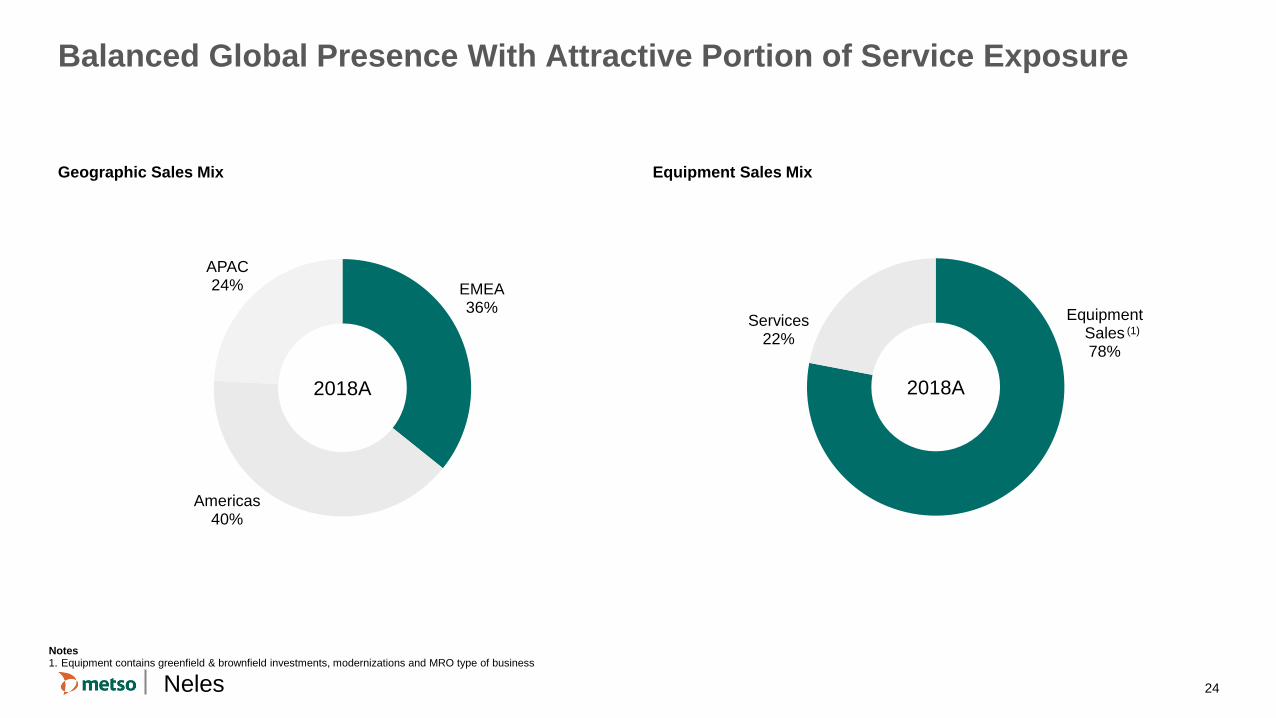
Balanced Global Presence With Attractive Portion of Service Exposure
Geographic Sales Mix Equipment Sales Mix
Neles
EMEA 36%
Americas 40%
APAC 24%
2018A
Equipment Sales 78%
Services 22%
2018A
(1)
Notes 1. Equipment contains greenfield & brownfield investments, modernizations and MRO type of business

25
Content
(Top Alignment)
Subtitles
(bottom alignment)
Page Titles
(bottom alignment
Page Content
Left Alignment Page Content
Right Alignment
Content
(Bottom Alignment)
Footnotes
(Top Alignment)
224/101/44
205/220/233
127/127/127
255/255/255
0/0/0
230/230/230
Chart 7
Chart 8
Chart 9
Chart 1
Chart 2
Chart 3
Chart 4
Chart 5
Chart 6
0/0/0
22/155/214
207/207/207
235/241/246
192/192/202
Body Text
Background
Message Box
Table Highlights
Titles
235/235/235
135/135/135
252/238/224
11.8x
23.9x
17.0x
15.1x 14.3x
12.6x 12.4x 11.7x
11.1x
Enterprise Value / EBIT(1)
2020E
Notes 1. Source: Capital IQ as of 2 July 2019
Crystalising Value Potential Through Re-rating Compared to
Flow Control Peers
Neles

26
Content
(Top Alignment)
Subtitles
(bottom alignment)
Page Titles
(bottom alignment
Page Content
Left Alignment Page Content
Right Alignment
Content
(Bottom Alignment)
Footnotes
(Top Alignment)
224/101/44
205/220/233
127/127/127
255/255/255
0/0/0
230/230/230
Chart 7
Chart 8
Chart 9
Chart 1
Chart 2
Chart 3
Chart 4
Chart 5
Chart 6
0/0/0
22/155/214
207/207/207
235/241/246
192/192/202
Body Text
Background
Message Box
Table Highlights
Titles
235/235/235
135/135/135
252/238/224
Neles: A Highly Attractive Investment Opportunity
Leading position as a flow control solution provider with market leadership across pulp & paper valves and down stream oil & gas control valves
Continued outperformance of market growth with best-in-class profitability and proven resilience through the cycle
Solid balance sheet and financial position
Diversified sales mix both by region and industry
A fully focused, dedicated management to deliver shareholder value and leverage further growth opportunities
Crystallisation of attractive sector trading multiples
Neles

Conclusion
Neles

28
Content
(Top Alignment)
Subtitles
(bottom alignment)
Page Titles
(bottom alignment
Page Content
Left Alignment Page Content
Right Alignment
Content
(Bottom Alignment)
Footnotes
(Top Alignment)
224/101/44
205/220/233
127/127/127
255/255/255
0/0/0
230/230/230
Chart 7
Chart 8
Chart 9
Chart 1
Chart 2
Chart 3
Chart 4
Chart 5
Chart 6
0/0/0
22/155/214
207/207/207
235/241/246
192/192/202
Body Text
Background
Message Box
Table Highlights
Titles
235/235/235
135/135/135
252/238/224
Indicative Key Transaction Milestones
• Initiation of regulatory review
• Publication of demerger prospectus
• Metso and Outotec EGMs
• Metso and Outotec 2019 dividend payment
• Expected closing
Q3 2019
October 2019
March 2020
Q2 2020

29
Content
(Top Alignment)
Subtitles
(bottom alignment)
Page Titles
(bottom alignment
Page Content
Left Alignment Page Content
Right Alignment
Content
(Bottom Alignment)
Footnotes
(Top Alignment)
224/101/44
205/220/233
127/127/127
255/255/255
0/0/0
230/230/230
Chart 7
Chart 8
Chart 9
Chart 1
Chart 2
Chart 3
Chart 4
Chart 5
Chart 6
0/0/0
22/155/214
207/207/207
235/241/246
192/192/202
Body Text
Background
Message Box
Table Highlights
Titles
235/235/235
135/135/135
252/238/224
Creating Two Leading Companies…
... in Process Technology, Equipment and Services … and in Flow Control
€2.9 billion(1)
2018 Sales
€1.3 billion 2018 Sales
€4.2 billion(1)
2018 Sales
Notes 1. Including €315 million McCloskey estimated calendar year 2018 sales due to September 2018 fiscal year end
Minerals
~€600 million
2018 Sales
Neles
Flow Control

30
Content
(Top Alignment)
Subtitles
(bottom alignment)
Page Titles
(bottom alignment
Page Content
Left Alignment Page Content
Right Alignment
Content
(Bottom Alignment)
Footnotes
(Top Alignment)
224/101/44
205/220/233
127/127/127
255/255/255
0/0/0
230/230/230
Chart 7
Chart 8
Chart 9
Chart 1
Chart 2
Chart 3
Chart 4
Chart 5
Chart 6
0/0/0
22/155/214
207/207/207
235/241/246
192/192/202
Body Text
Background
Message Box
Table Highlights
Titles
235/235/235
135/135/135
252/238/224
Appendix
31
Content
(Top Alignment)
Subtitles
(bottom alignment)
Page Titles
(bottom alignment
Page Content
Left Alignment Page Content
Right Alignment
Content
(Bottom Alignment)
Footnotes
(Top Alignment)
224/101/44
205/220/233
127/127/127
255/255/255
0/0/0
230/230/230
Chart 7
Chart 8
Chart 9
Chart 1
Chart 2
Chart 3
Chart 4
Chart 5
Chart 6
0/0/0
22/155/214
207/207/207
235/241/246
192/192/202
Body Text
Background
Message Box
Table Highlights
Titles
235/235/235
135/135/135
252/238/224
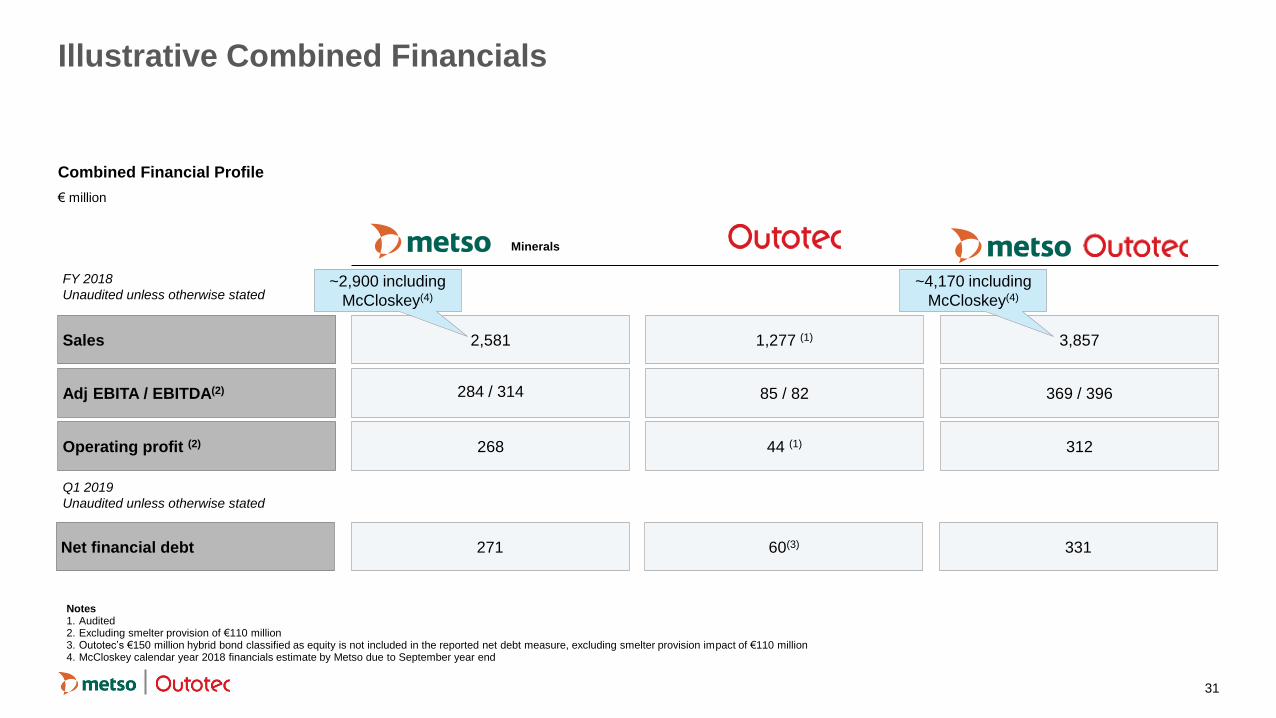
Illustrative Combined Financials
Combined Financial Profile
€ million
Notes 1. Audited 2. Excluding smelter provision of €110 million 3. Outotec’s €150 million hybrid bond classified as equity is not included in the reported net debt measure, excluding smelter provision impact of €110 million 4. McCloskey calendar year 2018 financials estimate by Metso due to September year end
FY 2018
Unaudited unless otherwise stated
Sales 2,581 1,277 (1) 3,857
Adj EBITA / EBITDA(2) 284 / 314 85 / 82 369 / 396
Operating profit (2) 268 44 (1) 312
Minerals
~2,900 including
McCloskey(4)
~4,170 including
McCloskey(4)
Net financial debt 271 60(3) 331
Q1 2019
Unaudited unless otherwise stated