combinations of type 1 diabetes, celiac disease and ...455275/fulltext01.pdfl inkÖping u niversity...
TRANSCRIPT

LINKÖPING UNIVERSITY MEDICAL DISSERTATIONS
NO 1277
Combinations of type 1 diabetes, celiac disease and allergy -
An immunological challenge
Anna Kivling
Division of Pediatrics
Department of Clinical and Experimental Medicine
Faculty of Health Sciences, Linköping University
SE-581 85 Linköping
Linköping 2011

©Anna Kivling
Cover design by Anna and Helle Kivling.
ISBN: 978-91-7393-021-5
ISSN 0345-0082
Ownership of copyright for paper I and III remains with the authors.
Paper I was originally published by John Wiley & Sons, Inc.
Paper III was originally published by Elsevier BV.
Paper IV has been reprinted with kind permission from John Wiley & Sons, Inc.
During the course of the research underlying this thesis, Anna Kivling was enrolled in
Forum Scientium, a multidisciplinary doctoral programme at Linköping University,
Sweden.
Printed by LiU-tryck, Linköping 2011

What if everything around you
Isn't quite as it seems?
What if all the world you think you know
Is an elaborate dream?
And if you look at your reflection
Is it all you want it to be?
What if you could look right through the cracks?
Would you find yourself
Find yourself afraid to see?
Right where it belongs, Trent Reznor
NiN album With teeth, 2005
To me, myself, and I. With love.


Abstract
The immune system is composed of a complex network of different cell types
protecting the body against various possible threats. Among these cells are T-helper
(Th) cells type 1 (Th1) and type 2 (Th2), as well as T regulatory (Treg) cells. Th1 and Th2
are supposed to be in balance with each other, while Tregs regulate the immune
response, by halting it when the desired effect, i.e. destroying the threat, is acquired.
However, sometimes this intricate interplay in the immune system is disturbed,
leading to diseases as type 1 diabetes (T1D), celiac disease or allergic disease. According
to the paradigm claiming that Th1- and Th2-cells inhibit each other a coexistence of a
Th1-deviated disease and a Th2-deviated disease seems unlikely.
This thesis aimed to examine the immune response with focus on subsets of T-cells in
children with T1D, celiac disease, allergy, or a combination of two of these diseases, in
comparison to reference children (healthy).
In line with previous findings we observed that children with celiac disease showed a
decreased spontaneous Th2-associated secretion, whereas children with allergic
disease showed increased birch- and cat-induced Th2-associated response.
The most remarkable results in this thesis are those observed in children with
combinations of diseases. The combination of T1D and celiac disease decreased the
Th1-associated response against several antigens, but instead displayed a more
pronounced Treg-associated response. Further, in children with combined T1D and
allergy an increased Th1- and Th2-associated response was seen to a general stimulus,
and an increased birch-induced Th1-, Th2-, Treg- and pro-inflammatory response. In
contrast, the combination of allergy and celiac disease showed a decreased
spontaneous Th1-, Th2-, Treg- and pro-inflammatory response.
In conclusion, we observed that two Th1-deviated diseases in combination suppress the
immune response and increase the regulatory activity. Further it seems that allergy has
the ability to shift the immune response in diverging directions depending on which
disease it is combined with. The observed suppressive effect might be due to
exhaustion of the immune system from the massive pressure of two immunological
diseases in combination, while the pronounced Treg response might be caused by an
attempt to compensate for the dysfunction. These results shed some light on the
intriguing and challenging network that constitutes the immune system, and hopefully
give clues regarding disease prevention and treatment.

Populärvetenskaplig sammanfattning
I immunförsvaret finns ett flertal olika celltyper som samarbetar för att skydda
kroppen mot potentiellt skadliga ämnen. Bland dessa finns T-hjälpar celler (Th) av typ
1 och 2, vars uppgift är att hjälpa andra celler att utföra sina uppgifter. Th1- och Th2-
celler tros vara i balans med varandra, och hämmar därför vid behov varandra. De
reglerande T-cellerna (Treg) har istället en reglerande effekt med uppgift att bromsa
immunförsvaret i tid för att undvika skada på kroppens egna celler. Ibland störs
balansen, vilket kan leda till olika sjukdomar, som de autoimmuna sjukdomarna typ 1-
diabetes (T1D) och celiaki men också uppkomst av allergi. Givet den balans som råder
mellan Th1 och Th2, borde det vara ovanligt med att en sjukdom med Th1-inslag ska
kunna existera tillsammans med en med Th2-inslag, men denna kombination av
sjukdomar är inte ovanligare än vad som är förväntat i befolkningen.
Denna avhandling syftar till att studera immunsvaret med fokus på olika undergrupper
av T-celler (bla Th1, Th2 och Treg), hos barn med T1D, celiaki och allergi, samt även
kombinationer av två av dessa sjukdomar, men även jämfört med friska barn .
Vi fann att barn med celiaki, en sjukdom med Th1-inslag, enligt förväntan reagerade
med ett lågt Th2-svar, och att barn med allergi, en sjukdom med Th2-inslag, reagerade
starkt mot både björk och katt, också det enligt våra förväntningar.
Immunförsvaret hos barn med kombinationer av dessa immunologiska sjukdomar har
inte utforskats i någon stor utsträckning, och der är här vi fann de mest oväntade
resultaten. Vi fann att barn med kombinationen av T1D och celiaki uppvisar både ett
minskat Th1-svar mot ett flertal ämnen, samt ett mer uttalat Treg-svar. Barn med
allergi verkar också ha förmågan att förskjuta immunförsvaret i olika riktningar
beroende på vilken annan sjukdom de kombineras med. Kombinationen av T1D och
allergi ger upphov till ett ökat Th1, Th2 samt Treg-svar mot björk, medan
kombinationen av celiaki och allergi istället ger upphov till ett minskat spontant Th1-,
Th2- samt Treg-svar.

Sammanfattningsvis tyder våra resultat på att två sjukdomar med Th1-inslag trycker
ned immunförsvaret, men ökar den reglerande aktiviteten. Dessutom verkar allergi
kunna förskjuta immunförsvaret i olika riktningar beroende på vilken annan sjukdom
den kombineras med. Det nedtryckta svar vi ser kan bero på att immunförsvaret är
utmattat från det tryck som är följden av att bära på har två immunologiska
sjukdomar. Den mer uttalade reglerande effekten kan dessutom komma sig av att
immunförsvaret försöker kompensera för den störda balansen. Förhoppningsvis kan
dessa resultat sprida lite ljus över det intrikata nätverk immunförsvaret består av samt
även ha effekt på prevention och behandling.

Contents
Original Publications ................................................................................................. 5
Abbrevations .............................................................................................................. 7
Review of the literature ........................................................................................... 13
Introduction to the immune system ................................................................... 13
T-helper cells .................................................................................................... 13
Disturbance in Th1-Th2-Treg balance ............................................................ 15
Regulatory T-cells ............................................................................................ 15
Cytokines and chemokines .............................................................................. 18
Type 1 diabetes ......................................................................................................... 19
Pathogenesis and epidemiology .......................................................................... 19
Immunology ........................................................................................................ 20
Celiac disease ........................................................................................................... 22
Pathogenesis and epidemiology .......................................................................... 22
Immunology .........................................................................................................24
Allergy....................................................................................................................... 27
Pathogenesis and epidemiology .......................................................................... 27
Immunology ........................................................................................................ 28
Combinations of Type 1 diabetes, Celiac disease and Allergy ............................... 30
Combination of type 1 diabetes and celiac disease ............................................ 30
Combination of type 1 diabetes and allergy ....................................................... 31
Children with combination of celiac disease and allergy .................................. 31
Cryopreservation ...................................................................................................... 33
Aims of the thesis .................................................................................................... 35

Material and methods ............................................................................................. 37
Study population .................................................................................................. 37
Paper 1 ............................................................................................................... 38
Paper II ............................................................................................................. 39
Paper III ............................................................................................................ 39
Paper IV ........................................................................................................... 40
Paper V............................................................................................................. 40
Diagnostic criteria ............................................................................................ 41
Laboratory analyses .............................................................................................42
Isolation and in vitro stimulation of peripheral blood mononuclear cells ..42
Freezing, thawing and in vitro stimulation of PBMC (paper III) .................. 43
Collection of PBMC and cell supernatants (paper II, III and IV) .................. 45
Enzyme linked immunospot (ELIspot) (paper I) ........................................... 45
Multiplex fluorochrome technique (Luminex) (paper II) .............................47
Real-time reversed-transcriptase polymerase chain reaction (RT-PCR)
(paper III and IV) .............................................................................................50
Enzyme linked immunosorbent assay (ELISA) (paper III) ............................ 52
Flow cytometry ................................................................................................. 52
Statistical analyses ........................................................................................... 54
Ethics ................................................................................................................ 55
Results and Discussion ............................................................................................ 57
Children with T1D showed a decreased spontaneous IL-15 secretion and a
decreased spontaneous and PHA-induced expression of FOXP3 ..................... 57

Children with celiac disease showed decreased spontaneous IL-4 and IL-15
secretion but an increased expression of spontaneous, insulin-, gluten- and
PHA-induced FOXP3 ........................................................................................... 61
Children with allergy showed an increased birch- and cat-induced IL-4
secretion, an increased spontaneous IFN-γ, IL-10 and IL-12 secretion .............65
Children with a combination of T1D and celiac disease showed a decreased
inhalant- and food-antigen-induced IFN-γ secretion, however an increased
Treg-associated response ................................................................................... 70
Children with a combination of T1D and allergy showed an increased PHA-
induced IFN-γ and IL-4 secretion, as well as an increased birch-induced
secretion of several cytokines ..............................................................................74
Children with a combination of celiac disease and allergy showed a decreased
spontaneous secretion of several cytokines ...................................................... 78
Methodological data ........................................................................................... 80
Summary and Conclusion ...................................................................................... 86
Future perspectives ................................................................................................. 89
Acknowledgement ................................................................................................... 91
References ............................................................................................................... 95

~ 4~

~ 5~
ORIGINAL PUBLICATIONS
This thesis is based on the following papers, which will be referred to in the text by
their Roman numerals.
I: Combinations of common paediatric diseases deviate the immune response in
diverging directions
Nilsson L, Kivling A, Jalmelid M, Fälth-Magnusson K, Faresjö M
Clinical and Experimental Immunology. 2006; 146: 433-42
II: Diverging immune responses when allergy, type 1 diabetes and celiac disease coexist
Kivling A, Nilsson L, Åkesson K, Fälth-Magnusson K, Faresjö M
Manuscript
III: How and when to pick up the best signals from markers associated with T-
regulatory cells?
Kivling A, Nilsson L, Faresjö M
Journal of Immunological Methods, 2009; 345: 29-39
IV: Diverse foxp3 expression in children with type 1 diabetes and celiac disease
Kivling A, Nilsson M, Fälth-Magnusson K, Söllvander S, Johansson C, Faresjö M
Annals of the New York Academy of Sciences. 2008; 1150;273-277
V: Combined type 1 diabetes and celiac disease in children give raise to a more
pronounced Treg population
Kivling A, Åkesson K, Nilsson L, Faresjö M
Manuscript

~ 6~

~ 7 ~
ABBREVIATIONS
AGA Anti-gliadin antibody
AP Alkaline phosphatase
APC Allophycocyanin
BAL Bronchoalveolar lavage
βLG β-lactoglobulin
BSA Bovine serum albumin
cDNA Complementary DNA
Ct Cycle threshold
CTLA-4 Cytotoxic T-lymphocyte antigen-4
Cy Cyanin
DC Dendritic cells
DMSO Dimethyl sulfoxide
dNTP Deoxyribonucleotide triphosphate
ELISA Enzyme linked immunosorbent assay
ELIspot Enzyme linked immunospot
EMA Endomysial antibody
ESPGAN The European Society of Paediatric Gastroenterology and Nutrition
ESPGHAN The European Society of Paediatric Gastroenterology, hepatology
and Nutrition

~ 8 ~
FCS Fetal calf serum
FSC Forward scatter
FGF Fibro blast growth factor
FITC Fluorescein isothiocyanate
FOXP3 Forkhead box protein 3
GAD Glutamic acid decarboxylase
G-CSF Granulocyte colony-stimulating factor
GFD Gluten free diet
GM-CSF Granulocyte macrophage colony-stimulating factor
HbA1c Hemoglobin A1c
HCl Hydrochloric acid
HLA Human leukocyte antigen
IA-2 Thyrosinphosphatase
IEL Intraepithelial lymphocytes
IFN Interferon
Ig Immunoglobulin
IL Interleukin
IL-1ra IL-1 receptor antagonist
IL-2RA IL-2 receptor alpha
IMDM Iscove´s modification of Dulbeccos medium
ISAAC International Study of Asthma and Allergies in Childhood

~ 9~
LPS Lipopolysaccharide
MFI Median fluorescence intensity
mRNA Messenger RNA
NK Natural killer
NOD Non-obese diabetic
nTreg Naturally occurring regulatory T-cell
OD Optic density
OVA Ovalbumin
PBMC Peripheral blood mononuclear cells
PBS Phosphate buffered saline
PDGF Platelet-derived growth factor
PE Phycoerythrin
PerCP Peridinin-chlorophyll proteins
PHA Phytohaemagglutinin
PTPN22 Protein tyrosine phosphatase, non-receptor type 22
rRNA Ribosomal RNA
RT Room temperature
RT-PCR Reversed transcriptase polymerase chain reaction
sCTLA-4 Soluble cytotoxic T-lymphocyte antigen-4
SIT Specific immunotherapy
SPT Skin prick test

~ 10~
SSC Side scatter
T1D Type 1 diabetes
Tc Cytotoxic T-cell
TGF Tumor Growth Factor
Th T-helper
TNF Tumor necrosis factor
TR1 T-regulatory cells 1
Treg Regulatory T-cell
TT Tetanus toxoid
tTG Tissue transglutaminse
tTGA Tissue translutaminase antibody
VEGF Vascular endothelial growth factor
ZnT8 Zinc transporter 8

~ 11~
CHEMOKINE NOMENCLATURE
The four different groups of chemokines are C-X-C, C-C, C and C-X3-C,
indicating number and spacing of conserved cysteines [1]. The letter “L”
indicates a ligand whereas the letter “R” indicates receptor[2].
CXCL9=MIG
CXCL10=IP-10
CXCL11=I-TAC
CCL3=MIP1α
CCL4=MIP1β
CCL5=RANTES
CCL7=MCP-3
CCL11=Eotaxin
CCL2=MCP-1
CCL17=TARC
CCL1=I-309
CXCL8=IL-8

~ 12~

~ 13~
REVIEW OF THE LITERATURE
Introduction to the immune system
The word immunity comes from the Latin word “immunis”, meaning exempt.
The immunological science is believed to originate from Jenner who discovered
that cowpox could be used as vaccine against human smallpox; however it was
not until late 19th century that microorganisms were identified as the cause for
infections. The function of the immune system is to protect the body from any
foreign, and possibly harmful invader, like viruses, bacteria, fungi, parasites and
tumors [3]. The immune response is generally divided into innate and adaptive
immunity. The innate immunity, or non-specific, is the first line of defense,
including physical barriers as well as monocytes, dendritic cells (DC),
granulocytes, macrophages and natural killer (NK) cells. Adaptive immunity
consists of highly specialized lymphocytes; T-helper (Th) cells, cytotoxic T-cells
(Tc) and B-cells. The adaptive immunity is long-lasting in contrast to the innate
immunity.
T-helper cells
Several cells cooperate in the immune system in order to protect the body from
and defeat possible harmful threats. In 1980´s Mossman et. al. [4] presented a
murine model describing two types of Th-cells, Th1 and Th2 respectively, with
different cytokine and chemokine patterns, and consequently different
functions. T-helper-1 cells secrete e.g. the cytokines interleukin (IL)-2, tumor
necrosis factor (TNF)-β and interferon (IFN)-γ and they are stimulated by IL-2,
IL-12, tumor growth factor (TGF)-β and IFN-γ (figure 1) [5, 6]. Additionally, Th1-
cells express chemokine receptor CXCR3 (receptor for CXCL9, CXCL10 and

~ 14~
CXCL11) and to some extent CCR5 (receptor for CCL3, CCL4 and CCL5) (figure 1)
[7]. In the immune response Th1-cells are involved in defense against
intracellular bacteria and viruses, as well as activation of cytotoxic and
inflammatory responses and delayed-type hyper-sensitivity reactions [5, 6].
T-helper-2 cells secrete e.g. IL-4, IL-5, IL-9 and IL-13, and are stimulated by IL-2
and in particular by IL-4 (figure 1) [5, 6]. The chemokine receptors CCR3
(receptor for CCL7 and CCL11), CCR4 (receptor for CCL2, CCL3, CCL5 and
CCL17) and CCR8 (receptor for CCL1) are all associated with a Th2-response
(figure 1) [7-9]. T-helper-2 cells are involved in antibody production, eosinophil
proliferation and function, as well as phagocyte-independent host defense
against for example helminths, a reaction mediated by immunoglobulin (Ig)E
and eosinophils [5, 6].
Cytokines associated with Th1-cells, e.g. IFN-γ, exert an inhibitory effect on Th2-
cells, and Th2-associated IL-4 inhibits Th1-development, a feature that gives rise
to a balance between Th1- and Th2-cells [10, 11].
This description is however a simplification of the intricate interplay between
different cells. Cells secreting IL-9 and small amounts IL-10 are termed Th9;
they are activated by IL-4 and TGF-β and have no suppressive functions but act
in a pro-inflammatory manner [12, 13]. Another subpopulation of Th-cells are
Th17 cells, which are induced by TGF-β, IL-1β, IL-6 and IL-23 [14]. T-helper-17
cells have a pro-inflammatory effect, involved in autoimmune disease as well as
in allergy and asthma and they secrete IL-6, IL-17A, IL-17B, IL-22 and CXCL-8
(reviewed in [15]).

~ 15~
Disturbance in Th1-Th2-Treg balance
It is widely accepted that a disturbance in the balance between Th1 and Th2
might lead to different diseases [5, 6, 16, 17]. A Th1-deviation is commonly
associated with autoimmune disease, among them are rheumatoid arthritis and
multiple sclerosis besides T1D and celiac disease, while Th2-deviation is
associated with measles virus infection, atopic disorders and in addition a
successful pregnancy and transplantation tolerance [5, 6, 16, 17]. However, as
there is no clear cut between the different cell populations, growing evidence
points out the need for an expansion of different subsets of lymphocytes [18-21].
Regulatory T-cells
The concept of a balance between Th1 and Th2, and two distinct separated sub-
populations has been a dogma for several years. This concept is today more and
more considered as a working model of the balance in the immune response
and not the one and only explanation. Already in 1970’s immunologists talked
about suppressive T-cells [22], and those cells were further studied until mid-
1980’s when studies regarding suppressive cells vanished due to draw-backs in
characterization of the suppressive cells [23]. During the 1990’s, however
suppressive cells re-entered the scientific scene, when Sakaguchi et. al. [24]
described CD4+ CD25+ cells with regulatory features in mice, further on they
were also described in humans [25]. These so called regulatory T-cells (Treg)
maintain immune homeostasis and self-tolerance [26]. Naturally occurring Treg
(nTreg) develop in thymus and are CD4+, constitutively express CD25, the α-
chain of the IL-2 receptor (figure 1) [24, 27]. Only approximately 1-2% of the
CD4+ CD25+ display the strongest regulatory function in humans, and this
population is usually termed CD4+ CD25high [28]. Several markers and cytokines
have been implied to be associated with Treg cells, both positively and
negatively, among them are forkhead box protein 3 (FOXP3), cytotoxic T-

~ 16~
lymphocyte antigen-4 (CTLA-4), CD39, CD45RA, CD127, IL-10 and TGF-β (figure
1) [25, 26, 29-31].
The transcription factor FOXP3 is a specific marker of Treg cells in mice, but not
in humans according to Walker et. al. [29]. They showed that FOXP3 could be
induced after activation of human CD4+ CD25- cells, and the up-regulated
FOXP3+ population acquired suppressive features after prolonged culture [29].
However, FOXP3 is one of the best available markers so far. FOXP3 has the
ability of directing the immune response through suppression of activation,
proliferation and effector functions, for example cytokine production, and has
been shown to control Treg development in mice [32]. The marker CTLA-4
(CD152) has been shown to be intracellularly expressed in CD4+ CD25+ cells,
remains up-regulated after activation and inhibits the activation of naïve T-cells
through down-regulation of CD80/CD86 [25, 33, 34]. An alternative spliced form
of CTLA-4 constitutes the soluble form (sCTLA-4), normally found in low levels
yet shown to be increased in several autoimmune diseases [35-37]. The
ectonucleotidase CD39 is expressed on FOXP3+ cells and suppresses
inflammation, hence an appropriate marker for Treg (figure 1) [30, 38].
Recently three different populations of cells expressing CD45RA and FOXP3 in
different proportions were identified; CD45RA+ FOXP3low was characteristic for
resting Treg cells, while activated Treg cells expressed CD45RA- FOXP3high and
CD45RA- FOXP3low cells were expressed on non-suppressive Treg cells, making
CD45RA a negatively Treg associated marker (figure 1) [39]. CD127 is another
marker negatively correlated to Treg, as it has been reported that CD127 is
down-regulated in all activated T-cell, and FOXP3+ CD127- cells account for a
high percentage of CD4+ cells in peripheral blood (figure 1) [31]. Further is this
down-regulation probably driven by FOXP3, and CD127lo/- cells which suppress

~ 17~
alloantigen in vitro [31]. T-regulatory cells 1 (TR1) are a cell population
characterized by large secretion of IL-10, but also some TGF-β, capable of
inhibiting antigen-specific immune responses and down-regulating pathological
immune response actively in mice (figure 1) [40]. Yet another cell population
considered to have regulatory properties is Th3 cells, identified in studies of oral
tolerance, producing TGF-β in large amount, however only low to none IL-4 and
IL-10, and it can induce FOXP3 (figure 1) [41-43].
Figure 1: A schematic picture of subpopulations of T-cells and the relation to different cytokines
and chemokines. Th-cells are stimulated by IL-2, IL-12, TGF-β and IFN-γ, and secrete IL-2, TNF-β.
The chemokines CXCL3, CXCL4, CXCL5, CCL9, CCL10 and CCL11 are all associated to Th1-cells.
Th2-cells are stimulated by IL-2 and IL-4, and secrete IL-2, IL-5, IL-9 and IL-13. The chemokines
CCL1, CCL2, CCL3, CCL5, CCL7, CCL11 and CCL17 are all associated to Th2-cells. nTreg-cells
express CD4, CD25, FOXP3, CD39, CTLA-4, but not CD127 and CD45RA. TR1-cells secrete IL-10,
and to some extent TGF-β. Th3-cells secrete TGF- β. Th=T-helper, nTreg=Natural regulatory T-
cell, TR1=T-regulatory cells 1, IL=Interleukin, TNF=Tumor necrosis factor, TGF=tumor growth
factor, IFN=Interferon, FOXP3=Forkhead box protein 3, CTLA-4=Cytotoxic T-lymphocyte
antigen-4.
Th1
IL-2, IL-12, TGF- , IFN-γCD4+, CD25+FOXP3+, CD39+, CTLA-4+CD127-, CD45RA-
IL-2, IL-4
IL-2, TNF-β, IFN-γCXCL3, CXCL4, CXCL5,CCL9, CCL10, CCL11
Th2
TR1 Th3
IL-2, IL-5, IL-9, IL-13CCL1, CCL2, CCL3, CCL5,CCL7, CCL11, CCL17 IL-10, TGF-β
nTreg
TGF-β

~ 18~
Cytokines and chemokines
As previously described in the “T-helper cells” section cytokines and
chemokines can be classified according to which cell type they usually are
secreted by. Besides this classification is it possible to distinguish cytokines and
chemokines with regard to their function, e.g. pro- or anti-inflammatory.
Among the pro-inflammatory cytokines are IL-1, IL-6, IL-15 and TNF-α involved
in the acute inflammation, whereas IL-1 receptor antagonist (IL-1ra), IL-4, IL-10
and IL-13 have anti-inflammatory properties [44-46]. Further, as described in
the “Regulatory T-cells” section some cytokines exert a regulatory effect. The
cytokine TGF-β is secreted not only by Th3 cells but also by FOXP3+ Treg, and
has additionally both pro- and anti-inflammatory effects, and IL-10 is secreted
by TR1 cells as described elsewhere [40, 45, 47].

~ 19~
TYPE 1 DIABETES
Pathogenesis and epidemiology
Type 1 diabetes (T1D), formerly known as diabetes mellitus, is one of the oldest
described diseases. An Egyptian manuscript written around 1550 B.C. uses the
phrase “the passing of too much urine”, and around 500 B.C. the disease was
described by an Indian physician when he noted sweetness in the urine in
certain cases. In the first century A.D. a Greek physician described the first
complete clinical symptoms, with extreme urine volumes passing through, and
he used the word “diabetes” to describe it, which is Greek and means siphon. In
1680’s an English physician adds the word “mellitus”, which is the Latin word for
honey, because of the sweetness of urine. During centuries different physicians
found more and more clues, and in 1889 Von Mering and Minkowski reported
that removal of pancreas in dogs made them develop signs and symptoms of
diabetes mellitus, and the dogs died shortly thereafter. In 1921 Banting and Best
repeated the work of Von Mering and Minkowski, and also went further when
they showed that they could reverse induced diabetes in dogs by administrating
extract from pancreatic islets of Langerhans of healthy dogs. Banting and Best
managed to purify bovine insulin together with the chemist Collip and treated
their first patient with it in 1922.
Type 1 diabetes is a chronic autoimmune disease caused by the destruction of
the insulin-producing β-cells in pancreas, leading to insulin deficiency [48]. The
lack of insulin leads to increased urination, thirst and hunger, as well as fatigue
and weight loss [49]. There is a strong genetic component in T1D, and one of the
strongest genetic associations is with human leukocyte antigen (HLA) class II, in

~ 20~
particular HLA-DQ and HLA-DR [48]. Other proposed risk genes are the insulin
gene, the protein tyrosine phosphatase, non-receptor type 22 (PTPN22) gene,
the IL-2 receptor alpha (IL-2RA) gene and the CTLA-4 gene (reviewed in [50]).
Environmental factors and viruses have also been suggested to underlie the
pathogenesis behind T1D, among them are cow´s milk, vitamin D, gluten,
psychological stress and viral infections, especially enteroviruses [50]. Still, no
single mechanism has been found to explain the pathogenesis behind T1D.
Sweden has one of the highest incidences of T1D in the world, however recent
reports show that the increase is not so steep any longer [51, 52].
Immunology
Insulitis, i.e. the destruction of the insulin-producing β-cells in the islet of
Langerhans in pancreas has been proposed to have three stages, even if the
initial event still remains unknown [53]. The first stage includes a primary
sensitization against β-cell antigens, followed by antigen-presenting cells
processing the autoantigen perpetuating the immune reaction, which causes an
inflammation in the islet. In the last stage a cycle of harmful interactions takes
place between immune- and β-cells. At least four different autoantigens have
been implicated to be important in T1D; tyrosinephosphatase (IA-2), glutamic
acid decarboxylase (GAD)65, insulin and zinc transport 8 (ZnT8) [54-57].
In the experimental murine model of T1D, non-obese diabetic (NOD) mice T1D
has been shown to be transferable by Th1-like cells [58] and in pancreas of T1D-
patients it has been shown that lymphocytes dominate, preferably IFN-γ-
secreting lymphocytes [59], implicating that T1D has a Th1-deviation. It has also
been reported that high-risk first degree relatives have a Th1-like profile up to

~ 21~
several years before disease onset, however this Th1-profile often is reduced near
or at the onset of the disease but then increases again after onset [60-63].
Children newly diagnosed with T1D have further been shown to have an
increased Th3-response, as well as an increased secretion of pro-inflammatory
cytokines [64, 65]. Pro-inflammatory and anti-apoptotic IL-15 have been
reported to be increased in serum from patients with T1D [66], and NK-cell
depleted NOD-mice treated with recombinant IL-15 delayed the disease process
and increased the suppressive functions in CD4+ CD25+ Tregs [67].
The role of Treg cells in T1D is contradictory. In 2005 Lindley et. al. reported
[68] that CD4+ CD25+ T-cells had dysfunctional suppressive properties in
comparison to healthy controls, even though frequency of them did not differ.
Further, patients with T1D had an increased secretion of IFN-γ and decreased
IL-10-secretion [68]. Brusko et. al. [69] found that the frequency of CD4+ CD25+
FOXP3+ CD127- did not differ between individuals with T1D, their first degree
relatives and healthy subjects, while insulin increased messenger RNA (mRNA)-
expression as well as frequency of CD4+ CD25+ FOXP3+ cells in children with
T1D [70]. High-risk relatives of T1D patients show decreased frequency of CD4+
CD25+ CD127- compared to healthy controls, a trend also seen in the CD4+ CD25+
FOXP3+ population [71]. This phenomena was further investigated by Badami et.
al. [72] reporting a decreased frequency of CD4+ CD25+ FOXP3+ CD127- in
subjects with T1D in comparison to individuals with celiac disease or healthy.
However, the group of T1D-patients in Badami’s study was not homogenous as
50% of the subjects in that group also had celiac disease.
~ 22~
CELIAC DISEASE
Pathogenesis and epidemiology
During the second century A.D. celiac disease was described for the first time.
However, the first papers regarding celiac disease was published 1888 by Samuel
Gee who described the clinical features in malabsorption in infants. During the
World War II cereals were found to be the suspected agent in celiac disease,
when Willem Karel Dicke found that the death rate due to this malabsorption
decreased to almost none after shortage of bread, but increased when bread was
available again. Between 1985 and 1987 the incidence of celiac disease increased
four times in Sweden and remained high until 1995 when it dropped sharply [73]
(figure 1). This was partly explained by changes in the infants’ dietary advices
regarding breast feeding, when to introduce gluten as well as amount of gluten
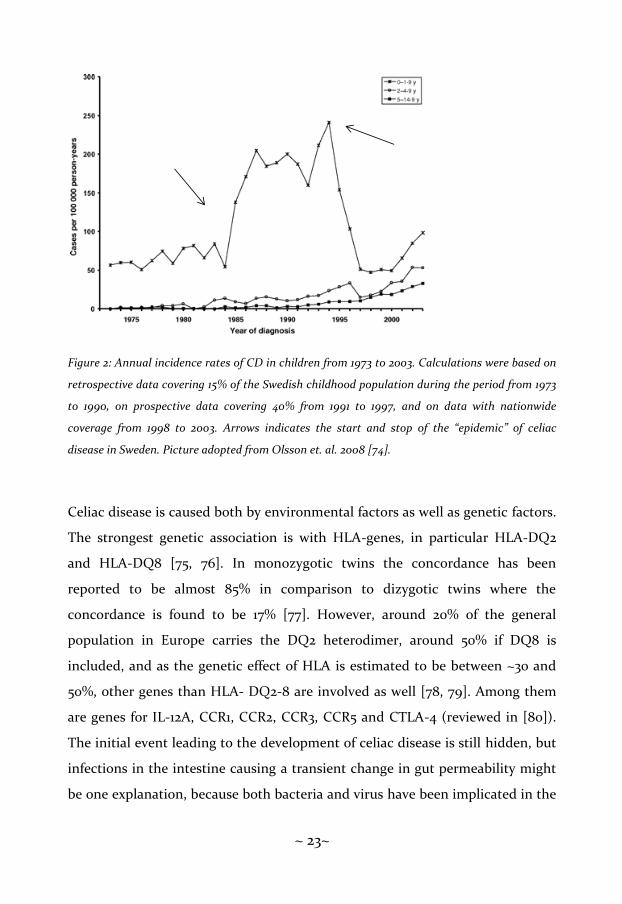
at introduction. The incidence of celiac disease still increases in Sweden and the
annual incidence was 44 cases per 100 000 person-years in 2003 [74] (figure 2).
~ 23~
Figure 2: Annual incidence rates of CD in children from 1973 to 2003. Calculations were based on
retrospective data covering 15% of the Swedish childhood population during the period from 1973
to 1990, on prospective data covering 40% from 1991 to 1997, and on data with nationwide
coverage from 1998 to 2003. Arrows indicates the start and stop of the “epidemic” of celiac
disease in Sweden. Picture adopted from Olsson et. al. 2008 [74].
Celiac disease is caused both by environmental factors as well as genetic factors.
The strongest genetic association is with HLA-genes, in particular HLA-DQ2
and HLA-DQ8 [75, 76]. In monozygotic twins the concordance has been
reported to be almost 85% in comparison to dizygotic twins where the
concordance is found to be 17% [77]. However, around 20% of the general
population in Europe carries the DQ2 heterodimer, around 50% if DQ8 is
included, and as the genetic effect of HLA is estimated to be between ~30 and
50%, other genes than HLA- DQ2-8 are involved as well [78, 79]. Among them
are genes for IL-12A, CCR1, CCR2, CCR3, CCR5 and CTLA-4 (reviewed in [80]).
The initial event leading to the development of celiac disease is still hidden, but
infections in the intestine causing a transient change in gut permeability might
be one explanation, because both bacteria and virus have been implicated in the

~ 24~
disease process. Rod-shaped bacteria have been identified in intestine of
patients with celiac disease, both untreated and treated in comparison to
controls [81]. A longitudinal study has revealed that high frequency of rotavirus
infections might increase the risk of celiac disease, which could be explained by
the similarities between VP-7, a rotavirus-neutralising protein and tissue
transglutaminase (tTG), reviewed in next section [82, 83]. Classical symptoms in
celiac disease are diarrhea, flatulence, weight loss and fatigue, however
symptoms with no clear gastrointestinal connection are also present, like
osteopenic bone disease, and so far gluten-free diet (GFD) is the only way to
avoid symptoms [84].
Immunology
Gluten is a protein with two fractions in wheat, called gliadins and glutenins,
similar proteins in barley are called hordeins and in rye secalins [85]. The
enzyme tTG has been reported to modify the gliadin peptides via deamidation,
thereby binding gliadin with higher affinity to HLA-DQ2 and HLA-DQ8,
causing an epitope that is recognized by T-cells derived from the gut and
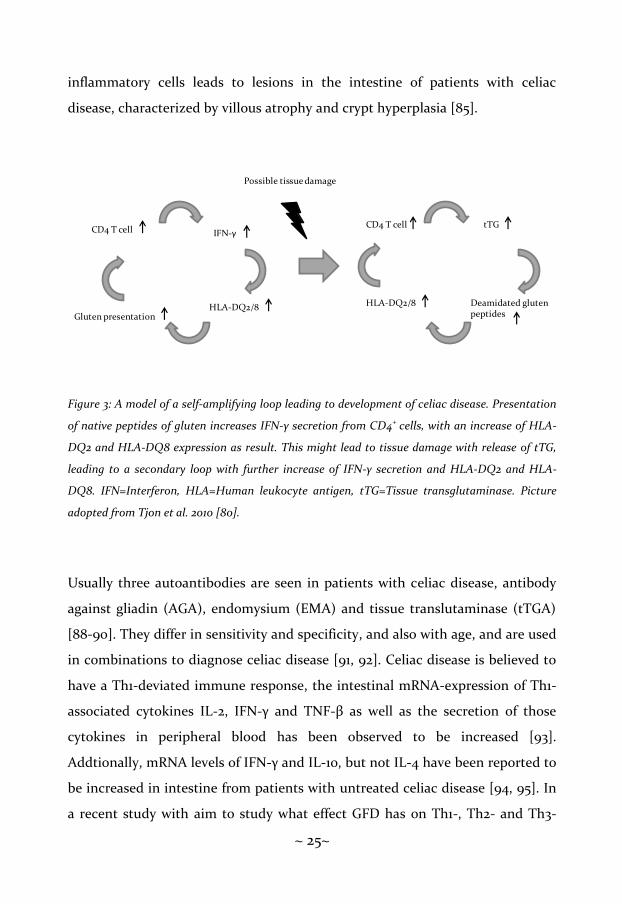
increasing gliadin-specific reactivity of T-cells [86, 87]. One explanation for the
immunological process is that native gluten bound HLA-DQ2 or HLA-DQ8 is
presented to CD4+ T-cells via antigen presenting cells leading to secretion of
IFN-γ, which in turn leads to increased expression of HLA-DQ molecules. If this
loop leads to tissue damage and subsequent release of tTG, thereby modifying
the affinity of gliadin, and increasing the CD4+ T-cell population, then this leads
to more tissue damage and initializes a secondary loop (figure 3) [80]. One
alternative explanation is that infections in the intestines generate a pro-
inflammatory response with a resulting loss of tolerance to gluten, generating
additional tissue damage and initiating deamidation [80]. The infiltration of
~ 25~
inflammatory cells leads to lesions in the intestine of patients with celiac
disease, characterized by villous atrophy and crypt hyperplasia [85].
Figure 3: A model of a self-amplifying loop leading to development of celiac disease. Presentation
of native peptides of gluten increases IFN-γ secretion from CD4+ cells, with an increase of HLA-
DQ2 and HLA-DQ8 expression as result. This might lead to tissue damage with release of tTG,
leading to a secondary loop with further increase of IFN-γ secretion and HLA-DQ2 and HLA-
DQ8. IFN=Interferon, HLA=Human leukocyte antigen, tTG=Tissue transglutaminase. Picture
adopted from Tjon et al. 2010 [80].
Usually three autoantibodies are seen in patients with celiac disease, antibody
against gliadin (AGA), endomysium (EMA) and tissue translutaminase (tTGA)
[88-90]. They differ in sensitivity and specificity, and also with age, and are used
in combinations to diagnose celiac disease [91, 92]. Celiac disease is believed to
have a Th1-deviated immune response, the intestinal mRNA-expression of Th1-
associated cytokines IL-2, IFN-γ and TNF-β as well as the secretion of those
cytokines in peripheral blood has been observed to be increased [93].
Addtionally, mRNA levels of IFN-γ and IL-10, but not IL-4 have been reported to
be increased in intestine from patients with untreated celiac disease [94, 95]. In
a recent study with aim to study what effect GFD has on Th1-, Th2- and Th3-
CD4 T cell IFN-γ
HLA-DQ2/8 Deamidated gluten peptidesGluten presentation
HLA-DQ2/8
CD4 T cell
Possible tissue damage
tTG

~ 26~
associated response in small intestine as well as in peripheral blood it was
reported that patients with an untreated celiac disease have an increased Th1-
response, but a decreased Th2-response [96]. After one year on GFD the Th2-
response was normalized, but the alterations seen in mucosa were not reflected
in peripheral blood. There is an increase of the pro-inflammatory cytokine IL-15
in patients with an untreated celiac disease in comparison to patients with
treated disease or controls, which has been reported repeatedly [97-99]. Also
FOXP3 has been reported repeatedly [100-102] to be increased in patients with
an untreated celiac disease, both at the level of mRNA-expression and frequency
of CD4+ CD25+ FOXP3+ cells.
~ 27~
ALLERGY
Pathogenesis and epidemiology
Already during antiquity allergic diseases were described, but the term allergy
was introduced first in 1906 by Clemens von Pirquet from the two ancient Greek
word “allos” meaning other and “ergon” meaning work. In 1916 Cooke and van
der Veer described skin reactions, and during the 1960’s the different
hypersensitivity reactions were described for the first time by Gell and Combs.
Only type I hypersensitivity was now considered allergic, and in 1967 the
antibody IgE was described for the first time by Ishizaka and Johansson. The
term “atopy” was used by Coca and Cooke for the first time 1923, from Greek
meaning out of place, special and unusual, and atopy was for a long time the
term for any IgE-mediated reaction. The term atopy has further been classified
to describe the hereditary predisposition to become sensitized and produce IgE
antibodies in response to allergens, while allergy is classified as a
hypersensitivity reaction initiated by immunological mechanisms [103]. Typical
allergic symptoms include asthma, rhinitis, conjunctivitis, dermatitis (both
eczema and contact dermatitis), urticaria and gastrointestinal symptoms. When
the symptoms are IgE-driven they are called atopic followed by appropriate
symptom [103]. The term “atopic march” is used for describing the variation of
allergic symptoms with age. It starts with atopic dermatitis and food allergy
during the first 2 years of life, followed by vanishing of food allergies and
progression to asthma and rhinocunjunctivis in pre-school age [104, 105].
Approximately 50% of the children with atopic dermatitis will develop asthma
later on [104, 105].

~ 28~
During the years 1979 to 1991 the prevalence of asthma, allergic rhinitis and
eczema was doubled among Swedish schoolchildren [106]. Environmental
factors are believed to have a high impact on the development of allergy and
asthma, as reported by several groups, among them the International Study of
Asthma and Allergies in Childhood (ISAAC) as well as comparisons between
Sweden and Estonia. Atopic sensitization and asthma symptoms examined in
the ISAAC material have been shown to increase with economic development
[107]. Also by a direct comparison of atopy and allergic disorders in children and
adults in Sweden and Estonia it was found that the prevalence of atopy was
increased in Sweden proposed to be caused by low endotoxin levels [108]. This
indicates that a reduced pressure to different microbes increases allergic disease
[109]. Additionally, exposure to tobacco smoke, animals, farming, lactobacilli,
fatty acids, day care and antibiotic use have been proposed to be involved in
allergic diseases [110-115].
Immunology
The IgE-mediated immune response is commonly divided into sensitization,
early or immediate hypersensitivity reaction and late phase reaction [116, 117]. In
the sensitization step specific IgE antibodies are synthesized by plasma cells,
with involvement of allergen-specific Th2-cells. Produced IgE-antibodies are
mainly found on mast cells. The immediate hypersensitivity reaction takes place
within minutes from the re-exposure to the allergen. Then the allergen binds
and cross-links to IgE-sensitized mast cells, which results in a release of
inflammatory mediators like histamine, tryptase and cytokines, triggering
different responses including vascular permeability, broncho-constriction and
production of mucus. The different cytokines and chemokines, for example IL-4,
~ 29~
IL-5, IL-9 and IL-13 drive the late allergic response where eosinophils, basofils
and Th2-cells are recruited to the inflammation site.
Allergic disease and asthma are considered being Th2-deviated, as shown by
atopic asthmatics having an increased mRNA-level of IL-3, IL-4, IL-5 and
granulocyte-macrophage colony-stimulating factor (GM-CSF) in
bronchoalveolar lavage (BAL), in comparison to controls, and IL-4 and IL-13
induce the switch to IgE [118], There is also decreased frequency of IFN-γ-
producing cells in CD4+ cells, but not CD8+ cells, in atopic individuals [119].
Additionally, the Th1-associated cytokine IL-12 has the ability to suppress
synthesis of IgE in IL-4-stimulated peripheral blood mononuclear cells (PBMC)
[120], and it also dampens the airway hyperresponsiveness in mice [121]. The TR1-
associated cytokine IL-10 has been shown to be increased in monocytes in atopic
patients [122], and has also been reported to be increased during specific
immune therapy (SIT) [123].

~ 30~
COMBINATIONS OF TYPE 1 DIABETES, CELIAC DISEASE AND ALLERGY
According to the theory that Th1 and Th2 are in balance with each other, a Th1-
deviated disease should not co-exist with a Th2-deviated disease. However, this
is not the case as individuals might suffer from example T1D or celiac disease
and allergy at the same time, and there are also cases with all three diseases in
combination.
Combination of type 1 diabetes and celiac disease
Besides a common immunological profile, with a Th1-devation, individuals with
T1D and celiac disease share some risk genes, i.e HLA-DQ2 and HLA-DQ8
leading to increased risk of developing the other disease once affected by one of
these diseases [124]. Screening children with T1D for non-islet autoantibodies
revealed that 11,6% had tTG autoantibodies, but only just around a quarter of
them had developed celiac disease [125]. Besides a common genetically
predisposition, gliadin sensitivity has been reported in both T1D and celiac
disease [86, 126, 127]. There are studies showing that the gut is involved in T1D,
both with regard to a change in permeability and with regard to mucosal
immunity. Children with T1D and no sign of celiac disease have been reported
to have both increased expression of HLA class II genes, and an increase of
adhesion molecule in mucosa, and additionally an expression of gut-associated
homing receptor α4β7-integrin in GAD-specific T-cells suggesting an interplay
between gut and pancreas [128, 129]. This has been further supported by other
groups, suggesting that gluten, or gliadin, has the property of increasing the
permeability of the gut both in mice and humans [126, 127, 130, 131]. Further does
the FOXP3 mRNA-expression, as well as the frequency of FOXP3+ cells in small-

~ 31~
bowel mucosa, increase when celiac disease is accompanied with T1D in
comparison to individuals with T1D or celiac disease as single diseases [132].
Combination of type 1 diabetes and allergy
Most studies on T1D and allergy focus on the negatively inverse relationship
between those diseases, with regard to T1D being a Th1-associated disease and
allergy being a Th2-associated one [133]. A study by Gazit et. al. reported that
the prevalence of atopy in T1D-patients was similar to the general population
[134], while Olesen et. al. reported that atopic dermatitis was decreased in
patients with T1D if atopic dermatitis was developed first [135]. Further, children
with combination of T1D and asthma have been shown to have a similar pattern
of IFN-γ, IL-2, IL-4, IL-10 and IL-13 in PBMC after stimulation with
phytohaemagglutinin (PHA), tetanus toxoid (TT) or anti-CD3 monoclonal
antibodies [136]. The IL-10 secretion in total (both spontaneous and stimulated
secretion) was increased in the group with combination of T1D and asthma
[136]. Kainonen et. al. [137] reported that spontaneous IFN-γ, TNF-α and IL-10
were higher in children with both T1D and asthma, however stimulation with
CD3 and CD28 did not increase the secretion of IL-10 in this group. Finally
serum levels of IL-12 and IL-18 have been shown to be increased in children with
T1D and asthma, as well as the serum ratio of IL-18/IL-12, while stimulation with
lipopolysaccharide (LPS) decreased the IL-12 secretion [138].
Children with combination of celiac disease and allergy
Children with celiac disease and allergy have the same difference in
immunological profile as patients with T1D and allergy, with celiac disease

~ 32~
having a Th1-associated profile and allergy a Th2-associated profile. In a Finnish
study from 1983 Verkasalo et. al. [139] found that children with celiac disease
had an increase of atopy in comparison to unselected schoolchildren, and atopy
was more frequently seen in individuals carrying HLA-B8DR3-. In Italy the
prevalence of silent celiac disease in atopics has been reported to be 1%, which is
significantly higher than the general Italian population [140]. The cumulative
incidence of asthma is significantly higher in children with celiac disease and
allergy in Finnish children compared to children with exclusively celiac disease
[141]. Recently a study performed in Sweden reported that there is a 1.6-fold
increased risk of developing asthma when you suffer from celiac disease, as seen
by the hazard ratio [142].

~ 33~
CRYOPRESERVATION
Cryopreservation is a convenient way to collect and store samples, e.g. PBMC or
tissue. Through this process it is possible to collect the samples during a limited
period of time, and by performing all analyses collectively it is possible to over-
come inter-assy variation. However, the freezing and thawing of cells is a harsh
process and might harm or change the sample. Studies performed on the
cytokine IL-10 have shown contradictory results, with either a decrease or no
change at all after cryopreservation [143-145]. The same pattern has been
reported for frequency for the Treg-associated marker FOXP3, ranging from a
significant decrease to no change at all [146-148]. Both freezing protocols and
used medium can affect the cryopreservation, which might be an explanation
for differences in result [147, 149].

~ 34~

~ 35~
AIMS OF THE THESIS
The general aim of this thesis was to study the immune profile with focus on subsets of T-lymphocytes in children with T1D, celiac disease, allergy, a combination of two of these diseases and healthy children (reference).
The specific aims of the papers were:
Paper I: To evaluate the secretion of the Th1-associated cytokine IFN-γ and the Th2-associated cytokine IL-4 in PBMC, both spontaneously and after in vitro stimulation with disease-associated antigens, in children with T1D, celiac disease, allergy, combination of two of these as well as reference children.
Paper II: To evaluate the secretion of cytokines and chemokines in cell supernatant, both spontaneously and after in vitro stimulation with disease associated antigens, in children with T1D, celiac disease, allergy, two of these diseases in combination in comparison to reference children.
Paper III: A methodological study to examine the mRNA-expression of markers associated with regulatory T-cells (i.e. FOXP3, TGF-β, CTLA-4 and sCTLA-4), and additionally comparison between 48- and 96-hours stimulation period, both spontaneous and after antigen-stimulation.
Paper IV: To examine the mRNA-expression of the Treg-associated marker FOXP3 after in vitro stimulation in children with T1D, celiac disease, combination of T1D and celiac disease and reference children.
Paper V: To evaluate the expression of markers associated with regulatory T-cells (CD4, CD25, CD39, FOXP3, CD45RA and CD127) in children with T1D, celiac disease, combination of T1D and celiac disease and reference children.

~ 36~

~ 37~
MATERIAL AND METHODS
Study population
The study population in this thesis (paper I-V) consists of three different
cohorts, see figure 4. In paper I, II and IV the same cohort was included with
slightly different compositions, with children from Linköping University
Hospital, Sweden. In paper II the cohort included healthy adults from
Linköping, Sweden. Paper V included children from Ryhov Hospital, Jönköping,
Sweden.
Cohort 1, paper I and II describes children diagnosed with T1D, celiac disease,
allergy or a combination of two of these diseases, in relation to healthy children
as reference. Cohort 1, paper IV describes children diagnosed with T1D, celiac
disease or a combination of these diseases, in relation to healthy children as
reference. Cohort 2, paper III describes healthy adults from Linköping, Sweden.
Cohort 3, paper V describes children diagnosed with T1D, celiac disease or a
combination of these diseases, in relation to healthy children as reference.
Figure 4: A description of cohorts used in the different papers.
Cohort 1 Cohort 2
Paper II
Cohort 3
Paper I Paper IIIPaper IV Paper V

~ 38~
Paper 1
Sixty-eight children from cohort 1 were included in the study, diagnosed with
either T1D, celiac disease or allergy, or a combination of two of these diseases.
Healthy children, i.e. without any of these diseases were used as reference
children. All children were matched by gender and age as closely as possible, see
table I. This material includes all children diagnosed with both T1D and celiac
disease, at the Paediatric clinic at the University hospital of Linköping, Sweden,
i.e. 4.4% (8/180). These children represent the Swedish population since 4.6 %.
of the patients with celiac disease in Sweden have been found to have T1D, at
the time for inclusion.
Table 1 Children with type 1 diabetes, celiac disease and/or allergy and reference children
Gender T1D+CD T1D+AD CD+AD T1D CD AD Ref
Boys 14 (3 y/ 4 y) - 11 (1 m) 13 (4 y) - 13 12
13 (18 m/ 5 m) 12 (10 m) - 12 (11 y) 10 (d.n.a.) 12 12
12 (8 y/ 18 m) 12 (8 y) - 12 (2 y) 10 (1 y) 9 10
10 (3 y/ 9 m) 9 (4 y) 10 (6 y) 9 (5 y) 8 (6 y) 9 9
7 (1 y/ 9 m) 6 (4 m) - 6 (1 y) 7 (4 y) 6 8
- - - 13 (3 m) - - -
Girls - 14 (11 y) 16 (4 m) 14 (3 y) 15 (11 y) 14 14
12 (2 y/ 1 y) 12 (5 y) 14 (12 y) 12 (7 y) 14 (11 y) 12 13
- 12 (5 y) 11 (9 y) 12 (10 y) 12 (1 d) 12 12
10 (5 y/ 10 m) 10 (6 y) 11 (8 y) 10 (14 m) 11 (9 y) 11 12
8 (2 y/ 10 m) 10 (7 y) 10 (6 y) 10 (2 y) 10 (9 y) 11 11
- - - 10 (9 m) 10 (7 y) 10 -
- - - - - 12 -
Range (mean) 7-14 (10.8) 6-14 (10.8) 10-16 (11.9) 6-14 (11.1) 8-15 (10.7) 6-14 (10.9) 8-14 (11.3)
No 8 9 7 12 10 12 10
Children with type 1 diabetes (T1D), celiac disease (CD) or allergy (AD), and combinations of these diseases (T1D+CD, T1D+AD, CD+AD)
were matched to each other and to reference (REF) children by age (years) and gender. Duration of disease (in parenthesis d = days, m = months,
y = years) is presented for children with T1D and/or CD.
d.n.a.= data not available

~ 39~
Paper II
The study group in paper II consisted of 72 children from cohort 1, either
diagnosed with T1D, celiac disease, allergy or a combination of two of these
diseases. Children without any of these diseases were used as reference group,
see table II. All children were matched by gender and age as closely as possible.
Paper III
Twelve healthy adults (median age 31 years of age, 25-52 years, 7 female/5 male)
from cohort 2 comprised the study group for paper III.
Table II Children with type 1 diabetes, celiac disease and/or allergy and reference children
Gender T1D CD AD T1D + CD T1D +AD CD + AD Ref
Boys 12 (11 y) 10 (d.n.a.) 12 13 (18 m/5 m) 12 (10 m) 12
12 (2 y) 10 (1 y) 9 12 (8 y) 10
9 (5 y) 8 (6 y) 9 10 (3 y/9 m) 9 (4 y) 10 (6 y) 9
6 (1 y) 7 (4 y) 6 7 (1 y/9 m) 6 (4 m) 8
13 (3 m) 15 (d.n.a.) 12
13 14 (3y/4 y) 11 (1 m) 12
12
14
Girls 14 (3 y) 15 (11 y) 14 14 (11 y) 16 (4 m) 18
12 (7 y) 14 (11 y) 12 12 (2 y/1 y) 12 (5 y) 14 (12 y) 18
12 (10 y) 12 (1 d) 12 11 (d.n.a.) 12 (5 y) 11 (9 y) 12
10 (14 m) 11 (9 y) 11 10 (5 y/10 m) 10 (6 y) 11 (8 y) 10
10 (2 y) 10 (9 y) 11 8 (2 y/10 m) 10 (7 y) 10 (6 y)
10 (9 m) 10 (7 y) 10 13
11 (d.n.a.) 12
Range (mean)6-14 (10.9) 7-15 (10.7) 6-14 (10.9) 7-15 (11.1) 6-14 (10.8) 10-16 (11.9) 8-18 (12.3)
No 12 10 12 9 9 7 13
Children with type 1 diabetes (T1D), celiac disease (CD) or allergy (AD), and combinations of these diseases (T1D+CD, T1D+AD, CD+AD)
were matched to each other and to reference (REF) children by age (years) and gender. Duration of disease (in parenthesis d = days, m = months,
y = years) is presented for children with T1D and/or CD.
d.n.a.= data not available

~ 40~
Paper IV
Paper IV included 24 children from cohort 1, diagnosed with T1D, celiac disease,
T1D and celiac disease in combination as well as reference children. All children
were matched by gender and age as close as possible. See table III.
Table III: Children with type 1 diabetes, celiac disease and/or allergy and reference
children
Paper V
Thirty-two children from cohort 3, diagnosed with T1D and/or celiac disease
were included in this study. Children without any of these diseases were used as
reference (table IV). The material includes children with T1D and celiac disease
Gender T1D+CD T1D CD REF
Boys 14 (3 y/ 4 y) 12 (2 y) 10 (d.n.a.) 12
10 (3 y/ 9 m) 10 (1 y) 12
7 (1 y/ 9 m) 8 (6 y) 9
7 (4 y) 8
Girls 12 (2 y/ 1 y) 12 (7 y) 15 (11 y)
10 (5 y/ 10 m) 12 (10 y) 14 (11 y)
10 (14 m) 12 (1 d)
10 (2 y) 11 (9 y)
10 (9 m) 10 (9 y)
Range (mean) 7-14 (10.6) 6-14 (11) 7-15 (10.8) 8-18 (10.3)
N 5 6 9 4
Children with type 1 diabetes (T1D), celiac disease (CD) and combination of T1D and CD
were matched to each other and to reference (REF) children by age (years) and gender.
Duration of disease (in parenthesis d = days, m = months, y = years) is presented were available.
d.n.a.= data not available

~ 41~
from the pediatric clinic, Ryhov Hospital, Jönköping, Sweden. The combined
T1D and celiac disease group was the first to be included, and as far as possible
the other groups were matched by age and gender to this group.
Table IIII: Children with type 1 diabetes, celiac disease and/or allergy and reference
children
Children with type 1 diabetes (T1D), celiac disease (CD) and combinations of these diseases (T1D+CD)
were matched to each other and to healthy children by age (Y=years) and gender.
Diagnostic criteria
Celiac disease was diagnosed according to the modified version of The European
Society of Paediatric Gastroenterology, hepatology and Nutrition (ESPGHAN),
former The European Society of Paediatric Gastroenterology and Nutrition
(ESPGAN) criteria [150]. Duration of T1D was defined as the date of diagnosis
and celiac disease as the date of the first biopsy. For diagnosis of allergy we
strictly adhered to the protocols for phase I and III described in the ISAAC study
(http://isaac.auckland.ac.nz/phases/phaseone/phaseone.html, and
http://isaac.auckland.ac.nz/phases/phasethree/phasethree.html). Allergy was
T1D + CD T1D CD Ref
male 8 7 8 7
female 8 8 - 8
female 8 13 10 10
male 11 15 10 14
female 13 14 13 10
female - 14 - 11
male 14 15 - 14
female - 14 17 14
male 16 17 - -
female - 17 17 16
No n=7 n=10 n=6 n=9Range (mean) 8-16 y (11.1) 7-17 y (13.4) 8-17 y (12.5) 7-16 y (11.6)

~ 42~
characterized by eczema, bronchial asthma and/or allergic rhinoconjunctivitis.
Skin prick test (SPT) was performed on all children in duplicate on the volar
aspects of the forearms with standardised cat and dog dander extracts, birch,
timothy, grass, mite (Soluprick R, ALK, Hørsholm, Denmark) and hen’s egg
white. Tests were regarded as positive if skin wheals had a mean diameter of 3
mm or more after 15 minutes. Histamine dihydrochloride, 10 mg/ml, and a
sterile lancet were used as positive and negative controls respectively. The
reference children had no signs of T1D or of any other autoimmune disease, nor
any clinical signs of celiac disease or clinical allergy, and the SPT was negative
for all of them. Further, no signs of these diseases were reported among their
first-degree relatives. None of the children had signs of a cold or other infection
at the time of blood sampling.
Laboratory analyses
Isolation and in vitro stimulation of PBMC
In paper I, II, III and IV PBMC were isolated from sodium-heparinised venous
blood samples with Ficoll Paque (Pharmacia, Biotech, Sollentuna, Sweden),
within four hours from blood sampling. After density gradient centrifugation for
30 minutes at 400 g, mononuclear cells were collected at the interface between
blood and Ficoll, followed by wash two times by centrifugation for 15 minutes at
400 g in RPMI 1640 medium (Gibco, Täby, Sweden), supplemented with 2% fetal
calf serum (FCS) (Gibco). Cells were stained with Türks solution (1:10) and
counted in Bürkers chamber by light microscopy, followed by a final wash. For
cells intended to be cultured, PBMC were diluted to 2 x 10⁶ PBMC/ml in AIM V
serum free medium supplemented with 2 mM L-glutamine, 50 μg/ml
streptomycin sulphate, 10 μg/ml gentamycin Sulphate and 2 x 10⁻⁵ M 2-
mercaptoethanol (Gibco, Täby, Sweden) and cultured as follows:

~ 43~
In paper II PBMC were cultured in vitro for 96 hours with insulin 500 µg/ml
(Actrapid, Novo Nordisk, Denmark), gluten 400 µg/ml (gift from Outi Vaarala,
Helsinki, Finland) and birch 10 kSU/ml (Aquagen, ALK-Abell, Hærsholm,
Denmark). Medium alone was used for detection of spontaneous secretion, and
PHA 5 µg/ml (Sigma, Stockholm, Sweden) was used as positive control. Cell
supernatants were collected and frozen at -70°C until further analysis.
In paper IV PBMC were cultured in vitro for 96 hours with tTG 500 μg/ml,
gluten 400 μg/ml (both gifts from Outi Vaarala, Helsinki, Finland) and insulin
500 μg/ml (Actrapid, Novo Nordisk, Denmark). Phytohaemagglutinin 5 μg/ml
[61] (Sigma-Aldrich, Stockholm, Sweden) was used as a positive control and
medium alone for detection of spontaneous mRNA expression. In samples with
limited number of cells, the order of priority for stimulation with antigens was
PHA, gluten, tTG and finally insulin. Cells were collected post-stimulation and
stored at -70°C for further analysis of mRNA expression.
Freezing, thawing and in vitro stimulation of PBMC (paper III)
After counting PBMC were centrifuged at 400 g for 10 minutes and freezing
medium containing 50% RPMI 1640 without glutamine (Gibco, Invitrogen
Corporation, UK), 40% FCS (Gibco, Invitrogen Corporation) and 10% dimethyl
sulfoxide (DMSO) (Sigma) was added while tubes were agitated. Cells with a
concentration of 5-10 x 106 PBMC/ml were moved to cryo vials and placed in a
pre-cooled (-4° C) Cryo 1°C Freezing Container (Nalge Nunc International,
Rochester, USA) containing isopropanol. The container was placed in -70°C with
a freezing rate of -1°C/minutes. The following day the vials were transferred to
liquid nitrogen (-196°C) and stored frozen until analysis.

~ 44~
After storage in liquid nitrogen for at least one month, PBMC were quickly
thawed to 37°C in water bath, and cell suspensions were immediately washed
with RPMI supplemented with 10% FCS. The cell suspensions were centrifuged
for 10 minutes at 400 g, then the suspensions were removed and the cell pellets
were resuspended in AIM-V serum free medium (Gibco, Täby, Sweden)
supplemented with 2 mM L-glutamine, 50 μg/ml streptomycin sulphate, 10
μg/ml gentamycin Sulphate and 2 x 10⁻⁵ M 2-mercaptoethanol (Sigma-Aldrich,
Stockholm, Sweden). Peripheral blood mononuclear cells stained with Türks
solution were counted in phase contrast microscopy and viability was calculated
with trypan blue. A viability level of at least 90% was considered acceptable.
Stimulation of frozen and thawed PBMC was performed following the same
stimulation protocol as for freshly stimulated cells, and the same procedure was
followed for collection of PBMC and cell supernatant.
Cell concentration was adjusted to 2 x 10⁶ PBMC/ml with AIM-V serum free
medium (Gibco, Sweden) supplemented with 2 mM L-glutamine, 50 μg/ml
streptomycin sulphate, 10 μg/ml gentamycin Sulphate and 2 x 10⁻⁵ M 2-
mercaptoethanol (Sigma-Aldrich, Stockholm, Sweden), and PBMC were
stimulated with PHA (Sigma-Aldrich), TT (SBL, Stockholm, Sweden), β-
lactoglobulin (βLG) (Sigma-Aldrich) and ovalbumin (OVA) (Sigma-Aldrich) for
48 and 96 hours respectively at 37°C, in 5% CO2 (for concentration see table V).
Antigen Concentration for 48 h Concentration for 96 h
PHA 5 µg/ml 5 µg/ml
TT 20 Lf/ml 20 Lf/ml
βLG 5 µg/ml 50 µg/ml
OVA 5 µg/ml 50 µg/ml
Table V Concentration of antigens.
Concentration for 48 and 96 h stimulation period.
PHA=Phytohaemagglutinin. TT=Tetanus toxoid.
βLG=Betalactoglobulin. OVA=Ovalbumin.

~ 45~
Collection of PBMC and cell supernatants (paper II, III and IV)
After centrifugation for 10 minutes at 400 g aliquots of cell supernatants were
removed and PBMC were resuspended in AIM-V serum free medium (Gibco,
Sweden) supplemented with 2 mM L-glutamine, 50 μg/ml streptomycin
sulphate, 10 μg/ml gentamycin Sulphate and 2 x 10⁻⁵ M 2-mercaptoethanol
(Sigma-Aldrich, Stockholm, Sweden). Both cell suspension and cell supernatant
were kept frozen at -70°C until further analysis.
Enzyme linked immunospot (ELIspot) (paper I)
In an ELIspot assay it is possible to study cytokine secretion at the single cell
level, as the released cytokine is captured by antibodies bound to the surface of
a microtiter plate before it is digested or internalised by the cells (figure V).
Sterile 96-well microtiter plates (Multiscreen HA, Milipore, Bedford,
Massachusetts, USA) were precoated with 70% ethanol, followed by five times
wash with sterile water. Coating antibody, i.e. mouse anti-human IFN-γ 7B61
(Mabtech AB, Stockholm, Sweden) or mouse anti-human IL-4 MoAB (Mabtech
AB) was added to the wells, and the plates were incubated overnight at 4°C in a
humid chamber. After wash with phosphate buffer saline (PBS), the wells were
incubated for 30 minutes in 37°C and 5% CO2 with Iscove´s modification of
Dulbeccos medium (IMDM) (Life Technologies, Täby, Sweden) containing 50
U/ml penicillin (Life Technologies), 50 µg/ml streptomycin (Life Technologies),
10 ml/l 100 x MEM non-essential amino acids (Life Technologies) and 5% FCS
(Gibco) to block unspecific binding sites. After removal of IMDM cells with a
concentration of 1 x 10⁵ PBMC/well were added together with 100 µl IMDM with
supplements as well as antigens according to table VI and incubated
undisturbed for 48 hours, at 37°C and 5% CO2 in a humid chamber. Border wells
of the plates contained exclusively IMDM and functioned as a negative control,

~ 46~
while PHA functioned as a positive control. All stimulated and unstimulated
samples were applied in quadruplicates, and all plates were blinded for
identification of samples.
After 48 hours incubation the plates were washed twice with sterile PBS and
twice with PBS Tween and incubated for two hours, at room temperature (RT),
in darkness and in a humid chamber, with biotinylated anti-human IFN-γ 1-
D1KmoAb (Mabtech AB) or bionibylated anti-human IL-4 MoAB (Mabtech AB)
respectively, both with a concentration of 1 µg/ml. After wash with PBS Tween
streptavidin conjugated with alkaline phosphatase (AP) (Mabtach AB), diluted
1:1000, was added to the plates, followed by incubation for one hour, in humidity
at RT. After wash twice with PBS Tween and four times with PBS spots were
developed by AP conjugate substrate kit (Bio-Rad, Hercules, California, USA)
diluted 1:25. The development process proceeded for 10-15 minutes and the
plates were washed with abundant amounts of tap water, emptied and placed
upside down in darkness to dry overnight at RT.
Table VI Antigens
Antigen ConcentrationSource
Birch extract 10 kSQ-U/ml Aquagen, ALK-Abelló, Hørsholm, Denmark
Cat allergen extract 10 kSQ-U/ml " "
Insulin 500 ng/ml Actrapid, NovoNordisk, Malmö, Sweden
β-lactoglobulin 10 mg/ml Sigma-Aldrich, Stockholm, Sweden
Ovalbumin 10 mg/ml " "
Gluten 400 mg/ml Gift from O Vaarala, Linköping, Sweden
Phytohaemagglutinin 20 mg/ml Sigma-Aldrich, Stockholm, Sweden
Concentration and source of antigens used for stimulation of peripheral blood
mononuclear cells (PBMC) to induce antigen-specific secretion of interferon(IFN)-γ
and interleukin(IL)-4, detected by enzyme linked immunspot (ELIspot)-technique.

~ 47~
Plates were counted automatically, by the AID ELISPOT Reader System (AID,
Strasbourg, Germany), where each well was photographed and spots were
marked based on size, colour and intensity. However, artefacts were sometimes
regarded as spots, hence manual supervision was required. The median value of
the quadruplicates for each antigen was calculated and the value of secretion for
unstimulated PBMC (i.e. spontaneous secretion) was subtracted from the
secretion from stimulated PBMC in order to obtain antigen-specific secretion.
Our laboratory participated in the first ELISPOT workshop as one of the core
laboratories, and our assay was judged to be sensitive and reproducible [151].
Multiplex fluorochrome technique (Luminex) (paper II)
With Luminex technique it is possible to fast and precisely analyse up to 100
simultaneous tests in one single reaction. It is a sandwich immunoassay, based
on microspheres individually dyed (figure 6). On the surface of the microsphere
antibodies directed against analyte of interest are bound. When the
microspheres pass through a laser, the combination of dye is read for
identification of analyte, while another laser reads the amount antibody bound
to each sphere. A standard curve is used to correlate each concentration to the
unknown sample.
Figure 5: Principle for the enzyme linked immuno spot (ELIspot) technique. Capture antibody, eitherinterferon (IFN)-γ or interleukin (IL)-4 were bound to the bottom wells in a microtiter plate. Cells were allowed to react to antigens, hereby secreting cytokines. Biotinylated detection antibodies (IFN- γ or IL-4)
were added. After incubation, streptavidin conjugated with alkaline phosphatase (AP), and thereafter developed by AP conjugate. Picture published after kind permission from Jenny Walldén.
~ 48~
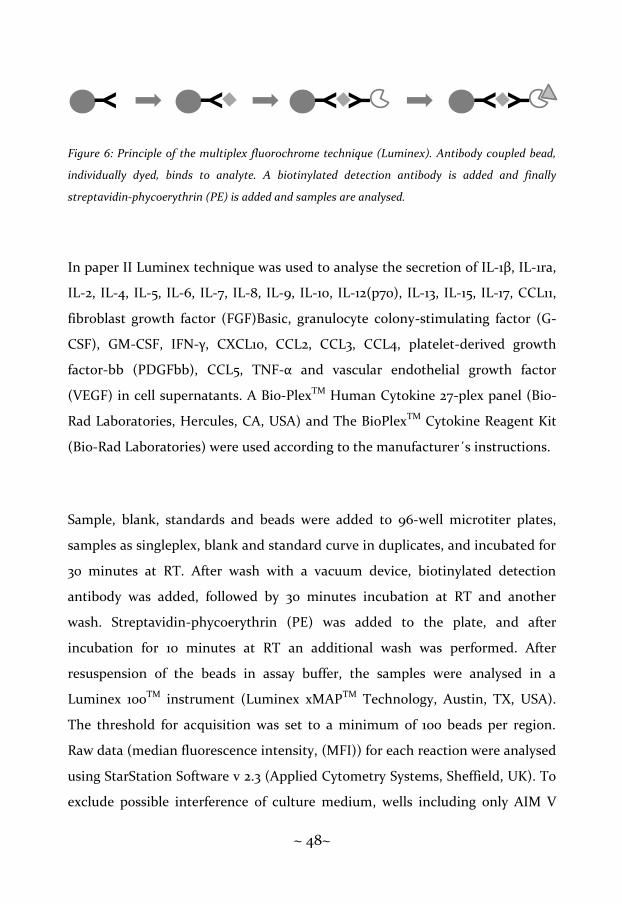
Figure 6: Principle of the multiplex fluorochrome technique (Luminex). Antibody coupled bead,
individually dyed, binds to analyte. A biotinylated detection antibody is added and finally
streptavidin-phycoerythrin (PE) is added and samples are analysed.
In paper II Luminex technique was used to analyse the secretion of IL-1β, IL-1ra,
IL-2, IL-4, IL-5, IL-6, IL-7, IL-8, IL-9, IL-10, IL-12(p70), IL-13, IL-15, IL-17, CCL11,
fibroblast growth factor (FGF)Basic, granulocyte colony-stimulating factor (G-
CSF), GM-CSF, IFN-γ, CXCL10, CCL2, CCL3, CCL4, platelet-derived growth
factor-bb (PDGFbb), CCL5, TNF-α and vascular endothelial growth factor
(VEGF) in cell supernatants. A Bio-PlexTM Human Cytokine 27-plex panel (Bio-
Rad Laboratories, Hercules, CA, USA) and The BioPlexTM Cytokine Reagent Kit
(Bio-Rad Laboratories) were used according to the manufacturer´s instructions.
Sample, blank, standards and beads were added to 96-well microtiter plates,
samples as singleplex, blank and standard curve in duplicates, and incubated for
30 minutes at RT. After wash with a vacuum device, biotinylated detection
antibody was added, followed by 30 minutes incubation at RT and another
wash. Streptavidin-phycoerythrin (PE) was added to the plate, and after
incubation for 10 minutes at RT an additional wash was performed. After
resuspension of the beads in assay buffer, the samples were analysed in a
Luminex 100TM instrument (Luminex xMAPTM Technology, Austin, TX, USA).
The threshold for acquisition was set to a minimum of 100 beads per region.
Raw data (median fluorescence intensity, (MFI)) for each reaction were analysed
using StarStation Software v 2.3 (Applied Cytometry Systems, Sheffield, UK). To
exclude possible interference of culture medium, wells including only AIM V
Y Y
Y
Y Y
Y

~ 49~
serum free medium (Gibco, Täby, Sweden) were subtracted from each sample.
In order to obtain antigen specific response the spontaneous secretion was
subtracted from stimulated secretion. A five-parameter curve fit was applied to
each standard curve to acquire sample concentration values. For cut off values,
see table VII.
Cut-off values for cytokines and chemokines included in the Luminex-assay. FGF=Fibroblast
growth factor, G-CSF=Granulocyte colony-stimulating factor, GM-CSF= Granulocyte
macrophage colony-stimulating factor, IFN=Interferon, IL=Interleukin, PDGF=Platelet-derived
growth factor, TNF=Tumor necrosis factor, VEGF=Vascular endothelial growth factor.
Table VII
Cytokine/Chemokine Cut-off (min) (pg/ml)
CCL2 0,4
CCL3 0,3
CCL4 0,5
CCL5 0,5
CCL11 0,2
CXCL10 1,2
FGFBasic 0,3
G-CSF 0,6
GM-CSF 0,1
IFN-γ 0,3
IL-1β 0,5
IL-1ra 0,7
IL-2 0,3
IL-4 0,07
IL-5 0,6
IL-6 0,4
IL-7 0,8
IL-9 0,4
IL10 0,4
IL-12(p70) 0,6
IL-13 0,9
IL-15 0,4
IL-17 0,8
PDGFbb 0,2
TNF-α 0,8
VEGF 0,5

~ 50~
Real-time reversed-transcriptase polymerase chain reaction (RT-PCR)
(paper III and IV)
RNeasy 96 kit (Qiagen, KEBO, Spånga, Sweden) was used to isolate total RNA
from PBMC, according to manufacturer’s recommendation. Thawed PBMC were
lysed, mixed 1:1 with 70% ethanol and placed on RNAeasy 96-well plates. Several
washing steps including centrifugation with wash buffer included in the kit,
were performed and the RNA was eluted with RNAse-free water. Quantification
of RNA concentration was performed using a NanoDrop® ND-1000
spectrophometer (NanoDrop Technologies, Willington, Delaware, USA) at optic
density (OD) 260 nm. To determine purity of RNA the quota between OD 260
nm and 280 nm was calculated (≥ 1.8 in all cases). RNA was stored at -70°C until
further analysis.
Using equal amounts of total RNA (7 ng/μl), stimulated under various
conditions, mRNA was marked complementary with random hexamers, and
complementary DNA (cDNA) was synthesised from the mRNA by High Capacity
cDNA archive kit (Applied Biosystems, Stockholm, Sweden), according to
supplier’s recommendation. RNAse inhibitor (1 U/ml) (Applied Biosystems) was
added to the reaction, apart from reactants supplied in the kit. The synthesis
was performed using random hexamers and deoxyribonucleotide triphosphate
(dNTP). The reaction mixture was synthesised with a Gene Amp PCR System
2700 (Applied Biosystems), for 10 minutes at 25°C and at 37°C for 120 minutes.
The final cDNA product was stored at -20°C until cDNA amplification.
Transcription levels of markers associated with Treg cells (paper III: FOXP3,
TGF-β, CTLA-4 and sCTLA-4, paper IV: FOXP3) were detected by multiplex
real-time RT-PCR. TaqMan Universal PCR 2x Master Mix (Applied Biosystems),
specific primer and probe (Foxp3: Hs00203958, TGF-β: Hs00171257 and CTLA-4:

~ 51~
Hs00175480, all FAM dye layer, Applied Biosystems), s-CTLA-4 primers and
probe (FAM dye layer, synthesised by Applied Biosystems) and endogenous
reference primers and probe (Human 18s ribosomal RNA (rRNA): 4310893E, VIC
dye layer) constituted the PCR-reaction mix. All samples were applied in
duplicates at a final volume of 25 µl and added to a MicroAmp Optical 96-well
reaction plate with optical cover. A 7500 Fast Real-Time PCR (Applied
Biosystems) was used for amplification of the reaction mixture for 50 cycles,
with an annealing temperature of 58-60°C for primers and 68-72° for probes.
Quantification of target mRNA was acquired from the FAM dye layer, while the
VIC dye layer yielded the result for quantification of the 18S rRNA endogenous
control and the ROX dye layer was used for the passive reference used for
normalise for non-PCR-related fluctuations in fluorescence signal. An inter-
assay control RNA (i.e. unstimulated PBMC from a healthy individual) as well as
controls without template was included in all experiments. In paper III, sCTLA-
4 was not analysed for optimum stimulation period, due to limited amount of
study material.
Calculation of relative quantification values of mRNA gene expression was done
from the accurate cycle threshold (CT) according to the manufacturer’s
description (protocol P/N 4304671, Perkin Elmer). A threshold line was set in
the exponential phase of the amplification, the accurate CT value represents the
cycle where the increase in fluorescence in both dye layers in the assay have
passed the threshold. A low CT value represents a high mRNA expression and
vice versa. The CT value for rRNA (VIC layer) was subtracted from the CT value
of the immunological marker (FAM layer) to calculate Δ-CT for the calibrator
and samples in each T-reg associated marker gene expression assay. Δ-CT values
for duplicate wells of the calibrator sample for each marker were averaged
(spontaneous expression). The average delta (calibrator) value was subtracted
~ 52~
from the Δ-CT values of samples to calculate their ΔΔ-CT value. The ΔΔ-CT value
for duplicate wells of each sample was averaged. This operation normalises the
number of target mRNA molecules to the number of rRNA molecules. Relative
quantification values were obtained after calculating the 2-averaged ΔΔ-CT.
Enzyme linked immunosorbent assay (ELISA) (paper III)
Secretion of the cytokine TGF-β1 in cell supernatants were analysed in paper III
with Quantikine human TGF-β1 ELISA (R&D Systems, Abingdon, UK) according
to the manufacturer’s recommendation. Briefly, TGF-β1 in cell supernatants
were activated by addition of hydrochloric acid (HCl), diluted and incubated for
2 hours at RT. After several wash-steps, with wash buffer (included in the kit),
TGF-β1 conjugate was added, followed by incubation for 2 hours at RT. After
additional wash steps, as previously, substrate solution (included in the kit) was
added and incubated in darkness for 30 minutes at RT. Stop solution (included
in the kit) was added and the plate was read within 30 minutes at OD 450 nm.
The range of the standard curve was 31.2-2000 pg/ml, and a limited number of
samples had a concentration below the detection limit of the ELISA.
Flow cytometry
In paper V, flow cytometry was used to analyse both extra- and intracellular
expression of markers associated to Treg cells in whole blood. Staining was
performed within 24 hours from blood sampling. Blood was incubated for 15
minutes in darkness with extracellular antibodies associated to Treg cells;
fluorescein isothiocyanate (FITC)-conjugated CD39 (Biolegend, San Diego,
California, USA), peridinin-chlorophyll proteins-cyanin5.5 (PerCP-Cy5.5)-
conjugated CD45RA (Biolegend), PE-Cy7-conjugated CD25 (Biolegend),
allophycocyanin (APC)-conjugated CD127 (BD Biosciences, San José, California,
USA) and APC-Cy7-conjugated CD4 (Biolegend), followed by wash in PBS

~ 53~
(Medicago AB, Uppsala, Sweden) supplemented with 0,5 % bovine serum
albumin (BSA) (Sigma-Aldrich, St Louis, Missouri, USA) and centrifugation at
500 g for 5 minutes. After removal of cell supernatant with pasteur pipette, cells
were resuspended and treated with Fixation/Permeabilization buffer
(eBioscience, San Diego, California, USA) for 30 minutes at 4°C in darkness,
followed by centrifugation for 10 minutes at 500 g. After another wash step, cells
were resuspended in Permeabilization buffer (eBioscience) and intra cellular
PE-conjugated FOXP3 antibody was added. After 30 minutes of incubation in
darkness at RT cells were washed with PBS containing 0.5% BSA and
centrifuged for another 5 minutes at 500 g. After removal of cell supernatant,
cells were resuspended in PBS containing 0.5% BSA and kept at 4°C until
analysis.
Gating strategy and analysis of flow cytometric data
Flow cytometric data were analyzed with Kaluza 1.1 (Beckman Coulter,
Manchester, UK), and all analyses were blinded. Lymphocytes were gated based
on forward scatter (FSC) and side scatter (SSC). Initially, CD4+ cells were gated
(figure 7a), followed by gating of CD25+ cells (figure 7b). The CD4+ CD25+
population was either used in total (figure 7c) or after gating of the 2% highest
in this population, termed CD4+ CD25high (figure 7d). Results were either
expressed as frequency of expressed markers (%) or as MFI, which is equivalent
to the amount of receptors on the cell.

~ 54~
Figure 7: Gating strategy for a: Lymphocyte population, b: CD4+ population, c: Total CD4+ CD25+
population, d: Strict CD4+ CD25high population
Statistical analyses
As the data were not normally distributed, non-parametric statistical analyses,
corrected for ties, were used throughout the entire thesis. Three or more groups
were compared using Kruskal-Wallis, while Mann-Whitney U-test was used for
comparison between two groups. In paper III Wilcoxon signed rank test was
employed for paired observation for fresh versus cryopreserved PBMC and 48
hours versus 96 hours respectively. Correlation between mRNA expression and
Fig 7a Fig 7b
Fig 7c Fig 7d
~ 55~
protein levels was calculated by a bivariate, two-tailed Spearson correlation test.
A probability level of <0.05 was considered statistically significant, while a
probability level <0.1 was regarded a trend. In paper I calculations were
performed using the statistical package STATVIEW 5.0.1 for Macintosh (Abacus
Concepts Inc., Berkely, CA, USA), for paper 2 and 3 calculations were performed
using SPSS 14.0 for Windows (SPSS Inc., Chicago, IL, USA) and for paper 4 and 5
PASW Statistics 18.0 for Windows (SPSS Inc., Chicago, IL, USA).
Ethics
Collection of blood samples, SPT and questionnaires included in the study was
performed after informed consent from all parents or responsible guardians, or
the participant if he/she was over 18 years of age. The studies were approved by
the Ethics Committee of the Faculty of Health Sciences, Linköping University,
Sweden.

~ 56~

~ 57~
RESULTS AND DISCUSSION
During an immune response several different cells are involved e.g. T-, B-, Treg-,
NK and Tc-cells. These immunological cells secrete e.g. cytokines and
chemokines and express different immune markers that can be detected by
immunological methods such as Luminex technique, ELIspot, flow cytometry
and real-time RT-PCR. We have evaluated both secretion of cytokines and
chemokines, as well as markers associated with different cells in order to
evaluate the immune response in children with T1D, celiac disease, allergy, or a
combination of two of these diseases.
Children with T1D showed a decreased spontaneous IL-15 secretion and a
decreased spontaneous and PHA-induced expression of FOXP3
The spontaneous secretion of IL-15 was decreased in children with T1D in
comparison to children with allergy, combinations of T1D and celiac disease,
T1D and allergy, celiac disease and allergy as well as reference children (figure
8), when evaluated with Luminex-technique (paper II). Our results are in
contrast to a previous report showing that levels of IL-15 are elevated in serum
of T1D-patients [66]. This difference may be due to different methods, i.e. the
use of PBMC versus serum. Kuczynski et. al. [66] further found that high serum
levels of IL-15 are correlated to a high hemoglobin A1c (HbA1c). In NK-cell
depleted NOD-mice IL-15 has a protective role against T1D-development, and
IL-15 was found to both increase the suppressive effect of CD4+ CD25+ Tregs and
the FOXP3-expression in these cells [67]. Administration of a human IL-15-IgG-
2b recombinant cytokine to NOD-mice reduced the cumulative incidence of
diabetes, an effect that might be due to the anti-apoptotic effects of IL-15 [152].
Additionally, treatment with IL-15 fusion protein in combination with
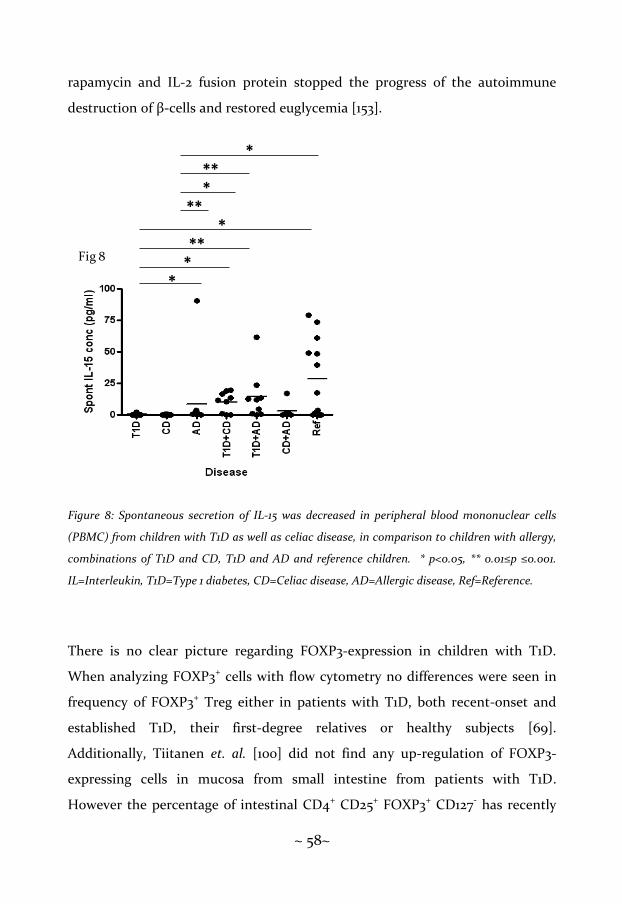
~ 58~
rapamycin and IL-2 fusion protein stopped the progress of the autoimmune
destruction of β-cells and restored euglycemia [153].
Figure 8: Spontaneous secretion of IL-15 was decreased in peripheral blood mononuclear cells
(PBMC) from children with T1D as well as celiac disease, in comparison to children with allergy,
combinations of T1D and CD, T1D and AD and reference children. * p<0.05, ** 0.01≤p ≤0.001.
IL=Interleukin, T1D=Type 1 diabetes, CD=Celiac disease, AD=Allergic disease, Ref=Reference.
There is no clear picture regarding FOXP3-expression in children with T1D.
When analyzing FOXP3+ cells with flow cytometry no differences were seen in
frequency of FOXP3+ Treg either in patients with T1D, both recent-onset and
established T1D, their first-degree relatives or healthy subjects [69].
Additionally, Tiitanen et. al. [100] did not find any up-regulation of FOXP3-
expressing cells in mucosa from small intestine from patients with T1D.
However the percentage of intestinal CD4+ CD25+ FOXP3+ CD127- has recently
*
*
*
*
**
**
**
*
Fig 8

~ 59~
been shown to be decreased in T1D patients in comparison to healthy subjects
and individuals with celiac disease [72]. Dendritic cells from lamina propria in
T1D patients were further found to be unable to convert CD4+ CD25- cells into
CD4+ CD25+ FOXP3+ CD127- Treg cells [72]. However, this group of T1D
consisted of individuals with both T1D as a single disease and patients with T1D
and celiac disease in combination [72]. Further, effector T-cells in diabetic
individuals have been shown to be insensitive to regulation by induced CD4+
FOXP3+ cells, as well as nTreg direct isolated from blood, suggesting a defect
not in the Treg population but defects in effector T-cells instead [154]. Recently
Han et. al. [155] reported that patients with long-term T1D had a decreased fold-
change of FOXP3 mRNA-expression in comparison to both newly diagnosed
T1D-patients and healthy controls. We found that spontaneous mRNA-
expression was decreased in children with T1D in comparison to children with
celiac disease (figure 9a). Further, PHA-induced mRNA-expression of FOXP3
was reduced in children with T1D in comparison to children with celiac disease
and children with combination of T1D and celiac disease (figure 9b). Given the
diverging results from several studies regarding FOXP3-levels in T1D patients
it´s hard to draw an unambiguous conclusion, and obviously there is a need for
more research concerning this matter.

~ 60~
Figure 9: Spontaneous FOXP3 mRNA-expression was decreased in children with T1D in
comparison to children with celiac disease, as well as PHA-induced mRNA expression of FOXP3,
in comparison to children with celiac disease and combinations of T1D and celiac disease. In
contrast was the spontaneous and PHA-induced mRNA expression of FOXP3 increased in
children with celiac disease in comparison to reference. * p<0.05, ** 0.01≤p ≤0.001.
FOXP3=Forkhead box protein 3, PHA=Phytohaemagglutinin, T1D=Type 1 diabetes, CD=Celiac
disease, Ref=Reference.
In conclusion:
11.0
13.5
16.0
Spo
nt.
FO
XP
3 m
RN
Aex
pr.
(del
ta C
t)
T1D CD
T1D
+C
D Re
f
1.0
3.5
6.0
8.5
*
*
PH
A in
d. F
OX
P3
mR
NA
exp
r. (d
elt
a C
t)
T1D
CD
T1D
+C
D
Re
f
1.0
3.5
6.0
8.5
11.0
13.5
16.0
**
*
*Fig 9a Fig 9b
Type 1 diabetes
FOXP3
FOXP3
IL-15
PHA
Spontaneous

~ 61~
Children with celiac disease showed decreased spontaneous IL-4 and IL-
15 secretion but an increased expression of spontaneous, insulin-, gluten-
and PHA-induced FOXP3
Celiac disease has a Th1-associated immune response, reported previously by
several groups [93-95]. Interferon-γ is shown to modify epithelial barrier
function through a modification of tight junction function altering the
permeability of the epithelium [156], and expression of IFN-γ mRNA in mucosa
from patients with celiac disease was significantly increased in comparison to
healthy subjects [157]. Further IFN-γ mRNA-expression in intraepithelial
lymphocytes (IEL) was increased in three groups of children with celiac disease
(untreated, on GFD or challenged) in comparison to control subjects [94].
Further, expression of IFN-γ mRNA, but not IL-4 mRNA, was increased in
mucosa from patients with celiac disease in comparison to controls [95].
Secretion of IL-4 in celiac disease seems to be associated with disease activity, as
children with a treated celiac disease secreted no IL-4, while untreated patients
showed an increased secretion of IL-4 in peripheral leucocytes [93]. Still, serum
levels of IL-4 was shown to be elevated in children with untreated celiac disease
and those on GFD with antibodies against tTG, in comparison to children on
GFD without tTG antibodies or controls [158]. We found that children with
celiac disease showed a decreased IL-secretion assessed with ELIspot-technique
(paper I), in concordance with a Th1-profile which is the most dominant feature
in celiac disease patient (figure 10). The difference between reports showing an
increased or a decreased IL-4 secretion is probably due to different methods and
matrices, or difference in disease process, i.e. untreated versus treated.

~ 62~
Figure 10: Spontaneous secretion of IL- was decreased in children with celiac disease in
comparison to children with T1D, allergy and combined T1D and allergy. * p<0.05, ** 0.01≤p
≤0.001 *** p<0.001. IL=Interleukin, T1D=Type 1 diabetes, CD=Celiac disease, AD=Allergic disease,
Ref=Reference
Interleukin-15 is involved in the disease process in celiac disease, as
demonstrated in biopsies from small intestine in patients with celiac disease,
both treated and untreated, as well as healthy controls [97]. Induced IL-15
epithelial modulations were noted in patients with celiac disease, especially
untreated, but not in controls, and this modification could be inhibited by anti-
IL-15-antibodies [97]. Further, IL-15 was reported to be overexpressed both in
lamina propria and the intestinal epithelium in patients with untreated celiac
disease, including refractory celiac sprue, however not in treated patients or
controls [98]. Interleukin-15 has also been reported to have effects on celiac
disease process in mice. DePaolo et. al. [99] reported that when transgenic mice,
constitutively expressing IL-15, were stimulated with OVA together with retinoic
acid Treg cells were inhibited, a Th1-response via IFN-γ was induced and the
IL-4
[sp
ots
/10
0.0
00
PB
MC
]
Fig 10
0
10
20
30
40
50
60
70A
D
CD
T1
D
CD
+ A
T1
D +
AD
T1
D +
CD
Ref
**
***
** ***
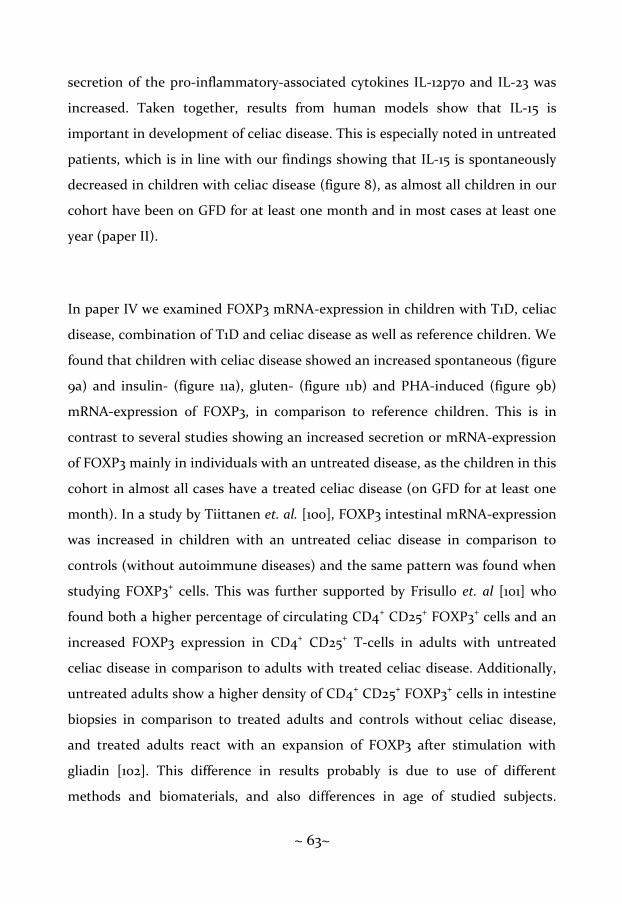
~ 63~
secretion of the pro-inflammatory-associated cytokines IL-12p70 and IL-23 was
increased. Taken together, results from human models show that IL-15 is
important in development of celiac disease. This is especially noted in untreated
patients, which is in line with our findings showing that IL-15 is spontaneously
decreased in children with celiac disease (figure 8), as almost all children in our
cohort have been on GFD for at least one month and in most cases at least one
year (paper II).
In paper IV we examined FOXP3 mRNA-expression in children with T1D, celiac
disease, combination of T1D and celiac disease as well as reference children. We
found that children with celiac disease showed an increased spontaneous (figure
9a) and insulin- (figure 11a), gluten- (figure 11b) and PHA-induced (figure 9b)
mRNA-expression of FOXP3, in comparison to reference children. This is in
contrast to several studies showing an increased secretion or mRNA-expression
of FOXP3 mainly in individuals with an untreated disease, as the children in this
cohort in almost all cases have a treated celiac disease (on GFD for at least one
month). In a study by Tiittanen et. al. [100], FOXP3 intestinal mRNA-expression
was increased in children with an untreated celiac disease in comparison to
controls (without autoimmune diseases) and the same pattern was found when
studying FOXP3+ cells. This was further supported by Frisullo et. al [101] who
found both a higher percentage of circulating CD4+ CD25+ FOXP3+ cells and an
increased FOXP3 expression in CD4+ CD25+ T-cells in adults with untreated
celiac disease in comparison to adults with treated celiac disease. Additionally,
untreated adults show a higher density of CD4+ CD25+ FOXP3+ cells in intestine
biopsies in comparison to treated adults and controls without celiac disease,
and treated adults react with an expansion of FOXP3 after stimulation with
gliadin [102]. This difference in results probably is due to use of different
methods and biomaterials, and also differences in age of studied subjects.
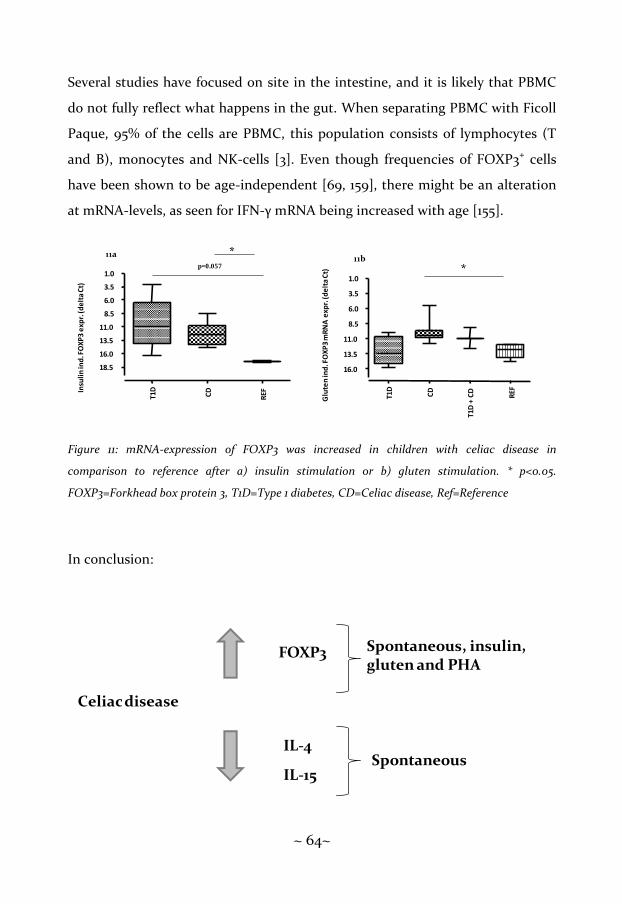
~ 64~
Several studies have focused on site in the intestine, and it is likely that PBMC
do not fully reflect what happens in the gut. When separating PBMC with Ficoll
Paque, 95% of the cells are PBMC, this population consists of lymphocytes (T
and B), monocytes and NK-cells [3]. Even though frequencies of FOXP3+ cells
have been shown to be age-independent [69, 159], there might be an alteration
at mRNA-levels, as seen for IFN-γ mRNA being increased with age [155].
Figure 11: mRNA-expression of FOXP3 was increased in children with celiac disease in
comparison to reference after a) insulin stimulation or b) gluten stimulation. * p<0.05.
FOXP3=Forkhead box protein 3, T1D=Type 1 diabetes, CD=Celiac disease, Ref=Reference
In conclusion:
Glu
ten
ind
. FO
XP
3 m
RN
Ae
xpr.
(de
lta
Ct)
T1D
CD
T1D
+ C
D
REF
1.0
3.5
6.0
8.5
11.0
13.5
16.0
*
T1D
CD
REF
1.0
3.5
6.0
8.5
11.0
13.5
16.0
18.5
Insu
lin
ind
. FO
XP
3 e
xpr.
(de
lta
Ct)
11a *p=0.057
11b
Celiacdisease
FOXP3 Spontaneous, insulin, gluten and PHA
IL-15
IL-4Spontaneous

~ 65~
Children with allergy showed an increased birch- and cat-induced IL-4
secretion, an increased spontaneous IFN-γ, IL-10 and IL-12 secretion
Allergy and asthma are diseases with a Th2-deviated immune response, with
secretion of e.g. IL-4 that drives B-cells to produce IgE. Th2-associated cells have
also been demonstrated in the airways of individuals with atopic asthma [118,
160]. This was confirmed in paper I, where allergic children responded with an
increased IL-4 secretion after stimulation with both birch (figure 12a) and cat
(figure 12b), studied by ELIspot-technique.
Figure 12: Secretion of IL-4 was increased in allergic children after a) birch stimulation, in
comparison to children with T1D, celiac disease, combinations of celiac disease and allergy, T1D
and celiac disease and reference or b) cat stimulation, in comparison to children with T1D, celiac
disease, celiac disease and allergy in combination and reference. * p<0.05 ** 0.01≤p ≤0.001.
IL=Interleukin, T1D=Type 1 diabetes, CD=Celiac disease, AD=Allergic disease, Ref=Reference
Fig 12a
-40
-20
0
20
40
60
80
100
IL-4
by
bir
ch [
spo
ts/1
00
00
0 P
BM
C]
-40
-20
0
20
40
60
80
100
120
140
160
IL-4
by c
at
[sp
ots
/100 0
00 P
BM
C]
**
**
*
*
*
**
*
*
*
AD
CD
T1D
CD
+A
D
T1
D +
AD
T1
D +
CD
Ref
AD
CD
T1
D
CD
+A
D
T1D
+A
D
T1
D +
CD
Ref
Fig 12b

~ 66~
In atopic individuals cells producing IFN-γ have been shown to be decreased in
CD4+ cells, but not in CD8+ cells [119], and apoptosis of IFN-γ-producing cells
has been shown to be increased in atopic individuals [161]. However, there are
conflicting results, as IFN-γ, a Th1-associated cytokine, has been proposed to be
involved in asthma and atopy, in particular in CD8+ cells. Further, it has been
shown that the percentage of IFN-γ+ cells is increased in BAL fluid in patients
with atopic asthma, compared to atopic patients without asthma as well as
healthy controls [162]. Expression of IFN-γ mRNA in sputum has been
demonstrated to be increased in patients with moderate to severe asthma
compared to mild asthma, but mRNA expression of IFN-γ showed to be
decreased in allergic patients compared to non-allergic patients in the same
study [163]. These results were further supported by Shannon e. al. [164],
showing an increased IFN-γ and IL-8 expression in subepithelia in patients with
severe asthma compared to moderate asthma. Our data are in line with this
observation, showing an increased spontaneous IFN-γ secretion in children with
allergy, studied by both ELIspot (figure 13a) (paper I) and Luminex technique
(figure 13b) (paper II).
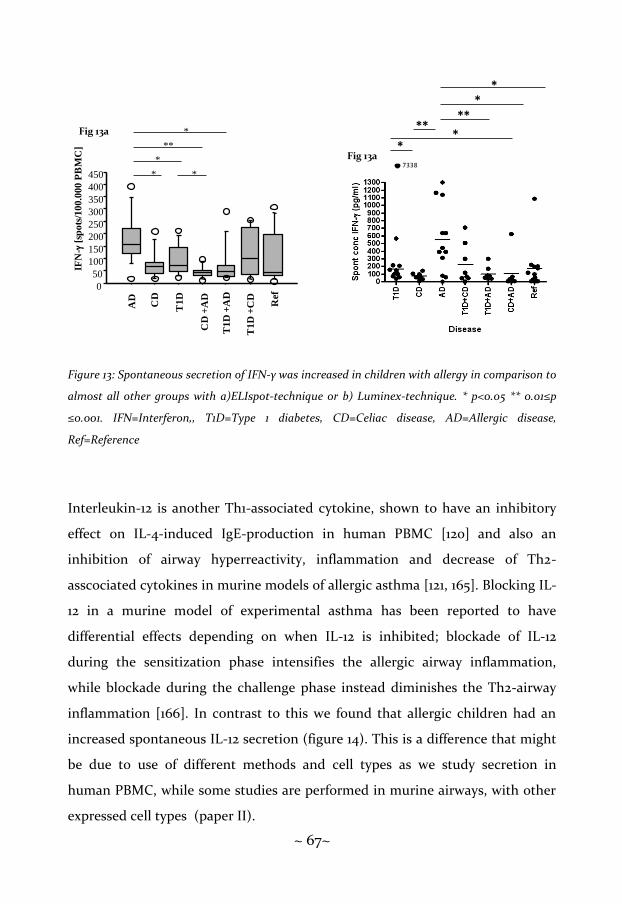
~ 67~
Figure 13: Spontaneous secretion of IFN-γ was increased in children with allergy in comparison to
almost all other groups with a)ELIspot-technique or b) Luminex-technique. * p<0.05 ** 0.01≤p
≤0.001. IFN=Interferon,, T1D=Type 1 diabetes, CD=Celiac disease, AD=Allergic disease,
Ref=Reference
Interleukin-12 is another Th1-associated cytokine, shown to have an inhibitory
effect on IL-4-induced IgE-production in human PBMC [120] and also an
inhibition of airway hyperreactivity, inflammation and decrease of Th2-
asscociated cytokines in murine models of allergic asthma [121, 165]. Blocking IL-
12 in a murine model of experimental asthma has been reported to have
differential effects depending on when IL-12 is inhibited; blockade of IL-12
during the sensitization phase intensifies the allergic airway inflammation,
while blockade during the challenge phase instead diminishes the Th2-airway
inflammation [166]. In contrast to this we found that allergic children had an
increased spontaneous IL-12 secretion (figure 14). This is a difference that might
be due to use of different methods and cell types as we study secretion in
human PBMC, while some studies are performed in murine airways, with other
expressed cell types (paper II).
7338
*
**
****
*IF
N-g
[sp
ots
/100.0
00 P
BM
C]
0
50
100
150
200
250
300
350
400
450 *
**
*
*
*
Fig 13a
Fig 13a
AD
CD
T1D
CD
+A
D
T1D
+A
D
T1D
+C
D
Ref

~ 68~
Figure 14: Spontaneous secretion of IL-12 was increased in children with allergy in comparison to
combination of T1D and allergy and reference. * p<0.05 ** 0.01≤p ≤0.001. IL=Interleukin,
T1D=Type 1 diabetes, CD=Celiac disease, AD=allergic disease, Ref=Reference
Interleukin-10 is a cytokine produced by monocytes, B-cells, both Th1- and Th2-
cells, and to some extent also NK-cells [167, 168]. They are secreted by TR1-cells,
and polymorphisms in IL-10 genes have been reported to be associated to both
atopic and non-atopic asthma in children [40, 169]. Interleukin-10 has been
reported by several groups to be instrumental in the use of specific
immunotherapy (SIT). Grass pollen SIT significantly increases IL-10 in patients
undergoing grass pollen immune therapy in comparison to untreated atopic
controls [170], IL-10 has also been shown to be secreted by both specific T-cells
and antigen presenting cells after high doses of bee venom [123]. Monocytes
secreting IL-10 are increased in atopic patients, in comparison to healthy
controls [122]. We found that allergic children spontaneously secreted higher
200114
*
*
***
**
Fig 14

~ 69~
levels of IL-10 in comparison to all the other studied groups (figure 15), which is
in line with reports from other groups (paper III).
Figure 15: Spontaneous secretion of IL-10 was increased in children with allergy in comparison to
all other studied groups. * p<0.05 ** 0.01≤p ≤0.001. IL=Interleukin, T1D=Type 1 diabetes,
CD=Celiac disease, AD=Allergic disease, Ref=Reference
In conclusion:
**
*
****
****
Fig 15
Allergy
IL-4 Birch, cat
IL-10
IFN-γ
Spontaneous
~ 70~
Children with a combination of T1D and celiac disease showed a
decreased inhalant- and food-antigen-induced IFN-γ secretion, however
an increased Treg-associated response
In paper I we found that children with combination of T1D and celiac disease
showed a decreased secretion of IFN-γ after stimulation with βLG (figure 16a),
OVA (figure 16b), gluten (figure 16c), birch (figure 16d) and cat (figure 16e). As
far as we know, this has not been described previously. It has previously been
suggested that the immune system in the gut is involved in the development of
T1D. Expression of HLA-DR, HLA-DP and adhesion molecules has shown an
increased expression in T1D patients with normal mucosa, and in lamina propria
IL-1α+ and IL-4+ cells were expressed to great extent [129]. Gliadin challenge
among T1D patients give to hand that subsets of these patients show an
immunological response to gliadin with lymphocyte recruitment [126]. Gliadin
has also recently been reported to induce moderate enteropathy, and barrier
dysfunction in NOD-DQ8 mice, however insulitis was only induced after
depletion of CD25+ FOXP3+ T cells [131]. Additionally, as reviewed in [127],
gliadin is considered a part of the pathogenesis in both T1D and celiac disease,
which has effects on intestinal permeability and changes in tight junction
dynamics, through the binding of gliadin to CXCR3. All together this implies a
role of the immune system in the gut in both T1D and celiac disease that might
affect oral tolerance. However, this is a complex network and our results might
reflect a suppression of the immune response when combining two Th1-
associated diseases.

~ 71~
Figure 16: Secretion of IFN-γ was decreased in children with combination of T1D and celiac
disease a) after stimulation with βLG, in comparison to children with T1D, celiac disease,
combination of T1D and allergy and reference, and b) after stimulation with OVA in comparison
to children with T1D, celiac disease, allergy, combination of celiac disease and allergy and
reference, and c) after stimulation with gluten in comparison to reference children, and d) after
stimulation with birch in comparison to children with T1D, allergy, combination of T1D and
allergy and reference, and e) after stimulation with cat in comparison to children with T1D,
combination of T1D and allergy and reference. * p<0.05 ** 0.01≤p ≤0.001. IFN=Interferon,
βLG=Betalactoglobulin, OVA=Ovalbumin, T1D=Type 1 diabetes, CD=Celiac disease, AD=Allergic
disease, Ref=Reference.
IFN
-gb
y b
LG
[sp
ots
/100.0
00 P
BM
C]
****
*
*
-150-100-50
050
100150200250300350
IFN
-gb
y O
VA
[sp
ots
/10
0.0
00
PB
MC
]
*
*
**
**
**
-100
-50
0
50
100
150
200
-125-100-75-50-25
0255075
100125
5
IFN
-gb
y g
lute
n [
spo
ts/1
00
.00
0 P
BM
C]
*
AD
CD
T1
D
CD
+A
D
T1
D +
AD
T1
D +
CD
Ref
AD
CD
T1D
CD
+A
D
T1D
+A
D
T1
D +
CD
Ref
AD
CD
T1D
CD
+A
D
T1D
+A
D
T1
D +
CD
Ref
Fig 16a Fig 16b Fig 16a
IFN
-gb
y b
irch
[sp
ots
/10
0 0
00 P
BM
C] **
*
*
IFN
-gb
y c
at
[sp
ots
/10
0 0
00 P
BM
C] *
**
*
*
-200
-100
0
100
200
300
400
500
-200
-100
0
100
200
300
400
500
AD
CD
T1D
CD
+A
D
T1D
+A
D
T1
D+
CD
Ref
AD
CD
T1D
CD
+A
D
T1D
+A
D
T1
D+
CD
Ref
Fig 16d Fig 16e

~ 72~
In contrast to a suppressed Th1-response in combined T1D and celiac disease,
we found that these children have an increased expression of the Treg-
associated markers FOXP3 (figure 17a) and CD39 (figure 17b), and decreased
expression of CD127 (figure 17c-e) and CD45RA (figure 17d-e), both negatively
associated to Treg cells (paper V). First-degree relatives to T1D-patients have
been shown to have decreased percentage of CD4+ CD25+ CD127- cells in
comparison to healthy controls, and a tendency of decrease of CD4+ CD25+
FOXP3+ cells in comparison to healthy individuals [71]. In a study by Badami et.
al. [72], T1D patients were found to have a decreased percentage of CD4+ CD25+
FOXP3+ CD127- intestinal cells in comparison to healthy individuals and subjects
with celiac disease. However 5/10 T1D patients had additional celiac disease but
the difference remained after a division of the T1D-group into one with
exclusively T1D and one with combination of T1D and celiac disease [72].
Further did Badami et. al. [72] compare percentage of CD4+ CD25+ FOXP3+
CD127- intestinal cells to percentage of CD4+ CD25+ FOXP3+ CD127- in PBMC,
and found that the difference disappeared, which is in line with Brusko et. al.
[69], but in contrast to our findings.
In small-bowel mucosa from children with celiac disease, combination of T1D
and celiac disease and controls mRNA levels of FOXP3 were reported to be
increased in children with combined T1D and celiac disease in comparison to
both subjects with celiac disease and healthy controls [132]. Additionally, the
number of FOXP3+ cells were increased after immunohistochemical staining in
children with combination of T1D and celiac disease in relation to controls, and
the same was seen for children with celiac disease alone in comparison to
controls [132]. Our findings are unique in respect of studies in Treg-associated
markers in children with combination of T1D and celiac disease, and they are
indicating that this combination increases the Treg population, especially in
comparison to children with solely T1D or celiac disease.

~ 73~
Figure 17a: Increased frequency of FOXP3 cells in the strict CD4+ CD25high population, in children
with combination of T1D and celiac disease, in comparison to children with exclusively T1D.
Figure 17b: Increased MFI of FOXP3 the strict CD4+ CD25high population, on comparison to
children with exclusively celiac disease.
Figure 17: Decreased MFI of CD127 in total CD4+ CD25+ population, in comparison to children
with exclusively T1D.
Figure 17d: Decreased CD127 and CD45RA the strict CD4+ CD25high population, in children with
combination of T1D and celiac disease in comparison to children with T1D or celiac disease.
Figure 17e: Decreased CD127 and CD45RA the total CD4+ CD25+ population, in children with
combination of T1D and celiac disease in comparison to children with T1D or celiac disease.
* p<0.05, ** 0.01≤p ≤0.001. MFI=Median fluorescence intensity, FOXP3=Forkhead box protein 3,
T1D=Type 1 diabetes, CD=Celiac disease, Ref=Reference.
* **Fig 17bFig 17a

~ 74~
In conclusion:
Children with a combination of T1D and allergy showed an increased
PHA-induced IFN-γ and IL-4 secretion, as well as an increased birch-
induced secretion of several cytokines
In paper I we showed that children with a combination of T1D and allergy
showed an increased PHA-induced IFN-γ (figure 18a) and IL-4-response (figure
18b). This was in contrast to a study by Rachimel et. al. [136] who analyzed IFN-
γ, IL-2, IL-4 and IL-10 secretion with ELIspot and ELISA, after stimulation with
GAD, house dust mite, PHA, TT and anti-CD3 monoclonal antibody. They
found that children with a combination of T1D and asthma and children with
T1D as single disease had similar cytokine pattern [136]. However, children with
a combination of T1D and celiac disease had a decreased Th1/Th2 ratio in
comparison to diabetic subjects [136]. Only stimulation with house dust mite
induced an increased secretion of Th2 cytokines (IL-4 and IL-13) in children
with a combination of T1D and celiac disease, as well as the total (i.e. both
T1D + celiacdisease
IFN-γ βLG, OVA, gluten, birch and cat
FOXP3CD39
Frequencyand MFICD4+ CD25high andCD4+ CD25+
CD45RACD127
Frequencyand MFICD4+ CD25high andCD4+ CD25+

~ 75~
unstimulated and stimulated) secretion of IL-10 [136]. The difference to our
findings may be caused by differences in age, or the fact that the allergic
children in our cohort consisted of children with asthma, atopic dermatitis, food
allergy and allergic rhinoconjunctivis.
Further, Kainonen et. al. [137] published a study the same year, where they
analyzed the concentration of IFN-γ, TNF-α, IL-2, IL-4, IL-5 and IL-10 with a
multiplexed flow cytometric assay in PBMC, after stimulation with anti-CD3 and
anti-CD28 in children with T1D, asthma, a combination of T1D and asthma and
healthy children as controls. They found an increased spontaneous secretion of
IFN-γ, TNF-α and IL-10 in children with combined T1D and asthma in
comparison to children with T1D, asthma or healthy children [137]. Stimulation
with CD3 and CD28 only increased IL-10 secretion in children with exclusively
T1D or asthma, and controls, but not in children with T1D and asthma in
combination [137]. The differences displayed between our findings and
Kainonens is probably due to different methods as well as the fact that PHA and
CD3 use different pathways for stimulation [171, 172].
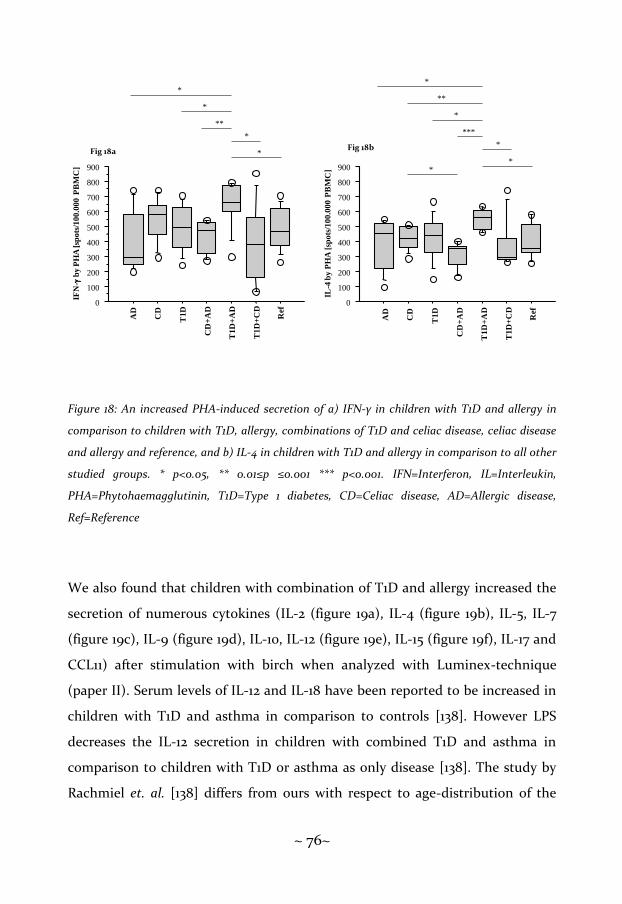
~ 76~
Figure 18: An increased PHA-induced secretion of a) IFN-γ in children with T1D and allergy in
comparison to children with T1D, allergy, combinations of T1D and celiac disease, celiac disease
and allergy and reference, and b) IL-4 in children with T1D and allergy in comparison to all other
studied groups. * p<0.05, ** 0.01≤p ≤0.001 *** p<0.001. IFN=Interferon, IL=Interleukin,
PHA=Phytohaemagglutinin, T1D=Type 1 diabetes, CD=Celiac disease, AD=Allergic disease,
Ref=Reference
We also found that children with combination of T1D and allergy increased the
secretion of numerous cytokines (IL-2 (figure 19a), IL-4 (figure 19b), IL-5, IL-7
(figure 19c), IL-9 (figure 19d), IL-10, IL-12 (figure 19e), IL-15 (figure 19f), IL-17 and
CCL11) after stimulation with birch when analyzed with Luminex-technique
(paper II). Serum levels of IL-12 and IL-18 have been reported to be increased in
children with T1D and asthma in comparison to controls [138]. However LPS
decreases the IL-12 secretion in children with combined T1D and asthma in
comparison to children with T1D or asthma as only disease [138]. The study by
Rachmiel et. al. [138] differs from ours with respect to age-distribution of the
IFN
-g b
y P
HA
[sp
ots
/100
.000 P
BM
C]
IL-4
by
PH
A [
spo
ts/1
00
.00
0 P
BM
C]
*
*
***
*
**
*
*
*
*
*
**
*
0
100
200
300
400
500
600
700
800
900
0
100
200
300
400
500
600
700
800
900
AD
CD
T1
D
CD
+A
D
T1
D+
AD
T1
D+
CD
Ref
AD
CD
T1
D
CD
+A
D
T1
D+
AD
T1D
+C
D
Ref
Fig 18a Fig 18b

~ 77~
study group, different methods used and the fact that PHA and LPS use
different pathways for stimulation [171, 173].
Figure 19: Stimulation with birch increased a) IL-2 secretion in children with T1D and allergy in
combination in comparison to all other studied groups, and b) IL-4 secretion in children with
T1D and allergy in combination in comparison to children with allergy, combinations of T1D and
celiac disease, celiac disease and allergy and reference, and c) IL-7 secretion in children with
combination of T1D and allergy in comparison to all other groups, and d) IL-9 secretion in
children with T1D and allergy in comparison to all other groups, and e) IL-15 secretion in children
with T1D and allergy in combination in comparison to children with T1D, celiac disease, allergy
and combination of T1D and celiac disease, and f) secretion of IL-17 in children with combination
of T1D and allergy in comparison to children with T1D, allergy, combination of T1D celiac disease,
celiac disease and allergy and reference. * p<0.05, ** 0.01≤p ≤0.001 *** p<0.001. IL=Interleukin,
T1D=Type 1 diabetes, CD=Celiac disease, AD=allergy and Ref=Reference.
***
****
**
****
19a
**
*
*
*19b
***
*****
***
****
19c
*
***
**
****
**19d
**
**
19e
*****
***
**19f

~ 78~
In conclusion:
Children with a combination of celiac disease and allergy showed a
decreased spontaneous secretion of several cytokines
Interestingly, we found that children with a combination of celiac disease and
allergy showed a spontaneous decreased secretion of several cytokines (IL-1β,
IL-5, IL-6, IL-9 (figure 20a), IL-10 (figure 20b), IL-12 (figure 20c) and CCL3), a
result that, to the best of our knowledge, not yet has been reported by other
groups (paper II). Even though celiac disease is considered a Th1-deviated
disease, and allergy is considered a Th2-deviated disease, there are reports
showing that these diseases can coexist. In an Italian study, the prevalence of
celiac disease in atopics was significantly increased in comparison to the general
Italian population [140], which has been shown in a Finnish study as well, where
the cumulative incidence of asthma in children was increased in children with
celiac disease in comparison to children without this disease [141]. However, the
information of the immune response in children with celiac disease and allergy
is scarce, if not totally absent, which makes our results unique.
T1D + Allergy
IL-2, IL-4, IL-5, IL-7, IL-9, IL-10, IL-12, IL-15, IL-17, CCL11
Birch
IL-4PHA
IFN-γ
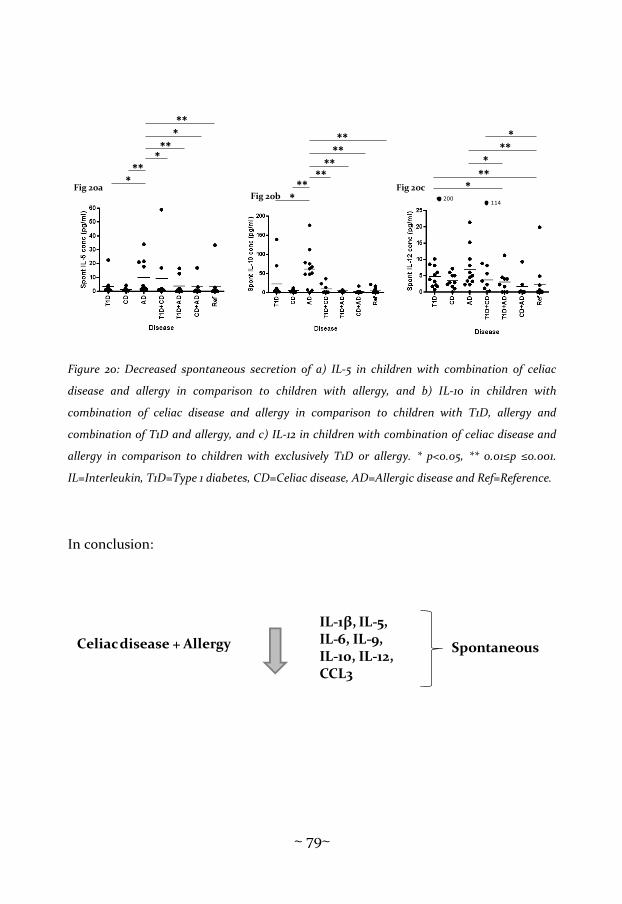
~ 79~
Figure 20: Decreased spontaneous secretion of a) IL-5 in children with combination of celiac
disease and allergy in comparison to children with allergy, and b) IL-10 in children with
combination of celiac disease and allergy in comparison to children with T1D, allergy and
combination of T1D and allergy, and c) IL-12 in children with combination of celiac disease and
allergy in comparison to children with exclusively T1D or allergy. * p<0.05, ** 0.01≤p ≤0.001.
IL=Interleukin, T1D=Type 1 diabetes, CD=Celiac disease, AD=Allergic disease and Ref=Reference.
In conclusion:
**
*
****
****
Fig 20b 200114
*
*
***
**
Fig 20c
***
*
**
***
Fig 20a
Celiacdisease + Allergy
IL-1β, IL-5, IL-6, IL-9, IL-10, IL-12, CCL3
Spontaneous

~ 80~
Methodological data
In paper III we performed a methodological study in order to evaluate how
cryopreservation affects Treg-associated markers (FOXP3, TGF-β, CTLA-4 and
sCTLA-4), as well as an examination of suitable time, 48 or 96 hours, for
detection of mRNA-expression of those markers. We found that cryopreserved
PBMC retain a stable spontaneous mRNA-expression throughout the
cryopreservation, and stimulated TGF-β, CTLA-4 and sCTLA-4, as well as
secreted TGF-β remained stable (figure 21-23). Recently, our group has reported
that cryopreserved CD4+ CD25+ CD127lo/- cells from PBMC still are able to
expand after cryopreservation with a mean fold change of 144 and a median fold
change of 104 [174]. This is in line with a study by Venet et. al. [148] examining
how cryopreservation affects CD4+ CD25+ CD127- cells from HIV-infected
subjects. They found that even if isolation of PBMC with Ficoll decreased the
MFI of CD4+ cells in comparison to whole blood, no further decrease was seen
after cryopreservation [148]. Additionally, they found that CD4+ CD25+ CD127-
cells remained stable after cryopreservation both in comparison to fresh PBMC
and whole blood, and even if a slight increase of percentage of Treg was visible,
there was no statistically significant difference [148]. In contrast to the work by
Elkord [146], reporting a decrease in frequency of CD4+ FOXP+ cells in PBMC
from healthy donors, this difference is likely due to different experimental
setups, i.e. real-time RT-PCR versus flow cytometry or differences in the freezing
protocol, as described by Van Hemelen [147]. Further we found that a
stimulation period of 48 hours in general was most suitable for detection of
FOXP3, TGF-β and CTLA-4 mRNA (figure 24, 25). Spontaneous mRNA-
expression was decreased after a 96 hours stimulation period in comparison to
48 hours; the same was seen in PHA-induced FOXP3 and TGF-β mRNA-
expression, as well as for TT-induced FOXP3 mRNA-expression. This result is in
line with a study by Allen et. al. [175] reporting the percentage of expressed
~ 81~
FOXP3, CD25, CTLA-4, CD69 and glucocorticoid-induced tumor necrosis factor
receptor compared between non-regulatory T-effector cells expressing CD4 and
naturally occurring CD4+ CD25+ during seven days, showing that the expression
of FOXP3 increased during the first 72 hours, followed by a decline.

~ 82~
Sp
on
tan
eo
us
FO
XP
3
TG
F-β
CT
LA
-4
sCT
LA
-4
A K PF
Fre
shC
ryo
pre
serv
ed
14
15 16 17 18
19
20
10 11 12
13
14
Fre
shC
ryo
pre
serv
ed
15
**
*
* *
**
19
20 21 22 23 24 25 26
Fre
shC
ryo
pre
serv
ed
27
Fre
shC
ryo
pre
serv
ed
02468
10
1214
Fre
shC
ryo
pre
serv
ed
01234567
Fre
shC
ryo
pre
serv
ed
0.00.5
1.0
1.52.0
2.5
3.0
Fre
shC
ryo
pre
serv
ed
0123456
Fre
shC
ryo
pre
serv
ed
0.0
0.5
1.0
1.5
2.0
Fre
shC
ryo
pre
serv
ed
0.0
0.5
1.0
1.5
2.0
2.53.0
3.5
Fres
hCr
yopr
eser
ved
05
1015
20
25
Fre
shC
ryo
pre
serv
ed
0.0
0.5
1.01.5
2.0
2.5
3.0
3.5
Fre
shC
ryo
pre
serv
ed
0.0
0.5
1.0
1.5
2.0
2.5
3.0
3.5
4.0
Fre
shC
ryo
pre
erv
ed
05
10
152025
30
35
Fres
hCr
yopr
eser
ved
0123456789
Fre
shC
ryo
pre
serv
ed
012345
Fre
shC
ryo
pre
serv
ed
0.0
0.5
1.01.5
2.0
2.5
3.0
3.54.0
4.5
PH
AT
Tβ
LG
OV
AB
CD
E
G
Fig
21
HI
J
LM
NO
QR
ST
Fre
shC
ryo
pre
serv
ed
012
313233
Fres
hCr
yopr
eser
ved
10 12
14 16 18 20
Fre
shC
ryo
pre
serv
ed
05
10
2025
Fre
sh
Cry
op
reserv
ed
012313
17
21
Fig
ure
21
A-T
: Co
mpa
riso
n b
etw
een
fre
sh a
nd
cry
opre
serv
edP
BM
C e
ffec
t o
n m
RN
A e
xpre
ssio
nm
RN
A e
xpre
ssio
n o
f fo
rkh
ead
box
p3
(FO
XP
3), t
ran
sfo
rmin
g g
row
th f
acto
r-β
(T
GF
-β),
cyt
oto
xic
T ly
mp
ho
cyte
an
tig
en-4
(C
TL
A-4
) a
nd
so
lub
le
CT
LA
-4 (
sCT
LA
-4)
for
spo
nta
neo
us
an
d p
erip
her
al b
lood
mon
on
ucl
ear
cell
s (P
BM
C)
stim
ula
ted
wit
h p
hyt
oh
aem
agg
luti
nin
(PH
A),
tet
an
us
toxo
id(T
T),
bet
ala
cto
glo
buli
nβ
LG
or
ova
lbu
min
(OV
A),
bef
ore
(
) a
nd
aft
er c
ryop
rese
rva
tio
n (
). S
pon
tan
eou
s ex
pre
ssio
n is
exp
ress
ed in
ΔC
t, w
hil
e st
imu
late
d s
am
ple
s a
re e
xpre
ssed
in r
ela
tive
tra
nsc
rip
tio
n. *
rep
rese
nts
a p
-va
lue
< 0
.05,
**
repr
esen
ts a
p-v
alu
e <
0.0
1.

~ 83~
Figu
re 2
2 A
-E: T
he
rela
tive
ch
ange
of
mR
NA
exp
ress
ion
of
fork
hea
dbo
x p3
(FO
XP
3),
tran
sfor
min
g gr
owth
fact
or-β
(T
GF
-β),
cy
toto
xic
T ly
mph
ocyt
e an
tige
n-4
(C
TL
A-4
) an
d so
lubl
e C
TL
A-4
(sC
TL
A-4
) fo
r sp
onta
neo
us
and
peri
pher
al b
lood
mon
onu
clea
r ce
lls
(PB
MC
) st
imu
late
d w
ith
ph
yto
ha
ema
gg
luti
nin
(PH
A),
tet
an
us
toxo
id(T
T),
bet
ala
cto
glo
bu
lin
βL
Go
r o
valb
um
in(O
VA
),
bet
wee
n fr
esh
an
d c
ryo
pre
serv
edP
BM
C. T
he
inte
rqu
art
ile
ran
ge
rep
rese
nts
th
e m
edia
n a
nd
th
e q
ua
rtil
es f
rom
25-
75%
.
Fig
22 S
po
nta
ne
ou
sF
OX
P3
TG
F-β
CT
LA
-4sC
TL
A-4
AB
CD
E
FO
XP
3T
GF
- bC
TL
A-4
sC
TL
A-4
-15
-10-505
10
Diff
PH
AT
Tb
LG
OV
A-1
5
-10-505
10
Diff
PH
AT
Tb
LG
OV
A-1
5
-10-505
10
Diff
PH
AT
Tb
LG
OV
A-1
5
-10-505
10
Diff
PH
AT
T
bL
GO
VA
-15
-10-505
10
Diff
Sp
on
tan
eo
us
TG
F-β
1
PH
AT
Tβ
LG
OV
A
Fig
23
*A
BC
DE
Fre
sh
Cry
op
rese
rve
d0
25
00
50
00
75
00
10
00
0
1250
0
Fre
shC
ryo
pre
serv
ed
0
25
00
50
00
75
00
10
00
0
1250
0
Fre
shC
ryo
pre
serv
ed
0
25
00
50
00
75
00
10
00
0
1250
0
Fre
shC
ryo
pre
serv
ed
0
25
00
50
00
75
00
10
00
0
12
50
0
Fre
shC
ryo
pre
serv
ed
0
25
00
50
00
75
00
10
00
0
1250
0
Figu
re 2
3 A
-E: C
ompa
riso
n b
etw
een
fre
sh a
nd
cryo
pres
erve
dP
BM
Cef
fect
on T
GF
-β1
secr
etio
n.
Pro
tein
leve
l of
tra
nsf
orm
ing
grow
th
fact
or-
β1 (
TG
F-β
1) f
or
spo
nta
neo
us
an
d p
erip
her
al
blo
od
mo
no
nu
clea
r ce
lls
(PB
MC
) st
imu
late
d w
ith
ph
yto
ha
ema
gg
luti
nin
(PH
A),
teta
nu
s to
xoid
(TT
), b
eta
lact
og
lob
uli
nβ
LG
or
ova
lbu
min
(OV
A),
bef
ore
(
) a
nd
aft
er c
ryo
pre
serv
ati
on
(
). C
on
cen
tra
tio
n i
s p
rese
nte
d in
pg
/ml.
*
rep
rese
nts
a p
-va
lue
< 0
.05.

~ 84~

~ 85~
~ 86~
SUMMARY AND CONCLUSION
Numerous cell types and cell populations are involved during an immune
response, in an intricate and balanced network. Occasionally this balance is
disturbed, leading to different diseases. One working model that tries to explain
this is the concept of Th1- and Th2-cells, commonly believed to be inhibit each
other. Further, cells with regulatory features, Tregs, are also important, as these
have the function of halting an ongoing immune response in order to avoid
harmful effects.
Type 1 diabetes is an autoimmune disease caused by the destruction of insulin-
producing β-cells in pancreas. The cause behind is still unknown, and as there is
yet no cure, individuals with T1D need a life-long treatment with insulin. Type I
diabetes is suggested to be of a Th1-deviated feature.
In celiac disease gluten, a protein present in major crops but dominant in wheat,
induces an immune response leading to villous atrophy and crypt hyperplasia in
the small intestine. The only cure for celiac disease is to exclude gluten from the
diet for the rest of life. From an immunological point-of-view, Th1-deviation has
been proposed in celiac disease as well.
Allergy has increased several-folds during the last 4-5 decades particularly in
affluent countries. Allergic disease affects different organs depending on the
specific allergen. A Th2-response is initiated after exposure to an allergen, which
in itself is not a threat but recognized by the immune system as something
harmful.
Patients with T1D or celiac disease have an increased risk to develop the other
disease, because of shared risk genes, and this is a more frequent combination,
than combining T1D and allergy or celiac disease and allergy. Due to the
paradigm of a balance between Th1 and Th2, the combination of one Th1-

~ 87~
deviated disease with one Th2-deviated seems unlikely, but is a reality. In this
thesis I examined the immune response in children with T1D, celiac disease,
allergy, or a combination of two of these diseases in relation to healthy children,
with focus on Th1, Th2 and Treg subsets of lymphocytes. Additionally, I
performed a methodological study in healthy adults, to examine the effect of
cryopreservation and optimal stimulation-period for Treg-associated markers.
Some of our results were expected with regard to previous reports on Th1- and
Th2-cells during different diseases. Studying children with one of these diseases
showed a decreased spontaneous Th2-response in children with celiac disease
and an increased Th2-response against birch and cat in allergic children.
However, allergic children displayed an elevated spontaneous Th1-response,
which could be due to a previously reported participation of IFN-γ in children
with asthma, as well as an increased IL-10 secretion, implying an increased
involvement of TR1 cells in children with allergy.
The most unique and interesting results in this thesis are those seen in children
with combinations of these diseases, as these combinations of diseases have not
been studied to a great extent previously. We found that the combination of
T1D and celiac disease decreased the Th1-response against both inhalation- and
foodantigens, but gave a more pronounced Treg-response. The combination of
T1D and allergy increased both Th1- and Th2-response against a general
stimulus, as well as in increased Th1-, Th2-, Treg- and pro-inflammatory
response against birch. However, the combination of celiac disease and allergy
instead decreased the spontaneous Th1-, Th2-, Treg- and pro-inflammatory
responses.

~ 88~
Thus, it actually seems that a combination of two Th1-associated diseases
suppresses the immune response and activates regulatory mechanisms, while
allergy shifts the immune response in different directions depending on which
disease it is combined with. Speculatively, the suppressive effect could be
caused by exhaustion of the immune cells from the massive pressure of two
immunological diseases, whereas the more pronounced Tr-regulatory activation
could be due to an attempt to compensate for dysfunction in the immune
response. Still, further investigation is needed to examine why the immune
response acts in diverging directions.
In the methodological study we found that Treg-associated markers are suitable
to use after cryopreservation, as there were no significant difference between
fresh and cryopreserved PBMC with regard to mRNA-expression of FOXP3,
CTLA-4, sCTLA-4 and TGF-β. Yet, it is important not to use fresh and
cryopreserved PBMC in the same study. Further is a stimulation period of 48
hours was found in general to be the most optimal for studying mRNA-
expression of Treg-associated markers.
In conclusion, the immune system is a complex network. The Th1-Th2 paradigm
is an over-simplification, but still a useful working model. Speculatively is it
possible that different subpopulations of lymphocytes are displayed in all
diseases, but at different levels and directions. Our results shed some light on
the thrilling interplays of the immune system, and hopefully it will have some
effect on disease prevention and treatment.

~ 89~
FUTURE PERSPECTIVES
This cohort is unique, and includes a satisfying number of children. There are
several things that can be studied in order to seek more clues regarding this
specific cohort. One remarkable result not included in the thesis, was seen in
allergic children, who reacted with a high Th2-response against insulin. Thus,
we analyzed insulin IgE, but did not receive any significant results. We have
searched the literature to find any possible explanation, with no result so far.
Numerous theories have been rejected, hence this is a question that needs to be
elicited more thoroughly.
As the immunological universe is expanding, other cell types, like Nk-cells and
Tc-cells could be considered to be analyzed. An ongoing study, in cooperation
with the county hospital Ryhov, Jönköping, not only increases the cohort, but
also introduces new laboratory protocols. The aim is to increase the cohort from
paper V, including all three diseases and perhaps even introduce a group
consisting of children with all three diseases. Hence, to elucidate how these
three immunological diseases interacts, this project is still ongoing.

~ 90~

~ 91~
ACKNOWLEDGEMENT
A thesis might be my personal, but without help I would not be here today, so I
would like end this thesis by expressing my sincere gratitude to all of you, who
helped me coming this far.
All the children participating in this study.
My main supervisor Maria Faresjö: Thank you for letting me be part of this, letting
me see the world from a researcher’s point of view. You are an ambitious woman,
and I am sure you will reach every goal you have in life.
Lennart Nilsson, my first co-supervisor: I think every PhD-student should have a
supervisor like you, especially during the last year. Thank you for being there for
me!
Karin Åkesson, my second co-supervisor: Your enthusiasm is marvelous, and I think
your energy is endless. Thank you for sharing some of it with me.
Karin Fälth-Magnusson: Your kindness is amazing and your knowledge is deep.
Thank you very much for helping me during these years!
Forum Scientium, the multidisciplinary research program at Linköping University,
for proving good possibilities for networking and cooperation across disciplines
within Life Sciences.
Peter Bang, present representative for Division of Pediatrics, and Johnny
Ludvigsson, former representative for Division of Pediatrics.

~ 92~
There are several individuals that make the life of a PhD-student much easier. Kicki
Helander “my” research nurse, besides taking excellent care of the families in this
study, you have always helped me and cheered me up whenever we have met. Anki
Gilmore-Ellis, you are an angel without wings! Maria Jenmalm, for interesting
research discussions. Madeleine Örlin, for your kindness. Florence Sjögren and Uno
Johansson for excellent technical assistance, and for answering every question a
million times without any sign of irritation. Kerstin, Håkan, Pia for taking care of
“every-day-life” at KEF and sharing your knowledge.
And all my wonderful friends, many of you former or present members of
Fikarummet™, the place where problems are solved and laughter are near. So here
goes, in random order: Jenny Walldén and Sara Tomičić, there were no others
choice for toast madams, I miss you both a lot, and admire your happiness and your
life-wisdom! Anna Rydén, what can I say? “I says hi?” ;). Thank you for making any
conference trip epic!
Ingela Johansson, next year we have to do some “backträning”! You are a really nice
person, and you are always welcome at “Camp VR”! Ammi Fornander, Gosia
Smolinska-Konefal, Martina Sandberg, Camilla Skoglund, Piiha-Lotta Jerevall,
Mimmi Persson, Anne Lahdenperä, Tina Bendrik and Kristina Briheim for being
helpful, kind and just lovely persons. Anna Lundberg, one of the best boxing
partners I have had, but also a very dear friend.
Present and former roomies: Stina “Shakira” Axelsson, you are caring and sweet,
I´m going to miss you! Kristina Warstedt, not only my roomie but also a very dear
friend. This would have been a much harder experience without you! Linda
Åkerman, you are kind, and you always, always go that extra mile to help someone.
Malin Fagerås, you are a really wise person, and kind of a role model.
~ 93~
Mikael Chéramy, Mikael Pihl, Rosaura Casas for being part of the coffee-drinkers,
and for giving me good laughter. All other personnel at KEF.
For my friends outside work; Karin, now I know that true friendship can be born at
F&S! Jessica, thank you for being there whenever I need it! Lasse B, for being so
happy and enthusiastic all the time! Lovely, lovely Sofi, you are dear to me!
Tills sist:
Kim: Alla dessa år, och nu är den klar! Jag tror banne mig att jag siktar Motala nu!
Tack.
Mina underbara syskon Eva, Åsa och Otto med familjer. Det här hade inte gått utan
erat stöd, erat peppande, allt bollande, all barnvakt, ja listan kan göras lång…
Magnus: Tack för allt. Det kanske inte är ”bara ord” trots allt?
Mamma Helle och pappa Sven: Bättre föräldrar finns inte. Ert ändlösa stöd, er tro på
mig, alla peppsamtal har burit mig framåt. Att kunna komma hem till nybadade
barn, städad lägenhet och färdiglagad mat, det ÄR verkligen en lyx, och har betytt
mer än jag kan säga. Tack blir så torftigt, men det är det enda jag kan komma med,
så, från djupet av mitt hjärta: Tack! ♥
Klara och Michael: Ni visar mig vad som är viktigt i livet.
This work was generously supported by grants from Medical Research Council of
South-East Sweden (FORSS), Swedish Child Diabetes Foundation
(Barndiabetesfonden), Medical Research Fund of the County of Östergötland, the
County council of Östergötland, Schelins Foundation, the Research Foundation of
the Swedish Asthma and Allergy association, the Lions Foundation and Knut and
Alice Wallenberg’s foundation.

~ 94~

~ 95~
REFERENCES
1 Zlotnik, A. and Yoshie, O., Chemokines: a new classification system and their role in immunity. Immunity 2000. 12: 121-127.
2 Chemokine/chemokine receptor nomenclature. J Immunol Methods 2002. 262: 1-3.
3 Janeway CA, T. P., Walport M Schlomchik MJ, Immunobiology: the immune system in health and disease. 6th edition. Garland Science Publishing, New York: 2005.
4 Mosmann, T. R., Cherwinski, H., Bond, M. W., Giedlin, M. A. and Coffman, R. L., Two types of murine helper T cell clone. I. Definition according to profiles of lymphokine activities and secreted proteins. J Immunol 1986. 136: 2348-2357.
5 Romagnani, S., Biology of human TH1 and TH2 cells. J Clin Immunol 1995. 15: 121-129.
6 Mosmann, T. R. and Sad, S., The expanding universe of T-cell subsets: Th1, Th2 and more. Immunol Today 1996. 17: 138-146.
7 Bonecchi, R., Bianchi, G., Bordignon, P. P., D'Ambrosio, D., Lang, R., Borsatti, A., Sozzani, S., Allavena, P., Gray, P. A., Mantovani, A. and Sinigaglia, F., Differential expression of chemokine receptors and chemotactic responsiveness of type 1 T helper cells (Th1s) and Th2s. J Exp Med 1998. 187: 129-134.
8 Rollins, B. J., Chemokines. Blood 1997. 90: 909-928. 9 Zingoni, A., Soto, H., Hedrick, J. A., Stoppacciaro, A., Storlazzi, C. T.,
Sinigaglia, F., D'Ambrosio, D., O'Garra, A., Robinson, D., Rocchi, M., Santoni, A., Zlotnik, A. and Napolitano, M., The chemokine receptor CCR8 is preferentially expressed in Th2 but not Th1 cells. J Immunol 1998. 161: 547-551.
10 Maggi, E., Parronchi, P., Manetti, R., Simonelli, C., Piccinni, M. P., Rugiu, F. S., De Carli, M., Ricci, M. and Romagnani, S., Reciprocal regulatory effects of IFN-gamma and IL-4 on the in vitro development of human Th1 and Th2 clones. J Immunol 1992. 148: 2142-2147.
11 Skapenko, A., Niedobitek, G. U., Kalden, J. R., Lipsky, P. E. and Schulze-Koops, H., Generation and regulation of human Th1-biased immune responses in vivo: a critical role for IL-4 and IL-10. J Immunol 2004. 172: 6427-6434.
12 Veldhoen, M., Uyttenhove, C., van Snick, J., Helmby, H., Westendorf, A., Buer, J., Martin, B., Wilhelm, C. and Stockinger, B., Transforming growth factor-beta 'reprograms' the differentiation of T helper 2 cells and promotes an interleukin 9-producing subset. Nat Immunol 2008. 9: 1341-1346.
~ 96~
13 Dardalhon, V., Awasthi, A., Kwon, H., Galileos, G., Gao, W., Sobel, R. A., Mitsdoerffer, M., Strom, T. B., Elyaman, W., Ho, I. C., Khoury, S., Oukka, M. and Kuchroo, V. K., IL-4 inhibits TGF-beta-induced Foxp3+ T cells and, together with TGF-beta, generates IL-9+ IL-10+ Foxp3(-) effector T cells. Nat Immunol 2008. 9: 1347-1355.
14 Burgler, S., Ouaked, N., Bassin, C., Basinski, T. M., Mantel, P. Y., Siegmund, K., Meyer, N., Akdis, C. A. and Schmidt-Weber, C. B., Differentiation and functional analysis of human T(H)17 cells. J Allergy Clin Immunol 2009. 123: 588-595, 595 e581-587.
15 Schmidt-Weber, C. B., Akdis, M. and Akdis, C. A., TH17 cells in the big picture of immunology. J Allergy Clin Immunol 2007. 120: 247-254.
16 Romagnani, S., Th1 and Th2 in human diseases. Clin Immunol Immunopathol 1996. 80: 225-235.
17 Singh, V. K., Mehrotra, S. and Agarwal, S. S., The paradigm of Th1 and Th2 cytokines: its relevance to autoimmunity and allergy. Immunol Res 1999. 20: 147-161.
18 Sheikh, A., Smeeth, L. and Hubbard, R., There is no evidence of an inverse relationship between TH2-mediated atopy and TH1-mediated autoimmune disorders: Lack of support for the hygiene hypothesis. J Allergy Clin Immunol 2003. 111: 131-135.
19 El Biaze, M., Boniface, S., Koscher, V., Mamessier, E., Dupuy, P., Milhe, F., Ramadour, M., Vervloet, D. and Magnan, A., T cell activation, from atopy to asthma: more a paradox than a paradigm. Allergy 2003. 58: 844-853.
20 Prescott, S. L., New concepts of cytokines in asthma: is the Th2/Th1 paradigm out the window? J Paediatr Child Health 2003. 39: 575-579.
21 Allen, J. E. and Maizels, R. M., Th1-Th2: reliable paradigm or dangerous dogma? Immunol Today 1997. 18: 387-392.
22 Gershon, R. K. and Kondo, K., Cell interactions in the induction of tolerance: the role of thymic lymphocytes. Immunology 1970. 18: 723-737.
23 Kronenberg, M., Steinmetz, M., Kobori, J., Kraig, E., Kapp, J. A., Pierce, C. W., Sorensen, C. M., Suzuki, G., Tada, T. and Hood, L., RNA transcripts for I-J polypeptides are apparently not encoded between the I-A and I-E subregions of the murine major histocompatibility complex. Proc Natl Acad Sci U S A 1983. 80: 5704-5708.
24 Sakaguchi, S., Sakaguchi, N., Asano, M., Itoh, M. and Toda, M., Immunologic self-tolerance maintained by activated T cells expressing IL-2 receptor alpha-chains (CD25). Breakdown of a single mechanism of self-tolerance causes various autoimmune diseases. J Immunol 1995. 155: 1151-1164.
25 Bellinghausen, I., Klostermann, B., Knop, J. and Saloga, J., Human CD4+CD25+ T cells derived from the majority of atopic donors are able to suppress TH1 and TH2 cytokine production. J Allergy Clin Immunol 2003. 111: 862-868.

~ 97~
26 Sakaguchi, S., Wing, K. and Miyara, M., Regulatory T cells - a brief history and perspective. Eur J Immunol 2007. 37 Suppl 1: S116-123.
27 Itoh, M., Takahashi, T., Sakaguchi, N., Kuniyasu, Y., Shimizu, J., Otsuka, F. and Sakaguchi, S., Thymus and autoimmunity: production of CD25+CD4+ naturally anergic and suppressive T cells as a key function of the thymus in maintaining immunologic self-tolerance. J Immunol 1999. 162: 5317-5326.
28 Baecher-Allan, C., Brown, J. A., Freeman, G. J. and Hafler, D. A., CD4+CD25high regulatory cells in human peripheral blood. J Immunol 2001. 167: 1245-1253.
29 Walker, M. R., Kasprowicz, D. J., Gersuk, V. H., Benard, A., Van Landeghen, M., Buckner, J. H. and Ziegler, S. F., Induction of FoxP3 and acquisition of T regulatory activity by stimulated human CD4+CD25- T cells. J Clin Invest 2003. 112: 1437-1443.
30 Deaglio, S., Dwyer, K. M., Gao, W., Friedman, D., Usheva, A., Erat, A., Chen, J. F., Enjyoji, K., Linden, J., Oukka, M., Kuchroo, V. K., Strom, T. B. and Robson, S. C., Adenosine generation catalyzed by CD39 and CD73 expressed on regulatory T cells mediates immune suppression. J Exp Med 2007. 204: 1257-1265.
31 Liu, W., Putnam, A. L., Xu-Yu, Z., Szot, G. L., Lee, M. R., Zhu, S., Gottlieb, P. A., Kapranov, P., Gingeras, T. R., Fazekas de St Groth, B., Clayberger, C., Soper, D. M., Ziegler, S. F. and Bluestone, J. A., CD127 expression inversely correlates with FoxP3 and suppressive function of human CD4+ T reg cells. J Exp Med 2006. 203: 1701-1711.
32 Sakaguchi, S., Miyara, M., Costantino, C. M. and Hafler, D. A., FOXP3+ regulatory T cells in the human immune system. Nat Rev Immunol 2010. 10: 490-500.
33 Dieckmann, D., Plottner, H., Berchtold, S., Berger, T. and Schuler, G., Ex vivo isolation and characterization of CD4(+)CD25(+) T cells with regulatory properties from human blood. J Exp Med 2001. 193: 1303-1310.
34 Wing, K., Onishi, Y., Prieto-Martin, P., Yamaguchi, T., Miyara, M., Fehervari, Z., Nomura, T. and Sakaguchi, S., CTLA-4 control over Foxp3+ regulatory T cell function. Science 2008. 322: 271-275.
35 Magistrelli, G., Jeannin, P., Herbault, N., Benoit De Coignac, A., Gauchat, J. F., Bonnefoy, J. Y. and Delneste, Y., A soluble form of CTLA-4 generated by alternative splicing is expressed by nonstimulated human T cells. Eur J Immunol 1999. 29: 3596-3602.
36 Oaks, M. K. and Hallett, K. M., Cutting edge: a soluble form of CTLA-4 in patients with autoimmune thyroid disease. J Immunol 2000. 164: 5015-5018.
37 Liu, M. F., Wang, C. R., Chen, P. C. and Fung, L. L., Increased expression of soluble cytotoxic T-lymphocyte-associated antigen-4 molecule in patients with systemic lupus erythematosus. Scand J Immunol 2003. 57: 568-572.

~ 98~
38 Borsellino, G., Kleinewietfeld, M., Di Mitri, D., Sternjak, A., Diamantini, A., Giometto, R., Hopner, S., Centonze, D., Bernardi, G., Dell'Acqua, M. L., Rossini, P. M., Battistini, L., Rotzschke, O. and Falk, K., Expression of ectonucleotidase CD39 by Foxp3+ Treg cells: hydrolysis of extracellular ATP and immune suppression. Blood 2007. 110: 1225-1232.
39 Miyara, M., Yoshioka, Y., Kitoh, A., Shima, T., Wing, K., Niwa, A., Parizot, C., Taflin, C., Heike, T., Valeyre, D., Mathian, A., Nakahata, T., Yamaguchi, T., Nomura, T., Ono, M., Amoura, Z., Gorochov, G. and Sakaguchi, S., Functional delineation and differentiation dynamics of human CD4+ T cells expressing the FoxP3 transcription factor. Immunity 2009. 30: 899-911.
40 Groux, H., O'Garra, A., Bigler, M., Rouleau, M., Antonenko, S., de Vries, J. E. and Roncarolo, M. G., A CD4+ T-cell subset inhibits antigen-specific T-cell responses and prevents colitis. Nature 1997. 389: 737-742.
41 Carrier, Y., Yuan, J., Kuchroo, V. K. and Weiner, H. L., Th3 cells in peripheral tolerance. I. Induction of Foxp3-positive regulatory T cells by Th3 cells derived from TGF-beta T cell-transgenic mice. J Immunol 2007. 178: 179-185.
42 Chen, Y., Kuchroo, V. K., Inobe, J., Hafler, D. A. and Weiner, H. L., Regulatory T cell clones induced by oral tolerance: suppression of autoimmune encephalomyelitis. Science 1994. 265: 1237-1240.
43 Weiner, H. L., Induction and mechanism of action of transforming growth factor-beta-secreting Th3 regulatory cells. Immunol Rev 2001. 182: 207-214.
44 Feghali, C. A. and Wright, T. M., Cytokines in acute and chronic inflammation. Front Biosci 1997. 2: d12-26.
45 Opal, S. M. and DePalo, V. A., Anti-inflammatory cytokines. Chest 2000. 117: 1162-1172.
46 Dinarello, C. A., Interleukin-1beta and the autoinflammatory diseases. N Engl J Med 2009. 360: 2467-2470.
47 Chen, Y., Haines, C. J., Gutcher, I., Hochweller, K., Blumenschein, W. M., McClanahan, T., Hammerling, G., Li, M. O., Cua, D. J. and McGeachy, M. J., Foxp3(+) Regulatory T Cells Promote T Helper 17 Cell Development In Vivo through Regulation of Interleukin-2. Immunity 2011. 34: 409-421.
48 Atkinson, M. A. and Maclaren, N. K., The pathogenesis of insulin-dependent diabetes mellitus. N Engl J Med 1994. 331: 1428-1436.
49 Siafarikas, A. and O'Connell, S., Type 1 diabetes in children - emergency management. Aust Fam Physician 2010. 39: 290-293.
50 van Belle, T. L., Coppieters, K. T. and von Herrath, M. G., Type 1 diabetes: etiology, immunology, and therapeutic strategies. Physiol Rev 2011. 91: 79-118.

~ 99~
51 Incidence and trends of childhood Type 1 diabetes worldwide 1990-1999. Diabet Med 2006. 23: 857-866.
52 Berhan, Y., Waernbaum, I., Lind, T., Mollsten, A. and Dahlquist, G., Thirty years of prospective nationwide incidence of childhood type 1 diabetes: the accelerating increase by time tends to level off in Sweden. Diabetes 2011. 60: 577-581.
53 Pearl-Yafe, M., Kaminitz, A., Yolcu, E. S., Yaniv, I., Stein, J. and Askenasy, N., Pancreatic islets under attack: cellular and molecular effectors. Curr Pharm Des 2007. 13: 749-760.
54 Ellis, T. M., Schatz, D. A., Ottendorfer, E. W., Lan, M. S., Wasserfall, C., Salisbury, P. J., She, J. X., Notkins, A. L., Maclaren, N. K. and Atkinson, M. A., The relationship between humoral and cellular immunity to IA-2 in IDDM. Diabetes 1998. 47: 566-569.
55 Oling, V., Marttila, J., Ilonen, J., Kwok, W. W., Nepom, G., Knip, M., Simell, O. and Reijonen, H., GAD65- and proinsulin-specific CD4+ T-cells detected by MHC class II tetramers in peripheral blood of type 1 diabetes patients and at-risk subjects. J Autoimmun 2005. 25: 235-243.
56 Kimpimaki, T., Kulmala, P., Savola, K., Kupila, A., Korhonen, S., Simell, T., Ilonen, J., Simell, O. and Knip, M., Natural history of beta-cell autoimmunity in young children with increased genetic susceptibility to type 1 diabetes recruited from the general population. J Clin Endocrinol Metab 2002. 87: 4572-4579.
57 Wenzlau, J. M., Juhl, K., Yu, L., Moua, O., Sarkar, S. A., Gottlieb, P., Rewers, M., Eisenbarth, G. S., Jensen, J., Davidson, H. W. and Hutton, J. C., The cation efflux transporter ZnT8 (Slc30A8) is a major autoantigen in human type 1 diabetes. Proc Natl Acad Sci U S A 2007. 104: 17040-17045.
58 Katz, J. D., Benoist, C. and Mathis, D., T helper cell subsets in insulin-dependent diabetes. Science 1995. 268: 1185-1188.
59 Foulis, A. K., McGill, M. and Farquharson, M. A., Insulitis in type 1 (insulin-dependent) diabetes mellitus in man--macrophages, lymphocytes, and interferon-gamma containing cells. J Pathol 1991. 165: 97-103.
60 Karlsson, M. G., Lawesson, S. S. and Ludvigsson, J., Th1-like dominance in high-risk first-degree relatives of type I diabetic patients. Diabetologia 2000. 43: 742-749.
61 Karlsson Faresjo, M. G., Ernerudh, J. and Ludvigsson, J., Cytokine profile in children during the first 3 months after the diagnosis of type 1 diabetes. Scand J Immunol 2004. 59: 517-526.
62 Karlsson Faresjo, M. G. and Ludvigsson, J., Diminished Th1-like response to autoantigens in children with a high risk of developing type 1 diabetes. Scand J Immunol 2005. 61: 173-179.

~ 100~
63 Hedman, M., Ludvigsson, J. and Faresjo, M. K., Nicotinamide reduces high secretion of IFN-gamma in high-risk relatives even though it does not prevent type 1 diabetes. J Interferon Cytokine Res 2006. 26: 207-213.
64 Stechova, K., Bohmova, K., Vrabelova, Z., Sepa, A., Stadlerova, G., Zacharovova, K. and Faresjo, M., High T-helper-1 cytokines but low T-helper-3 cytokines, inflammatory cytokines and chemokines in children with high risk of developing type 1 diabetes. Diabetes Metab Res Rev 2007. 23: 462-471.
65 Ryden, A., Stechova, K., Durilova, M. and Faresjo, M., Switch from a dominant Th1-associated immune profile during the pre-diabetic phase in favour of a temporary increase of a Th3-associated and inflammatory immune profile at the onset of type 1 diabetes. Diabetes Metab Res Rev 2009. 25: 335-343.
66 Kuczynski, S., Winiarska, H., Abramczyk, M., Szczawinska, K., Wierusz-Wysocka, B. and Dworacka, M., IL-15 is elevated in serum patients with type 1 diabetes mellitus. Diabetes Res Clin Pract 2005. 69: 231-236.
67 Xia, J., Liu, W., Hu, B., Tian, Z. and Yang, Y., IL-15 promotes regulatory T cell function and protects against diabetes development in NK-depleted NOD mice. Clin Immunol 2010. 134: 130-139.
68 Lindley, S., Dayan, C. M., Bishop, A., Roep, B. O., Peakman, M. and Tree, T. I., Defective suppressor function in CD4(+)CD25(+) T-cells from patients with type 1 diabetes. Diabetes 2005. 54: 92-99.
69 Brusko, T., Wasserfall, C., McGrail, K., Schatz, R., Viener, H. L., Schatz, D., Haller, M., Rockell, J., Gottlieb, P., Clare-Salzler, M. and Atkinson, M., No alterations in the frequency of FOXP3+ regulatory T-cells in type 1 diabetes. Diabetes 2007. 56: 604-612.
70 Tiittanen, M., Huupponen, J. T., Knip, M. and Vaarala, O., Insulin treatment in patients with type 1 diabetes induces upregulation of regulatory T-cell markers in peripheral blood mononuclear cells stimulated with insulin in vitro. Diabetes 2006. 55: 3446-3454.
71 Vrabelova, Z., Hrotekova, Z., Hladikova, Z., Bohmova, K., Stechova, K. and Michalek, J., CD 127- and FoxP3+ expression on CD25+CD4+ T regulatory cells upon specific diabetogeneic stimulation in high-risk relatives of type 1 diabetes mellitus patients. Scand J Immunol 2008. 67: 404-410.
72 Badami, E., Sorini, C., Coccia, M., Usuelli, V., Molteni, L., Bolla, A. M., Scavini, M., Mariani, A., King, C., Bosi, E. and Falcone, M., Defective differentiation of regulatory FoxP3+ T cells by small-intestinal dendritic cells in patients with type 1 diabetes. Diabetes 2011. 60: 2120-2124.
73 Ivarsson, A., Persson, L. A., Nystrom, L., Ascher, H., Cavell, B., Danielsson, L., Dannaeus, A., Lindberg, T., Lindquist, B.,

~ 101~
Stenhammar, L. and Hernell, O., Epidemic of coeliac disease in Swedish children. Acta Paediatr 2000. 89: 165-171.
74 Olsson, C., Hernell, O., Hornell, A., Lonnberg, G. and Ivarsson, A., Difference in celiac disease risk between Swedish birth cohorts suggests an opportunity for primary prevention. Pediatrics 2008. 122: 528-534.
75 Sollid, L. M., Markussen, G., Ek, J., Gjerde, H., Vartdal, F. and Thorsby, E., Evidence for a primary association of celiac disease to a particular HLA-DQ alpha/beta heterodimer. J Exp Med 1989. 169: 345-350.
76 Lundin, K. E., Scott, H., Hansen, T., Paulsen, G., Halstensen, T. S., Fausa, O., Thorsby, E. and Sollid, L. M., Gliadin-specific, HLA-DQ(alpha 1*0501,beta 1*0201) restricted T cells isolated from the small intestinal mucosa of celiac disease patients. J Exp Med 1993. 178: 187-196.
77 Nistico, L., Fagnani, C., Coto, I., Percopo, S., Cotichini, R., Limongelli, M. G., Paparo, F., D'Alfonso, S., Giordano, M., Sferlazzas, C., Magazzu, G., Momigliano-Richiardi, P., Greco, L. and Stazi, M. A., Concordance, disease progression, and heritability of coeliac disease in Italian twins. Gut 2006. 55: 803-808.
78 Petronzelli, F., Bonamico, M., Ferrante, P., Grillo, R., Mora, B., Mariani, P., Apollonio, I., Gemme, G. and Mazzilli, M. C., Genetic contribution of the HLA region to the familial clustering of coeliac disease. Ann Hum Genet 1997. 61: 307-317.
79 Sollid, L. M. and Lie, B. A., Celiac disease genetics: current concepts and practical applications. Clin Gastroenterol Hepatol 2005. 3: 843-851.
80 Tjon, J. M., van Bergen, J. and Koning, F., Celiac disease: how complicated can it get? Immunogenetics 2010. 62: 641-651.
81 Forsberg, G., Fahlgren, A., Horstedt, P., Hammarstrom, S., Hernell, O. and Hammarstrom, M. L., Presence of bacteria and innate immunity of intestinal epithelium in childhood celiac disease. Am J Gastroenterol 2004. 99: 894-904.
82 Stene, L. C., Honeyman, M. C., Hoffenberg, E. J., Haas, J. E., Sokol, R. J., Emery, L., Taki, I., Norris, J. M., Erlich, H. A., Eisenbarth, G. S. and Rewers, M., Rotavirus infection frequency and risk of celiac disease autoimmunity in early childhood: a longitudinal study. Am J Gastroenterol 2006. 101: 2333-2340.
83 Zanoni, G., Navone, R., Lunardi, C., Tridente, G., Bason, C., Sivori, S., Beri, R., Dolcino, M., Valletta, E., Corrocher, R. and Puccetti, A., In celiac disease, a subset of autoantibodies against transglutaminase binds toll-like receptor 4 and induces activation of monocytes. PLoS Med 2006. 3: e358.
84 Trier, J. S., Celiac sprue. N Engl J Med 1991. 325: 1709-1719. 85 Di Sabatino, A. and Corazza, G. R., Coeliac disease. Lancet 2009. 373:
1480-1493. 86 van de Wal, Y., Kooy, Y., van Veelen, P., Pena, S., Mearin, L.,
Papadopoulos, G. and Koning, F., Selective deamidation by tissue

~ 102~
transglutaminase strongly enhances gliadin-specific T cell reactivity. J Immunol 1998. 161: 1585-1588.
87 Molberg, O., McAdam, S. N., Korner, R., Quarsten, H., Kristiansen, C., Madsen, L., Fugger, L., Scott, H., Noren, O., Roepstorff, P., Lundin, K. E., Sjostrom, H. and Sollid, L. M., Tissue transglutaminase selectively modifies gliadin peptides that are recognized by gut-derived T cells in celiac disease. Nat Med 1998. 4: 713-717.
88 Burgin-Wolff, A., Gaze, H., Hadziselimovic, F., Huber, H., Lentze, M. J., Nussle, D. and Reymond-Berthet, C., Antigliadin and antiendomysium antibody determination for coeliac disease. Arch Dis Child 1991. 66: 941-947.
89 Lerner, A., Kumar, V. and Iancu, T. C., Immunological diagnosis of childhood coeliac disease: comparison between antigliadin, antireticulin and antiendomysial antibodies. Clin Exp Immunol 1994. 95: 78-82.
90 Dieterich, W., Ehnis, T., Bauer, M., Donner, P., Volta, U., Riecken, E. O. and Schuppan, D., Identification of tissue transglutaminase as the autoantigen of celiac disease. Nat Med 1997. 3: 797-801.
91 Burgin-Wolff, A., Dahlbom, I., Hadziselimovic, F. and Petersson, C. J., Antibodies against human tissue transglutaminase and endomysium in diagnosing and monitoring coeliac disease. Scand J Gastroenterol 2002. 37: 685-691.
92 Volta, U. and Villanacci, V., Celiac disease: diagnostic criteria in progress. Cell Mol Immunol 2011. 8: 96-102.
93 Lahat, N., Shapiro, S., Karban, A., Gerstein, R., Kinarty, A. and Lerner, A., Cytokine profile in coeliac disease. Scand J Immunol 1999. 49: 441-446.
94 Forsberg, G., Hernell, O., Melgar, S., Israelsson, A., Hammarstrom, S. and Hammarstrom, M. L., Paradoxical coexpression of proinflammatory and down-regulatory cytokines in intestinal T cells in childhood celiac disease. Gastroenterology 2002. 123: 667-678.
95 Monteleone, I., Monteleone, G., Del Vecchio Blanco, G., Vavassori, P., Cucchiara, S., MacDonald, T. T. and Pallone, F., Regulation of the T helper cell type 1 transcription factor T-bet in coeliac disease mucosa. Gut 2004. 53: 1090-1095.
96 Lahdenpera, A., Ludvigsson, J., Falth-Magnusson, K., Hogberg, L. and Vaarala, O., The effect of gluten-free diet on Th1-Th2-Th3-associated intestinal immune responses in celiac disease. Scand J Gastroenterol 2011. 46: 538-549.
97 Maiuri, L., Ciacci, C., Auricchio, S., Brown, V., Quaratino, S. and Londei, M., Interleukin 15 mediates epithelial changes in celiac disease. Gastroenterology 2000. 119: 996-1006.
98 Mention, J. J., Ben Ahmed, M., Begue, B., Barbe, U., Verkarre, V., Asnafi, V., Colombel, J. F., Cugnenc, P. H., Ruemmele, F. M., McIntyre, E., Brousse, N., Cellier, C. and Cerf-Bensussan, N.,

~ 103~
Interleukin 15: a key to disrupted intraepithelial lymphocyte homeostasis and lymphomagenesis in celiac disease. Gastroenterology 2003. 125: 730-745.
99 DePaolo, R. W., Abadie, V., Tang, F., Fehlner-Peach, H., Hall, J. A., Wang, W., Marietta, E. V., Kasarda, D. D., Waldmann, T. A., Murray, J. A., Semrad, C., Kupfer, S. S., Belkaid, Y., Guandalini, S. and Jabri, B., Co-adjuvant effects of retinoic acid and IL-15 induce inflammatory immunity to dietary antigens. Nature 2011. 471: 220-224.
100 Tiittanen, M., Westerholm-Ormio, M., Verkasalo, M., Savilahti, E. and Vaarala, O., Infiltration of forkhead box P3-expressing cells in small intestinal mucosa in coeliac disease but not in type 1 diabetes. Clin Exp Immunol 2008. 152: 498-507.
101 Frisullo, G., Nociti, V., Iorio, R., Patanella, A. K., Marti, A., Assunta, B., Plantone, D., Cammarota, G., Tonali, P. A. and Batocchi, A. P., Increased CD4+CD25+Foxp3+ T cells in peripheral blood of celiac disease patients: correlation with dietary treatment. Hum Immunol 2009. 70: 430-435.
102 Zanzi, D., Stefanile, R., Santagata, S., Iaffaldano, L., Iaquinto, G., Giardullo, N., Lania, G., Vigliano, I., Vera, A. R., Ferrara, K., Auricchio, S., Troncone, R. and Mazzarella, G., IL-15 interferes with suppressive activity of intestinal regulatory T cells expanded in Celiac disease. Am J Gastroenterol 2011. 106: 1308-1317.
103 Johansson, S. G., Bieber, T., Dahl, R., Friedmann, P. S., Lanier, B. Q., Lockey, R. F., Motala, C., Ortega Martell, J. A., Platts-Mills, T. A., Ring, J., Thien, F., Van Cauwenberge, P. and Williams, H. C., Revised nomenclature for allergy for global use: Report of the Nomenclature Review Committee of the World Allergy Organization, October 2003. J Allergy Clin Immunol 2004. 113: 832-836.
104 Spergel, J. M. and Paller, A. S., Atopic dermatitis and the atopic march. J Allergy Clin Immunol 2003. 112: S118-127.
105 Wood, R. A., The natural history of food allergy. Pediatrics 2003. 111: 1631-1637.
106 Aberg, N., Hesselmar, B., Aberg, B. and Eriksson, B., Increase of asthma, allergic rhinitis and eczema in Swedish schoolchildren between 1979 and 1991. Clin Exp Allergy 1995. 25: 815-819.
107 Weinmayr, G., Weiland, S. K., Bjorksten, B., Brunekreef, B., Buchele, G., Cookson, W. O., Garcia-Marcos, L., Gotua, M., Gratziou, C., van Hage, M., von Mutius, E., Riikjarv, M. A., Rzehak, P., Stein, R. T., Strachan, D. P., Tsanakas, J., Wickens, K. and Wong, G. W., Atopic sensitization and the international variation of asthma symptom prevalence in children. Am J Respir Crit Care Med 2007. 176: 565-574.
108 Jogi, R., Janson, C., Bjornsson, E., Boman, G. and Bjorksten, B., Atopy and allergic disorders among adults in Tartu, Estonia compared with Uppsala, Sweden. Clin Exp Allergy 1998. 28: 1072-1080.

~ 104~
109 Bottcher, M. F., Bjorksten, B., Gustafson, S., Voor, T. and Jenmalm, M. C., Endotoxin levels in Estonian and Swedish house dust and atopy in infancy. Clin Exp Allergy 2003. 33: 295-300.
110 Flohr, C., Pascoe, D. and Williams, H. C., Atopic dermatitis and the 'hygiene hypothesis': too clean to be true? Br J Dermatol 2005. 152: 202-216.
111 Wahn, U., What drives the allergic march? Allergy 2000. 55: 591-599. 112 Riedler, J., Braun-Fahrlander, C., Eder, W., Schreuer, M., Waser, M.,
Maisch, S., Carr, D., Schierl, R., Nowak, D. and von Mutius, E., Exposure to farming in early life and development of asthma and allergy: a cross-sectional survey. Lancet 2001. 358: 1129-1133.
113 Nafstad, P., Magnus, P., Gaarder, P. I. and Jaakkola, J. J., Exposure to pets and atopy-related diseases in the first 4 years of life. Allergy 2001. 56: 307-312.
114 Furuhjelm, C., Warstedt, K., Larsson, J., Fredriksson, M., Bottcher, M. F., Falth-Magnusson, K. and Duchen, K., Fish oil supplementation in pregnancy and lactation may decrease the risk of infant allergy. Acta Paediatr 2009. 98: 1461-1467.
115 Sjogren, Y. M., Tomicic, S., Lundberg, A., Bottcher, M. F., Bjorksten, B., Sverremark-Ekstrom, E. and Jenmalm, M. C., Influence of early gut microbiota on the maturation of childhood mucosal and systemic immune responses. Clin Exp Allergy 2009. 39: 1842-1851.
116 Gould, H. J., Sutton, B. J., Beavil, A. J., Beavil, R. L., McCloskey, N., Coker, H. A., Fear, D. and Smurthwaite, L., The biology of IGE and the basis of allergic disease. Annu Rev Immunol 2003. 21: 579-628.
117 Holgate, S. T. and Polosa, R., Treatment strategies for allergy and asthma. Nat Rev Immunol 2008. 8: 218-230.
118 Robinson, D. S., Hamid, Q., Ying, S., Tsicopoulos, A., Barkans, J., Bentley, A. M., Corrigan, C., Durham, S. R. and Kay, A. B., Predominant TH2-like bronchoalveolar T-lymphocyte population in atopic asthma. N Engl J Med 1992. 326: 298-304.
119 Jung, T., Lack, G., Schauer, U., Uberuck, W., Renz, H., Gelfand, E. W. and Rieger, C. H., Decreased frequency of interferon-gamma- and interleukin-2-producing cells in patients with atopic diseases measured at the single cell level. J Allergy Clin Immunol 1995. 96: 515-527.
120 Kiniwa, M., Gately, M., Gubler, U., Chizzonite, R., Fargeas, C. and Delespesse, G., Recombinant interleukin-12 suppresses the synthesis of immunoglobulin E by interleukin-4 stimulated human lymphocytes. J Clin Invest 1992. 90: 262-266.
121 Kips, J. C., Brusselle, G. J., Joos, G. F., Peleman, R. A., Tavernier, J. H., Devos, R. R. and Pauwels, R. A., Interleukin-12 inhibits antigen-induced airway hyperresponsiveness in mice. Am J Respir Crit Care Med 1996. 153: 535-539.

~ 105~
122 Prasse, A., Germann, M., Pechkovsky, D. V., Markert, A., Verres, T., Stahl, M., Melchers, I., Luttmann, W., Muller-Quernheim, J. and Zissel, G., IL-10-producing monocytes differentiate to alternatively activated macrophages and are increased in atopic patients. J Allergy Clin Immunol 2007. 119: 464-471.
123 Akdis, C. A., Blesken, T., Akdis, M., Wuthrich, B. and Blaser, K., Role of interleukin 10 in specific immunotherapy. J Clin Invest 1998. 102: 98-106.
124 Ascher, H., Coeliac disease and type 1 diabetes: an affair still with much hidden behind the veil. Acta Paediatr 2001. 90: 1217-1220.
125 Triolo, T. M., Armstrong, T. K., McFann, K., Yu, L., Rewers, M. J., Klingensmith, G. J., Eisenbarth, G. S. and Barker, J. M., Additional autoimmune disease found in 33% of patients at type 1 diabetes onset. Diabetes Care 2011. 34: 1211-1213.
126 Troncone, R., Franzese, A., Mazzarella, G., Paparo, F., Auricchio, R., Coto, I., Mayer, M. and Greco, L., Gluten sensitivity in a subset of children with insulin dependent diabetes mellitus. Am J Gastroenterol 2003. 98: 590-595.
127 Visser, J., Rozing, J., Sapone, A., Lammers, K. and Fasano, A., Tight junctions, intestinal permeability, and autoimmunity: celiac disease and type 1 diabetes paradigms. Ann N Y Acad Sci 2009. 1165: 195-205.
128 Paronen, J., Klemetti, P., Kantele, J. M., Savilahti, E., Perheentupa, J., Akerblom, H. K. and Vaarala, O., Glutamate decarboxylase-reactive peripheral blood lymphocytes from patients with IDDM express gut-specific homing receptor alpha4beta7-integrin. Diabetes 1997. 46: 583-588.
129 Westerholm-Ormio, M., Vaarala, O., Pihkala, P., Ilonen, J. and Savilahti, E., Immunologic activity in the small intestinal mucosa of pediatric patients with type 1 diabetes. Diabetes 2003. 52: 2287-2295.
130 Auricchio, R., Paparo, F., Maglio, M., Franzese, A., Lombardi, F., Valerio, G., Nardone, G., Percopo, S., Greco, L. and Troncone, R., In vitro-deranged intestinal immune response to gliadin in type 1 diabetes. Diabetes 2004. 53: 1680-1683.
131 Galipeau, H. J., Rulli, N. E., Jury, J., Huang, X., Araya, R., Murray, J. A., David, C. S., Chirdo, F. G., McCoy, K. D. and Verdu, E. F., Sensitization to Gliadin Induces Moderate Enteropathy and Insulitis in Nonobese Diabetic-DQ8 Mice. J Immunol 2011. 187: 4338-4346.
132 Vorobjova, T., Uibo, O., Heilman, K., Rago, T., Honkanen, J., Vaarala, O., Tillmann, V., Ojakivi, I. and Uibo, R., Increased FOXP3 expression in small-bowel mucosa of children with coeliac disease and type I diabetes mellitus. Scand J Gastroenterol 2009. 44: 422-430.
133 Rabin, R. L. and Levinson, A. I., The nexus between atopic disease and autoimmunity: a review of the epidemiological and mechanistic literature. Clin Exp Immunol 2008. 153: 19-30.
~ 106~
134 Gazit, V., Tasher, D., Hanukoglu, A., Landau, Z., Ben-Yehuda, Y., Somekh, E. and Dalal, I., Atopy in children and adolescents with insulin-dependent diabetes mellitus. Isr Med Assoc J 2008. 10: 858-861.
135 Olesen, A. B., Juul, S., Birkebaek, N. and Thestrup-Pedersen, K., Association between atopic dermatitis and insulin-dependent diabetes mellitus: a case-control study. Lancet 2001. 357: 1749-1752.
136 Rachmiel, M., Bloch, O., Bistritzer, T., Weintrob, N., Ofan, R., Koren-Morag, N. and Rapoport, M. J., TH1/TH2 cytokine balance in patients with both type 1 diabetes mellitus and asthma. Cytokine 2006. 34: 170-176.
137 Kainonen, E., Rautava, S., Korkeamaki, M. and Isolauri, E., Unique cytokine secretion profile in children with both type I diabetes and asthma distinct from that of solely diabetic or asthmatic children. Cytokine 2006. 34: 198-205.
138 Rachmiel, M., Bloch, O., Shaul, A. A., Ben-Yehudah, G., Bistritzer, Z., Weintrob, N., Ofan, R. and Rapoport, M. J., Young patients with both type 1 diabetes mellitus and asthma have a unique IL-12 and IL-18 secretory pattern. Pediatr Diabetes 2011.
139 Verkasalo, M., Tiilikainen, A., Kuitunen, P., Savilahti, E. and Backman, A., HLA antigens and atopy in children with coeliac disease. Gut 1983. 24: 306-310.
140 Zauli, D., Grassi, A., Granito, A., Foderaro, S., De Franceschi, L., Ballardini, G., Bianchi, F. B. and Volta, U., Prevalence of silent coeliac disease in atopics. Dig Liver Dis 2000. 32: 775-779.
141 Kero, J., Gissler, M., Hemminki, E. and Isolauri, E., Could TH1 and TH2 diseases coexist? Evaluation of asthma incidence in children with coeliac disease, type 1 diabetes, or rheumatoid arthritis: a register study. J Allergy Clin Immunol 2001. 108: 781-783.
142 Ludvigsson, J. F., Hemminki, K., Wahlstrom, J. and Almqvist, C., Celiac disease confers a 1.6-fold increased risk of asthma: A nationwide population-based cohort study. J Allergy Clin Immunol 2011. 127: 1071-1073 e1074.
143 Venkataraman, M., Effects of cryopreservation on immune responses: IX. Stimulus-mediated dichotomy in IL-10 production by frozen human peripheral blood mononuclear cells. J Hematother 1996. 5: 301-308.
144 Kvarnstrom, M., Jenmalm, M. C. and Ekerfelt, C., Effect of cryopreservation on expression of Th1 and Th2 cytokines in blood mononuclear cells from patients with different cytokine profiles, analysed with three common assays: an overall decrease of interleukin-4. Cryobiology 2004. 49: 157-168.
145 Shreffler, W. G., Visness, C. M., Burger, M., Cruikshank, W. W., Lederman, H. M., de la Morena, M., Grindle, K., Calatroni, A., Sampson, H. A. and Gern, J. E., Standardization and performance

~ 107~
evaluation of mononuclear cell cytokine secretion assays in a multicenter study. BMC Immunol 2006. 7: 29.
146 Elkord, E., Frequency of human T regulatory cells in peripheral blood is significantly reduced by cryopreservation. J Immunol Methods 2009. 347: 87-90.
147 Van Hemelen, D., Oude Elberink, J. N., Heimweg, J., van Oosterhout, A. J. and Nawijn, M. C., Cryopreservation does not alter the frequency of regulatory T cells in peripheral blood mononuclear cells. J Immunol Methods 2010. 353: 138-140.
148 Venet, F., Malcus, C., Ferry, T., Poitevin, F. and Monneret, G., Percentage of regulatory T cells CD4+CD25+CD127- in HIV-infected patients is not reduced after cryopreservation. J Immunol Methods 2010. 357: 55-58.
149 Disis, M. L., dela Rosa, C., Goodell, V., Kuan, L. Y., Chang, J. C., Kuus-Reichel, K., Clay, T. M., Kim Lyerly, H., Bhatia, S., Ghanekar, S. A., Maino, V. C. and Maecker, H. T., Maximizing the retention of antigen specific lymphocyte function after cryopreservation. J Immunol Methods 2006. 308: 13-18.
150 Revised criteria for diagnosis of coeliac disease. Report of Working Group of European Society of Paediatric Gastroenterology and Nutrition. Arch Dis Child 1990. 65: 909-911.
151 Schloot, N. C., Meierhoff, G., Karlsson Faresjo, M., Ott, P., Putnam, A., Lehmann, P., Gottlieb, P., Roep, B. O., Peakman, M. and Tree, T., Comparison of cytokine ELISpot assay formats for the detection of islet antigen autoreactive T cells. Report of the third immunology of diabetes society T-cell workshop. J Autoimmun 2003. 21: 365-376.
152 Signore, A., Annovazzi, A., Giacalone, P., Beales, P. E., Valorani, M. G., Vestri, A. R., Ruberti, G., Manfrini, S., Pozzilli, P. and Bulfone-Paus, S., Reduced cumulative incidence of diabetes but not insulitis following administration of chimeric human IL-15-murine IgG2b in NOD mice. Diabetes Metab Res Rev 2003. 19: 464-468.
153 Koulmanda, M., Budo, E., Bonner-Weir, S., Qipo, A., Putheti, P., Degauque, N., Shi, H., Fan, Z., Flier, J. S., Auchincloss, H., Jr., Zheng, X. X. and Strom, T. B., Modification of adverse inflammation is required to cure new-onset type 1 diabetic hosts. Proc Natl Acad Sci U S A 2007. 104: 13074-13079.
154 Schneider, A., Rieck, M., Sanda, S., Pihoker, C., Greenbaum, C. and Buckner, J. H., The effector T cells of diabetic subjects are resistant to regulation via CD4+ FOXP3+ regulatory T cells. J Immunol 2008. 181: 7350-7355.
155 Han, D., Leyva, C. A., Matheson, D., Mineo, D., Messinger, S., Blomberg, B. B., Hernandez, A., Meneghini, L. F., Allende, G., Skyler, J. S., Alejandro, R., Pugliese, A. and Kenyon, N. S., Immune

~ 108~
profiling by multiple gene expression analysis in patients at-risk and with type 1 diabetes. Clin Immunol 2011. 139: 290-301.
156 Adams, R. B., Planchon, S. M. and Roche, J. K., IFN-gamma modulation of epithelial barrier function. Time course, reversibility, and site of cytokine binding. J Immunol 1993. 150: 2356-2363.
157 Salvati, V. M., MacDonald, T. T., Bajaj-Elliott, M., Borrelli, M., Staiano, A., Auricchio, S., Troncone, R. and Monteleone, G., Interleukin 18 and associated markers of T helper cell type 1 activity in coeliac disease. Gut 2002. 50: 186-190.
158 Manavalan, J. S., Hernandez, L., Shah, J. G., Konikkara, J., Naiyer, A. J., Lee, A. R., Ciaccio, E., Minaya, M. T., Green, P. H. and Bhagat, G., Serum cytokine elevations in celiac disease: association with disease presentation. Hum Immunol 2010. 71: 50-57.
159 Fuchizawa, T., Adachi, Y., Ito, Y., Higashiyama, H., Kanegane, H., Futatani, T., Kobayashi, I., Kamachi, Y., Sakamoto, T., Tsuge, I., Tanaka, H., Banham, A. H., Ochs, H. D. and Miyawaki, T., Developmental changes of FOXP3-expressing CD4+CD25+ regulatory T cells and their impairment in patients with FOXP3 gene mutations. Clin Immunol 2007. 125: 237-246.
160 Jutel, M. and Akdis, C. A., T-cell subset regulation in atopy. Curr Allergy Asthma Rep 2011. 11: 139-145.
161 Akkoc, T., de Koning, P. J., Ruckert, B., Barlan, I., Akdis, M. and Akdis, C. A., Increased activation-induced cell death of high IFN-gamma-producing T(H)1 cells as a mechanism of T(H)2 predominance in atopic diseases. J Allergy Clin Immunol 2008. 121: 652-658 e651.
162 Brown, V., Warke, T. J., Shields, M. D. and Ennis, M., T cell cytokine profiles in childhood asthma. Thorax 2003. 58: 311-316.
163 Truyen, E., Coteur, L., Dilissen, E., Overbergh, L., Dupont, L. J., Ceuppens, J. L. and Bullens, D. M., Evaluation of airway inflammation by quantitative Th1/Th2 cytokine mRNA measurement in sputum of asthma patients. Thorax 2006. 61: 202-208.
164 Shannon, J., Ernst, P., Yamauchi, Y., Olivenstein, R., Lemiere, C., Foley, S., Cicora, L., Ludwig, M., Hamid, Q. and Martin, J. G., Differences in airway cytokine profile in severe asthma compared to moderate asthma. Chest 2008. 133: 420-426.
165 Gavett, S. H., O'Hearn, D. J., Li, X., Huang, S. K., Finkelman, F. D. and Wills-Karp, M., Interleukin 12 inhibits antigen-induced airway hyperresponsiveness, inflammation, and Th2 cytokine expression in mice. J Exp Med 1995. 182: 1527-1536.
166 Meyts, I., Hellings, P. W., Hens, G., Vanaudenaerde, B. M., Verbinnen, B., Heremans, H., Matthys, P., Bullens, D. M., Overbergh, L., Mathieu, C., De Boeck, K. and Ceuppens, J. L., IL-12 contributes to allergen-induced airway inflammation in experimental asthma. J Immunol 2006. 177: 6460-6470.

~ 109~
167 Del Prete, G., De Carli, M., Almerigogna, F., Giudizi, M. G., Biagiotti, R. and Romagnani, S., Human IL-10 is produced by both type 1 helper (Th1) and type 2 helper (Th2) T cell clones and inhibits their antigen-specific proliferation and cytokine production. J Immunol 1993. 150: 353-360.
168 Wolk, K., Kunz, S., Asadullah, K. and Sabat, R., Cutting edge: immune cells as sources and targets of the IL-10 family members? J Immunol 2002. 168: 5397-5402.
169 Hussein, Y. M., Shalaby, S. M., Mohamed, R. H. and Hassan, T. H., Association between genes encoding components of the IL-10/IL-0 receptor pathway and asthma in children. Ann Allergy Asthma Immunol 2011. 106: 474-480.
170 Francis, J. N., Till, S. J. and Durham, S. R., Induction of IL-10+CD4+CD25+ T cells by grass pollen immunotherapy. J Allergy Clin Immunol 2003. 111: 1255-1261.
171 O'Flynn, K., Krensky, A. M., Beverley, P. C., Burakoff, S. J. and Linch, D. C., Phytohaemagglutinin activation of T cells through the sheep red blood cell receptor. Nature 1985. 313: 686-687.
172 Bolt, S., Routledge, E., Lloyd, I., Chatenoud, L., Pope, H., Gorman, S. D., Clark, M. and Waldmann, H., The generation of a humanized, non-mitogenic CD3 monoclonal antibody which retains in vitro immunosuppressive properties. Eur J Immunol 1993. 23: 403-411.
173 Verhasselt, V., Buelens, C., Willems, F., De Groote, D., Haeffner-Cavaillon, N. and Goldman, M., Bacterial lipopolysaccharide stimulates the production of cytokines and the expression of costimulatory molecules by human peripheral blood dendritic cells: evidence for a soluble CD14-dependent pathway. J Immunol 1997. 158: 2919-2925.
174 Rydén, A., et. al., Efficient expansion of cryopreserved CD4+ CD25+ CD127 lo/- cells in Type 1 diabetes. Results in Immunology 2011. 1: 36-44.
175 Allan, S. E., Crome, S. Q., Crellin, N. K., Passerini, L., Steiner, T. S., Bacchetta, R., Roncarolo, M. G. and Levings, M. K., Activation-induced FOXP3 in human T effector cells does not suppress proliferation or cytokine production. Int Immunol 2007. 19: 345-354.