combined metabolomic analysis of plasma and urine reveals
TRANSCRIPT

ORIGINAL RESEARCHpublished: 21 December 2017
doi: 10.3389/fmolb.2017.00084
Frontiers in Molecular Biosciences | www.frontiersin.org 1 December 2017 | Volume 4 | Article 84
Edited by:
Francois-Pierre Martin,
Nestle Institute of Health Sciences,
Switzerland
Reviewed by:
Francesco Capozzi,
Università di Bologna, Italy
Michal Jan Markuszewski,
Gdansk Medical University, Poland
Sandrine Paule Claus,
University of Reading, United Kingdom
*Correspondence:
Alexandra Kautzky-Willer
alexandra.kautzky-willer
@meduniwien.ac.at
Wolfram Weckwerth
†These authors have contributed
equally to this work.
Specialty section:
This article was submitted to
Metabolomics,
a section of the journal
Frontiers in Molecular Biosciences
Received: 18 June 2017
Accepted: 28 November 2017
Published: 21 December 2017
Citation:
Leitner M, Fragner L, Danner S,
Holeschofsky N, Leitner K, Tischler S,
Doerfler H, Bachmann G, Sun X,
Jaeger W, Kautzky-Willer A and
Weckwerth W (2017) Combined
Metabolomic Analysis of Plasma and
Urine Reveals AHBA, Tryptophan and
Serotonin Metabolism as Potential
Risk Factors in Gestational Diabetes
Mellitus (GDM).
Front. Mol. Biosci. 4:84.
doi: 10.3389/fmolb.2017.00084
Combined Metabolomic Analysis ofPlasma and Urine Reveals AHBA,Tryptophan and SerotoninMetabolism as Potential Risk Factorsin Gestational Diabetes Mellitus(GDM)Miriam Leitner 1†, Lena Fragner 2, 3†, Sarah Danner 2, Nastassja Holeschofsky 2,
Karoline Leitner 1, Sonja Tischler 2, 3, Hannes Doerfler 2, Gert Bachmann 2, Xiaoliang Sun 2, 3,
Walter Jaeger 3, 4, Alexandra Kautzky-Willer 1* and Wolfram Weckwerth 2, 3*
1Gender Medicine Unit, Division of Endocrinology and Metabolism, Department of Internal Medicine III, Medical University of
Vienna, Vienna, Austria, 2Department of Ecogenomics and Systems Biology, University of Vienna, Vienna, Austria, 3 Vienna
Metabolomics Center, University of Vienna, Vienna, Austria, 4Department of Clinical Pharmacy and Diagnostics, University of
Vienna, Vienna, Austria
Gestational diabetes mellitus during pregnancy has severe implications for the health
of the mother and the fetus. Therefore, early prediction and an understanding of
the physiology are an important part of prenatal care. Metabolite profiling is a long
established method for the analysis and prediction of metabolic diseases. Here,
we applied untargeted and targeted metabolomic protocols to analyze plasma and
urine samples of pregnant women with and without GDM. Univariate and multivariate
statistical analyses of metabolomic profiles revealed markers such as 2-hydroxybutanoic
acid (AHBA), 3-hydroxybutanoic acid (BHBA), amino acids valine and alanine, the
glucose-alanine-cycle, but also plant-derived compounds like sitosterin as different
between control and GDM patients. PLS-DA and VIP analysis revealed tryptophan as
a strong variable separating control and GDM. As tryptophan is biotransformed to
serotonin we hypothesized whether serotonin metabolism might also be altered in GDM.
To test this hypothesis we applied a method for the analysis of serotonin, metabolic
intermediates and dopamine in urine by stable isotope dilution direct infusion electrospray
ionization mass spectrometry (SID-MS). Indeed, serotonin and related metabolites
differ significantly between control and GDM patients confirming the involvement of
serotonin metabolism in GDM. Clustered correlation coefficient visualization of metabolite
correlation networks revealed the different metabolic signatures between control and
GDM patients. Eventually, the combination of selected blood plasma and urine sample
metabolites improved the AUC prediction accuracy to 0.99. The detected GDM
candidate biomarkers and the related systemic metabolic signatures are discussed in
their pathophysiological context. Further studies with larger cohorts are necessary to
underpin these observations.
Keywords: diabetes, serotonin, GC-MS, SID-MS, urine, plasma, tryptophan metabolism, nutrition

Leitner et al. Serotonine Metabolism in Diabetes
INTRODUCTION
Gestational diabetes mellitus (GDM) is defined as glucoseintolerance with onset or new recognition in pregnancy(Kautzky-Willer et al., 2004, 2016b). The prevalence of GDMis rising worldwide, reaching up to 25.1% (Zhu and Zhang,2016). Therefore, GDM is the most common form of metaboliccomplication in pregnancy (Erem et al., 2015) and is associatedwith fetal macrosomia (Witkop et al., 2009), hyperbilirubinemia,and in consequence shoulder dystocia (Xiong et al., 2001; HAPOStudy Cooperative Research Group, 2008; Yogev et al., 2009)as well as maternal morbidity (hypertension, polyhydramnion,infection). Women who had GDM have an elevated risk todevelop Diabetes mellitus Type 2 (T2DM) or cardiovasculardisease (Tobias et al., 2011), as well as hyperlipidemia orobesity (Bartha et al., 2008; Clausen et al., 2009; Landon et al.,2009; Gillman et al., 2010; Harreiter et al., 2014) in later life,whereas their children have a higher risk for obesity or impairedfasting glucose (Silverman et al., 1995). Further, GDM affectsthe psychological health of the mother and the child: GDMincreases a woman’s risk of postpartum depression 4-fold (Hinkleet al., 2016), and postpartum depression is decreased withtreatment of GDM (Crowther et al., 2005; Beucher et al., 2010).Intrauterine exposure to hyperglycemia is linked to an increasedrisk for neuropsychiatric and neurodevelopmental disorders ofthe offspring (Xiang et al., 2015; Nahum Sacks et al., 2016).
Early detection of GDM and treatment can reduce the riskfor mother and child. The current gold standard of diagnosingGDM is an oral glucose tolerance test (oGTT) between 24 and28 weeks of gestation. However, detection of women at risk evenearlier during pregnancy would be important to enable earlylifestyle modification or even drug treatment in order to improveperinatal outcomes of these women. In addition other markersthan glucose could be useful in identification of women andneonates at greatest risk. Therefore, the identification of newreliable and easily accessible biomarkers for earlier diagnosis ofwomen with metabolic alterations during pregnancy would be ofgreat value.
When the fetus starts to grow the maternal metabolismchanges. More and more energy is required to ensure thegrowth of the unborn child. For this reason the maternalmetabolic state must be modified in different and multiple waysto afford the energy demand. Among the altered mechanisms, anadaptation of hormones appears, such as insulin, serotonin (5-hydroxytryptamin, 5HT), hepatocyte growth factor (HGF) andcortisol (Ernst et al., 2011). Moreover transcription factors andcell cycle regulators cause a change in the metabolism of themother during pregnancy (Ernst et al., 2011). These modulationsare essential physiological elements for the normal progress ofpregnancy, but can implicate pathological diabetic condition ifthey are disrupted. Although the altered mechanisms in GDMand overt diabetes are similar and pathways can be deduced, theconditions and the pathophysiology differ, and more research isneeded on the most common but heterogeneous form, namelyGDM (International Association of Diabetes in Pregnancy StudyGroup Working Group on Outcome et al., 2015; Kautzky-Willeret al., 2016a; Simmons et al., 2016; Rosta et al., 2017).
Metabolomics has the capacity to detect early deregulationsand disruptions in metabolism associated with diseases ordisorders. To investigate physiological processes and to develop(early) diagnostics, metabolomics is one of the most promisingtechnologies (Bain et al., 2009; Pinto et al., 2015; Allalouet al., 2016). In case of glucose disrupted states (like GDM),there are novel findings regarding hitherto inconspicioushormones like melatonin or serotonin which arouse interest(Ernst et al., 2011) and legitimate closer examinations ofthe metabolome and hormone levels in GDM. Therefore weused untargeted and targeted metabolomic technology for thecombined investigation of the metabolome in 32 pregnantwomen with and without GDM in blood plasma and urineand performed a metabolite profiling. Differences in theprofiles between the case and control group were detectedpointing to potential biomarkers and physiological processesfor early GDM. Complementary to these metabolite markersthe body mass index (BMI) and week of pregnancy (seeSupplementary Table S1) were monitored. Combined regressionanalysis of the latter, blood plasma and urine metabolitesimproved the AUC (Area under curve) prediction accuracy to0.99. In this paper we discuss corresponding hypotheses andassumptions for detected alterations in metabolic pathways fora better understanding of the metabolomic changes occuringin GDM.
MATERIALS AND METHODS
Study PopulationParticipants were recruited from the outpatient clinic at theMedical University of Vienna. We investigated 14 women withGDM and 18 women without GDM (nGDM). The participantswere 21–41 years old and in 12th−26th week of pregnancy(see Supplementary Table S1 also for BMI). The study wasperformed in accordance with the ethical principles of theDeclaration of Helsinki II and was approved by the localethics committee (Ethics Committee of the Medical Universityof Vienna). All participants gave their written informedconsent.
GDM Definition, BMI and SamplePreparationGDM was diagnosed with a standard 2 h 75 g oral glucosetolerance test (oGTT), according to the InternationalAssociation of Diabetes and Pregnancy Study Groups(IADPSG) criteria (International Association of PregnancyStudy Groups Consensus Panel et al., 2010; Colagiuri et al.,2014). Eighteen control and fourteen GDM cases were defined.Urine samples were taken before the oGTT and urine was storedat −20◦C. Blood samples were taken at three time points ofthe oGTT (0, 60, and 120min after glucose intake). Plasmasamples were prepared by centrifugation. Coagulation wasavoided with an anticoagulant, ethylenediaminetetraacetic acid(EDTA). Samples were stored at −20◦C until measurement.BMI was calculated as weight (kg) divided by the square ofheight (m2).
Frontiers in Molecular Biosciences | www.frontiersin.org 2 December 2017 | Volume 4 | Article 84

Leitner et al. Serotonine Metabolism in Diabetes
Plasma Sample Extraction, Derivatization,GC-MS Analysis, Identification andQuantification
Extraction and derivatization were performed slightly modifiedaccording to Weckwerth et al. (2004b). Chemicals werepurchased from Sigma-Aldrich (Austria) if not stated otherwise:Methanol (CHROMASOLV R©, HPLC grade), chloroform(anhydrous ≥99%, stabilized with 0.5–1% ethanol). Water wasdouble-distilled and deionized (Milli-Q water R© Advantage A10,Austria).
Samples were extracted in batches of 12, each including apooled quality control sample and a blank processed in thesame way. The pooled sample was a mixture of randomlychosen blood aliquots of half of the women, containing mostof the metabolites expected in plasma (Dunn et al., 2011).Extraction was done by adding 200 µl of plasma to 1.7ml of pre-chilled (−20◦C) extraction mixture: methanol/chloroform/water(2.5:1:0.5 (v/v/v)) (MCW) and internal standard was spiked(1µmol of D-Sorbitol-13C6, 98 atom % 13C, Campro Scientific,Germany). Sample tubes were agitated for 10 s and incubatedfor 8min on ice. Samples were centrifuged for 4min at 14,000 gat 4◦C. The one-phase-supernatant was collected in a newEppendorf tube, shortly vortexed and divided into two equalaliquots, corresponding to 100 µl plasma each. Samples weredried using a speed vac (SavantTM, Thermo Scientific, Austria)and stored at −80◦C until measurements. One aliquot of eachsample was used for further GC-MS analyses and metaboliteswere derivatized before measurement in two steps. Dried extractswere acclimated at room temperature for 10min, dissolvedin 20 µl solution of 40 mg/ml methoxyamine hydrochloride(CH3ONH2∗HCL) in pyridine and incubated for 90min at 30◦Con a thermo shaker (550 rpm). Subsequently, 80 µl of N-methyl-N-(trimethylsilyl) trifluoroacetamide (MSTFA) (MachereyNagel,Germany) were added and incubated for 30min at 37◦C.After centrifugation (2min at 14,000 g), the supernatant wastransferred to glass vials with micro inserts, closed with crimpcaps and measured by gas chromatography coupled to massspectrometry (GC-MS). GC-MS analyses and data validationwere performed according to previous publications (Mari et al.,2013; Prezelj et al., 2016) with slight modifications on aThermoFisher Trace GC coupled to a Triple Quadrupole massanalyzer (Thermo Scientific TSQ Quantum GCTM, Bremen,Germany). Each batch included randomly chosen samples, ablank, a pooled quality control sample and a pure non derivatizedalkane standard mixture of even-numbered n-alkanes (C10-C40,each 50 mg/L in hexane) for retention index (RI) determination.One microliter of sample was injected in splitless mode ata constant injector temperature of 230◦C using a deactivatedstainless steel Siltek liner (Restek Corp., USA). GC separationwas performed on a HP-5MS capillary column (30m × 0.25mm× 0.25µm) (Agilent Technologies, CA) at a constant heliumflow rate of 1mL min−1. Initial oven temperature was set to70◦C and held for 1min, followed by a ramp to 76◦C at 1◦Cmin−1 and a second ramp at 6◦C min−1 to 350◦C held for1min. Transfer line temperature was set to 340◦C and post runtemperature to 325◦C for 10min. The quadrupole mass analyzer
was used in full scan mode with a scan range of m/z 40–600 Thand a scan time of 250 msec. Electron impact (EI) ionizationwas performed at 70 eV with 50 µA emission current and ionsource temperature was set to 250◦C. Metabolite derivatives wereidentified by matching retention time as well as mass spectrawith those of reference standards and by comparison of alkanebased retention indices with an in house mass spectral library, aswell as the GMD library (Kopka et al., 2005). Metabolites wereconsidered as annotated with a spectral match factor higher than850 (NIST MS Search 2.0 Program algorithm) and RI-deviationlower than 4%. Deconvolution and RI-deviation calculation wasperformed with AMDIS (Stein, 1999) and quantification withLC-Quan 2.6.0 (Thermo Fisher Scientific Inc.). Peak areas of aspecific ion of a compound (quant m/z) were normalized to the13C-sorbitol peak within each run. More detailed informationand a list of quantified analytes can be found in SupplementaryTable S1.
Stable Isotope Diluted Direct InfusionElectrospray Ionization Mass Spectrometry(SID-MS) Analysis of Serotonin Metabolismin UrineIf not stated otherwise solvents were purchased from Sigma-Aldrich (Austria) in high quality (CHROMASOLV R©, HPLCgrade), formic acid (ROTIPURAN R©) was purchased fromCarl Roth (Germany), acetic acid from Fisher Scientific(Austria) and water was double-distilled Milli-Q water as statedabove.
Urine samples were purified prior analyses by solid phaseextraction (SPE) using a slightly modified protocol according toMoriarty et al. (2011). Reaction tubes (15ml, Greiner bio-one)were prepared by cutting a hole into the lid in the size of a SPEC18 cartridge (InertSepTM 100mg/1ml, GL Sciences, Japan). SPEcartridges were inserted into the tubes and conditioned with 3×1ml methanol, followed by 3 × 1ml of acidified water to ph 3.5with acetic acid. Before loading, urine samples were diluted byadding 500 µl sample to 800 µL acidified water (ph 3.5) in a 2mlreaction tube including internal standard serotonin-d4 (1 µMol)(98 atom% D, CDN Isotopes, Canada). After vortexing andcentrifugation for 5min at 14,000 g the supernatant was loadedon the SPE cartridge and washed with 1ml 5% (v/v) methanolsolution.Metabolites were eluted with 5× 1ml 0.1M ammoniumacetate in methanol. SPE cartridge tubes were centrifuged aftereach solvent or sample loading step at 1,000 g for 30 sec at4◦C. The collected eluate was dried for 2 h to absolute drynessunder a gentle stream of nitrogen (N2 99.999%) and storedat−20◦C.
Purified and dried urine samples were dissolved in 200 µL0.1% formic acid in methanol, centrifuged at 21,000 g andsupernatant were transferred to glass vials with micro-insertswhich were crimped with pre-perforated lids. Samples were keptat 4◦C during all preparation steps of extraction, purification andanalyses.
Targeted SID-MS detection and quantification of serotonin-melatonin-tryptophan pathway metabolites were performed onan Orbitrap Elite mass spectrometer (Thermo Fisher Scientific,
Frontiers in Molecular Biosciences | www.frontiersin.org 3 December 2017 | Volume 4 | Article 84
Leitner et al. Serotonine Metabolism in Diabetes
USA). Direct infusion of samples was performed using a nanoUHPLC pump equipped with an autosampler (Dionex UltiMate3000 RSLCnano UHPLC pump, Thermo Fisher Scientific) by anisocratic flow. To prevent clogging of the nano spray needle, aPicoChipTM nano emitter system for Infusion (New objectiveInc., USA) was used and ionization was conducted using anano spray ionisation source (NSI). In the following, instrumentdescriptions and detailed parameters are given. Injection volumewas 5 µl, isocratic flow was performed at a flow rate of 500nL/min, with 60% mobile phase A: 0.1% formic acid and 40%mobile phase B (90% ACN, 10% H2O,+0.1% formic acid) with atotal run time of 15min. Tip size of the PicoChipTM nano emitterwas 15µm and NSI source parameters were as follows: sourcevoltage 1.9 kV, source current 100 µA, sheath gas 0, aux gas 0 andcapillary temperature 275◦C.
Accurate mass analysis was performed using the OrbitrapFTMS mass analyzer using the lock mass option in MSand MS/MS mode. Ions of cyclomethicone N5 (m/z =
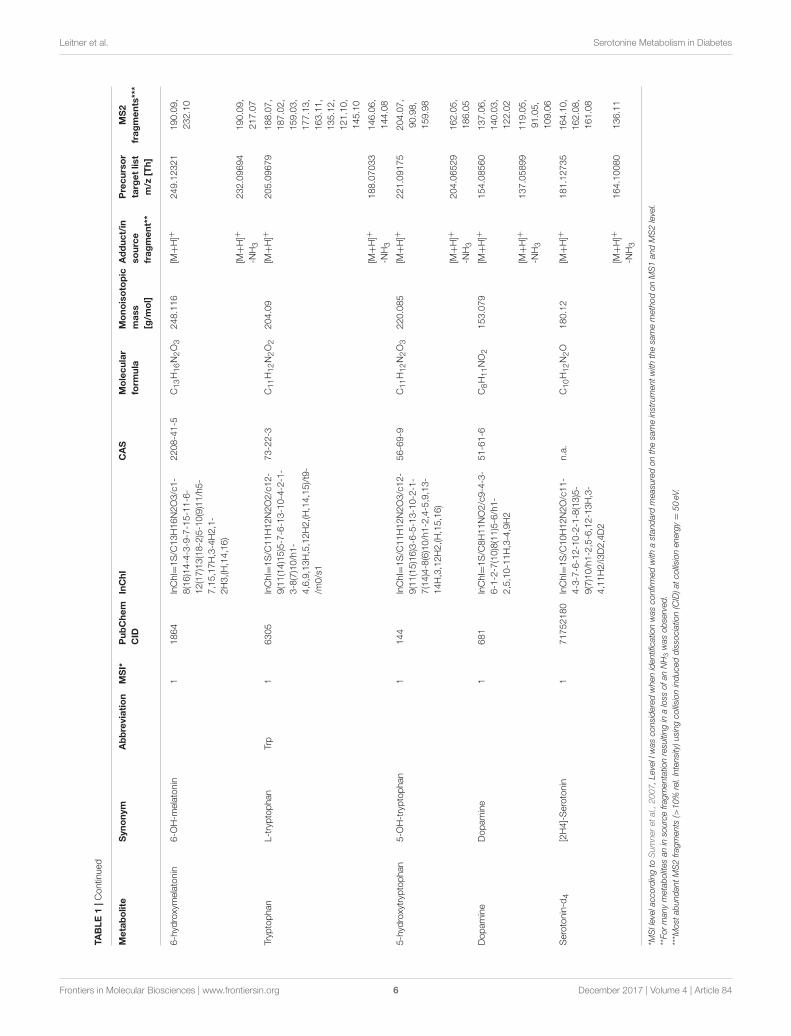
371.101230) were used for internal mass calibration. Datadependent MS2 scan experiments of a target parent mass listwas performed at a mass resolution of 120,000; scan event1 was performed in full scan mode and a scan range ofm/z 110–600 Th, MS2 fragmentation of triggered precursormasses in scan event 2 was performed by collision induceddissociation (CID) with 50 eV normalized collision energy.Precursor ions of the target analytes serotonin, 5-hydroxyindolicacetic acid, N-acetylserotonin, 5-methoxytryptamin, melatonin,6-hydroxymelatonin, L-tryptophan, 5-hydroxytryptophan anddopamine, as well as observed MS2 fragments are summarizedin Table 1. Mass calibration was performed once a week. Forquantification average intensities of MS² product ions were usedand normalized to the stable isotope labeled internal standardserotonin-d4.
Statistical AnalysisLog transformation and data normalization using internalstandards to avoid interday tuning differences were applied.Two tailed unpaired t-test was used to compare the differencesin metabolites between the control and the GDM-group. Ap-value of less than 0.05 was regarded to be statisticallysignificant. Further, the data were analysed with principalcomponent analysis (PCA) and ANOVA integrated in thestatistical toolbox COVAIN (Sun and Weckwerth, 2012) to findgroup separations and significant metabolite changes betweencontrol and GDM. Additionally, the data matrices are analyzedwith partial least squares discriminant analysis (PLS-DA) usingSIMCA-PR (Umetrics, Sweden). The PLS-DA model employed7 cross validation groups, assigning every 7th observation tothe same group, and grouping similar observations in the samegroups. In Supplementary Figure S1 Q2(cum) and R2(cum)are given as indicators for goodness of fit and the predictivequality of all three time points. Variable importance selectionwas conducted with a VIP-analysis (variable importance in theprojection).
Clustered correlation coefficient matrix visualization wasperformed with an in house written Matlab script (MatlabR2016b, version 9.1, R© Natick, Massachusetts, United States).
The script is available upon request from the correspondingauthor.
BMI, week of pregnancy and blood and urine samplemetabolites were analyzed by LASSO regression (least absoluteshrinkage and selection operator). For 21 patients (10 GDM,11 normal) with serotonin and intermediates measurements, webuilt statistical models to predict GDM from a combinationof metabolomics (131 metabolites) as well as serotonindata (8 compounds). First, metabolomics data were log-transformed. Second, all variables were standardized by the z-score transformation. Third, LASSO regression combined witha linear SVM (support vector machine) classifier, was applied toselect the best subset of variables that achieve highest predictionaccuracy. LASSO is a regularization regression method thatpenalizes the absolute size of the regression coefficients to avoidoverfitting that is common in many regression problems. Here,LASSO was applied with a range of lambda values, or theregularization parameter. For each lambda value, a subset ofvariables are selected. Then a linear SVM model was builtusing these variables for the two-class (GDM = 1, nGDM = 0)classification problem. The concept of SVM is to maximize themargin that distinguish groups of data by fitting a “hyperplane.”It proves to work well with biological data where the samplesize is small. The SVM model was evaluated by five-fold crossvalidation (CV). After trying all lambda values, the best subsetof variables were selected from the model with minimal CVerror. All the analysis was done by the Statistics and MachineLearning Toolbox in Matlab R2016b (version 9.1, R© Natick,Massachusetts, United States).
RESULTS
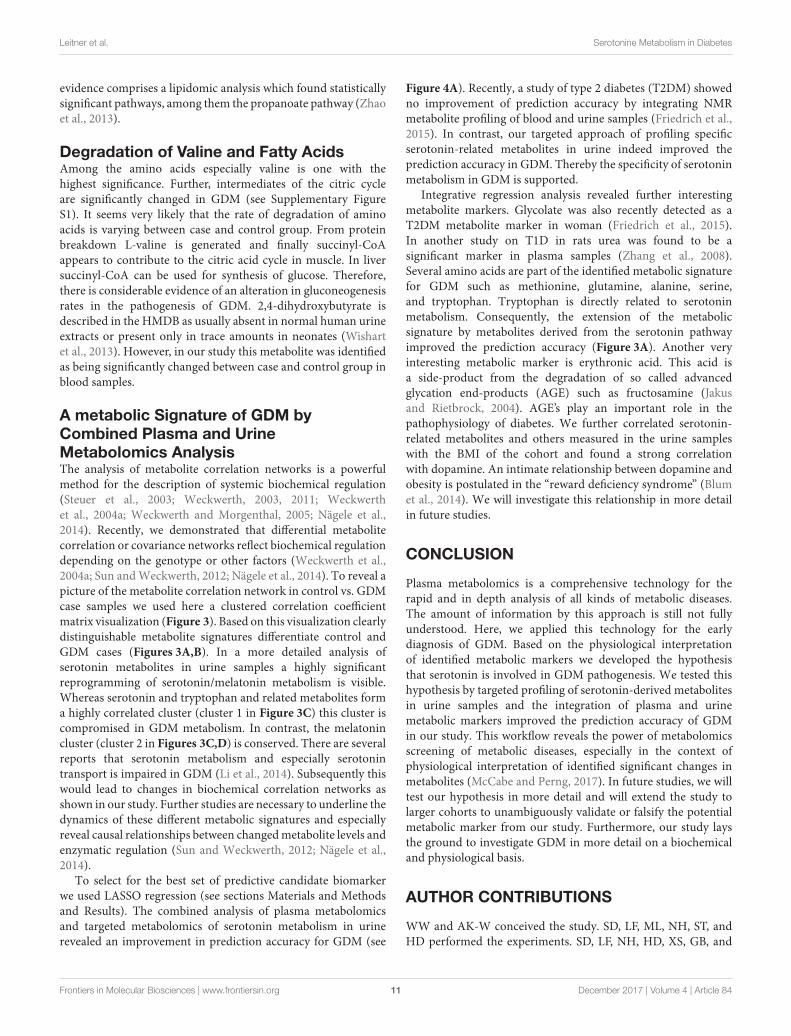
Plasma Metabolite Analysis of Control andGDM Patients during an Oral GlucoseTolerance Test (oGTT)We applied an universal integrative protocol for extraction andanalysis of metabolites from plasma samples (Weckwerth et al.,2004b). After extraction with MCW (methanol, chloroform,water in a one phase mixture) no further phase separation wasperformed and the complete MCW extract was injected intoGC-MS. With the modified protocol 131 annotated and putativemetabolites were detected (see Supplementary Table S1). Themetabolite data were further analyzed by PLS-DA (see Figure 1).Healthy pregnant women are labeled by black squares (class 1)and diabetic individuals are labeled with red dots (class 2). PLS-DA revealed a separation between case and control groups in allthree time points of the oGTT (Figures 1A–C). To detect themetabolites, which are most responsible for the separation in thePLS-scatter plots a VIP analysis has been performed. The patternof the corresponding VIP analysis (Figure 1D) illustrates themetabolites importantance projection for the sample separationseen in the PLS-DA plot in Figure 1B. VIP values largerthan one indicate important metabolites, which were groupedinto classes. The VIP plot (Figure 1D), sorted by importance,showed the metabolites tryptophan and 3-hydroxybutanoic acidas most discriminatory between GDM and control. Further
Frontiers in Molecular Biosciences | www.frontiersin.org 4 December 2017 | Volume 4 | Article 84

Leitner et al. Serotonine Metabolism in Diabetes
TABLE1|Metaboliteandmass
spectralinform
atio
noftargetedSID-M
Sanalysis.
Metabolite
Synonym
Abbreviation
MSI*
PubChem
CID
InChI
CAS
Molecular
form
ula
Monoisotopic
mass
[g/m
ol]
Adduct/in
source
fragment**
Precursor
targetlist
m/z
[Th]
MS2
fragments***
Serotonin
5-
Hyd
roxytryp
tamine
5-H
T1
5202
InChI=
1S/C
10H12N2O/c11-
4-3-7-6-12-10-2-1-8(13)5-
9(7)10/h1-2,5-6,12-13H,3-
4,11H2
50-67-9
C10H12N2O
176.095
[M+H]+
177.10136
131.00,
121.10,
159.12,
135.08,
107.09
[M+H]+
-NH3
160.07474
132.08,
133.06,
115.05
5-hyd
roxyindoleacetic
acid
5-H
ydroxyindole-3-
acetic
acid,
5-
Hyd
roxyindoleacetate
5-H
IAA
11826
InChI=
1S/C
10H9NO3/c12-7-
1-2-9-8(4-7)6(5-11-9)3-
10(13)14/h1-2,4-5,11-
12H,3H2,(H,13,14)
54-16-0
C10H9NO3
191.058
[M+H]+
192.06548
146.06,
119.05,
174.15,
164.07,
110.06
bypeak
146.06009
118.07,
100.08,
113.95,
131.96,
146.06
N-acetylserotonin
N-A
cetyl-5-
hyd
roxytryp
tamine,
Norm
elatonin
1903
InChI=
1S/C
12H14N2O2/c1-
8(15)13-5-4-9-7-14-12-3-2-
10(16)6-11(9)12/h2-3,6-
7,14,16H,4-5H2,1H3,(H,13,15)
1210-83-9
C12H14N2O2
218.106
[M+H]+
219.11217
173.05,
191.06,
160.08,
[M+H]+
-NH3
202.08580
160.08,
184.08,
102.09,
174.09
5-m
ethoxytryp
tamine
Methoxytryp
tamine
11833
InChI=
1S/C
11H14N2O/c1-
14-9-2-3-11-10(6-9)8(4-5-
12)7-13-11/h2-3,6-7,13H,4-
5,12H2,1H3
608-07-1
C11H14N2O
190.111
[M+H]+
191.11743
145.02,
163.03,
173.13,
191.02
[M+H]+
-NH3
174.09076
159.07,
143.07
Melatonin
N-A
cetyl-5-
methoxytryp
tamine
1896
InChI=
1S/C
13H16N2O2/c1-
9(16)14-6-5-10-8-15-13-4-3-
11(17-2)7-12(10)13/h3-4,7-
8,15H,5-6H2,1-2H3,(H,14,16)
73-31-4
C13H16N2O2
232.121
[M+H]+
233.12802
174.09,
216.10
[M+H]+
-NH3
216.10159
174.09,
198.09,
116.11
(Continued)
Frontiers in Molecular Biosciences | www.frontiersin.org 5 December 2017 | Volume 4 | Article 84
Leitner et al. Serotonine Metabolism in Diabetes
TABLE1|Contin
ued
Metabolite
Synonym
Abbreviation
MSI*
PubChem
CID
InChI
CAS
Molecular
form
ula
Monoisotopic
mass
[g/m
ol]
Adduct/in
source
fragment**
Precursor
targetlist
m/z
[Th]
MS2
fragments***
6-hyd
roxymelatonin
6-O
H-m
elatonin
11864
InChI=
1S/C
13H16N2O3/c1-
8(16)14-4-3-9-7-15-11-6-
12(17)13(18-2)5-10(9)11/h5-
7,15,17H,3-4H2,1-
2H3,(H,14,16)
2208-41-5
C13H16N2O3
248.116
[M+H]+
249.12321
190.09,
232.10
[M+H]+
-NH3
232.09694
190.09,
217.07
Tryp
tophan
L-tryptophan
Trp
16305
InChI=
1S/C
11H12N2O2/c12-
9(11(14)15)5-7-6-13-10-4-2-1-
3-8(7)10/h1-
4,6,9,13H,5,12H2,(H,14,15)/t9-
/m0/s1
73-22-3
C11H12N2O2
204.09
[M+H]+
205.09679
188.07,
187.02,
159.03,
177.13,
163.11,
135.12,
121.10,
145.10
[M+H]+
-NH3
188.07033
146.06,
144.08
5-hyd
roxytryp
tophan
5-O
H-tryptophan
1144
InChI=
1S/C
11H12N2O3/c12-
9(11(15)16)3-6-5-13-10-2-1-
7(14)4-8(6)10/h1-2,4-5,9,13-
14H,3,12H2,(H,15,16)
56-69-9
C11H12N2O3
220.085
[M+H]+
221.09175
204.07,
90.98,
159.98
[M+H]+
-NH3
204.06529
162.05,
186.05
Dopamine
Dopamine
1681
InChI=
1S/C
8H11NO2/c9-4-3-
6-1-2-7(10)8(11)5-6/h1-
2,5,10-11H,3-4,9H2
51-61-6
C8H11NO2
153.079
[M+H]+
154.08560
137.06,
140.03,
122.02
[M+H]+
-NH3
137.05899
119.05,
91.05,
109.06
Serotonin-d
4[2H4]-Serotonin
171752180
InChI=
1S/C
10H12N2O/c11-
4-3-7-6-12-10-2-1-8(13)5-
9(7)10/h1-2,5-6,12-13H,3-
4,11H2/i3D2,4D2
n.a.
C10H12N2O
180.12
[M+H]+
181.12735
164.10,
162.08,
161.08
[M+H]+
-NH3
164.10080
136.11
*MSIlevelaccordingtoSumneretal.,2007,LevelIwasconsideredwhenidentificationwasconfirmedwithastandard
measuredonthesameinstrumentwiththesamemethodonMS1andMS2level.
**FormanymetabolitesaninsourcefragmentationresultinginalossofanNH3wasobserved.
***M
ostabundantMS2fragments(>10%rel.Intensity)usingcollisioninduceddissociation(CID)atcollisionenergy=50eV.
Frontiers in Molecular Biosciences | www.frontiersin.org 6 December 2017 | Volume 4 | Article 84

Leitner et al. Serotonine Metabolism in Diabetes
FIGURE 1 | PLS-DA model built for two classes, control and GDM for three different time points of the oral glucose tolerance test (oGTT). Healthy pregnant women
are labeled by black squares (class 1) and GDM individuals are labeled with red dots (class 2). (A) 0 h, (B) 1 h, (C) 2 h (D) VIP projection of the variables according to
the scores plot of B.
interesting metabolite markers discriminating GDM and controlare discussed below.
Amino Acids, Fatty Acids, Organic Acids,Sugars, and Steroids Discriminate Controland GDMIn Supplementary Figure S1 selected boxplots of statisticallysignificant organic acids, branched-chain amino acids (BCAA),and further amino acids are shown. Valine, alanine and β-alaninediffer significantly between patients with and without GDM.Several fatty acids, hydroxy acids and other organic acids aswell as ketone bodies and sugars show differences. 2- and 3-hydroxybutanoic acid (α- and β-hydroxybutyric acid, AHBAand BHBA) differ significantly (see boxplots SupplementaryFigure S1).
The intermediates of the tricarboxylic acid cycle (TCA) showsignificant differences between the GDM- group and the control-group. The potentially identified plant sterol β-sitosterol, derivedfrom diet, and cholesterol were found significantly changed.β-Sitosterol had also high loadings in the VIP analysis (seeFigure 1D).
Serotonin Metabolism Is Changed in GDMThe strong VIP loadings of tryptophan pointed us to serotoninmetabolism. Because serotonin and intermediates are only
weakly covered by GC-MS we applied a stable isotope dilutiondirect-infusion method (SIDE-MS assay, see section Materialsand Methods). We applied this assay to the analysis of urinesamples from the GDM and the control group. Urine analysisis a non-invasive technique complementing any other profilingmethod with lowest costs. In Figure 2A a principal componentanalysis demonstrates that serotonin metabolism is alteredin GDM patients in comparison to the control-group. InFigure 2B boxplots are shown of selected intermediates with highloadings.
Integrative Analysis of Plasma and UrineMetabolomicsIntegrative analysis of plasma and urine metabolite profiles wasperformed in two steps: (i) a systemic analysis using metabolitecorrelation networks of control and GDM cases, and (ii) using alinear regression method to determine the best set of candidatebiomarker for accurate prediction of GDM cases.
In Figures 3A,B clustering of correlation coefficients betweenall metabolites from plasma and from urine samples isshown. The clustered correlation map is very different betweencontrol and GDM cases indicating a large reprogramming ofmetabolism in GDM patients. This pattern can be interpretedas a signature of GDM. Details are discussed below and inthe discussion. In Figures 3C,D detailed clustered correlation
Frontiers in Molecular Biosciences | www.frontiersin.org 7 December 2017 | Volume 4 | Article 84

Leitner et al. Serotonine Metabolism in Diabetes
FIGURE 2 | Measurement of extracellular serotonin metabolic intermediates and dopamine in urine of GDM patients. (A) Principal component analysis of serotonin
metabolic intermediates. (B) Boxplots of serotonin metabolic intermediates in urine of GDM vs. control groups.
coefficient maps of the serotonin-related metabolites in urinesamples are depicted. Here, a remarkable difference is theclustering of serotonin, dopamine, 5-HIAA, N-acetyl-serotoninand tryptophan (cluster 1) and 5-methoxytryptamin, melatoninand 6-hydroxy-melatonin (cluster 2) in the control sampleswhereas cluster 1 is completely dissolved and cluster 2 ismaintained in GDM cases (see Figures 3C,D).
To select for the set of most discriminatory variablesfrom blood and urine sample metabolites a LASSO (leastabsolute shrinkage and selection operator) regression methodwas employed. For the 21 patients (10 GDM, 11 nGDM)with serotonin and metabolic intermediate measurements, webuilt statistical models to predict GDM from a combinationof 131 plasma metabolites as well as 8 urine metabolites
related to serotonin metabolism. LASSO regression wrappedwith a linear SVM (support vector machine) classifier, wasapplied to select the best subset of variables that achieves thehighest prediction accuracy. We found that the best subset ofmetabolites plus BMI achieves a good prediction performancewith an AUC (Area under curve) value 0.94 of the ROC(Receiver operating characteristic) curve. These metabolites areglycolic acid, urea, methionine, erythronic acid, an unknownorganic acid (potentially tartaric acid), glutamine, an unknowncarbohydrate, unknown, alanin, serin and tryptophan. Next, wetested whether the prediction accuracy can be improved bycombining the serotonin data from urine analysis. Following thesame procedure, the best model adds five serotonin compounds,namely, serotonin, 5-HIAA, L-tryptophan, melatonin and
Frontiers in Molecular Biosciences | www.frontiersin.org 8 December 2017 | Volume 4 | Article 84

Leitner et al. Serotonine Metabolism in Diabetes
6-hydroxymelatonin, and achieves a higher AUC value of0.99. The comparison between these two models is shown inFigure 4A.
Correlation between BMI and Metabolitesof Serotonin Metabolism in Urine SamplesPearson correlation coefficients (PCC) were calculated between8 urine target compounds and BMI (Figure 4B). Significantassociations were found between BMI and dopamine (PCC =
0.50, p-value = 0.022), and 5-HIAA (PCC = 0.49, p-value =
0.023), respectively.
DISCUSSION
Changes in Serotonin Metabolism in GDMvs. Control GroupL-tryptophan and its metabolites serotonin (5HT) and melatoninhave notable functions in regulating growth and developmentof the fetus (Glover, 2015; St-Pierre et al., 2016; Wu et al.,2016) and are involved in a magnifique number of physiologicalpathways and adaption processes during pregnancy (Sano et al.,2016). As L-trytophan (TRP) is highest ranked in the PLS-analysis (Figure 1D), we searched for differences regardingserotonin metabolism. Therefore, we applied a serotonin assay byusing stable isotope dilution direct electrospray ionization massspectrometry (SID-MS, see section Materials and Methods) toanalyze urine samples of the same patients. In the measurementsthe control and the GDM patients showed significantly differentconcentrations of serotonin and intermediates of this pathwayin urine samples (see Figure 2): serotonin levels were higherin women with GDM compared with women without GDM.Besides the well-known role of serotonin in mood and feedingbehavior, recent results renewed the interest in the role ofserotonin in metabolic diseases (Almaça et al., 2016). Conditionsof metabolic demand lead to the production of serotonin in thepancreatic islet (Kim et al., 2010; Goyvaerts et al., 2015, 2016).Further, studies showed that serotonin via autocrine signalingincreases beta- cell function and ß-cell mass during insulinresistant states (e.g., pregnancy). In mouse models evidencesuggests that increased serotonin in islets during pregnancydrives ß-cell expansion (Kim et al., 2010). Additionally, serotoninlevels were shown to rise in regard to BMI (Almaça et al., 2016).A recent study showed that ß-cell-derived serotonin inhibitsglucagon secretion, a hormone which elevates the blood glucoselevels. Based on this, our results could be explained by (1) adifferent lifestyle (nutrition: protein intake) of the patients withGDM and those without GDM (2) a higher BMI of womenwith GDM compared to the control group could be a reasoneither, or (3) higher serotonin levels in the case of disruptedmetabolism, like GDM, could substantiate that serotonin is afactor in maintaining normoglycemia, the increase presenting apossible compensatory mechanism.
In summary, changes in L-tryptophan in the GDM grouppointed to an altered serotonin metabolism which indeed ischanged in GDM patients. Accordingly, alterations in serotoninmetabolism may be fundamental in the pathogenesis of GDM.
Nevertheless, such findings need to be confirmed by furtherstudies analyzing larger cohorts.
Glucose-L-Alanine CycleSome of the significantly changed metabolites are found inthe glucose-L-alanine cycle, which plays a role in glycolysisand gluconeogenesis. These findings appear to be relevant forthe energy metabolism in GDM. The glucose-alanine cycle isa biochemical route between muscle and liver metabolism. Inthe muscle, protein is degraded resulting in glutamic acid.Subsequently, the alanine aminotransferase transfers the aminogroup from glutamate to pyruvate, which arises from glycolysis.L-alanine is formed and then transferred frommuscle to the liverthrough the blood. Finally, the amino acid is used in the liverfor gluconeogenesis. Several other metabolites show an alterationin concentrations from the GDM group (see SupplementaryFigure S1). Furthermore, we analysed also the alanine-amino-transferase activity and identified a significant change betweenthe case and control groups confirming the metabolomics data(data not shown). A recent study suggests an up-regulatedglycolysis and higher alanine concentration in T2DM patients(Huang and Joseph, 2012). Like in our study another recentstudy discovered increased concentrations of alanine and lactateas potential gluconeogenic precursors (Galazis et al., 2012) aswell as alanine and glutamate as significant marker in GDM(Bentley-Lewis et al., 2015).
Strong Markers of GDM Disease −2- and3-Hydroxybutanoic AcidKetone bodies play a role in the fatty acid biosynthesis.3-hydroxybutanoic acid (β-hydroxybutyrate; BHBA) is anorganic acid, which is used for the biosynthesis of fattyacids. BHBA reached statistical significance between the caseand control group. Furthermore, 2-hydroxybutanoic acid (α-hydroxybutyrate; AHBA) shows the lowest p-value of allmetabolites between control and GDM and therefore is one ofthe strongest metabolic alterations (Supplementary Figure S1).
Our results confirm already well documented conclusions:AHBA is suggested as an early biomarker for insulin resistanceand proposed to identify insulin resistance earlier than currentdiagnostic tests (Gall et al., 2010). Previous research has studiedliver and plasma metabolome in mice to identify early alterationsin development of insulin resistance and found significantchanges in metabolites, of which AHBA is also significant in ourstudy (Li et al., 2009). Altogether AHBA tends to be importantfor decreased insulin sensitivity in GDM and may be critical inthe prevention and treatment of diabetes as potent biomarker.
Propanoate MetabolismIn consideration of four metabolites—lactic acid, AHBA, beta-alanin, and valine—of the propanoate pathway which showa significant change in case and control (see SupplementaryTable S1 and Supplementary Figure S1) it seems reasonable topropose that the whole propanoate pathway is changed in thecase group. On the basis of our data we suggest an adaption inthe propanoate metabolism as described in an in-vivo study forDM by Huang in 2006 (Huang et al., 2006). Literature-derived
Frontiers in Molecular Biosciences | www.frontiersin.org 9 December 2017 | Volume 4 | Article 84

Leitner et al. Serotonine Metabolism in Diabetes
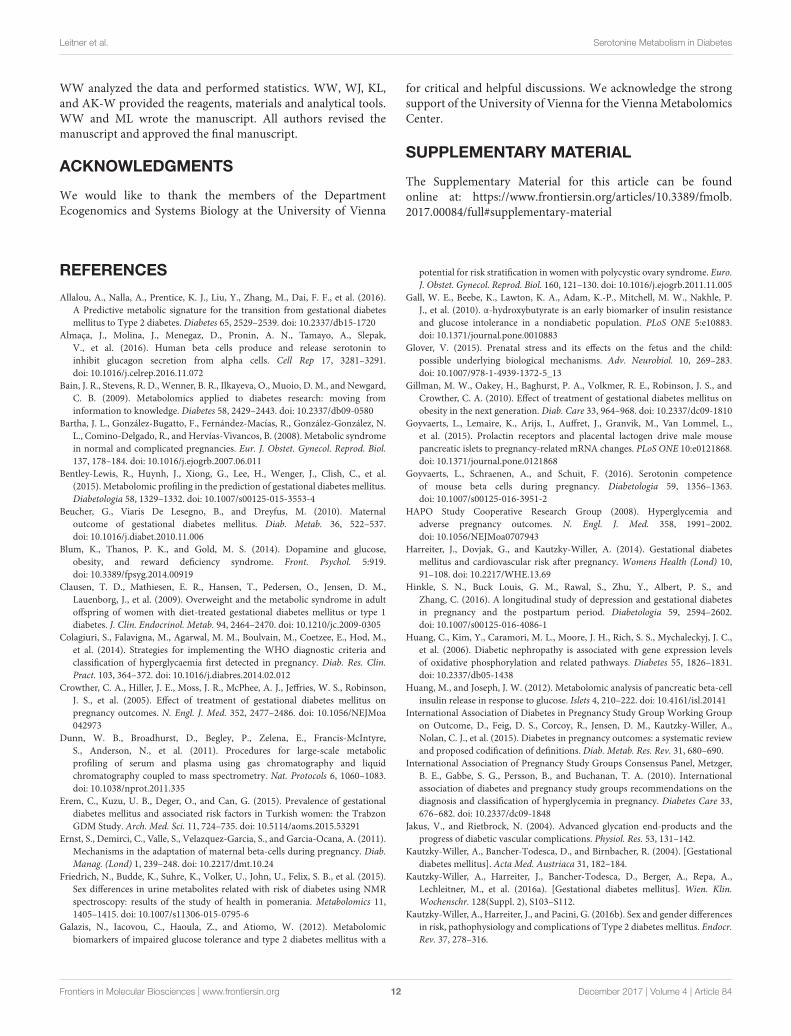
FIGURE 3 | Metabolite correlation network analysis visualized as clustered correlation coefficient matrix. (A) Clustered heat map shows a significant metabolic
signature of control samples. (B) GDM case show a different pattern compared to the control samples indicating a dramatic reprogramming of metabolism in GDM
disease. (C) Detailed view of serotonin/melatonin metabolites in urine samples of control. Cluster 1 is a highly correlated serotonin cluster and cluster 2 a highly
correlated melatonin cluster in normal metabolic conditions. (D) Detailed view of serotonin/melatonin metabolites in urine samples of GDM case. Cluster 1
disappeared in GDM cases and cluster 2 is conserved from control to GDM.
FIGURE 4 | Receiver operating characteristic (ROC) analysis of selected metabolites from plasma and urine samples of GDM vs. control patients. (A) Area under
curve (AUC) for selected metabolites from plasma analysis and combined analysis of selected analysis of plasma and urine analysis. The final AUC is 0.99. Selection of
variables was performed by LASSO regression (see section Materials and Methods). 11 Metabolites from blood samples and 5 metabolites from urine samples were
selected (for further information see results and discussion). (B) Correlation analysis of serotonin, associated metabolic intermediates and dopamine measured in urine
with BMI. The strongest correlation is found for dopamine.
Frontiers in Molecular Biosciences | www.frontiersin.org 10 December 2017 | Volume 4 | Article 84
Leitner et al. Serotonine Metabolism in Diabetes
evidence comprises a lipidomic analysis which found statisticallysignificant pathways, among them the propanoate pathway (Zhaoet al., 2013).
Degradation of Valine and Fatty AcidsAmong the amino acids especially valine is one with thehighest significance. Further, intermediates of the citric cycleare significantly changed in GDM (see Supplementary FigureS1). It seems very likely that the rate of degradation of aminoacids is varying between case and control group. From proteinbreakdown L-valine is generated and finally succinyl-CoAappears to contribute to the citric acid cycle in muscle. In liversuccinyl-CoA can be used for synthesis of glucose. Therefore,there is considerable evidence of an alteration in gluconeogenesisrates in the pathogenesis of GDM. 2,4-dihydroxybutyrate isdescribed in the HMDB as usually absent in normal human urineextracts or present only in trace amounts in neonates (Wishartet al., 2013). However, in our study this metabolite was identifiedas being significantly changed between case and control group inblood samples.
A metabolic Signature of GDM byCombined Plasma and UrineMetabolomics AnalysisThe analysis of metabolite correlation networks is a powerfulmethod for the description of systemic biochemical regulation(Steuer et al., 2003; Weckwerth, 2003, 2011; Weckwerthet al., 2004a; Weckwerth and Morgenthal, 2005; Nägele et al.,2014). Recently, we demonstrated that differential metabolitecorrelation or covariance networks reflect biochemical regulationdepending on the genotype or other factors (Weckwerth et al.,2004a; Sun andWeckwerth, 2012; Nägele et al., 2014). To reveal apicture of the metabolite correlation network in control vs. GDMcase samples we used here a clustered correlation coefficientmatrix visualization (Figure 3). Based on this visualization clearlydistinguishable metabolite signatures differentiate control andGDM cases (Figures 3A,B). In a more detailed analysis ofserotonin metabolites in urine samples a highly significantreprogramming of serotonin/melatonin metabolism is visible.Whereas serotonin and tryptophan and related metabolites forma highly correlated cluster (cluster 1 in Figure 3C) this cluster iscompromised in GDM metabolism. In contrast, the melatonincluster (cluster 2 in Figures 3C,D) is conserved. There are severalreports that serotonin metabolism and especially serotonintransport is impaired in GDM (Li et al., 2014). Subsequently thiswould lead to changes in biochemical correlation networks asshown in our study. Further studies are necessary to underline thedynamics of these different metabolic signatures and especiallyreveal causal relationships between changedmetabolite levels andenzymatic regulation (Sun and Weckwerth, 2012; Nägele et al.,2014).
To select for the best set of predictive candidate biomarkerwe used LASSO regression (see sections Materials and Methodsand Results). The combined analysis of plasma metabolomicsand targeted metabolomics of serotonin metabolism in urinerevealed an improvement in prediction accuracy for GDM (see
Figure 4A). Recently, a study of type 2 diabetes (T2DM) showedno improvement of prediction accuracy by integrating NMRmetabolite profiling of blood and urine samples (Friedrich et al.,2015). In contrast, our targeted approach of profiling specificserotonin-related metabolites in urine indeed improved theprediction accuracy in GDM. Thereby the specificity of serotoninmetabolism in GDM is supported.
Integrative regression analysis revealed further interestingmetabolite markers. Glycolate was also recently detected as aT2DM metabolite marker in woman (Friedrich et al., 2015).In another study on T1D in rats urea was found to be asignificant marker in plasma samples (Zhang et al., 2008).Several amino acids are part of the identified metabolic signaturefor GDM such as methionine, glutamine, alanine, serine,and tryptophan. Tryptophan is directly related to serotoninmetabolism. Consequently, the extension of the metabolicsignature by metabolites derived from the serotonin pathwayimproved the prediction accuracy (Figure 3A). Another veryinteresting metabolic marker is erythronic acid. This acid isa side-product from the degradation of so called advancedglycation end-products (AGE) such as fructosamine (Jakusand Rietbrock, 2004). AGE’s play an important role in thepathophysiology of diabetes. We further correlated serotonin-related metabolites and others measured in the urine sampleswith the BMI of the cohort and found a strong correlationwith dopamine. An intimate relationship between dopamine andobesity is postulated in the “reward deficiency syndrome” (Blumet al., 2014). We will investigate this relationship in more detailin future studies.
CONCLUSION
Plasma metabolomics is a comprehensive technology for therapid and in depth analysis of all kinds of metabolic diseases.The amount of information by this approach is still not fullyunderstood. Here, we applied this technology for the earlydiagnosis of GDM. Based on the physiological interpretationof identified metabolic markers we developed the hypothesisthat serotonin is involved in GDM pathogenesis. We tested thishypothesis by targeted profiling of serotonin-derived metabolitesin urine samples and the integration of plasma and urinemetabolic markers improved the prediction accuracy of GDMin our study. This workflow reveals the power of metabolomicsscreening of metabolic diseases, especially in the context ofphysiological interpretation of identified significant changes inmetabolites (McCabe and Perng, 2017). In future studies, we willtest our hypothesis in more detail and will extend the study tolarger cohorts to unambiguously validate or falsify the potentialmetabolic marker from our study. Furthermore, our study laysthe ground to investigate GDM in more detail on a biochemicaland physiological basis.
AUTHOR CONTRIBUTIONS
WW and AK-W conceived the study. SD, LF, ML, NH, ST, andHD performed the experiments. SD, LF, NH, HD, XS, GB, and
Frontiers in Molecular Biosciences | www.frontiersin.org 11 December 2017 | Volume 4 | Article 84
Leitner et al. Serotonine Metabolism in Diabetes
WW analyzed the data and performed statistics. WW, WJ, KL,and AK-W provided the reagents, materials and analytical tools.WW and ML wrote the manuscript. All authors revised themanuscript and approved the final manuscript.
ACKNOWLEDGMENTS
We would like to thank the members of the DepartmentEcogenomics and Systems Biology at the University of Vienna
for critical and helpful discussions. We acknowledge the strongsupport of the University of Vienna for the ViennaMetabolomicsCenter.
SUPPLEMENTARY MATERIAL
The Supplementary Material for this article can be foundonline at: https://www.frontiersin.org/articles/10.3389/fmolb.2017.00084/full#supplementary-material
REFERENCES
Allalou, A., Nalla, A., Prentice, K. J., Liu, Y., Zhang, M., Dai, F. F., et al. (2016).A Predictive metabolic signature for the transition from gestational diabetesmellitus to Type 2 diabetes. Diabetes 65, 2529–2539. doi: 10.2337/db15-1720
Almaça, J., Molina, J., Menegaz, D., Pronin, A. N., Tamayo, A., Slepak,V., et al. (2016). Human beta cells produce and release serotonin toinhibit glucagon secretion from alpha cells. Cell Rep 17, 3281–3291.doi: 10.1016/j.celrep.2016.11.072
Bain, J. R., Stevens, R. D., Wenner, B. R., Ilkayeva, O., Muoio, D. M., and Newgard,C. B. (2009). Metabolomics applied to diabetes research: moving frominformation to knowledge. Diabetes 58, 2429–2443. doi: 10.2337/db09-0580
Bartha, J. L., González-Bugatto, F., Fernández-Macías, R., González-González, N.L., Comino-Delgado, R., and Hervías-Vivancos, B. (2008). Metabolic syndromein normal and complicated pregnancies. Eur. J. Obstet. Gynecol. Reprod. Biol.137, 178–184. doi: 10.1016/j.ejogrb.2007.06.011
Bentley-Lewis, R., Huynh, J., Xiong, G., Lee, H., Wenger, J., Clish, C., et al.(2015). Metabolomic profiling in the prediction of gestational diabetes mellitus.Diabetologia 58, 1329–1332. doi: 10.1007/s00125-015-3553-4
Beucher, G., Viaris De Lesegno, B., and Dreyfus, M. (2010). Maternaloutcome of gestational diabetes mellitus. Diab. Metab. 36, 522–537.doi: 10.1016/j.diabet.2010.11.006
Blum, K., Thanos, P. K., and Gold, M. S. (2014). Dopamine and glucose,obesity, and reward deficiency syndrome. Front. Psychol. 5:919.doi: 10.3389/fpsyg.2014.00919
Clausen, T. D., Mathiesen, E. R., Hansen, T., Pedersen, O., Jensen, D. M.,Lauenborg, J., et al. (2009). Overweight and the metabolic syndrome in adultoffspring of women with diet-treated gestational diabetes mellitus or type 1diabetes. J. Clin. Endocrinol. Metab. 94, 2464–2470. doi: 10.1210/jc.2009-0305
Colagiuri, S., Falavigna, M., Agarwal, M. M., Boulvain, M., Coetzee, E., Hod, M.,et al. (2014). Strategies for implementing the WHO diagnostic criteria andclassification of hyperglycaemia first detected in pregnancy. Diab. Res. Clin.Pract. 103, 364–372. doi: 10.1016/j.diabres.2014.02.012
Crowther, C. A., Hiller, J. E., Moss, J. R., McPhee, A. J., Jeffries, W. S., Robinson,J. S., et al. (2005). Effect of treatment of gestational diabetes mellitus onpregnancy outcomes. N. Engl. J. Med. 352, 2477–2486. doi: 10.1056/NEJMoa042973
Dunn, W. B., Broadhurst, D., Begley, P., Zelena, E., Francis-McIntyre,S., Anderson, N., et al. (2011). Procedures for large-scale metabolicprofiling of serum and plasma using gas chromatography and liquidchromatography coupled to mass spectrometry. Nat. Protocols 6, 1060–1083.doi: 10.1038/nprot.2011.335
Erem, C., Kuzu, U. B., Deger, O., and Can, G. (2015). Prevalence of gestationaldiabetes mellitus and associated risk factors in Turkish women: the TrabzonGDM Study. Arch. Med. Sci. 11, 724–735. doi: 10.5114/aoms.2015.53291
Ernst, S., Demirci, C., Valle, S., Velazquez-Garcia, S., and Garcia-Ocana, A. (2011).Mechanisms in the adaptation of maternal beta-cells during pregnancy. Diab.Manag. (Lond) 1, 239–248. doi: 10.2217/dmt.10.24
Friedrich, N., Budde, K., Suhre, K., Volker, U., John, U., Felix, S. B., et al. (2015).Sex differences in urine metabolites related with risk of diabetes using NMRspectroscopy: results of the study of health in pomerania. Metabolomics 11,1405–1415. doi: 10.1007/s11306-015-0795-6
Galazis, N., Iacovou, C., Haoula, Z., and Atiomo, W. (2012). Metabolomicbiomarkers of impaired glucose tolerance and type 2 diabetes mellitus with a
potential for risk stratification in women with polycystic ovary syndrome. Euro.J. Obstet. Gynecol. Reprod. Biol. 160, 121–130. doi: 10.1016/j.ejogrb.2011.11.005
Gall, W. E., Beebe, K., Lawton, K. A., Adam, K.-P., Mitchell, M. W., Nakhle, P.J., et al. (2010). α-hydroxybutyrate is an early biomarker of insulin resistanceand glucose intolerance in a nondiabetic population. PLoS ONE 5:e10883.doi: 10.1371/journal.pone.0010883
Glover, V. (2015). Prenatal stress and its effects on the fetus and the child:possible underlying biological mechanisms. Adv. Neurobiol. 10, 269–283.doi: 10.1007/978-1-4939-1372-5_13
Gillman, M. W., Oakey, H., Baghurst, P. A., Volkmer, R. E., Robinson, J. S., andCrowther, C. A. (2010). Effect of treatment of gestational diabetes mellitus onobesity in the next generation. Diab. Care 33, 964–968. doi: 10.2337/dc09-1810
Goyvaerts, L., Lemaire, K., Arijs, I., Auffret, J., Granvik, M., Van Lommel, L.,et al. (2015). Prolactin receptors and placental lactogen drive male mousepancreatic islets to pregnancy-related mRNA changes. PLoS ONE 10:e0121868.doi: 10.1371/journal.pone.0121868
Goyvaerts, L., Schraenen, A., and Schuit, F. (2016). Serotonin competenceof mouse beta cells during pregnancy. Diabetologia 59, 1356–1363.doi: 10.1007/s00125-016-3951-2
HAPO Study Cooperative Research Group (2008). Hyperglycemia andadverse pregnancy outcomes. N. Engl. J. Med. 358, 1991–2002.doi: 10.1056/NEJMoa0707943
Harreiter, J., Dovjak, G., and Kautzky-Willer, A. (2014). Gestational diabetesmellitus and cardiovascular risk after pregnancy. Womens Health (Lond) 10,91–108. doi: 10.2217/WHE.13.69
Hinkle, S. N., Buck Louis, G. M., Rawal, S., Zhu, Y., Albert, P. S., andZhang, C. (2016). A longitudinal study of depression and gestational diabetesin pregnancy and the postpartum period. Diabetologia 59, 2594–2602.doi: 10.1007/s00125-016-4086-1
Huang, C., Kim, Y., Caramori, M. L., Moore, J. H., Rich, S. S., Mychaleckyj, J. C.,et al. (2006). Diabetic nephropathy is associated with gene expression levelsof oxidative phosphorylation and related pathways. Diabetes 55, 1826–1831.doi: 10.2337/db05-1438
Huang, M., and Joseph, J. W. (2012). Metabolomic analysis of pancreatic beta-cellinsulin release in response to glucose. Islets 4, 210–222. doi: 10.4161/isl.20141
International Association of Diabetes in Pregnancy Study Group Working Groupon Outcome, D., Feig, D. S., Corcoy, R., Jensen, D. M., Kautzky-Willer, A.,Nolan, C. J., et al. (2015). Diabetes in pregnancy outcomes: a systematic reviewand proposed codification of definitions. Diab. Metab. Res. Rev. 31, 680–690.
International Association of Pregnancy Study Groups Consensus Panel, Metzger,B. E., Gabbe, S. G., Persson, B., and Buchanan, T. A. (2010). Internationalassociation of diabetes and pregnancy study groups recommendations on thediagnosis and classification of hyperglycemia in pregnancy. Diabetes Care 33,676–682. doi: 10.2337/dc09-1848
Jakus, V., and Rietbrock, N. (2004). Advanced glycation end-products and theprogress of diabetic vascular complications. Physiol. Res. 53, 131–142.
Kautzky-Willer, A., Bancher-Todesca, D., and Birnbacher, R. (2004). [Gestationaldiabetes mellitus]. Acta Med. Austriaca 31, 182–184.
Kautzky-Willer, A., Harreiter, J., Bancher-Todesca, D., Berger, A., Repa, A.,Lechleitner, M., et al. (2016a). [Gestational diabetes mellitus]. Wien. Klin.
Wochenschr. 128(Suppl. 2), S103–S112.Kautzky-Willer, A., Harreiter, J., and Pacini, G. (2016b). Sex and gender differences
in risk, pathophysiology and complications of Type 2 diabetes mellitus. Endocr.Rev. 37, 278–316.
Frontiers in Molecular Biosciences | www.frontiersin.org 12 December 2017 | Volume 4 | Article 84

Leitner et al. Serotonine Metabolism in Diabetes
Kim, H., Toyofuku, Y., Lynn, F. C., Chak, E., Uchida, T., Mizukami, H., et al.(2010). Serotonin regulates pancreatic beta cell mass during pregnancy. Nat.Med. 16, 804–808. doi: 10.1038/nm.2173
Kopka, J., Schauer, N., Krueger, S., Birkemeyer, C., Usadel, B., Bergmuller, E.,et al. (2005). [email protected]: the golm metabolome database. Bioinformatics
21, 1635–1638. doi: 10.1093/bioinformatics/bti236Landon, M. B., Spong, C. Y., Thom, E., Carpenter, M. W., Ramin, S. M., Casey, B.,
et al. (2009). A multicenter, randomized trial of treatment for mild gestationaldiabetes. N. Engl. J. Med. 361, 1339–1348. doi: 10.1056/NEJMoa0902430
Li, X., Xu, Z., Lu, X., Yang, X., Yin, P., Kong, H., et al. (2009). Comprehensivetwo-dimensional gas chromatography/time-of-flight mass spectrometry formetabonomics: biomarker discovery for diabetes mellitus. Anal. Chim. Acta
633, 257–262. doi: 10.1016/j.aca.2008.11.058Li, Y., Hadden, C., Singh, P., Mercado, C. P., Murphy, P., Dajani, N. K., et al.
(2014). GDM-associated insulin deficiency hinders the dissociation of SERTfrom ERp44 and down-regulates placental 5-HT uptake. Proc. Natl. Acad. Sci.U.S.A. 111, E5697–E5705. doi: 10.1073/pnas.1416675112
Mari, A., Lyon, D., Fragner, L., Montoro, P., Piacente, S., Wienkoop, S., et al.(2013). Phytochemical composition of Potentilla anserina L. analyzed byan integrative GC-MS and LC-MS metabolomics platform. Metabolomics 9,599–607. doi: 10.1007/s11306-012-0473-x
McCabe, C. F., and Perng,W. (2017).Metabolomics of diabetes in pregnancy.Curr.Diab. Rep. 17:57. doi: 10.1007/s11892-017-0890-3
Moriarty, M., Lee, A., O’Connell, B., Kelleher, A., Keeley, H., and Furey, A.(2011). Development of an LC-MS/MS method for the analysis of serotoninand related compounds in urine and the identification of a potential biomarkerfor attention deficit hyperactivity/hyperkinetic disorder. Anal. Bioanal. Chem.
401, 2481–2493. doi: 10.1007/s00216-011-5322-7Nägele, T., Mair, A., Sun, X., Fragner, L., Teige, M., and Weckwerth, W. (2014).
Solving the differential biochemical Jacobian from metabolomics covariancedata. PLoS ONE 9:e92299. doi: 10.1371/journal.pone.0092299
Nahum Sacks, K., Friger, M., Shoham-Vardi, I., Abokaf, H., Spiegel, E., Sergienko,R., et al. (2016). Prenatal exposure to gestational diabetes mellitus as anindependent risk factor for long-term neuropsychiatric morbidity of theoffspring. Am. J. Obstet. Gynecol. 215, 380.e1-7. doi: 10.1016/j.ajog.2016.03.030
Pinto, J., Almeida, L. M., Martins, A. S., Duarte, D., Barros, A. S.,Gahano, E., et al. (2015). Prediction of gestational diabetes throughNMR metabolomics of maternal blood. J. Proteome Res. 14, 2696–2706.doi: 10.1021/acs.jproteome.5b00260
Prezelj, N., Covington, E., Roitsch, T., Gruden, K., Fragner, L., Weckwerth, W.,et al. (2016). Metabolic Consequences of Infection of Grapevine (Vitis viniferaL.) cv. “Modra frankinja” with Flavescence Doree Phytoplasma. Front. Plant Sci.7:711. doi: 10.3389/fpls.2016.00711
Rosta, K., Al-Aissa, Z., Hadarits, O., Harreiter, J., Nadasdi, A., Kelemen, F., et al.(2017). Association Study with 77 SNPs Confirms the Robust Role for thers10830963/G of MTNR1B Variant and Identifies Two Novel Associationsin Gestational Diabetes Mellitus Development. PLoS ONE 12:e0169781.doi: 10.1371/journal.pone.0169781
Sano, M., Ferchaud-Roucher, V., Kaeffer, B., Poupeau, G., Castellano, B., andDarmaun, D. (2016). Maternal and fetal tryptophan metabolism in gestatingrats: effects of intrauterine growth restriction. Amino Acids 48, 281–290.doi: 10.1007/s00726-015-2072-4
Silverman, B. L., Metzger, B. E., Cho, N. H., and Loeb, C. A. (1995). Impairedglucose tolerance in adolescent offspring of diabetic mothers. Relationship tofetal hyperinsulinism. Diab. Care 18, 611–617. doi: 10.2337/diacare.18.5.611
Simmons, D., Devlieger, R., van Assche, A., Jans, G., Galjaard, S., Corcoy,R., et al. (2016). Effect of physical activity and/or healthy eating on GDMrisk: the DALI Lifestyle Study. J. Clin. Endocrinol. Metab. 102, 903–913.doi: 10.1210/jc.2016-3455
Stein, S. E. (1999). An integrated method for spectrum extraction and compoundidentification from gas chromatography/mass spectrometry data. J. Am. Soc.
Mass Spectrometry 10, 770–781. doi: 10.1016/S1044-0305(99)00047-1Steuer, R., Kurths, J., Fiehn, O., and Weckwerth, W. (2003). Observing
and interpreting correlations in metabolomic networks. Bioinformatics 19,1019–1026. doi: 10.1093/bioinformatics/btg120
St-Pierre, J., Laurent, L., King, S., and Vaillancourt, C. (2016). Effects of prenatalmaternal stress on serotonin and fetal development. Placenta 48(Suppl. 1),S66–S71. doi: 10.1016/j.placenta.2015.11.013
Sumner, L. W., Amberg, A., Barrett, D., Beale, M. H., Beger, R., Daykin, C. A.,et al. (2007). Proposed minimum reporting standards for chemical analysis.Metabolomics 3, 211–221. doi: 10.1007/s11306-007-0082-2
Sun, X., and Weckwerth, W. (2012). COVAIN: a toolbox for uni- and multivariatestatistics, time-series and correlation network analysis and inverse estimationof the differential Jacobian from metabolomics covariance data. Metabolomics
8, 81–93. doi: 10.1007/s11306-012-0399-3Tobias, D. K., Hu, F. B., Forman, J. P., Chavarro, J., and Zhang, C. (2011). Increased
risk of hypertension after gestational diabetes mellitus: findings from a largeprospective cohort study. Diab. Care 34, 1582–1584. doi: 10.2337/dc11-0268
Weckwerth, W. (2003). Metabolomics in systems biology. Annu. Rev. Plant Biol.54, 669–689. doi: 10.1146/annurev.arplant.54.031902.135014
Weckwerth, W. (2011). Unpredictability of metabolism–the key roleof metabolomics science in combination with next-generationgenome sequencing. Anal. Bioanal. Chem. 400, 1967–1978.doi: 10.1007/s00216-011-4948-9
Weckwerth, W., and Morgenthal, K. (2005). Metabolomics: from patternrecognition to biological interpretation. Drug Discov. Tod. 10, 1551–1558.doi: 10.1016/S1359-6446(05)03609-3
Weckwerth, W., Loureiro, M. E., Wenzel, K., and Fiehn, O. (2004a). Differentialmetabolic networks unravel the effects of silent plant phenotypes. Proc. Natl.Acad. Sci. U.S.A. 101, 7809–7814. doi: 10.1073/pnas.0303415101
Weckwerth, W., Wenzel, K., and Fiehn, O. (2004b). Process for the integratedextraction, identification and quantification of metabolites, proteins andRNA to reveal their co-regulation in biochemical networks. Proteomics 4,78–83. doi: 10.1002/pmic.200200500
Wishart, D. S., Jewison, T., Guo, A. C., Wilson, M., Knox, C., Liu, Y., et al. (2013).HMDB 3.0–The human metabolome database in 2013. Nucleic Acids Res. 41,D801–D807. doi: 10.1093/nar/gks1065
Witkop, C. T., Neale, D., Wilson, L. M., Bass, E. B., and Nicholson, W. K.(2009). Active compared with expectant delivery management in womenwith gestational diabetes: a systematic review. Obstet. Gynecol. 113, 206–217.doi: 10.1097/AOG.0b013e31818db36f
Wu, H. H., Choi, S., and Levitt, P. (2016). Differential patterning of genes involvedin serotoninmetabolism and transport in extra-embryonic tissues of themouse.Placenta 42, 74–83. doi: 10.1016/j.placenta.2016.03.013
Xiang, A. H., Wang, X., Martinez, M. P., Walthall, J. C., Curry, E. S., Page, K., et al.(2015). Association of maternal diabetes with autism in offspring. JAMA 313,1425–1434. doi: 10.1001/jama.2015.2707
Xiong, X., Saunders, L. D., Wang, F. L., and Demianczuk, N. N. (2001). Gestationaldiabetes mellitus: prevalence, risk factors, maternal and infant outcomes. Int. J.Gynaecol. Obstet. 75, 221–228. doi: 10.1016/S0020-7292(01)00496-9
Yogev, Y., Metzger, B. E., and Hod, M. (2009). Establishing diagnosis of gestationaldiabetes mellitus: impact of the hyperglycemia and adverse pregnancy outcomestudy. Sem. Fetal Neonatal Med. 14, 94–100. doi: 10.1016/j.siny.2009.01.001
Zhang, S., Nagana Gowda, G. A., Asiago, V., Shanaiah, N., Barbas, C., and Raftery,D. (2008). Correlative and quantitative 1H NMR-based metabolomics revealsspecific metabolic pathway disturbances in diabetic rats. Anal. Biochem. 383,76–84. doi: 10.1016/j.ab.2008.07.041
Zhao, C., Mao, J., Ai, J., Shenwu, M., Shi, T., Zhang, D., et al. (2013). Integratedlipidomics and transcriptomic analysis of peripheral blood reveals significantlyenriched pathways in type 2 diabetes mellitus. BMC Med. Genomics 6(Suppl.1):S12. doi: 10.1186/1755-8794-6-S1-S12
Zhu, Y., and Zhang, C. (2016). Prevalence of gestational diabetes and risk ofprogression to Type 2 diabetes: a global perspective. Curr. Diab. Rep. 16:7.doi: 10.1007/s11892-015-0699-x
Conflict of Interest Statement: The authors declare that the research wasconducted in the absence of any commercial or financial relationships that couldbe construed as a potential conflict of interest.
Copyright © 2017 Leitner, Fragner, Danner, Holeschofsky, Leitner, Tischler, Doerfler,
Bachmann, Sun, Jaeger, Kautzky-Willer and Weckwerth. This is an open-access
article distributed under the terms of the Creative Commons Attribution License (CC
BY). The use, distribution or reproduction in other forums is permitted, provided the
original author(s) or licensor are credited and that the original publication in this
journal is cited, in accordance with accepted academic practice. No use, distribution
or reproduction is permitted which does not comply with these terms.
Frontiers in Molecular Biosciences | www.frontiersin.org 13 December 2017 | Volume 4 | Article 84