combined use of sequence similarity and codon bias for coding
TRANSCRIPT

February 21, 1996 page 1
Combined Use of Sequence Similarity and Codon Bias for Coding Region Identification
David J. States* and Warren Gish
†
*Institute for Biomedical ComputingWashington University
and
†
National Center for Biotechnology InformationNational Library of Medicine
Running title: Combined use of codon bias and sequence similarity information
Keywords: database search algorithms, sequence errors, codon utilization
* To whom correspondence should be addressed
David J. StatesInstitute for Biomedical ComputingWashington University700 S. Euclid Ave.St. Louis, MO 63108

February 21, 1996 page 2
Summary
A computer program called BLASTX was previously shown to be effective in identifying and
assigning putative function to likely protein coding regions by detecting significant similarity
between a conceptually translated nucleotide query sequence and members of a protein sequence
database. We present and assess the sensitivity of a new option to this software tool, herein called
BLASTC, which employs information obtained from biases in codon utilization, along with the
information obtained from sequence similarity. A rationale for combining these diverse
information sources was derived, and analyses of the information available from codon utilization
in several species was performed with wide variation seen. Codon bias information was found on
average to improve the sensitivity of detection of short coding regions of human origin by about a
factor of five. The implications of combining information sources on the interpretation of positive
findings are discussed.
February 21, 1996 page 3
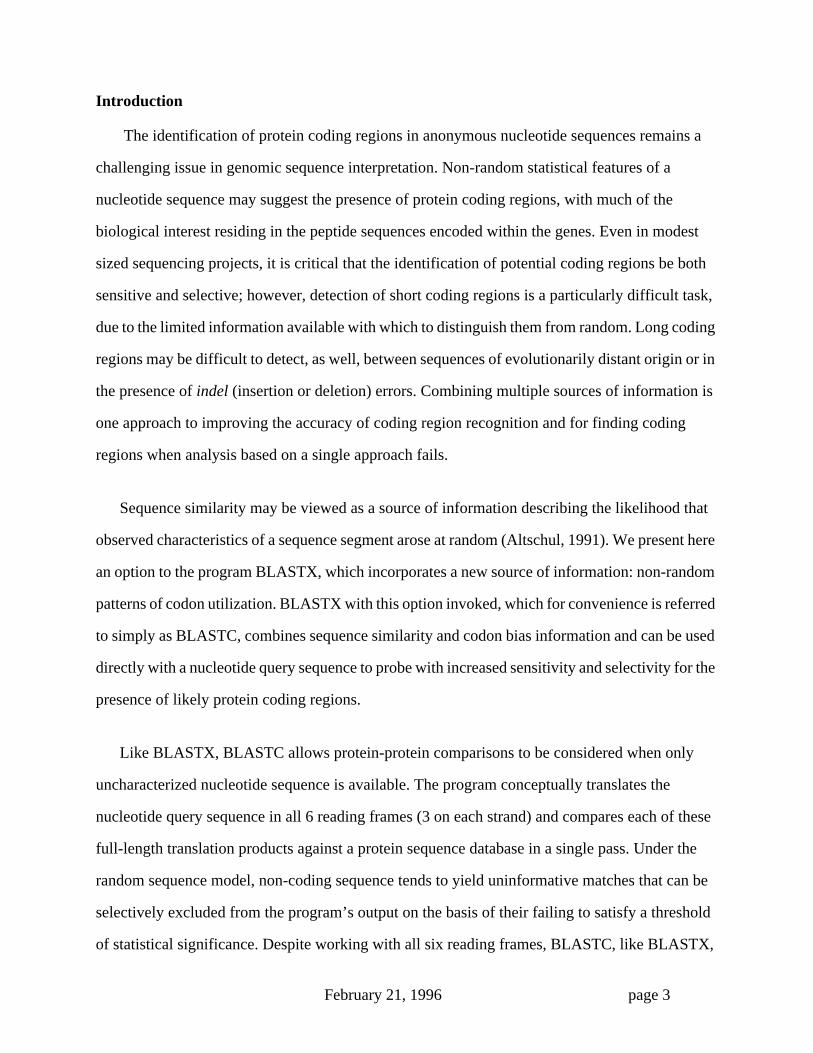
Introduction
The identification of protein coding regions in anonymous nucleotide sequences remains a
challenging issue in genomic sequence interpretation. Non-random statistical features of a
nucleotide sequence may suggest the presence of protein coding regions, with much of the
biological interest residing in the peptide sequences encoded within the genes. Even in modest
sized sequencing projects, it is critical that the identification of potential coding regions be both
sensitive and selective; however, detection of short coding regions is a particularly difficult task,
due to the limited information available with which to distinguish them from random. Long coding
regions may be difficult to detect, as well, between sequences of evolutionarily distant origin or in
the presence of
indel
(insertion or deletion) errors. Combining multiple sources of information is
one approach to improving the accuracy of coding region recognition and for finding coding
regions when analysis based on a single approach fails.
Sequence similarity may be viewed as a source of information describing the likelihood that
observed characteristics of a sequence segment arose at random (Altschul, 1991). We present here
an option to the program BLASTX, which incorporates a new source of information: non-random
patterns of codon utilization. BLASTX with this option invoked, which for convenience is referred
to simply as BLASTC, combines sequence similarity and codon bias information and can be used
directly with a nucleotide query sequence to probe with increased sensitivity and selectivity for the
presence of likely protein coding regions.
Like BLASTX, BLASTC allows protein-protein comparisons to be considered when only
uncharacterized nucleotide sequence is available. The program conceptually translates the
nucleotide query sequence in all 6 reading frames (3 on each strand) and compares each of these
full-length translation products against a protein sequence database in a single pass. Under the
random sequence model, non-coding sequence tends to yield uninformative matches that can be
selectively excluded from the program’s output on the basis of their failing to satisfy a threshold
of statistical significance. Despite working with all six reading frames, BLASTC, like BLASTX,

February 21, 1996 page 4
is capable of recognizing sequence similarity in the presence of data errors at rates that are typical
for raw molecular sequence data.
Although biases in codon utilization alone are insufficiently informative to establish reading
frames with high confidence in genomic sequence, they are decidedly non-random (Fickett, 1982;
Staden and McLachlan, 1982; Staden, 1990). Their non-random nature can be exploited in concert
with a standard BLASTX database similarity search to improve the sensitivity of coding region
recognition. In this supplemental capacity, codon utilization may assist not only in the recognition
of the correct reading frame, but may also help delineate the extent or end-points of any putative
coding region thus defined.

February 21, 1996 page 5
Methods
The BLAST algorithm approximates a well defined measure of local sequence similarity based
on a matrix of similarity or substitution scores for all possible pairs of residues (Altschul
et al
.,
1990). By default, the PAM120 matrix for amino acid similarities is used (Dayhoff
et al
., 1978;
Altschul, 1991), wherein identities and conservative replacements receive positive scores, and
non-conservative replacements,
e.g.
, leucine for aspartic acid, receive negative scores. The
algorithm identifies ungapped aligned segment pairs with locally maximum scores which meet or
exceed a parametrized cutoff value, referred to as “high-scoring segment pairs” (HSPs). The
highest scoring segment pair involving two given sequences is their maximal segment pair (MSP).
BLASTC is a program based on this rapid, probabilistic algorithm which finds statistically
significant HSPs between a translated nucleotide sequence query and a target peptide sequence
database. The analysis of Karlin and Altschul (1990) is used to estimate the probability that a
random alignment will score as well as the observed alignment, providing an estimate of the
statistical significance for the match.
Like BLASTX, no prior knowledge of the reading frame or direction is assumed by BLASTC.
All possible reading frames in both orientations of the query sequence are translated using a genetic
code; but whereas BLASTX translates into conceptual sequences for each frame using a 20+ letter
amino acid code, BLASTC translates into conceptual sequences using a 64 letter codon code, with
each letter of the 64 letter codon code being easily represented in a single 8-bit byte. A standard
BLAST neighborhood word list (Altschul
et al
., 1990) is then generated from the codon
sequences.The PAM (point accepted mutation) amino acid substitution formalism (Dayhoff
et al
.,
1978) is used by default for scoring similarity between peptide sequences, but alternative scoring
systems such as the BLOSUM matrices (Henikoff and Henikoff, 1992) can be easily selected via
a command line option. To obtain the alignment score of a codon vs. an amino acid, BLASTC
looks up the substitution score of the amino acid encoded by the codon vs. the amino acid.
A list of genetic codes is integral to the programs and non-standard codes may be selected with

February 21, 1996 page 6
a command line option. The currently supported genetic codes include:
0. Standard (default)
1. Vertebrate Mitochondrial
2. Yeast Mitochondrial
3. Mold Mitochondrial and Mycoplasma
4. Invertebrate Mitochondrial
5. Ciliate Macronuclear
6. Protozoan Mitochondrial
7. Plant Mitochondrial
8. Echinodermate Mitochondrial
Stop codons were not explicitly included in the development of the PAM or BLOSUM
theoretical framework. We have chosen to score alignments between amino acids and stop codons
as being equivalent to the least favorable pairing of any two amino acids in the matrix. These score
values are, however, readily accessible to the user as a column in the score matrix file read by the
program. Alignments incorporating a stop codon may be effectively forbidden by applying a large
negative penalty to any such alignment, or scores may be based on the odds that the stop codon
resulted from a data error.
BLASTC uses knowledge of biases in codon frequency in the scoring of alignments. Equation
1 describes the calculation of the score that a codon, xyz, in a segment of alignment codes for
an amino acid and that amino acid is similar to an amino acid in the target sequence. This is
calculated as a composite of the log of the odds of a codon’s utilization rate among the family of
synonymous of codons translating to the same amino acid added to the log odds score for aligning
the translated amino acid, , with the target amino acid.
S
aaxyz

February 21, 1996 page 7
(EQ 1)
The odds of using a codon were normalized to the average base composition of the query
sequence as is shown in Equation 2.
(EQ 2)
where is the observed frequency of codon xyz, and is the expected probability of
the codon derived as the product of its constituent nucleotide frequencies.
(EQ 3)
Equation 4 relates
E
, the expected frequency of chance occurrence of an alignment, to its
alignment score,
S
.
(EQ 4)
where
K
and
λ
are parameters dependent on the amino acid or codon composition of the query
sequence (Karlin and Altschul, 1990) and
N
is the product of the lengths of the query sequence and
the database. Typical values for
K
and
λ
are respectively about 0.2 (unitless) and 0.34 nats per unit
Sxyz->aaxOddsxyz( )log Oddsaaxyz aaX–( )log+=
Oddsxyz
Fxyz
Fcc->aaxyz
∑-----------------------
Pxyz
Pcc->aaxyz
∑-----------------------
-----------------------=
Fxyz Pxyz
Pxyz FxFyFz=
E NKe λS–=

February 21, 1996 page 8
score when using the PAM120 matrix scaled to 0.5 bits. A nat is a measure of information using a
natural log, or log
e
, scale, with one nat being roughly equal to 1.4 bits.
In a true coding region, one reading frame will tend to exhibit a strongly biased codon
utilization and predicted amino acid composition typical of biologically occurring proteins, while
the other reading frames exhibit anomalous amino acid and codon frequencies (Fickett, 1982;
Staden and McLachlan, 1982; Staden, 1990). The calculation of
λ
and
K
values specific to each of
the 6 reading frames is performed by BLASTX. When codon biases are used in BLASTC,
however, the nucleotide composition of an idealized query sequence has already been accounted
for in the preparation of the codon bias tables; the use of uniform values of
λ
and
K
for the 3 reading
frames on each strand is, therefore, appropriate. If frame-specific values of
λ
and
K
were used
instead by BLASTC, the tendency of the correct reading frame to exhibit the expected codon usage
would yield a lower value for its
λ
, thus offsetting the effect of the higher score expected from
using codon bias information.
The calculation of parameter
K
in Equation 4 requires iterating a summation over all possible
score combinations (Karlin and Altschul, 1990). This presents a trade-off between the precision
with which scores are calculated and the computer time required to setup for the assessment of
statistical significance of alignment scores. We have chosen to specify both the PAM matrices and
the codon bias tables in tenth-bit units, and find this to be a reasonable compromise.
Only those sequence segment pairs whose scores meet or exceed a cutoff score, S, are reported
to the user. Rather than choose a value for S explicitly, users often find it more natural to specify
a maximum expected frequency of chance occurrence, E, for HSPs to be reported by the program.
From a specified value of E, BLASTC calculates the appropriate value for S, using the length and
codon composition of the query sequence, the length of the database, and the particular scoring
matrix to be employed. A fixed set of amino acid frequencies characteristic of general protein
databases is used in these calculations (Altschul
et al
., 1990).

February 21, 1996 page 9
Codon utilization is species- and, in higher eukaryotes, isochore-specific (Bernardi
et al
.,
1988). Since the origin of the query sequence is generally known, an appropriate table of codon
biases can be selected prior to the database search. Individual tables have been calculated for
human coding sequences with G+C compositions in the ranges 35-45%, 45-55%, 55-65%, and 65-
75%, and for the model organisms
E. coli
and
S. cerevisiae
. A program to calculate tables based
on observed codon use in a reference set of sequences is also available.
The BLAST algorithm is heuristic but has the property that any desired level of sensitivity of
MSP detection up to 100% can be obtained at the cost of increased computation time. The
algorithm is implemented in two stages, with an implicit trade-off in speed versus sensitivity being
imparted during the first. A list of consecutive, overlapping “neighborhood” words of length W is
first generated from the query sequence, using the specified scoring matrix. The neighborhood list
contains all words in the amino acid alphabet of the database which satisfy a threshold scoring
parameter, T, when aligned with all words of length W in the codon alphabet of the query sequence.
In the second stage of the implementation, database sequences are examined for occurrences of the
neighborhood words. Each of these seeds for alignment is then extended in both directions along
the diagonal until the cumulative alignment score falls off from its locally maximum value by a
parameterized quantity, X. Lowering T increases the size of the neighborhood list and
consequently decreases the search speed, but with the benefit of increased sensitivity; similarly,
raising X increases both the expected distance that each seed is extended and the execution time,
but also yields increased sensitivity (Altschul
et al
., 1990).
By lowering the neighborhood word score threshold T (or raising X), the increased sensitivity
so obtained tends to be confined to low-scoring alignments, which are often statistically
insignificant and excluded from reports on this basis. For example, MSPs with a significance of 25
bits or more are expected to occur about 30 times by mere chance in a BLASTC search with a 300
nucleotide query sequence against a protein sequence database totalling 10 million amino acids in
length. Under these conditions, 25 bits is statistically insignificant. Using the default BLASTC

February 21, 1996 page 10
parameter values (W = 3, T =6-1/2 bits, X = 10 bits, and the PAM120 matrix), the predicted
frequency of detection of MSPs as low as 25 bits (score 50) is about 97% (Altschul
et al.
, 1990).
This is lower than the sensitivity obtained by default with BLASTP (nearly a 100% rate of
detection for alignments scoring this low), due to BLASTP’s use of a lower default value of about
5 bits for T. Decreased sensitivity for BLASTC and BLASTX was chosen as the default in
exchange for increased search speed, due to the typical presence of at least 5 reading frames of
noncoding sequence in each query and the frequent desire in production-scale sequencing projects
to observe only those matches which are decidedly significant statistically. In this regard, for
alignments of 35 bits significance (score 70), the rate of detection by BLASTX or BLASTC using
their default parameters is nearly 100% (Altschul
et al.
, 1990).

February 21, 1996 page 11
Results and Discussion
The inference that a sequence may function as a protein coding region may be based on several
statistical characteristics including the absence of stop codons, codon utilization frequencies
similar to those observed in other genes from the same organism or isochore (Fickett, 1982; Staden
and McLachlan, 1982; Staden, 1990), or similarity of the conceptually translated protein with
known protein sequences (Gish and States, 1993). To optimize the ability of BLASTX to recognize
potential coding regions, we have combined two of these features, sequence similarity and codon
bias, to yield BLASTC. The absence of stop codons in a reading frame is a function of the
frameshift error rate. Since the ability to work with error prone sequence was a design goal for
BLASTC, we have not explicitly included open reading frame analysis in the present
implementation. Alignments containing stop codons may be easily excluded from program output,
however, by modifying the score matrix to apply a sufficiently large penalty (negative score) for
aligning a stop codon with any amino acid. Even in the matrices employed here, though, stop
codons were heavily penalized.
To combine codon utilization biases with sequence similarity scores, the overall score was
calculated as the sum of the log-odds for using the observed codon and the log-odds of substituting
the target amino acid for the translated amino acid from the query. These scores are therefore based
on the pairing of a codon with an amino acid. A table for all possible pairings was computed by
adding the log-odds of codon utilization (read from one file) with the log-odds for substituting
amino acids (read from a separate file). This approach permits standard amino acid substitution
matrices to be maintained separately and used with codon bias information that may be species- or
system-specific.
As sequences diverge evolutionarily, the information that may be derived from sequence
alignment declines. Under the PAM model, after 250 substitution events per 100 amino acids, only
0.36 bits of information per alignment position are expected to remain (Altschul, 1991). The
information, in bits, present in codon biases is shown in Equation 5.I

February 21, 1996 page 12
(EQ 5)
where is the frequency of a given amino acid and is the frequency of codon
c
among
the synonymous codons translating to that amino acid. Based on this formula, the information
content encoded in codon bias was 0.17 bits per codon averaged over all of the human coding
regions in GenBank release 75.0, and varied from 0.12 bits per codon for human coding sequences
expressed at low levels to as much as a bit per codon for
S. cerevisiae
coding regions expressed at
high levels (data from Sharp
et al.,
1988). The use of codon bias may, therefore, contribute a
significant source of information to recognize coding sequences which is independent of, and
therefore additive to, that obtained by sequence similarity. The use of these two sources of
information in concert is philosophically consistent, in that both measures are derived from known
coding sequences.
The contribution that codon bias information is expected to make to an alignment score can be
assessed from an information theoretic perspective (Altschul, 1991). Figure 1 shows the lengths
expected for aligned segments achieving significance levels of 35 bits and 45 bits over a wide range
of mutational distances, with and without the inclusion of codon bias information. Using a PAM
substitution matrix alone, the expected information contributed per aligned pair of amino acids is
0.98 bits at 120 PAMs divergence and 0.36 bits at 250 PAMs divergence (Altschul, 1991). Thus,
the length of a 35-bit alignment at 120 PAMs divergence is expected to be about 35 amino acids,
or about 97 amino acids at 250 PAMs divergence; and a 45-bit alignment has an expected length
of about 44 amino acids at 120 PAMs divergence or 125 amino acids at 250 PAMs divergence. By
including codon bias information with an expected contribution of 0.12 bits per codon, aligned
segments achieving any desired level of significance will on average be 0.12/0.98 = 12% shorter
at 120 PAMs divergence and 0.12/0.36 = 33% shorter at 250 PAMs divergence. This shortening
of the expected length provides significantly increased search sensitivity, particularly in the
I Faa
Fc Fclog
2log--------------------
synonomouscodons∑
aminoacids∑=
Faa Fc

February 21, 1996 page 13
presence of frameshift mutations and indel sequencing errors by reducing the impact of their
disruptive effects on segmental alignments. The potential benefit is greater for detecting more
distant homologs, since the frameshift mutation rate tends to increase with evolutionary distance
(Gonnet
et al
., 1992), as does the alignment length expected at any level of significance.
When similarity scores and codon bias information are combined in a search, the findings are
not simply sequence alignments between similar segments. Instead, the probability that is
calculated for each alignment score is the likelihood of observing by chance a segment that has
significant combined codon usage and sequence similarity components. In particular, highly
favored codons may cause an alignment to be differentially extended over or into regions having
otherwise negative similarity scores. BLASTC output represents the extent of what are most likely
to be ungapped coding regions, rather than the most similar or most substitutable segments
between the query and database sequences. And while the benefit of combining codon bias with
sequence similarity increases with mutational or evolutionary distance, codon bias is also more
likely to distinguish random alignments having no significant similarity or biological relationship
that would have been better relegated to the background. In order to minimize the appearance or
effects of such noise, it may be useful to flag or entirely exclude from BLASTC output those
alignments which would not have satisfied at least some intermediate threshold of significance
without the inclusion of codon bias information.
For vertebrates, the genome is heterogeneous, being composed of isochores several hundred
kilobases in length which differ from each other in average base composition (Bernardi
et al
.,
1985), and codon utilization frequencies very with the mean composition of the gene with codons
of high G+C content being favored in genes of high G+C content (Bernardi
et al
., 1988). This
heterogeneity may be accommodated in BLASTC by using codon bias tables derived from genes
of similar composition.
The information content of codon biases correlates with the level of gene expression and the

February 21, 1996 page 14
species of origin. Table 2 compares the information content for genes expressed at high and low
levels in several species (Sharp
et al.,
1988). For genes expressed at high level, the mean
information content derived from biases in codon utilization was 0.73 bits per codon, but for genes
expressed at low levels, the codon bias information was only 0.11 bits per codon. These results
confirm earlier findings based on more limited data collections (McLachlan
et al
., 1984). The
greatest utility for combined use of codon bias and sequence similarity search will therefore be in
recognition of highly expressed genes, independent of the species of origin. In contrast, much less
information can be obtained from codon utilization for genes expressed at low levels, even for
species with strong overall preferences in codon utilization.
In comparing codon utilization in different species, large variations in codon information
content were observed, ranging from less than 0.05 bits per codon for
Trypanosoma brucei
to more
than one bit per codon for highly expressed genes in Saccharomyces cerevisiae (data collected by
Dr. J. M. Cherry, personal communication; Sharp et al., 1988). The expected codon utilization
scores for random sequence were negatively correlated with the expected codon bias information
content of coding regions. Figure 3 compares the expected codon utilization score for coding and
random sequence for several species. The large negative scores expected for random sequences
suggests that for species with strong codon utilization preferences, codon bias scores may serve to
eliminate many false hits occurring in database searches used to identify potential protein coding
regions. Significant variation in codon utilization with G+C content was also observed, but the
information content of codon biases did not appear to be correlated with G+C composition of the
genome.
A. Validation on real data: finding short exons
To test our approach on a real problem, we examined the ability of BLASTC to identify short
exons in primate sequence by similarity search with and without the use of codon bias information.
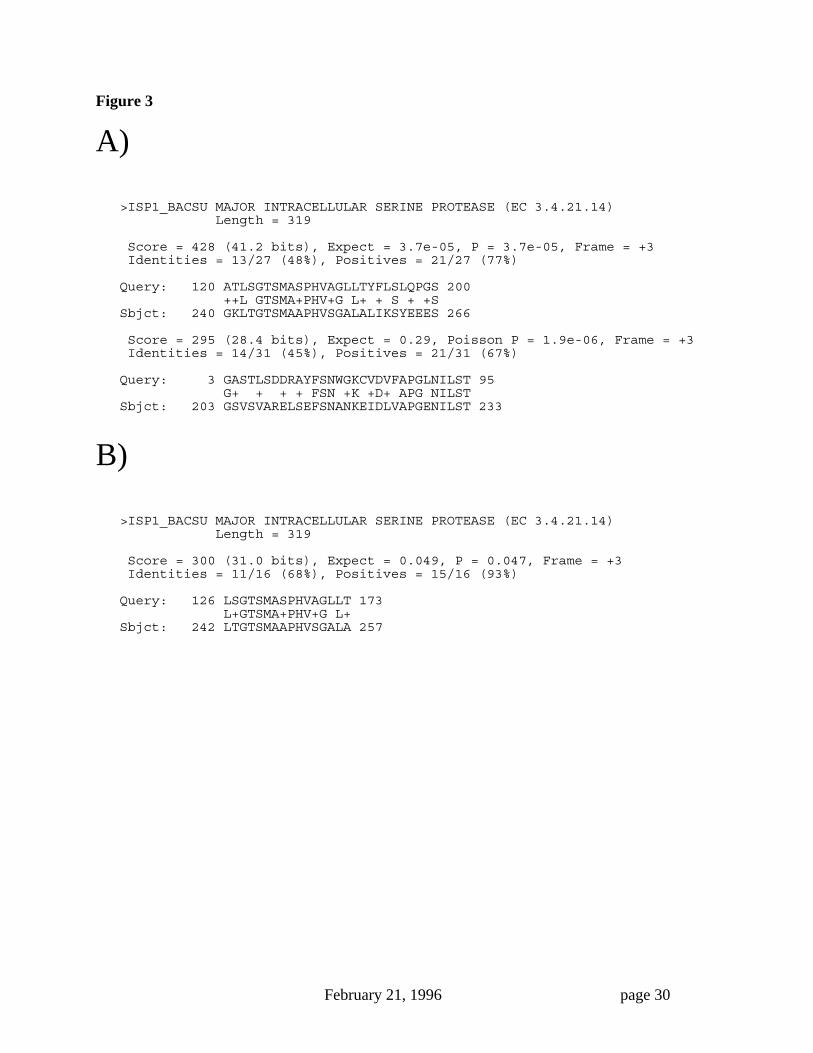
Figure 3 shows an application for the yeast Saccharomyces cerevisiae. The SWISS-PROT database
was searched using a 300 base fragment of the GenBank locus YSCPRB1, S. cerevisiae protease

February 21, 1996 page 15
B, a member of the subtilisn family of serine proteases as a query. The entire query sequence was
drawn from a coding region. The target sequence shown, ISP1_BACSU, is also a member of this
family of proteases and represents a true homolog. The figure compares the results of database
queries performed with and without use of codon bias information. Both the number and extent of
the coding region segments identified in the database search were increased by adding codon
utilization information.
Figure 4 shows the results of adding codon bias information to the problem of identifying short
coding region exons. The figure compares the scoring of alignments generated by searching the
SWISS-PROT database using BLASTC with codon information to the score of the same alignment
without the use of codon information. For query sequences which were genuine coding region
exons, the addition of codon utilization information significantly increased the significance of most
hits. In contrast, when randomly jumbled query sequences of the same length and composition
were used, adding codon bias information had no systematic effect on hit significance.
B. Caveats to the statistical model: some causes of misleading analysis
Several phenomena complicate the statistical analysis of similarity searches. These are
independent of the algorithm used to perform the search, but must be considered in viewing the
output of BLASTC. Genomes contain local regions of heavily biased composition and reduced
information content. Such regions of “low entropy” sequence may be present in a query sequence,
and a large number of high scoring alignments are frequently observed in searches where low
entropy sequences are present in the query. As is the case for BLASTP and BLASTX, local biases
in the amino acid composition are not reflected in the BLASTC random sequence model, and
erroneously high probability scores will be attached to these alignments. The biological
significance of alignments containing low entropy regions must, therefore, be suspect even though
the alignment score may be relatively high.
Repetitive sequence elements, such as Alu, are present in genomes and are particularly frequent

February 21, 1996 page 16
in higher eukaryotic genomes. It is not unusual for a query sequence to carry a segment derived
from such a repetitive element, even if the query is a cDNA. BLASTC searches performed with
such a query will identify alignments which appear statistically to be highly significant wherever
members of the same repetitive sequence family are present in the database. Comparison of search
results with and without the use codon bias information can provide one indication that a hit is an
artifact rather than true coding region, however, the utility of this approach may be limited by the
fact the some repetitive elements such as the line elements contain true protein regions.
Our results show that BLASTC is a computationally efficient tool capable of finding gene
homologs without prior knowledge of the coding regions or reading frames in a nucleic acid query
sequence. The algorithm is able to identify many related sequences even if the query sequence is
error prone, albeit at lower sensitivity. The greatest impact of query errors on search sensitivity is
expected in comparisons between distantly related proteins.
BLAST is based on the identification of local regions of similarity which are ungapped. Several
local regions of similarity may contribute to the overall score, but algorithms such as the dynamic
programming approach of Smith and Waterman (Smith and Waterman, 1981) may give increased
sensitivity when insertion and deletion errors are present. It should be noted, however, that even in
those algorithms, gap errors will be heavily penalized, and that a small number of such errors will
rapidly degrade the significance of an alignment. A rigorous theory for combining codon bias
information with information from alignments generated by dynamic programing will not be
possible without an analytic formula for the statistical significance of a gapped alignments.
Empirically combining codon bias scores with gapped alignment scores may nevertheless provide
some useful indication of coding potential.
A variety of measures for the protein coding potential of a nucleic acids sequence have been
developed, including several based on codon preferences (Staden and McLachlan, 1982; Gribskov
et al, 1984; and Kolaskar and Reddy, 1985). Hexanucleotide utilization frequencies appear to be

February 21, 1996 page 17
the strongest measure of coding potential (Fickett and Tung, 1992). We chose to implement a
codon based method because it could be integrated with an amino acid similarity based scoring
system in defining the extents of HSPs. The theoretical framework we present could also be used
to combine sequence similarity and oligomer frequency biases in assessing combined measures for
scoring likelihood.
Multiple sequence alignment (Altschul and Lipman, 1990) and profile based (Henikoff and
Henikoff, 1991) alignment techniques also may offer increased sensitivity in the identification of
very distantly related homologs by database similarity search. Codon bias information can be
combined with information from multiple sequence similarity or profile alignment in a manner that
is analogous to the approach we have used to combine it with pairwise similarity information.
Acknowledgments
We wish to thank Dr. Stephen Altschul for many hours of informative discussion.
February 21, 1996 page 18
References
Aho, A.V., Hopcroft, J. E., and Ullman, J. D. (1974). “The Design and Analysis of
Computer Algorithms”. Addison-Wesley Publishing, Reading Mass.
Altschul, S.F. (1991). Amino acid substitution matrices from an information theoretic
perspective. J. Mol. Biol. 219:555-65.
Altschul, S. F., Gish, W., Miller, W., Myers, E. W. and Lipman, D. J. (1990). Basic local
alignment search tool. J. Mol. Biol. 215:403-410.
Altschul, S. F. and Lipman, D. J. (1990). Protein database searches for multiple
alignments. Proc. Natl. Acad. Sci. U S A 87:5509-13.
Barker, W. C., George, D.G. and Hunt, L.T. (1990). Protein sequence database. Methods
Enzymol. 183:31-49.
Bernardi, G., Olofsson, B., Filipski, J., Zerial, M., Salinas, J., Cuny, G., Meunier-Rotival,
M. and Rodier, F. (1985). The mosaic genome of warm-blooded vertebrates. Science
228:953-8.
Bernardi, G., Mouchinard, D., Gautier, C. and Bernardi, G. (1988). Compositional
patterns in vertebrate genomes: conservation and change in evolution. J. Mol. Evol. 28:7-
18.
Burks, C., Cinkosky, M. J., Gilna, P., Hayden, J. E., Abe, Y., Atencio, E. J., Barnhouse, S.,
Benton, D., Buenafe, C. A. and Cumella, K. E. (1990). GenBank: current status and future
directions. Methods Enzymol. 183:3-22.
Cherry, J.M. has compiled and maintains a set of species specific codon utilization tables
available by anonymous FTP from the server amber.mgh.harvard.edu.

February 21, 1996 page 19
Dayhoff, M. O., Schwartz, R. M. and Orcutt, B. C. (1978). In M. O. Dayhoff (ed.), “Atlas
of Protein Sequence and Structure” National Biomedical Research Foundation.
Washington, D.C., Vol. 5. Suppl. 3.
Fickett, J. W. (1982). Recognition of protein coding regions in DNA sequences. Nucleic
Acids Res. 10:5303-18.
Fickett J.W., Tung, C.S. (1992) Assessment of protein coding measures. Nucleic Acids
Res 20:6441-50.
Fitch, W. M., and Smith, T. F. (1983). Optimal sequence alignments. Proc. Natl. Acad. Sci.
USA 80:1382-86.
Gish, W. and States, D. J. (1993). Identification of protein coding regions by database
similarity search. Nature Genetics 3:266-72.
Gonnet, G. H., Cohen, M. A. and Benner, S. A. (1992). Exhaustive matching of the entire
protein sequence database. Science 256:1443-45.
Gribskov, M., Devereux, J., and Burgess, R.R. (1984). The codon preference plot: graphic
analysis of protein coding sequences and prediction of gene expression. Nucleic Acids Res
12: 539-49.
Henikoff, S. and Henikoff, J.G. (1991). Automated assembly of protein blocks for
database searching. Nucleic Acids Res 19: 6565-72.
Henikoff, S. and Henikoff, J. G. (1992). Amino acid substitution matrices from protein
blocks. Proc Natl Acad Sci U S A 89: 10915-9.

February 21, 1996 page 20
Karlin, S. and Altschul, S. F. (1990). Methods for assessing the statistical significance of
molecular sequence features by using general scoring schemes. Proc. Natl. Acad. Sci.
USA 87:2264-2268.
Koide, Y., Nakamura, A., Uozumi, T. and Beppu, T. (1986). Cloning and sequencing of the
major intracellular serine protease gene of Bacillus subtilis. J Bacteriol 167:110-6.
Kolaskar, A.S., and Reddy, B.V. (1985) A method to locate protein coding sequences in
DNA of prokaryotic systems. Nucleic Acids Res 13:185-94.
Krawetz, S. A. (1989). Sequence errors described in GenBank: a means to determine the
accuracy of DNA sequence interpretation. Nucleic Acids Res 17:3951-7.
McLachlan, A.D., Staden, R., Boswell, D.R. (1984). A method for measuring the non-
random bias of a codon usage table. Nucleic Acids Res 12:9567-75
Moehle, C. M., Tizard, R., Lemmon, S. K., Smart, J. and Jones, E. W. (1987). Protease B
of the lysosome like vacuole of the yeast Saccharomyces cerevisiae is homologous to the
subtilisin family of serine proteases. Mol. Cell. Biol. 7:4390-4399.
Pearson, W. R. and Lipman, D. J. (1988). Improved tools for biological sequence
comparison. Proc Natl Acad Sci U S A 85:2444-8.
Sharp, P.M., Cowe, E., Desmond, G.H., Shields, D.C., Wolfe, K.H., and Wright, F. (1988)
Codon usage patterns in Escherichia coli, Bacillus subtilis, Saccharomyces cerevisiae,
Schizosaccharomyces pombe, Drosophila melanogaster and Homo sapiens; a review of
the considerable within-species diversity. Nucleic Acids Res 16:8207-11.
Smith, T. F. and Waterman, M. S. (1981). Identification of common molecular
subsequences. J Mol Biol 147:195-7.
February 21, 1996 page 21
Staden, R. and McLachlan, A. D. (1982). Codon preference and its use in identifying
protein coding regions in long DNA sequences. Nucleic Acids Res 10:141-56.
Staden, R. (1990). Finding protein coding regions in genomic sequences. Methods
Enzymol 183:163-80.
States, D. J. and Botstein, D. (1991). Molecular sequence accuracy and the analysis of
protein coding regions. Proc. Natl. Acad. Sci. USA 88:5518-22.
States, D. J., Gish, W. and Altschul, S. F. (1992). Improved sensitivity in nucleic acid
database searches using application-specific scoring matrices. Methods: A Compan. Meth.
Enzymol. 3:66-70.

February 21, 1996 page 22
Table 1 Codon information content
The probability and odds that a given codon was used instead of its synonymous codons was
calculated from the frequency of appearance of each codon in the human coding regions present in
GenBank release 75.0. The information contributed to an alignment by each codon is expressed as
a log-odds score in units of 0.1 bits. Similar tables were compiled for species-specific sequence
collections and for primate DNA of varying G+C content (data not shown).
Table 2 Variation in codon information with expression level
The table compares codon information content from genes expressed at high and low levels
(data from Sharp et al 1988). A uniform set of amino acid frequencies was used for all calculations
(Dayhoff et al, 1978). Data are expressed in units of 0.1 bits.

February 21, 1996 page 23
Table 1 Codon information content (human)
aa codon fcodon pcodon odds score aa codon fcodon pcodon odds scoreA GCA 0.00 0.02 0.06 -40.2 P CCA 0.03 0.36 1.35 4.3
A GCC 0.00 0.02 0.09 -35.5 P CCC 0.02 0.23 1.00 0.0
A GCG 0.01 0.40 1.71 7.7 P CCG 0.02 0.17 0.75 -4.1
A GCT 0.02 0.57 2.12 10.8 P CCT 0.02 0.23 0.87 -2.1
C TGC 0.01 0.24 0.52 -9.4 Q CAA 0.01 0.52 0.98 -0.3
C TGT 0.02 0.76 1.42 5.0 Q CAG 0.01 0.48 1.03 0.4
D GAC 0.00 0.12 0.25 -20.1 R AGA 0.03 0.28 1.44 5.3
D GAT 0.01 0.88 1.65 7.2 R AGG 0.01 0.09 0.56 -8.5
E GAA 0.01 0.58 1.09 1.2 R CGA 0.02 0.21 1.21 2.7
E GAG 0.01 0.42 0.90 -1.5 R CGC 0.01 0.06 0.41 -12.9
F TTC 0.02 0.44 0.95 -0.8 R CGG 0.01 0.14 0.94 -0.9
F TTT 0.02 0.56 1.05 0.7 R CGT 0.02 0.22 1.29 3.7
G GGA 0.01 0.21 0.77 -3.8 S AGC 0.01 0.07 0.43 -12.2
G GGC 0.01 0.11 0.46 -11.2 S AGT 0.02 0.17 0.97 -0.4
G GGG 0.01 0.29 1.23 3.0 S TCA 0.03 0.37 2.06 10.4
G GGT 0.02 0.40 1.50 5.8 S TCC 0.01 0.13 0.84 -2.6
H CAC 0.01 0.36 0.77 -3.8 S TCG 0.01 0.10 0.65 -6.1
H CAT 0.02 0.64 1.20 2.6 S TCT 0.01 0.16 0.90 -1.5
I ATA 0.01 0.14 0.41 -12.9 T ACA 0.04 0.34 1.28 3.6
I ATC 0.01 0.29 0.97 -0.5 T ACC 0.03 0.23 0.98 -0.3
I ATT 0.03 0.56 1.62 6.9 T ACG 0.02 0.18 0.79 -3.4
K AAA 0.02 0.60 1.12 1.7 T ACT 0.03 0.25 0.92 -1.3
K AAG 0.01 0.40 0.86 -2.2 V GTA 0.00 0.09 0.35 -15.1
L CTA 0.01 0.09 0.51 -9.9 V GTC 0.01 0.23 1.00 -0.1
L CTC 0.02 0.19 1.26 3.3 V GTG 0.01 0.29 1.27 3.4
L CTG 0.01 0.16 1.09 1.3 V GTT 0.02 0.38 1.42 5.1
L CTT 0.02 0.27 1.60 6.8 W TGG 0.01 1.00 1.00 0.0
L TTA 0.01 0.09 0.44 -11.9 Y TAC 0.01 0.34 0.73 -4.5
L TTG 0.02 0.21 1.23 3.0 Y TAT 0.01 0.66 1.23 3.0
M ATG 0.02 1.00 1.00 0.0 * TAA 0.01 0.20 0.53 -9.0
N AAC 0.02 0.42 0.90 -1.6 * TAG 0.00 0.08 0.26 -19.3
N AAT 0.02 0.58 1.09 1.2 * TGA 0.04 0.72 2.27 11.9

February 21, 1996 page 24
Table 2 Variations in codon information with expression level
OrganismHighly
expressedLow level expression
E. coli 7.65 0.92
B. subtilis 5.85 1.00
S. cerevisiae 10.67 0.73
S. pombe 7.65 1.88
D. melanogaster 6.93 0.80
human 4.99 1.21

February 21, 1996 page 25
Figure 1. Segment length expected to achieve significance
Over a range of mutational distances, the expected length (in nucleotides) was calculated for a
segment achieving marginal (35 bits) and high (45 bits) significance using sequence similarity
information alone (dashed lines) and using sequence similarity plus codon utilization (solid lines),
assuming 0.17 bits/codon of information from codon utilization (the value calculated for all human
coding sequence from GenBank release 75.0). A significance level of 35 bits for an alignment
score corresponds to an overall frequency of chance occurrence of about 0.05 in a complete
BLASTC search of a 10 million amino acid-long database, using a 400 nucleotide-long query
sequence. 45 bits implies about a 1-in-50,000 chance of occurrence under the same conditions.
Plotted along the abscissa is the number of amino acid PAMs divergence between the query
segment and the most similar homologous sequence in the target database. In the calculation,
alignments were scored with the PAM matrix corresponding to the PAM distance between the
homologs, which therefore reflects conditions of optimal scoring and maximum sensitivity under
this model (Altschul, 1991).
Figure 2. Species-specific variations in codon biases
The figure shows the codon bias information content for coding and non-coding regions
sequences as a function of the species of origin. Shown in A) are the expected scores for random
sequences as a function of the expected codon information scores for protein coding sequences.
Shown in B) are the difference in codon bias scores between coding and non-coding regions as a
function of the expected score in coding regions. The information content is expressed in units of
tenths of a bit per codon. Key to abbreviations: alg = green algae; asn = Aspergillus nidulans; ath
= Arabidopsis thaliana; bly = Hordeum vulgare (Barley); bmo = Bombyx mori (Silk Moth); bov =
Bos taurus (Cow;) bsu = Bacillus subtilis; cel = Caenorhabditis elegans; chi = Chironomus sp.;
chk = Gallus sp. (Chicken;) ddi = Dictyostelium discoideum; dro = Drosophila melanogaster; eco
= Escherichia coli; ham = Cricetulus sp. & Mesocricetus sp. (Hamster); hum = Homo sapiens; kpn
= Klebsiella pneumoniae; mac = Macaca sp.; mus = Mus sp. (Mouse); mze = Zea mays (Maize);
mzecp = Zea mays chloroplast (Maize); neu = Neurospora crassa; ngo = Neisseria gonorrheae;

February 21, 1996 page 26
pea = Pisum sativum (Pea;) pet = Petunia sp.; pfa = Plasmodium falciparum; phv = Phaseolus
vulgaris (Lima bean); pot = Solanum tuberosum (Potatoe); pse = Pseudomonas sp.;. rab =
Oryctolagus sp. (Rabbit); rat = Rattus sp. (Rat); rhm = Rhizobium meliloti; ric = Oryza sativa
(Rice); shp = Ovis sp. (Sheep); slm = Physarum polycephalum; soy = Glycine max (Soybean); sta
= Staphylococcus aureus; sty = Salmonella thphimurium; sus = Strongylocentrotus purpuratus; tet
Tetrahymena thermophila; tob = Nicotiana tabacum (Tobacco); tobcp = Nicotiana tabacum
chloroplast (Tobacco); tom = Lycopersicon esculentum (Tomato); trb = Trypanosoma brucei; wht
= Triticum aestivum (Wheat); xel = Xenopus laevis; ysc = Saccharomyces cerevisiae; yscmt =
Saccharomyces cerevisiae mitochondrion; ysp = Schizosaccharomyces pombe. Codon
composition data was collected by Dr. J. M. Cherry (personal communication).
Figure 3. Effect of incorporating codon bias information in a database search
The figure compares the results of database queries performed with and without use of codon
bias information. The SWISS-PROT database was searched using a 300 nucleotide fragment of the
GenBank locus YSCPRB1 (accession M18097), S. cerevisiae protease B, a member of the
subtilisn family of serine proteases as a query. A) an alignment detected by a BLASTC search with
codon utilization information included. B) the alignment detected for the same pair of sequences
by BLASTX using amino acid similarity alone. The target sequence, ISP1_BACSU (accession
P11018), is also a member of this family of proteases and represents a true homolog.
Figure 4. Effect of incorporating codon bias information in database search
Alignment scores generated by searching the SWISS-PROT database using codon information
(x-axis) were compared to scores of the same alignments without the use of codon information (y-
axis). Panel A shows the results of searches that produced 708 HSPs with expectations <0.5
involving exons less than 70 nucleotides in length drawn from the primate section of GenBank.
Panel B shows results for searches with 100 randomly jumbled sequences of the same length and
composition. Because scores were all rounded to tenth-bit precision, many of the data points
overlap, producing 304 distinct (x,y) points in Panel A and 80 distinct (x,y) points in Panel B. The
nucleotide composition of the query set in Panel A was 23,911 G+C and 19,932 A+T, yielding 56%

February 21, 1996 page 27
G+C; hence the human codon usage table for 60% G+C was used (Table 1).

February 21, 1996 page 28
Figure 1
0 50 100 150 200 250 3000
100
200
300
400
500
600
point accepted mutations
length

February 21, 1996 page 29
Figure 2
expected random
-6
-4
-2
algae
asnath
blybmobov
bsu
cel
chi
chk
ddi
dro
eco
hamhum
kpn
mac
mus
mzemzecp
neu
ngo
pea
petpfa
phvpot
pse
rabrat
rhm
ric
shp
slm
soy sta
sty
sus
tet
tob tobcp
tom
trb
wht
xelysc
yscmt
ysp
expected score in a coding region (0.1 bits)1 2 3 4 5
2
4
6
8
10
12
algae
asn
ath
bly
bmobov
bsu
cel
chi
chk
ddi
dro
eco
hamhum
kpn
mac
musmze
mzecpneu
ngo
pea
pet
pfa
phvpot
pse
rabrat
rhm
ric
shpslm
soy
sta
sty
sus
tet
tob tobcptom
trb
wht
xel
ysc
yscmt
ysp
sequence score (0.1 bits)
coding - randomcodon score
(0.1 bits)
A)
B)
February 21, 1996 page 30
Figure 3
A)
>ISP1_BACSU MAJOR INTRACELLULAR SERINE PROTEASE (EC 3.4.21.14) Length = 319
Score = 428 (41.2 bits), Expect = 3.7e-05, P = 3.7e-05, Frame = +3 Identities = 13/27 (48%), Positives = 21/27 (77%)
Query: 120 ATLSGTSMASPHVAGLLTYFLSLQPGS 200 ++L GTSMA+PHV+G L+ + S + +SSbjct: 240 GKLTGTSMAAPHVSGALALIKSYEEES 266
Score = 295 (28.4 bits), Expect = 0.29, Poisson P = 1.9e-06, Frame = +3 Identities = 14/31 (45%), Positives = 21/31 (67%)
Query: 3 GASTLSDDRAYFSNWGKCVDVFAPGLNILST 95 G+ + + + FSN +K +D+ APG NILSTSbjct: 203 GSVSVARELSEFSNANKEIDLVAPGENILST 233
B)
>ISP1_BACSU MAJOR INTRACELLULAR SERINE PROTEASE (EC 3.4.21.14) Length = 319
Score = 300 (31.0 bits), Expect = 0.049, P = 0.047, Frame = +3 Identities = 11/16 (68%), Positives = 15/16 (93%)
Query: 126 LSGTSMASPHVAGLLT 173 L+GTSMA+PHV+G L+Sbjct: 242 LTGTSMAAPHVSGALA 257

February 21, 1996 page 31
Figure 4
•
•
•
•
•
• •
••
•
••••
•
•
••••
•
•
•
••••••••••
•
•
•
••
•
••
••
•• •
•
•
•••
•
•
•
••
• •
•
•••
•
•
•
•••
•••
•
••
••
•
•
•••
•
••
••
•
• •• •
••
•••
••••
••
•••
•
••••••••••
•
••••••••••••••
•
•
•
•
•
•
••
••
• ••
••••••••••
••••
••
•
•
•
•••••
••
•
•
•
•
•
••
•
••••
•
•
••
••••
••• ••
•
•
•
••
••
•
•
••
•••
•
•
•
••
••
•
•
•
•
•
•
•
•
•
•
•
•••••
•••••••••••••••••••••
••••
•••••••••• ••
•
••• •••
•
•
•
•
•
••••••••••
••
••••
•••
••
••••
•
•
••
••••••
••••
• ••••
••
••
•••
••
••
•
•
•••
• •
••
••
•••
•
••••
•••
•
•• •••• •••• ••• •••
•
•
•
•
•
•
•
• ••
•
•
•
•
•
•
•••••
••
•••••
•••
•••••
•••••
•••••
•••••
•••••••
•••
•••••••
•••
••
•••
•••••
•
••••
••••
•••••
••••• •• •••••••• •• •••••••• •• ••••
••
•
••••••••••
•
••••••••••
•
••••••••
•••
••••••
•••
••••••
•••••••••
•••••
•••
•••••
••
••
•
••
•
••
••
••
•
••
•
••
••
•
•
••
•
•••
•
•
••
•
••
••
•
•
•
•
•
•
•
•
••
•
•
•
•
•
•
•
••
•
••
•
•
•••
••••••••
•
••
•••••
•••••
•
•
•
•
•••
•
•
•••••
•
•
•
•
••
•••
•
••
•
•
•
•••
••
• •
•
•
•
••
•
••
-8 -7 -6 -5 -4 -3 -2 -1-8
-7
-6
-5
-4
-3
-2
-1
with codon information
•••••••••
•••
•
••••
••••••
•••
••
••• ••
•••
•••
•• •
••
•••• •
•••
•
••
•
•
••
••••• •••••••
••
••
• ••
•••••
••••
•••••
•
•
••
••
•
•
-8 -7 -6 -5 -4 -3 -2 -1-8
-7
-6
-5
-4
-3
-2
-1
with codon information
without codon information
without codon information
A)
B)