combustion and emission analysis of a four stroke …...analysis of a four stroke ic engine using...
TRANSCRIPT

International Journal of Scientific & Engineering Research, Volume 7, Issue 3, March-2016 164 ISSN 2229-5518
IJSER © 2016 http://www.ijser.org
COMBUSTION AND EMISSION ANALYSIS OF A FOUR STROKE IC
ENGINE USING (Bio diesel produced from Kranja oil by transesterification
process) ABSTRACT: The performance, emission and combustion characteristics of a single cylinder four stroke variable compression ratio engine when fuelled with blends Karanja methyl ester 20%, 40%, 60% with diesel (on a volume basis) and Kranja oil 10%,20% with diesel(on a volume basis)are investigated and compared with diesel.The suitability of Karanja oil methyl ester as a bio fuel has been established in this study. Bio diesel produced from Kranja oil by transesterification process has been used in this study. Experiment has been conducted at a fixed engine speed of 1500 rpm, 0% load to 100% load and at a compression ratios of 16:1, 17:1 and 18:1. The impact of compression ratio on fuel consumption, combustion pressures and exhaust gas emissions has been investigated and presented. Optimum compression ratio which gives best performance has been identified. The results indicate longer ignition delay, maximum rate of pressure rise, lower heat release rate and higher mass fraction burnt at higher compression ratio for Karanja oil methyl ester when compared to that of diesel and Karanja oil. The brake thermal efficiency for Karanja oil methyl ester blends, Karanja oil and diesel has been calculated and the blend B40 is found to give maximum thermal efficiency. The blends when used as fuel results in reduction of carbon monoxide, hydrocarbon and increase in nitrogen oxides emissions.
—————————— ——————————
NOMENCLATURE
SYMBOLS DESCRIPTION
BP Brake Power BSFC Brake Specific fuel consumed
BTE Brake thermal efficiency
B20 20% bio diesel + 80% diesel
B40 40% bio diesel + 60% diesel
B0 60% bio diesel + 40% diesel
CA Crank angle
CI Compression Ignition
CO Carbon monoxide
CO2 Carbon dioxide
CR Compression Ratio
HC Hydro carbon
KOME Karanja Oil Methyl Ester
K10 10% Karanja oil+90% diesel
IJSER

International Journal of Scientific & Engineering Research, Volume 7, Issue 3, March-2016 165 ISSN 2229-5518
IJSER © 2016 http://www.ijser.org
K20 20%Karanja oil+80% diesel
ME Mechanical efficiency
NHRR Net heat release rate
NOx Nitrogen oxides
Pmax Maximum pressure
Text Exhaust temperature
Tmax Maximum temperature
VCR Variable Compression Ratio
CONTENTS
Title Page
ACKNOWLEDGEMENT........................................................................................i
ABSTRACT............................................................................................................. ii
NOMENCLATURE.................................................................................................iii
List of tables..............................................................................................................iv
List of Figures............................................................................................................v
List of Fig............................................................................................................vii
CHAPTER 1
1. INTRODUCTION …………………………...…………………………….. 1
1.1. General Background.................................................................................. 1
1.2. Energy Scenario..........................................................................................2
1.3.Biodiesel as Diesel Substitute.....................................................................2
1.4.Advantages of use of Biodiesel in diesel engine.........................................3
IJSER

International Journal of Scientific & Engineering Research, Volume 7, Issue 3, March-2016 166 ISSN 2229-5518
IJSER © 2016 http://www.ijser.org
CHAPTER 2
2. LITERATURE REVIEW.............................................................................5
2.1. Introduction...............................................................................................5
2.2. Previous Works with Alternative Fuels....................................................5
2.3. Conclusion of Literature Review..............................................................11
2.4. Scope of Present Investigation.................................................................11
2.5. Objectives...................................................................................................12
CHAPTER 3
3. EXPERIMENT
3.1Introduction
3.2 Measurement of density
3.3 Measurement of Viscosity
3.4 Acidic value calculation
3.5 Biodiesel preparation from Karanja vegetable oil
3.5.1 Mixing of alcohol and catalyst
3.5.2 Separation 3.5.3. Alcohol Removal 3.5.4. Glycerine Neutralization 3.5.5. Methyl Ester Wash 3.6 Experimental set up 3.6.1 Engine specification and its attachements.
3.6.2. Compression ratio adjustment
3.6.3 Dynamometer
3.6.4Multi gas analyser 3.6.5 Smoke meter 3.7experimental lay out 3.8 Experimental procedure 3.9 Conclusion 4. Result and Discussion 4.1 Fuel property testing at different blend and temperature.
4.1.2 Viscosity of blend of Karanja at different temperature:
4.1.3 Specific gravity of blend of bio diesel at different temperature.
IJSER

International Journal of Scientific & Engineering Research, Volume 7, Issue 3, March-2016 167 ISSN 2229-5518
IJSER © 2016 http://www.ijser.org
4.1.4 Viscosity of blend of bio diesel at different temperature:
4.2 PERFORMANCE ANALYSIS OF KARANJA OIL METHYL ESTER
4.2.1 Brake specific fuel consumption.
4.2.2 Brake thermal efficiency.
4.2.3 Mechanical efficiency
4.2.4 Exhaust gas temperature
4.3 Combustion Analysis of Karanja oil methyl ester
4.3.1 Maximum combustion pressure. 4.3.2 Combustion duration
4.3.3. Net heat release rate
4.3.4 Mass fraction burnt
4.3.5 Ignition delay
4.3.6 Maximum combustion temperature
4.4 Emission analysis
4.4.1 Carbon monoxide emission
4.4.2Carbon dioxide emission
4.4.3Hydrocarbon emission
4.4.4Nitrogen oxides emission
4.4.5Smoke opacity
4.5 PERFORMANCE ANALYSIS OF NEAT KARANJA
IJSER

International Journal of Scientific & Engineering Research, Volume 7, Issue 3, March-2016 168 ISSN 2229-5518
IJSER © 2016 http://www.ijser.org
4.5.1 Brake specific fuel consumption
4.5.2 Brake thermal efficiency
4.5.3 Mechanical efficiency
4.5.4 Exhaust gas temperature
4.6 Combustion analysis of neat Karanja
4.6.1 Combustion pressure
4.6.2 . Combustion duration
4.6.3.Net Heat release rate
4.6.4 Mass fraction burnt
4.6.5 Ignition delay
4.6.6 Maximum combustion temperature
4.7 Emission analysis of Karanja oil 4.7.1 Carbon monoxide emission
4.7.2 Carbon dioxide emission
4.7.3 Hydrocarbon emission
4.7.4 Nitrogen oxides emission
4.7.5 Smoke opacity
5. CONCLUSION:
5.1 Conclusion of Karanja oil methyl ester
5.2 Conclusion of Karanja oil
IJSER

International Journal of Scientific & Engineering Research, Volume 7, Issue 3, March-2016 169 ISSN 2229-5518
IJSER © 2016 http://www.ijser.org
REFFERENCE
List of Tables
Table 1: Hydrometer specification
Table 2: Observation table for titration step-1
Table 3 : Observation table for titration step-2
Table 4: Engine Specification.
Table 5: Measurement range and accuracy of AVL-444 gas analyser
Table-6: Measurement range and accuracy of Smoke meter
Table-7 variation of specific gravity with temperature and blend (neat karanja)
Table-8 variation of viscosity with temperature and blend (neat karanja)
Table-9 variation of specific gravity with temperature and blend (Karanja oil methyl ester)
Table-10 variation of specific gravity with temperature and blend (Karanja oil methyl ester)
IJSER

International Journal of Scientific & Engineering Research, Volume 7, Issue 3, March-2016 170 ISSN 2229-5518
IJSER © 2016 http://www.ijser.org
List of Figures
Fig.1 Oil bath and hydrometer
Fig.2 oil bath with viscometer
Fig.3 Biodiesel reactor
Fig.4 Transesterification
Fig. 5 Water washing
Fig.6 Actual Engine setup
Fig. 7 Compression ratio adjustment
Fig 8 Dynamometer
Fig.9: Exhaust Gas Analyzer
Fig 10: Smoke meter
Fig. 11 Block diagram of the Experimental Layout
Fig. 1 BSFC vs Load
Fig.2 BSFC vs CR
Fig.3 BTE vs Load
Fig.4 BTE vs CR
Fig.5 ME vs Load
Fig.6 ME vs CR
Fig.7 EGT vs Load
Fig.8 EGT vs CR
Fig.9 Combustion pressure vs Load
Fig.10 Combustion pressure vs CR
Fig 11 combustion duration vs Load
Fig 12 Combustion duration vs CR
IJSER

International Journal of Scientific & Engineering Research, Volume 7, Issue 3, March-2016 171 ISSN 2229-5518
IJSER © 2016 http://www.ijser.org
Fig 13 NHRR vs Load
Fig 14 NHRR vs CR
Fig 15 MFB vs CA
Fig.16 Ignition delay vs Load
Fig.17 Ignition delay vs CR
Fig 18 Maximum combustion temperature vs Load
Fig 19 Maximum combustion temperature vs CR
Fig 20 Mean gas temperature vs CA
Fig 21 CO vs Load
Fig 22 CO vs CR
Fig 23 CO2 vs Load
Fig 24 CO2 vs CR
Fig 25 HC vs Load
Fig 26 HC vs CR
Fig 27 NOx vs Load
Fig 28 NOx vs CR
Fig 29 Smoke oppacity vs Load
Fig 30 Smoke oppacity vs CR
Fig. 31BSFC vs Load
Fig.32BSFC vs CR
Fig.33 BTE vs Load
Fig.34 BTE vs CR
Fig.35 ME vs Load
Fig.36 ME vs CR
Fig.37 EGT vs Load
Fig.38 EGT vs CR
IJSER

International Journal of Scientific & Engineering Research, Volume 7, Issue 3, March-2016 172 ISSN 2229-5518
IJSER © 2016 http://www.ijser.org
Fig 39Combustion pressure vs Load
Fig 40 Combustion pressure vs CR
Fig 4 combustion duration vs Load
Fig 42 Combustion duration vs CR
Fig 42 NHRR vs Load
Fig 43 NHRR vs CR
Fig 44 MFB vs CA
Fig.45Ignition delay vs Load
Fig.46 Ignition delay vs CR
Fig 47Maximum combustion temperature vs Load
Fig 48 Maximum combustion temperature vs CR
Fig 49 CO vs Load
Fig 50 CO vs CR
Fig 51 CO2 vs Load
Fig 52 CO2 vs CR
Fig 53 HC vs Load
Fig 54 HC vs CR
Fig 55 NOx vs Load
Fig 56 NOx vs CR
Fig 57 Smoke opacity vs Load
Fig 58 Smoke opacity vs CR
Chapter 1
1. INTRODUCTION
IJSER

International Journal of Scientific & Engineering Research, Volume 7, Issue 3, March-2016 173 ISSN 2229-5518
IJSER © 2016 http://www.ijser.org
1.1. GENERAL BACKGROUND
The diesel engine is a major tool in the day-to-day life of modern society. It powers much of
our land and sea transport, provides electrical power, used for farming, construction and
industrial activities. The fossil fuel scarcity and pollutant emissions from diesel engines have
become two important problems of world today. One method to overcome the crisis is to find
suitable substitute for the petroleum based fuels. Bio fuels have been gaining popularity
recently as an alternative fuel for diesel engines. Bio fuels are derived from biomass, and are
renewable either through agricultural processes or biological waste generation. Bio fuels can
be used in any diesel engine, usually without any modifications. It boasts a reduction in toxic
emissions (except NOx emissions) compared to diesel fuel. In India million tonnes non edible
seeds are going in waste. Utilizing these seeds as an alternative fuel source will reduce the
consumption of conventional fuels. The overall objective is to prevent waste, increase the
value recovery of resource as bio fuel and minimize the amount of waste going for disposal.
1.2. ENERGY SCENARIO
Energy is one of the major sources for the economic development of any country. India
being a developing country requires much higher level of energy to sustain its rate of
progress. According to the International Energy Agency (IEA), hydrocarbons account for
the majority of India’s energy use. Together, coal and oil represent about two-thirds of total
energy use. Natural gas now accounts for a seven percent share, which is expected to grow
with the discovery of new gas deposits. India had approximately 5.7 billion barrels of
proven oil reserves as of January 2011, the second-largest amount in the Asia-Pacific region
after China. The combination of rising oil consumption and relatively flat production has
left India increasingly dependent on imports to meet its petroleum demand. To combat the
present energy crisis, one of the important strategies need to be adopted is to develop and
promote appropriate technology for utilizing non-traditional energy resources to satisfy
energy requirements. Hence to overcome all these problems most combustion devices are
modified to adapt gaseous fuels in dual fuel mode .
1.3. BIODIESEL AS DIESEL SUSTITUTE
For substituting the petroleum fuels used in internal combustion engines, fuels of bio-origin
provide a feasible solution to the twin crises of ‘fossil fuel depletion’ and ‘environmental
degradation’. For diesel engines, a significant research effort has been directed towards
IJSER

International Journal of Scientific & Engineering Research, Volume 7, Issue 3, March-2016 174 ISSN 2229-5518
IJSER © 2016 http://www.ijser.org
using vegetable oils and their derivatives as fuels. In India, attempts are being made for
using non-edible and under-exploited oils for production of esters. Several research
institutions are actively pursuing the utilization of non-edible oils for the production of Bio-
diesel, additives for lubricating oils, saturated and unsaturated alcohols and fatty acids and
many other value added products. Biodiesel has received a good response worldwide as an
alternative fuel to diesel. Biodiesel is a cleaner burning fuel because of its own molecular
oxygen content. Again in place of diesel, biodiesel can be substituted as the pilot fuel in the
dual fuel due to the diminishing reserves of petroleum fuels and rising awareness for
protecting our environment. Biodiesel is produced by transesterification process which
involves a chemical reaction between an alcohol and triglyceride of fatty acid in the
presence of a suitable catalyst leading to the formation of fatty acid alkyl esters (biodiesel)
and glycerol . Biodiesel’s viscosity is much closer to that of the diesel fuel than vegetable
oil. Although biodiesel has many advantages over diesel fuel, there are several problems
needs to be addressed such as its lower calorific value, higher flash point, higher viscosity,
poor cold flow properties, etc. This can lead to the poor atomization and mixture formation
with air that result in slower combustion, lower thermal efficiency and higher emissions .
To overcome such limitations of biodiesel some researchers have studied the performance
and emissions of the diesel engines with increased injection pressure. Fuel injection
pressure and fuel injection timing play a vital role in ignition delay and combustion
characteristics of the engine, as the temperature and pressure change significantly close to
TDC. The fuels properties also play a significant role to increase or decrease exhaust
pollutants . Various investigations clearly reported that cetane number (CN) affects exhaust
emissions. The CN also affects the combustion efficiency, and this ensures starting the
engine easily. However, if the CN is excessively higher than the normal value, the ignition
delay will be too short for the fuel to spread into the combustion chamber. As a result of this
unexpected condition, the engine performance will be reduced and the smoke value will
increase .
1.4. Advantages of use of biodiesel in VCR engine
As compared to diesel fuel biodiesel has the following advantages.
It is renewable since it is produced from vegetable oils or from animal tallow. So adequate
amount of biodiesel can be provided by cultivating the seeds of different vegetable oil plant.
IJSER

International Journal of Scientific & Engineering Research, Volume 7, Issue 3, March-2016 175 ISSN 2229-5518
IJSER © 2016 http://www.ijser.org
1. It is non-toxic. It does not contain sulphur and any aromatic compounds, but contains
10% to 11% oxygen.
2. The use of biodiesel reduces CO, HC and smoke emission from the engine. The
emission reduces due to the oxygen content of biodiesel.
3. It can be used CI engine by blending with diesel or it can also be directly used in the
engine without any engine modification.
4. It has a higher flash point than diesel fuel hence it is less volatile, and is safer to store
and transport the fuel.
5. It has good lubricant properties with respect to petroleum diesel.
Beside all these advantages, in current scenario biodiesel produced from vegetable oil has
higher cost as compared to diesel fuel, which can be minimised by mass production only.
In the present study, the effects of CR on the performance, combustion and emission of a
four stroke single cylinder diesel engine using alternative fuels.
Chapter 2
2. LITERATURE REVIEW
2.1 . Introduction
Several targets like reducing the exhaust emissions, reducing engine noise, reducing fuel
consumption and increasing specific outputs are the main focus for the researchers. The
characteristic at ignition, the affinity of the alternative fuel to mixture formation and
combustion speed of the alternative fuel influences the cycle variation. Many researchers
worldwide are still concentrating on the further improvement of VCR engines to improve
the performance, combustion and emission.
2.2. Previous Works with Alternative Fuels
Varuvel et al. [1] Compared the performance, combustion and emission characteristics of a
single cylinder four stroke compression ignition engine fuelled with oil produced from waste
IJSER

International Journal of Scientific & Engineering Research, Volume 7, Issue 3, March-2016 176 ISSN 2229-5518
IJSER © 2016 http://www.ijser.org
fat .The brake thermal efficiency of neat bio fuel is 32.4% at 80% load which was very high
compared to neat diesel (29.98%). The combustion duration and ignition delay were decreased
with neat bio fuel due to high oxygen content and high cetane number of bio fuel. The main
problem with the use of neat bio fuel in diesel engine was high NOx emissions at all loads.
Addition of diesel with bio fuel reduced the NOx emissions significantly from 917 ppm to 889
ppm at 80% load with an optimum blend of B80D20.
Swaminath et al.[2] Studied the performance and emission of single cylinder four stroke diesel
engine using biodiesel(fish oil) at a constant speed 1500 rpm. Fuel was blended with oxygenate
and EGR technique was also used to improve the performance. He found there is increased in
break thermal efficiency. The percentage reduction was CO-91% ,CO2-62%,NOx-92% and
CxHy-90% were attained when the engine was run at maximum load using
BFOwith2%additive with EGR and there was reduction in all the percentages when the engine
was run in other loads also. In the case of NOx, there was an increase of this emission by about
48%in the maximum load with BFO when compared with diesel, for obvious reasons and that
was also reduced because of the addition of oxygenates and EGR.
K. Muralidhran et al.[3] studied the performance, emission and combustion of VCR engine
using methyl esters of waste cooking oil and its blends with standard diesel in a compression
ignition engine. Experiments were carried out for diesel, B20, B40, B60, B80. Maximum
brake thermal efficiency for B40 at full load was found to be 4.1% higher than diesel. Brake
specific fuel consumption of the blends B20, B40 at full load was found to be lower than
diesel. Exhaust temperatures of blends were lower than diesel. Combustion pressure of B40
was found to be higher than that of diesel. From the analysis of exhaust emission of the
blends, it was found that the hydrocarbon emissions of various blends were higher at higher
loads except B20. The NOx emission for biodiesel and its blends was higher than that of
standard diesel except B40 at lower loads. The CO emission of the blend B40 was closer to
that of standard diesel and it was found to be higher for light and medium load.
K.Muralidhran et al.[4 ] studied the performance, emission and combustion of VCR engine
using methyl esters of waste cooking oil and its blends with standard diesel at varying
compression ratio and engine loading at a constant speed .Brake thermal efficiency of blend
B40 was higher than that of diesel at higher compression ratio. The specific fuel consumption
of B40 was lower than that of all other blends and diesel. Exhaust gas temperature of blends
was found to be lower than diesel. Combustion pressure of waste cooking oil was found to be
IJSER

International Journal of Scientific & Engineering Research, Volume 7, Issue 3, March-2016 177 ISSN 2229-5518
IJSER © 2016 http://www.ijser.org
higher than diesel. The hydrocarbon emission of various blends was higher at higher
compression ratios. The increase in compression ratio increases the HC emission for blend
B40. The emission of oxides of nitrogen (NOx) from the waste cooking oil blend B40 is
higher than that of diesel. The CO emission of the blend B40 is closer to the standard diesel
and it is very higher at compression ratio. The CO2 emission is also lesser at the same
conditions.
Jindal et al. [5] studied that the effects of the engine design parameters viz. compression ratio
and fuel injection pressure on the performance with regard to parameters such as fuel
consumption, brake thermal efficiency and emissions of CO,CO2,HC(hydrocarbon), NOx
and Smoke opacity with Jatropha methyl ester as fuel. It is found that the combined increase
of compression ratio and injection pressure increases the brake thermal efficiency and
reduces brake specific fuel consumption while having lower emissions.
Saravanan et al. [6] studied that the combustion characteristics of a stationary diesel engine
fuelled with a blend of crude rice bran oil methyl ester and diesel. It was observed that the
delay period and the maximum rate of pressure rise for crude rice bran oil methyl ester blend
were lower than those of diesel. The occurrence of maximum heat release rate advanced for
crude rice bran oil methyl ester blend with lesser magnitude when compared to diesel. This
investigation ensures that the suitability of crude rice bran oil methyl ester blend as fuel for
CI engines with higher fuel cost.
Prem Anand et al. [4] calculated the combustion performance and exhaust emission
Characteristics of turpentine oil fuel blended with conventional diesel fuel in a diesel engine.
Yousef Heik et al. [7] carried out an experimental study to use raw Algae oil and its methyl
esters in a Ricardo E6 variable compression ratio engine. Effects of engine speed, engine load
output, injection timing of the algae bio fuel and engine compression ratio on the engine
output torque, combustion noise(maximum pressure rise rate), maximum pressure and
maximum heat release rate have been studied. However, its use reduced the engine output
torque slightly and increased the combustion noise. The engine output can be increased and
the combustion noise can
be reduced by controlling the engine design parameters e.g. injection timing and compression
ratio.
IJSER
International Journal of Scientific & Engineering Research, Volume 7, Issue 3, March-2016 178 ISSN 2229-5518
IJSER © 2016 http://www.ijser.org
Kalam et al. [8] evaluated the emission and performance characteristics of a multi-cylinder
diesel engine operating on waste cooking oil such as 5% palm oil with 95% ordinary diesel
fuel and 5% coconut oil with 95% ordinary diesel fuel. B0 was used for comparison
purposes. The results shows that there are reductions in brake power of 1.2% and 0.7% and
reduction of exhaust emissions such as unburned hydrocarbon (HC), smoke, carbon mono-
oxide(CO), and nitrogen oxides (NOx) is offered by the blended fuels.
Mani et al. [9] studied the effect of using waste plastic oil and diesel blends in compression
ignition engine. It is observed that the engine could operate with 100% waste plastic oil and
can be used as fuel in diesel engines. Oxides of nitrogen (NOx) was higher by about 25% and
carbon monoxide (CO) increased by 5% for waste plastic oil operation compared to diesel
fuel operation. Hydrocarbon was higher by about 15%. Smoke increased by 40% at full load
with waste plastic oil compared to diesel. Engine fuelled with waste plastic oil exhibits higher
thermal efficiency up to 80% of the full load and the exhaust gas temperature was higher at
all loads compared to diesel fuel operation.
Gumus and Kasifoglu [10] studied the performance and emissions of a compression ignition
diesel engine without any modification, using neat apricot seed kernel oil methyl ester and its
blends with diesel fuel and found that lower concentration of apricot seed kernel oil methyl
ester in blends give a better improvement in the engine performance and exhaust emissions.
Ismet Celikten et al. [11] compared the performance and emissions of diesel fuel from
rapeseed and soybean oil methyl esters injected at different pressures (250,300 and 350 bar).
It has been found that the torque and power of diesel fuel engine reduced with increasing
injection pressure. Smoke level (%) and CO emission also reduced while NOx emission
increased as the injection pressure is increased.
Raheman and Ghadge [12] studied the performance of Ricardo E6 engine using bio diesel
obtained from mahua oil (B100) and its blend with high speed diesel at varying compression
ratio, injection timing and engine loading. The brake specific fuel consumption and exhaust
gas temperature increased, whereas brake thermal efficiency decreased with increase in the
proportion of bio diesel in the blends for all compression ratios (18:1–20:1) and injection
timings (35–45_ before TDC). The authors concluded that, bio diesel could be safely blended
IJSER

International Journal of Scientific & Engineering Research, Volume 7, Issue 3, March-2016 179 ISSN 2229-5518
IJSER © 2016 http://www.ijser.org
with HSD up to 20% at any of the compression ratio and injection timing tested for getting
fairly accurate performance as that of diesel.
2.3. Conclusion of Present Review
Petroleum resources are finite and, therefore, search for their alternative non-petroleum fuels
for internal combustion engines is continuing all over the world. Moreover gases emitted by
petroleum fuel driven vehicles have an adverse effect on the environment and human health.
There is universal acceptance of the need to reduce such emissions. The researchers have
performed their experiment with different alternative fuels like CNG, LPG, bio fuels,
producer gas, biogas, syngas, and acetylene etc. It is observed that biofuels are more
acceptable to the diesel engines because of their better combustion and performance
characteristics. At the same time while choosing the blends of biodiesel the fuel blends are
being used in the engine designed exclusively for diesel fuel operation, and thus are restricted
upto 40% mixing only [24].
2.4. Scope of Present Investigation
It seems that with diesel or blends of biodiesel will be a promising technique for controlling
performance, combustion and emissions from the diesel engines. It is found that the lower
concentrations of biodiesel blends improve the thermal efficiency. Reduction in emission and
brake-specific fuel consumption (BSFC) is also observed while using B-40. From various
experiments conducted, it has been found that all the emission parameters like HC, CO and
soot emission decreases by the use of bio-diesel but NOx emission increases due to the high
oxygen content and proper combustibility of bio-diesel. As the engines are designed to
operate with diesel, so for use of higher blends of biodiesel modifications are needed in the
fuel injection system. After critical review of the available literatures on the use of biodiesel
as alternative fuel it was decided to carry out detailed experiment with the different blends
KOME. Varying the CR ranging from 16:1 to 18:1.with varying loads to optimize the CR to a
value which would give the best performance of engine and reduces the emissions which are
harmful to the environment.
IJSER

International Journal of Scientific & Engineering Research, Volume 7, Issue 3, March-2016 180 ISSN 2229-5518
IJSER © 2016 http://www.ijser.org
2.5. Objectives
• Fuel property testing of a locally available non edible vegetable oil(karanja oil) at
different temperatures to know the diesel engine compatibility.
• Effect of CR on performance of a single cylinder 4 stroke compression ignition
engine using blends of Karanja oil methyl ester and neat Karanja oil with diesel.
• Effect of CR on combustion of a single cylinder 4 stroke compression ignition engine
using blends of Karanja oil methyl ester and neat Karanja oil with diesel.
Effect of CR on emission of a single cylinder 4 stroke compression ignition engine using
blends of Karanja oil methyl ester and neat Karanja oil with diesel.
3.EXPERIMENT
3.1Introduction
This chapter discusses the principles and methodologies that have been used during the
course of several experimental investigations in the variable compression ratio engine engine
test rig. A single cylinder four stroke 3.5kW, 1500 rpm, water cooled diesel engine was
selected for the study. The instruments fitted to the test bed were properly calibrated to
minimize the possible errors during experimentation. The results of this study can give
ample guidelines to utilize bio fuel and neat Karanja in variable compression ratio engine
with blends of biodiesel in variable compression ratio diesel engines.
IJSER

International Journal of Scientific & Engineering Research, Volume 7, Issue 3, March-2016 181 ISSN 2229-5518
IJSER © 2016 http://www.ijser.org
3.2 Measurement of specific gravity.
The specific gravity of all fuel blends (neat Karanja oil, blended neat oil with diesel, 100%
biodiesel and blended biodiesel with diesel) are measured as per standard ASTM D4052 at
varying temperature using different hydrometers.
Fig 1 Oil bath and hydrometer
Table -1 Hydrometer specification
Range To suit surface tension
Catlog no. Type Interval
0.750-0.800 Low 1010 M-50SP 0.001gm/ml 0.800-0.850 Low 1011 L-50SP 0.0005gm/ml 0.850-0.900 Low 1012 M-50SP 0.001gm/ml 0.900-0.950 Low 1013 M-50SP 0.001gm/ml 0.950-1.0 Low 1014 M-50SP 0.001gm/ml
3.3 Measurement of Viscosity:-
When a fluid is subjected to external forces, it resists flow due to internal friction. Viscosity
is a measure of internal friction. The viscosity of the fuel affects atomization and fuel
IJSER

International Journal of Scientific & Engineering Research, Volume 7, Issue 3, March-2016 182 ISSN 2229-5518
IJSER © 2016 http://www.ijser.org
delivery rates. It is an important property because if it is too low and too high then
atomization, mixing of air and fuel in combustion chamber gets affected. Viscosity studies
are conducted for different fuel blends (neat Karanja oil, blended neat oil with diesel, 100%
biodiesel and blended biodiesel with diesel). Kinematic viscosity of liquid fuel samples are
measured using the viscometer at different temperatures and blendings as per specification
given in ASTM D445, using Cannon-Frensky viscometer tubes in viscometer oil bath.
\
Fig 2 oil bath with viscometer
3.4 Acidic value calculation:-
Step-1
10 ml of ethanol was taken in a beaker .10 drops of Phenopthalin indicator was added to it. Then it was titrated with N/100 KOH. Amount of base required for the neutralization of the sample was measured. Three times the same procedure was done and three observations were taken.
Step-2
Again 10 ml of ethanol was taken in a beaker.0.5 gm of oil was added to it .It was stirred for 15 minutes. Then it was titrated with N/100 KOH.10 drops of Phenopthalin indicator was
IJSER

International Journal of Scientific & Engineering Research, Volume 7, Issue 3, March-2016 183 ISSN 2229-5518
IJSER © 2016 http://www.ijser.org
added to it .The sample was titrated with N/100 KOH. Amount of base required for neutralization was measured. Same procedure was done for three times three observations were taken.
Table 2 Observation table for titration step-1
Observation IBR FBR Difference Mean(V1) 1 0 2.1 2.1 2 2.1 4.2 2.1 2.06 3 4.2 6.2 2.0
Table 3 Observation table for titration step-2
Observation IBR FBR Difference Mean(V2) 1 6.2 20.3 14.1 2 20.3 36.2 15.9 15.63 3 29.0 45.9 16.9
Acid value= (56 x (V2-V1) X 2)/100000=15.18
At the time of esterfication same procedure was carried out taking samples from the reactor .When the Acid value was found to below 5 .It was then transferred to the separating funnel .
3.5 Biodiesel preparation from Karanja vegetable oil
There are two basic routes to biodiesel production from oils and fats:
1. Conversion of the oil to its triglyceride.
2. Base catalyzed transesterification of the triglyceride to its biodiesel.
To prepare Karanja biodiesel from the oil the acid value of the oil is measured using titration
technique. The acid value of the oil is found to be 6.3 mg KOH/g. The acid value of the oil is
decreased by esterification method. In esterification method acid catalyzed reaction of the oil
with alcohol is done. Samples are taken from the products of reaction in every half an hour
and acid value measured. The reaction is stopped when acid value of the oil comes below 5
mgKOH/g. The products of reaction are then allowed to be settled in a separating funnel.
IJSER

International Journal of Scientific & Engineering Research, Volume 7, Issue 3, March-2016 184 ISSN 2229-5518
IJSER © 2016 http://www.ijser.org
After 24 hours of settling triglyceride comes to the bottom of the funnel and unreacted
alcohol comes to the top. The triglyceride of Karanja oil is then collected from the bottom of
the separating funnel. The triglyceride of the oil is transesterified to produce biodiesel or
Karanja oil methyl ester on the same reactor. Then reaction is carried out at 600C with
continuous stirring. The transesterification is represented as below in equation (1).
The products of the reaction is kept in the separating funnel and allowed to settle down.
Glycerol is settled at the bottom of the separating funnel and collected. The top part of the
funnel contains Karanja oil methyl ester or Karanja biodiesel. The dissolved water particle is
removed by heating the collected Karanja biodiesel. Biodiesel are blended with diesel fuel at
10%, 20%, 30%-------100% on a volume basis.
3.5.1 Mixing of alcohol and catalyst
The catalyst is typically sodium hydroxide (caustic soda) or potassium hydroxide(potash). It is dissolved in the alcohol using a standard agitator or mixer. The alcohol/catalyst mix is then charged into a closed reaction vessel and the oil or fat is added. The system from here on is totally closed to the atmosphere to prevent the loss of alcohol. The reaction mixture is kept just above the boiling point of the alcohol (around 60 °C) to speed up the reaction and the reaction takes place. Recommended reaction time varies from 1 to 8 hours, and some systems recommend the reaction take place at room temperature. Excess alcohol is normally used to ensure total conversion of the fat or oil to its esters. Care must be taken to monitor
IJSER

International Journal of Scientific & Engineering Research, Volume 7, Issue 3, March-2016 185 ISSN 2229-5518
IJSER © 2016 http://www.ijser.org
the amount of water and free fatty acids in the incoming oil or fat. If the free fatty acid level or water level is too high it may cause problems with soap formation and the separation of the glycerin by-product downstream.
Fig.3. Biodiesel reactor
3.5.2 Separation Once the reaction is complete, two major products are obtained: glycerin and biodiesel. Each has a substantial amount of the excess alcohol that was used in the reaction. The reacted mixture is sometimes neutralized at this step if needed. The glycerin is much more dense than biodiesel and the two can be gravity separated with glycerin simply drawn off the bottom of the settling vessel. In some cases, a centrifuge is used to separate the two materials faster.
IJSER

International Journal of Scientific & Engineering Research, Volume 7, Issue 3, March-2016 186 ISSN 2229-5518
IJSER © 2016 http://www.ijser.org
Fig.4.Transesterification
3.5.3. Alcohol Removal Once the glycerin and biodiesel phases have been separated, the excess alcohol in each phase is removed with a flash evaporation process or by distillation. In others systems, the alcohol is removed and the mixture neutralized before the glycerin and esters have been separated. In either case, the alcohol is recovered using distillation equipment and is re-used. Care must be taken to ensure no water accumulates in the recovered alcohol stream. 3.5.4. Glycerine Neutralization The glycerin by-product contains unused catalyst and soaps that are neutralized with an acid and sent to storage as crude glycerin. In some cases the salt formed during this phase is recovered for use as fertilizer. In most cases the salt is left in the glycerin. Water and alcohol are removed to produce 80-88% pure glycerin that is ready to be sold as crude glycerin. In more sophisticated operations, the glycerin is distilled to 99% or higher purity and sold into the cosmetic and pharmaceutical markets.
IJSER
International Journal of Scientific & Engineering Research, Volume 7, Issue 3, March-2016 187 ISSN 2229-5518
IJSER © 2016 http://www.ijser.org
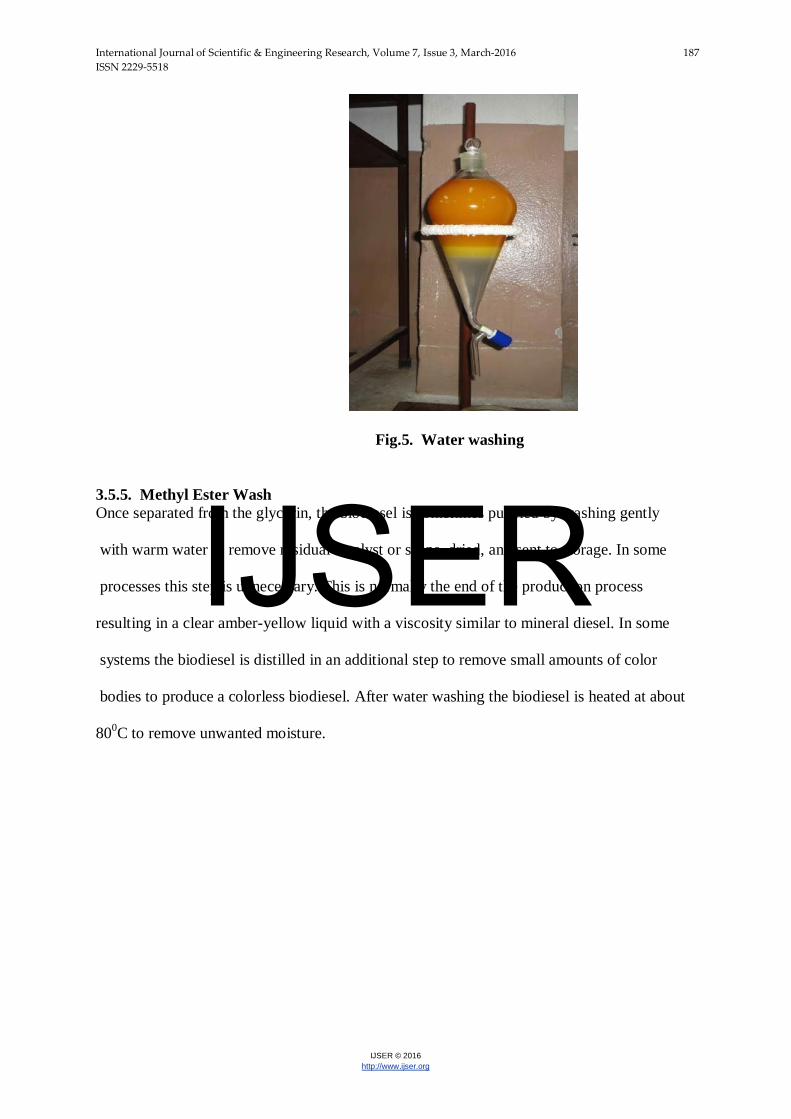
Fig.5. Water washing 3.5.5. Methyl Ester Wash Once separated from the glycerin, the biodiesel is sometimes purified by washing gently with warm water to remove residual catalyst or soaps, dried, and sent to storage. In some processes this step is unnecessary. This is normally the end of the production process resulting in a clear amber-yellow liquid with a viscosity similar to mineral diesel. In some systems the biodiesel is distilled in an additional step to remove small amounts of color bodies to produce a colorless biodiesel. After water washing the biodiesel is heated at about 800C to remove unwanted moisture.
IJSER

International Journal of Scientific & Engineering Research, Volume 7, Issue 3, March-2016 188 ISSN 2229-5518
IJSER © 2016 http://www.ijser.org
3.6 Experimental set up
Fig 6 Actual Engine setup
The principles and methodologies that have been used during the course of several
experimental investigations in the VCR diesel engine test rig consisting of a 1 cylinder, 4
stroke, power 3.5 kW at 1500 rpm Diesel engine connected to eddy current dynamometer in
computerized mode to study the performance, emission and combustion of engine by varying
its CR at different load condition from 0kg to 12kg using various blends of KOME and diesel.
The detailed specification of the engine is shown in Table 1. Engine performance analysis
software package “EnginesoftLV” have been employed for online performance analysis. Piezo
sensor and crank angle sensor which measures the combustion pressure and the corresponding
crank angle respectively are mounted into the engine head. The output shaft of the eddy
current dynamometer is fixed to a strain gauge type load cell for measuring applied load to the
engine.
Type K-Chromel (Nickel-Chromium Alloy)/ Alumel (Nickel- Aluminium Alloy)
thermocouples is used to measure gas temperature at the engine exhaust, calorimeter exhaust,
water inlet of calorimeter and water outlet of calorimeter, engine cooling water outlet and
ambient temperature. The fuel flow is measured by the use of 50ml burette and stopwatch
IJSER

International Journal of Scientific & Engineering Research, Volume 7, Issue 3, March-2016 189 ISSN 2229-5518
IJSER © 2016 http://www.ijser.org
with level sensors.
3.6.1 Engine specification and its attachements. Table :-4 Engine specification
Make Kirloskar
General details VCR Engine test setup 1 cylinder, 4
stroke, Water cooled, compression
ignition
Rated power 3.5Kw at 1500 rpm
Speed 1500 rpm(constant)
Number of cylinder Single cylinder
Compression ratio 16:1 to 18:1(variable)
Bore 87.5 mm
Stroke 110 mm
Ignition Compression ignition
Loading Eddy current dynamometer
Load sensor Load cell, type strain gauge 0-50 Kg
Temperature sensor Type RTD, PT100 and Thermocouple,
Type K
Cooling Water
Air flow transmitter Pressure transmitter, Range (-) 250 mm
WC
Rotameter Engine cooling 40-400 LPH; Calorimeter
25-250 LPH
Software “EnginesoftLV” Engine performance
analysis software
Propeller shaft With universal joints
Air box M S fabricated with orifice meter and
manometer
Fuel tank Capacity 15 lit with glass fuel metering
column
Calorimeter Type Pipe in pipe
Piezo sensor Range 5000 PSI, with low noise cable
IJSER
International Journal of Scientific & Engineering Research, Volume 7, Issue 3, March-2016 190 ISSN 2229-5518
IJSER © 2016 http://www.ijser.org
Crank angle sensor Resolution 1 Deg, Speed 5500 RPM with
TDC pulse
Data acquisition device NI USB-6210, 16-bit, 250kS/s.
Piezo powering unit Make-Cuadra, Model AX-409.
Digital milivoltmeter Range 0-200mV, panel mounted
Temperature
transmitter
Type two wire, Input RTD PT100, Range
0–100 Deg C,
Output 4–20 mA and Type two wire,
Input
Thermocouple, Range 0–1200 Deg C,
Output 4–20 mA
Load indicator Digital, Range 0-50 Kg, Supply 230VAC
Pump Type Monoblock
Overall dimensions W 2000 x D 2500 x H 1500 mm
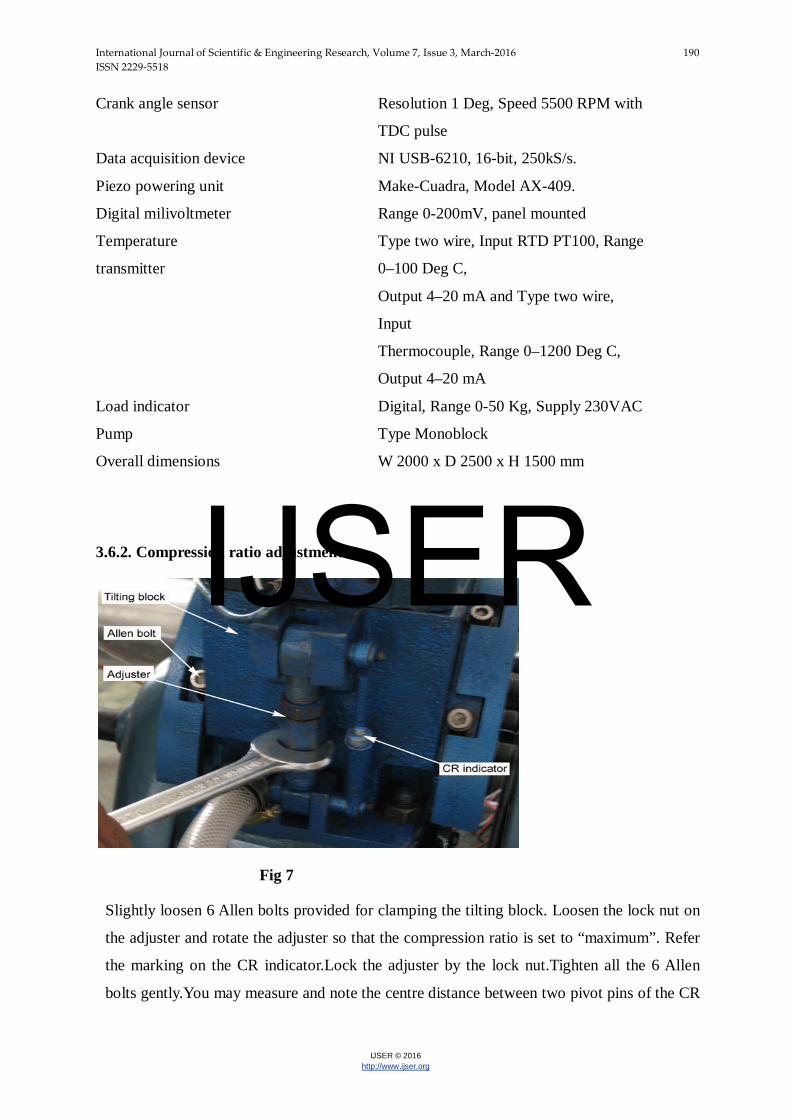
3.6.2. Compression ratio adjustment
Fig 7
Slightly loosen 6 Allen bolts provided for clamping the tilting block. Loosen the lock nut on
the adjuster and rotate the adjuster so that the compression ratio is set to “maximum”. Refer
the marking on the CR indicator.Lock the adjuster by the lock nut.Tighten all the 6 Allen
bolts gently.You may measure and note the centre distance between two pivot pins of the CR
IJSER

International Journal of Scientific & Engineering Research, Volume 7, Issue 3, March-2016 191 ISSN 2229-5518
IJSER © 2016 http://www.ijser.org
indicator. After changing the compression ratio thedifference (Δ) can be used to know new
CR.
3.6.3 Dynamometer
Fig 8
It is an absorption type of eddy current water cooled dynamometer. It is a device used for
loading unit. Here load is measured by a strain gauge type load cell.
3.6.4 Multi gas analyser:- Multi - Gas Analyzer capable of measuring CO, HC, CO2, O2 & NOx (optional) contents in
the exhaust. The AVL-444 analyzer provides optimized analysis methods for different
applications. It is specifically designed for the automobile industry.
Designed using latest technology, these analyzers can easily check the pollution level of
various automobiles, elegant and smart in appearance. The analyzers are easy to install and
known for their efficient functioning. Further, the range is tested on various parameters in
order to meet the set industrial standards. The specifications of accuracy for measurement of
various parameters are given in Table-1.
IJSER

International Journal of Scientific & Engineering Research, Volume 7, Issue 3, March-2016 192 ISSN 2229-5518
IJSER © 2016 http://www.ijser.org
Table-5: Measurement range and accuracy of AVL 444 gas analyzer
Measured Quality
Measuring Range Resolution Accuracy
CO 0…10% vol. 0.01% vol. <0.6% vol: ±0.03% vol. >=0.6% vol: ±5% of ind value
CO2 0…20% vol. 0.1% vol. <10% vol: ±0.5% vol. >=10% vol: ±5% vol.
HC 0…20000 ppm vol <=2000:1 ppm vol. >2000:10 ppm vol.
<200 ppm vol: ±10 ppm vol. >=200 ppm vol: ±5% of ind. val.
O2 0…22% vol. 0.01% vol. <2% vol: ±0.1% vol. >=2% vol: ±5% vol.
NO 0…5000 ppm vol. 1 ppm vol. <500 ppm vol: ±50 ppm vol. >=500 ppm vol: ±10% of ind. val.
Engine Speed 400…6000 min-1 1 min-1 ±1% of ind. val. Oil Temperature -30…1250C 10C ±40C
Lambda 0…9.999 0.001 Calculation of CO, CO2, HC, O2
Fig. 9 Multi gas analyser 3.6.5 Smoke meter:- device use to measure smoke opacity.
Fig. 9 Smoke meter
IJSER

International Journal of Scientific & Engineering Research, Volume 7, Issue 3, March-2016 193 ISSN 2229-5518
IJSER © 2016 http://www.ijser.org
Table-6: Measurement range and accuracy of Smoke meter
Measured Quality Measuring Range Resolution Accuracy
Opacity 0…100% 0.1% ±%of full scale
Absorption 0…99.99m-1 0.01 m-1 Better than± 0.1 m-1 RPM 400-6000 1/ min 11 1/ min ±10 OilTemperature 00…150oC 1oC ±3oC
3.7 Experimental lay out:-
Fig.11 Lay out of VCR engine 3.8 Experimental procedure:- The variable compression ratio engine is started by using standard diesel. It is run for 30
IJSER

International Journal of Scientific & Engineering Research, Volume 7, Issue 3, March-2016 194 ISSN 2229-5518
IJSER © 2016 http://www.ijser.org
minutes. When the engine is warmed up then readings are taken. The tests are conducted at
the rated speed of 1500 rpm. Fuel consumption is measured by the help of the measuring
burette attached to the data acquisition system. In every test, brake thermal efficiency, brake
specific fuel consumption, exhaust gas temperature, mechanical efficiency, torque and
combustion parameters like combustion pressure, combustion temperature, ignition delay, net
heat release rate, combustion duration and exhaust gas emissions such as carbon monoxide
(CO), carbon dioxide (CO2), hydrocarbon (HC), nitrogen oxides (NOx), and smoke opacity
are measured. From the initial measurement, performance, combustion and emission
parameters with respect to compression ratio 16:1, 17:1 and 18:1 at 100% load for different
blends are calculated and recorded. Also the engine operating parameters such as
performance, combustion and emission with respect to different loads for different blends at
compression ratio 18 are measured and recorded. At each operating conditions, the
performance and combustion characteristics are also processed and stored in personal
computer (PC) for further processing of results. The same procedure is repeated for different
blends of Karanja oil methyl esters.
3.9 Conclusion The specific gravity of biodiesel fuels is lower than that of straight vegetable oil. Therefore,
the specific gravity of the blend increases with the increase of biodiesel concentration. Also,
the specific gravity shows a inverse relationship with temperature. As the temperature is
increased, specific gravity decreases. The viscosity of biodiesel is found lower than that of
straight vegetable oil. The viscosity of the blend increases with the increasing biodiesel
fraction for all. Similar to the effect of temperature on specific gravity, viscosity also shows
linearly inverse trend i.e increasing temperature reduces the viscosity. This property helps in
better atomisation and hence fuel burning in application of biodiesels. It has been noticed that
the specific gravity and the viscosity of the biodiesel blends increase with increase of the
IJSER
International Journal of Scientific & Engineering Research, Volume 7, Issue 3, March-2016 195 ISSN 2229-5518
IJSER © 2016 http://www.ijser.org
biodiesel fraction. It is also seen that the specific gravity and viscosity of each blend
decreases with increase in the temperature.
4. Result and Discussion 4.1 Fuel property testing at different blend and temperature.
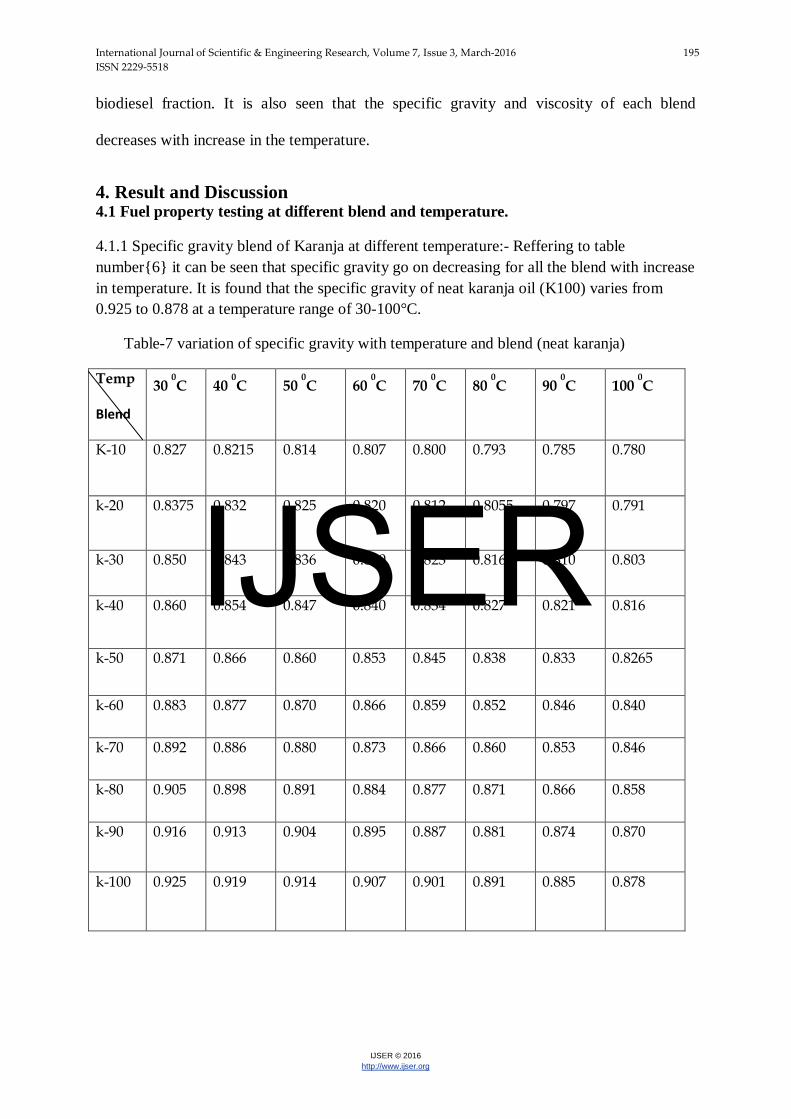
4.1.1 Specific gravity blend of Karanja at different temperature:- Reffering to table number{6} it can be seen that specific gravity go on decreasing for all the blend with increase in temperature. It is found that the specific gravity of neat karanja oil (K100) varies from 0.925 to 0.878 at a temperature range of 30-100°C.
Table-7 variation of specific gravity with temperature and blend (neat karanja)
Temp Blend
30 0C 40
0C 50
0C 60
0C 70
0C 80
0C 90
0C 100
0C
K-10 0.827 0.8215 0.814 0.807 0.800 0.793 0.785 0.780
k-20 0.8375 0.832 0.825 0.820 0.812 0.8055 0.797 0.791
k-30 0.850 0.843 0.836 0.830 0.823 0.816 0.810 0.803
k-40 0.860 0.854 0.847 0.840 0.834 0.827 0.821 0.816
k-50 0.871 0.866 0.860 0.853 0.845 0.838 0.833 0.8265
k-60 0.883 0.877 0.870 0.866 0.859 0.852 0.846 0.840
k-70 0.892 0.886 0.880 0.873 0.866 0.860 0.853 0.846
k-80 0.905 0.898 0.891 0.884 0.877 0.871 0.866 0.858
k-90 0.916 0.913 0.904 0.895 0.887 0.881 0.874 0.870
k-100 0.925 0.919 0.914 0.907 0.901 0.891 0.885 0.878
IJSER

International Journal of Scientific & Engineering Research, Volume 7, Issue 3, March-2016 196 ISSN 2229-5518
IJSER © 2016 http://www.ijser.org
4.1.2 Viscosity of blend of Karanja at different temperature:- Reffering to the table {7} it can be observed that viscosity for all blend go on decreasing with increase in temperature. It is found that the viscosity of neat Karanja oil blends (K10) varies from 4.116 cSt to 2.2912 cSt at a temperature range of 30 to 100°C.
Table- 8 variation of viscosity with temperature and blend (neat karanja)
Temp BLEND
300C 40
0C 50
0C 60
0C 70
0C 80
0C 90
0C 100
0C
K-10 4.116 3.238 2.351 2.043 1.763 1.2572 2.0572 2.2912
K-20 4.976 4.354 3.421 2.724 2.332 2.052 1.842 1.7
K-30 8.061 6.563 4.5 3.695 2.852 2.612 2.316 2.005
K-40 10.344 8.382 6.420 5.25 4.189 3.586 2.789 2.556
K-50 14.821 11.948 8.917 6.920 4.683 3.933 3.494 3.147
K-60 18.678 14.789 10.898 9.024 7.384 5.305 4.372 4.189
K-70 27.167 20.686 16.562 11.185 9.667 7.633 6.563 4.226
K-80 34.513 24.602 17.645 12.475 9.956 8.989 8.097 7.491
K-90 36.478 30.665 23.436 16.753 12.785 10.636 9.631 8.561
K-100 58.1324 42.785 32.173 22.228 13.256 11.649 7.589 9.346
4.1.3 Specific gravity of blend of bio diesel at different temperature:- The specific gravity
of karanja biodiesel (B100) varies between 0.891 to 0.841 at same temperature range . Many
studies show that biodiesel’s specific gravity is not changed a lot, because the densities of
methanol and oil is close to the specific gravity of the produced biodiesel. The specific
gravity of biodiesel is found higher than that those of diesel fuel. As the specific gravity of
IJSER

International Journal of Scientific & Engineering Research, Volume 7, Issue 3, March-2016 197 ISSN 2229-5518
IJSER © 2016 http://www.ijser.org
biodiesel is high compared to diesel fuel so the energy content of it is lower . Specific gravity
of biodiesel will vary with the fatty acid composition and their purity.
Table -9 variation of specific gravity with temperature and blend (karanja oil methyl ester)
300C 40
0C 50
0C 60
0C 70
0C 80
0C 90
0C 100
0C
B-10 .826 .8205 .813 .8055 .798 .792 .785 .779 B-20 .8375 .831 .823 .817 .8105 .8035 .796 .790 B-30 .8425 .836 .830 .823 .8155 .808 .8025 .796 B-40 .849 .8435 .8355 .8285 .822 .8155 .809 .803 B-50 .854 .847 .840 .8325 .8265 .820 .8125 .806 B-60 .860 .854 .846 .840 .833 .826 .820 .814 B-70 .867 .861 .854 .846 .837 .832 .826 .820 B-80 .871 .865 .859 .852 .845 .837 .831 .824 B-90 .884 .878 .872 .865 .858 .851 .843 .837 B-100 .891 .885 .877 .869 .862 .855 .848 .841
IJSER

International Journal of Scientific & Engineering Research, Volume 7, Issue 3, March-2016 198 ISSN 2229-5518
IJSER © 2016 http://www.ijser.org
4.1.4 Viscosity of blend of bio diesel at different temperature:- viscosity of biodiesel blends (B10-B100) at 40°C varies from 2.18 cSt to 4.5249 cSt.
Table- 10 variation of viscosity with temperature and blend (karanja oil methyl ester)
300C 40
0C 50
0C 60
0C 70
0C 80
0C 90
0C 100
0C
B-10 2.6963 2.1831 B-20 2.4164 1.9779 B-30 2.7149 2.1738 1.8753 B-40 3.452 2.8456 2.3044 1.9592 B-50 3.1254 2.603 2.1738 1.8939 B-60 3.3494 2.7896 2.3697 2.0245 B-70 3.7225 3.0788 2.631 2.2951 1.9592 B-80 3.8252 3.1628 2.7149 2.3324 2.0059 B-90 4.2637 3.4706 2.8829 2.4537 2.1085 B-100 4.5249 3.7225 3.0135 2.5190 2.1458
4.2 PERFORMANCE ANALYSIS OF KARANJA OIL METHYL ESTER
4.2.1 Brake specific fuel consumption
From Fig 4.2.1.1 it can be observed that the BSFC of the engine decreased with increase in
load. But the BSFC for the KOME blends is found to be higher compared to that of diesel at
all the loads. The BSFC varies with diesel, B20, B40, and B60 at full load is found to be 0.34
kg/kWh, 0.34kg/kWh, 0.32kg/kWh and 0.39kg/kWh respectively. At higher percentage of the
blends, the BSFC increases.
The brake specific fuel consumption of the blend B40 at the compression ratio of 18 is
0.32kg/kWh whereas for diesel it is 0.34kg/kWh. At higher percentage of blends, the specific
fuel consumption increases. This is due to the decrease in calorific value for the higher
blends. The specific energy consumption decreases with the increase in compression ratio.
IJSER

International Journal of Scientific & Engineering Research, Volume 7, Issue 3, March-2016 199 ISSN 2229-5518
IJSER © 2016 http://www.ijser.org
The BSFC of the engine with the Karanja oil methyl ester blends as fuels compared with its
diesel fuel operation at various loads in Fig 4.2.1.2
Fig 4.2.1.1
Fig 4.2.1.2
4.2.2 Brake thermal efficiency
The variation of brake thermal efficiency (BTE) for different loads and for different
fuels is given in Fig 4.2.2.1 It is seen that there is a steady increase in efficiency with
increases in load in all the fuel operations. It is happened due to reduction in heat loss and
0
0.2
0.4
0.6
0.8
1
1.2
1.4
0 10 20 30 40 50 60 70 80 90 100
BSF
C(K
g/kW
h)
Load(%)
Diesel
B20
B40
B60
0
0.05
0.1
0.15
0.2
0.25
0.3
0.35
0.4
0.45
16 17 18
BSF
C(K
g/kW
h)
Compression Ratio
DieselK10K20
IJSER
International Journal of Scientific & Engineering Research, Volume 7, Issue 3, March-2016 200 ISSN 2229-5518
IJSER © 2016 http://www.ijser.org
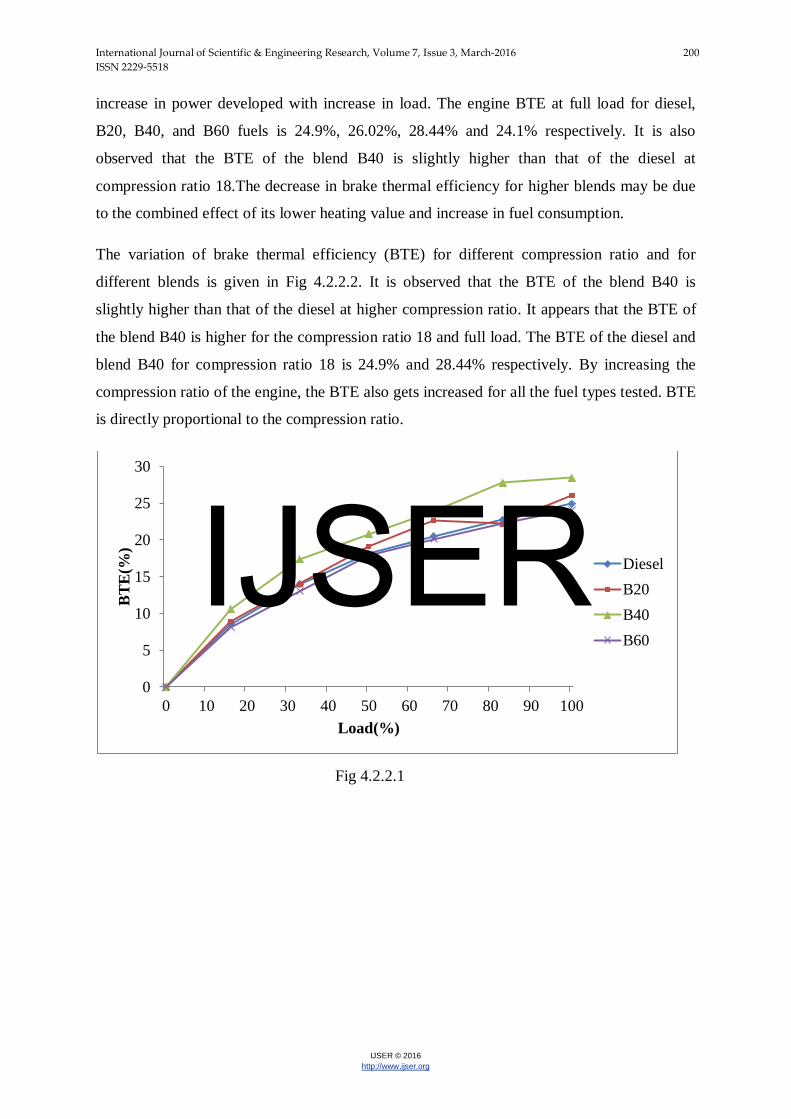
increase in power developed with increase in load. The engine BTE at full load for diesel,
B20, B40, and B60 fuels is 24.9%, 26.02%, 28.44% and 24.1% respectively. It is also
observed that the BTE of the blend B40 is slightly higher than that of the diesel at
compression ratio 18.The decrease in brake thermal efficiency for higher blends may be due
to the combined effect of its lower heating value and increase in fuel consumption.
The variation of brake thermal efficiency (BTE) for different compression ratio and for
different blends is given in Fig 4.2.2.2. It is observed that the BTE of the blend B40 is
slightly higher than that of the diesel at higher compression ratio. It appears that the BTE of
the blend B40 is higher for the compression ratio 18 and full load. The BTE of the diesel and
blend B40 for compression ratio 18 is 24.9% and 28.44% respectively. By increasing the
compression ratio of the engine, the BTE also gets increased for all the fuel types tested. BTE
is directly proportional to the compression ratio.
Fig 4.2.2.1
0
5
10
15
20
25
30
0 10 20 30 40 50 60 70 80 90 100
BTE
(%)
Load(%)
DieselB20B40B60
IJSER

International Journal of Scientific & Engineering Research, Volume 7, Issue 3, March-2016 201 ISSN 2229-5518
IJSER © 2016 http://www.ijser.org
Fig 4.2.2.2
4.2.3 Mechanical efficiency
The variations of mechanical efficiency with compression ratio for various blends are
shown in Fig.4.2.3.1 It has been observed that the mechanical efficiency of the blends is
lesser in lower compression ratio and higher in higher compression ratio. The mechanical
efficiency of the blend B20 and B40 increases with increase in compression ratio, when
compared to that of diesel. The maximum mechanical efficiency obtained from blend B20
and B40 for compression ratio 18 is 54.61% and 53.56%. Mechanical efficiency increases
with increasing compression ratio for all the blends.
Fig.4.2.3.2 shows that the variation of mechanical efficiency with load ratio for various
blends. It has been observed that there is a steady increase in mechanical efficiency for all the
blends as the load increases. Maximum mechanical efficiency has been obtained from blend
B20 and B40 for full load and it is 54.61% and 53.56% respectively. Mechanical efficiency
increases with increasing load for all the blends. The efficiency of the fuel blends is in
general very closer to that of diesel. The increase in efficiency for all the blends may be due
0
5
10
15
20
25
30
16 17 18
BTE
(%)
Compression ratio
DieselB20B40B60
IJSER

International Journal of Scientific & Engineering Research, Volume 7, Issue 3, March-2016 202 ISSN 2229-5518
IJSER © 2016 http://www.ijser.org
to improved quality of spray, high reaction activity in the fuel rich zone and decrease in heat
loss due to lower flame temperature of the blends than that of diesel.
Fig 4.2.3.1
Fig 4.2.3.2
4.2.4 Exhaust gas temperature
The variation of exhaust gas temperature for different compression ratio and for different
blends is shown in Fig.4.2.4.1. The result indicates that exhaust gas temperature decreases
for different blends when compared to that of diesel. As the compression ratio increases, the
0
10
20
30
40
50
60
0 10 20 30 40 50 60 70 80 90 100
Mec
hani
cal e
ffici
ency
(%)
Load(%)
DieselB20B40B60
42
44
46
48
50
52
54
56
16 17 18
Mec
hani
cal e
ffici
ency
(%)
Compression ratio
DieselB20B40B60
IJSER

International Journal of Scientific & Engineering Research, Volume 7, Issue 3, March-2016 203 ISSN 2229-5518
IJSER © 2016 http://www.ijser.org
exhaust gas temperature of various blends is lesser than that of diesel. The highest
temperature obtained is 324.53ºC for diesel for a compression ratio 18, whereas the
temperature is only 301.63ºC for the blend B40. The reason for the reduction in exhaust gas
temperature at increased compression ratio is due to the lower calorific value of blended fuel
as compared to the diesel and lower temperature, at the end of compression,
The variation of exhaust gas temperature with applied load for different bends is shown in
Fig 4.2.4.2.The exhaust gas temperature decrease for different blends when compared to that
of diesel. The highest temperature obtained is 324.53ºC for diesel for full load, whereas the
temperature is only 324.11ºC and 310.63ºC for the blend B20 and B40.
Fig 4.2.4.1
0
50
100
150
200
250
300
350
0 10 20 30 40 50 60 70 80 90 100
Exha
ust t
empe
ratu
re(°
C)
Load(%)
DieselB20B40B60IJSER

International Journal of Scientific & Engineering Research, Volume 7, Issue 3, March-2016 204 ISSN 2229-5518
IJSER © 2016 http://www.ijser.org
Fig 4.2.4.2
4.3 Combustion Analysis of Karanja oil methyl ester
4.3.1 Maximum combustion pressure.
The variation of combustion pressure with respect to crank angle for compression ratio 18 and
for different blends is shown in Fig.4.3.1.1. It shows almost the same pressure crank angle
characteristics for KOME blends and diesel. The variation of peak pressure with respect to load for different compression ratio and for
different blends is shown in Fig.4.3.1.2 The peak pressure depends on the amount of fuel
taking part in the uncontrolled phase of combustion, which is governed by the delay period
and spray envelop of the injected fuel. Larger the ignition delay more will be the fuel
accumulation, which finally results in a higher peak pressure. It is seen that the peak pressure
for diesel as well as KOME blends is almost the same at full load, the peak pressure value for
diesel and blends B20, B40, and B60 being 61.2 bar, 59.6 bar, 60.15 bar and 60.55 bar for
050
100150200250300350400450
16 17 18
Exha
ust t
empe
ratu
re(°
C)
Compression ratio
DieselB20B40B60
IJSER

International Journal of Scientific & Engineering Research, Volume 7, Issue 3, March-2016 205 ISSN 2229-5518
IJSER © 2016 http://www.ijser.org
respectively. It is observed that the cylinder pressure increased with load for all the fuel
operations. With increasing load, the amount of fuel supplied to the engine increase and due
to combustion of relatively more amount of fuel, the peak pressure of the in-cylinder gas is
more at higher load.
Fig 4.3.1.1
Fig 4.3.1.2
010203040506070
0 10 20 30 40 50 60 70 80 90 100
Max
imum
pre
ssur
e(B
ar)
Load(%)
DieselB20B40B60
0
10
20
30
40
50
60
70
16 17 18
Max
imum
pre
ssur
e(B
ar)
Compression ratio
DieselB20B40B60
IJSER

International Journal of Scientific & Engineering Research, Volume 7, Issue 3, March-2016 206 ISSN 2229-5518
IJSER © 2016 http://www.ijser.org
4.3.2 Combustion duration
It is difficult to define exactly the combustion duration of a diesel engine as the total
combustion process consists of the rapid premixed combustion, mixing controlled
combustion and the late combustion of fuel present in the fuel rich combustion products. The
combustion duration in general increases with load. At compression ratio 18, B60 gives better
combustion duration as compared to diesel. The variation of the total combustion duration
with different loads for different blends is shown in Fig 4.3.2.1. At full load, the combustion
duration for the fuel blends B20, B40,B60 and diesel is 45, 38,51 and 19 ºCA respectively.
As the calorific value of the biodiesel blend is lower than diesel, a higher quantity of fuel is
consumed to keep the engine speed stable at different loads. The decrease in combustion
duration is due to the efficient combustion of the injected fuel.
Fig 4.3.2.2 shows the variation of combustion duration with compression ratio for different
blends. With increase in compression ratio combustion duration increases. The oil blends
causes longer duration for combustion at lower compression ratio and less duration for
combustion at higher compression ratio.
Fig 4.3.2.1
0
10
20
30
40
50
60
0 10 20 30 40 50 60 70 80 90 100
Com
bust
ion
dura
tion(
Deg
)
Load(%)
DieselB20B40B60
IJSER

International Journal of Scientific & Engineering Research, Volume 7, Issue 3, March-2016 207 ISSN 2229-5518
IJSER © 2016 http://www.ijser.org
Fig 4.3.2.2
4.3.3. Net heat release rate
The net heat release rate at compression ratio 18 at 100% load with crank angle for
different KOME blends is given in Fig 4.3.3.1. The maximum heat release rate of diesel,
B20, B40, and B60 has been observed to be 53.2, 48.8, 47.7 and 45.07 J/ ºCA. The heat
release rate is analyzed based on the changes in crank angle variation of the cylinder. The
heat release rate of KOME blends decreases compared to that of diesel at full load. The heat
release rate of diesel is higher than oil blend due to its reduced viscosity and better spray
formation.
Fig 4.3.3.2.shows the variation of heat release rate with compression ratio for different
blends. Low compression ratio Heat release rate increases with the low compression ratios
and slightly decreases at higher compression ratio. This may be due to the air entrainment and
lower air/fuel mixing rate and effect of viscosity blends. The heat release rate of diesel is
higher than oil blend due to its reduced viscosity and better spray formation.
0
10
20
30
40
50
60
16 17 18
Com
bust
ion
dura
tion(
Deg
)
Compression ratio
DieselB20B40B60
IJSER

International Journal of Scientific & Engineering Research, Volume 7, Issue 3, March-2016 208 ISSN 2229-5518
IJSER © 2016 http://www.ijser.org
Fig 4.3.3.1
Fig 4.3.3.2
4.3.4 Mass fraction burnt
The variations of the mass fraction burnt with the crank angle for KOME blends and diesel at
compression ratio 18 at full load is given in Fig 4.3.4.1. The mass fraction burnt of blends is
slightly higher than that of diesel at full load. Due to the oxygen content of the blend, the
combustion is sustained in the diffusive combustion phase. The mass fraction burnt for the
fuel blend B40 is higher than that diesel for crank angle 350º-360º and it is closer for crank
angle 365º-380º. The highest rate of burning shows that the efficient rate of combustion. The
0
10
20
30
40
50
60
0 10 20 30 40 50 60 70 80 90 100
Max
imum
NH
R(J
/CA
)
Load(%)
DieselB20B40B60
010203040506070
16 17 18
Max
imum
NH
R(J
/CA
)
Compression ratio
DieselB20B40B60IJSER

International Journal of Scientific & Engineering Research, Volume 7, Issue 3, March-2016 209 ISSN 2229-5518
IJSER © 2016 http://www.ijser.org
engine operates in rich mixture and it reaches stoichiometric region at higher compression
ratio. More fuel is accumulated in the combustion phase and it causes rapid heat release.
Fig 4.3.4.1
4.3.5 Ignition delay
The most vital parameter in combustion analysis is ignition delay. The variation of ignition
delay with load is shown in Fig 4.3.5.1. It has observed that the ignition delay decreases with
biodiesel in the diesel blend with increase in load and increases in compression ratio. At
compression ratio 18 and 100% load condition, the ignition delay period of B20, B40 and
B60 is 5.5, 6.2, 6.5 ºCA higher than diesel. It is due to the higher cetane number, maximum
cylinder pressure and higher temperature.
Fig 4.3.5.2.shows the variation of ignition delay with compression ratio for different blends.
Ignition delay decrease with increase in compression ratio.
0102030405060708090
350 355 360 365 370 375 380
Mas
s fra
ctio
n bu
rned
(%)
Crank angle(Deg)
DieselB20B40B60
IJSER

International Journal of Scientific & Engineering Research, Volume 7, Issue 3, March-2016 210 ISSN 2229-5518
IJSER © 2016 http://www.ijser.org
Fig 4.3.5.1
Fig 4.3.5.2
4.3.6 Maximum combustion temperature
0
2
4
6
8
10
12
0 10 20 30 40 50 60 70 80 90 100
Igni
tion
dela
y(D
eg)
Load(%)
DieselB20B40B60
012345678
16 17 18
Igni
tion
dela
y(D
eg)
Compression ratio
DieselK10K20
IJSER

International Journal of Scientific & Engineering Research, Volume 7, Issue 3, March-2016 211 ISSN 2229-5518
IJSER © 2016 http://www.ijser.org
The variations of the maximum combustion temperature with loads for different blends
and diesel at compression ratio18 are given in Fig 4.3.6.1. B20 gives better combustion
temperature than diesel. Increasing load combustion temperature increases for all cases.
Fig 4.3.6.2 shows the variation of maximum combustion temperature with compression ratio
for different blends. It has been observed that increasing compression ratio combustion
temperature increases. B20 gives better combustion temperature than all other blends.
Fig 4.3.6.1
0200400600800
1000120014001600
0 10 20 30 40 50 60 70 80 90 100
Max
imum
com
bust
ion
tem
pera
ture
(ºC
)
Load(%)
DieselB20B40B60
1300132013401360138014001420144014601480
16 17 18
Max
imum
com
bust
ion
tem
pera
ture
(ºC
)
Compression ratio
DieselB20B40B60
IJSER

International Journal of Scientific & Engineering Research, Volume 7, Issue 3, March-2016 212 ISSN 2229-5518
IJSER © 2016 http://www.ijser.org
Fig 4.3.6.2
Fig 4.3.6.3
4.4 Emission analysis
4.4.1 Carbon monoxide emission
Fig 4.4.1.1 shows the variation of carbon monoxide emission of the blends and diesel for
various loads. The CO emission of the blend B40 and B20 is slightly less than diesel and it is
found to be higher for light and medium load. The CO emission of the blend B60 is more
than diesel. The proportion of CO increase due to rising temperature in the combustion
0200400600800
1000120014001600
320 330 340 350 360 370 380 390 400
Mea
n ga
s tem
pera
ture
(°C
)
Crank angle(Deg)
DieselB20B40B60IJSER

International Journal of Scientific & Engineering Research, Volume 7, Issue 3, March-2016 213 ISSN 2229-5518
IJSER © 2016 http://www.ijser.org
chamber, physical and chemical properties of the fuel, air-fuel ratio, lack of oxygen at high
speed, and smaller amount of time available for complete combustion
Fig 4.4.1.2 shows the variation of carbon monoxide emission of the blends and diesel with
various compression ratios. The CO emission of the blend B40 is close to diesel and it is
found to be higher for compression ratio 16. The other blends B20, B60 have slightly lesser
CO emission for compression ratio 16. It observed that by increasing compression ratio CO
emission decrease.
Fig 4.4.1.1
Fig 4.4.1.2
4.4.2Carbon dioxide emission
0
0.02
0.04
0.06
0.08
0.1
0.12
0 10 20 30 40 50 60 70 80 90 100
CO
(%)
Load(%)
DieselB20B40B60
0
0.05
0.1
0.15
0.2
0.25
0.3
0.35
16 17 18
CO
(%)
Compression ratio
DieselB20B40B60
IJSER

International Journal of Scientific & Engineering Research, Volume 7, Issue 3, March-2016 214 ISSN 2229-5518
IJSER © 2016 http://www.ijser.org
The variation of carbon dioxide emission with different loads is shown in Fig 4.4.2.1. More
amount of CO2 is an indication of complete combustion of fuel in the combustion chamber. It
also related to the exhaust gas temperature. CO2 emission of the blend B40 is slightly higher
than diesel. By increasing load CO2 emission increases.
The variation of carbon dioxide emission with different compression ratio is shown in Fig
4.4.2.2. The blend emits higher percentage of CO2 than diesel at lower compression ratios
and vice versa. CO2 emission of the blend B40 for compression ratio 16 is lesser due to
incomplete combustion and inadequate supply of oxygen. The accumulation of CO2 in the
atmosphere leads to many environmental problems like ozone depletion and global warming.
The CO2 emission from the combustion of bio fuels can be absorbed by the plants and the
carbon dioxide level and is kept constant in the atmosphere.
Fig 4.4.2.1
0
1
2
3
4
5
6
0 10 20 30 40 50 60 70 80 90 100
CO₂(
%)
Load(%)
DieselK10K20IJSER

International Journal of Scientific & Engineering Research, Volume 7, Issue 3, March-2016 215 ISSN 2229-5518
IJSER © 2016 http://www.ijser.org
Fig 4.4.2.2
4.4.3Hydrocarbon emission
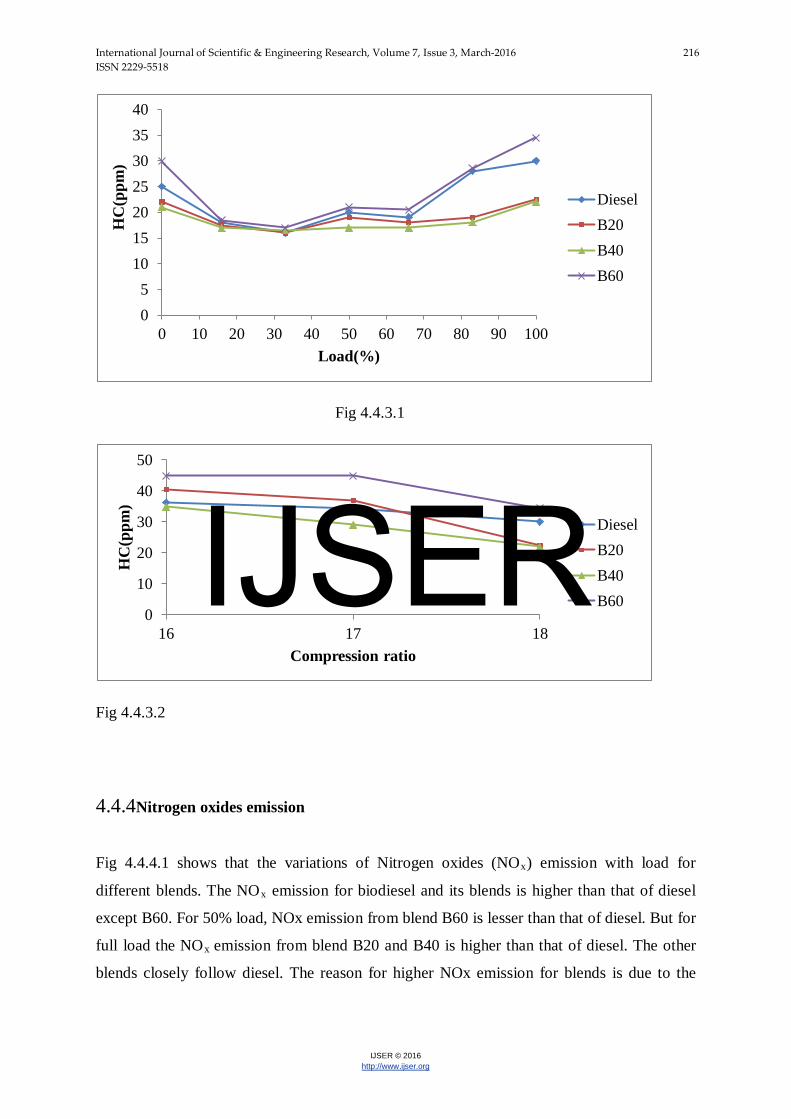
The variation of hydrocarbon emissions with load for different blends is plotted in Fig
4.4.3.1. The hydrocarbon emissions of various blends are higher at higher loads. The effect of
fuel viscosity and the fuel spray quality has been expected to produce some hydrocarbon
increases with vegetable oil fuels. It shows that the increase in load increase the hydrocarbon
emission for the blend B40. The other blends B20 and B60 lesser hydrocarbon emissions at
50% load than the diesel. Due to longer ignition delay, the accumulation of fuel in the
combustion chamber may cause higher hydrocarbon emission.
The variation of hydrocarbon emission with different compression ratios for different blends
is given in Fig 4.4.3.2. It shows that the hydrocarbon emission of various blends is higher at
higher compression ratios. In this research, it shows that the increase in compression ratio
increases the HC emission for blend B60. The other blends B20 and B40 produce lesser
hydrocarbon emissions at higher compression ratio than diesel. Due to longer ignition delay,
the accumulation of fuel in the combustion chamber may cause higher hydrocarbon emission.
44.14.24.34.44.54.64.74.84.9
5
16 17 18
CO₂(
%)
Compression ratio
DieselB20B40B60
IJSER
International Journal of Scientific & Engineering Research, Volume 7, Issue 3, March-2016 216 ISSN 2229-5518
IJSER © 2016 http://www.ijser.org
Fig 4.4.3.1
Fig 4.4.3.2
4.4.4Nitrogen oxides emission
Fig 4.4.4.1 shows that the variations of Nitrogen oxides (NOx) emission with load for
different blends. The NOx emission for biodiesel and its blends is higher than that of diesel
except B60. For 50% load, NOx emission from blend B60 is lesser than that of diesel. But for
full load the NOx emission from blend B20 and B40 is higher than that of diesel. The other
blends closely follow diesel. The reason for higher NOx emission for blends is due to the
05
10152025303540
0 10 20 30 40 50 60 70 80 90 100
HC
(ppm
)
Load(%)
DieselB20B40B60
0
10
20
30
40
50
16 17 18
HC
(ppm
)
Compression ratio
DieselB20B40B60IJSER

International Journal of Scientific & Engineering Research, Volume 7, Issue 3, March-2016 217 ISSN 2229-5518
IJSER © 2016 http://www.ijser.org
higher peak temperature. The NOx emission for diesel, B20,B40 and B60 for 50% load is 329
ppm, 384 ppm, 330 ppm and 250 ppm respectively.
The variation of nitrogen oxides (NOx) emission with respect to different compression ratio
for different blends is shown in Fig 4.4.4.2. The NOx emission for diesel and other blends
increase with increase of compression ratio. From the figure, it is obvious that for
compression ratio 18, NOx emission from the blendB20 and B40 is higher than that of diesel.
The other blends closely follow diesel. The reason for higher NOx emission for blends is due
to the higher peak temperature. The NOx emission for diesel, B20, B40 and B60 for
compression ratio 18 is 550ppm, 634.5ppm, 552ppm and 490ppm respectively.
Fig 4.4.4.1
Fig 4.4.4.2
0
100
200
300
400
500
600
700
0 10 20 30 40 50 60 70 80 90 100
NO
X(p
pm)
Load(%)
DieselB20B40B60
0100200300400500600700
16 17 18
NO
X(p
pm)
Compression ratio
DieselB20B40B60
IJSER

International Journal of Scientific & Engineering Research, Volume 7, Issue 3, March-2016 218 ISSN 2229-5518
IJSER © 2016 http://www.ijser.org
4.4.5Smoke opacity
Fig 4.4.5.1.shows that the variations of smoke opacity with load for different blends. Smoke
opacity increase with increase in load. B40 and B60 give higher smoke opacity than diesel.
The variation of smoke opacity with respect to different compression ratio for different
blends is shown in Fig 4.4.5.2. Smoke opacity decrease with increase in compression ratio.
B40 and B60 give higher smoke opacity than that of B20 and diesel. The smoke opacity for
diesel, B20, B40 and B60 for compression ratio 18 is 88.75%, 71.5%, 90% and 94%
respectively.
Fig 4.4.5.1
Fig 4.4.5.2
0
20
40
60
80
100
0 10 20 30 40 50 60 70 80 90 100
Smok
e O
paci
ty(%
)
Load(%)
DieselB20B40B60
0
20
40
60
80
100
120
16 17 18
Smok
e O
paci
ty(%
)
Compression ratio
DieselB20B40B60
IJSER

International Journal of Scientific & Engineering Research, Volume 7, Issue 3, March-2016 219 ISSN 2229-5518
IJSER © 2016 http://www.ijser.org
4.5 PERFORMANCE ANALYSIS OF NEAT KARANJA
4.5.1 Brake specific fuel consumption
The brake specific fuel consumption decreases with increase in load and K10 gives less
BSFC compared to K20 and diesel.. it can be seen from Fig 4.5.1.1 that with increase in
blend %age of karanja oil BSFC increasing this is due to the decrease in calorific value and
higher density of karanja oil for the higher blends. The BSFC varies with diesel, K10 and
K20 at full load is found to be 0.34 kg/kWh, 0.33kg/kWh, 0.35kg/kWh respectively.
Form Fig 4.5.1.2 it can be observed that the brake specific energy consumption decreases
with the increase in compression ratio. The BSFC for blend K20 is found to be higher
compared to that of diesel. K10 shows less BSFC as compared to K10 and diesel at all
compression ratio.
IJSER

International Journal of Scientific & Engineering Research, Volume 7, Issue 3, March-2016 220 ISSN 2229-5518
IJSER © 2016 http://www.ijser.org
Fig 4.5.1.1
Fig 4.5.1.2
4.5.2 Brake thermal efficiency
The variation of brake thermal efficiency (BTE) for different loads and for different
fuels is given in Fig 4.5.2.1. It is seen that there is a steady increase in efficiency with
increases in load in all the fuel operations. It is happened due to reduction in heat loss and
increase in power developed with increase in load. The engine BTE at full load for diesel,
K10, and K20 fuels is 24.9%, 26.63%, and 24.1% respectively. It is also observed that the
BTE of the blend K20 is slightly lower than that of the diesel and K10 is higher than diesel.
0
0.2
0.4
0.6
0.8
1
1.2
0 10 20 30 40 50 60 70 80 90 100
BSF
C(K
g/kW
h)
Load(%)
DieselK10K20
00.050.1
0.150.2
0.250.3
0.350.4
0.45
16 17 18
BSF
C(K
g/kW
h)
Compression Ratio
DieselK10K20
IJSER

International Journal of Scientific & Engineering Research, Volume 7, Issue 3, March-2016 221 ISSN 2229-5518
IJSER © 2016 http://www.ijser.org
This may be due to higher viscosity of the blend k20 resulting in poorly formed fuel spray
and air entrainment affecting the combustion in the engine and further due to lower volatility
of vegetable oil.
The variation of brake thermal efficiency (BTE) for different compression ratio and for
different blends is given in Fig 4.5.2.2 . It is observed that the BTE of the blend K10 is
higher than that of the diesel at all compression ratio. BTE also gets increased for all the fuel
types tested. BTE is directly proportional to the compression ratio.
Fig 4.5.2.1
Fig 4.5.2.2
4.5.3 Mechanical efficiency
Fig 4.5.3.1 shows that the variation of mechanical efficiency with load for various blends. It
has been observed that there is a steady increase in mechanical efficiency for diesel and
blends as the load increases. Maximum mechanical efficiency has been obtained from blend
0
5
10
15
20
25
30
0 10 20 30 40 50 60 70 80 90 100
BTE
(%)
Load(%)
DieselK10K20
05
1015202530
16 17 18
BTE
(%)
Compression ratio
DieselK10K20
IJSER

International Journal of Scientific & Engineering Research, Volume 7, Issue 3, March-2016 222 ISSN 2229-5518
IJSER © 2016 http://www.ijser.org
K10 at 50% load i.e. 35.41%. The efficiency of the fuel blends is in general very closer to
that of diesel. The increase in efficiency for all the blends may be due to improved quality of
spray, high reaction activity in the fuel rich zone and decrease in heat loss due to lower flame
temperature of the blends than that of diesel. At full load diesel gives maximum mechanical
efficiency as compared to K10 and K20. The mechanical efficiency at full load for diesel,
K10, and K20 fuels are 52.32%, 35.41%,and 32.56% respectively.
The variations of mechanical efficiency with compression ratio for various blends are shown
in Fig 4.5.3.2. It has been observed that the mechanical efficiency increases with compression
ratio and higher in higher compression ratio. Mechanical efficiency of diesel is higher than
K10 and K20 at all compression ratios. Mechanical efficiency increases with increasing
compression ratio for all the blends.
Fig 4.5.3.1
0
10
20
30
40
50
60
0 10 20 30 40 50 60 70 80 90 100
Mec
hnic
al e
ffici
ency
(%)
Load(%)
DieselK10K20
IJSER

International Journal of Scientific & Engineering Research, Volume 7, Issue 3, March-2016 223 ISSN 2229-5518
IJSER © 2016 http://www.ijser.org
Fig 4.5.3.2
4.5.4 Exhaust gas temperature
The variation of exhaust gas temperature with applied load for different bends is shown in
Fig 4.5.4.1. The exhaust gas temperature increases with increase in loadThe exhaust gas
temperature decrease for different blends when compared to that of diesel. The highest
temperature obtained is 324.53ºC for diesel for full load, whereas the temperature is only
317.93ºC and 310.39ºC for the blend K10 and K20.It may be due to energy content in diesel
is higher as compared to K10 and K20.
The variation of exhaust gas temperature for different compression ratio and for different
blends is shown in Fig 4.5.4.2.The exhaust gas temperature decreases with increase in
compression ratio. The result indicates that exhaust gas temperature decreases for different
blends when compared to that of diesel. As the compression ratio increases, the exhaust gas
temperature of various blends is lesser than that of diesel. The reason for the reduction in
exhaust gas temperature at increased compression ratio is due to lower temperature, at the
end of compression,
0
10
20
30
40
50
60
16 17 18
Mec
hani
cal e
ffici
ency
(%)
Compression ratio
DieselK10K20
IJSER

International Journal of Scientific & Engineering Research, Volume 7, Issue 3, March-2016 224 ISSN 2229-5518
IJSER © 2016 http://www.ijser.org
Fig 4.5.4.1
Fig 4.5.4.2
4.6 Combustion analysis of neat Karanja
4.6.1 Combustion pressure
The variation of combustion pressure with load for different blends is shown in Fig 4.6.1.1.
It shows that increasing load combustion pressure increases. It shows that diesel gives
maximum pressure as compared toK10 and K20. It is seen that the maximum pressure for
diesel as well as karanja oil blends is almost the same at full load, the maximum pressure
value for diesel and blends K10 and K20 being 61.2 bar, 58.93 bar, and 59.19 bar
respectively. The peak pressure depends on the amount of fuel taking part in the uncontrolled
050
100150200250300350
0 10 20 30 40 50 60 70 80 90 100
Exha
ust t
empe
ratu
re(°
C)
Load(%)
DieselK10K20
050
100150200250300350400
16 17 18
Exha
ust t
empe
ratu
re(°
C)
Compression ratio
DieselK10K20IJSER

International Journal of Scientific & Engineering Research, Volume 7, Issue 3, March-2016 225 ISSN 2229-5518
IJSER © 2016 http://www.ijser.org
phase of combustion, which is governed by the delay period and spray envelop of the injected
fuel.
The variation of combustion pressure for different compression ratio and for different blends
is shown in Fig 4.6.1.2.It shows that increasing compression ratio, combustion pressure
increases. . It shows that diesel gives maximum pressure as compared toK10 and K20.
Fig 4.6.1.1
Fig 4.6.1.2
4.6.2 . Combustion duration
010203040506070
0 10 20 30 40 50 60 70 80 90 100
Max
imum
pre
ssur
e(B
ar)
Load(%)
DieselK10K20
010203040506070
16 17 18
Max
imum
pre
ssur
e(B
ar)
Compression ratio
DieselK10K20
IJSER

International Journal of Scientific & Engineering Research, Volume 7, Issue 3, March-2016 226 ISSN 2229-5518
IJSER © 2016 http://www.ijser.org
It is difficult to define exactly the combustion duration of a diesel engine as the total
combustion process consists of the rapid premixed combustion, mixing controlled
combustion and the late combustion of fuel present in the fuel rich combustion products. The
combustion duration in general increases with load. The variation of the total combustion
duration with different loads for different blends is shown in Fig 4.6.2.1. At full load, the
combustion duration for the fuel blends K10, K20 and diesel are 47, 77 and 19 ºCA
respectively. As the calorific value of the karanja oil blend is lower than diesel, a higher
quantity of fuel is consumed to keep the engine speed stable at different loads. The decrease
in combustion duration is due to the efficient combustion of the injected fuel. K20 gives
higher combustion duration than other.
Fig 4.6.2.2 shows the variation of combustion duration with compression ratio for different
blends. Increase in compression ratio combustion duration increases. The oil blends causes
longer duration for combustion at lower compression ratio and less duration for combustion
at higher compression ratio. K20 gives higher combustion duration than other.
Fig 4.6.2.1
0102030405060708090
0 10 20 30 40 50 60 70 80 90 100
Com
bust
ion
dura
tion
(Deg
)
Load(%)
DieselK10K20
IJSER

International Journal of Scientific & Engineering Research, Volume 7, Issue 3, March-2016 227 ISSN 2229-5518
IJSER © 2016 http://www.ijser.org
Fig 4.6.2.2
4.6.3.Net Heat release rate
The variation of the total combustion duration with different loads for different blends is
shown in Fig 4.6.3.1. Increasing load heat release rate increases. The maximum heat release
rate of diesel, K10, and K20 at full load has been observed to be 53.2, 47.2 and 41.5J/ ºCA.
The heat release rate is analyzed based on the changes in crank angle variation of the
cylinder. The heat release rate of karanja oil blends decreases compared to that of diesel at all
load. The heat release rate of diesel is higher than oil blend due to its reduced viscosity and
reduction of air entrainment and fuel-air mixing rates.
Fig 4.6.3.2 shows the variation of heat release rate with compression ratio for different
blends. Low compression ratio Heat release rate increases with the low compression ratios
and slightly decreases at higher compression ratio. This may be due to the air entrainment and
lower air/fuel mixing rate and effect of viscosity blends. The heat release rate of diesel is
higher than oil blend due to its reduced viscosity and better spray formation.
0102030405060708090
16 17 18
Com
bust
ion
dura
tion
(Deg
)
Compression ratio
DieselK10K20
IJSER

International Journal of Scientific & Engineering Research, Volume 7, Issue 3, March-2016 228 ISSN 2229-5518
IJSER © 2016 http://www.ijser.org
Fig 4.6.3.1
Fig 4.6.3.2
4.6.4 Mass fraction burnt
The variations of the mass fraction burnt with the crank angle for karanja oil blends and
diesel at compression ratio 18 at full load is given in Fig 4.6.4.1, due to the oxygen content of
the blend, the combustion is sustained in the diffusive combustion phase. Diesel gives higher
mass fraction burnt than other blends. The highest rate of burning shows that the efficient rate
of combustion. The engine operates in rich mixture and it reaches stoichiometric region at
higher compression ratio. More fuel is accumulated in the combustion phase and it causes
rapid heat release.
0
10
20
30
40
50
60
0 10 20 30 40 50 60 70 80 90 100
Max
imum
NH
R(J
/CA
)
Load(%)
DieselK10K20
010203040506070
16 17 18
Max
imum
NH
R(J
/CA
)
Compression ratio
DieselK10K20IJSER

International Journal of Scientific & Engineering Research, Volume 7, Issue 3, March-2016 229 ISSN 2229-5518
IJSER © 2016 http://www.ijser.org
Fig 4.6.4.1
4.6.5 Ignition delay
The most vital parameter in combustion analysis is ignition delay. The variation of the
ignition delay with different loads for different blends is shown in Fig 4.6.5.1. It has observed
that the ignition delay decreases with karanja oil in the diesel blend with increase in load and
increases in compression ratio. K20 give higher ignition delay than diesel. It is because more
fuel required due to lower calorific value.
Fig 4.6.5.2 shows the variation of ignition delay with compression ratio for different blends.
Ignitiondelay decrease with increase in compression ratio.
0
20
40
60
80
100
350 355 360 365 370 375 380Mas
s fra
ctio
n bu
rned
(%)
Crank angle(Deg)
DieselK10K20
0
2
4
6
8
10
12
0 10 20 30 40 50 60 70 80 90 100
Igni
tion
dela
y (D
eg)
Load(%)
DieselK10K20
IJSER

International Journal of Scientific & Engineering Research, Volume 7, Issue 3, March-2016 230 ISSN 2229-5518
IJSER © 2016 http://www.ijser.org
Fig 4.6.5.1
Fig 4.6.5.2
4.6.6 Maximum combustion temperature
The variations of the maximum combustion temperature with loads for different blends are
given in Fig 4.6.6.1. Increasing load combustion temperature increases for all cases. Diesel
gives better combustion temperature than other blends. The maximum combustion
temperature of diesel, K10, and K20 at full load has been observed to be 1429.04, 1425.74
and 1400.01ºC respectively.
Fig 4.6.6.2 shows the variation of maximum combustion temperature with compression ratio
for different blends. It has been observed that increasing compression ratio combustion
temperature increases. Diesel gives better combustion temperature than all other blends. Due
to more fuel accumulated in the combustion chamber.
012345678
16 17 18
Igni
tion
dela
y(D
eg)
Compression ratio
DieselK10K20
IJSER

International Journal of Scientific & Engineering Research, Volume 7, Issue 3, March-2016 231 ISSN 2229-5518
IJSER © 2016 http://www.ijser.org
Fig 4.6.6.1
Fig 4.6.6.2
0200400600800
1000120014001600
0 10 20 30 40 50 60 70 80 90 100
Max
imum
com
bust
ion
tem
pera
ture
(°C)
Load(%)
DieselK10K20
1370
1380
1390
1400
1410
1420
1430
1440
16 17 18
Max
imum
com
bust
ion
tem
pera
ture
(ºC
)
Compression ratio
DieselK10K20
IJSER

International Journal of Scientific & Engineering Research, Volume 7, Issue 3, March-2016 232 ISSN 2229-5518
IJSER © 2016 http://www.ijser.org
Fig 4.6.6.3
4.7 Emission analysis of Karanja oil 4.7.1 Carbon monoxide emission
Fig 4.7.1.1 shows the variation of carbon monoxide emission of the blends and diesel for
various loads. CO emission is higher at lower load then decreases with increase in load and at
higher load it again increases. The CO emission of the blend K10 and K20 is more at lower
load compared to diesel, it may be due to higher viscosity and improper spray pattern
resulting in incomplete combustion. At full load diesel gives highest CO emission.
Fig 4.7.1.2 shows the variation of carbon monoxide emission of the blends and diesel with
various compression ratios. . CO emission decreases with increase in compression ratio. The
CO emission of diesel is minimum compared to K10 and K20. This may be due to, at higher
compression ratio air fuel mixing is better.
0
200
400
600
800
1000
1200
1400
1600
320 330 340 350 360 370 380 390 400
Mea
n ga
s tem
pera
ture
(˚C
)
Crank angle(Deg)
DieselK10K20
IJSER

International Journal of Scientific & Engineering Research, Volume 7, Issue 3, March-2016 233 ISSN 2229-5518
IJSER © 2016 http://www.ijser.org
Fig 4.7.1.1
Fig 4.7.1.2
4.7.2 Carbon dioxide emission
The variation of carbon dioxide emission with different loads is shown in Fig 4.7.2.1. CO2
emission increases with increase in load. In the range of whole engine load CO2 emission of
diesel fuel is lower than other fuel .This is because vegetable oil contains oxygen
element,carbon content is relatively lower in the same volume of fuel consumed at the same
engine load. More amount of CO2 is an indication of complete combustion of fuel in the
combustion chamber. CO2 emission of the blend K20 is slightly higher than diesel at all
loads. It is probably due to higher oxygen availability.
0
0.02
0.04
0.06
0.08
0.1
0.12
0.14
0 10 20 30 40 50 60 70 80 90 100
CO
(%)
Load(%)
DieselK10K20
0
0.05
0.1
0.15
0.2
0.25
0.3
0.35
16 17 18
CO
(%)
Compression ratio
DieselK10K20IJSER

International Journal of Scientific & Engineering Research, Volume 7, Issue 3, March-2016 234 ISSN 2229-5518
IJSER © 2016 http://www.ijser.org
The variation of carbon dioxide emission with different compression ratio is shown in Fig
4.7.2.2. The blend emits higher percentage of CO2 than diesel at lower compression ratios
and vice versa. The CO2 emission from the combustion of bio fuels can be absorbed by the
plants and the carbon dioxide level and is kept constant in the atmosphere.
Fig 4.7.2.1
Fig 4.7.2.2
4.7.3 Hydrocarbon emission
0
1
2
3
4
5
6
0 10 20 30 40 50 60 70 80 90 100
CO₂(
%)
Load(%)
DieselK10K20
0
1
2
3
4
5
6
16 17 18
CO₂(
%)
Compression ratio
DieselK10K20
IJSER

International Journal of Scientific & Engineering Research, Volume 7, Issue 3, March-2016 235 ISSN 2229-5518
IJSER © 2016 http://www.ijser.org
The variation of hydrocarbon emissions with load for different blends is plotted in Fig
4.7.3.1. Increased HC emissions clearly show that the combustion in the engine is not proper.
It is very clear that increasing the blend percentage of karanja oil increase the HC emissions.
All blends have shown higher HC emissions at 50% load. This may be due to poor
atomization of the blended fuel because of higher viscosity. Physical properties of fuels such
as density and viscosity influence the HC emissions. The blend K10 has higher HC emissions
at full load.
The variation of hydrocarbon emission with different compression ratios for different blends
is given in Fig 4.7.3.2. It shows that the hydrocarbon emissions of various blends are lower
at higher compression ratios. Blend K20 gives higher HC emission at lower compression
ratio but at higher compression ratio K10 gives higher.
Fig 4.7.3.1
05
1015202530354045
0 10 20 30 40 50 60 70 80 90 100
HC
(ppm
)
Load(%)
DieselK10K20IJSER

International Journal of Scientific & Engineering Research, Volume 7, Issue 3, March-2016 236 ISSN 2229-5518
IJSER © 2016 http://www.ijser.org
Fig 4.7.3.2
4.7.4 Nitrogen oxides emission
Fig 4.7.4.1 shows that the variations of Nitrogen oxides (NOx) emission with load for
different blends. NOx emission increases with increase in load. This is properly due to higher
combustion temperature in the engine cylinder with increasing load. It is also observed that
with increasing the percentage of Karanjo oil blend there is a trend of decreasing NOx
emission. NOx emission for diesel, K20, and K20 are 550ppm, 493ppm, and 524ppm at full
load.The limitation is higher viscosity of these higher karanja oil blends.
The variation of nitrogen oxides (NOx) emission with respect to different compression ratio
for different blends is shown in Fig 4.7.4.2. The NOx emission for diesel and other blends
increase with increase of compression ratio. Diesel gives higher NOx emission than other
blends. The other blends closely follow diesel.
0
10
20
30
40
50
60
16 17 18
HC
(ppm
)
Compression ratio
DieselK10K20
IJSER

International Journal of Scientific & Engineering Research, Volume 7, Issue 3, March-2016 237 ISSN 2229-5518
IJSER © 2016 http://www.ijser.org
Fig 4.7.4.1
Fig 4.7.4.2
4.7.5 Smoke opacity
Fig 4.7.5.1 shows that the variations of smoke opacity with load for different blends. Smoke opacity increase with increase in load. K10 and K20 give higher smoke opacity than diesel. It is observed that K10 and K20 have smoke opacity less than diesel at nearly 70% load. Hence
0
100
200
300
400
500
600
700
0 10 20 30 40 50 60 70 80 90 100
NO
X(p
pm)
Load(%)
DieselK10K20
0
100
200
300
400
500
600
16 17 18
NO
X(p
pm)
Compression ratio
DieselK10K20
IJSER

International Journal of Scientific & Engineering Research, Volume 7, Issue 3, March-2016 238 ISSN 2229-5518
IJSER © 2016 http://www.ijser.org
it can be conclude that K20 would be better blend from other. The smoke opacity for diesel, K10, and K20 at full load is 88.7%, 96%, and 97.8% respectively.
The variation of smoke opacity with respect to different compression ratio for different blends is shown in Fig 4.7.5.2. Smoke opacity increase with increase in compression ratio. K20 give higher smoke opacity than that of K10 and diesel.
Fig 4.7.5.1
Fig 4.7.5.2
0
20
40
60
80
100
120
0 10 20 30 40 50 60 70 80 90 100
Smok
e O
paci
ty(%
)
Load(%)
DieselK10K20
70
75
80
85
90
95
100
16 17 18
Smok
e O
paci
ty(%
)
Compression ratio
DieselK10K20
IJSER

International Journal of Scientific & Engineering Research, Volume 7, Issue 3, March-2016 239 ISSN 2229-5518
IJSER © 2016 http://www.ijser.org
5. CONCLUSION:
The performance, emission and combustion characteristics of a dual fuel variable
compression ratio engine with Karanja oil bio-diesel, Karanja oil and diesel blends have been
investigated and compared with that of diesel. The experimental results confirm that the BTE,
SFC, exhaust gas temperature, mechanical efficiency and torque of variable compression
ratio engine, is a function of bio diesel blend, load and compression ratio. For the similar
operating conditions, engine performance reduced with increase in bio-diesel percentage in
the blend. However by increasing the compression ratio the engine performance varied and it
becomes comparable with that of diesel. The following conclusions is drawn from this
investigation:
• The brake thermal efficiency of the blend B40 is slightly higher than that of diesel at
compression ratio 18. The specific fuel consumption of the blend B40 is lower than
that of all other blends and diesel. The engine BTE at full load for diesel, B20,
B40,and B60 fuels is 24.9%, 26.02%, 28.44% and 24.1% respectively. The brake
specific fuel consumption of the blend B40 at the compression ratio of 18 is
0.32kg/kWh whereas for diesel it is 0.34kg/kWh.
• There is a steady increase in mechanical efficiency for all the blends as the load
increases. Maximum mechanical efficiency has been obtained from blend B20 and
B40 for full load and it is 54.61% and 53.56% respectively. The exhaust gas
temperature decreases for different blends when compared to that of diesel. As the
compression ratio increases, the exhaust gas temperature of various blends is lesser
than that of diesel.
IJSER

International Journal of Scientific & Engineering Research, Volume 7, Issue 3, March-2016 240 ISSN 2229-5518
IJSER © 2016 http://www.ijser.org
• Increasing compression ratio torque increases. B20 gives better torque than diesel.
The highest torque obtained is 22.22Nm for B20 for a compression ratio 18, whereas
the torque is only 21.93Nm for diesel.
• Combustion analysis reveals almost the same pressure crank angle characteristics for
KOME blends and diesel. The peak pressure has been observed to be 61.2 bar, 59.6
bar, 60.15 bar and 60.55 bar for diesel and blends B20, B40, and B60 respectively at
full load.
• The combustion duration in general increases with load. At compression ratio 18,
B60 gives better combustion duration as compared to diesel. With increase in
compression ratio combustion duration increases.
• The maximum heat release rate of diesel, B20, B40,and B60 has been observed to be
53.2, 48.8, 47.7 and 45.07 J/ ºCA. The heat release rate of KOME blends decreases
compared to that of diesel at full load.
• The mass fraction burnt of blends is slightly higher than that of diesel at full load. The
mass fraction burnt for the fuel blend B40 is higher than that diesel for crank angle
350º-360º and it is closer for crank angle 365º-380º.
• It has observed that the ignition delay decreases with biodiesel in the diesel blend with
increase in load and increases in compression ratio. At compression ratio 18 and
100% load condition, the ignition delay period of B20, B40 and B60 is 5.5, 6.2, 6.5
ºCA higher than diesel.
• B20 gives better combustion temperature than diesel. Increasing load combustion
temperature increases for all cases. It has been observed that increasing compression
ratio combustion temperature increases. B20 gives better combustion temperature
than all other blends.
• The CO emission of the blend B40 and B20 is slightly less than diesel and it is found
to be higher for light and medium load. The CO emission of the blend B60 is more
than diesel. The CO emission of the blend B40 is close to diesel and it is found to be
higher for compression ratio 16. The other blends B20, B60 have slightly lesser CO
emission for compression ratio 16. It observed that by increasing compression ratio
CO emission decreases.
• CO2 emission of the blend B40 is slightly higher than diesel. By increasing load CO2
emission increases. The blend emits higher percentage of CO2 than diesel at lower
IJSER

International Journal of Scientific & Engineering Research, Volume 7, Issue 3, March-2016 241 ISSN 2229-5518
IJSER © 2016 http://www.ijser.org
compression ratios and vice versa. CO2 emission of the blend B40 for compression
ratio 16.
• The hydrocarbon emissions of various blends is higher at higher loads. It shoes that
the increase in load increase the hydrocarbon emission for the blend B40. It shoes that
the hydrocarbon emission of various blends is lower at higher compression ratios. The
blends B20 and B40 produce lesser hydrocarbon emissions at higher compression
ratio than diesel except B60.
• The NOx emission for biodiesel and its blends is higher than that of diesel except
B60. . The NOx emission for diesel and other blends increase with increase of
compression ratio.
• Smoke opacity increase with increase in load. B40 and B60 gives higher smoke
opacity than diesel. Smoke opacity decrease with increase in compression ratio. B40
and B60 gives higher smoke opacity than that of B20 and diesel.
•
• The performance, emission and combustion characteristics of a dual fuel variable
compression ratio engine with Karanja oil and diesel blends have been
investigated and compared with that of diesel.
• The experimental results confirm that the BTE, SFC, exhaust gas temperature,
mechanical efficiency and torque of variable compression ratio engine, is a
function of bio diesel blend, load and compression ratio. For the similar operating
conditions, engine performance reduced with increase in bio-diesel percentage in
the blend. However by increasing the compression ratio the engine performance
varied and it becomes comparable with that of diesel.
• The following conclusions is drawn from this investigation was found out. K10
gives less BSFC compared to K20 and diesel. . The engine BTE at full load for
diesel, K10, and K20 fuels is 24.9%, 26.63%,and 24.1% respectively. It is also
observed that the BTE of the blend K20 is slightly lower than that of the diesel and
K10 is higher than diesel.
• The highest temperature obtained is 324.53ºC for diesel for full load, whereas the
temperature is only 317.93ºC and 310.39ºC for the blend K10 and K20.It may be
due to energy content in diesel is higher as compared to K10 and K20. CO, HC
IJSER

International Journal of Scientific & Engineering Research, Volume 7, Issue 3, March-2016 242 ISSN 2229-5518
IJSER © 2016 http://www.ijser.org
emission of K10 and K20 is lower than diesel and NOx emission was higher than
diesel.
REFFERENCE
[1]Varuvel EG,Mrad N,Tazerout M,Aloui F. Experimental analysis of bio fuel as an alternative fuel for diesel engines. Applied Energy 2012; 94: 224-231.
[2] Swaminathan C, Sarangan J. Performance and exhaust emission characteristics of a CI engine fueled with biodiesel (fish oil) with DEE as additive. Biomass and bio energy 2012; 39:168-174
[3] Muralidharan K,Vasudevan D,Sheeba K.N..Performance, emission and combustion
characteristics of biodiesel fuelled variable compression ratio engine. Energy 2011; 36:5385-
5393.
[4] Muralidharan K,Vasudevan D. Performance, emission and combustion
characteristics of a variable compression ratio engine using methyl esters of waste cooking
oil and diesel blends. Applied Energy 2011; 88:3959-3968.
[5] Jindal S,Nandwana BP, RathoreNS, VashisthaV. Experimental investigation of the effect of
compression ratio and injection pressure in a direct injection diesel engine running on
Jatropha methyl ester. Applied Thermal Engineering 2010; 30:442-8.
[6] Saravanan S, Nagarajan G, Lakshmi Narayana Rao G, Sampath S. Combustion
characteristics of a stationary diesel engine fuelled with a blend of crude rice
bran oil methyl ester and diesel. Energy 2010; 35:94-100
[7] Prem Anand B, Saravanan CG, Ananda Srinivasan C. Performance and exhaust
emission of turpentine oil powered direct injection diesel engine. Renewable
Energy 2010;35:1179-84
[8] Haik Yousef, Selim Mohamed YE, Abdulrehman Tahir. Combustion of algae oil
methyl ester in an indirect injection diesel engine. Energy 2011; 36:1827-35.
IJSER
International Journal of Scientific & Engineering Research, Volume 7, Issue 3, March-2016 243 ISSN 2229-5518
IJSER © 2016 http://www.ijser.org
[9] Kalam MA, Masjuki HH, Jayed MH, Liaquat AM. Emission and performance
characteristics of an indirect ignition diesel engine fuelled with waste cooking
oil. Energy 2011; 36:397-402.
[10] Mani M, Nagarajan G, Sampath S. Characterisation and effect of using waste plastic oil and diesel fuel blends in compression ignition engine. Energy 2011; 36:212-9.
[11] Gumus MA. Comprehensive experimental investigation of combustion and
heat release characteristics of a biodiesel (hazelnut kernel oil methyl ester)
fueled direct injection compression ignition engine. Fuel 2010; 89:2802-14.
[12] Celikten Ismet, Koca Atilla, Arslan Mehmet Ali. Comparison of performance
and emissions of diesel fuel, rapeseed and soybean oil methyl esters injected
at different pressures. Renewable Energy 2010; 35:814-20
[13]A.S. Ramadhas, C. Muraleedharan, S. Jayaraj, Performance and emission evaluation of a diesel engine fueled with methyl esters of rubber seed oil, Renewable Energy 30 (2005) 1789–1800. [12]Arul Mozhi Selvan V, Anand RB, Udayakumar M. Combustion characteristics of
Diesohol using bio diesel as an additive in a direct injection ignition engine under
various compression ratios.Energy & Fuels 2009 ; 23:5413-22.
[14]Satyanarayana M, Muraleedharan C.A comparative study of vegetable oil methyl esters
(biodiesels). Energy 2011; 36:2129-37.
[15]Devan PK, Mahalakshmi NV. Study of the performance, emission and combustion
characteristics of a diesel engine using poon oil e based fuels.Fuel Processing Technology
2009;90:513-9
[16]Ramadhas AS, Muraleedharan C, Jayaraj S. Performance and emission evaluation of a
diesel engine fueled with methyl esters of rubber seed oil. Renewable Energy 2005; 30:1789–
800.
IJSER