combustion, gasification & propulsion laboratory (cgpl) department of aerospace engineering...
TRANSCRIPT

Combustion, Gasification & Propulsion Laboratory (CGPL)Combustion, Gasification & Propulsion Laboratory (CGPL)Department of Aerospace EngineeringDepartment of Aerospace Engineering
Indian Institute of Science, Bangalore 560 012Indian Institute of Science, Bangalore 560 012http://cgpl.iisc.ernet.inhttp://cgpl.iisc.ernet.in

The Biomass Resource Mapping InitiativeThe Biomass Resource Mapping Initiative

Some of the Key-Aspects for the MappingSome of the Key-Aspects for the Mapping
1.1. Integration of Remote Sensing Data (RSD) into Integration of Remote Sensing Data (RSD) into GIS layersGIS layers
2.2. The statistical biomass data - analysis and compilationThe statistical biomass data - analysis and compilation
3.3. Graphical Vectorisation for the base GIS layersGraphical Vectorisation for the base GIS layers
4.4. Strategies to identify Crop from RSD by their NDVI of LU signaturesStrategies to identify Crop from RSD by their NDVI of LU signatures
5.5. Strategies for Enhanced Reliability for Crop Identification – use of Strategies for Enhanced Reliability for Crop Identification – use of NDVI and Rainfall parameters with AI (artificial intelligence) NDVI and Rainfall parameters with AI (artificial intelligence) techniquestechniques
6.6. Options for comprehensive query responses for the usersOptions for comprehensive query responses for the users
7.7. Options for dynamic queries with graphical and tabular resultsOptions for dynamic queries with graphical and tabular results
8.8. Resolve the data spatially to taluk or block levelResolve the data spatially to taluk or block level
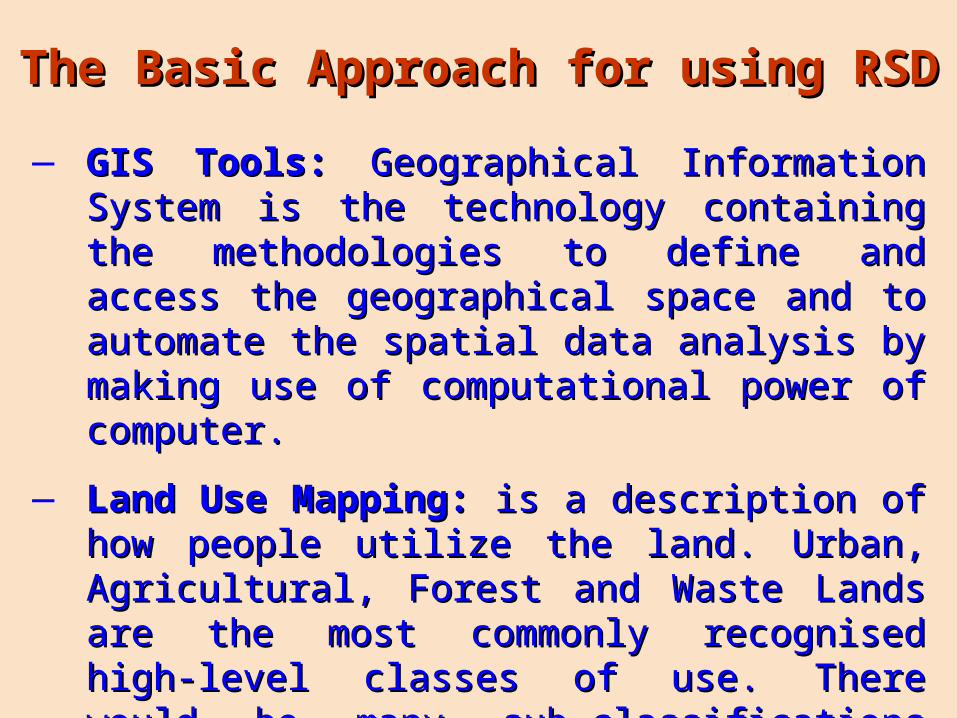
― GIS Tools:GIS Tools: Geographical Information System is the Geographical Information System is the technology containing the methodologies to define and technology containing the methodologies to define and access the geographical space and to automate the access the geographical space and to automate the spatial data analysis by making use of computational spatial data analysis by making use of computational power of computer.power of computer.
― Land Use Mapping:Land Use Mapping: is a description of how people is a description of how people utilize the land. Urban, Agricultural, Forest and Waste utilize the land. Urban, Agricultural, Forest and Waste Lands are the most commonly recognised high-level Lands are the most commonly recognised high-level classes of use. There would be many sub-classifications classes of use. There would be many sub-classifications under these to define land uses properly.under these to define land uses properly.
The Basic Approach for using RSDThe Basic Approach for using RSD

– NDVI = Normalized difference Vegetation Index NDVI = Normalized difference Vegetation Index – It is defined as It is defined as NDVI = (NIR — VIS) / (NIR + VIS) NDVI = (NIR — VIS) / (NIR + VIS) where where NIRNIR = Near infrared = Near infrared
reflection and reflection and VISVIS = Visible reflection. = Visible reflection.– Spatial representation of Land use is done in GIS through irregular Polygons of Spatial representation of Land use is done in GIS through irregular Polygons of
different classes of NDVI.different classes of NDVI.
Adaptation of NDVIAdaptation of NDVI
LU-Polygons- a graphic illustrationLU-Polygons- a graphic illustrationNDVI illustratedNDVI illustrated

• Spatial representation of Land use is done by Satellite as an image seen Spatial representation of Land use is done by Satellite as an image seen by the IR and Visible light range camera. A sample for Karnataka is by the IR and Visible light range camera. A sample for Karnataka is shown here:shown here:
Tumkur Image
Vectorization
– The Image provides an index for The Image provides an index for Vegetation. This is used to group the Vegetation. This is used to group the respective similar Pixels and classified respective similar Pixels and classified into Corresponding Land Use Polygons into Corresponding Land Use Polygons Called Called VectorsVectors..


The Scheme of the Ongoing WorkThe Scheme of the Ongoing WorkAI:AI: Apex Institute who Analyze & Apex Institute who Analyze & Validate the Survey Reports for Validate the Survey Reports for Biomass Availability.Biomass Availability.
SoI:SoI: Survey of IndiaSurvey of India
MoA: MoA: Ministry of Agriculture.Ministry of Agriculture.
NFP:NFP: National Focal Point do the data National Focal Point do the data verification, Software development, verification, Software development, Map generation and Web deployment Map generation and Web deployment of Biomass Resource Atlas.of Biomass Resource Atlas.
MNREMNRE:: Ministry for New and Ministry for New and Renewable Energy – Renewable Energy – Project Project Sponsoring Ministry.Sponsoring Ministry.
ISRO: ISRO: Indian Space Research Organization.Indian Space Research Organization.
NRSA: NRSA: National Remote Sensing Agency.National Remote Sensing Agency.
RRSSC: RRSSC: Regional Remote Sensing Service Center.Regional Remote Sensing Service Center.

– Usage of the Usage of the same LU Data for subsequent years (about 10)same LU Data for subsequent years (about 10), as long as , as long as the area under the agricultural activity in the selected zone remains the area under the agricultural activity in the selected zone remains roughly same – a feature generally true. roughly same – a feature generally true.
– Land use Land use has been classified based on NDVI analysis of the earth has been classified based on NDVI analysis of the earth surface temporally i.e. surface temporally i.e. season-wiseseason-wise. Land use map for each state is . Land use map for each state is available at Taluk level. It contains the agricultural land class polygons available at Taluk level. It contains the agricultural land class polygons based on seasons- Kharif, Rabi, Kharif-Rabi.based on seasons- Kharif, Rabi, Kharif-Rabi.
– In the current method, polygons are classified into specific crops on In the current method, polygons are classified into specific crops on the basis that same type of crop get into the same polygon due to the basis that same type of crop get into the same polygon due to ‘Implied NDVI’ for land use and ‘Implied NDVI’ for land use and Major crops go into larger polygonsMajor crops go into larger polygons..
– AI is used to do the spatial distribution of Crops into Land use polygons AI is used to do the spatial distribution of Crops into Land use polygons using Major crops for larger polygons, Statistical Crop area and other using Major crops for larger polygons, Statistical Crop area and other prior data such as season and type of land use.prior data such as season and type of land use.
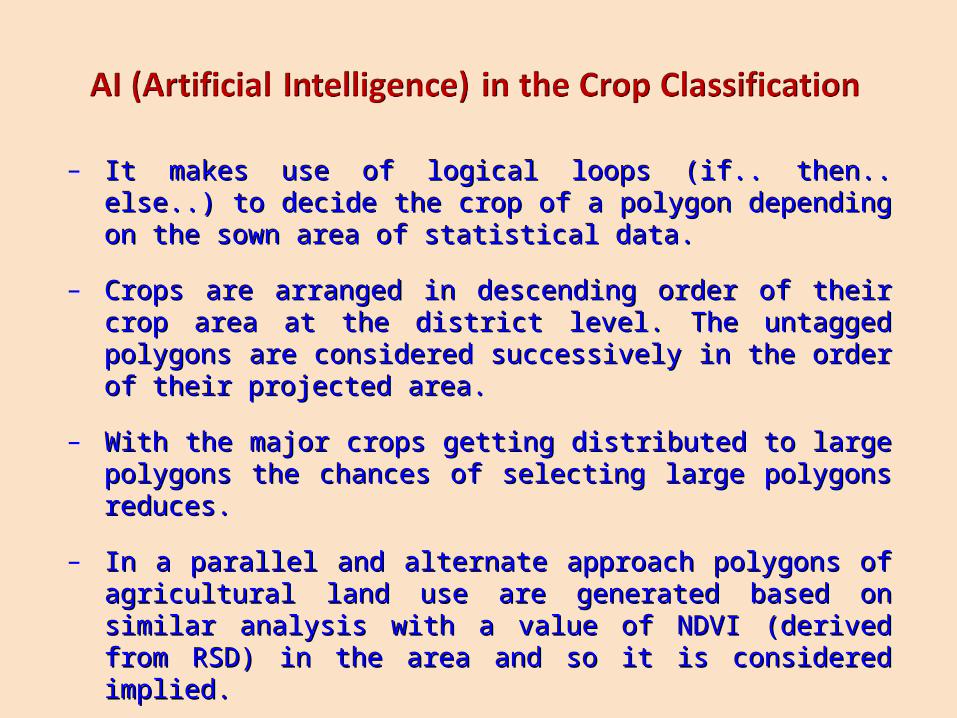
– It makes use of logical loops (if.. then.. else..) to decide the crop of a It makes use of logical loops (if.. then.. else..) to decide the crop of a polygon depending on the sown area of statistical data. polygon depending on the sown area of statistical data.
– Crops are arranged in descending order of their crop area at the district Crops are arranged in descending order of their crop area at the district level. The untagged polygons are considered successively in the order of level. The untagged polygons are considered successively in the order of their projected area.their projected area.
– With the major crops getting distributed to large polygons the chances With the major crops getting distributed to large polygons the chances of selecting large polygons reduces. of selecting large polygons reduces.
– In a parallel and alternate approach polygons of agricultural land use are In a parallel and alternate approach polygons of agricultural land use are generated based on similar analysis with a value of NDVI (derived from generated based on similar analysis with a value of NDVI (derived from RSD) in the area and so it is considered implied.RSD) in the area and so it is considered implied.
– Smaller polygons get classified into other crops depending on the Smaller polygons get classified into other crops depending on the terminal area required to conserve the reported statistical area.terminal area required to conserve the reported statistical area.

Is Data Complete
& OK?
Integrate Data
Prepare Map
Map Data ExtractIs
Data OK?
Prepare Atlas & Launch on Web
Data Preparation
Verification
Spatially Distribute
Preprocessing
Use a Grid at district level to Analyze and locate places of high biomass
potential resources


Agro-crop statistics is taken at district level. Biomass generation from the crops are Agro-crop statistics is taken at district level. Biomass generation from the crops are to be computed using a parameter - Crop Residue Ratio (CRR) defined by ratio of to be computed using a parameter - Crop Residue Ratio (CRR) defined by ratio of Residue Yield to Crop Yield. Following is a sample table showing result of mapping Residue Yield to Crop Yield. Following is a sample table showing result of mapping and analysis of the agro-biomass for the district of Kheda:and analysis of the agro-biomass for the district of Kheda:

State-wise Biomass Data - Year : Based on Survey Data (2002-04) ; Annual
State Area (kHa) Crop
Production (kT/Yr)
Biomass Generation
kT/Yr
Biomass Surplus (kT/Yr)
Power Potential (MWe)
Andhra pradesh 6021.5 28345.7 21569.8 3947.7 481.3Assam 2586.6 5945.4 6625.1 1361.7 163.1Bihar 5833.1 13817.8 20441.8 4286.2 530.3Chattisgarh 3815.5 6142.8 10123.7 1907.8 220.9Goa 156.3 554.7 928.5 180.5 22.7Gujarat 6519.0 20635.5 25471.3 8352.7 1131.1Haryana 4890.2 13520.0 26581.1 10105.9 1303.5Himachal pradesh 710.3 1329.2 2668.2 988.3 128.0Jammu & kashmir 368.7 648.7 1198.7 237.7 31.8Jharkhand 1299.8 1509.0 2191.2 567.7 66.8Karnataka 7356.0 38754.1 26949.3 7814.2 1041.3Kerala 2058.4 9773.3 13072.6 7528.7 1017.9Madhya pradesh 9937.0 14166.9 28348.7 9283.6 1240.2Maharashtra 15542.3 51665.4 39348.6 12998.5 1751.1Manipur 72.6 159.4 318.8 31.9 4.1Meghalaya 0.8 14.0 42.0 8.4 1.1Nagaland 27.1 87.6 149.2 27.2 3.1Orissa 2436.6 3633.3 5350.4 1163.4 147.3Punjab 6774.3 31698.9 50187.9 24637.5 3145.4Rajasthan 10478.5 12762.9 25234.4 7419.9 975.0Tamil nadu 2561.5 24688.4 17459.2 7400.8 967.2Uttar pradesh 12672.5 46841.9 50622.1 11869.8 1496.6Uttaranchal 66.4 135.8 159.9 51.6 6.6West bengal 5575.6 21062.8 23332.7 2968.0 369.5Total 107760.7 347893.5 398375.4 125139.4 16245.7

Nation-wide, residue-wise Data (Annual > 500MWe)
Crop Residue Area (kHa)Crop
Production (kT/Yr)
Biomass Generation
(kT/Yr)
Biomass Surplus (kT/Yr)
Power Potential (MWe)
Paddy Straw 40879.7 89566.6 115921.6 26904.9 3227.2Cotton Stalks 8038.8 5743.5 29986.7 16418.4 2298.6Wheat Stalks 21913.2 60946.4 90417.4 15861.4 2062.1Wheat Pod 21913.2 60946.4 18048.3 8084.6 1131.8Paddy Husk 40879.7 89566.6 15466.1 10264.2 1129.1Cotton Bollshell 8038.8 5743.5 6068.1 4347.0 608.6Cotton Husk 8038.8 5743.5 6068.1 4347.0 608.6Maize Stalks 6231.5 11550.8 21113.9 4182.2 543.7Banana Residue 106.6 3978.9 11885.9 4167.9 541.8Coconut Fronds 1813.4 5973.5 7219.9 3603.6 504.5
Total 78983.2 177759.6 322195.9 98181.2 12655.9

Nation Wide Residue-wise Data (Annual- 100 to 500 MWe)
Crop Residue Area (kHa)Crop
Production (kT/Yr)
Biomass Generation
(kT/Yr)
Biomass Surplus (kT/Yr)
Power Potential (MWe)
Soyabean Stalks 6046.3 5820.6 9863.1 3257.1 423.4
Mustard Stalks 3935.0 3902.0 6591.2 2986.4 388.2
Tapioca Stalks 205.8 5498.9 3398.2 2377.4 309.1
Maize Cobs 6231.5 11550.8 4824.9 1835.4 257.0
Bajra Stalks 8312.0 5976.8 11649.1 1864.7 242.4
Jowar Stalks 9267.4 9986.0 14191.8 1738.2 226.0Ground Nut Stalks 6524.0 6503.8 11391.5 1708.9 222.2
Sugarcane Tops & Leaves 2669.2 174238.1 8301.6 1517.6 212.5
Jowar Cobs 9267.4 9986.0 3977.9 1507.1 211.0
Coconut Husk & Pith 1813.4 5973.5 3113.4 1556.7 202.4Black Pepper Stalks 203.8 4673.2 2336.0 1401.6 182.2
Rubber Primary Wood 498.5 0 1495.1 1196.1 167.4Coffee Pruning & Wastes 350.0 266.3 1383.7 1106.9 155.0
Coconut Shell 1813.4 5973.5 1274.6 902.5 126.3Ground Nut Shell 6524.0 6503.8 1611.2 1027.8 123.3
Gram Stalks 5928.4 4667.6 4641.8 921.0 119.7
Bajra Cobs 8312.0 5976.8 1865.3 884.0 114.9Total 51985.2 239057.5 91910.4 27789.3 3683.0

Nation Wide Residue-wise Data (Annual)
Crop Residue Area (kHa) Crop Production (kT/Yr)
Biomass Generation
(kT/Yr)
Biomass Surplus (kT/Yr)
Power Potential (MWe)
Arhar Stalks 2777.5 2070.6 4418.5 768.3 99.9Castor Seed Stalks 526.0 413.4 1622.8 730.2 94.9Jowar Husk 9267.4 9986.0 1620.4 770.5 92.5Rubber Secondary Wood 498.5 0 995.2 597.1 83.6Til Stalks 1225.3 1024.6 1891.2 642.7 83.6Tea Sticks 573.6 1066.5 909.5 582.1 81.5Safflower Stalks 295.4 160.0 470.6 376.5 48.9Bajra Husk 8312.0 5976.8 1565.1 372.5 44.7Arecanut Fronds 262.8 265.4 769.3 269.3 37.7Arhar Husk 2777.5 2070.6 464.5 232.3 27.9Moong Stalks 1300.8 2408.4 2043.8 204.4 26.6Casurina Wood 21.2 0 208.9 177.6 24.9Ragi Straw 1453.9 2070.6 2329.4 197.6 23.7Guar Stalks 266.3 116.0 231.2 161.8 22.7Potato Leaves 119.6 1095.3 792.4 158.1 22.1Urad Stalks 1458.0 1876.6 1471.1 154.4 20.1Meshta Stalks 479.2 809.4 1483.7 148.4 19.3Eucalyptus Residue 16.3 3.1 160.7 136.6 19.1Sun Flower Stalks 1331.0 697.5 870.3 125.0 16.2Moong Husk 1300.8 2408.4 261.2 130.6 15.7Urad Husk 1458.0 1876.6 252.8 126.1 15.1Pulses Stalks 1874.8 1069.2 1142.5 114.3 14.9Oilseeds Stalks 341.9 458.8 882.4 95.6 11.5Horse Gram Stalks 418.0 764.5 789.4 79.0 10.3
Total 32819.3 32332.6 27646.9 7350.7 957.2

A Spatial View of Agro-Residues in Madhya PradeshA Spatial View of Agro-Residues in Madhya Pradesh
From Atlas, CGPL Site

A Demographic View of Madhya PradeshA Demographic View of Madhya Pradesh
From Atlas, CGPL Site

The Strategies for Mapping of Forest & Waste LandsThe Strategies for Mapping of Forest & Waste Lands
• The spatial assessment of agro-biomass-power completed earlier is The spatial assessment of agro-biomass-power completed earlier is taken as the stage for further processing. Agro-biomass-power is taken as the stage for further processing. Agro-biomass-power is estimated to be more than 16,000 MW of energy per year across the estimated to be more than 16,000 MW of energy per year across the Country. Country.
• The residues available from forest & wasteland are added on these The residues available from forest & wasteland are added on these data layers. CRR [Crop Residue Ratio] is not applicable in the case of data layers. CRR [Crop Residue Ratio] is not applicable in the case of forest and wasteland residues.forest and wasteland residues.
• Waste-Land is not well cultured with appropriate biomass growing Waste-Land is not well cultured with appropriate biomass growing plants. Based on the species mix available reports in forest area a plants. Based on the species mix available reports in forest area a first level estimate is predicted.first level estimate is predicted.
• In this case, the biomass estimate is done using the yield of the In this case, the biomass estimate is done using the yield of the residue.residue.

Significance of Existing Utilization Pattern of Biomass Significance of Existing Utilization Pattern of Biomass from Forest & Waste Land in the Mapping Strategyfrom Forest & Waste Land in the Mapping Strategy
– Given the inefficiency of administration and the ‘soft’ character Given the inefficiency of administration and the ‘soft’ character of the political system, one could generalize that from a typical of the political system, one could generalize that from a typical tree, the stem goes to the rich and the towns, while the tree, the stem goes to the rich and the towns, while the branches and twigs belong to the poor.branches and twigs belong to the poor.
– Human needs for biomass are, however, not restricted to the Human needs for biomass are, however, not restricted to the consumption and use of woody biomass. consumption and use of woody biomass.
– The maintenance of life support systems is a function The maintenance of life support systems is a function performed mainly by the crown biomass of trees. It is this performed mainly by the crown biomass of trees. It is this component of trees that can contribute positively towards the component of trees that can contribute positively towards the maintenance of the hydrological and nutrient cycles.maintenance of the hydrological and nutrient cycles.

Significance of Existing Utilization (Contd…)Significance of Existing Utilization (Contd…)– Social forestry is also the most important source for the Social forestry is also the most important source for the
production of biomass for consumption as fuel, fodder, manure, production of biomass for consumption as fuel, fodder, manure, fruits, etc. fruits, etc.
– Social forestry as distinct from commercial forestry is supposed to Social forestry as distinct from commercial forestry is supposed to be corrective aimed at the maximization of the production of all be corrective aimed at the maximization of the production of all types of useful biomass which improve ecological stability. types of useful biomass which improve ecological stability.
– The appropriate unit of assessment of growth and yields of The appropriate unit of assessment of growth and yields of different tree species for social forestry programmes cannot be different tree species for social forestry programmes cannot be restricted to woody biomass production for commercial use. It restricted to woody biomass production for commercial use. It must, instead, be specific to the end use of biomass. must, instead, be specific to the end use of biomass.

– Evidently, the crisis in biomass for mulching or animal feed Evidently, the crisis in biomass for mulching or animal feed cannot be resolved by planting trees that are fast growing and are cannot be resolved by planting trees that are fast growing and are absolutely unproductive as fodder. absolutely unproductive as fodder.
– The assessment of yields in social forestry must include diverse The assessment of yields in social forestry must include diverse types of biomass which provide inputs to agro ecosystems. When types of biomass which provide inputs to agro ecosystems. When the objective of tree planting is the production of fodder or green the objective of tree planting is the production of fodder or green fertilizer, it is relevant to measure fertilizer, it is relevant to measure crown biomass crown biomass productivity.productivity.
– Keeping these factors in mind Wasteland has to be developed Keeping these factors in mind Wasteland has to be developed with Plantations suitable for energy.with Plantations suitable for energy.
– For the present, species available in Forest area are considered to For the present, species available in Forest area are considered to be extended to Waste land area for the purpose of Biomass be extended to Waste land area for the purpose of Biomass assessment for Energy.assessment for Energy.

Some Observations on Forest & Wasteland BiomassSome Observations on Forest & Wasteland Biomass
—It is reported by FSI that the plantation density varies depending It is reported by FSI that the plantation density varies depending on the type of forest. FSI has published forest area based on the on the type of forest. FSI has published forest area based on the plantation density (next slide).plantation density (next slide).
—The plants / trees species pattern grown in the forests are The plants / trees species pattern grown in the forests are heterogeneous unlike agricultural crops. FSI has given % mix of heterogeneous unlike agricultural crops. FSI has given % mix of these species in each state & nation wide (slide follows).these species in each state & nation wide (slide follows).
—Some of these species are leafy, some others generate more of Some of these species are leafy, some others generate more of twigs, some of them generate twigs-leaf-bark. Generation of bark twigs, some of them generate twigs-leaf-bark. Generation of bark also depends on the stem size.also depends on the stem size.
—Though we do not get direct relations between these factors, Though we do not get direct relations between these factors, there are some estimations available through internet sources and there are some estimations available through internet sources and FSI regarding residue yields (slide follows).FSI regarding residue yields (slide follows).

Forest Plantation DensityForest Plantation Density
Dense ForestAll lands with tree cover of canopy density of 40 percent and above.
Open ForestAll lands with tree cover of canopy density between 10 to 40 percent.
MangroveSalt tolerant forest ecosystem found mainly in tropical and sub-tropical inter-tidal regions.
ScrubAll lands with poor tree growth mainly of small or stunted trees having canopy density less than 10 percent.
Non-Forest Any area not included in the above classes
Density Classification & Percentage Concentration (FSI):Density Classification & Percentage Concentration (FSI):

Species wise plantation upto 1997 by the state forest departments
SPECIES Area in '000 ha. Percentage
Eucalyptus spp. 1,360.91 8.87Tectona grandis 1,330.09 8.67Acacia nilotica 801.61 5.23Acacia auriculiformis 564.67 3.68Bamboo 408.09 2.66Pinus roxburghii 318.54 2.08Dalbergia sissoo 266.58 1.74Acacia catechu 259.54 1.69Shorea robusta 250.28 1.63Gmelina arborea 148.01 0.97Anacardium occidentale 141.54 0.92Casurina equisetifolia 133.99 0.87Pinus kesiya 127.12 0.83Cedrus deodara 124.93 0.81Populus spp. 47.48 0.31Bombax ceiba 37.97 0.25Acacia mearnsii 37.56 0.24Picea smithiana, Abies pindrow 16.74 0.11Hevea brasiliensis 12.3 0.08Santalam album 10.58 0.07Others 8,938.10 58.28Total 15,336.60 100

SpeciesSpecies
Percentage in total Percentage in total Biomass Biomass (%) (%)
Total Total BiomassBiomass
Stem wood Stem wood and bark and bark
Branches Branches and twigs and twigs ((Tons/ha )Tons/ha )
Eucalyptus Eucalyptus 8181 1919 17.417.4 Subabul Subabul 7777 2323 23.023.0 Acacia Nilotica Acacia Nilotica 4747 5353 31.631.6 Prosopis Juliflora Prosopis Juliflora 3030 7070 32.232.2
Coniferous & DeciduousConiferous & DeciduousResidueResidue %%
StemStem 6565BarkBark 33TwigsTwigs 33BranchesBranches 33LeavesLeaves 3.53.5RootsRoots 1717UncertainUncertain 5.55.5

TwigsTwigs
BranchesBranches Leaves – Crown BiomassLeaves – Crown Biomass
BarkBark

Method of Approach for the Assessment MappingMethod of Approach for the Assessment Mapping
—Initially the biomass in forest was assessed without considering Initially the biomass in forest was assessed without considering the plantation density for a quick analysis to enable the process the plantation density for a quick analysis to enable the process development.development.
—Later based on the observations the mapping was reclassified into Later based on the observations the mapping was reclassified into sub-classes for low and high density areas using ground reference sub-classes for low and high density areas using ground reference points.points.
—This called for re-processing of image and spatial classifications. This called for re-processing of image and spatial classifications. The mapping was reworked with this modified classifications.The mapping was reworked with this modified classifications.
—There has been a significant enhancement in the reliability factor There has been a significant enhancement in the reliability factor in the estimation of biomass surplus on this approach.in the estimation of biomass surplus on this approach.

Method of Approach for the Assessment Mapping (Contd…) Method of Approach for the Assessment Mapping (Contd…)
—With the species spread being heterogeneous and their mix being With the species spread being heterogeneous and their mix being known for each state, they could be spatially distributed to the known for each state, they could be spatially distributed to the Forest and Waste Land zones appropriately in the mapping.Forest and Waste Land zones appropriately in the mapping.
—The a specialized database is created from these distributions The a specialized database is created from these distributions from the maps that preserves the essential characteristics of the from the maps that preserves the essential characteristics of the analysis and mapping made.analysis and mapping made.
—The algorithm for arriving at the biomass assessment is much The algorithm for arriving at the biomass assessment is much similar to Agro-Biomass assessment as was described earlier.similar to Agro-Biomass assessment as was described earlier.


– The Biomass surplus assessed separately for agro, forest and The Biomass surplus assessed separately for agro, forest and waste land are integrated into a database.waste land are integrated into a database.
– The database is further queried to provide aggregated biomass The database is further queried to provide aggregated biomass data with power potential for any combination such as- (Agro & data with power potential for any combination such as- (Agro & Forest), (Agro & Wasteland), (Agro & Forest & Wasteland), etc.Forest), (Agro & Wasteland), (Agro & Forest & Wasteland), etc.
– The biomass data generated is further used to generate image The biomass data generated is further used to generate image maps for each state indicating the biomass production index over maps for each state indicating the biomass production index over the respective spatial region of the state (Slides follow).the respective spatial region of the state (Slides follow).
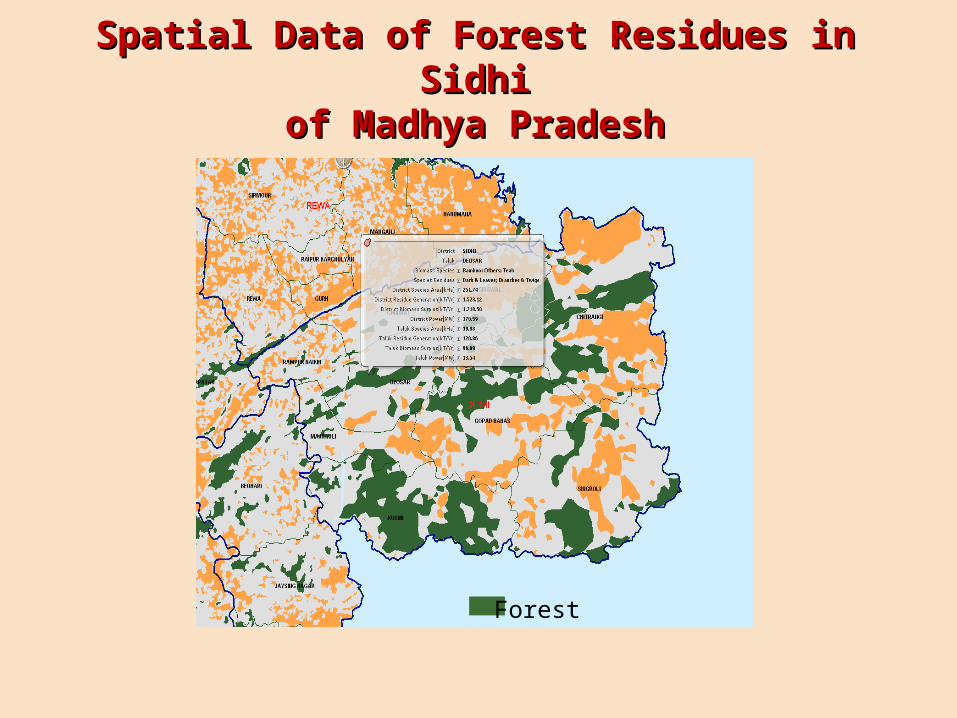
Spatial Data of Forest Residues in SidhiSpatial Data of Forest Residues in Sidhiof Madhya Pradeshof Madhya Pradesh
Forest

Spatial Wasteland based Resource Map for Sidhi of Spatial Wasteland based Resource Map for Sidhi of Madhya PradeshMadhya Pradesh
Waste Land
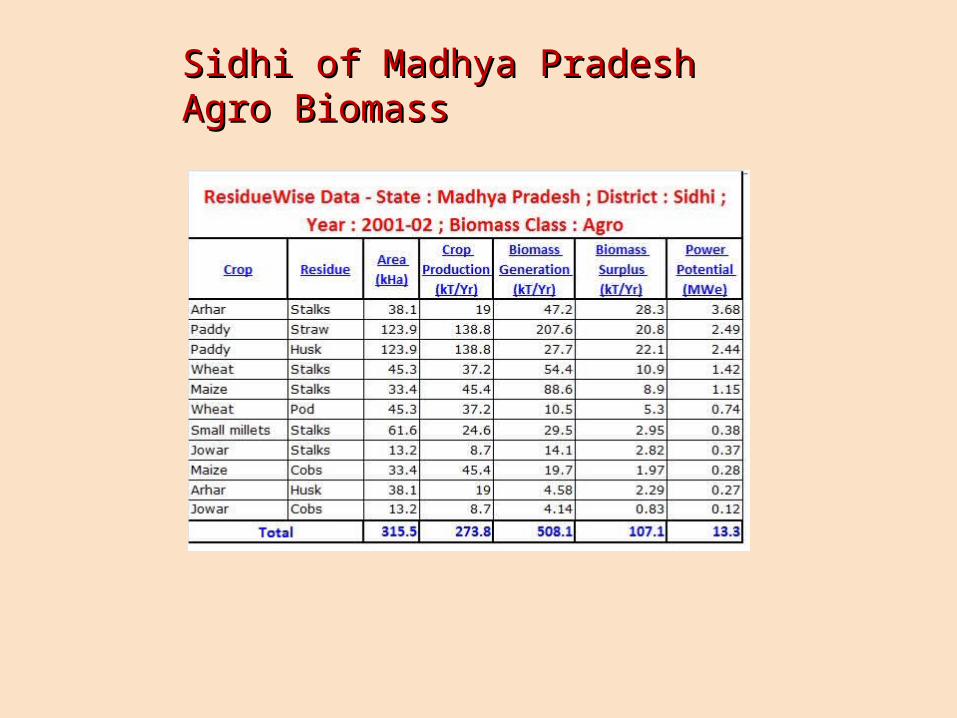
Sidhi of Madhya Pradesh Agro BiomassSidhi of Madhya Pradesh Agro Biomass

Sidhi of Madhya Pradesh Agro & Forest BiomassSidhi of Madhya Pradesh Agro & Forest Biomass

Sidhi of Madhya Pradesh Agro & Wasteland BiomassSidhi of Madhya Pradesh Agro & Wasteland Biomass

Sidhi of Madhya Pradesh Agro, Forest & Wasteland Sidhi of Madhya Pradesh Agro, Forest & Wasteland BiomassBiomass
Contd…Contd…

Sidhi of Madhya Pradesh Agro, Forest & Wasteland Biomass Sidhi of Madhya Pradesh Agro, Forest & Wasteland Biomass Contd…Contd…


A Concept Evolved - Biomass Production IndexA Concept Evolved - Biomass Production Index
• After the different types of biomass are spatially distributed After the different types of biomass are spatially distributed into different layers, it is necessary that the ‘biomass into different layers, it is necessary that the ‘biomass concentration centers’ be identified based on the concentration centers’ be identified based on the aggregation of biomass surplus of all types.aggregation of biomass surplus of all types.
• To aid this activity a reverse process of generating an image To aid this activity a reverse process of generating an image based on the total surplus biomass from all the layers- Agro, based on the total surplus biomass from all the layers- Agro, Forest and Wasteland of map data is generated.Forest and Wasteland of map data is generated.
• This is done by coloring the geographical area based on a This is done by coloring the geographical area based on a normalized index of the total biomass surplus for each normalized index of the total biomass surplus for each district.district.

Analysis of Biomass Growth IntensityAnalysis of Biomass Growth Intensity• Biomass mapping based on local potential is made spatiallyat different levels. This is done by computation of biomassproduction (BP) based on a normalized index. Analysisbeing impractical at polygon levels, grid based approach isintroduced.
• With the computed Biomass Production Index [BPI], that isbeing developed, the combined analysis with BPI linkedmap-coloring is done with the developed software tool.
• The necessary special tools for this approach are developedand are used for the biomass mapping and estimation in theForest and waste lands.
• Followingslide showsaclipping….


Biomass Production IndexBiomass Production Index– In the previous slide image generated for BPI is shown as In the previous slide image generated for BPI is shown as an example.an example.
–In the district Rajkot of Gujarath it is now easy to point to In the district Rajkot of Gujarath it is now easy to point to the areas of high biomass concentration. The green areas the areas of high biomass concentration. The green areas are more biomass productive for the purposes of energy are more biomass productive for the purposes of energy generation.generation.
–This is also verified by making a graphical query on this This is also verified by making a graphical query on this chosen geographical area. For example if a query is made chosen geographical area. For example if a query is made on the red region it shows low energy-useful biomass on the red region it shows low energy-useful biomass production.production.

Polygon Identifier
TalukArea (kHa)
Avg Residue Yield (T/Ha)
BPI
373998 Tankara 30.35 0.9029 0.5609
374030 Jetpur 1.13 0.9029 0.5609
375244 Rajkot 1.30 0.6588 0.4299
374008 Rajkot 2.39 0.6588 0.4299
374052 Rajkot 1.81 0.6588 0.4299
374044 Jetpur 1.15 0.6588 0.4299
374047 Jetpur 4.61 0.6588 0.4299
374003 Paddhari 7.18 0.5125 0.3981
374028 Lodhika 1.06 0.5125 0.3981
374050 Gondal 2.22 0.5125 0.3981
374034 Rajkot 0.59 0.5125 0.3981
374056 Gondal 0.26 0.5125 0.3981
375258 Rajkot 0.60 0.6588 0.3769
374055 Kotdasangani 0.83 0.6588 0.3769
374045 Gondal 2.29 0.6588 0.3769
374005 Paddhari 2.38 0.4595 0.3608
375297 Rajkot 0.17 0.4595 0.2734
374011 Paddhari 2.16 0.5125 0.2603
374733 Morvi 0.11 0.5125 0.2603
374032 Gondal 0.12 0.5125 0.2603
374025 Gondal 0.07 0.5125 0.2603
374024 Jetpur 0.01 0.5125 0.2603
374002 Vankaner 0.01 1.1051 0.0823
374678 Morvi 1.45 1.1051 0.0823
374720 Morvi 1.45 1.1051 0.0823
375259 Rajkot 0.01 1.1051 0.0823
374013 Paddhari 0.06 1.1051 0.0823
374014 Paddhari 26.06 1.1051 0.0823
374015 Rajkot 65.16 1.1051 0.0823
374016 Vankaner 84.11 1.1051 0.0823
374041 Jetpur 0.58 1.1051 0.0823
374730 Morvi 0.07 0.1138 0.0533
374734 Morvi 0.11 0.1138 0.0533
374021 Gondal 0.14 0.1138 0.0533
375250 Rajkot 0.24 0.4281 0.0297
374048 Gondal 0.68 0.7425 0.0062
374046 Lodhika 0.21 0.7425 0.0062

Forest cover and per Capita Availability in Different Regions/ Countries
Region / Country
Percentage of Forest Cover to Land Area
(1995)
Per Capita Forest(ha)
World 26.60 0.64Asia 16.40 0.10Africa 17.70 0.70Europe 41.30 1.30China 14.30 0.10Pakistan 2.30 0.01Nepal 33.70 0.20Bangladesh 7.80 0.02Sri Lanka 27.80 0.10Indonesia 60.60 0.60Malaysia 47.10 0.80Philippines 22.70 0.10Japan 66.80 0.20USA 23.20 0.80India 15.70 0.06
Concluding RemarksConcluding Remarks• The mapped biomass resource atlas is hosted on a internet site (The mapped biomass resource atlas is hosted on a internet site (
http://cgpl.iisc.ernet.in) and is available for an end user to access ) and is available for an end user to access from anywhere.from anywhere.
• The usage of the atlas is found fairly good (typically 150-250 visits The usage of the atlas is found fairly good (typically 150-250 visits per day) by aspirant entrepreneurs and administrators in decision per day) by aspirant entrepreneurs and administrators in decision making.making.
• Expansion of the data sets and features are ongoing for enhanced Expansion of the data sets and features are ongoing for enhanced features and performance.features and performance.
• The mapping has provided a strong basis of building sustainable The mapping has provided a strong basis of building sustainable and efficient biomass power plants – a well recognized and and efficient biomass power plants – a well recognized and emerging renewable alternative energy source.emerging renewable alternative energy source.
• The study points out that availability of biomass as fuel is generally The study points out that availability of biomass as fuel is generally not the hindrance for its wider applicability but it needs to have a not the hindrance for its wider applicability but it needs to have a proper organized approach to overcome the barrier, as of today.proper organized approach to overcome the barrier, as of today.

Thank You !Thank You !