combustion generated nanoparticles - assessment of particle … · 2018-07-12 · excellence in...
TRANSCRIPT

Assessment of Particle Measurement Techniques and Physico-chemical Soot Properties at Different Diesel Combustion Modes
Lutz Kraemer, Olaf Friedrichs, Kai Behnk Contact: IAV GmbH, Carnotstr. 1, D-10587 Berlin, [email protected] Introduction: The application of a Diesel particle filter (DPF) is mandatory in order to comply with the proposed European emission and immission limits as well as the stringent US limits. The regeneration interval of the DPF is determined by the amount of soot deposited in the filter as a function of mileage (and operating conditions). The calibration of this regeneration by thermally induced soot oxidation requires a good knowledge of the DPF soot loading to avoid fuel consumption penalties or thermal filter stress. As a consequence, the precise mapping and modelling of the soot raw emissions from a specific engine is part of the development process and in need for a reliable, selective and fast soot measurement technique. The presented work yields a brief assessment of well-established particle measurement techniques. It is very likely, that besides internal engine measures and the application of DPF systems an additional exhaust aftertreatment device for the reduction of nitrogen oxides (DeNOx process) will be required. Two systems rival for their application: while the selective catalytic reduction (SCR) of NOX features the highest conversion efficiency for both, light- and heavy-duty applications at moderate fuel consumption levels, the lean NOX storage trap (LNT) is a candidate system for medium-term introduction as no additional fuel is needed for the DeNOx process. However, the regeneration of an LNT requires a rich combustion regime which leads to high soot emissions that might significantly reduce the regeneration interval of the DPF. Little is known on the nature of soot originated at rich combustion. The presented results from various soot characterization methods yield new thoughts on the microstructure, reactivity and quantification capability of so-called “rich” soot. The following particle measurement techniques were run in parallel to characterize the soot emissions from one common-rail diesel engine of the 2l class equipped with a diesel oxidation catalyst (DOC) prior to the sampling positions: gravimetric filter weighing, chemical determination of elemental carbon by coulometry, transmission electron microscopy, RAMAN spectroscopy and online methods such as photoacoustic spectroscopy, laser-induced incandescence, smoke monitoring, electrostatic particle size and optical number determination as well as opacity metering. The EU4 engine was controlled by IAV HOCCOS (Homogeneous combustion control software) combined with IAV FI²re (Fuel injection and ignition rapid prototyping) via a Micro AutoBox and operated under various operating points from idle to full load and the correlations of the various methods were investigated. Furthermore, the engine was operated under rich combustion conditions with varying air/fuel ratios and post injection timings. Results: The online determination of soot mass concentration by photoacoustic spectroscopy (AVL MicroSoot Sensor, diluted sampling) and laser-induced incandescence (ESYTEC LI²SA, in-situ) showed very good agreement with the chemical filter analysis by coulometric elemental carbon determination under all operating points with “classic EU4” lean combustion. Please note, that the deviating calibration slopes of the three methods require the calibration of the delivered instruments by chemical filter analysis to selectively determine the soot raw emission. The filter smoke measurement was also in very good agreement with the methods described before except the full-load operating point, where the high space velocity caused a significant

HC slip over the DOC leading to a small but significant overestimation of the soot mass concentration. Furthermore, the new IAV opacity meter EOM 200 showed almost the same correlation as the filter smoke number based measurement technique. However, under rich combustion conditions as applied for the LNT regeneration, the optical soot measurement methods based on extinction or absorption were not correlating to the aforementioned calibration. Whereas the laser induced incandescence showed excellent agreement with the elemental carbon as determined by chemical filter analysis, the Smoke meter, opacity meter and MicroSoot Sensor dramatically overestimated the actual soot concentration. As photoacoustic spectroscopy is based on the absorbance of the aerosol, the corresponding signal is proportional to the mass concentration multiplied by the specific absorption coefficient of soot. Due to the experimental findings, it is assumed, that the absorption coefficient of soot from the rich combustion regimes is significantly higher compared to standard lean EU4 soot. With the comparison of amorphous soot with Diesel soot being reported in [1] and its effect on the absorption coefficient in [2], the increase in the absorption efficient is assumed to be caused by a higher level of graphitization of the “rich” soot. This assumption is also supported by additionally performed RAMAN spectroscopic measurements with deposited soot. After polymodal fitting of the RAMAN spectra, a clear trend could be observed, that soot originated by rich combustion showed a higher degree of graphitization compared to “lean” soot. In addition, it has been reported in [3 & 4], that the reactivity of soot decreases with an increasing degree of graphitization due to the graphite lattice. The transmission electronic microscopy investigations yielded a very good agreement of the primary particle diameter determination by the laser induced incandescence. Regardless of the applied engine conditions, the primary particle diameters were approx. 25 nm. The morphologic structures of the various soots also showed no significant differences. However, the addition of high resolution EDX-measurements yielded a significant decrease of the degree of oxidation of the carbon particles with decreasing air/fuel-ratios and retardation of the post injection. The number and size measurements carried out with the TSI EEPS showed an increase of the particle diameters with increasing number concentrations as expected by agglomeration. Conclusion: It could be shown, that the correlation of several soot measurement techniques under standard engine conditions is very good and enables time—resolved soot measurements. However, under rich combustion regimes, the calibration of the particle measurement techniques was significantly differing from the chemical elemental carbon detection with the exception of the LI². The observed non-correlation of several techniques is caused by their different physical measurement principles. The discussion of these results leads to the assumption, that “rich” soot has a lower reactivity compared to “lean” soot as the degree of the oxidation is lower and the degree of graphitization seems to be higher. To keep it simple: A DPF clearly does not favour rich combustion regimes. [1] Kamm: Kinetic investigations of soot aerosol oxidation via ESR- and FTIR-spectroscopy, Ph.D., Karlsruhe 2000. [2] Kraemer: Microstructure of ultrafine aerosols and photoacoustic detection of soot aerosols, Ph. D., Munich 2001. [3] Jacob et al.: Diesel Soot: Microstructure and Oxidation Kinetics, Vienna Symposia 2003. [4] Su et al.: Microstructure and Oxidation Behaviour of Euro IV Diesel Engine Soot, Catalysis Today 2004.
Excellence in Automotive R&D
Assessment of Particle Measurement Techniquesand Physico-chemical Soot Properties at Different Diesel Combustion Modes10th ETH-Conference on Combustion Generated NanoparticlesLutz Krämer, Olaf Friedrichs, Kai Behnk
Zuerich, CH, 2006/08/22

© IAV · 03/2006 · DLK · ME-D1 · ETH Kraemer, Lutz.ppt 2
IntroductionMotivation
• US Tier 2 / LEV II / EU 6? -> DPF and NOX aftertreatment !
• Raw soot emission measurement -> soot mass selective
• DPF lay-out definition
• calibration of regeneration mode
• advanced modeling of DPF
• LNT usage for Denoxation ?
• increased raw soot emissions -> accelerated DPF loading !
• reactivity of "rich" soot ? -> regeneration behavior ?
• physico-chemical soot properties ? -> reliable soot measurement ?
• Detailed knowledge of the soot properties under various combustion regimesrequired
© IAV · 03/2006 · DLK · ME-D1 · ETH Kraemer, Lutz.ppt 3
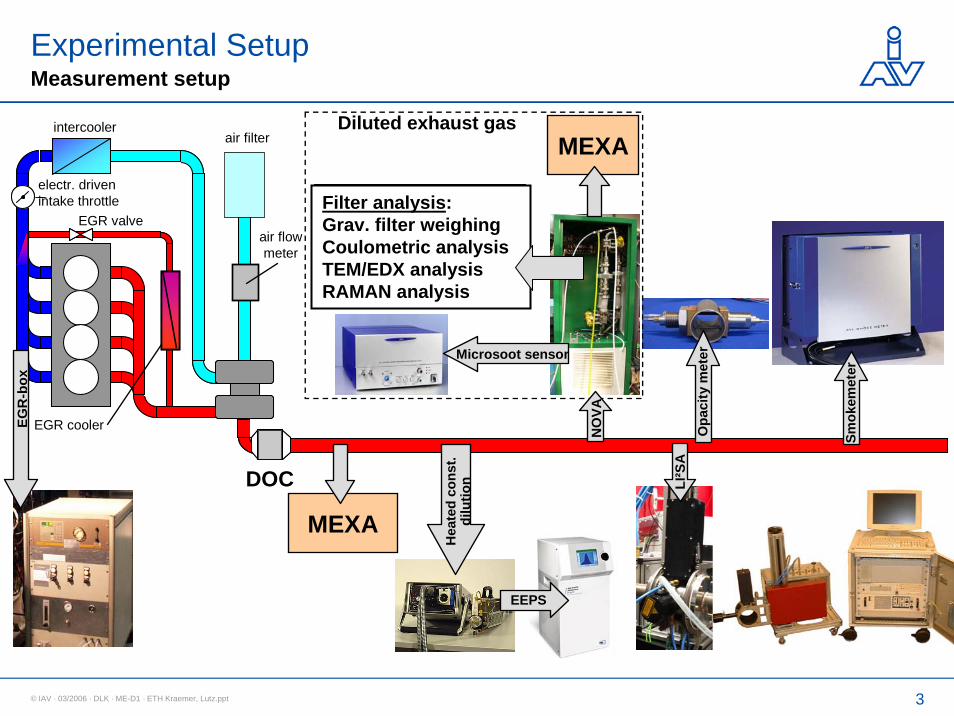
Experimental SetupMeasurement setup
MEXA
electr. drivenintake throttle
intercooler
EGR valve
air filter
EGR cooler
air flow meter
DOC
MEXA
Microsoot sensor
NO
VA
LI²S
AO
paci
ty m
eter
Smok
emet
er
EGR
-box
Diluted exhaust gas
Filter analysis:Grav. filter weighingCoulometric analysisTEM/EDX analysis
Hea
ted
cons
t. di
lutio
n
EEPS
Filter
Filter analysis:Grav. filter weighingCoulometric analysisTEM/EDX analysisRAMAN analysis
© IAV · 03/2006 · DLK · ME-D1 · ETH Kraemer, Lutz.ppt 4
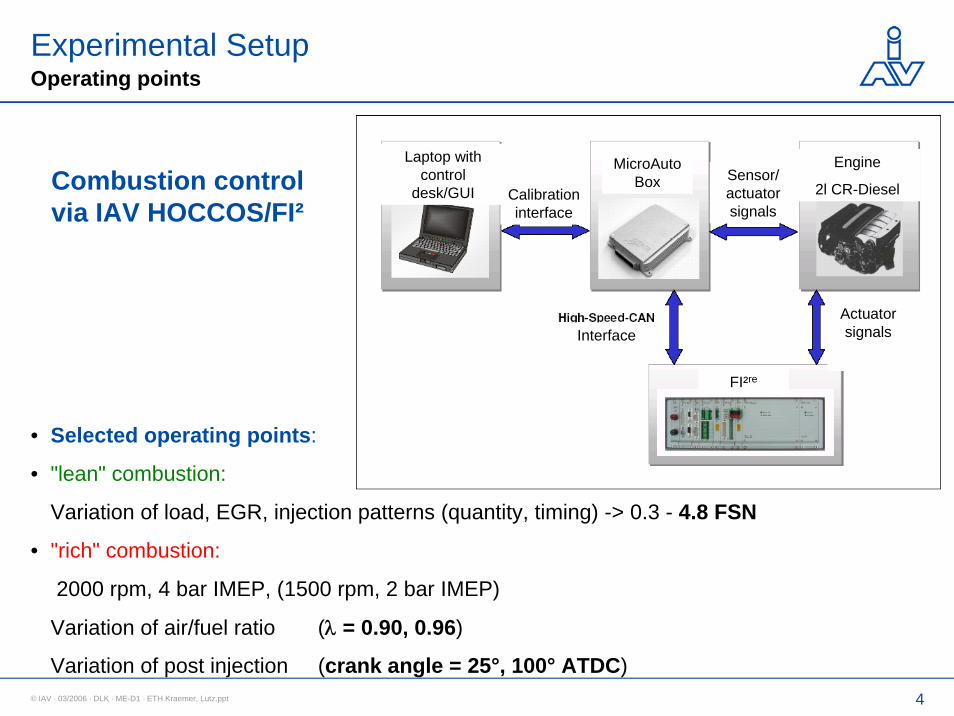
Experimental SetupOperating points
Combustion controlvia IAV HOCCOS/FI²
Laptop with control
desk/GUI
Engine
2l CR-Diesel
Actuator signalsInterface
Calibration interface
Sensor/ actuator signals
MicroAutoBox
FI²re
Laptop with control
desk/GUI
Engine
2l CR-Diesel
Actuator signalsInterface
Calibration interface
Sensor/ actuator signals
MicroAutoBox
FI²re
• Selected operating points:
• "lean" combustion:
Variation of load, EGR, injection patterns (quantity, timing) -> 0.3 - 4.8 FSN
• "rich" combustion:
2000 rpm, 4 bar IMEP, (1500 rpm, 2 bar IMEP)
Variation of air/fuel ratio (λ = 0.90, 0.96)
Variation of post injection (crank angle = 25°, 100° ATDC)

© IAV · 03/2006 · DLK · ME-D1 · ETH Kraemer, Lutz.ppt 5
Experimental ResultsCorrelation of chemical filter analysis and laser-induced incandescence
• Primary particle diameter approx. 25 nm for all operating points
• Excellent agreement between laser induced incandescence and chemical analysis
y = 0.64xR2 = 0.98
0
50
100
150
200
250
0 50 100 150 200 250 300 350 400EC [mg/m³]
LI² [
mg/
m³]
• In-situ detection of elemental carbon and primary particle sizes by LI²
© IAV · 03/2006 · DLK · ME-D1 · ETH Kraemer, Lutz.ppt 6
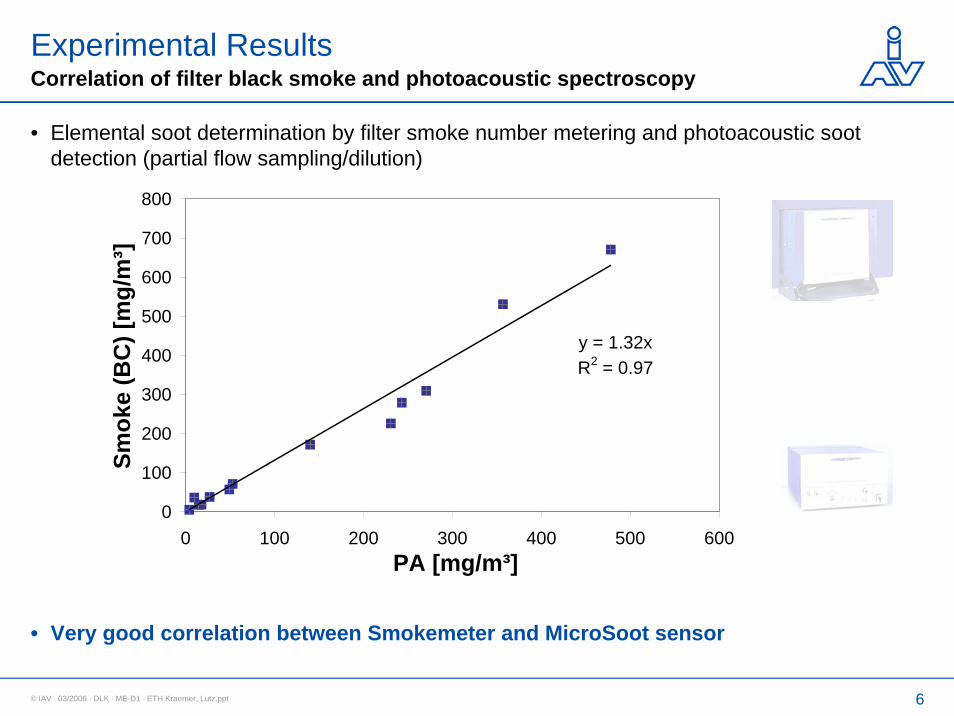
Experimental ResultsCorrelation of filter black smoke and photoacoustic spectroscopy
• Very good correlation between Smokemeter and MicroSoot sensor
y = 1.32xR2 = 0.97
0
100
200
300
400
500
600
700
800
0 100 200 300 400 500 600PA [mg/m³]
Smok
e (B
C) [
mg/
m³]
• Elemental soot determination by filter smoke number metering and photoacoustic sootdetection (partial flow sampling/dilution)

© IAV · 03/2006 · DLK · ME-D1 · ETH Kraemer, Lutz.ppt 7
Experimental ResultsCorrelation of chemical filter analysis/photoacoustic spectroscopy and opacity
• New in-situ IAV Exhaust Opacity Meter EOM 200 at tailpipe
• Optimized design prevents soot deposition and condensation on optics
• EOM 200 only available at few lean and rich conditions operating points
• Two different correlation fits for PA soot detection and chemical EC analysis ?
• Deviation caused by scattering ?
y = 0.04xR2 = 0.96
y = 0.06xR2 = 0.90
0
5
10
15
20
25
0 100 200 300 400 500 600
EC / PA [mg/m³]
Opa
city
[%]
PAEC
© IAV · 03/2006 · DLK · ME-D1 · ETH Kraemer, Lutz.ppt 8
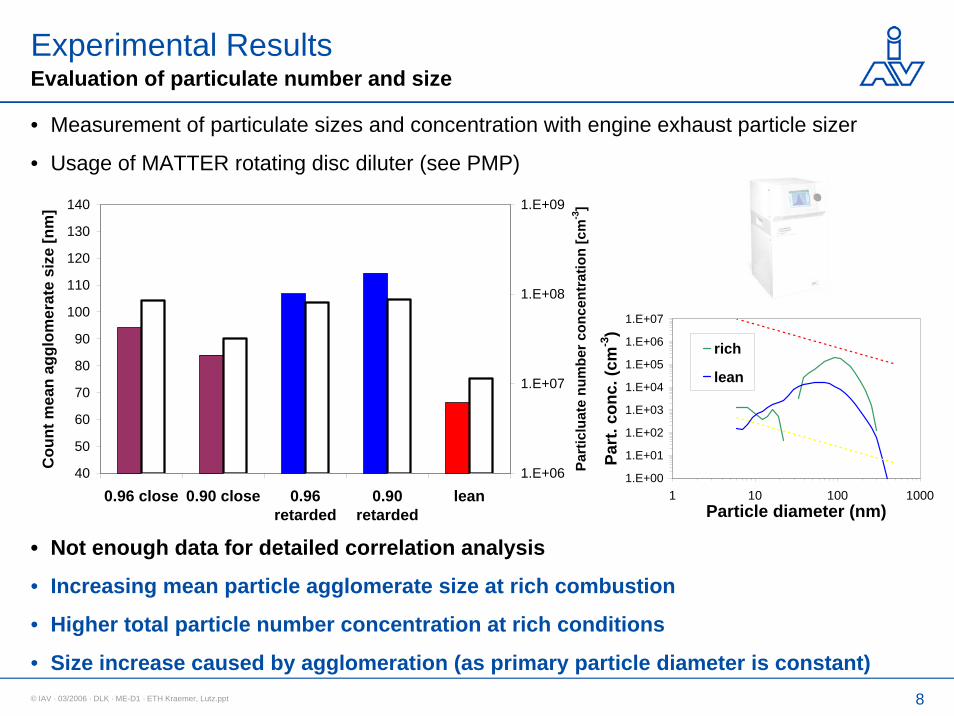
Experimental ResultsEvaluation of particulate number and size
• Not enough data for detailed correlation analysis
• Increasing mean particle agglomerate size at rich combustion
• Higher total particle number concentration at rich conditions
• Size increase caused by agglomeration (as primary particle diameter is constant)
1.E+00
1.E+01
1.E+02
1.E+03
1.E+04
1.E+05
1.E+06
1.E+07
1 10 100 1000Particle diameter (nm)
Part
. con
c. (c
m-3
)
rich
lean
• Measurement of particulate sizes and concentration with engine exhaust particle sizer
• Usage of MATTER rotating disc diluter (see PMP)
40
50
60
70
80
90
100
110
120
130
140
0.96 close 0.90 close 0.96retarded
0.90retarded
lean
Cou
nt m
ean
aggl
omer
ate
size
[nm
]
1.E+06
1.E+07
1.E+08
1.E+09
Part
iclu
ate
num
ber c
once
ntra
tion
[cm
-3]

© IAV · 03/2006 · DLK · ME-D1 · ETH Kraemer, Lutz.ppt 9
Experimental ResultsCorrelation of chemical filter analysis and black smoke measurement
y = 0.88xR2 = 0.97
0
100
200
300
400
500
600
700
800
0 50 100 150 200 250 300 350 400EC [mg/m³]
Smok
e (B
C) [
mg/
m³]
leanrichFull load
• Filter sampling (undiluted, heated) and filter smoke number detection (intervals)
• Very good correlation for lean conditions (slight deviation for full load soot)
• Overestimation of soot under rich conditions -> higher soot absorbance ?

© IAV · 03/2006 · DLK · ME-D1 · ETH Kraemer, Lutz.ppt 10
Experimental ResultsCorrelation of chemical filter analysis and photoacoustic spectroscopy
y = 0.74xR2 = 0.99
0
100
200
300
400
500
600
0 50 100 150 200 250 300 350 400EC [mg/m³]
PA [m
g/m
³]
PA rich
PA lean
• Online soot monitoring by PA spectroscopy with partial flow dilution system (CO2 tracercontrolled)
• Excellent agreement for lean conditions (including full load conditions)
• Overestimation of "rich" soot -> higher soot absorption coeffecient, σC !
• σC of Diesel and spark-discharge soot ≈ 2.5 : 1 -> Diesel soot more graphitic [1, 2]
• Reactivity reported to decrease with increasing degree of graphitization [3, 4]

© IAV · 03/2006 · DLK · ME-D1 · ETH Kraemer, Lutz.ppt 11
Experimental ResultsTransmission electron microscopy / Particle morphology
• Primary particle diameter of LI² measurement confirmed (approx. 25 nm)
• No significant morphologic differences between the sampled soots observed(mean agglomerate sizes not determined due to high statistical efforts and high soot loadings)
• Degree of graphitization in the same order (not studied in detail here)(please note, that high resolution TEM may induce microstructural effects of deposited soot particles!)
• Particles sampled after oxidation catalyst with proportional dilution system

© IAV · 03/2006 · DLK · ME-D1 · ETH Kraemer, Lutz.ppt 12
Experimental ResultsTransmission electron microscopy / O/C ratio
• Detailed EDX analysis yields O/C ratio (approx. 10 spectra/sample)
• O/C ratio increases with air/fuel ratio
• O/C ratio decreases with retardation of post injection
• No correlation between O/C ratio and deviation of PA from EC (PA/EC)
0
0.05
0.1
0.15
0.2
0.25
0.3
0.35
0.96 close 0.90 close 0.96retarded
0.90retarded
lean
O/C
ratio

© IAV · 03/2006 · DLK · ME-D1 · ETH Kraemer, Lutz.ppt 13
rich soot
• RAMAN spectroscopy (Renishaw; GRAMS/32) (9 fittings of each of 14 spectra per soot)
Experimental ResultsRAMAN spectroscopy
Low D1 full width at half maximumindicates high order of soot(high graphitization);D1 indicates a deffectivegraphitic lattice
High D3 amplitude indicates highproportion of amorphous carbon
Sample “Rich“ soot “Lean“ sootPosition 1585 ± 2 1589 ± 3 G FWHM 57 ± 3 58 ± 5 Position 1355 ± 2 1359 ± 2 FWHM 164 ± 4 176 ± 4 D1 ID1/IG 6.24 ± 1.04 7.65 ± 3.00
Position 1612 ± 2 1615 ± 2 FWHM 55 ± 2 55 ± 3 D2 ID2/IG 1.35 ± 0.37 1.45 ± 0.87
Position 1536 ± 5 1547 ± 4 FWHM 163 ± 4 156 ± 4 D3 ID3/IG 1.55 ± 0.26 1.88 ± 0.70
Position 1199 ± 7 1185 ± 10 D4 FWHM 214 ± 14 219 ± 17 ID1/(IG+ ID1+ ID2) 0.73 ± 0.01 0.76 ± 0.01
ID1/(IG+ ID2) 2.67 ± 0.19 3.11 ± 0.22 ID3/(IG+ ID2+ ID3) 0.40 ± 0.02 0.43 ± 0.02
• Both soots from the same engine result in comparable RAMAN spectra (exemplary)
• D1 and D3 intensities tend to be bigger for lean soot as is D1 FWHM
• RAMAN spectroscopy indicates trend of higher degree of graphitization for rich soot
• PA and Smoke measurement potentially very sensitive to degree of graphitization

© IAV · 03/2006 · DLK · ME-D1 · ETH Kraemer, Lutz.ppt 14
ConclusionLessons learned
1. Excellent correlation of soot measurement techniques under lean conditions
1. Soot properties under observed lean conditions constant
2. Impact of cross-sensitivities negligible (here)
2. Minor correlation of soot measurement techniques under rich conditions
3. Soot from rich combustion is a little different compared to lean combustion
1. Higher absorption coefficient -> (higher degree of graphitization)
2. Lower O/C ratio (less oxidation)
3. Higher mean agglomerate size
4. Same primary particle diameter
5. No significant morphologic differences observed (i.e. shape)
6. Lower reactivity expected (low O/C ratio and higher degree of graphitization)
4. Knowledge on measurement technique, calibration and sampling required
5. The application of a DPF favors avoiding rich combustion !
6. Outlook: What about advanced diesel combustion (ADCS) or GDI soot…?

Excellence in Automotive R&D
Thank you
Contact:
Dr. Lutz Krämer
IAV GmbH
Ingenieurgesellschaft für Auto und Verkehr
Carnotstrasse 1, 10587 Berlin (Germany)Phone: +49 30 39978-9378
Dr. Natalia Ivleva, IWC, TU Munich
Werner Dreher, NMI, Reutlingen
Roland Sommer, LTT, Erlangen
Dr. Axel Zerrath, TSI, Aachen
Frank Heimlich, Bernhard Kleiter, Jochen Schäffner, Mark Schidlowski, IAV

© IAV · 03/2006 · DLK · ME-D1 · ETH Kraemer, Lutz.ppt 16
AppendixSelected particulate measurement methods
Instrument Physical measurement principle Targeted soot properties Company
Gravimetric filter analysis
Proportional flow sampling (microtunnel), filter weighing
Total PM mass NOVA
Coulometry Coulometric determination of CO2 as a product of sampled soot oxidation
Elemental and organic carbon mass
IGF
TEM/EDX Transmission electron microscopy and energy dispersive X-ray analysis
Microstructure, morphology, qual. degree of graphitisation, elemental composition
EEPS Electrostatic classification and detection of charged particles
Particulate number and size distribution
Microsoot sensor
Photoacoustic spectroscopy Soot mass (absorption cross-section)
AVL
Opacity meter Transmission measurement Opacity (non-selective correlation to soot mass)
IAV
Smoke meter Filter transmission measurement Soot mass (Filter smoke number, FSN)
AVL
LI²SA Laser induced incandescence of soot particles
Soot mass (extrapolated) and primary particle size

© IAV · 03/2006 · DLK · ME-D1 · ETH Kraemer, Lutz.ppt 17
AppendixCorrelation of gravimetric weighing and chemical filter analysis
• Filters sampled from partial flow dilution system (NOVA microtunnel)
• Chemical filter analysis by carbon oxidation and subsequent CO2 detection
• Surprisingly good correlation in all operating regimes
• Elemental carbon content seems to be fairly constant (macroscopic)
y = 0.92xR2 = 0.99
0
50
100
150
200
250
300
350
400
0 50 100 150 200 250 300 350 400EC [mg/m³]
PM [m
g/m
³]
© IAV · 03/2006 · DLK · ME-D1 · ETH Kraemer, Lutz.ppt 18
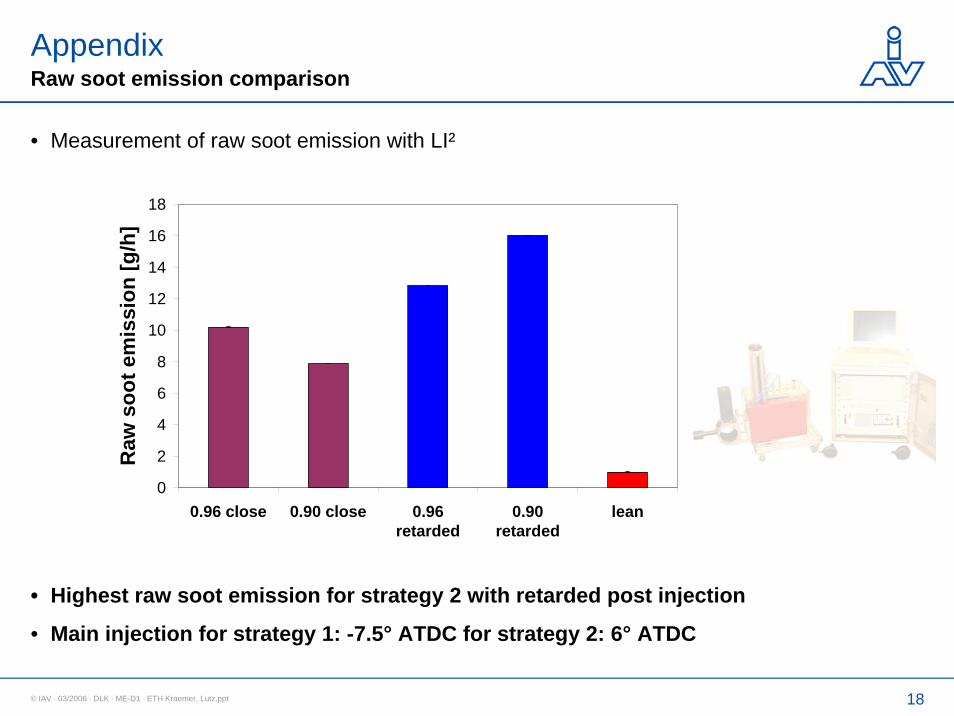
AppendixRaw soot emission comparison
• Measurement of raw soot emission with LI²
• Highest raw soot emission for strategy 2 with retarded post injection
• Main injection for strategy 1: -7.5° ATDC for strategy 2: 6° ATDC
0
2
4
6
8
10
12
14
16
18
0.96 close 0.90 close 0.96retarded
0.90retarded
lean
Raw
soo
t em
issi
on [g
/h]

© IAV · 03/2006 · DLK · ME-D1 · ETH Kraemer, Lutz.ppt 19
AppendixCorrelation of chemical filter analysis and particulate number
• Measurement of particulate sizes and concentration with engine exhaust particle sizer
• Usage of MATTER rotating disc diluter (see PMP)
• Not enough data for detailed correlation analysis
• Rough correlation between number concentration and soot mass -> const. density?
y = 3.3 105 xR2 = 0.91
0.0E+00
2.5E+07
5.0E+07
7.5E+07
1.0E+08
0 50 100 150 200 250 300EC [mg/m³]
Part
icul
ate
num
ber [
cm-3
]

© IAV · 03/2006 · DLK · ME-D1 · ETH Kraemer, Lutz.ppt 20
AppendixSecond look at transmission electron microscopy / O/C ratio
• Comparison of deviation from PA measurement and chemical analysis (EC) with O/C-ratio
0
0.5
1
1.5
2
2.5
0 0.05 0.1 0.15 0.2 0.25 0.3 0.35O/C ratio [-]
PA /
EC [-
]
• No correlation between O/C ratio and deviation of PA from EC (PA/EC)
• Soot particle oxidation is not solely the reason for the increasing absorption efficient
• Graphitization of soot particles could be a reason -> RAMAN spectroscopy

© IAV · 03/2006 · DLK · ME-D1 · ETH Kraemer, Lutz.ppt 21
• ATDC After top dead center
• BC Black carbon
• DPF Diesel particle filter
• EC Elemental carbon
• EDX Energy disperive x-ray spectroscopy
• EGR Exhaust gas recirculation
• FSN Filter smoke number
• IMEP Induced mean effetive pressure
• LI² Laser induced incandescence
• LI²SA LI² soot analyser
• LNT Lean NOX trap
• OC Organic carbon
• O/C ratio Oxygen/carbon ratio
• PA Photoacoustic(s)
• PM (Total) particulate matter
• PMP Particlulate measurement programme from the ECE/GRPE
• TEM Transmission electron microscopy
AppendixList of acronyms
[1] Kamm: Kinetic investigations of soot aerosol oxidation via ESR- and FTIR-spectroscopy, Ph.D., Karlsruhe 2000.[2] Kraemer: Microstructure of ultrafine aerosols and photoacoustic detection of soot aerosols, Ph. D., Munich 2001.[3] Jacob et al.: Diesel Soot: Microstructure and Oxidation Kinetics, Vienna Symposia 2003.[4] Su et al.: Mcrostructure and Oxidation Behaviour of Euro IV Diesel Engine Soot, Catalysis Today 2004.
50 nmSoot produced under
rich combustion