combustion in energy & transformation industries …
TRANSCRIPT
COMBUSTION IN ENERGY & TRANSFORMATION INDUSTRIES
ps010101 Activities 010101 - 010105
Emission Inventory Guidebook December, 2006 B111-1
SNAP CODES: (See below)
SOURCE ACTIVITY TITLE: COMBUSTION IN ENERGY & TRANSFORMATION INDUSTRIES
Combustion Plants as Point Sources
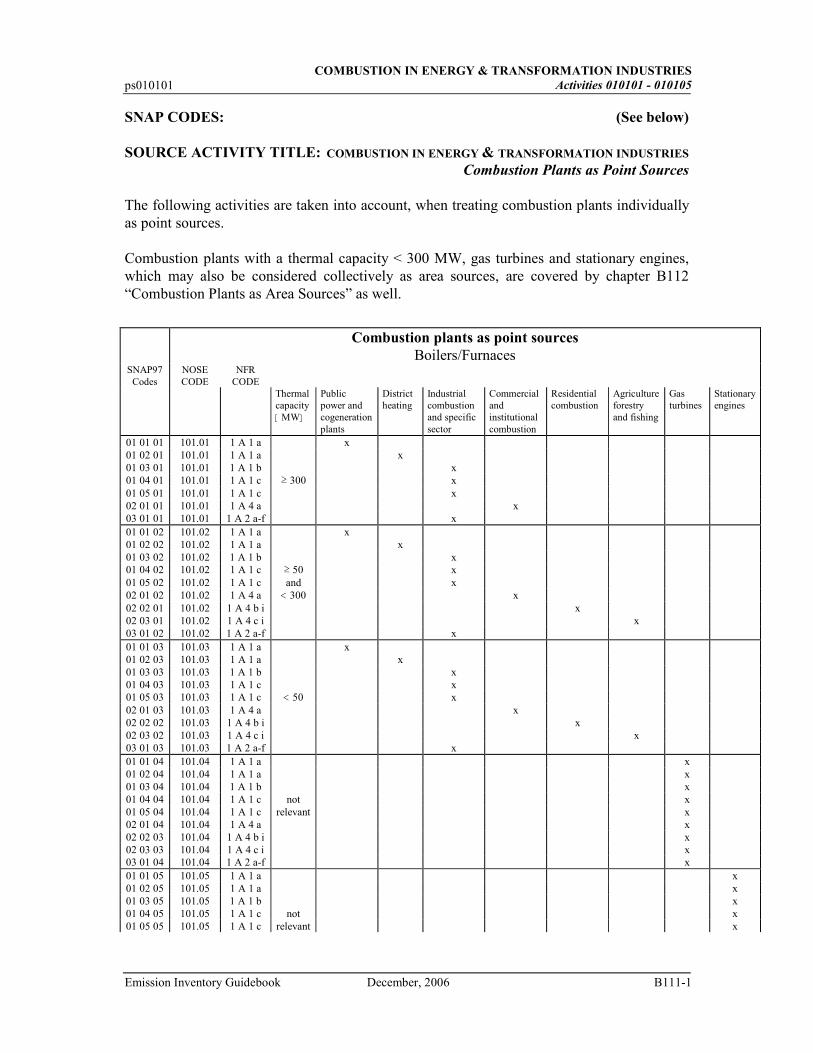
The following activities are taken into account, when treating combustion plants individually as point sources. Combustion plants with a thermal capacity < 300 MW, gas turbines and stationary engines, which may also be considered collectively as area sources, are covered by chapter B112 “Combustion Plants as Area Sources” as well.
Combustion plants as point sources
Boilers/Furnaces SNAP97 Codes
NOSE CODE
NFR CODE
Thermal capacity [MW]
Public power and cogeneration plants
District heating
Industrial combustion and specific sector
Commercial and institutional combustion
Residential combustion
Agriculture forestry and fishing
Gas turbines
Stationary engines
01 01 01 101.01 1 A 1 a x 01 02 01 101.01 1 A 1 a x 01 03 01 101.01 1 A 1 b x 01 04 01 101.01 1 A 1 c ≥ 300 x 01 05 01 101.01 1 A 1 c x 02 01 01 101.01 1 A 4 a x 03 01 01 101.01 1 A 2 a-f x 01 01 02 101.02 1 A 1 a x 01 02 02 101.02 1 A 1 a x 01 03 02 101.02 1 A 1 b x 01 04 02 101.02 1 A 1 c ≥ 50 x 01 05 02 101.02 1 A 1 c and x 02 01 02 101.02 1 A 4 a < 300 x 02 02 01 101.02 1 A 4 b i x 02 03 01 101.02 1 A 4 c i x 03 01 02 101.02 1 A 2 a-f x 01 01 03 101.03 1 A 1 a x 01 02 03 101.03 1 A 1 a x 01 03 03 101.03 1 A 1 b x 01 04 03 101.03 1 A 1 c x 01 05 03 101.03 1 A 1 c < 50 x 02 01 03 101.03 1 A 4 a x 02 02 02 101.03 1 A 4 b i x 02 03 02 101.03 1 A 4 c i x 03 01 03 101.03 1 A 2 a-f x 01 01 04 101.04 1 A 1 a x 01 02 04 101.04 1 A 1 a x 01 03 04 101.04 1 A 1 b x 01 04 04 101.04 1 A 1 c not x 01 05 04 101.04 1 A 1 c relevant x 02 01 04 101.04 1 A 4 a x 02 02 03 101.04 1 A 4 b i x 02 03 03 101.04 1 A 4 c i x 03 01 04 101.04 1 A 2 a-f x 01 01 05 101.05 1 A 1 a x 01 02 05 101.05 1 A 1 a x 01 03 05 101.05 1 A 1 b x 01 04 05 101.05 1 A 1 c not x 01 05 05 101.05 1 A 1 c relevant x
COMBUSTION IN ENERGY & TRANSFORMATION INDUSTRIES Activities 010101 - 010105 ps010101
B111-2 December, 2006 Emission Inventory Guidebook
Combustion plants as point sources
Boilers/Furnaces SNAP97 Codes
NOSE CODE
NFR CODE
Thermal capacity [MW]
Public power and cogeneration plants
District heating
Industrial combustion and specific sector
Commercial and institutional combustion
Residential combustion
Agriculture forestry and fishing
Gas turbines
Stationary engines
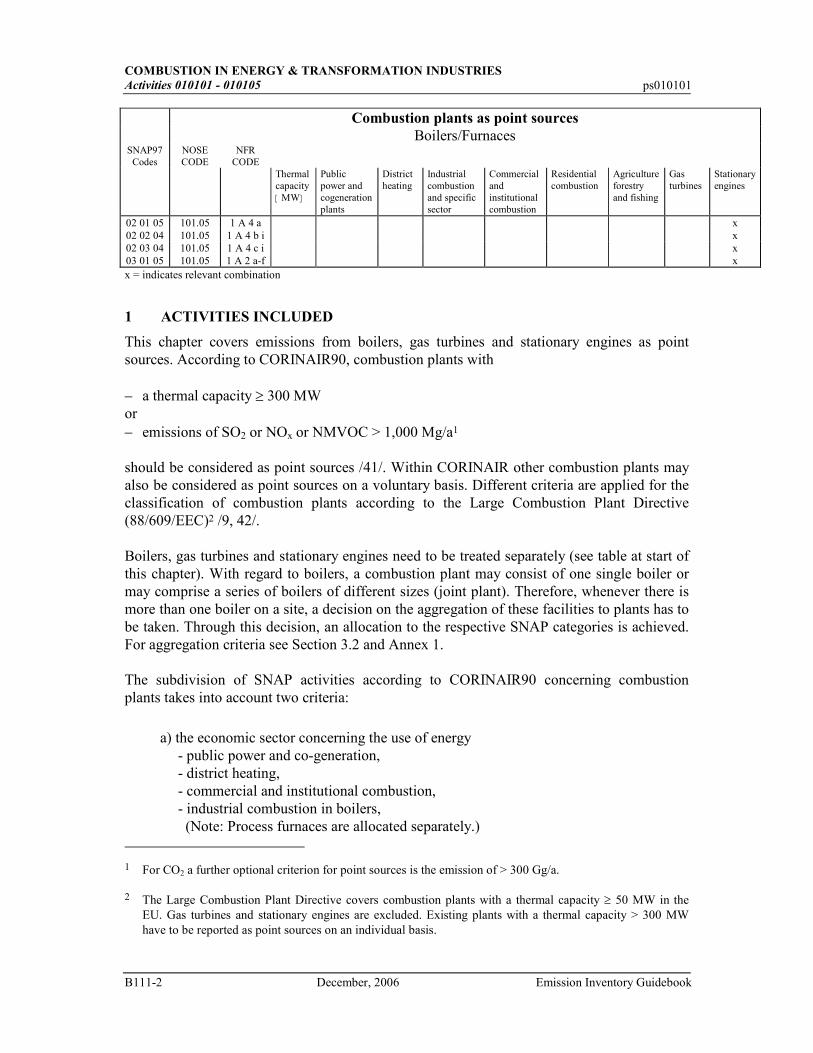
02 01 05 101.05 1 A 4 a x 02 02 04 101.05 1 A 4 b i x 02 03 04 101.05 1 A 4 c i x 03 01 05 101.05 1 A 2 a-f x x = indicates relevant combination
1 ACTIVITIES INCLUDED
This chapter covers emissions from boilers, gas turbines and stationary engines as point sources. According to CORINAIR90, combustion plants with − a thermal capacity ≥ 300 MW or − emissions of SO2 or NOx or NMVOC > 1,000 Mg/a1 should be considered as point sources /41/. Within CORINAIR other combustion plants may also be considered as point sources on a voluntary basis. Different criteria are applied for the classification of combustion plants according to the Large Combustion Plant Directive (88/609/EEC)2 /9, 42/. Boilers, gas turbines and stationary engines need to be treated separately (see table at start of this chapter). With regard to boilers, a combustion plant may consist of one single boiler or may comprise a series of boilers of different sizes (joint plant). Therefore, whenever there is more than one boiler on a site, a decision on the aggregation of these facilities to plants has to be taken. Through this decision, an allocation to the respective SNAP categories is achieved. For aggregation criteria see Section 3.2 and Annex 1. The subdivision of SNAP activities according to CORINAIR90 concerning combustion plants takes into account two criteria:
a) the economic sector concerning the use of energy - public power and co-generation, - district heating, - commercial and institutional combustion, - industrial combustion in boilers, (Note: Process furnaces are allocated separately.)
1 For CO2 a further optional criterion for point sources is the emission of > 300 Gg/a.
2 The Large Combustion Plant Directive covers combustion plants with a thermal capacity ≥ 50 MW in the EU. Gas turbines and stationary engines are excluded. Existing plants with a thermal capacity > 300 MW have to be reported as point sources on an individual basis.
COMBUSTION IN ENERGY & TRANSFORMATION INDUSTRIES
ps010101 Activities 010101 - 010105
Emission Inventory Guidebook December, 2006 B111-3
b) the technical characteristics - with respect to boilers, the installed thermal capacity, - ≥ 300 MW, - ≥ 50 to < 300 MW, - ≤ 50 MW, - other combustion technologies, - gas turbines, - stationary engines.
Emissions considered in this section are released by a controlled combustion process (boiler emissions, emissions from the combustion chamber of gas turbines or stationary engines), taking into account primary reduction measures, such as furnace optimisation inside the boiler or the combustion chamber, and secondary reduction measures downstream of the boiler or the combustion chamber. Solid, liquid or gaseous fuels are used, where solid fuels comprise coal, coke, biomass and waste (as far as waste is used to generate heat or power). In addition, a non-combustion process can be a source of ammonia emissions, namely ammonia slip in connection with several NOx abatement techniques. 2 CONTRIBUTION TO TOTAL EMISSIONS
This section covers emissions of SOx, NOx, CO, CO2, NMVOC, CH4, N2O, NH3 and heavy
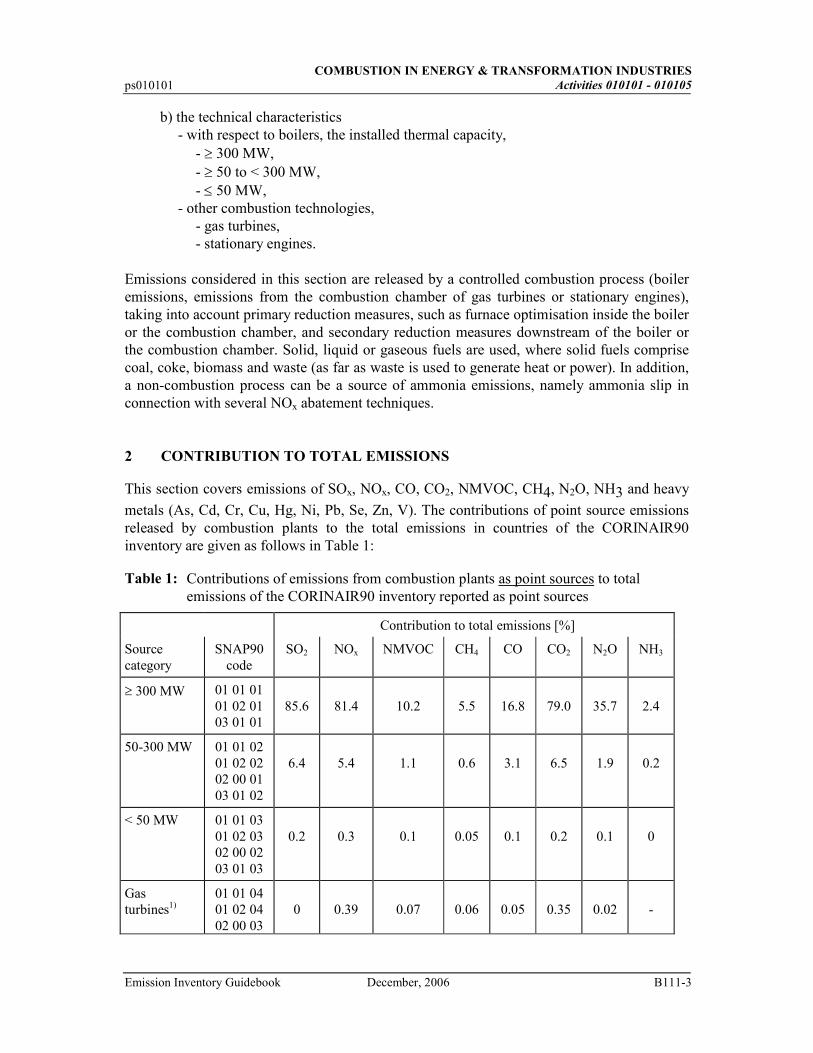
metals (As, Cd, Cr, Cu, Hg, Ni, Pb, Se, Zn, V). The contributions of point source emissions released by combustion plants to the total emissions in countries of the CORINAIR90 inventory are given as follows in Table 1:
Table 1: Contributions of emissions from combustion plants as point sources to total emissions of the CORINAIR90 inventory reported as point sources
Contribution to total emissions [%]
Source category
SNAP90 code
SO2 NOx NMVOC CH4 CO CO2 N2O NH3
≥ 300 MW 01 01 01 01 02 01 03 01 01
85.6
81.4
10.2
5.5
16.8
79.0
35.7
2.4
50-300 MW 01 01 02 01 02 02 02 00 01 03 01 02
6.4
5.4
1.1
0.6
3.1
6.5
1.9
0.2
< 50 MW 01 01 03 01 02 03 02 00 02 03 01 03
0.2
0.3
0.1
0.05
0.1
0.2
0.1
0
Gas turbines1)
01 01 04 01 02 04 02 00 03
0
0.39
0.07
0.06
0.05
0.35
0.02
-
COMBUSTION IN ENERGY & TRANSFORMATION INDUSTRIES Activities 010101 - 010105 ps010101
B111-4 December, 2006 Emission Inventory Guidebook
03 01 04
Stationary engines1)
01 01 05 01 02 05 02 00 04 03 01 05
0.04
0.10
0.04
0
0.01
0.02
0
-
- : no emissions are reported
0 : emissions are reported, but the precise number is under the rounding limit 1) Gas turbines and stationary engines may be reported either as point or as area sources.
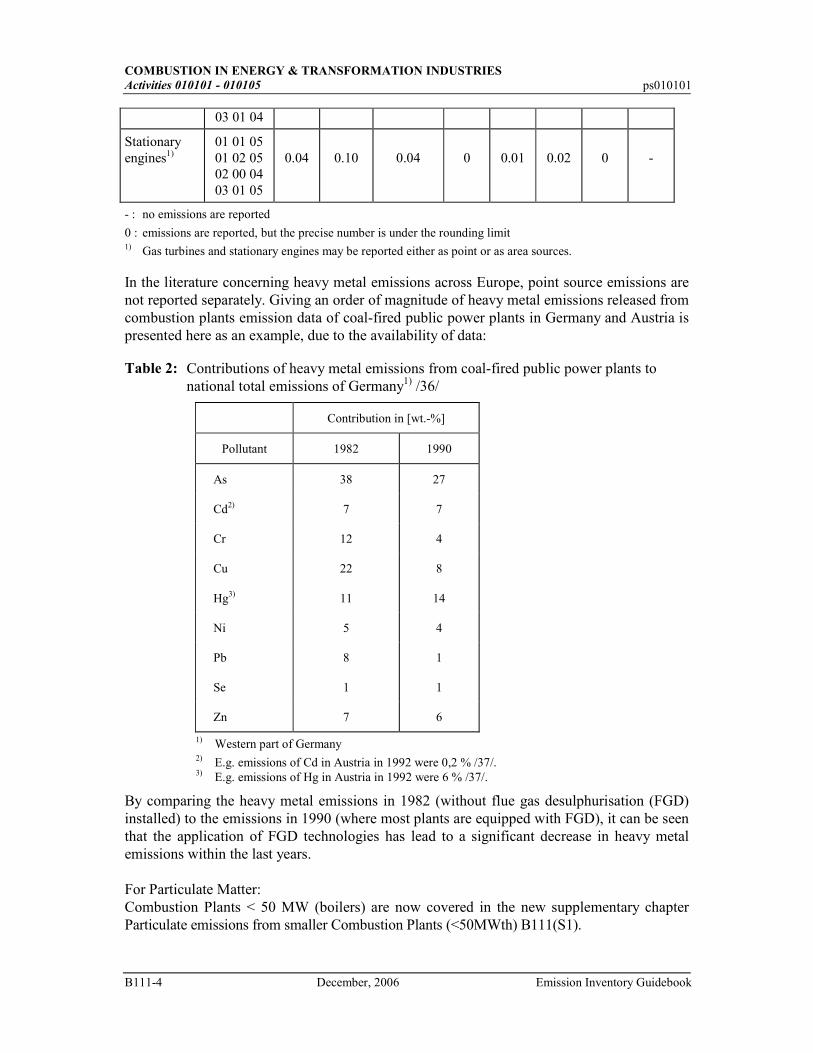
In the literature concerning heavy metal emissions across Europe, point source emissions are not reported separately. Giving an order of magnitude of heavy metal emissions released from combustion plants emission data of coal-fired public power plants in Germany and Austria is presented here as an example, due to the availability of data:
Table 2: Contributions of heavy metal emissions from coal-fired public power plants to national total emissions of Germany1) /36/
Contribution in [wt.-%]
Pollutant 1982 1990
As 38 27
Cd2) 7 7
Cr 12 4
Cu 22 8
Hg3) 11 14
Ni 5 4
Pb 8 1
Se 1 1
Zn 7 6
1) Western part of Germany 2) E.g. emissions of Cd in Austria in 1992 were 0,2 % /37/. 3) E.g. emissions of Hg in Austria in 1992 were 6 % /37/.
By comparing the heavy metal emissions in 1982 (without flue gas desulphurisation (FGD) installed) to the emissions in 1990 (where most plants are equipped with FGD), it can be seen that the application of FGD technologies has lead to a significant decrease in heavy metal emissions within the last years. For Particulate Matter: Combustion Plants < 50 MW (boilers) are now covered in the new supplementary chapter Particulate emissions from smaller Combustion Plants (<50MWth) B111(S1).
COMBUSTION IN ENERGY & TRANSFORMATION INDUSTRIES
ps010101 Activities 010101 - 010105
Emission Inventory Guidebook December, 2006 B111-5
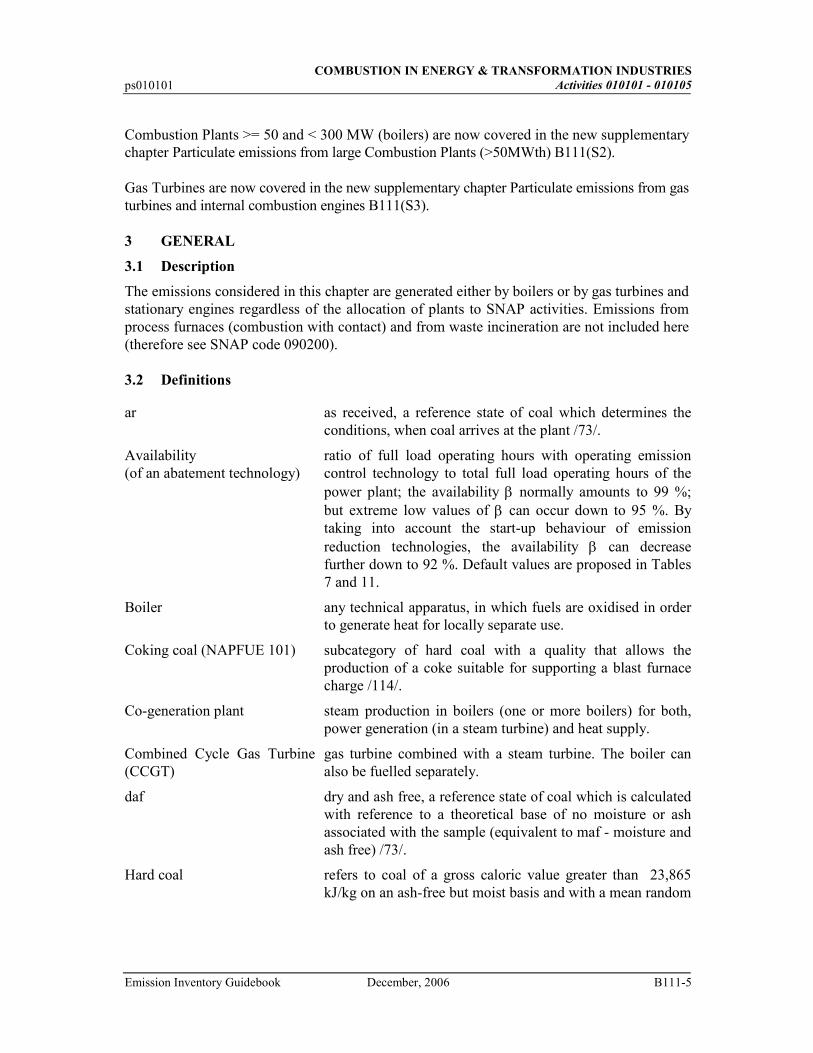
Combustion Plants >= 50 and < 300 MW (boilers) are now covered in the new supplementary chapter Particulate emissions from large Combustion Plants (>50MWth) B111(S2). Gas Turbines are now covered in the new supplementary chapter Particulate emissions from gas turbines and internal combustion engines B111(S3). 3 GENERAL
3.1 Description
The emissions considered in this chapter are generated either by boilers or by gas turbines and stationary engines regardless of the allocation of plants to SNAP activities. Emissions from process furnaces (combustion with contact) and from waste incineration are not included here (therefore see SNAP code 090200). 3.2 Definitions
ar as received, a reference state of coal which determines the conditions, when coal arrives at the plant /73/.
Availability (of an abatement technology)
ratio of full load operating hours with operating emission control technology to total full load operating hours of the power plant; the availability β normally amounts to 99 %; but extreme low values of β can occur down to 95 %. By taking into account the start-up behaviour of emission reduction technologies, the availability β can decrease further down to 92 %. Default values are proposed in Tables 7 and 11.
Boiler any technical apparatus, in which fuels are oxidised in order to generate heat for locally separate use.
Coking coal (NAPFUE 101) subcategory of hard coal with a quality that allows the production of a coke suitable for supporting a blast furnace charge /114/.
Co-generation plant steam production in boilers (one or more boilers) for both, power generation (in a steam turbine) and heat supply.
Combined Cycle Gas Turbine (CCGT)
gas turbine combined with a steam turbine. The boiler can also be fuelled separately.
daf dry and ash free, a reference state of coal which is calculated with reference to a theoretical base of no moisture or ash associated with the sample (equivalent to maf - moisture and ash free) /73/.
Hard coal refers to coal of a gross caloric value greater than 23,865 kJ/kg on an ash-free but moist basis and with a mean random
COMBUSTION IN ENERGY & TRANSFORMATION INDUSTRIES Activities 010101 - 010105 ps010101
B111-6 December, 2006 Emission Inventory Guidebook
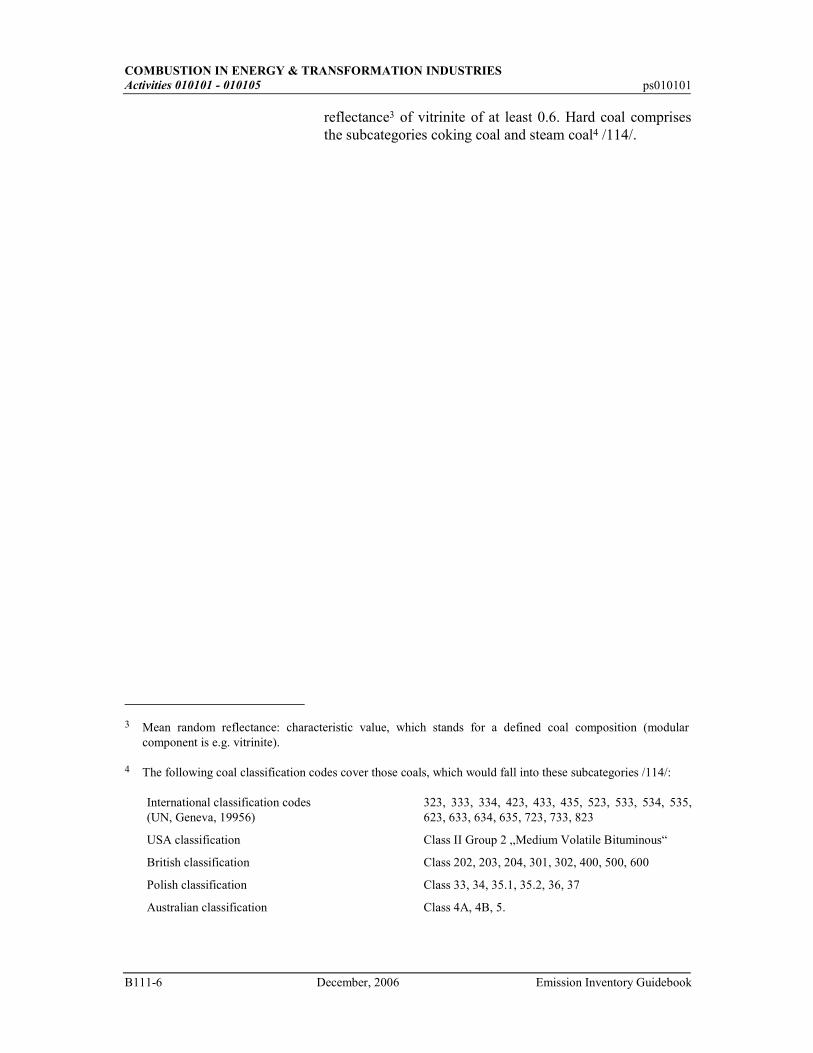
reflectance3 of vitrinite of at least 0.6. Hard coal comprises the subcategories coking coal and steam coal4 /114/.
3 Mean random reflectance: characteristic value, which stands for a defined coal composition (modular
component is e.g. vitrinite).
4 The following coal classification codes cover those coals, which would fall into these subcategories /114/:
International classification codes (UN, Geneva, 19956)
323, 333, 334, 423, 433, 435, 523, 533, 534, 535, 623, 633, 634, 635, 723, 733, 823
USA classification Class II Group 2 „Medium Volatile Bituminous“
British classification Class 202, 203, 204, 301, 302, 400, 500, 600
Polish classification Class 33, 34, 35.1, 35.2, 36, 37
Australian classification Class 4A, 4B, 5.
COMBUSTION IN ENERGY & TRANSFORMATION INDUSTRIES
ps010101 Activities 010101 - 010105
Emission Inventory Guidebook December, 2006 B111-7
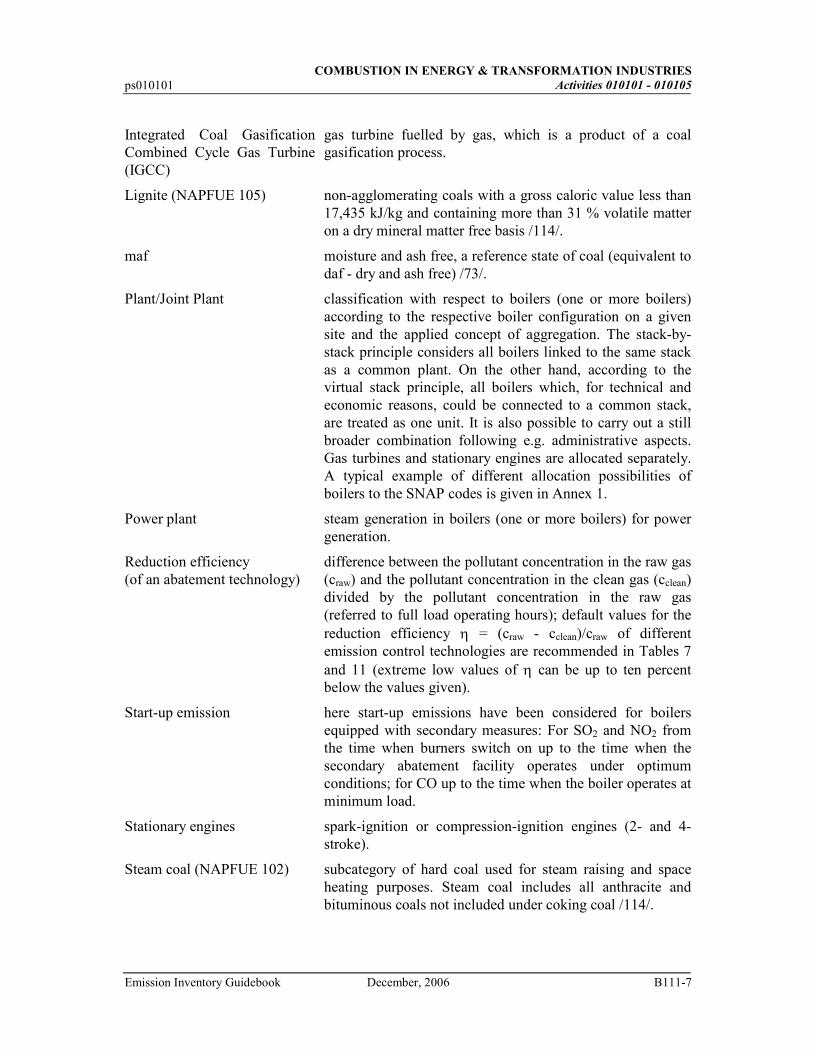
Integrated Coal Gasification Combined Cycle Gas Turbine (IGCC)
gas turbine fuelled by gas, which is a product of a coal gasification process.
Lignite (NAPFUE 105) non-agglomerating coals with a gross caloric value less than 17,435 kJ/kg and containing more than 31 % volatile matter on a dry mineral matter free basis /114/.
maf moisture and ash free, a reference state of coal (equivalent to daf - dry and ash free) /73/.
Plant/Joint Plant classification with respect to boilers (one or more boilers) according to the respective boiler configuration on a given site and the applied concept of aggregation. The stack-by-stack principle considers all boilers linked to the same stack as a common plant. On the other hand, according to the virtual stack principle, all boilers which, for technical and economic reasons, could be connected to a common stack, are treated as one unit. It is also possible to carry out a still broader combination following e.g. administrative aspects. Gas turbines and stationary engines are allocated separately. A typical example of different allocation possibilities of boilers to the SNAP codes is given in Annex 1.
Power plant steam generation in boilers (one or more boilers) for power generation.
Reduction efficiency (of an abatement technology)
difference between the pollutant concentration in the raw gas (craw) and the pollutant concentration in the clean gas (cclean) divided by the pollutant concentration in the raw gas (referred to full load operating hours); default values for the reduction efficiency η = (craw - cclean)/craw of different emission control technologies are recommended in Tables 7 and 11 (extreme low values of η can be up to ten percent below the values given).
Start-up emission here start-up emissions have been considered for boilers equipped with secondary measures: For SO2 and NO2 from the time when burners switch on up to the time when the secondary abatement facility operates under optimum conditions; for CO up to the time when the boiler operates at minimum load.
Stationary engines spark-ignition or compression-ignition engines (2- and 4-stroke).
Steam coal (NAPFUE 102) subcategory of hard coal used for steam raising and space heating purposes. Steam coal includes all anthracite and bituminous coals not included under coking coal /114/.
COMBUSTION IN ENERGY & TRANSFORMATION INDUSTRIES Activities 010101 - 010105 ps010101
B111-8 December, 2006 Emission Inventory Guidebook
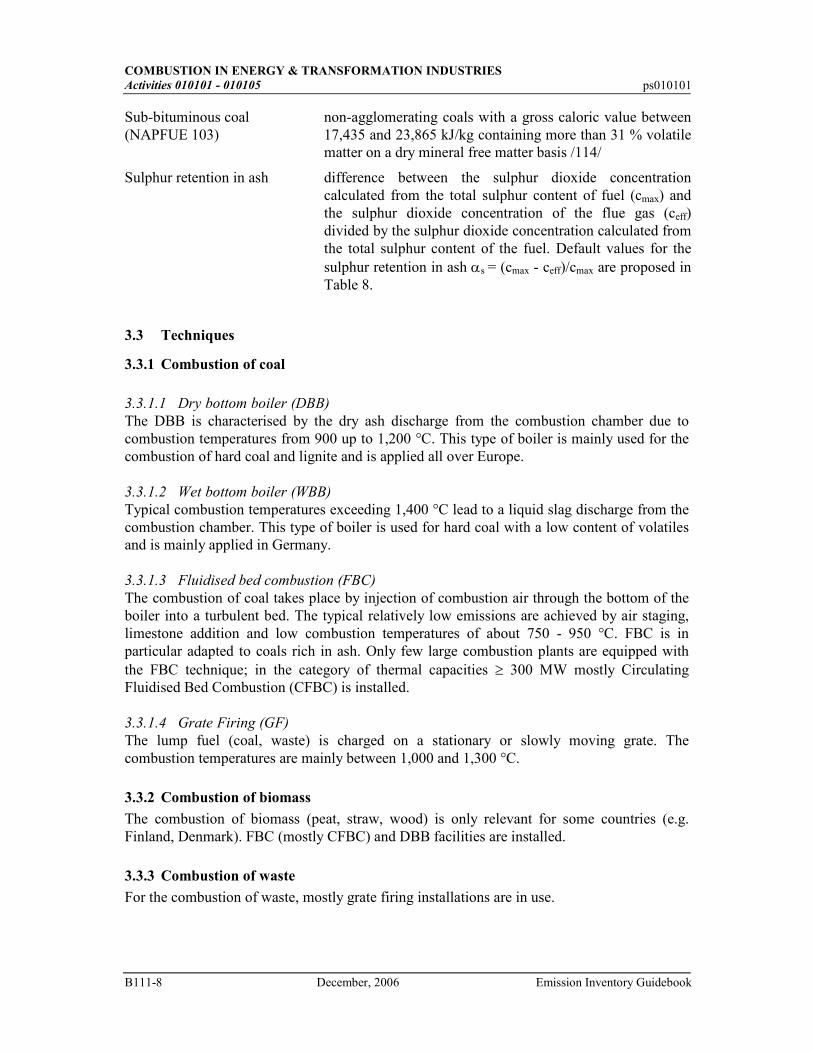
Sub-bituminous coal (NAPFUE 103)
non-agglomerating coals with a gross caloric value between 17,435 and 23,865 kJ/kg containing more than 31 % volatile matter on a dry mineral free matter basis /114/
Sulphur retention in ash difference between the sulphur dioxide concentration calculated from the total sulphur content of fuel (cmax) and the sulphur dioxide concentration of the flue gas (ceff) divided by the sulphur dioxide concentration calculated from the total sulphur content of the fuel. Default values for the sulphur retention in ash αs = (cmax - ceff)/cmax are proposed in Table 8.
3.3 Techniques
3.3.1 Combustion of coal
3.3.1.1 Dry bottom boiler (DBB)
The DBB is characterised by the dry ash discharge from the combustion chamber due to combustion temperatures from 900 up to 1,200 °C. This type of boiler is mainly used for the combustion of hard coal and lignite and is applied all over Europe. 3.3.1.2 Wet bottom boiler (WBB)
Typical combustion temperatures exceeding 1,400 °C lead to a liquid slag discharge from the combustion chamber. This type of boiler is used for hard coal with a low content of volatiles and is mainly applied in Germany. 3.3.1.3 Fluidised bed combustion (FBC)
The combustion of coal takes place by injection of combustion air through the bottom of the boiler into a turbulent bed. The typical relatively low emissions are achieved by air staging, limestone addition and low combustion temperatures of about 750 - 950 °C. FBC is in particular adapted to coals rich in ash. Only few large combustion plants are equipped with the FBC technique; in the category of thermal capacities ≥ 300 MW mostly Circulating Fluidised Bed Combustion (CFBC) is installed. 3.3.1.4 Grate Firing (GF)
The lump fuel (coal, waste) is charged on a stationary or slowly moving grate. The combustion temperatures are mainly between 1,000 and 1,300 °C.
3.3.2 Combustion of biomass
The combustion of biomass (peat, straw, wood) is only relevant for some countries (e.g. Finland, Denmark). FBC (mostly CFBC) and DBB facilities are installed.
3.3.3 Combustion of waste
For the combustion of waste, mostly grate firing installations are in use.
COMBUSTION IN ENERGY & TRANSFORMATION INDUSTRIES
ps010101 Activities 010101 - 010105
Emission Inventory Guidebook December, 2006 B111-9
3.3.4 Combustion of gas/oil
3.3.4.1 Combustion in boilers (general aspects of the combustion techniques)
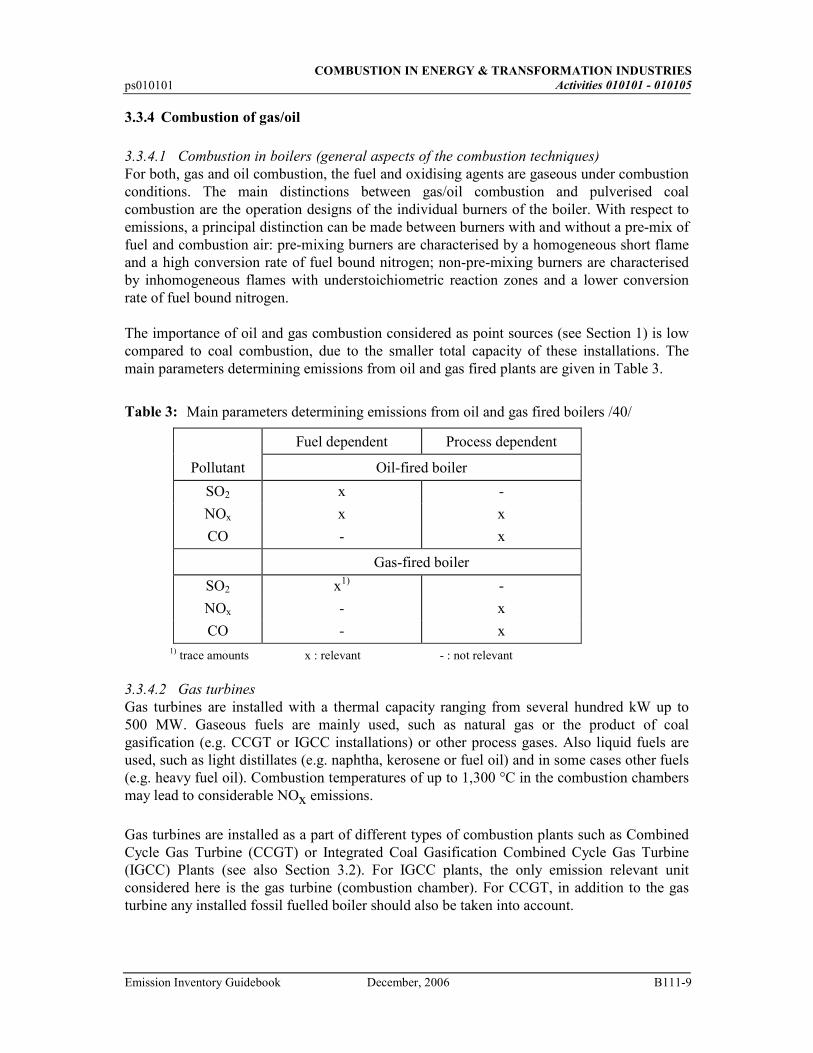
For both, gas and oil combustion, the fuel and oxidising agents are gaseous under combustion conditions. The main distinctions between gas/oil combustion and pulverised coal combustion are the operation designs of the individual burners of the boiler. With respect to emissions, a principal distinction can be made between burners with and without a pre-mix of fuel and combustion air: pre-mixing burners are characterised by a homogeneous short flame and a high conversion rate of fuel bound nitrogen; non-pre-mixing burners are characterised by inhomogeneous flames with understoichiometric reaction zones and a lower conversion rate of fuel bound nitrogen. The importance of oil and gas combustion considered as point sources (see Section 1) is low compared to coal combustion, due to the smaller total capacity of these installations. The main parameters determining emissions from oil and gas fired plants are given in Table 3.
Table 3: Main parameters determining emissions from oil and gas fired boilers /40/
Fuel dependent Process dependent
Pollutant Oil-fired boiler
SO2 x -
NOx x x
CO - x
Gas-fired boiler
SO2 x1) -
NOx - x
CO - x 1) trace amounts x : relevant - : not relevant
3.3.4.2 Gas turbines
Gas turbines are installed with a thermal capacity ranging from several hundred kW up to 500 MW. Gaseous fuels are mainly used, such as natural gas or the product of coal gasification (e.g. CCGT or IGCC installations) or other process gases. Also liquid fuels are used, such as light distillates (e.g. naphtha, kerosene or fuel oil) and in some cases other fuels (e.g. heavy fuel oil). Combustion temperatures of up to 1,300 °C in the combustion chambers may lead to considerable NOx emissions.
Gas turbines are installed as a part of different types of combustion plants such as Combined Cycle Gas Turbine (CCGT) or Integrated Coal Gasification Combined Cycle Gas Turbine (IGCC) Plants (see also Section 3.2). For IGCC plants, the only emission relevant unit considered here is the gas turbine (combustion chamber). For CCGT, in addition to the gas turbine any installed fossil fuelled boiler should also be taken into account.
COMBUSTION IN ENERGY & TRANSFORMATION INDUSTRIES Activities 010101 - 010105 ps010101
B111-10 December, 2006 Emission Inventory Guidebook
3.3.4.3 Stationary engines
Stationary engines are installed as spark-ignition engines and compression-ignition engines (2- and 4-stroke) with electrical outputs ranging from less than 100 kW to over 10 MW (e.g. in co-generation plants) /cf. 46/. Both types represent relevant emission sources. 3.4 Emissions
Relevant pollutants are sulphur oxides (SOx), nitrogen oxides (NOx), carbon dioxide (CO2) and heavy metals (arsenic (As), cadmium (Cd), chromium (Cr), copper (Cu), mercury (Hg), nickel (Ni), lead (Pb), selenium (Se), zinc (Zn) and in the case of heavy oil also vanadium (V)). Emissions of volatile organic compounds (non-methane VOC and methane (CH4)),
nitrous oxide (N2O), carbon monoxide (CO) and ammonia (NH3) are of less importance. For
species profiles of selected pollutants see section 9. The emissions are released through the stack. Fugitive emissions (from seals etc.) can be neglected for combustion plants. The emissions of sulphur oxides (SOx) are directly related to the sulphur content of the fuel, which for coal normally varies between 0.3 and 1.2 wt.-% (maf) (up to an extreme value of 4.5 wt.-%) and for fuel oil (including heavy fuel oil) from 0.3 up to 3.0 wt.-% /15, 16/; usually, the sulphur content of gas is negligible. Sulphur appears in coal as pyritic sulphur (FeS2), organic sulphur, sulphur salts and elemental sulphur. A major part of the sulphur in coal comes from pyritic and organic sulphur; both types are responsible for SOx formation. The total sulphur content of coal is usually determined by wet chemical methods; by comparison with results from the X-ray method, it has been found that standard analytical procedures may overestimate the organic sulphur content of coal /30/. The uncertainty introduced by the analytical procedures should be determined by further research. For nitric oxide (NO, together with NO2 normally expressed as nitrogen oxides NOx) three different formation mechanisms have to be distinguished (see also Section 9):
-formation of "fuel-NO" from the conversion of chemically bound nitrogen in the fuel (NOfuel),
-formation of "thermal-NO" from the fixation of atmospheric nitrogen coming from the combustion air (NOthermal),
-formation of "prompt-NO".
In the temperature range considered (up to 1,700 °C) the formation of "prompt6-NO" can be neglected. The majority of NOx emissions from coal combustion (80 to more than 90 %) is formed from fuel nitrogen. Depending on combustion temperatures, the portion of thermal-NOx formed is lower than 20 %. The content of nitrogen in solid fuels varies: for hard coal between 0.2 and 3.5 wt.-% (maf), for lignite between 0.4 and 2.5 wt.-% (maf), for coke between 0.6 and 1.55 wt.-% (maf), for peat between 0.7 and 3.4 wt.-% (maf), for wood between 0.1 and 0.3 wt.-% (maf), and for waste between 0.3 and 1.4 wt.-% (maf) /17/. The content of nitrogen in liquid fuels varies for heavy fuel oil between 0.1 and 0.8 wt.-%, and for
COMBUSTION IN ENERGY & TRANSFORMATION INDUSTRIES
ps010101 Activities 010101 - 010105
Emission Inventory Guidebook December, 2006 B111-11
fuel oil between 0.005 and 0.07 wt.-% /17/. Natural gas contains no organically bound nitrogen. The content of molecular nitrogen in natural gas has no influence on the formation of fuel-NO; only thermal-NO is formed. Emissions of non-methane volatile organic compounds (NMVOC), e.g. olefins, ketones, aldehydes, result from incomplete combustion. Furthermore, unreacted fuel compounds such as methane (CH4) can be emitted. The relevance of NMVOC/CH4 emissions from boilers,
which are often reported together as VOC, is very low for large-sized combustion plants. VOC emissions tend to decrease as the plant size increases (cf. /24/). Carbon monoxide (CO) appears always as an intermediate product of the combustion process and in particular under understoichiometric combustion conditions. However, the relevance of CO released from combustion plants is not very high compared to CO2. The formation mechanisms of CO, thermal-NO and VOC are similarly influenced by combustion conditions. Carbon dioxide (CO2) is a main product from the combustion of all fossil fuels. The CO2 emission is directly related to the carbon content of fuels. The content of carbon varies for hard and brown coal between 61 and 87 wt.-% (maf), for wood it is about 50 wt.-% and for gas oil and heavy fuel oil about 85 wt.-% . The formation mechanism of nitrous oxide (N2O) has not yet been completely clarified. There is a possible formation mechanism based on intermediate products (HCN, NH3), which is
comparable to the formation of NO /55/. It has been found, that lower combustion temperatures, particularly below 1,000 °C, cause higher N2O emissions /13/. At lower temperatures the N2O molecule is relatively stable; at higher temperatures the N2O formed is reduced to N2 /55/. Compared to emissions from conventional stationary combustion units, nitrous oxides from either bubbling, circulating or pressurised fluidised bed combustion are relatively high /13, 14/. In laboratory experiments, it has been found that nitrous oxide is formed by Selective Catalytic Reduction (SCR) processes, passing a maximum at, or close to, the optimum temperature "window" of the SCR process /13/. Emissions of ammonia (NH3) are not caused by a combustion process; the emissions result from incomplete reaction of NH3 additive in the denitrification process (slip of ammonia in SCR and SNCR units). Most of the heavy metals considered (As, Cd, Cr, Cu, Hg, Ni, Pb, Se, Zn, V) are normally released as compounds (e.g. oxides, chlorides) in association with particulates. Only Hg and Se are at least partly present in the vapour phase. Less volatile elements tend to condense onto the surface of smaller particles in the flue gas stream. Therefore, an enrichment in the finest particle fractions is observed. The content of heavy metals in coal is normally several orders of magnitude higher than in oil (except occasionally for Ni and V in heavy fuel oil) and in natural gas. For natural gas only emissions of mercury are relevant. The concentrations are reported to be in the range of 2 - 5 µg/m3 for natural gas /35, 63/. During the combustion of coal, particles undergo complex changes which lead to vaporisation of volatile elements. The rate of volatilisation of heavy metal compounds depends on fuel characteristics (e.g.
COMBUSTION IN ENERGY & TRANSFORMATION INDUSTRIES Activities 010101 - 010105 ps010101
B111-12 December, 2006 Emission Inventory Guidebook
concentrations in coal, fraction of inorganic components, such as calcium) and on technology characteristics (e.g. type of boiler, operation mode). From DBB, all heavy metals of concern are emitted as particulate matter, except Hg and Se. Emissions from lignite fired DBB are potentially lower than from hard coal, as the trace element content in lignite and the combustion temperatures are lower. In WBB, the recirculation of fly ash is a common operation mode, which creates an important increase in heavy metal concentrations in the raw gas. Heavy metal emissions from FBC units are expected to be lower due to the lower operating temperatures and a smaller fraction of fine particles. The addition of limestone in FBC facilities might reduce the emission of some heavy metals, corresponding to an increased retention of heavy metals in the bottom ash. This effect can be partially compensated by the increase in the fraction of fine particulates in the flue gas leading to increased emissions from particulates highly enriched by heavy metals. High concentrations of As poison denitrification catalysts. Therefore, Selected Catalytic Reduction plants (SCR) in a high-dust configuration may require special measures (e.g. reduction of fly ash recirculation). /10, 11, 12/ 3.5 Controls
Relevant abatement technologies for SOx, NOx and heavy metals are outlined below. Abatement techniques for gas turbines and stationary engines are treated separately. Average reduction efficiencies and availabilities of abatement technologies for SOx and NOx are summarised in Tables 7, 10, and 11. Due to the fact, that most published studies do not clearly distinguish between SOx and SO2, for the following chapters, it can be assumed that SO2 includes SO3, if not stated otherwise.
3.5.1 Sulphur oxides: Flue Gas Desulphurisation Processes (FGD) (Secondary
measures) /cf. 18/
FGD processes are designed to remove SO2 from the flue gas of combustion installations. Most processes, like the wet scrubbing process (WS), the spray dryer absorption (SDA), the dry sorbent injection (DSI) and the Walther process (WAP) are based on the reaction of the SO2 with an alkaline agent added as solid or as suspension/solution of the agent in water to form the respective salts. In secondary reactions also SO3, fluorides and chlorides are removed. In the case of the DESONOX process (see Section 3.5.4.2), the SO2 is catalytically oxidised to SO3 and reacts with water to form sulphuric acid. The Activated Carbon process (see Section 3.5.4.1) and the Wellman-Lord process remove the SO2 to produce a SO2 rich gas, which may be further processed to sulphur or sulphuric acid. 3.5.1.1 Lime/Limestone Wet Scrubbing (WS)
The pollutants are removed from the flue gas by chemical reactions with an alkaline liquid (suspension of calcium compounds in water). The main product is gypsum. The WS process represents about 90 % of the total FGD-equipped electrical capacity installed in European OECD countries. Facilities are in operation at combustion units using hard coal, lignite and oil with sulphur contents from about 0.8 to more than 3.0 wt.-%. Other fossil fuels (such as peat) are presently rarely used at combustion plants with a thermal capacity ≥ 300 MW. The SO2 reduction efficiency is > 90 %.
COMBUSTION IN ENERGY & TRANSFORMATION INDUSTRIES
ps010101 Activities 010101 - 010105
Emission Inventory Guidebook December, 2006 B111-13
3.5.1.2 Spray Dryer Absorption (SDA)
The SDA process removes the pollutant components from flue gas of fossil fired combustion
units by injection of Ca(OH)2. The process forms a dry by-product (CaSO3.1/2 H2O). This
technology covers about 8 % of the total FGD-equipped electrical capacity installed in the European OECD countries. The SDA process is mostly in use at hard coal fired combustion units (sulphur content of fuel up to 3 wt.-%). Recent pilot studies have shown that this technique is also operational with other fossil fuels (oil, lignite, peat). The SO2 reduction efficiency is > 90 %. 3.5.1.3 Dry Sorbent Injection (DSI, LIFAC Process)
The DSI process is based on a gas/solid reaction of the flue gas and a dry sorbent (e.g. lime/limestone, sodium hydrogen carbonate NaHCO3) inside the boiler. There are three
different process types according to the injection point of the additive into the boiler (e.g. primary or secondary air, flame front). The by-products are a dry mixture of the respective salts (mostly CaSO4). Only few power plants (some 5 % of the total FGD-equipped electrical
capacity installed in European OECD countries) are equipped with this technology due to its low SO2 reduction efficiency of 40 - 50 %, which is not sufficient to meet the emission standards of some countries. DSI processes are presently in use for hard coal, lignite, oil and coal/oil fired boilers. The optimum reduction efficiency is obtained for the sulphur contents of fuel between 0.5 and 1.7 wt.-% (max. 2 wt.-%). The LIFAC process is an advanced dry sorbent injection process using additional water injection in a separate reactor downstream of the boiler, in order to raise the reduction efficiency. Generally, the SO2 reduction efficiency is > 50 %. At present, the LIFAC process is used in one plant in Finland with a SO2 reduction efficiency of already 70 %. 3.5.1.4 Wellman-Lord (WL)
The WL process is a regenerable FGD process, which uses the sodium sulphite (Na2SO3)/
sodium bisulphite (NaHSO3) equilibrium in order to remove SO2 from the flue gas. An SO2-
rich gas is obtained, which is used for the production of sulphuric acid. At present only three installations with a total thermal capacity of 3,300 MW are in use (in Germany), due to the complexity of the process and the resulting high investments and operating costs (this technology represents about 3 % of the total thermal capacity installed in the European OECD countries). The WL process is operational with various types of fuel (e.g. hard coal, oil), especially with high sulphur contents (of about 3.5 wt.-%). The SO2 reduction efficiency is > 97 %. 3.5.1.5 Walther Process (WAP)
The WAP process uses ammonia water in order to remove SO2 from the flue gas. The by-product is a dry salt mixture of the respective ammonia salts (mainly ammonium sulphate ((NH4)2SO4). One reference installation is currently operating in Germany. This process is
operational with all types of fuel. However, the maximum sulphur content should be limited to 2 wt.-% (due to the increasing formation of ammonia sulphate aerosols). The SO2 reduction efficiency is > 88 %.
COMBUSTION IN ENERGY & TRANSFORMATION INDUSTRIES Activities 010101 - 010105 ps010101
B111-14 December, 2006 Emission Inventory Guidebook
3.5.2 Nitrogen oxides: Primary measures - Denitrification techniques /cf. 17, 18, 19/
3.5.2.1 Low NOx burner (LNB)
A characteristic of LNB is the staged air to fuel ratio at the burner. Three different technical modifications are in use: − Air-staged LNB: An understoichiometric zone is created by a fuel-air mixture and primary
air. An internal recirculation zone occurs due to the swirl of primary air. A burn-out zone is created due to secondary air fed by air nozzles arranged around the primary air nozzles.
− Air-staged LNB with flue gas recirculation (FGR): The basic function is similar to air-staged LNB. The distances between the primary and secondary nozzles are greater, therefore, a flue gas layer is formed. As a result, the residence time in the reducing atmosphere increases and the oxygen concentration decreases.
− Air/Fuel staged LNB: An additional reduction zone around the primary zone is achieved by the extremely overstoichiometric addition of secondary fuel around the secondary flame.
LNB is operational with all fuels and all types of burners. The NOx reduction efficiency for coal fired boilers varies between 10 and 30 % (see Table 10). 3.5.2.2 Staged Air Supply (SAS)
Staged air means the creation of two divided combustion zones - a primary zone with a lack of oxygen and a burn-out zone with excess air. SAS covers the low excess air (LEA), burners out of service (BOOS) and biased burner firing (BBF) techniques: − Low excess air (LEA) means reduction of the oxygen content in the primary combustion
zone of the burners. When firing hard coal, experience has shown that the general limitations are fouling and corrosion, caused by the reducing atmosphere and incomplete burn-out. When firing gas, the reduction efficiency is limited by the CO formed. LEA is more suitable for lignite and often used for retrofitting combustion plants. For oil fired boilers a reduction efficiency of 20 % has been achieved.
− Burners out of service (BOOS) means that the lower burner row(s) in the boiler operate under a lack of oxygen (fuel rich), the upper burners are not in use. This technology is in particular suitable for older installations, but the thermal capacity of the boiler decreases by about 15 - 20 %.
− Biased burner firing (BBF) means that the lower burner rows in the boiler operate under a lack of oxygen (fuel rich) and the upper burners with an excess of oxygen. The boiler efficiency is less compared to BOOS and the NOx reduction is also lower.
The NOx reduction efficiency for coal fired boilers varies between 10 and 40 % (see Table 10).
COMBUSTION IN ENERGY & TRANSFORMATION INDUSTRIES
ps010101 Activities 010101 - 010105
Emission Inventory Guidebook December, 2006 B111-15
3.5.2.3 Overfire Air (OFA)
All burner rows in the boiler operate with a lack of oxygen. The combustion air is partly (5 - 20 %) injected through separate ports located above the top burner row in the boiler. OFA is operational with most fuels and most types of boilers. For gas fired boilers a reduction efficiency of 10 - 30 % and for oil fired boilers 10 - 40 % has been achieved. The NOx reduction efficiency for coal fired boilers varies between 10 and 40 % (see Table 10). 3.5.2.4 Flue Gas Recirculation (FGR)
The recirculation of flue gas into the combustion air is an efficient NOx abatement method for firing modes with high combustion temperatures, such as wet bottom boilers and especially for gas and oil fired boilers. The recirculated flue gas can be added to the secondary or primary air. In the first case, the flame core is not affected and the only effect is a reduction of the flame temperature, which is favourable for thermal-NOx abatement. The influence on dry bottom boilers is thus very limited, considering the fact that about 80 % of the NOx formed originates from fuel bound nitrogen; FGR can be used as an additional measure. A more efficient method is the introduction of flue gas into the primary air of an unstaged burner. High reduction efficiencies of FGR in the primary flow (15 - 20 %) have been achieved in gas and oil fired boilers. The NOx reduction efficiency for coal fired boilers varies between 5 and 25 % (see Table 10). 3.5.2.5 Split Primary Flow (SPF)
Split primary flow means fuel staging in the furnace. This technique involves injecting fuel into the furnace above the main combustion zone, thereby producing a second understoichiometric combustion zone. In the primary zone of the boiler the main fuel is burnt under fuel-lean conditions. This zone is followed by a secondary zone with a reducing atmosphere, into which the secondary fuel is injected. Finally, secondary air is injected into the burn-out zone of the boiler. This reburning technique can, in principle, be used for all types of fossil fuel fired boilers and in combination with low NOx combustion techniques for the primary fuels. When nitrogen is present in the reburning fuel, a part of it will be converted into NOx in the burn-out zone. Therefore, natural gas is the most appropriate reburning fuel. NOx reduction efficiencies have not been yet reported.
3.5.3 Nitrogen oxides: Secondary measures - Denitrification Processes /cf. 18, 19/
3.5.3.1 Selective Non-Catalytic Reduction (SNCR)
The reduction of nitrogen oxides in the flue gas is based on the selective reaction of NOx with injected ammonia, urea or caustic ammonia to form nitrogen and water. The SNCR process has been implemented at several installations (e.g. in Germany, in Austria and in Sweden) and has in principle proved to be operational with various types of fuels. The NOx reduction efficiency is about 50 %, in some installations up to 80 %. 3.5.3.2 Selective Catalytic Reduction (SCR)
The reduction of nitrogen oxides is based on selective reactions with injected additives in the presence of a catalyst. The additives used are mostly gaseous ammonia, but also liquid caustic ammonia or urea. The SCR technology accounts for about 95 % of all denitrification
COMBUSTION IN ENERGY & TRANSFORMATION INDUSTRIES Activities 010101 - 010105 ps010101
B111-16 December, 2006 Emission Inventory Guidebook
processes. SCR is mostly used for hard coal. For brown coal, lower combustion temperatures lead to lower NOx formation, so that primary measures fulfil the emission reduction requirements. Several heavy metals in the flue gas can cause rapid deactivation of the catalyst. The NOx reduction efficiency varies between 70 and 90 %.
3.5.4 Nitrogen oxides and sulphur oxides: Simultaneous Processes /18, 19/
3.5.4.1 Activated Carbon Process (AC)
The AC process is a dry process for simultaneous SO2 and NOx removal based on the adsorption of the pollutants in a moving bed filter of activated carbon. The sulphur oxides undergo catalytic oxidation with the moisture in the flue gas to form sulphuric acid. NO2 is completely reduced to N2; NO reacts catalytically with the ammonia injected and forms N2 and H2O. The AC process has been installed at four power plants in Germany (in two cases downstream of an SDA process). The sulphur content in the fuel used should not exceed 2.3 wt.-%. The SO2 reduction efficiency is > 95 %, the NOx reduction efficiency is > 70 %. 3.5.4.2 DESONOX Process/SNOX Process (DESONOX)
The purification of the flue gas by the DESONOX process is based on the simultaneous catalytic reduction of nitrogen oxides (NOx) to nitrogen (N2) and water (H2O) and on the catalytic oxidation of sulphur dioxide (SO2) to sulphur trioxide (SO3). The by-product is sulphuric acid. The process has been installed at one power plant in Germany, where hard coal is used with a sulphur content of about 1 wt.-%. The concentration of catalyst toxics (mainly arsenic, but also chromium, selenium etc.) has to be taken into account. The SO2 reduction efficiency is up to 95 %, the NOx reduction efficiency is also up to 95 %. The SNOX process works on the same basic principle as the DESONOX process, with the main difference that reduction and oxidation take place in two separate reaction towers. The SNOX process has been applied at one Danish power plant. No reduction efficiency has been reported yet. The SNOX process is also known as a combination of the Topsøe WSA-2 process and the SCR process.
3.5.5 Heavy metals: Secondary measures /12, 20, 21, 22, 23/
Heavy metal emissions are mainly reduced by dust control equipment. Particulate control systems, which are used in coal-fired power plants, are cyclones, wet scrubbers, electrostatic precipitators (ESP), and fabric filters. In most power plants 99 % of the particulates are removed from the flue gases by using ESP or fabric filters. The latter are more efficient in controlling fine particulate matter; wet scrubbers and cyclones are less efficient. The reduction efficiency of ESP for most elements in the solid state is > 99 %. Only for some higher volatile elements, such as Cd, Pb, Zn and Se, is the reduction efficiency less, but it remains above 90 %. The reduction efficiency of an ESP for Hg depends on the operating temperature of the ESP. A cold-side ESP operating at about 140 °C is estimated to have an average Hg reduction efficiency of about 35 %. The influence of FGD- and DeNOx-units on heavy metal emissions has been investigated mainly in the frame of mass balance studies. WS-FGD-units remove a further fraction of
COMBUSTION IN ENERGY & TRANSFORMATION INDUSTRIES
ps010101 Activities 010101 - 010105
Emission Inventory Guidebook December, 2006 B111-17
particulate matter in flue gas in addition to dust control. Particle bound elements are removed by FGD-units with an efficiency of about 90 %. In FGD-units, in particular WS-units, the gaseous compounds can additionally condense on particulate matter, which are mainly removed in the prescrubber. With regard to gaseous elements, various studies have shown reduction efficiencies of 30 - 50 % for Hg and 60 - 75 % for Se. Lime contributes over 90 % of the input of As, Cd, Pb and Zn to the FGD. The abatement of Hg emissions is influenced indirectly by DeNOx-units. A high dust SCR-unit improves Hg removal in a subsequent FGD-unit using a lime scrubbing system. The SCR-unit increases the share of ionic mercury (HgCl2) to up to 95 %, which can be washed out in the prescrubber of the FGD-unit. A study in the Netherlands found no influence of LNB on heavy metal emissions.
3.5.6 Gas turbines /cf. 68, 69/
For gas turbines mainly NOx emissions are of most relevance. Primary measures for NOx
reduction are the following: dry controls (e.g. overstoichiometric combustion in a dry low NOx burner with η = 0.6 - 0.8, which is a relatively new development as a primary measure)
and wet controls (injection of water and/or steam with η ≥ 0.6 /114/) in order to regulate the combustion temperature. For large gas turbines secondary measures are also installed such as Selective Catalytic Reduction (SCR).
3.5.7 Stationary engines /cf. 70/
For spark-ignition engines the main pollutants emitted are NOx, CO and unburned hydrocarbons (VOC). For diesel engines sulphur dioxide (SO2) emissions have also to be considered. Emissions of soot also contribute to emissions of heavy metals and persistent organic pollutants, but at this stage insufficient information is available /35/. Primary measures are installed to optimise combustion conditions (air ratio, reduced load, water injection, exhaust-gas recirculation, optimised combustion chamber etc.). Reduction efficiencies can be given e.g. for exhaust gas recirculation from 6.5 to 12 % and for internal exhaust gas recirculation from 4 to 37 %. External exhaust gas recirculation (turbo charged models) can have reductions of NOx varying from 25 to 34 %. /cf. 114/ Secondary measures are installed, if the emission thresholds cannot be met by adjustments to the engine itself. The following methods are used depending on the air ratio λ: λ = 1 Reduction of NOx, CO and VOC by using a three-way catalytic converter
(NSCR),
λ > 1 Reduction of NOx by Selective Catalytic Reduction with NH3 (SCR),
Reduction of other emissions (CO, VOC) using oxidation catalytic converter (NSCR).
Typical conversion rates of NOx range from 80 to 95 % with corresponding decreases in CO and VOC. Depending on the system design, NOx removal of 80 up to 90 % is achievable. /114/
COMBUSTION IN ENERGY & TRANSFORMATION INDUSTRIES Activities 010101 - 010105 ps010101
B111-18 December, 2006 Emission Inventory Guidebook
4 SIMPLER METHODOLOGY
4.1 General
4.1.1 General / specified emission factors
Here “simpler methodology“ refers to the calculation of emissions, based on emission factors and activities. The simpler methodology should only be used in cases where no measured data is available. The simpler methodology covers all relevant pollutants (SO2, NOx, NMVOC, CH4, CO, CO2, N2O, NH3, heavy metals). Special emphasis is put on the pollutants SOx, NOx and heavy metals, due to the significant contribution of combustion plants as point sources to the total emissions of these pollutants. A combustion plant can be treated either as a whole (irrespective of kind/size of individual boilers) or on a boiler-by-boiler level. Differences in design and operation of boilers, in fuels used and/or controls installed require different emission factors. The same applies to gas turbines and stationary engines. The annual emission E is derived from an activity A and a factor which determines their linear relation (see Equation (1)):
E EF Ai i= ⋅ (1)
Ei annual emission of pollutant i
EFi emission factor of pollutant i
A activity rate
The activity rate A and the emission factor EFi have to be determined on the same level of aggregation by using available data (e.g. fuel consumption) (see Section 6). For the activity rate A, the energy input in [GJ] should be used, but in principle other relations are also applicable. Two different approaches in order to obtain the emission factor EFi are proposed: - General emission factor EFG i
The general emission factor is a mean value for defined categories of boilers taking into account abatement measures (primary and secondary). A general emission factor is only
related to the type of fuel used and is applicable for all pollutants considered, except of SO25.
It should only be used where no technique specific data are available (only as a makeshift). - Specified emission factor EFR i
The specified emission factor is an individually determined value for boilers taking into account abatement measures (primary and secondary). A specified emission factor is related to individual fuel characteristics (e.g. sulphur content of fuel) and to technology specific
5 For the appropriate determination of SO2 emissions the sulphur content of fuel is required. Therefore, the
specified emission factor approach has to be applied.
COMBUSTION IN ENERGY & TRANSFORMATION INDUSTRIES
ps010101 Activities 010101 - 010105
Emission Inventory Guidebook December, 2006 B111-19
parameters. The following sections provide determination procedures for suitable specified emission factors for the pollutants NOx, SOx and heavy metals. In principle, plant specific data should be used, if available, for the determination of emission factors. The following Sections 4.1 to 4.8 give recommendations for the estimation and the use of general and specified emission factors as given in Table 4.
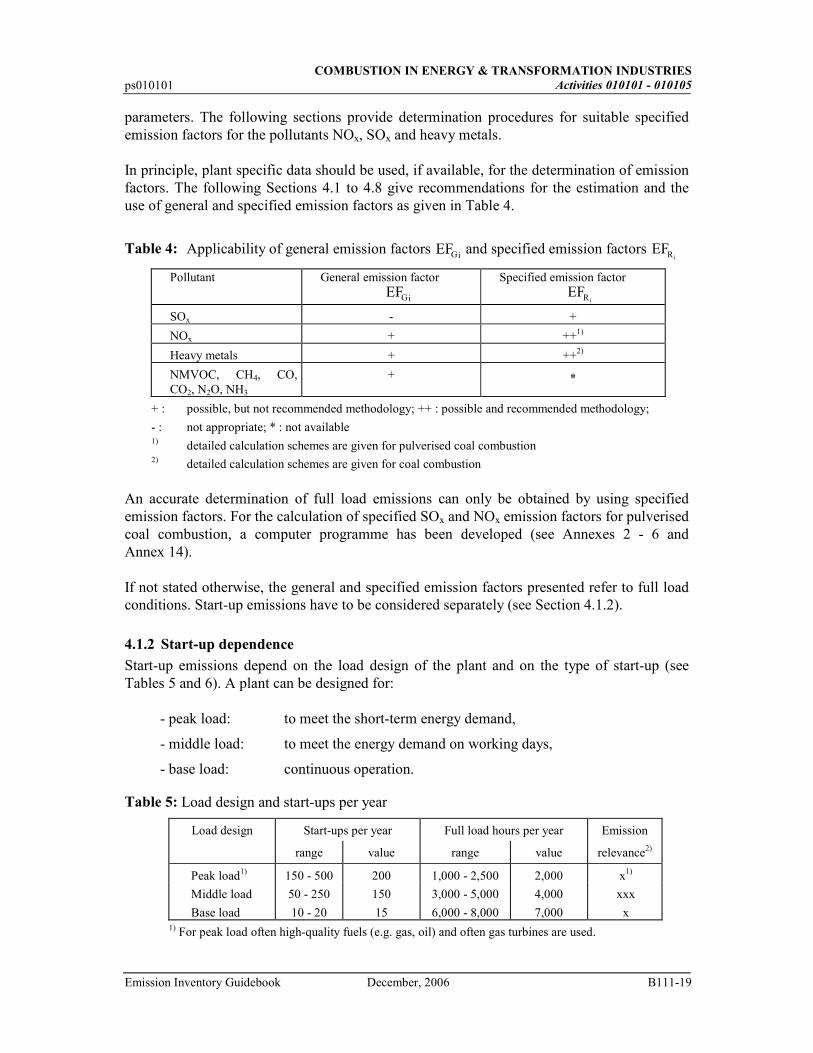
Table 4: Applicability of general emission factors EFGi and specified emission factors EFR i
Pollutant General emission factor EFGi
Specified emission factor EFR i
SOx - +
NOx + ++1)
Heavy metals + ++2)
NMVOC, CH4, CO, CO2, N2O, NH3
+ *
+ : possible, but not recommended methodology; ++ : possible and recommended methodology;
- : not appropriate; * : not available 1) detailed calculation schemes are given for pulverised coal combustion 2) detailed calculation schemes are given for coal combustion
An accurate determination of full load emissions can only be obtained by using specified emission factors. For the calculation of specified SOx and NOx emission factors for pulverised coal combustion, a computer programme has been developed (see Annexes 2 - 6 and Annex 14). If not stated otherwise, the general and specified emission factors presented refer to full load conditions. Start-up emissions have to be considered separately (see Section 4.1.2).
4.1.2 Start-up dependence
Start-up emissions depend on the load design of the plant and on the type of start-up (see Tables 5 and 6). A plant can be designed for:
- peak load: to meet the short-term energy demand,
- middle load: to meet the energy demand on working days,
- base load: continuous operation.
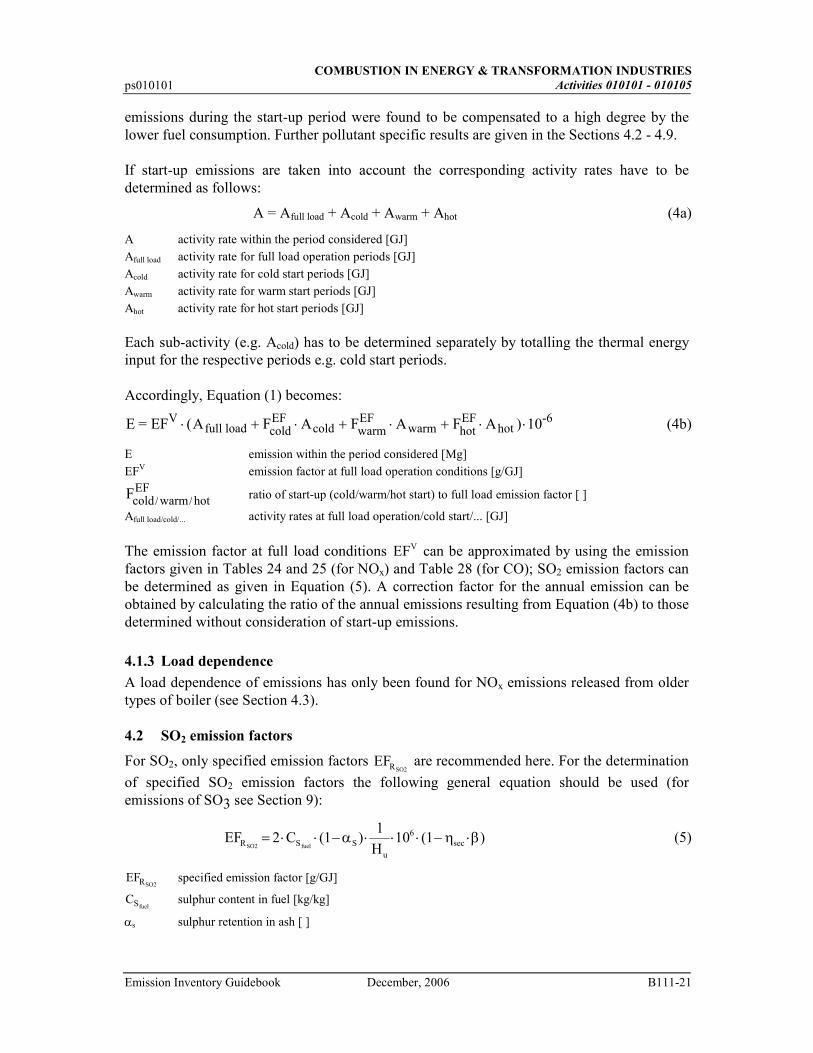
Table 5: Load design and start-ups per year
Load design Start-ups per year Full load hours per year Emission
range value range value relevance2)
Peak load1) 150 - 500 200 1,000 - 2,500 2,000 x1)
Middle load 50 - 250 150 3,000 - 5,000 4,000 xxx
Base load 10 - 20 15 6,000 - 8,000 7,000 x 1) For peak load often high-quality fuels (e.g. gas, oil) and often gas turbines are used.

COMBUSTION IN ENERGY & TRANSFORMATION INDUSTRIES Activities 010101 - 010105 ps010101
B111-20 December, 2006 Emission Inventory Guidebook
2) x: low; xxx: high.
Table 6: Status of the boiler at starting time for a conventional power plant
Type of start-up Time of stand-still [h] /65/
Status of the boiler
Frequency2) Emission relevance2)
Hot-start < 8 hot xxx x
Warm-start 8 - ca. 50 warm xx xx
Cold-start > 50 cold x1) xxx 1) normally once a year, only for maintenance. 2) x: low; xx: medium; xxx: high.
In order to take into consideration the relevance of start-up emissions, a detailed investigation has been carried out. There, start-up emissions and start-up emission factors have been determined for different types of boilers (DBB, WBB, gas-fired boiler, see Annex 15). Start-up emissions are only relevant if secondary measures are installed. By taking into account boiler characteristics as given in Annex 15, the following general trends of start-up emissions of SOx, NOx and CO on the type of fuel and type of boiler are obtained (based on /116/). − For the boilers considered in the detailed investigation it has been found that start-up
emissions for the combustion of coal are significantly higher than for the combustion of gas.
− Start-up emissions are higher for dry bottom boilers than for wet bottom boilers and gas boilers.
In the following sections, start-up emissions and start-up emission factors derived from measured data are presented as ratios:
F EF EFEF A V= / (2)
FEF ratio of start-up and full load emission factors [ ]
EFA emission factor at start-up period [g/GJ]
EFv emission factor at full load conditions [g/GJ]
F E EE A V= / (3)
FE ratio of start-up and full load emissions [ ]
EA emission during start-up period (see Section 3.2) [Mg]
Ev emission for full load conditions during start-up period [Mg] Start-up emissions and full load emissions are related to comparable periods; the energy input (fuel consumption) during the start-up period is lower than during full load operation. The emission factor ratio FEF is often higher than the emission ratio FE . Increased specific
COMBUSTION IN ENERGY & TRANSFORMATION INDUSTRIES
ps010101 Activities 010101 - 010105
Emission Inventory Guidebook December, 2006 B111-21
emissions during the start-up period were found to be compensated to a high degree by the lower fuel consumption. Further pollutant specific results are given in the Sections 4.2 - 4.9. If start-up emissions are taken into account the corresponding activity rates have to be determined as follows:
A = Afull load + Acold + Awarm + Ahot (4a)
A activity rate within the period considered [GJ]
Afull load activity rate for full load operation periods [GJ]
Acold activity rate for cold start periods [GJ]
Awarm activity rate for warm start periods [GJ]
Ahot activity rate for hot start periods [GJ]
Each sub-activity (e.g. Acold) has to be determined separately by totalling the thermal energy input for the respective periods e.g. cold start periods. Accordingly, Equation (1) becomes:
E = EF (A F A F A F A ) 10Vfull load cold
EFcold warm
EFwarm hot
EFhot
-6⋅ + ⋅ + ⋅ + ⋅ ⋅ (4b)
E emission within the period considered [Mg]
EFV emission factor at full load operation conditions [g/GJ]
Fcold warm hotEF
/ / ratio of start-up (cold/warm/hot start) to full load emission factor [ ]
Afull load/cold/... activity rates at full load operation/cold start/... [GJ] The emission factor at full load conditions EFV can be approximated by using the emission factors given in Tables 24 and 25 (for NOx) and Table 28 (for CO); SO2 emission factors can be determined as given in Equation (5). A correction factor for the annual emission can be obtained by calculating the ratio of the annual emissions resulting from Equation (4b) to those determined without consideration of start-up emissions.
4.1.3 Load dependence
A load dependence of emissions has only been found for NOx emissions released from older types of boiler (see Section 4.3). 4.2 SO2 emission factors
For SO2, only specified emission factors EFRSO2 are recommended here. For the determination
of specified SO2 emission factors the following general equation should be used (for emissions of SO3 see Section 9):
EF CHR S S
uSO fuel2
2 11
10 16= ⋅ ⋅ − ⋅ ⋅ ⋅ − ⋅( ) ( )secα η β (5)
EFRSO2 specified emission factor [g/GJ]
CSfuel sulphur content in fuel [kg/kg]
αs sulphur retention in ash [ ]
COMBUSTION IN ENERGY & TRANSFORMATION INDUSTRIES Activities 010101 - 010105 ps010101
B111-22 December, 2006 Emission Inventory Guidebook
Hu lower heating value of fuel [MJ/kg]
ηsec reduction efficiency of secondary measure [ ]
β availability of secondary measure [ ]
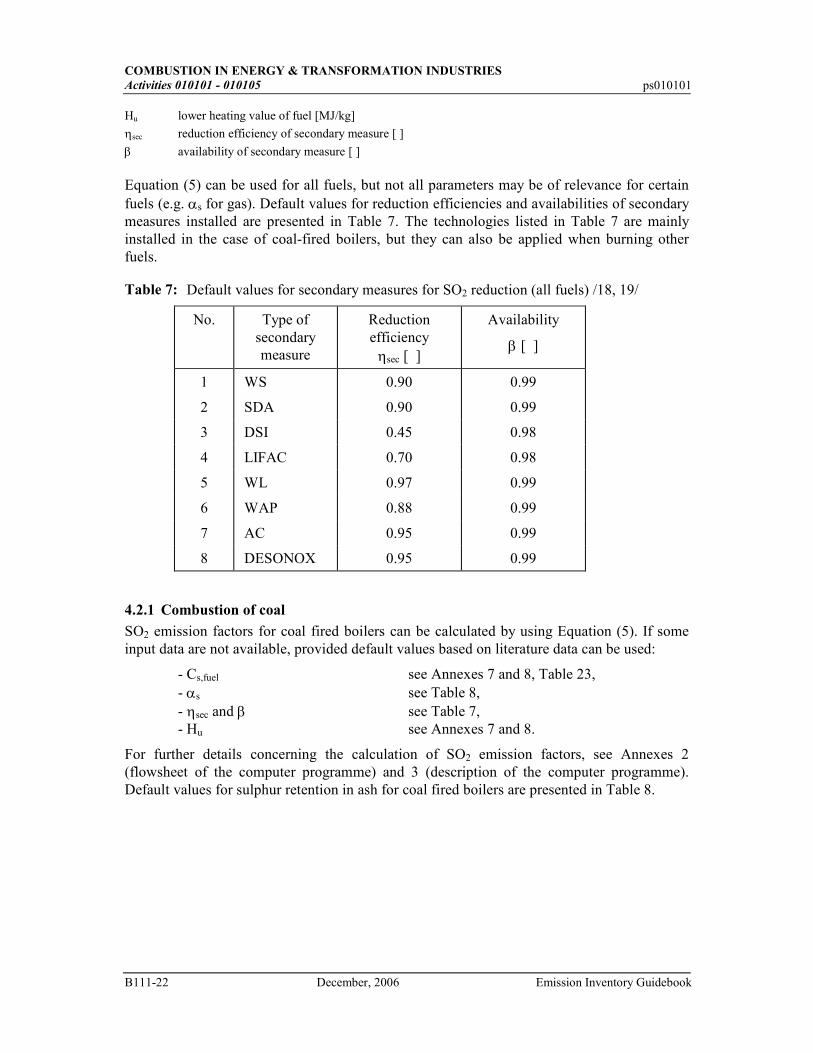
Equation (5) can be used for all fuels, but not all parameters may be of relevance for certain fuels (e.g. αs for gas). Default values for reduction efficiencies and availabilities of secondary measures installed are presented in Table 7. The technologies listed in Table 7 are mainly installed in the case of coal-fired boilers, but they can also be applied when burning other fuels.
Table 7: Default values for secondary measures for SO2 reduction (all fuels) /18, 19/
No. Type of secondary measure
Reduction efficiency ηsec [ ]
Availability
β [ ]
1 WS 0.90 0.99
2 SDA 0.90 0.99
3 DSI 0.45 0.98
4 LIFAC 0.70 0.98
5 WL 0.97 0.99
6 WAP 0.88 0.99
7 AC 0.95 0.99
8 DESONOX 0.95 0.99
4.2.1 Combustion of coal
SO2 emission factors for coal fired boilers can be calculated by using Equation (5). If some input data are not available, provided default values based on literature data can be used:
- Cs,fuel see Annexes 7 and 8, Table 23, - αs see Table 8, - ηsec and β see Table 7, - Hu see Annexes 7 and 8.
For further details concerning the calculation of SO2 emission factors, see Annexes 2 (flowsheet of the computer programme) and 3 (description of the computer programme). Default values for sulphur retention in ash for coal fired boilers are presented in Table 8.
COMBUSTION IN ENERGY & TRANSFORMATION INDUSTRIES
ps010101 Activities 010101 - 010105
Emission Inventory Guidebook December, 2006 B111-23
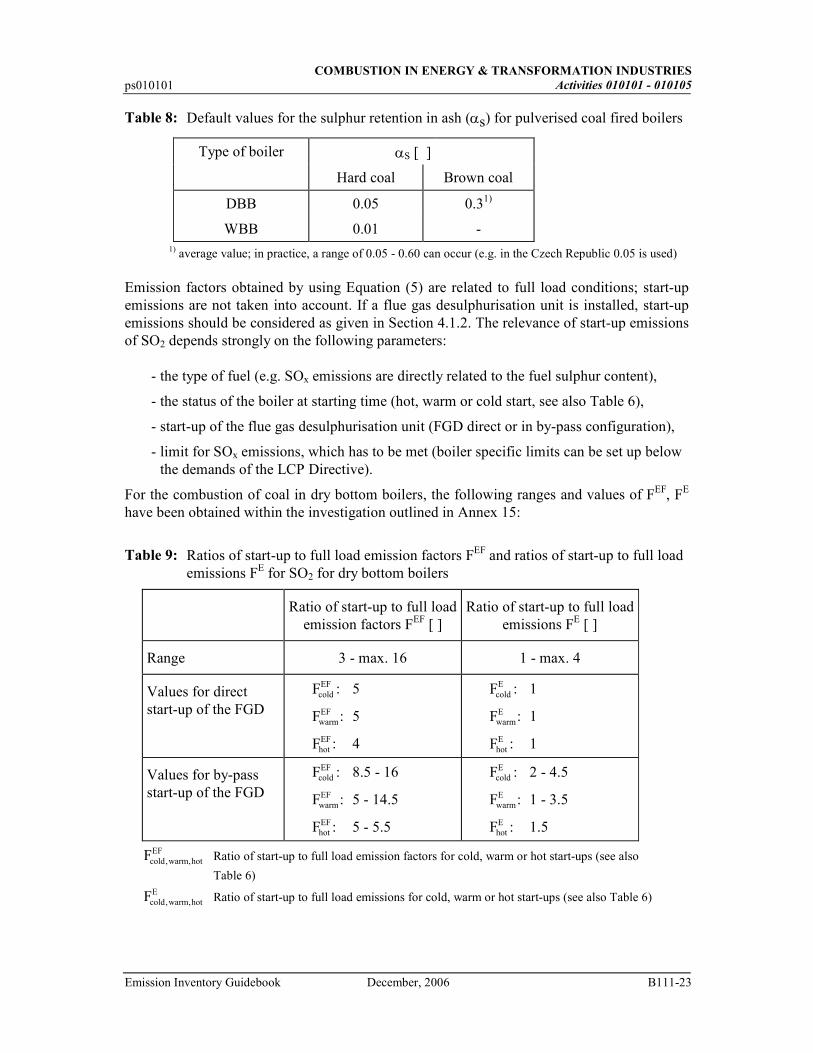
Table 8: Default values for the sulphur retention in ash (αs) for pulverised coal fired boilers
Type of boiler αS [ ]
Hard coal Brown coal
DBB 0.05 0.31)
WBB 0.01 - 1) average value; in practice, a range of 0.05 - 0.60 can occur (e.g. in the Czech Republic 0.05 is used)
Emission factors obtained by using Equation (5) are related to full load conditions; start-up emissions are not taken into account. If a flue gas desulphurisation unit is installed, start-up emissions should be considered as given in Section 4.1.2. The relevance of start-up emissions of SO2 depends strongly on the following parameters:
- the type of fuel (e.g. SOx emissions are directly related to the fuel sulphur content),
- the status of the boiler at starting time (hot, warm or cold start, see also Table 6),
- start-up of the flue gas desulphurisation unit (FGD direct or in by-pass configuration),
- limit for SOx emissions, which has to be met (boiler specific limits can be set up below the demands of the LCP Directive).
For the combustion of coal in dry bottom boilers, the following ranges and values of FEF, FE have been obtained within the investigation outlined in Annex 15:
Table 9: Ratios of start-up to full load emission factors FEF and ratios of start-up to full load emissions FE for SO2 for dry bottom boilers
Ratio of start-up to full load emission factors FEF [ ]
Ratio of start-up to full load emissions FE [ ]
Range 3 - max. 16 1 - max. 4
Values for direct start-up of the FGD
FcoldEF : 5
FwarmEF : 5
FhotEF : 4
FcoldE : 1
FwarmE : 1
FhotE : 1
Values for by-pass start-up of the FGD
FcoldEF : 8.5 - 16
FwarmEF : 5 - 14.5
FhotEF : 5 - 5.5
FcoldE : 2 - 4.5
FwarmE : 1 - 3.5
FhotE : 1.5
Fcold warm hotEF
, , Ratio of start-up to full load emission factors for cold, warm or hot start-ups (see also
Table 6)
Fcold warm hotE
, , Ratio of start-up to full load emissions for cold, warm or hot start-ups (see also Table 6)
COMBUSTION IN ENERGY & TRANSFORMATION INDUSTRIES Activities 010101 - 010105 ps010101
B111-24 December, 2006 Emission Inventory Guidebook
The values from the direct start-up of the FGD show, that start-up emissions of SO2 are not relevant (ratio FE of ca. 1). In the case of a by-pass start-up of the FGD, start-up emissions of SO2 are significant for hot, warm and cold starts; start-up emissions can be up to 4 times higher than emissions in a comparable full load time span (based on /116/).
4.2.2 Combustion of other fuels (biomass, waste, liquid fuels, gaseous fuels)
SO2 emissions are directly related to the sulphur content of biomass, waste, liquid and gaseous fuels (see Equation (5)). The sulphur retention in ash αs is not relevant. The reduction efficiency ηsec and the availability β of installed secondary measures have to be taken into account (in particular for the combustion of waste). Default values for η and β are given in Table 7. Sulphur contents of different fuels are given in Table 23 and in Annexes 7 and 8. 4.3 NOx emission factors
For the determination of NOx emissions, general as well as specified NOx emission factors can be used. Emission factors are listed in Tables 24 and 25 depending on installed capacity, type of boiler, primary measures and type of fuel used.
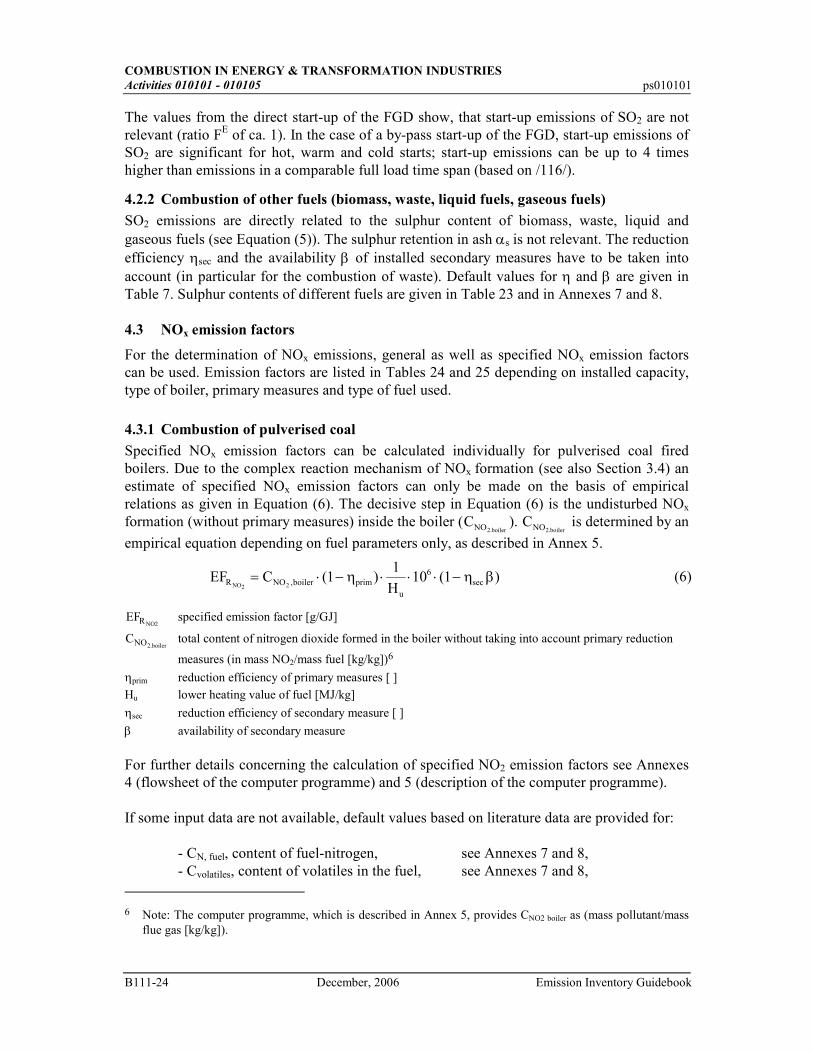
4.3.1 Combustion of pulverised coal
Specified NOx emission factors can be calculated individually for pulverised coal fired boilers. Due to the complex reaction mechanism of NOx formation (see also Section 3.4) an estimate of specified NOx emission factors can only be made on the basis of empirical relations as given in Equation (6). The decisive step in Equation (6) is the undisturbed NOx formation (without primary measures) inside the boiler (CNO boiler2.
). CNO boiler2. is determined by an
empirical equation depending on fuel parameters only, as described in Annex 5.
EF CHR NO boiler prim
uNO2 2
11
10 16= ⋅ − ⋅ ⋅ ⋅ −, sec( ) ( )η η β (6)
EFRNO2 specified emission factor [g/GJ]
CNO boiler2. total content of nitrogen dioxide formed in the boiler without taking into account primary reduction
measures (in mass NO2/mass fuel [kg/kg])6
ηprim reduction efficiency of primary measures [ ]
Hu lower heating value of fuel [MJ/kg]
ηsec reduction efficiency of secondary measure [ ]
β availability of secondary measure For further details concerning the calculation of specified NO2 emission factors see Annexes 4 (flowsheet of the computer programme) and 5 (description of the computer programme). If some input data are not available, default values based on literature data are provided for: - CN, fuel, content of fuel-nitrogen, see Annexes 7 and 8, - Cvolatiles, content of volatiles in the fuel, see Annexes 7 and 8, 6 Note: The computer programme, which is described in Annex 5, provides CNO2 boiler as (mass pollutant/mass
flue gas [kg/kg]).
COMBUSTION IN ENERGY & TRANSFORMATION INDUSTRIES
ps010101 Activities 010101 - 010105
Emission Inventory Guidebook December, 2006 B111-25
- ηprim see Table 10, - ηsec and β see Table 11, - Hu see Annexes 7 and 8.
Default values for the reduction efficiency of primary measures are presented in the following Tables 10 and 11.
COMBUSTION IN ENERGY & TRANSFORMATION INDUSTRIES Activities 010101 - 010105 ps010101
B111-26 December, 2006 Emission Inventory Guidebook
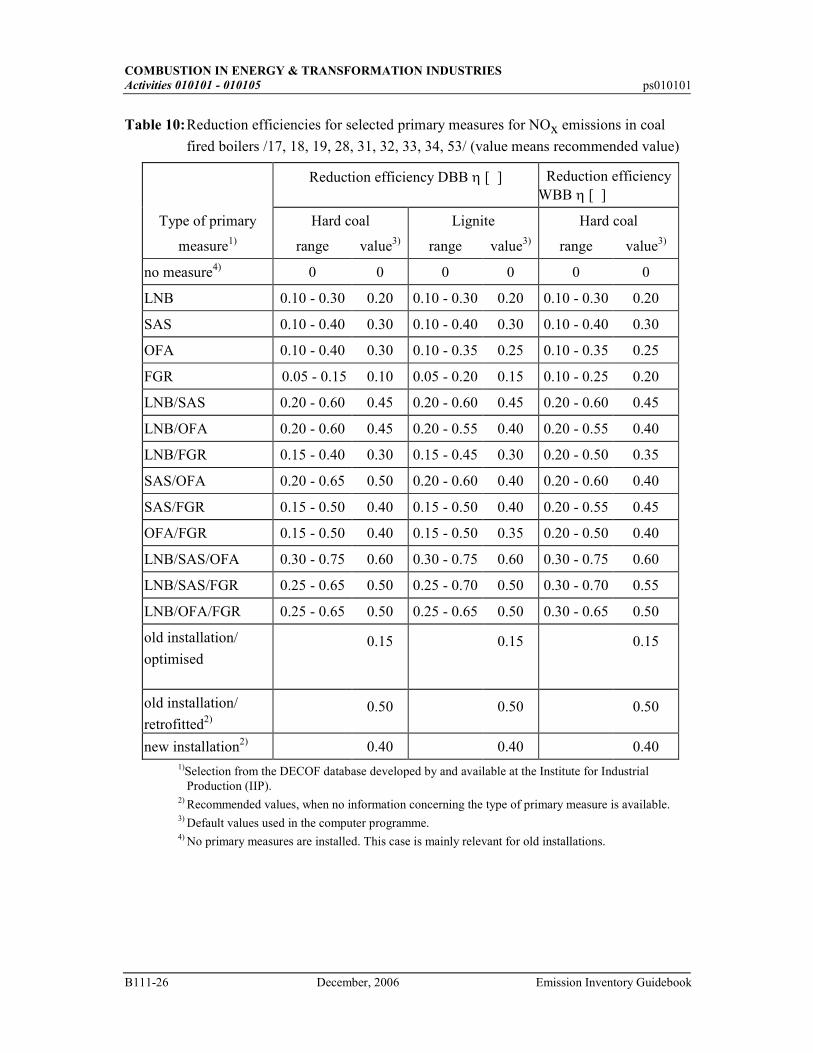
Table 10: Reduction efficiencies for selected primary measures for NOx emissions in coal
fired boilers /17, 18, 19, 28, 31, 32, 33, 34, 53/ (value means recommended value)
Reduction efficiency DBB η [ ] Reduction efficiency WBB η [ ]
Type of primary Hard coal Lignite Hard coal
measure1) range value3) range value3) range value3)
no measure4) 0 0 0 0 0 0
LNB 0.10 - 0.30 0.20 0.10 - 0.30 0.20 0.10 - 0.30 0.20
SAS 0.10 - 0.40 0.30 0.10 - 0.40 0.30 0.10 - 0.40 0.30
OFA 0.10 - 0.40 0.30 0.10 - 0.35 0.25 0.10 - 0.35 0.25
FGR 0.05 - 0.15 0.10 0.05 - 0.20 0.15 0.10 - 0.25 0.20
LNB/SAS 0.20 - 0.60 0.45 0.20 - 0.60 0.45 0.20 - 0.60 0.45
LNB/OFA 0.20 - 0.60 0.45 0.20 - 0.55 0.40 0.20 - 0.55 0.40
LNB/FGR 0.15 - 0.40 0.30 0.15 - 0.45 0.30 0.20 - 0.50 0.35
SAS/OFA 0.20 - 0.65 0.50 0.20 - 0.60 0.40 0.20 - 0.60 0.40
SAS/FGR 0.15 - 0.50 0.40 0.15 - 0.50 0.40 0.20 - 0.55 0.45
OFA/FGR 0.15 - 0.50 0.40 0.15 - 0.50 0.35 0.20 - 0.50 0.40
LNB/SAS/OFA 0.30 - 0.75 0.60 0.30 - 0.75 0.60 0.30 - 0.75 0.60
LNB/SAS/FGR 0.25 - 0.65 0.50 0.25 - 0.70 0.50 0.30 - 0.70 0.55
LNB/OFA/FGR 0.25 - 0.65 0.50 0.25 - 0.65 0.50 0.30 - 0.65 0.50
old installation/
optimised
0.15 0.15 0.15
old installation/
retrofitted2)
0.50 0.50 0.50
new installation2) 0.40 0.40 0.40 1)Selection from the DECOF database developed by and available at the Institute for Industrial
Production (IIP). 2) Recommended values, when no information concerning the type of primary measure is available. 3) Default values used in the computer programme. 4) No primary measures are installed. This case is mainly relevant for old installations.
COMBUSTION IN ENERGY & TRANSFORMATION INDUSTRIES
ps010101 Activities 010101 - 010105
Emission Inventory Guidebook December, 2006 B111-27
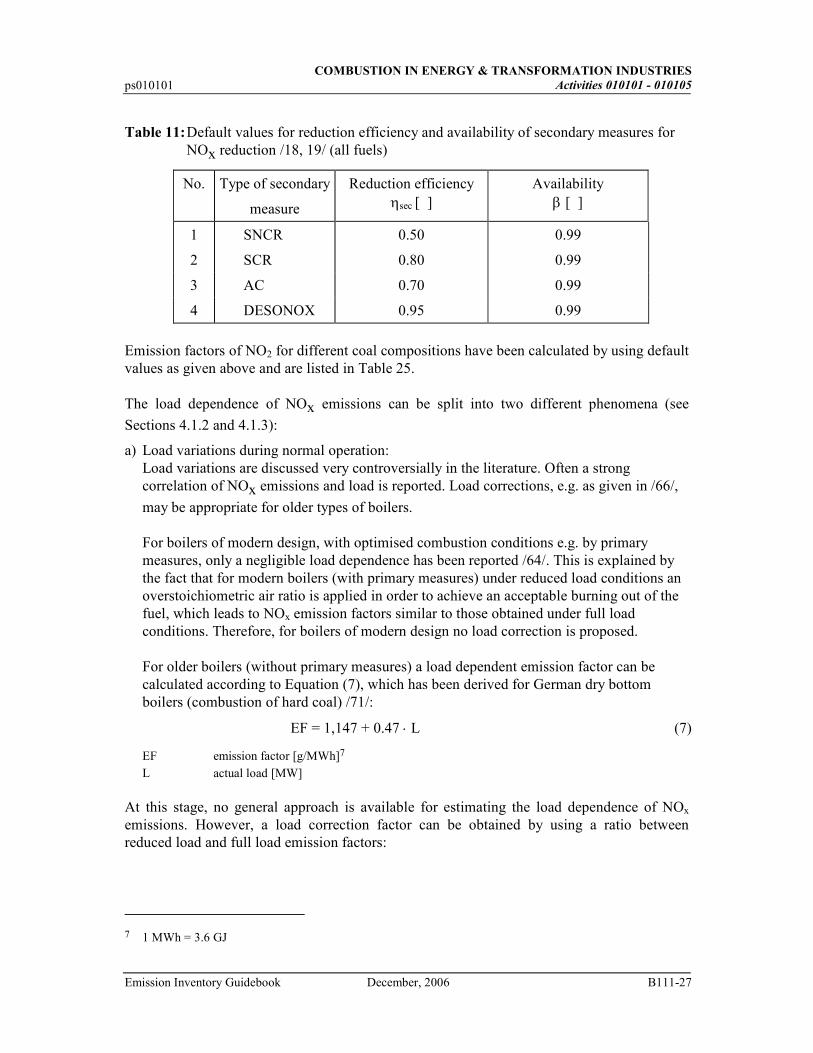
Table 11: Default values for reduction efficiency and availability of secondary measures for NOx reduction /18, 19/ (all fuels)
No. Type of secondary
measure
Reduction efficiency ηsec [ ]
Availability β [ ]
1 SNCR 0.50 0.99
2 SCR 0.80 0.99
3 AC 0.70 0.99
4 DESONOX 0.95 0.99
Emission factors of NO2 for different coal compositions have been calculated by using default values as given above and are listed in Table 25. The load dependence of NOx emissions can be split into two different phenomena (see
Sections 4.1.2 and 4.1.3):
a) Load variations during normal operation: Load variations are discussed very controversially in the literature. Often a strong correlation of NOx emissions and load is reported. Load corrections, e.g. as given in /66/,
may be appropriate for older types of boilers. For boilers of modern design, with optimised combustion conditions e.g. by primary measures, only a negligible load dependence has been reported /64/. This is explained by the fact that for modern boilers (with primary measures) under reduced load conditions an overstoichiometric air ratio is applied in order to achieve an acceptable burning out of the fuel, which leads to NOx emission factors similar to those obtained under full load conditions. Therefore, for boilers of modern design no load correction is proposed. For older boilers (without primary measures) a load dependent emission factor can be calculated according to Equation (7), which has been derived for German dry bottom boilers (combustion of hard coal) /71/:
EF = 1,147 + 0.47 ⋅ L (7)
EF emission factor [g/MWh]7
L actual load [MW] At this stage, no general approach is available for estimating the load dependence of NOx emissions. However, a load correction factor can be obtained by using a ratio between reduced load and full load emission factors:
7 1 MWh = 3.6 GJ
COMBUSTION IN ENERGY & TRANSFORMATION INDUSTRIES Activities 010101 - 010105 ps010101
B111-28 December, 2006 Emission Inventory Guidebook
kEF
EF
L
Lload
duced load
Vno al
= =+ ⋅
+ ⋅
Re
min
, .
, .
1 147 0 47
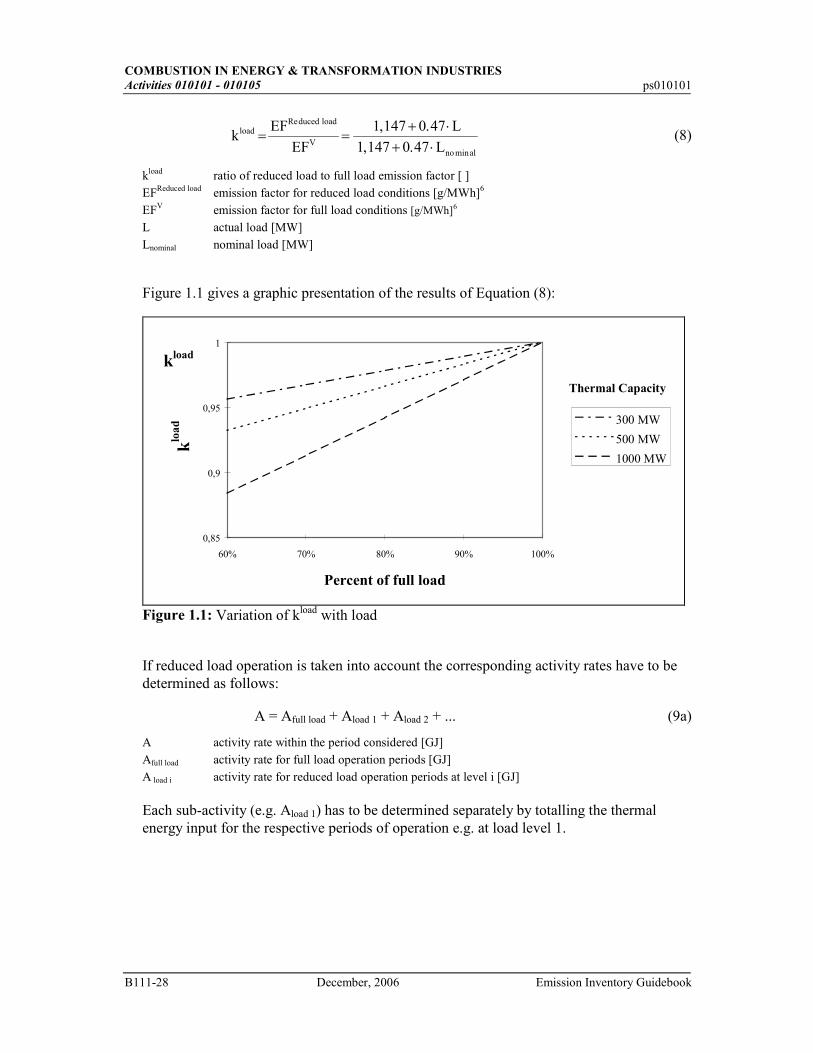
1 147 0 47 (8)
kload ratio of reduced load to full load emission factor [ ]
EFReduced load emission factor for reduced load conditions [g/MWh]6
EFV emission factor for full load conditions [g/MWh]6
L actual load [MW]
Lnominal nominal load [MW]
Figure 1.1 gives a graphic presentation of the results of Equation (8):
0,85
0,9
0,95
1
60% 70% 80% 90% 100%
Percent of full load
klo
ad 300 MW
500 MW
1000 MW
Thermal Capacity
Figure 1.1: Variation of kload with load
If reduced load operation is taken into account the corresponding activity rates have to be determined as follows:
A = Afull load + Aload 1 + Aload 2 + ... (9a)
A activity rate within the period considered [GJ]
Afull load activity rate for full load operation periods [GJ]
A load i activity rate for reduced load operation periods at level i [GJ]
Each sub-activity (e.g. Aload 1) has to be determined separately by totalling the thermal energy input for the respective periods of operation e.g. at load level 1.
kload
COMBUSTION IN ENERGY & TRANSFORMATION INDUSTRIES
ps010101 Activities 010101 - 010105
Emission Inventory Guidebook December, 2006 B111-29
Emissions are calculated according to Equation (9b):
E EF A k A k AVfull load
load 1load 1
load 2load 2= ⋅ + ⋅ + ⋅ + ⋅ −( ...) 10 6 (9b)
E emission within the period considered [Mg]
EFV emission factor at full load conditions [g/GJ]
Aload i activity rates at load level i [GJ]
kload i ratio of reduced load to full load emission factor at load level i [ ]
If secondary measures are installed, no load correction for NOx emissions has to be taken
into account.
b) Load variations with respect to start-up behaviour:
Emission factors for NOx, as given in Tables 24 and 25, are related to full load conditions; start-up emissions are not taken into account. If an SCR is installed, start-up emissions should be considered as given in Section 4.1.2. The relevance of start-up emissions of NOx depends strongly on the following parameters:
- the type of boiler (e.g. NOx emissions released by wet bottom boilers are always higher than those by dry bottom boilers, due to higher combustion temperatures),
- the type of fuel used (e.g. fuel nitrogen also contributes to the formation of NOx),
- the status of the boiler at starting time (hot, warm or cold start),
- the specifications of any individual start-up, such as
-- the duration and the velocity of start-up,
-- the load level (reduced load or full load),
-- the configuration of secondary measures (e.g. the start-up time of the high-dust-configurations (SCR-precipitator-FGD) depends on the boiler load, due to the fact that the SCR catalyst is directly heated by the flue gas; tail-end-configurations (precipitator-FGD-SCR) can have shorter start-up times, due to the fact that the SCR catalyst can be preheated by an additional furnace),
-- emission standards, which have to be met (boiler-specific emission standards can be set up below the demands of the LCP Directive).
In the investigation mentioned in Annex 15 the measured data from different boilers have been analysed. For the combustion of coal the following ratios have been obtained (based on /116/):
- For the combustion of coal in dry bottom boilers the following ranges and values can be given:
COMBUSTION IN ENERGY & TRANSFORMATION INDUSTRIES Activities 010101 - 010105 ps010101
B111-30 December, 2006 Emission Inventory Guidebook
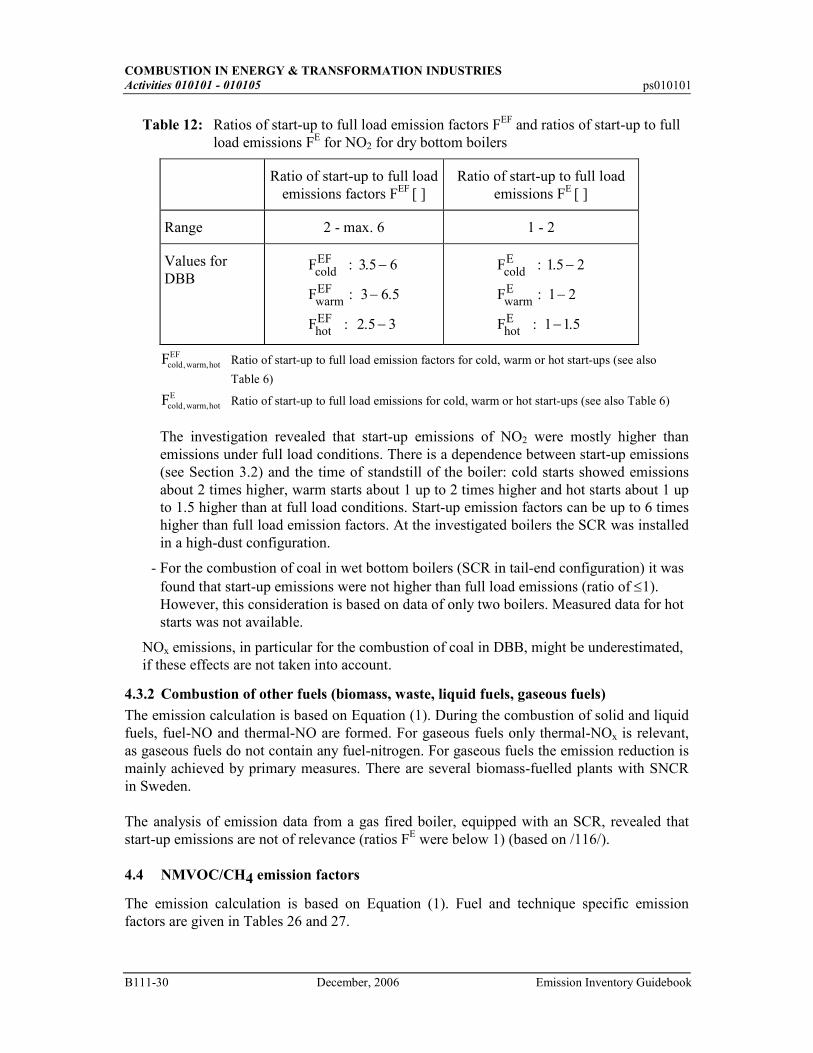
Table 12: Ratios of start-up to full load emission factors FEF and ratios of start-up to full load emissions FE for NO2 for dry bottom boilers
Ratio of start-up to full load emissions factors FEF [ ]
Ratio of start-up to full load emissions FE [ ]
Range 2 - max. 6 1 - 2
Values for DBB
F : 3.5 6
F : 3 6.5
F : 2.5 3
cold EF
warmEF
hotEF
−
−
−
F : .5
F : 1
F :
cold E
warmE
hotE
1 2
2
1 1 5
−
−
− .
Fcold warm hotEF
, , Ratio of start-up to full load emission factors for cold, warm or hot start-ups (see also
Table 6)
Fcold warm hotE
, , Ratio of start-up to full load emissions for cold, warm or hot start-ups (see also Table 6)
The investigation revealed that start-up emissions of NO2 were mostly higher than emissions under full load conditions. There is a dependence between start-up emissions (see Section 3.2) and the time of standstill of the boiler: cold starts showed emissions about 2 times higher, warm starts about 1 up to 2 times higher and hot starts about 1 up to 1.5 higher than at full load conditions. Start-up emission factors can be up to 6 times higher than full load emission factors. At the investigated boilers the SCR was installed in a high-dust configuration.
- For the combustion of coal in wet bottom boilers (SCR in tail-end configuration) it was found that start-up emissions were not higher than full load emissions (ratio of ≤1). However, this consideration is based on data of only two boilers. Measured data for hot starts was not available.
NOx emissions, in particular for the combustion of coal in DBB, might be underestimated, if these effects are not taken into account.
4.3.2 Combustion of other fuels (biomass, waste, liquid fuels, gaseous fuels)
The emission calculation is based on Equation (1). During the combustion of solid and liquid fuels, fuel-NO and thermal-NO are formed. For gaseous fuels only thermal-NOx is relevant, as gaseous fuels do not contain any fuel-nitrogen. For gaseous fuels the emission reduction is mainly achieved by primary measures. There are several biomass-fuelled plants with SNCR in Sweden. The analysis of emission data from a gas fired boiler, equipped with an SCR, revealed that start-up emissions are not of relevance (ratios FE were below 1) (based on /116/). 4.4 NMVOC/CH4 emission factors
The emission calculation is based on Equation (1). Fuel and technique specific emission factors are given in Tables 26 and 27.
COMBUSTION IN ENERGY & TRANSFORMATION INDUSTRIES
ps010101 Activities 010101 - 010105
Emission Inventory Guidebook December, 2006 B111-31
4.5 CO emission factors
The emission calculation is based on Equation (1). Fuel and technique specific emission factors are given in Table 28 (full load conditions); start-up emissions are not taken into account. CO emissions at starting time and under full load conditions are mainly influenced by the combustion conditions (oxygen availability, oil spraying etc.). In the detailed investigation start-up emissions for CO have only been found to be relevant for the combustion of coal. Start-up emissions for CO are determined for the time when burners switch-on up to the time when the boiler operates on minimum load. For the combustion of coal and gas the following results have been obtained (based on /116/ see also Section 4.1.2):
- For the combustion of coal in dry bottom boilers the following ranges can be given:
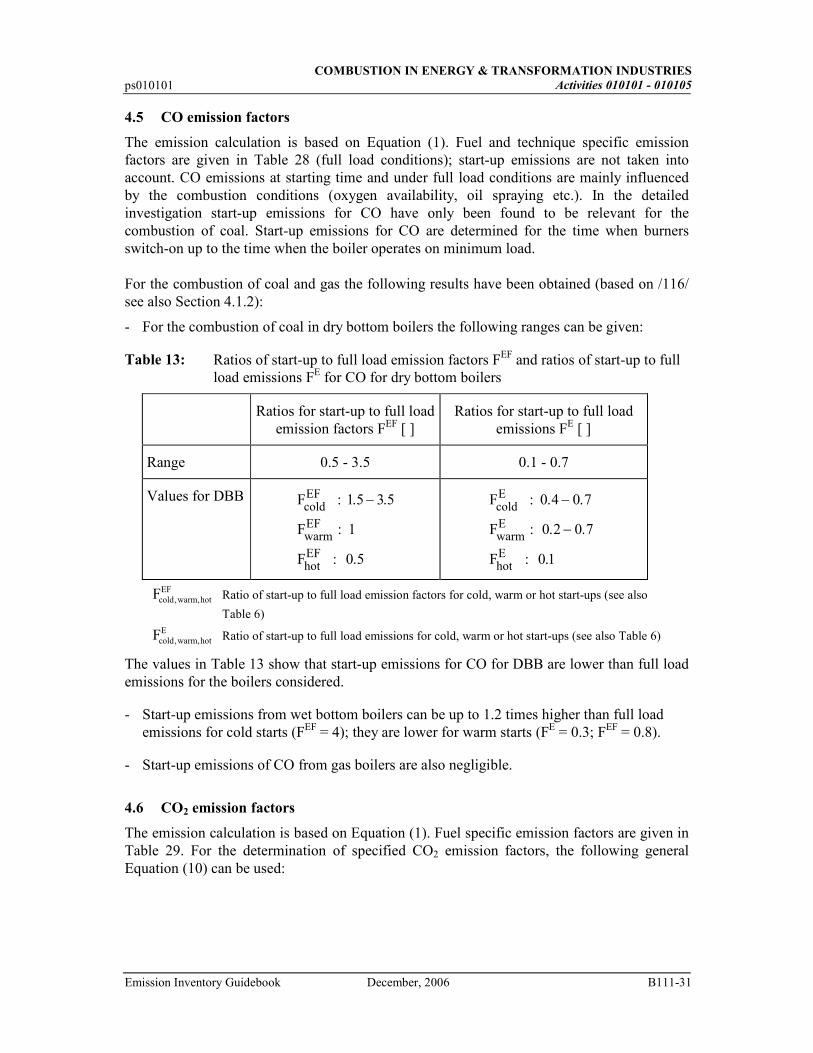
Table 13: Ratios of start-up to full load emission factors FEF and ratios of start-up to full load emissions FE for CO for dry bottom boilers
Ratios for start-up to full load emission factors FEF [ ]
Ratios for start-up to full load emissions FE [ ]
Range 0.5 - 3.5 0.1 - 0.7
Values for DBB F : .5
F : 1
F : .5
cold EF
warmEF
hotEF
1 3 5
0
− .
F : .4
F : 0.2
F : .1
cold E
warmE
hotE
0 0 7
0 7
0
−
−
.
.
Fcold warm hotEF
, , Ratio of start-up to full load emission factors for cold, warm or hot start-ups (see also
Table 6)
Fcold warm hotE
, , Ratio of start-up to full load emissions for cold, warm or hot start-ups (see also Table 6)
The values in Table 13 show that start-up emissions for CO for DBB are lower than full load emissions for the boilers considered.
- Start-up emissions from wet bottom boilers can be up to 1.2 times higher than full load emissions for cold starts (FEF = 4); they are lower for warm starts (FE = 0.3; FEF = 0.8).
- Start-up emissions of CO from gas boilers are also negligible.
4.6 CO2 emission factors
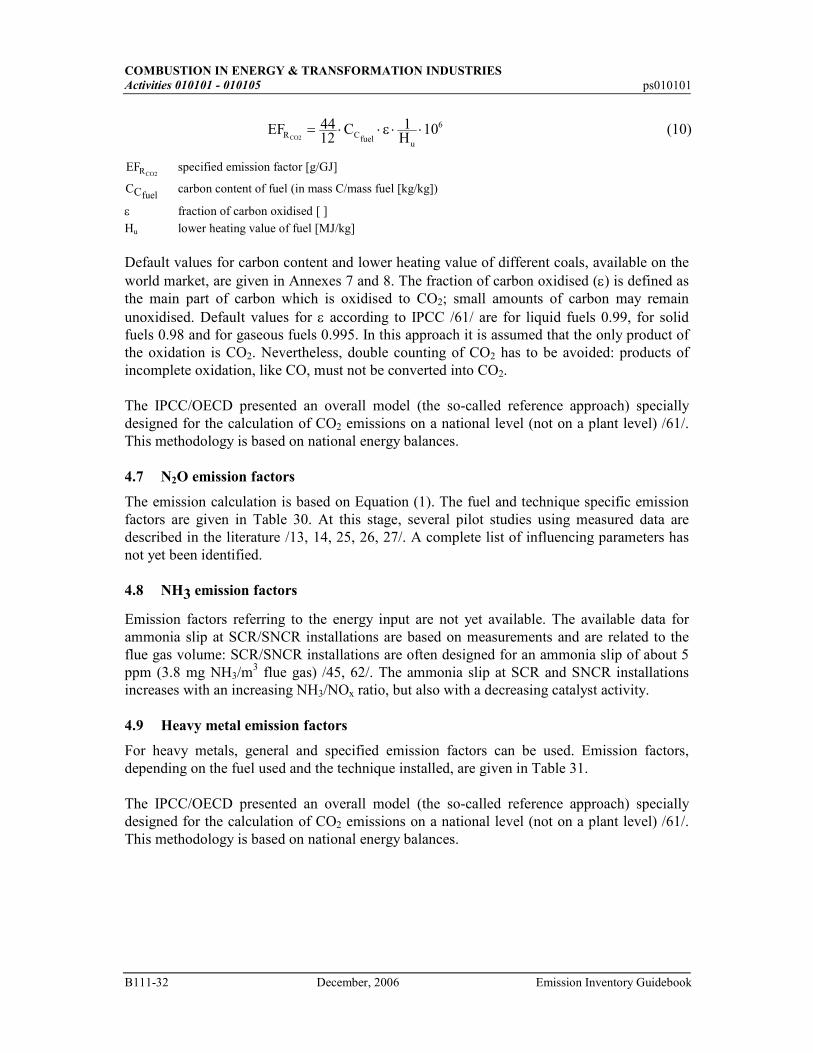
The emission calculation is based on Equation (1). Fuel specific emission factors are given in Table 29. For the determination of specified CO2 emission factors, the following general Equation (10) can be used:
COMBUSTION IN ENERGY & TRANSFORMATION INDUSTRIES Activities 010101 - 010105 ps010101
B111-32 December, 2006 Emission Inventory Guidebook
EF C 1H
10R Cfuelu
6
CO2= ⋅ ⋅ ⋅ ⋅44
12ε (10)
EFRCO2 specified emission factor [g/GJ]
CCfuel carbon content of fuel (in mass C/mass fuel [kg/kg])
ε fraction of carbon oxidised [ ]
Hu lower heating value of fuel [MJ/kg]
Default values for carbon content and lower heating value of different coals, available on the world market, are given in Annexes 7 and 8. The fraction of carbon oxidised (ε) is defined as the main part of carbon which is oxidised to CO2; small amounts of carbon may remain unoxidised. Default values for ε according to IPCC /61/ are for liquid fuels 0.99, for solid fuels 0.98 and for gaseous fuels 0.995. In this approach it is assumed that the only product of the oxidation is CO2. Nevertheless, double counting of CO2 has to be avoided: products of incomplete oxidation, like CO, must not be converted into CO2. The IPCC/OECD presented an overall model (the so-called reference approach) specially designed for the calculation of CO2 emissions on a national level (not on a plant level) /61/. This methodology is based on national energy balances. 4.7 N2O emission factors
The emission calculation is based on Equation (1). The fuel and technique specific emission factors are given in Table 30. At this stage, several pilot studies using measured data are described in the literature /13, 14, 25, 26, 27/. A complete list of influencing parameters has not yet been identified. 4.8 NH3 emission factors
Emission factors referring to the energy input are not yet available. The available data for ammonia slip at SCR/SNCR installations are based on measurements and are related to the flue gas volume: SCR/SNCR installations are often designed for an ammonia slip of about 5 ppm (3.8 mg NH3/m
3 flue gas) /45, 62/. The ammonia slip at SCR and SNCR installations increases with an increasing NH3/NOx ratio, but also with a decreasing catalyst activity. 4.9 Heavy metal emission factors
For heavy metals, general and specified emission factors can be used. Emission factors, depending on the fuel used and the technique installed, are given in Table 31. The IPCC/OECD presented an overall model (the so-called reference approach) specially designed for the calculation of CO2 emissions on a national level (not on a plant level) /61/. This methodology is based on national energy balances.
COMBUSTION IN ENERGY & TRANSFORMATION INDUSTRIES
ps010101 Activities 010101 - 010105
Emission Inventory Guidebook December, 2006 B111-33
4.9.1 Combustion of coal
For an individual determination of specific heavy metal emission factors, three different methodologies can be applied, taking into account:
- fuel composition (particle-bound and gaseous emissions),
- fly ash composition (particle-bound emissions),
- fly ash concentration in clean gas (particle-bound emissions). The choice of the methodology depends on data availability. 4.9.1.1 Calculation of specified emission factors based on fuel composition /cf. 35/
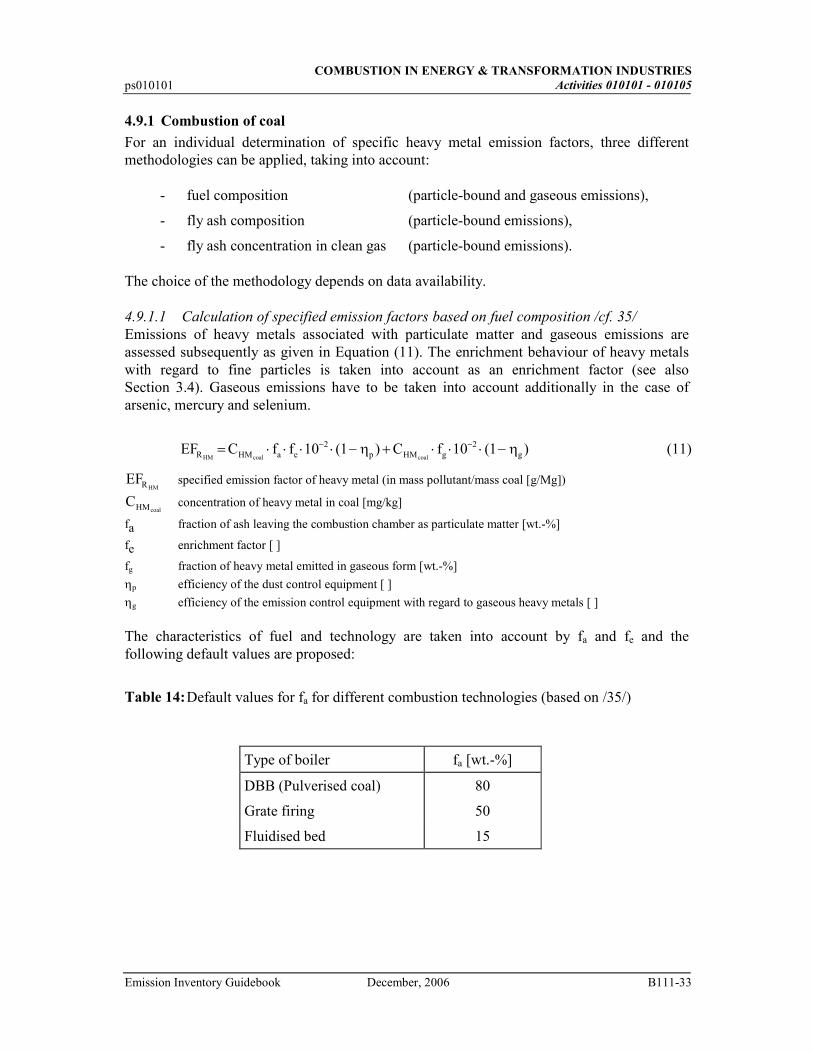
Emissions of heavy metals associated with particulate matter and gaseous emissions are assessed subsequently as given in Equation (11). The enrichment behaviour of heavy metals with regard to fine particles is taken into account as an enrichment factor (see also Section 3.4). Gaseous emissions have to be taken into account additionally in the case of arsenic, mercury and selenium.
EF C f f C fR HM a e p HM g gHM coal coal= ⋅ ⋅ ⋅ ⋅ − + ⋅ ⋅ ⋅ −− −10 1 10 12 2( ) ( )η η (11)
EFRHM specified emission factor of heavy metal (in mass pollutant/mass coal [g/Mg])
CHMcoal concentration of heavy metal in coal [mg/kg]
fa fraction of ash leaving the combustion chamber as particulate matter [wt.-%]
fe enrichment factor [ ]
fg fraction of heavy metal emitted in gaseous form [wt.-%]
ηp efficiency of the dust control equipment [ ]
ηg efficiency of the emission control equipment with regard to gaseous heavy metals [ ] The characteristics of fuel and technology are taken into account by fa and fe and the following default values are proposed:
Table 14: Default values for fa for different combustion technologies (based on /35/)
Type of boiler fa [wt.-%]
DBB (Pulverised coal) 80
Grate firing 50
Fluidised bed 15
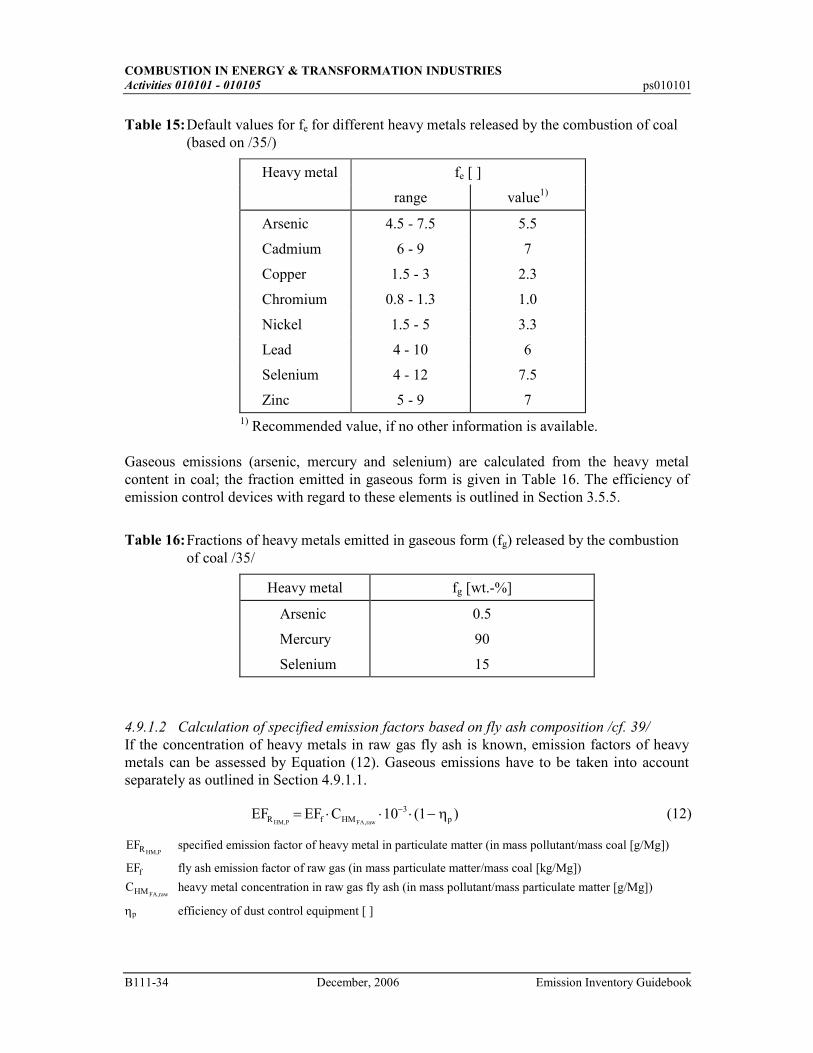
COMBUSTION IN ENERGY & TRANSFORMATION INDUSTRIES Activities 010101 - 010105 ps010101
B111-34 December, 2006 Emission Inventory Guidebook
Table 15: Default values for fe for different heavy metals released by the combustion of coal (based on /35/)
Heavy metal fe [ ]
range value1)
Arsenic 4.5 - 7.5 5.5
Cadmium 6 - 9 7
Copper 1.5 - 3 2.3
Chromium 0.8 - 1.3 1.0
Nickel 1.5 - 5 3.3
Lead 4 - 10 6
Selenium 4 - 12 7.5
Zinc 5 - 9 7 1) Recommended value, if no other information is available.
Gaseous emissions (arsenic, mercury and selenium) are calculated from the heavy metal content in coal; the fraction emitted in gaseous form is given in Table 16. The efficiency of emission control devices with regard to these elements is outlined in Section 3.5.5.
Table 16: Fractions of heavy metals emitted in gaseous form (fg) released by the combustion of coal /35/
Heavy metal fg [wt.-%]
Arsenic 0.5
Mercury 90
Selenium 15
4.9.1.2 Calculation of specified emission factors based on fly ash composition /cf. 39/
If the concentration of heavy metals in raw gas fly ash is known, emission factors of heavy metals can be assessed by Equation (12). Gaseous emissions have to be taken into account separately as outlined in Section 4.9.1.1.
EF EF CR f HM pHM P FA raw, ,( )= ⋅ ⋅ ⋅ −−10 13 η (12)
EFRHM P, specified emission factor of heavy metal in particulate matter (in mass pollutant/mass coal [g/Mg])
EFf fly ash emission factor of raw gas (in mass particulate matter/mass coal [kg/Mg])
CHMFA raw, heavy metal concentration in raw gas fly ash (in mass pollutant/mass particulate matter [g/Mg])
ηp efficiency of dust control equipment [ ]
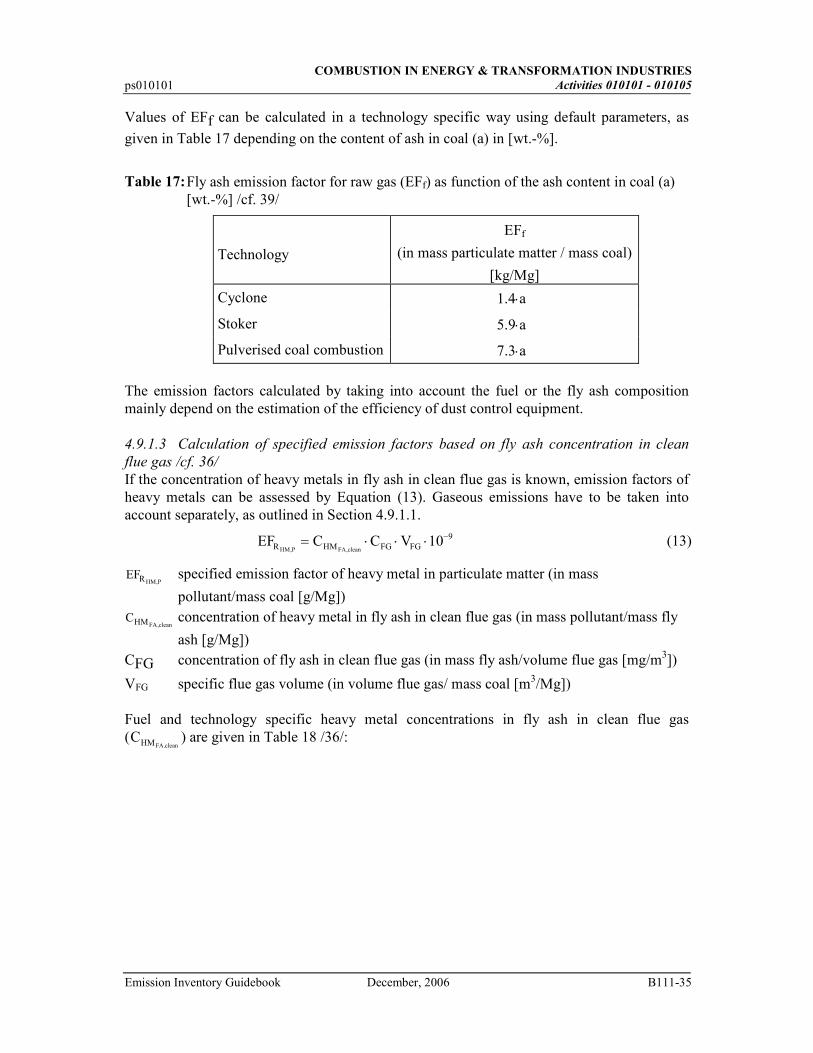
COMBUSTION IN ENERGY & TRANSFORMATION INDUSTRIES
ps010101 Activities 010101 - 010105
Emission Inventory Guidebook December, 2006 B111-35
Values of EFf can be calculated in a technology specific way using default parameters, as
given in Table 17 depending on the content of ash in coal (a) in [wt.-%].
Table 17: Fly ash emission factor for raw gas (EFf) as function of the ash content in coal (a) [wt.-%] /cf. 39/
Technology
EFf
(in mass particulate matter / mass coal)
[kg/Mg]
Cyclone 1.4⋅a
Stoker 5.9⋅a
Pulverised coal combustion 7.3⋅a
The emission factors calculated by taking into account the fuel or the fly ash composition mainly depend on the estimation of the efficiency of dust control equipment. 4.9.1.3 Calculation of specified emission factors based on fly ash concentration in clean
flue gas /cf. 36/
If the concentration of heavy metals in fly ash in clean flue gas is known, emission factors of heavy metals can be assessed by Equation (13). Gaseous emissions have to be taken into account separately, as outlined in Section 4.9.1.1.
EF C C V 10R HM FG FG9
HM,P FA,clean= ⋅ ⋅ ⋅ − (13)
EFRHM P, specified emission factor of heavy metal in particulate matter (in mass
pollutant/mass coal [g/Mg]) CHMFA clean,
concentration of heavy metal in fly ash in clean flue gas (in mass pollutant/mass fly
ash [g/Mg]) CFG concentration of fly ash in clean flue gas (in mass fly ash/volume flue gas [mg/m3])
VFG specific flue gas volume (in volume flue gas/ mass coal [m3/Mg]) Fuel and technology specific heavy metal concentrations in fly ash in clean flue gas (CHMFA clean.
) are given in Table 18 /36/:
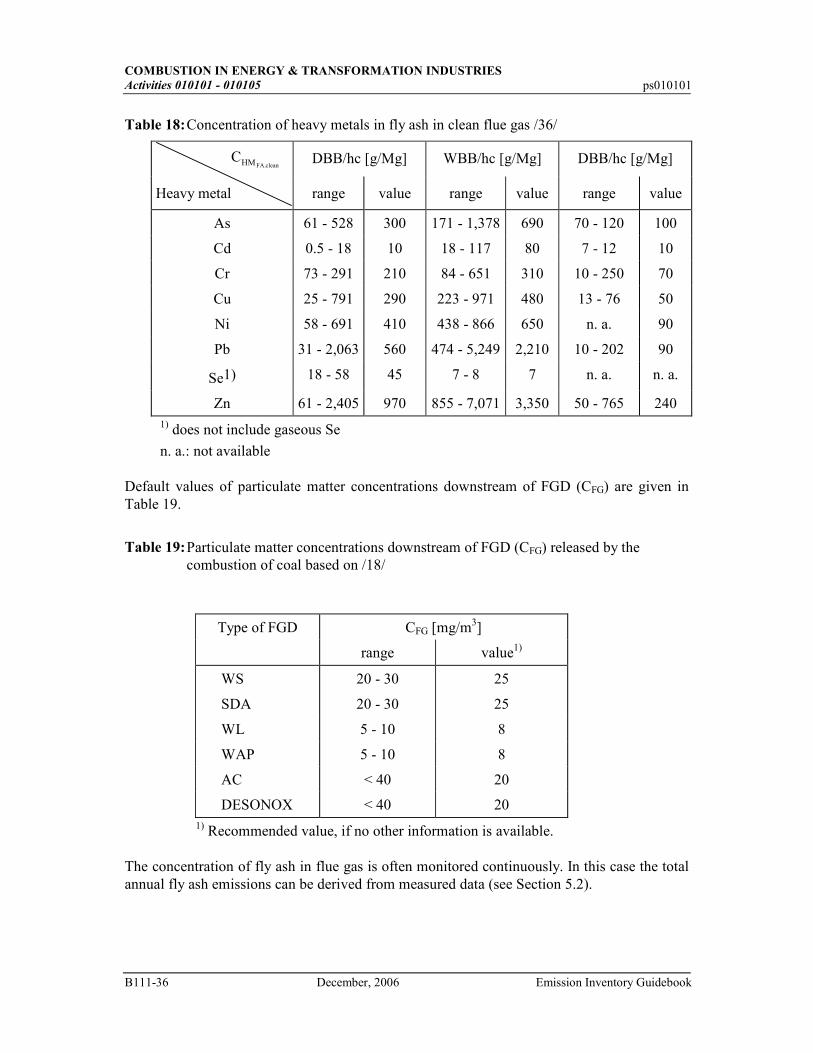
COMBUSTION IN ENERGY & TRANSFORMATION INDUSTRIES Activities 010101 - 010105 ps010101
B111-36 December, 2006 Emission Inventory Guidebook
Table 18: Concentration of heavy metals in fly ash in clean flue gas /36/
CHMFA clean. DBB/hc [g/Mg] WBB/hc [g/Mg] DBB/hc [g/Mg]
Heavy metal range value range value range value
As 61 - 528 300 171 - 1,378 690 70 - 120 100
Cd 0.5 - 18 10 18 - 117 80 7 - 12 10
Cr 73 - 291 210 84 - 651 310 10 - 250 70
Cu 25 - 791 290 223 - 971 480 13 - 76 50
Ni 58 - 691 410 438 - 866 650 n. a. 90
Pb 31 - 2,063 560 474 - 5,249 2,210 10 - 202 90
Se1) 18 - 58 45 7 - 8 7 n. a. n. a.
Zn 61 - 2,405 970 855 - 7,071 3,350 50 - 765 240 1) does not include gaseous Se
n. a.: not available Default values of particulate matter concentrations downstream of FGD (CFG) are given in Table 19.
Table 19: Particulate matter concentrations downstream of FGD (CFG) released by the combustion of coal based on /18/
Type of FGD CFG [mg/m3]
range value1)
WS 20 - 30 25
SDA 20 - 30 25
WL 5 - 10 8
WAP 5 - 10 8
AC < 40 20
DESONOX < 40 20 1) Recommended value, if no other information is available.
The concentration of fly ash in flue gas is often monitored continuously. In this case the total annual fly ash emissions can be derived from measured data (see Section 5.2).
COMBUSTION IN ENERGY & TRANSFORMATION INDUSTRIES
ps010101 Activities 010101 - 010105
Emission Inventory Guidebook December, 2006 B111-37
4.9.2 Combustion of other fuels
General emission factors for oil and gas combustion can be found in Table 31. Among the other fuels, only waste is relevant for heavy metal emissions. Emission factors for the combustion of waste are currently not available (reported emission factors within the literature mainly refer to the incineration of waste). 5 DETAILED METHODOLOGY
The detailed methodology refers to the handling of measured data in order to determine annual emissions or in order to verify emission factors (for comparison purposes). Annual emissions from major contributors should only be obtained by using continuously measured data which are normally available if secondary abatement technologies are installed. Furthermore, the detailed methodology should be used whenever measured data are available; e.g. for medium and small sized combustion installations periodically measured data are often available. Measurements are carried out downstream of the boiler or at the stack; measured values obtained by both variants are usable. National monitoring programmes should include guidelines for quality assurance of measurements (measuring places, methods, reporting procedures, etc.). The pollutants normally measured at power plants are SO2, NOx, CO, and particulate matter. Gaseous emissions of SO2, NOx, and CO are treated in Section 5.1. Continuously measured particulate matter emission data can be used to estimate heavy metal emissions (see Section 5.2). 5.1 Gaseous emissions
It is desirable to obtain annual emissions in [Mg]. The annual emission as a function of time is normally given by the following Equation (14):
∫=T
dtteE )( (14)
E emission within the period T [Mg]
e (t) emission per unit of time in the periods of operation [Mg/h]
t time [h]
T annual time period (see also Figure 1)
Usually, the emission e(t) cannot be or is not directly measured. Therefore, for practical reasons, the concentration of pollutants and the flue gas volume are used for the determination of e(t), as described by Equation (15):
e t V t C t( ) ( ) ( )= ⋅⋅
(15)
e (t) emission in the periods of operation [Mg/h]
V⋅(t) flue gas volume flow rate [m3/h]
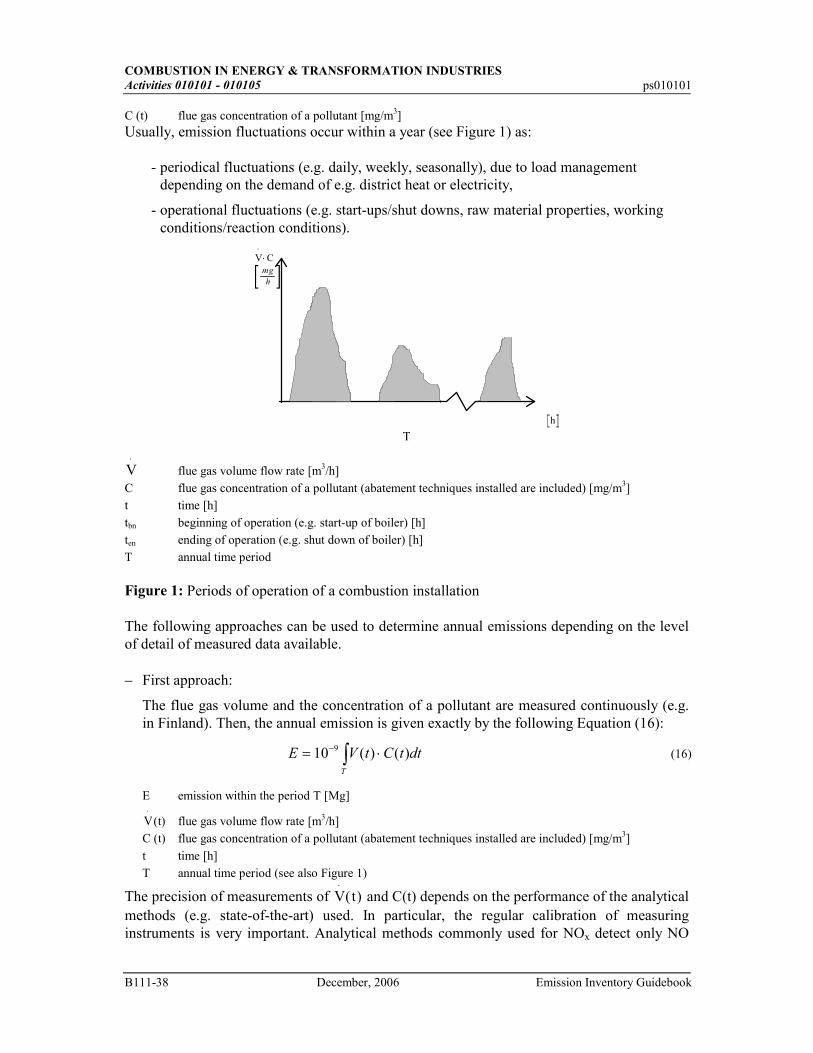
COMBUSTION IN ENERGY & TRANSFORMATION INDUSTRIES Activities 010101 - 010105 ps010101
B111-38 December, 2006 Emission Inventory Guidebook
C (t) flue gas concentration of a pollutant [mg/m3] Usually, emission fluctuations occur within a year (see Figure 1) as:
- periodical fluctuations (e.g. daily, weekly, seasonally), due to load management depending on the demand of e.g. district heat or electricity,
- operational fluctuations (e.g. start-ups/shut downs, raw material properties, working conditions/reaction conditions).
V C⋅⋅
[ ]mg
h
h T
V⋅
flue gas volume flow rate [m3/h]
C flue gas concentration of a pollutant (abatement techniques installed are included) [mg/m3]
t time [h]
tbn beginning of operation (e.g. start-up of boiler) [h]
ten ending of operation (e.g. shut down of boiler) [h]
T annual time period
Figure 1: Periods of operation of a combustion installation The following approaches can be used to determine annual emissions depending on the level of detail of measured data available. − First approach:
The flue gas volume and the concentration of a pollutant are measured continuously (e.g. in Finland). Then, the annual emission is given exactly by the following Equation (16):
∫ ⋅= −
T
dttCtVE )()(10 9 (16)
E emission within the period T [Mg]
V⋅(t) flue gas volume flow rate [m3/h]
C (t) flue gas concentration of a pollutant (abatement techniques installed are included) [mg/m3]
t time [h]
T annual time period (see also Figure 1)
The precision of measurements of V t⋅
( ) and C(t) depends on the performance of the analytical methods (e.g. state-of-the-art) used. In particular, the regular calibration of measuring instruments is very important. Analytical methods commonly used for NOx detect only NO
COMBUSTION IN ENERGY & TRANSFORMATION INDUSTRIES
ps010101 Activities 010101 - 010105
Emission Inventory Guidebook December, 2006 B111-39
and those used for SOx detect only SO2. It is implicitly assumed that NO2 in the flue gas is normally below 5 %, and that SO3 in the flue gas is negligible. Nevertheless, for some combustion plants the amounts of NO2 and/or SO3 formed can be significant and have to be detected by appropriate analytical methods. The measured values have to be specified with regard to dry/wet flue gas conditions and standard oxygen concentrations8.
For the annual time period T considered, a case distinction has to be made:
- calendar year T1 (e.g. including time out of operation),
- real operating time T2 of boiler/plant (e.g. start-ups are reported when „burner on/off“),
- official reporting time T3 determined by legislation (e.g. start-ups are reported, as soon as the oxygen content in the flue gas goes below 16 %),
where T3⊂T2⊂T1. If C(t) is only available for T3, adequate corrections have to be provided.
− Second approach:
Due to the difficulty in measuring V(t) continuously in large diameter stacks, in most cases the flue gas volume flow rate V(t) is not measured. Then the annual emission can be determined by Equation (17):
∫−=T
dttCVE )(10 9 & (17)
E emission within the period T [Mg]
V& average flue gas volume flow rate [m3/h]
C(t) flue gas concentration of a pollutant (abatement techniques installed are included) [mg/m3]
t time [h]
T annual time period (see also Figure 1)
The average flue gas volume flow rate V& (dry conditions) can be determined according to the following Equations (18) and (19):
fuelFG mVV && ⋅= (18)
V& average flue gas volume flow rate [m3/h]
VFG dry flue gas volume per mass fuel [m3/kg]
fuelm& fuel consumption rate [kg/h]
V 1.852 C 0.682 C 0.800 C VFGmkg c
ms
mkg N N
3 3 3
air≈ ⋅ + ⋅ + ⋅ +kg (19)
VFG dry flue gas volume per mass fuel [m3/kg]
Cc concentration of carbon in fuel [kg/kg]
Cs concentration of sulphur in fuel [kg/kg]
8 In some countries the measured values obtained are automatically converted into values under standard
oxygen concentrations (e.g. in Germany).
COMBUSTION IN ENERGY & TRANSFORMATION INDUSTRIES Activities 010101 - 010105 ps010101
B111-40 December, 2006 Emission Inventory Guidebook
CN concentration of nitrogen in fuel [kg/kg]
VNair specific volume of air nitrogen (in volume/mass fuel [m3/kg])
This calculation of V according to Equation (19) can be performed by the computer programme (see Annex 6) by using default values for CC, CS, CN and VNair
.
− Third approach:
In some countries the term ∫T
dttC )( is available as an annual density function P(C)
(histogram). In this case Equation (17) can be simplified to:
910−⋅⋅⋅= optCVE & (20)
where dCCCPC ⋅⋅= ∫∞
0
)( (21)
E emission within the period T [Mg]
V& average flue gas volume flow rate [m3/h]
C expected value (mean value) of the flue gas concentration for each pollutant (abatement techniques installed are included) [mg/m3]
top annual operating time [h]
P(C) density function [ ]
C flue gas concentration per pollutant as given in the histogram [mg/m3]
The variable top has to be introduced consistently with V& and C according to periods T1, T2 or T3 mentioned above. If e.g. start-ups are not included, they should be taken into account as given in Sections 4.1, 4.2 and 4.4. − Fourth approach: If neither T2 nor T3 are available, the annual full load operating hours can also be used.
Then Equation (20) becomes:
910−⋅⋅⋅= loadfull
opnormed tCVE & (22)
E emission within the period considered [Mg]
normedV& average flue gas volume flow rate related to full load operation [m3/h]
C mean value of the flue gas concentration for each pollutant (abatement techniques installed are included) [mg/m3]
topfullload annual operating time expressed as full load operating hours [h]
From here, emission factors, based on measured values, can be derived e.g. for verification purposes:
EFE
A= ⋅106 (23)
EF emission factor [g/GJ]
COMBUSTION IN ENERGY & TRANSFORMATION INDUSTRIES
ps010101 Activities 010101 - 010105
Emission Inventory Guidebook December, 2006 B111-41
E emission within the period considered [Mg]
A activity rate within the time period considered [GJ]
5.2 Heavy metal emissions
Continuously measured values for the total heavy metal emissions (particle-bound and gaseous) are not available for the combustion of fossil fuels. National legislation can require periodical measurements, e.g. weekly measurements of heavy metal emissions [mg/m3] in the case of waste incineration/combustion. The emissions of particle-bound heavy metals depend on the emission of particulate matter which is normally periodically or continuously monitored. Therefore, the particle-bound heavy metal emissions can be derived from the element content in particulate matter. The heavy metal emission factor can be back-calculated as follows:
A
CmEF cleanFAHMFA .⋅
=&
(24)
EF emission factor [g/GJ]
FAm& mass of fly ash within the period considered [Mg]
CHMFA clean. average concentration of heavy metal in fly ash (in mass pollutant/mass fly ash [g/Mg])
A activity rate within the period considered [GJ] Measured data should also be used to replace the default values of Equation (13) for CHMFA clean.
and CFG. 6 RELEVANT ACTIVITY STATISTICS
In general, the published statistics do not include point sources individually. Information on this level should be obtained directly from each plant operator. On a national level, statistics can be used for the determination of fuel consumption, installed capacity and/or types of boilers mainly used. The following statistical publications can be recommended: − Office for Official Publication of the European Communities (ed.): Annual Statistics 1990;
Luxembourg 1992
− Commission of the European Communities (ed.): Energy in Europe - Annual Energy Review; Brussels 1991
− Statistical Office of the European Communities (EUROSTAT) (ed.): CRONOS Databank, 1993
− OECD (ed.): Environmental Data, Données OCDE sur l’environnement; compendium 1993
− Commission of the European Communities (ed.): Energy in Europe; 1993 - Annual Energy Review; Special Issue; Brussels 1994
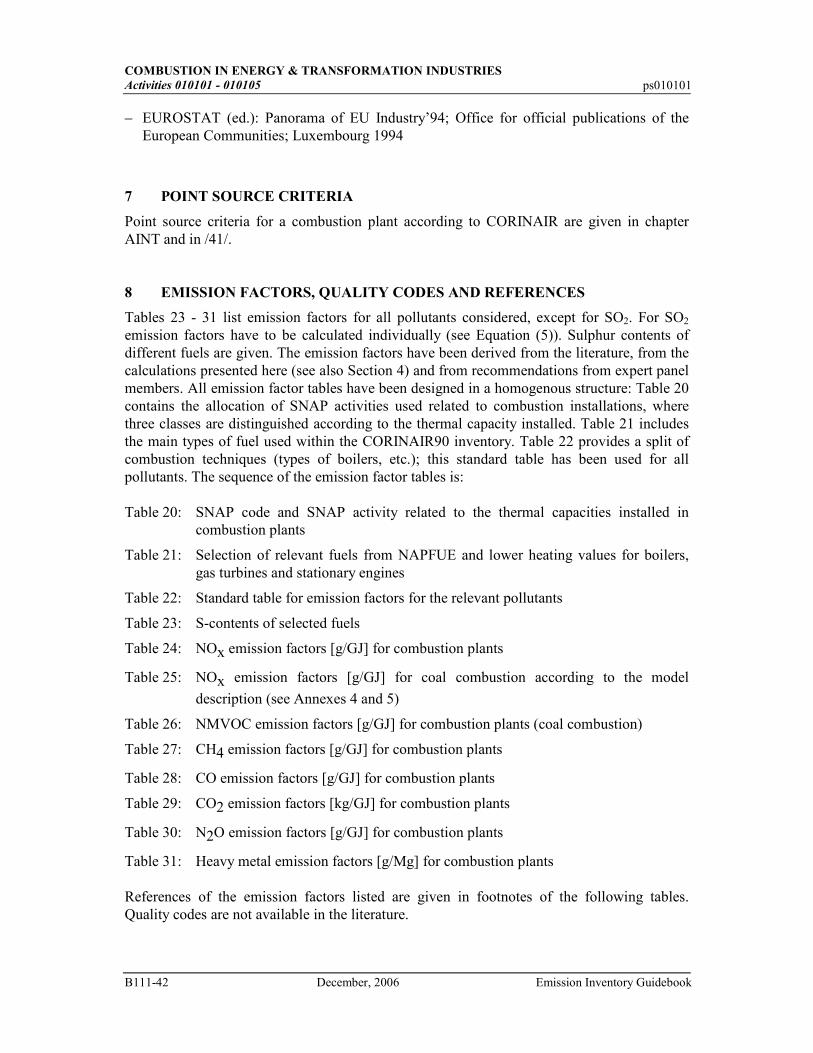
COMBUSTION IN ENERGY & TRANSFORMATION INDUSTRIES Activities 010101 - 010105 ps010101
B111-42 December, 2006 Emission Inventory Guidebook
− EUROSTAT (ed.): Panorama of EU Industry’94; Office for official publications of the European Communities; Luxembourg 1994
7 POINT SOURCE CRITERIA
Point source criteria for a combustion plant according to CORINAIR are given in chapter AINT and in /41/. 8 EMISSION FACTORS, QUALITY CODES AND REFERENCES
Tables 23 - 31 list emission factors for all pollutants considered, except for SO2. For SO2 emission factors have to be calculated individually (see Equation (5)). Sulphur contents of different fuels are given. The emission factors have been derived from the literature, from the calculations presented here (see also Section 4) and from recommendations from expert panel members. All emission factor tables have been designed in a homogenous structure: Table 20 contains the allocation of SNAP activities used related to combustion installations, where three classes are distinguished according to the thermal capacity installed. Table 21 includes the main types of fuel used within the CORINAIR90 inventory. Table 22 provides a split of combustion techniques (types of boilers, etc.); this standard table has been used for all pollutants. The sequence of the emission factor tables is: Table 20: SNAP code and SNAP activity related to the thermal capacities installed in
combustion plants
Table 21: Selection of relevant fuels from NAPFUE and lower heating values for boilers, gas turbines and stationary engines
Table 22: Standard table for emission factors for the relevant pollutants
Table 23: S-contents of selected fuels
Table 24: NOx emission factors [g/GJ] for combustion plants
Table 25: NOx emission factors [g/GJ] for coal combustion according to the model
description (see Annexes 4 and 5)
Table 26: NMVOC emission factors [g/GJ] for combustion plants (coal combustion)
Table 27: CH4 emission factors [g/GJ] for combustion plants
Table 28: CO emission factors [g/GJ] for combustion plants
Table 29: CO2 emission factors [kg/GJ] for combustion plants
Table 30: N2O emission factors [g/GJ] for combustion plants
Table 31: Heavy metal emission factors [g/Mg] for combustion plants References of the emission factors listed are given in footnotes of the following tables. Quality codes are not available in the literature.
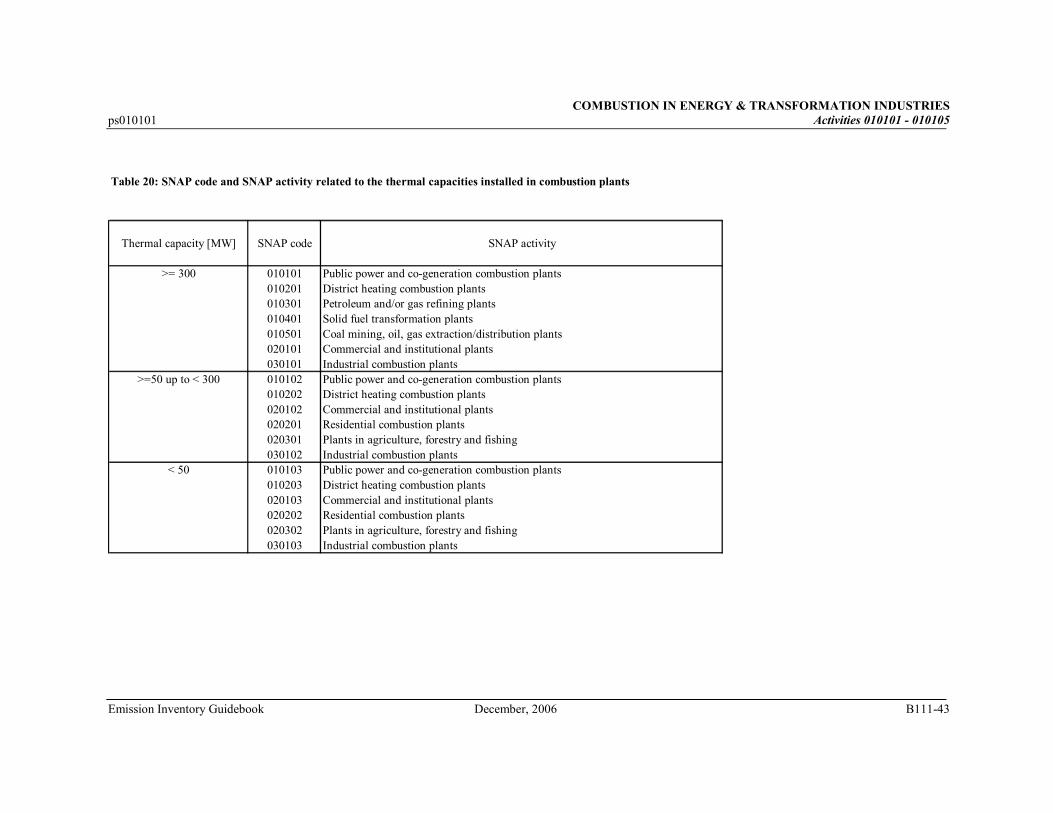
COMBUSTION IN ENERGY & TRANSFORMATION INDUSTRIES ps010101 Activities 010101 - 010105
Emission Inventory Guidebook December, 2006 B111-43
Table 20: SNAP code and SNAP activity related to the thermal capacities installed in combustion plants
Thermal capacity [MW] SNAP code SNAP activity
>= 300 010101 Public power and co-generation combustion plants010201 District heating combustion plants010301 Petroleum and/or gas refining plants010401 Solid fuel transformation plants010501 Coal mining, oil, gas extraction/distribution plants020101 Commercial and institutional plants030101 Industrial combustion plants
>=50 up to < 300 010102 Public power and co-generation combustion plants010202 District heating combustion plants020102 Commercial and institutional plants020201 Residential combustion plants020301 Plants in agriculture, forestry and fishing030102 Industrial combustion plants
< 50 010103 Public power and co-generation combustion plants010203 District heating combustion plants020103 Commercial and institutional plants020202 Residential combustion plants020302 Plants in agriculture, forestry and fishing030103 Industrial combustion plants
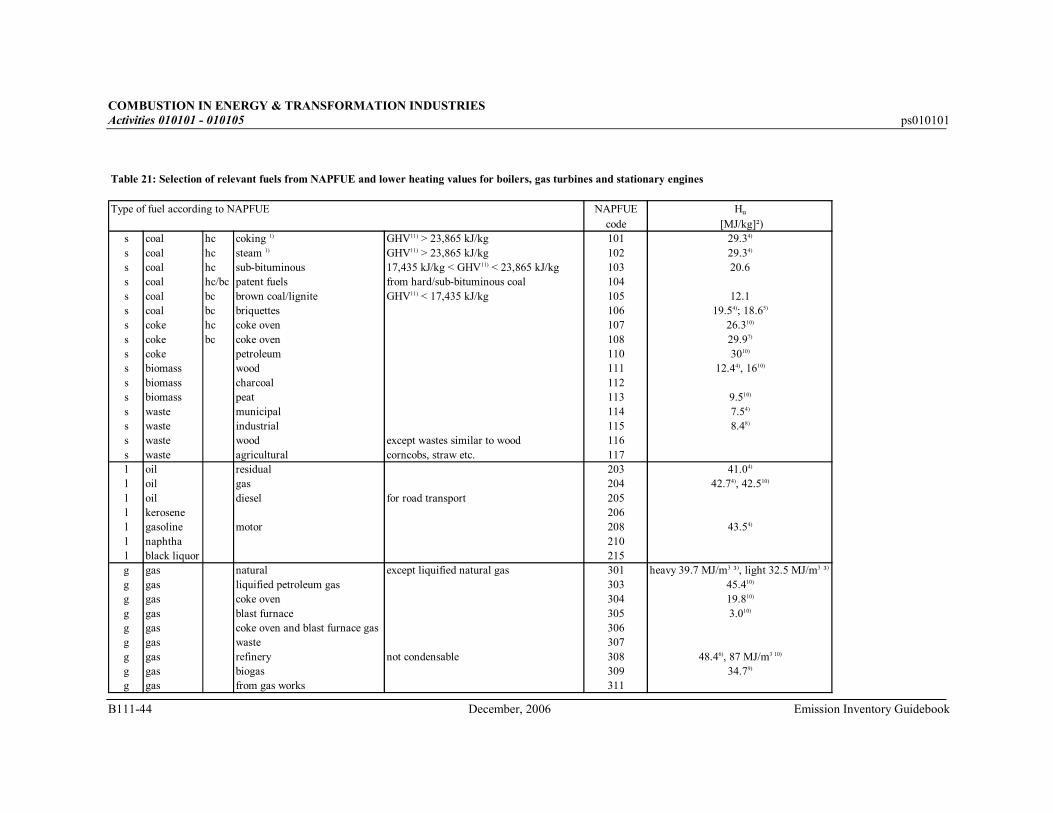
COMBUSTION IN ENERGY & TRANSFORMATION INDUSTRIES Activities 010101 - 010105 ps010101
B111-44 December, 2006 Emission Inventory Guidebook
Table 21: Selection of relevant fuels from NAPFUE and lower heating values for boilers, gas turbines and stationary engines
Type of fuel according to NAPFUE NAPFUE Hu
code [MJ/kg]²)s coal hc coking 1) GHV11) > 23,865 kJ/kg 101 29.34)
s coal hc steam 1) GHV11) > 23,865 kJ/kg 102 29.34)
s coal hc sub-bituminous 17,435 kJ/kg < GHV11) < 23,865 kJ/kg 103 20.6s coal hc/bc patent fuels from hard/sub-bituminous coal 104s coal bc brown coal/lignite GHV11) < 17,435 kJ/kg 105 12.1s coal bc briquettes 106 19.54); 18.65)
s coke hc coke oven 107 26.310)
s coke bc coke oven 108 29.97)
s coke petroleum 110 3010)
s biomass wood 111 12.44), 1610)
s biomass charcoal 112s biomass peat 113 9.510)
s waste municipal 114 7.54)
s waste industrial 115 8.48)
s waste wood except wastes similar to wood 116s waste agricultural corncobs, straw etc. 117l oil residual 203 41.04)
l oil gas 204 42.74), 42.510)
l oil diesel for road transport 205l kerosene 206l gasoline motor 208 43.54)
l naphtha 210l black liquor 215g gas natural except liquified natural gas 301 heavy 39.7 MJ/m3 ³), light 32.5 MJ/m3 ³)
g gas liquified petroleum gas 303 45.410)
g gas coke oven 304 19.810)
g gas blast furnace 305 3.010)
g gas coke oven and blast furnace gas 306g gas waste 307g gas refinery not condensable 308 48.46), 87 MJ/m3 10)
g gas biogas 309 34.79)
g gas from gas works 311
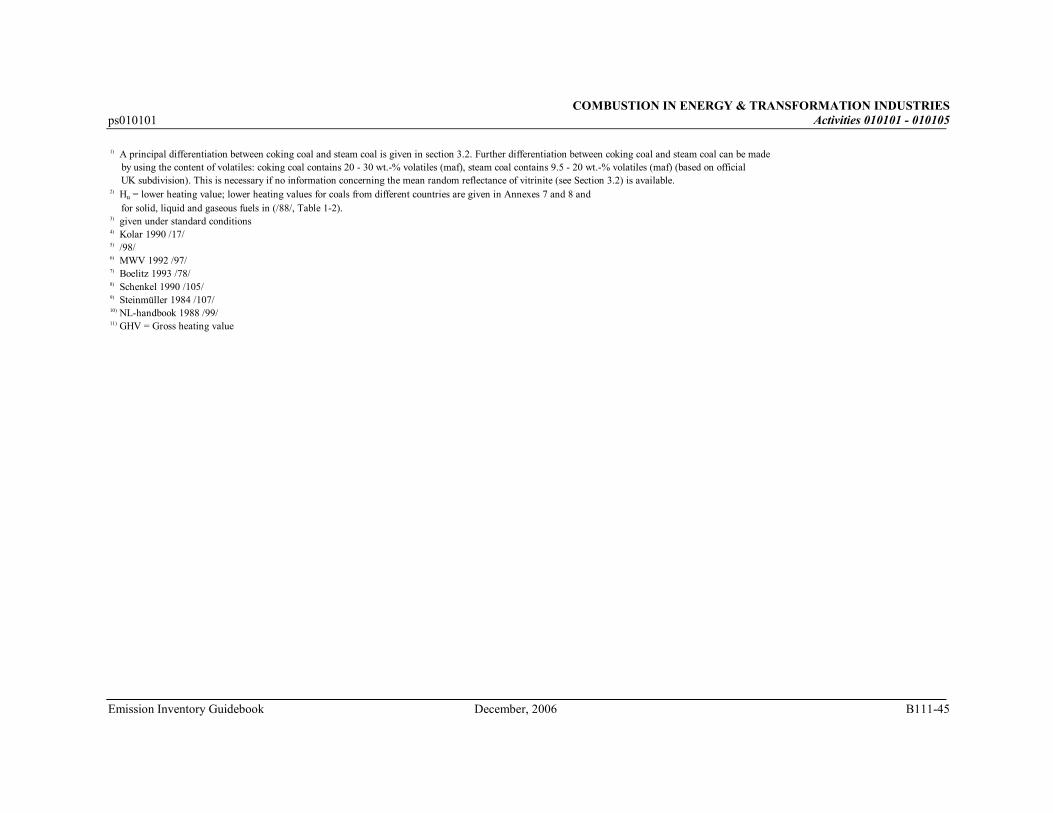
COMBUSTION IN ENERGY & TRANSFORMATION INDUSTRIES ps010101 Activities 010101 - 010105
Emission Inventory Guidebook December, 2006 B111-45
1) A principal differentiation between coking coal and steam coal is given in section 3.2. Further differentiation between coking coal and steam coal can be made by using the content of volatiles: coking coal contains 20 - 30 wt.-% volatiles (maf), steam coal contains 9.5 - 20 wt.-% volatiles (maf) (based on official UK subdivision). This is necessary if no information concerning the mean random reflectance of vitrinite (see Section 3.2) is available.2) Hu = lower heating value; lower heating values for coals from different countries are given in Annexes 7 and 8 and for solid, liquid and gaseous fuels in (/88/, Table 1-2).3) given under standard conditions4) Kolar 1990 /17/5) /98/6) MWV 1992 /97/7) Boelitz 1993 /78/8) Schenkel 1990 /105/9) Steinmüller 1984 /107/10) NL-handbook 1988 /99/11) GHV = Gross heating value
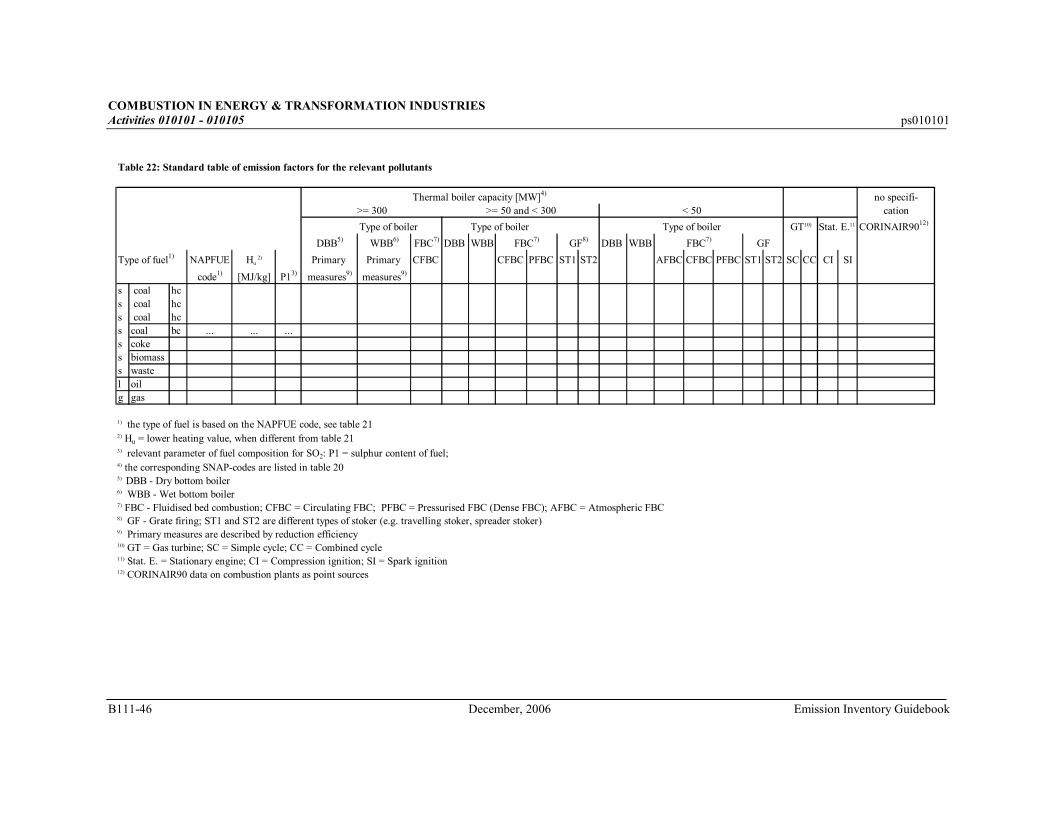
COMBUSTION IN ENERGY & TRANSFORMATION INDUSTRIES Activities 010101 - 010105 ps010101
B111-46 December, 2006 Emission Inventory Guidebook
Table 22: Standard table of emission factors for the relevant pollutants
Thermal boiler capacity [MW]4) no specifi->= 300 >= 50 and < 300 < 50 cation
Type of boiler Type of boiler Type of boiler GT10) Stat. E.11) CORINAIR9012)
DBB5) WBB6) FBC7) DBB WBB FBC7) GF8) DBB WBB FBC7) GF
Type of fuel1) NAPFUE Hu 2) Primary Primary CFBC CFBC PFBC ST1 ST2 AFBC CFBC PFBC ST1 ST2 SC CC CI SI
code1) [MJ/kg] P13) measures9) measures9)
s coal hcs coal hcs coal hcs coal bc ... ... ...s cokes biomasss wastel oilg gas
1) the type of fuel is based on the NAPFUE code, see table 212) Hu = lower heating value, when different from table 213) relevant parameter of fuel composition for SO2: P1 = sulphur content of fuel;4) the corresponding SNAP-codes are listed in table 205) DBB - Dry bottom boiler6) WBB - Wet bottom boiler7) FBC - Fluidised bed combustion; CFBC = Circulating FBC; PFBC = Pressurised FBC (Dense FBC); AFBC = Atmospheric FBC8) GF - Grate firing; ST1 and ST2 are different types of stoker (e.g. travelling stoker, spreader stoker) 9) Primary measures are described by reduction efficiency 10) GT = Gas turbine; SC = Simple cycle; CC = Combined cycle11) Stat. E. = Stationary engine; CI = Compression ignition; SI = Spark ignition12) CORINAIR90 data on combustion plants as point sources
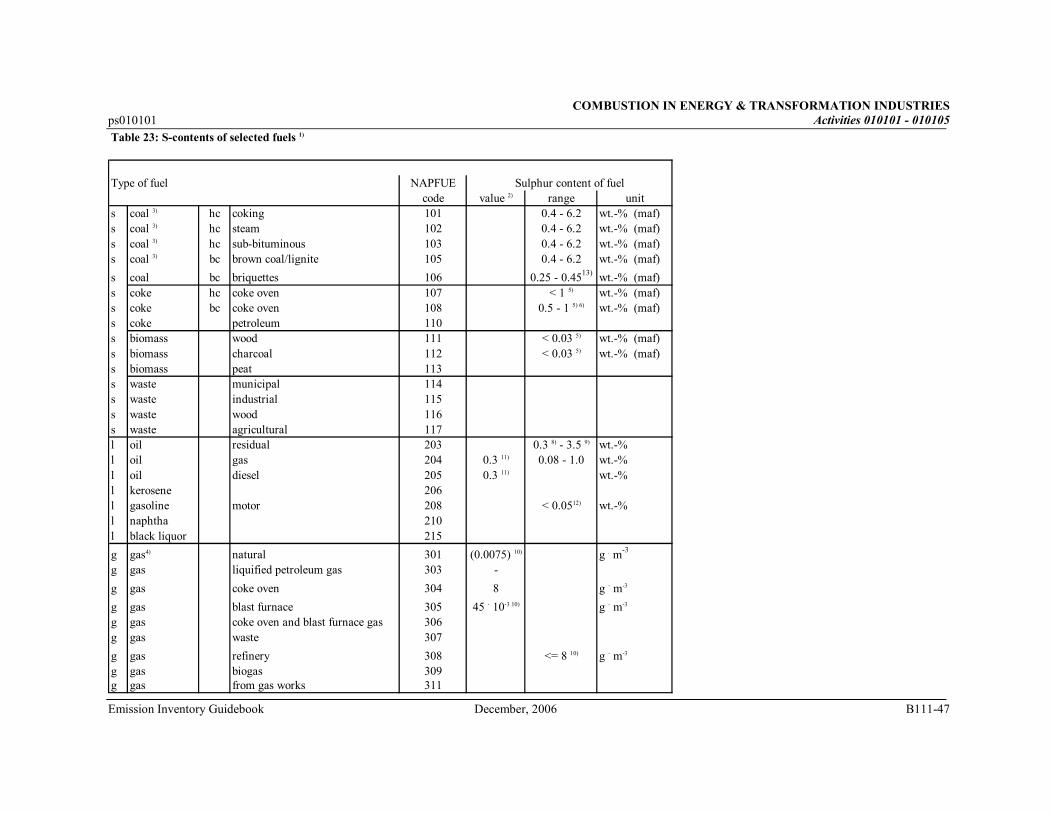
COMBUSTION IN ENERGY & TRANSFORMATION INDUSTRIES ps010101 Activities 010101 - 010105
Emission Inventory Guidebook December, 2006 B111-47
Table 23: S-contents of selected fuels 1)
Type of fuel NAPFUE Sulphur content of fuelcode value 2) range unit
s coal 3) hc coking 101 0.4 - 6.2 wt.-% (maf)s coal 3) hc steam 102 0.4 - 6.2 wt.-% (maf)s coal 3) hc sub-bituminous 103 0.4 - 6.2 wt.-% (maf)s coal 3) bc brown coal/lignite 105 0.4 - 6.2 wt.-% (maf)
s coal bc briquettes 106 0.25 - 0.4513) wt.-% (maf)s coke hc coke oven 107 < 1 5) wt.-% (maf)s coke bc coke oven 108 0.5 - 1 5) 6) wt.-% (maf)s coke petroleum 110s biomass wood 111 < 0.03 5) wt.-% (maf)s biomass charcoal 112 < 0.03 5) wt.-% (maf)s biomass peat 113s waste municipal 114s waste industrial 115s waste wood 116s waste agricultural 117l oil residual 203 0.3 8) - 3.5 9) wt.-%l oil gas 204 0.3 11) 0.08 - 1.0 wt.-%l oil diesel 205 0.3 11) wt.-%l kerosene 206l gasoline motor 208 < 0.0512) wt.-%l naphtha 210l black liquor 215
g gas4) natural 301 (0.0075) 10) g . m-3
g gas liquified petroleum gas 303 -
g gas coke oven 304 8 g . m-3
g gas blast furnace 305 45 . 10-3 10) g . m-3
g gas coke oven and blast furnace gas 306g gas waste 307
g gas refinery 308 <= 8 10) g . m-3
g gas biogas 309g gas from gas works 311
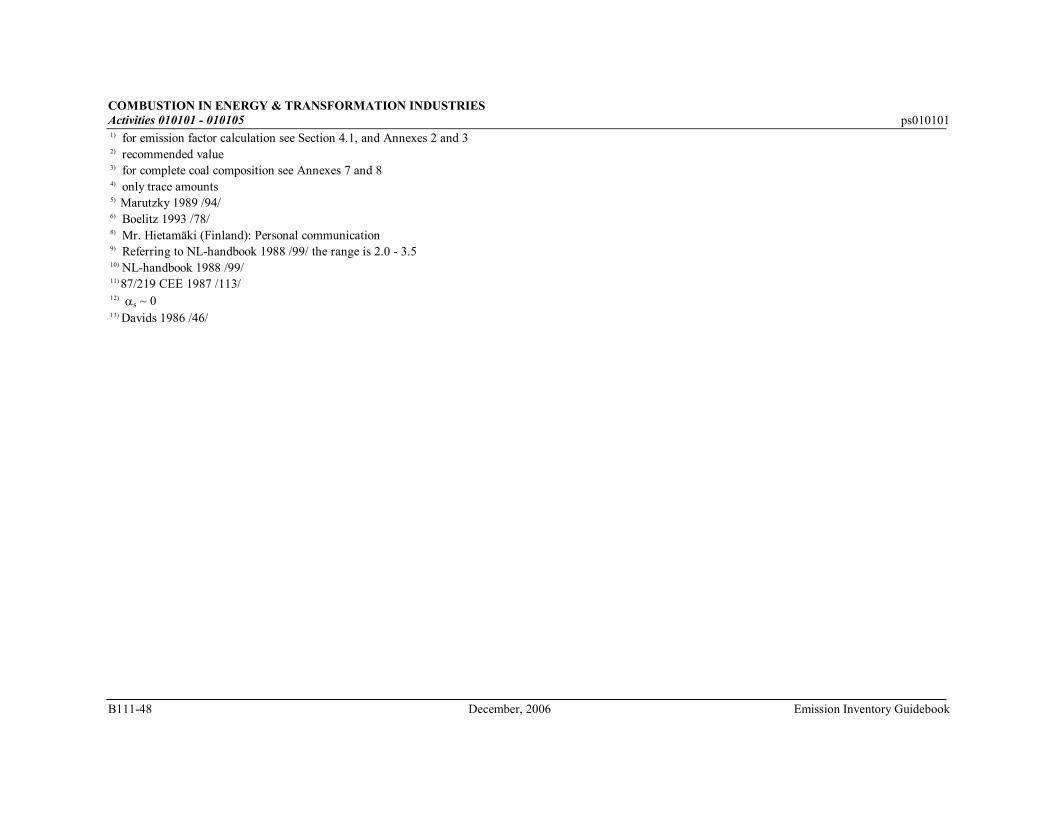
COMBUSTION IN ENERGY & TRANSFORMATION INDUSTRIES Activities 010101 - 010105 ps010101
B111-48 December, 2006 Emission Inventory Guidebook
1) for emission factor calculation see Section 4.1, and Annexes 2 and 32) recommended value3) for complete coal composition see Annexes 7 and 84) only trace amounts5) Marutzky 1989 /94/6) Boelitz 1993 /78/8) Mr. Hietamäki (Finland): Personal communication 9) Referring to NL-handbook 1988 /99/ the range is 2.0 - 3.510) NL-handbook 1988 /99/11) 87/219 CEE 1987 /113/12) αs ~ 013) Davids 1986 /46/
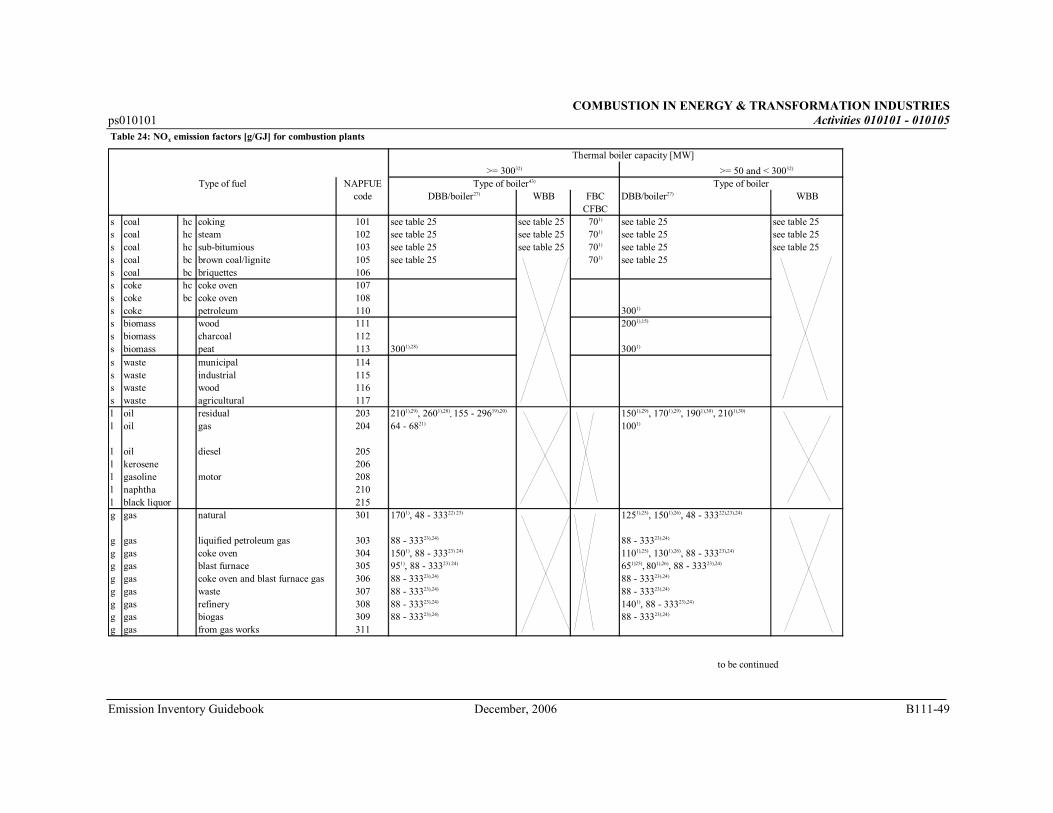
COMBUSTION IN ENERGY & TRANSFORMATION INDUSTRIES ps010101 Activities 010101 - 010105
Emission Inventory Guidebook December, 2006 B111-49
Table 24: NOx emission factors [g/GJ] for combustion plants
Thermal boiler capacity [MW]
>= 30032) >= 50 and < 30032)
Type of fuel NAPFUE Type of boiler43) Type of boilercode DBB/boiler27) WBB FBC DBB/boiler27) WBB
CFBCs coal hc coking 101 see table 25 see table 25 701) see table 25 see table 25s coal hc steam 102 see table 25 see table 25 701) see table 25 see table 25s coal hc sub-bitumious 103 see table 25 see table 25 701) see table 25 see table 25s coal bc brown coal/lignite 105 see table 25 701) see table 25s coal bc briquettes 106s coke hc coke oven 107s coke bc coke oven 108s coke petroleum 110 3001)
s biomass wood 111 2001),15)
s biomass charcoal 112s biomass peat 113 3001),28) 3001)
s waste municipal 114s waste industrial 115s waste wood 116s waste agricultural 117l oil residual 203 2101),29), 2601),28), 155 - 29619),20) 1501),29), 1701),29), 1901),30), 2101),30)
l oil gas 204 64 - 6821) 1001)
l oil diesel 205l kerosene 206l gasoline motor 208l naphtha 210l black liquor 215g gas natural 301 1701), 48 - 33322) 23) 1251),25), 1501),26), 48 - 33322),23),24)
g gas liquified petroleum gas 303 88 - 33323),24) 88 - 33323),24)
g gas coke oven 304 1501), 88 - 33323) 24) 1101),25), 1301),26), 88 - 33323),24)
g gas blast furnace 305 951), 88 - 33323) 24) 651)25), 801),26), 88 - 33323),24)
g gas coke oven and blast furnace gas 306 88 - 33323),24) 88 - 33323),24)
g gas waste 307 88 - 33323),24) 88 - 33323),24)
g gas refinery 308 88 - 33323),24) 1401), 88 - 33323),24)
g gas biogas 309 88 - 33323),24) 88 - 33323),24)
g gas from gas works 311
to be continued
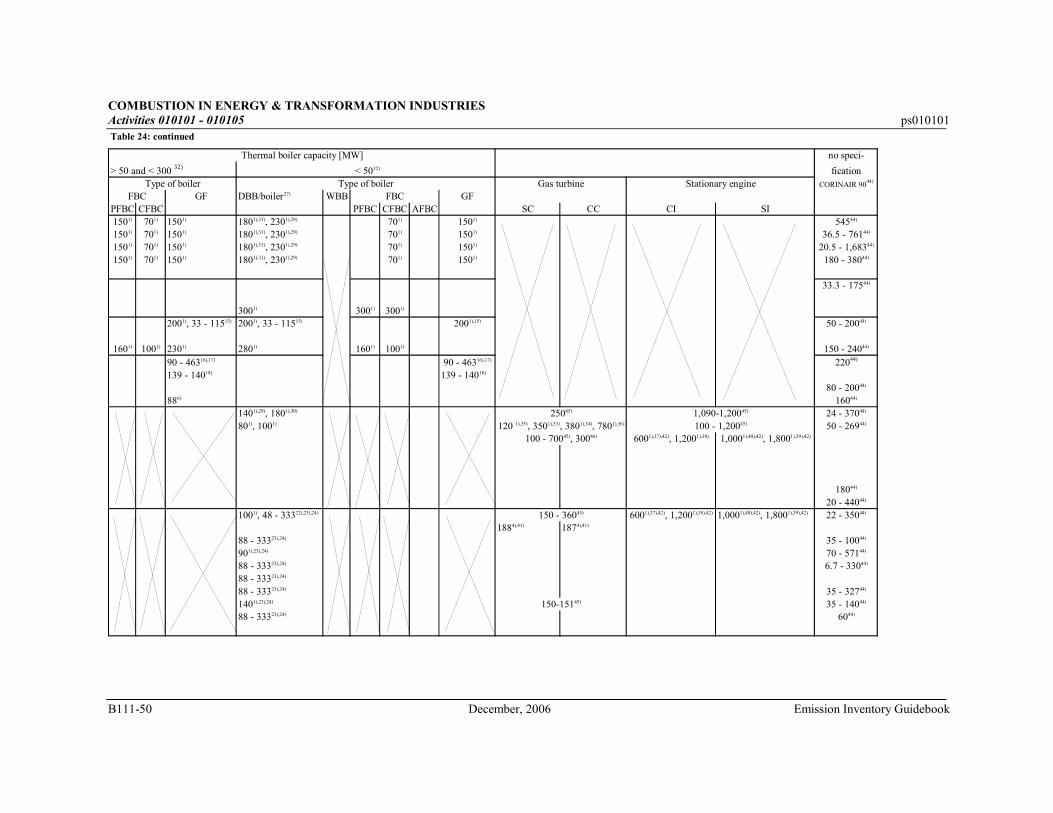
COMBUSTION IN ENERGY & TRANSFORMATION INDUSTRIES Activities 010101 - 010105 ps010101
B111-50 December, 2006 Emission Inventory Guidebook
Table 24: continued
Thermal boiler capacity [MW] no speci-
> 50 and < 300 32) < 5032) ficationType of boiler Type of boiler Gas turbine Stationary engine CORINAIR 9044)
FBC GF DBB/boiler27) WBB FBC GFPFBC CFBC PFBC CFBC AFBC SC CC CI SI1501) 701) 1501) 1801),31), 2301),29) 701) 1501) 54544)
1501) 701) 1501) 1801),31), 2301),29) 701) 1501) 36.5 - 76144)
1501) 701) 1501) 1801),31), 2301),29) 701) 1501) 20.5 - 1,68344)
1501) 701) 1501) 1801),31), 2301),29) 701) 1501) 180 - 38044)
33.3 - 17544)
3001) 3001) 3001)
2001), 33 - 11515) 2001), 33 - 11515) 2001),15) 50 - 20044)
1601) 1001) 2301) 2801) 1601) 1001) 150 - 24044)
90 - 46316),17) 90 - 46316),17) 22044)
139 - 14018) 139 - 14018)
80 - 20044)
886) 16044)
1401),29), 1801),30) 25045) 1,090-1,20045) 24 - 37044)
801), 1001) 120 1),35), 3501),33), 3801),34), 7801),36) 100 - 1,20045) 50 - 26944)
100 - 70045), 30046) 6001),37),42), 1,2001),38) 1,0001),40),42), 1,8001),39),42)
18044)
20 - 44044)
1001), 48 - 33322),23),24) 150 - 36045) 6001),37),42), 1,2001),38),42) 1,0001),40),42), 1,8001),39),42) 22 - 35044)
1884),41) 1874),41)
88 - 33323),24) 35 - 10044)
901),23),24) 70 - 57144)
88 - 33323),24) 6.7 - 33044)
88 - 33323),24)
88 - 33323),24) 35 - 32744)
1401),23),24) 150-15145) 35 - 14044)
88 - 33323),24) 6044)
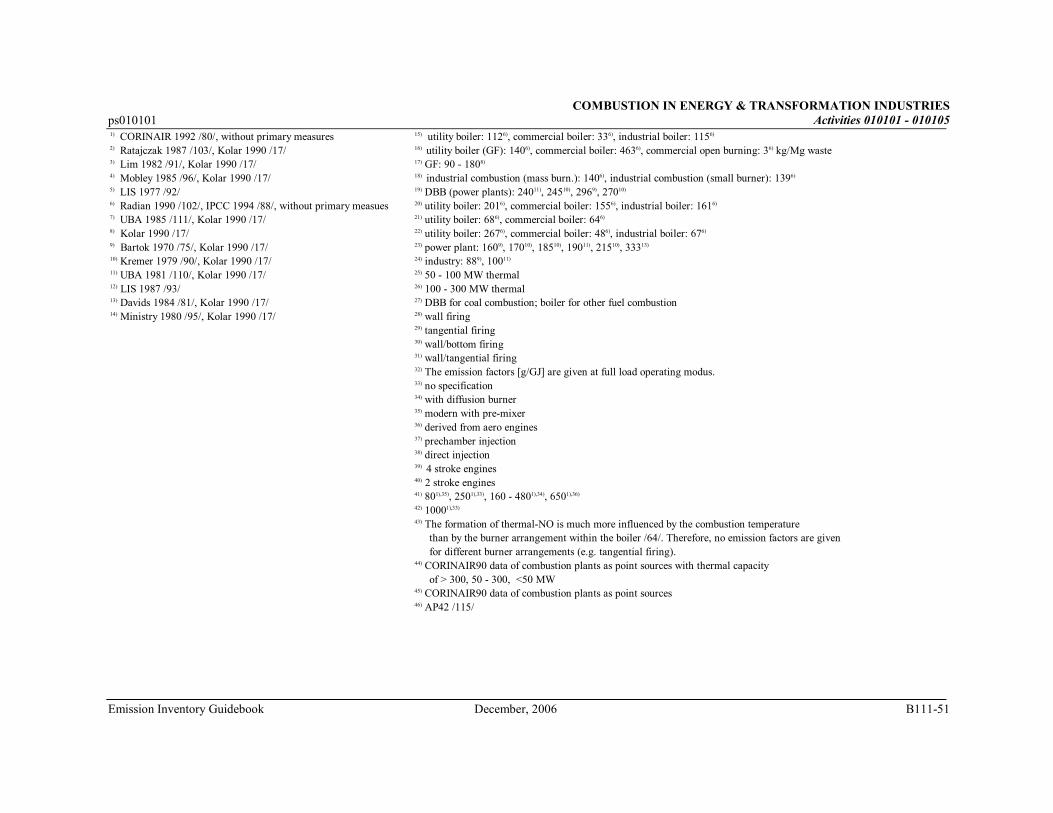
COMBUSTION IN ENERGY & TRANSFORMATION INDUSTRIES ps010101 Activities 010101 - 010105
Emission Inventory Guidebook December, 2006 B111-51
1) CORINAIR 1992 /80/, without primary measures 15) utility boiler: 1126), commercial boiler: 336), industrial boiler: 1156)
2) Ratajczak 1987 /103/, Kolar 1990 /17/ 16) utility boiler (GF): 1406), commercial boiler: 4636), commercial open burning: 36) kg/Mg waste 3) Lim 1982 /91/, Kolar 1990 /17/ 17) GF: 90 - 1808)
4) Mobley 1985 /96/, Kolar 1990 /17/ 18) industrial combustion (mass burn.): 1406), industrial combustion (small burner): 1396)
5) LIS 1977 /92/ 19) DBB (power plants): 24011), 24510), 2969), 27010)
6) Radian 1990 /102/, IPCC 1994 /88/, without primary measues 20) utility boiler: 2016), commercial boiler: 1556), industrial boiler: 1616)
7) UBA 1985 /111/, Kolar 1990 /17/ 21) utility boiler: 686), commercial boiler: 646)
8) Kolar 1990 /17/ 22) utility boiler: 2676), commercial boiler: 486), industrial boiler: 676)
9) Bartok 1970 /75/, Kolar 1990 /17/ 23) power plant: 1609), 17010), 18510), 19011), 21510), 33313)
10) Kremer 1979 /90/, Kolar 1990 /17/ 24) industry: 889), 10011)
11) UBA 1981 /110/, Kolar 1990 /17/ 25) 50 - 100 MW thermal12) LIS 1987 /93/ 26) 100 - 300 MW thermal13) Davids 1984 /81/, Kolar 1990 /17/ 27) DBB for coal combustion; boiler for other fuel combustion14) Ministry 1980 /95/, Kolar 1990 /17/ 28) wall firing
29) tangential firing30) wall/bottom firing31) wall/tangential firing32) The emission factors [g/GJ] are given at full load operating modus.33) no specification34) with diffusion burner35) modern with pre-mixer36) derived from aero engines37) prechamber injection38) direct injection39) 4 stroke engines40) 2 stroke engines41) 801),35), 2501),33), 160 - 4801),34), 6501),36)
42) 10001),33)
43) The formation of thermal-NO is much more influenced by the combustion temperature than by the burner arrangement within the boiler /64/. Therefore, no emission factors are given for different burner arrangements (e.g. tangential firing).44) CORINAIR90 data of combustion plants as point sources with thermal capacity of > 300, 50 - 300, <50 MW45) CORINAIR90 data of combustion plants as point sources46) AP42 /115/
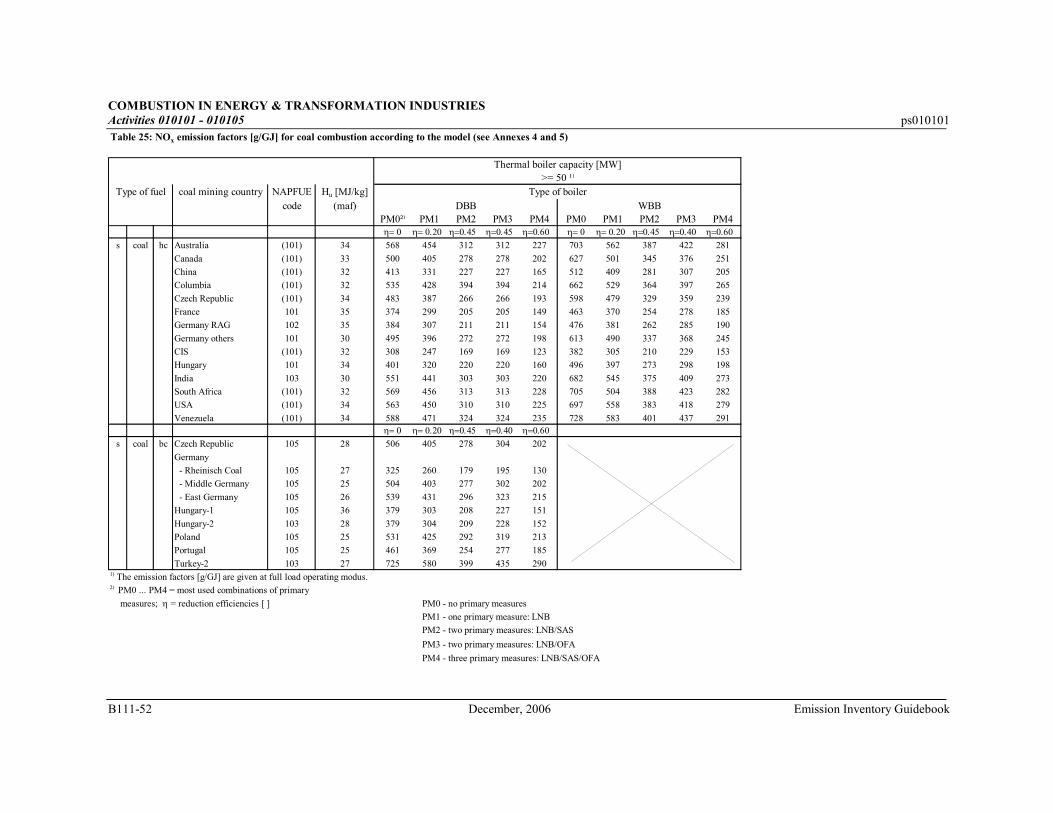
COMBUSTION IN ENERGY & TRANSFORMATION INDUSTRIES Activities 010101 - 010105 ps010101
B111-52 December, 2006 Emission Inventory Guidebook
Table 25: NOx emission factors [g/GJ] for coal combustion according to the model (see Annexes 4 and 5)
Thermal boiler capacity [MW]>= 50 ¹)
Type of fuel coal mining country NAPFUE Hu [MJ/kg] Type of boilercode (maf) DBB WBB
PM0²) PM1 PM2 PM3 PM4 PM0 PM1 PM2 PM3 PM4η= 0 η= 0.20 η=0.45 η=0.45 η=0.60 η= 0 η= 0.20 η=0.45 η=0.40 η=0.60
s coal hc Australia (101) 34 568 454 312 312 227 703 562 387 422 281
Canada (101) 33 500 405 278 278 202 627 501 345 376 251
China (101) 32 413 331 227 227 165 512 409 281 307 205
Columbia (101) 32 535 428 394 394 214 662 529 364 397 265
Czech Republic (101) 34 483 387 266 266 193 598 479 329 359 239
France 101 35 374 299 205 205 149 463 370 254 278 185
Germany RAG 102 35 384 307 211 211 154 476 381 262 285 190
Germany others 101 30 495 396 272 272 198 613 490 337 368 245
CIS (101) 32 308 247 169 169 123 382 305 210 229 153
Hungary 101 34 401 320 220 220 160 496 397 273 298 198
India 103 30 551 441 303 303 220 682 545 375 409 273
South Africa (101) 32 569 456 313 313 228 705 504 388 423 282
USA (101) 34 563 450 310 310 225 697 558 383 418 279
Venezuela (101) 34 588 471 324 324 235 728 583 401 437 291η= 0 η= 0.20 η=0.45 η=0.40 η=0.60
s coal bc Czech Republic 105 28 506 405 278 304 202
Germany
- Rheinisch Coal 105 27 325 260 179 195 130
- Middle Germany 105 25 504 403 277 302 202
- East Germany 105 26 539 431 296 323 215
Hungary-1 105 36 379 303 208 227 151
Hungary-2 103 28 379 304 209 228 152
Poland 105 25 531 425 292 319 213
Portugal 105 25 461 369 254 277 185
Turkey-2 103 27 725 580 399 435 2901) The emission factors [g/GJ] are given at full load operating modus.2) PM0 ... PM4 = most used combinations of primary
measures; η = reduction efficiencies [ ] PM0 - no primary measures
PM1 - one primary measure: LNB
PM2 - two primary measures: LNB/SAS
PM3 - two primary measures: LNB/OFA
PM4 - three primary measures: LNB/SAS/OFA
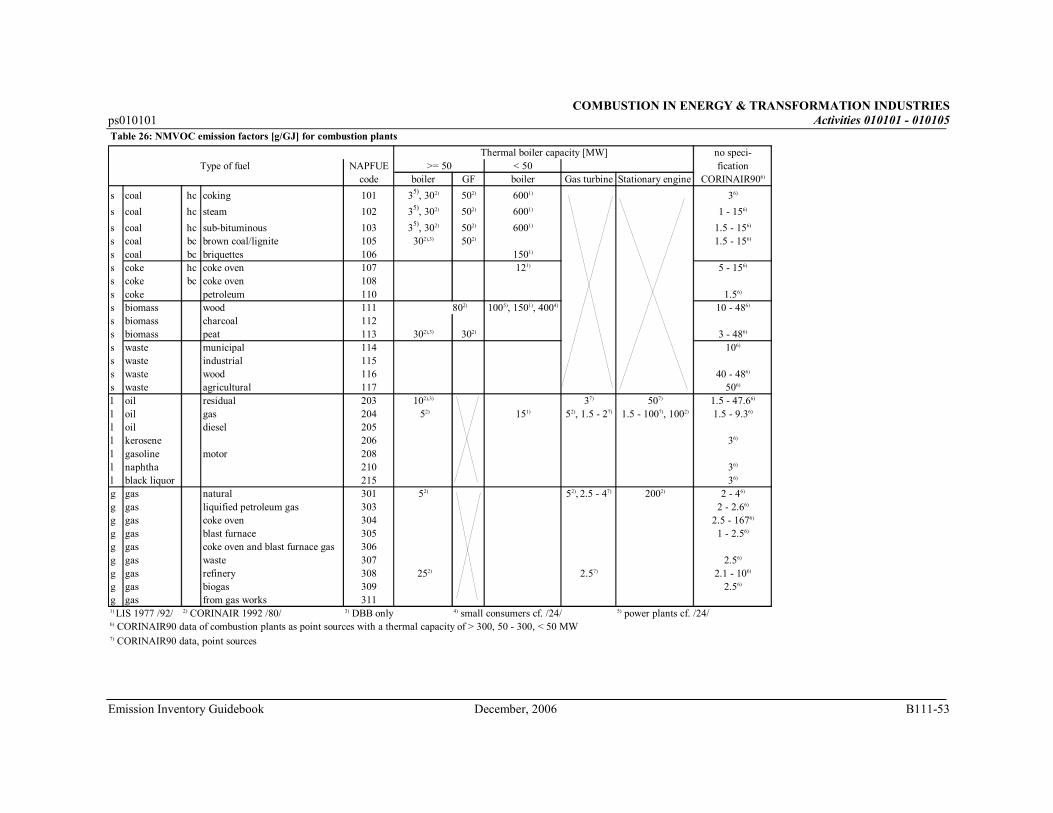
COMBUSTION IN ENERGY & TRANSFORMATION INDUSTRIES ps010101 Activities 010101 - 010105
Emission Inventory Guidebook December, 2006 B111-53
Table 26: NMVOC emission factors [g/GJ] for combustion plants
Thermal boiler capacity [MW] no speci-Type of fuel NAPFUE >= 50 < 50 fication
code boiler GF boiler Gas turbine Stationary engine CORINAIR906)
s coal hc coking 101 35), 302) 502) 6001) 36)
s coal hc steam 102 35), 302) 502) 6001) 1 - 156)
s coal hc sub-bituminous 103 35), 302) 502) 6001) 1.5 - 156)
s coal bc brown coal/lignite 105 302),3) 502) 1.5 - 156)
s coal bc briquettes 106 1501)
s coke hc coke oven 107 121) 5 - 156)
s coke bc coke oven 108s coke petroleum 110 1.56)
s biomass wood 111 802) 1005), 1501), 4004) 10 - 486)
s biomass charcoal 112s biomass peat 113 302),3) 302) 3 - 486)
s waste municipal 114 106)
s waste industrial 115s waste wood 116 40 - 486)
s waste agricultural 117 506)
l oil residual 203 102),3) 37) 507) 1.5 - 47.66)
l oil gas 204 52) 151) 52), 1.5 - 27) 1.5 - 1007), 1002) 1.5 - 9.36)
l oil diesel 205l kerosene 206 36)
l gasoline motor 208l naphtha 210 36)
l black liquor 215 36)
g gas natural 301 52) 52), 2.5 - 47) 2002) 2 - 46)
g gas liquified petroleum gas 303 2 - 2.66)
g gas coke oven 304 2.5 - 1676)
g gas blast furnace 305 1 - 2.56)
g gas coke oven and blast furnace gas 306g gas waste 307 2.56)
g gas refinery 308 252) 2.57) 2.1 - 106)
g gas biogas 309 2.56)
g gas from gas works 3111) LIS 1977 /92/ 2) CORINAIR 1992 /80/ 3) DBB only 4) small consumers cf. /24/ 5) power plants cf. /24/6) CORINAIR90 data of combustion plants as point sources with a thermal capacity of > 300, 50 - 300, < 50 MW 7) CORINAIR90 data, point sources
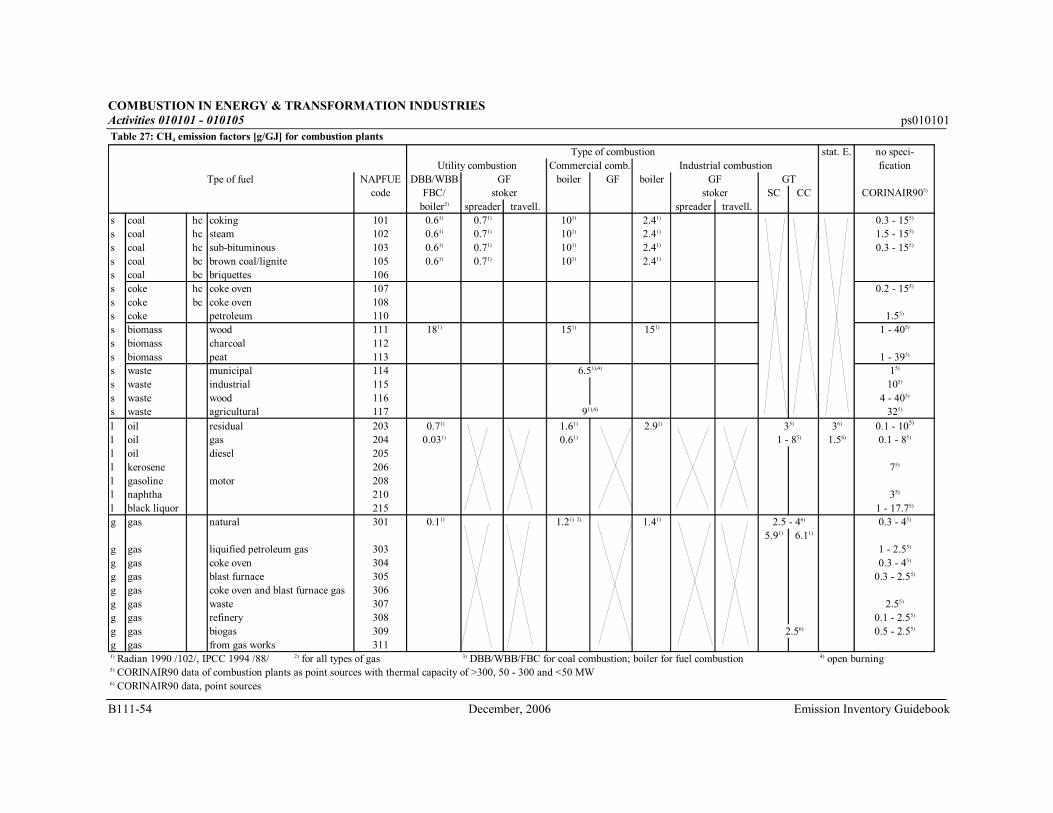
COMBUSTION IN ENERGY & TRANSFORMATION INDUSTRIES Activities 010101 - 010105 ps010101
B111-54 December, 2006 Emission Inventory Guidebook
Table 27: CH4 emission factors [g/GJ] for combustion plants
Type of combustion stat. E. no speci-Utility combustion Commercial comb. Industrial combustion fication
Tpe of fuel NAPFUE DBB/WBB GF boiler GF boiler GF GTcode FBC/ stoker stoker SC CC CORINAIR905)
boiler3) spreader travell. spreader travell.s coal hc coking 101 0.61) 0.71) 101) 2.41) 0.3 - 155)
s coal hc steam 102 0.61) 0.71) 101) 2.41) 1.5 - 155)
s coal hc sub-bituminous 103 0.61) 0.71) 101) 2.41) 0.3 - 155)
s coal bc brown coal/lignite 105 0.61) 0.71) 101) 2.41)
s coal bc briquettes 106s coke hc coke oven 107 0.2 - 155)
s coke bc coke oven 108s coke petroleum 110 1.55)
s biomass wood 111 181) 151) 151) 1 - 405)
s biomass charcoal 112s biomass peat 113 1 - 395)
s waste municipal 114 6.51),4) 15)
s waste industrial 115 105)
s waste wood 116 4 - 405)
s waste agricultural 117 91),4) 325)
l oil residual 203 0.71) 1.61) 2.91) 35) 36) 0.1 - 105)
l oil gas 204 0.031) 0.61) 1 - 85) 1.56) 0.1 - 85)
l oil diesel 205l kerosene 206 75)
l gasoline motor 208l naphtha 210 35)
l black liquor 215 1 - 17.75)
g gas natural 301 0.11) 1.21) 2) 1.41) 2.5 - 46) 0.3 - 45)
5.91) 6.11)
g gas liquified petroleum gas 303 1 - 2.55)
g gas coke oven 304 0.3 - 45)
g gas blast furnace 305 0.3 - 2.55)
g gas coke oven and blast furnace gas 306g gas waste 307 2.55)
g gas refinery 308 0.1 - 2.55)
g gas biogas 309 2.56) 0.5 - 2.55)
g gas from gas works 3111) Radian 1990 /102/, IPCC 1994 /88/ 2) for all types of gas 3) DBB/WBB/FBC for coal combustion; boiler for fuel combustion 4) open burning5) CORINAIR90 data of combustion plants as point sources with thermal capacity of >300, 50 - 300 and <50 MW6) CORINAIR90 data, point sources
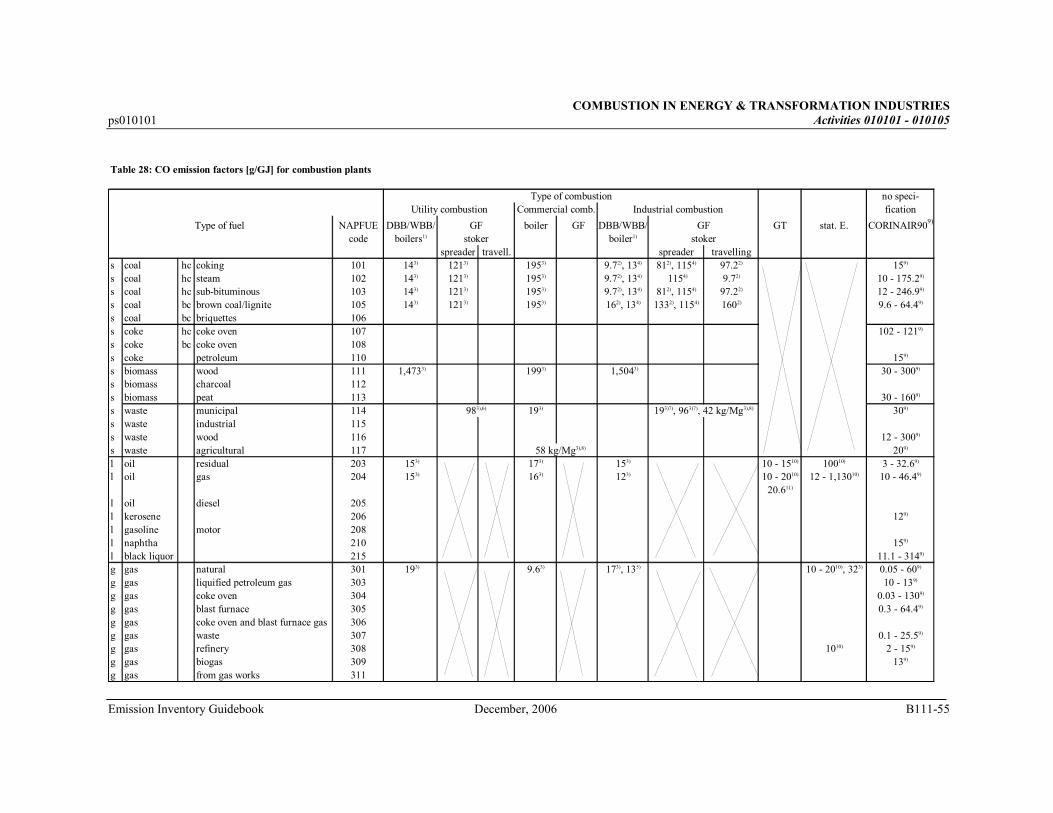
COMBUSTION IN ENERGY & TRANSFORMATION INDUSTRIES ps010101 Activities 010101 - 010105
Emission Inventory Guidebook December, 2006 B111-55
Table 28: CO emission factors [g/GJ] for combustion plants
Type of combustion no speci-Utility combustion Commercial comb. Industrial combustion fication
Type of fuel NAPFUE DBB/WBB/ GF boiler GF DBB/WBB/ GF GT stat. E. CORINAIR909)
code boilers1) stoker boiler1) stokerspreader travell. spreader travelling
s coal hc coking 101 143) 1213) 1953) 9.72), 134) 812), 1154) 97.22) 159)
s coal hc steam 102 143) 1213) 1953) 9.72), 134) 1154) 9.72) 10 - 175.29)
s coal hc sub-bituminous 103 143) 1213) 1953) 9.72), 134) 812), 1154) 97.22) 12 - 246.99)
s coal bc brown coal/lignite 105 143) 1213) 1953) 162), 134) 1332), 1154) 1602) 9.6 - 64.49)
s coal bc briquettes 106s coke hc coke oven 107 102 - 1219)
s coke bc coke oven 108s coke petroleum 110 159)
s biomass wood 111 1,4733) 1993) 1,5043) 30 - 3009)
s biomass charcoal 112s biomass peat 113 30 - 1609)
s waste municipal 114 983),6) 193) 193)7), 963)7), 42 kg/Mg3),8) 309)
s waste industrial 115s waste wood 116 12 - 3009)
s waste agricultural 117 58 kg/Mg3),8) 209)
l oil residual 203 153) 173) 153) 10 - 1510) 10010) 3 - 32.69)
l oil gas 204 153) 163) 123) 10 - 2010) 12 - 1,13010) 10 - 46.49)
20.611)
l oil diesel 205l kerosene 206 129)
l gasoline motor 208l naphtha 210 159)
l black liquor 215 11.1 - 3149)
g gas natural 301 193) 9.63) 173), 135) 10 - 2010), 323) 0.05 - 609)
g gas liquified petroleum gas 303 10 - 139)
g gas coke oven 304 0.03 - 1309)
g gas blast furnace 305 0.3 - 64.49)
g gas coke oven and blast furnace gas 306g gas waste 307 0.1 - 25.59)
g gas refinery 308 1010) 2 - 159)
g gas biogas 309 139)
g gas from gas works 311
COMBUSTION IN ENERGY & TRANSFORMATION INDUSTRIES Activities 010101 - 010105 ps010101
B111-56 December, 2006 Emission Inventory Guidebook
1) DBB/WBB for coal combustion; boiler for other fuel combustion2) EPA 1987 /85/, CORINAIR 1992 /80/3) Radian 1990 /102/, IPCC 1994 /88/, without primary measure4) OECD 1989 /100/, CORINAIR 1992 /80/5) CORINAIR 1992 /80/, part 86) grate firing without specification7) small combustion 19 g/GJ, mass burning 96 g/GJ8) open burning9) CORINAIR90 data of combustion plants as point sources with a thermal capacity of > 300, 50 - 300, < 50 MW10) CORINAIR90 data, point sources11) AP42 /115/
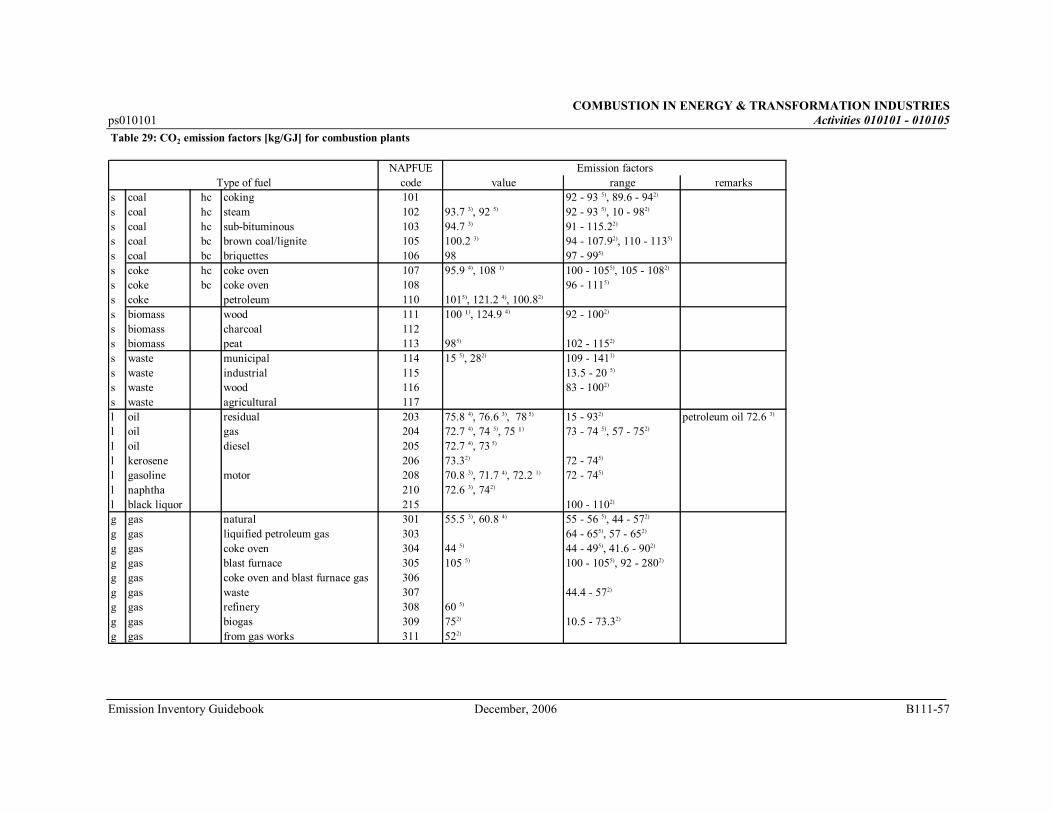
COMBUSTION IN ENERGY & TRANSFORMATION INDUSTRIES ps010101 Activities 010101 - 010105
Emission Inventory Guidebook December, 2006 B111-57
Table 29: CO2 emission factors [kg/GJ] for combustion plants
NAPFUE Emission factorsType of fuel code value range remarks
s coal hc coking 101 92 - 93 5), 89.6 - 942)
s coal hc steam 102 93.7 3), 92 5) 92 - 93 5), 10 - 982)
s coal hc sub-bituminous 103 94.7 3) 91 - 115.22)
s coal bc brown coal/lignite 105 100.2 3) 94 - 107.92), 110 - 1135)
s coal bc briquettes 106 98 97 - 995)
s coke hc coke oven 107 95.9 4), 108 1) 100 - 1055), 105 - 1082)
s coke bc coke oven 108 96 - 1115)
s coke petroleum 110 1015), 121.2 4), 100.82)
s biomass wood 111 100 ¹), 124.9 4) 92 - 1002)
s biomass charcoal 112s biomass peat 113 985) 102 - 1152)
s waste municipal 114 15 5), 282) 109 - 1411)
s waste industrial 115 13.5 - 20 5)
s waste wood 116 83 - 1002)
s waste agricultural 117l oil residual 203 75.8 4), 76.6 3), 78 5) 15 - 932) petroleum oil 72.6 3)
l oil gas 204 72.7 4), 74 5), 75 ¹) 73 - 74 5), 57 - 752)
l oil diesel 205 72.7 4), 73 5)
l kerosene 206 73.32) 72 - 745)
l gasoline motor 208 70.8 3), 71.7 4), 72.2 1) 72 - 745)
l naphtha 210 72.6 3), 742)
l black liquor 215 100 - 1102)
g gas natural 301 55.5 3), 60.8 4) 55 - 56 5), 44 - 572)
g gas liquified petroleum gas 303 64 - 655), 57 - 652)
g gas coke oven 304 44 5) 44 - 495), 41.6 - 902)
g gas blast furnace 305 105 5) 100 - 1055), 92 - 2802)
g gas coke oven and blast furnace gas 306g gas waste 307 44.4 - 572)
g gas refinery 308 60 5)
g gas biogas 309 752) 10.5 - 73.32)
g gas from gas works 311 522)
COMBUSTION IN ENERGY & TRANSFORMATION INDUSTRIES Activities 010101 - 010105 ps010101
B111-58 December, 2006 Emission Inventory Guidebook
1) Schenkel 1990 /105/2) CORINAIR90 data on combustion plants as point sources with thermal capacity of > 300, 50 - 300, < 50 MW3) IPCC 1993 /87/4) Kamm 1993 /89/5) BMU 1994 /77/
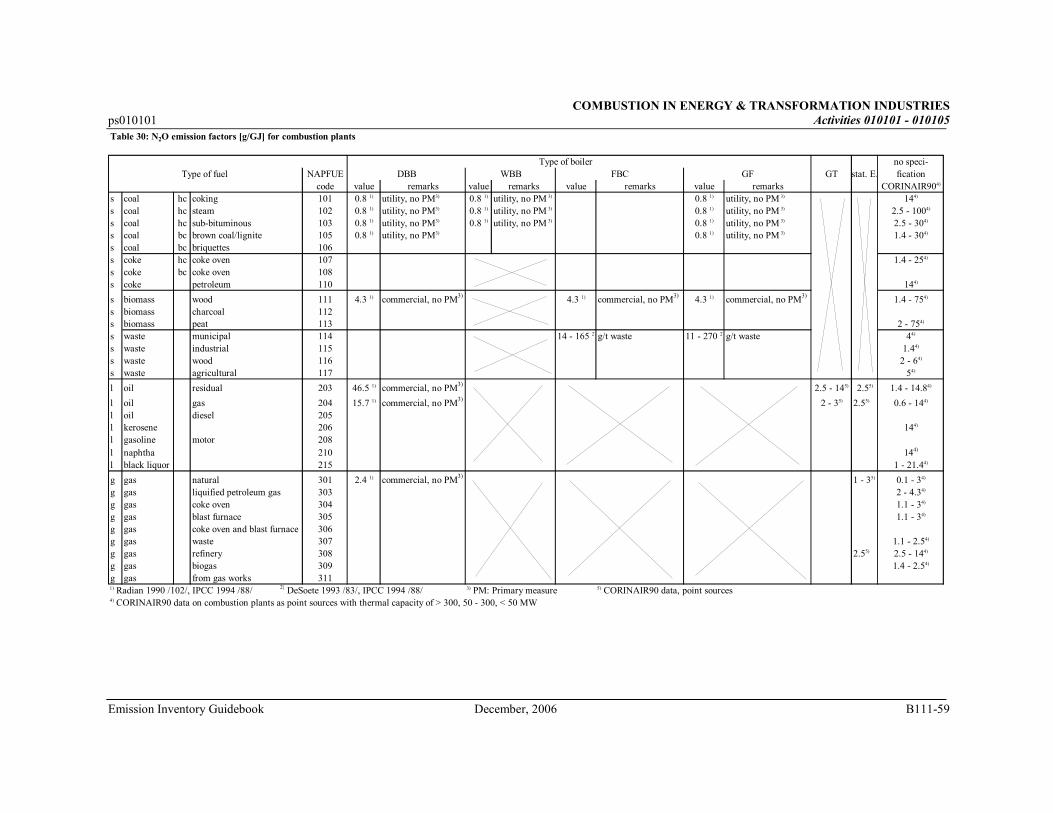
COMBUSTION IN ENERGY & TRANSFORMATION INDUSTRIES ps010101 Activities 010101 - 010105
Emission Inventory Guidebook December, 2006 B111-59
Table 30: N2O emission factors [g/GJ] for combustion plants
Type of boiler no speci-Type of fuel NAPFUE DBB WBB FBC GF GT stat. E. fication
code value remarks value remarks value remarks value remarks CORINAIR904)
s coal hc coking 101 0.8 1) utility, no PM3) 0.8 1) utility, no PM 3) 0.8 1) utility, no PM 3) 144)
s coal hc steam 102 0.8 1) utility, no PM3) 0.8 1) utility, no PM 3) 0.8 1) utility, no PM 3) 2.5 - 1004)
s coal hc sub-bituminous 103 0.8 1) utility, no PM3) 0.8 1) utility, no PM 3) 0.8 1) utility, no PM 3) 2.5 - 304)
s coal bc brown coal/lignite 105 0.8 1) utility, no PM3) 0.8 1) utility, no PM 3) 1.4 - 304)
s coal bc briquettes 106s coke hc coke oven 107 1.4 - 254)
s coke bc coke oven 108s coke petroleum 110 144)
s biomass wood 111 4.3 1) commercial, no PM3) 4.3 1) commercial, no PM3) 4.3 1) commercial, no PM3) 1.4 - 754)
s biomass charcoal 112s biomass peat 113 2 - 754)
s waste municipal 114 14 - 165 2) g/t waste 11 - 270 2) g/t waste 44)
s waste industrial 115 1.44)
s waste wood 116 2 - 64)
s waste agricultural 117 54)
l oil residual 203 46.5 1) commercial, no PM3) 2.5 - 145) 2.55) 1.4 - 14.84)
l oil gas 204 15.7 1) commercial, no PM3) 2 - 35) 2.55) 0.6 - 144)
l oil diesel 205l kerosene 206 144)
l gasoline motor 208l naphtha 210 144)
l black liquor 215 1 - 21.44)
g gas natural 301 2.4 1) commercial, no PM3) 1 - 35) 0.1 - 34)
g gas liquified petroleum gas 303 2 - 4.34)
g gas coke oven 304 1.1 - 34)
g gas blast furnace 305 1.1 - 34)
g gas coke oven and blast furnace 306g gas waste 307 1.1 - 2.54)
g gas refinery 308 2.55) 2.5 - 144)
g gas biogas 309 1.4 - 2.54)
g gas from gas works 3111) Radian 1990 /102/, IPCC 1994 /88/ 2) DeSoete 1993 /83/, IPCC 1994 /88/ 3) PM: Primary measure 5) CORINAIR90 data, point sources4) CORINAIR90 data on combustion plants as point sources with thermal capacity of > 300, 50 - 300, < 50 MW
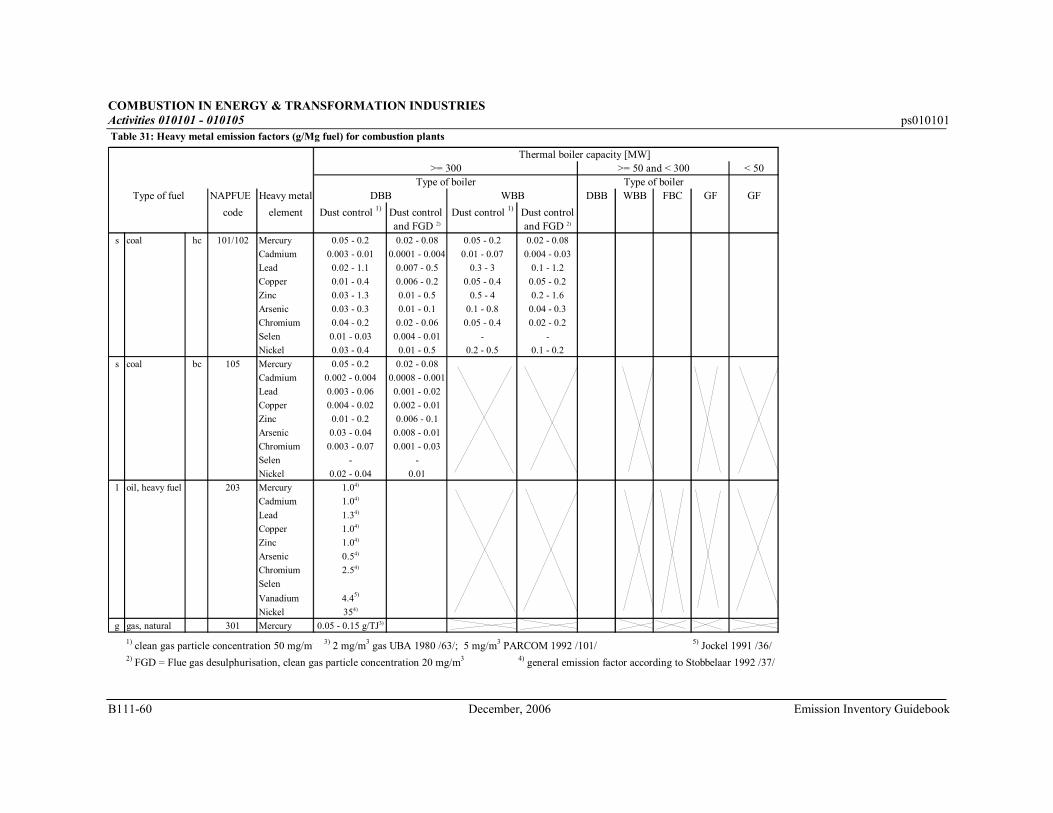
COMBUSTION IN ENERGY & TRANSFORMATION INDUSTRIES Activities 010101 - 010105 ps010101
B111-60 December, 2006 Emission Inventory Guidebook
Table 31: Heavy metal emission factors (g/Mg fuel) for combustion plants
Thermal boiler capacity [MW]>= 300 >= 50 and < 300 < 50
Type of boiler Type of boilerType of fuel NAPFUE Heavy metal DBB WBB DBB WBB FBC GF GF
code element Dust control 1) Dust control Dust control 1) Dust controland FGD 2) and FGD 2)
s coal hc 101/102 Mercury 0.05 - 0.2 0.02 - 0.08 0.05 - 0.2 0.02 - 0.08
Cadmium 0.003 - 0.01 0.0001 - 0.004 0.01 - 0.07 0.004 - 0.03
Lead 0.02 - 1.1 0.007 - 0.5 0.3 - 3 0.1 - 1.2
Copper 0.01 - 0.4 0.006 - 0.2 0.05 - 0.4 0.05 - 0.2
Zinc 0.03 - 1.3 0.01 - 0.5 0.5 - 4 0.2 - 1.6
Arsenic 0.03 - 0.3 0.01 - 0.1 0.1 - 0.8 0.04 - 0.3
Chromium 0.04 - 0.2 0.02 - 0.06 0.05 - 0.4 0.02 - 0.2
Selen 0.01 - 0.03 0.004 - 0.01 - -
Nickel 0.03 - 0.4 0.01 - 0.5 0.2 - 0.5 0.1 - 0.2
s coal bc 105 Mercury 0.05 - 0.2 0.02 - 0.08
Cadmium 0.002 - 0.004 0.0008 - 0.001
Lead 0.003 - 0.06 0.001 - 0.02
Copper 0.004 - 0.02 0.002 - 0.01
Zinc 0.01 - 0.2 0.006 - 0.1
Arsenic 0.03 - 0.04 0.008 - 0.01
Chromium 0.003 - 0.07 0.001 - 0.03
Selen - -
Nickel 0.02 - 0.04 0.01
l oil, heavy fuel 203 Mercury 1.04)
Cadmium 1.04)
Lead 1.34)
Copper 1.04)
Zinc 1.04)
Arsenic 0.54)
Chromium 2.54)
Selen
Vanadium 4.45)
Nickel 354)
g gas, natural 301 Mercury 0.05 - 0.15 g/TJ3)
1) clean gas particle concentration 50 mg/m3 3) 2 mg/m3 gas UBA 1980 /63/; 5 mg/m3 PARCOM 1992 /101/ 5) Jockel 1991 /36/2) FGD = Flue gas desulphurisation, clean gas particle concentration 20 mg/m3 4) general emission factor according to Stobbelaar 1992 /37/
COMBUSTION IN ENERGY & TRANSFORMATION INDUSTRIES ps010101 Activities 010101 - 010105
Emission Inventory Guidebook December, 2006 B111-61
9 SPECIFIC PROFILES
9.1 SOx emissions
Sulphur dioxide SO2 and sulphur trioxide SO3 are formed in the flame. Emissions of SO2 and SO3 are often considered together as SOx. Due to the equilibrium conditions at furnace temperature, sulphur trioxide SO3 normally decomposes to sulphur dioxide SO2. Then the amount of SO2 in the flue gas is approximately 99 %. Therefore, SOx is given in this chapter as SO2. 9.2 NOx emissions
The most important oxides of nitrogen formed with respect to pollution are nitric oxide (NO) and nitrogen dioxide (NO2), jointly referred to as NOx. The main compound is NO, which contributes over 90 % to the total NOx. Other oxides of nitrogen, such as dinitrogen-trioxide (N2O3), dinitrogen-tetroxide (N2O4), and dinitrogen-pentoxide (N2O5), are formed in negligible amounts. Nitrous oxide (N2O) is considered separrately. 9.3 NMVOC emissions
Due to the minor relevance of NMVOC emissions for power plants no split of species is given. 9.4 Heavy metal emissions
The heavy metals, which are of most environmental concern, are: arsenic (As), cadmium (Cd), chromium (Cr), copper (Cu), mercury (Hg), nickel (Ni), lead (Pb), selenium (Se) and zinc (Zn). This selection has been laid down by the UN-ECE Task Force on Heavy Metals, the PARCOM/ATMOS programme (cf. /35/) and the HELCOM programme. In the case of heavy oil combustion, vanadium emissions (V) are also of importance. In fly ash particles most of these elements occur as oxides or chlorides. The contribution of various forms of mercury to the emissions from combustion source categories in Europe is given in the following Figure 2:
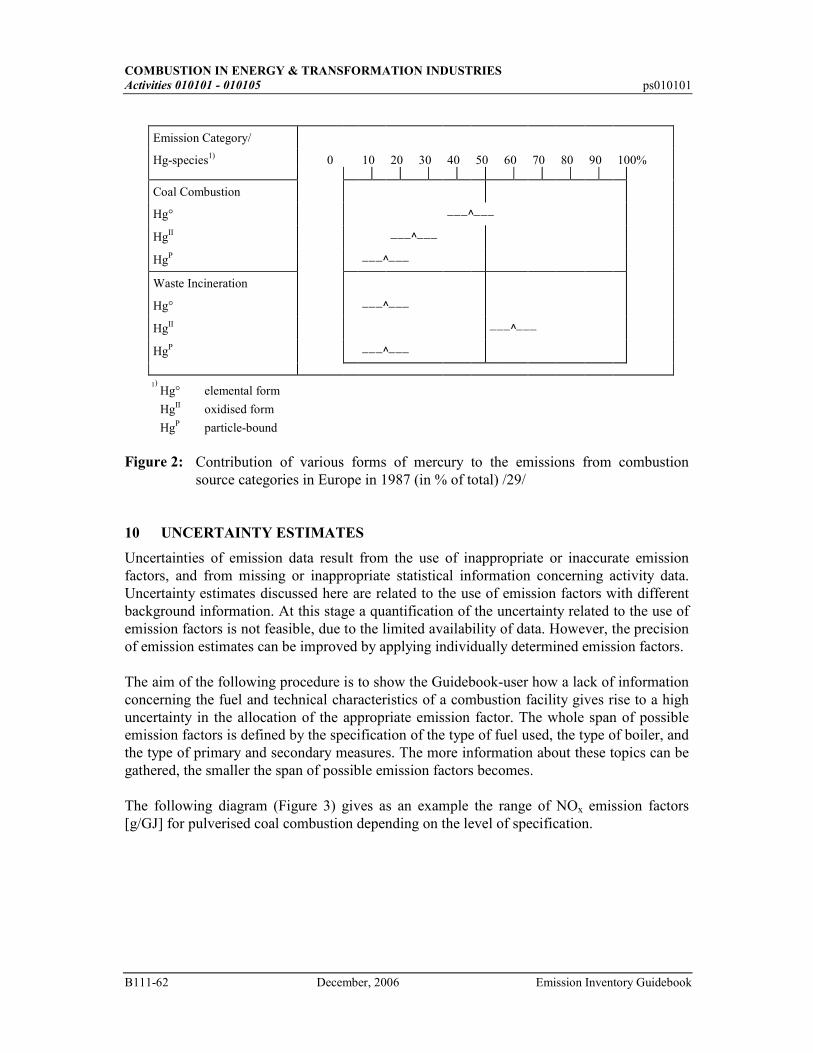
COMBUSTION IN ENERGY & TRANSFORMATION INDUSTRIES
Activities 010101 - 010105 ps010101
B111-62 December, 2006 Emission Inventory Guidebook
Emission Category/
Hg-species1) 0 10 20 30 40 50 60 70 80 90 100%
Coal Combustion
Hg° −−−^−−−
HgII −−−^−−−
HgP −−−^−−−
Waste Incineration
Hg° −−−^−−−
HgII −−−^−−−
HgP −−−^−−−
1) Hg° elemental form
HgII oxidised form
HgP particle-bound
Figure 2: Contribution of various forms of mercury to the emissions from combustion source categories in Europe in 1987 (in % of total) /29/
10 UNCERTAINTY ESTIMATES
Uncertainties of emission data result from the use of inappropriate or inaccurate emission factors, and from missing or inappropriate statistical information concerning activity data. Uncertainty estimates discussed here are related to the use of emission factors with different background information. At this stage a quantification of the uncertainty related to the use of emission factors is not feasible, due to the limited availability of data. However, the precision of emission estimates can be improved by applying individually determined emission factors. The aim of the following procedure is to show the Guidebook-user how a lack of information concerning the fuel and technical characteristics of a combustion facility gives rise to a high uncertainty in the allocation of the appropriate emission factor. The whole span of possible emission factors is defined by the specification of the type of fuel used, the type of boiler, and the type of primary and secondary measures. The more information about these topics can be gathered, the smaller the span of possible emission factors becomes. The following diagram (Figure 3) gives as an example the range of NOx emission factors [g/GJ] for pulverised coal combustion depending on the level of specification.
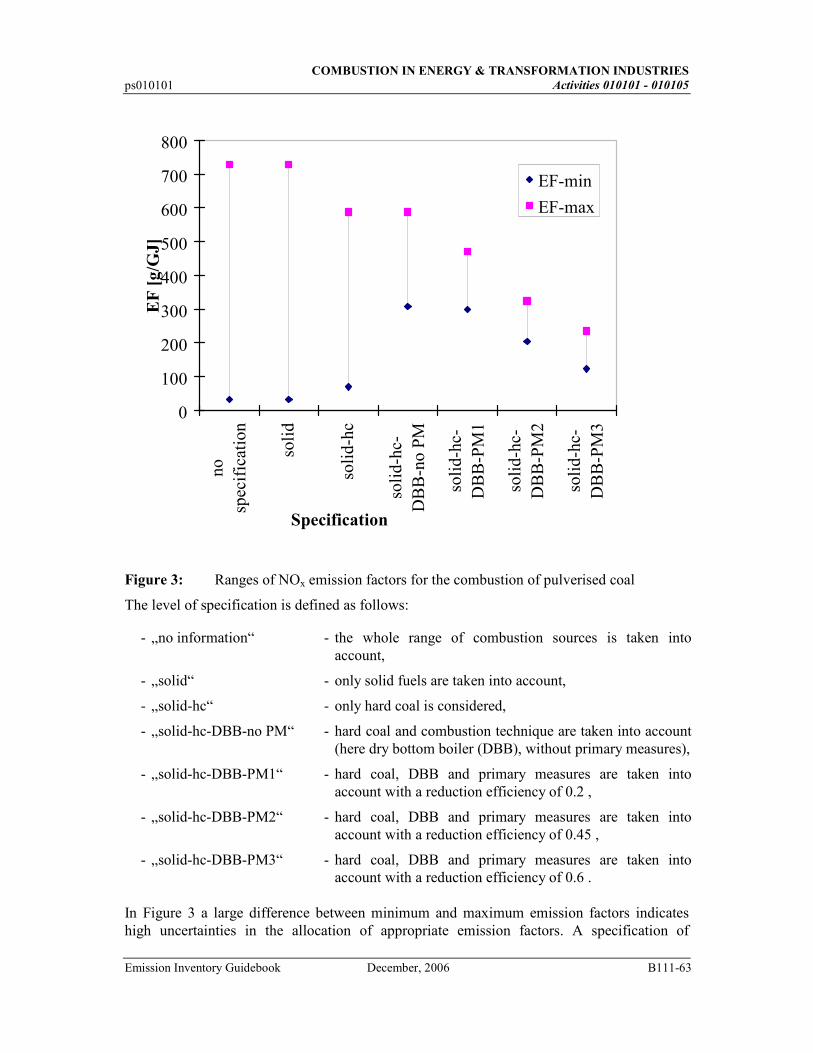
COMBUSTION IN ENERGY & TRANSFORMATION INDUSTRIES ps010101 Activities 010101 - 010105
Emission Inventory Guidebook December, 2006 B111-63
0
100
200
300
400
500
600
700
800
nosp
ecif
icat
ion
soli
d
soli
d-hc
soli
d-hc
-D
BB
-no
PM
soli
d-hc
-D
BB
-PM
1
soli
d-hc
-D
BB
-PM
2
soli
d-hc
-D
BB
-PM
3
Specification
EF [g/G
J]
EF-min
EF-max
Figure 3: Ranges of NOx emission factors for the combustion of pulverised coal
The level of specification is defined as follows:
- „no information“ - the whole range of combustion sources is taken into account,
- „solid“ - only solid fuels are taken into account,
- „solid-hc“ - only hard coal is considered,
- „solid-hc-DBB-no PM“ - hard coal and combustion technique are taken into account (here dry bottom boiler (DBB), without primary measures),
- „solid-hc-DBB-PM1“ - hard coal, DBB and primary measures are taken into account with a reduction efficiency of 0.2 ,
- „solid-hc-DBB-PM2“ - hard coal, DBB and primary measures are taken into account with a reduction efficiency of 0.45 ,
- „solid-hc-DBB-PM3“ - hard coal, DBB and primary measures are taken into account with a reduction efficiency of 0.6 .
In Figure 3 a large difference between minimum and maximum emission factors indicates high uncertainties in the allocation of appropriate emission factors. A specification of
COMBUSTION IN ENERGY & TRANSFORMATION INDUSTRIES
Activities 010101 - 010105 ps010101
B111-64 December, 2006 Emission Inventory Guidebook
emission factors only concerning the type of fuel used (e.g. hard coal) is not sufficient. The range of NOx emission factors for the combustion of pulverised coal is significantly reduced if technique related specifications are considered. 11 WEAKEST ASPECTS/PRIORITY AREAS FOR IMPROVEMENT IN
CURRENT METHODOLOGY
The weakest aspects discussed here are related to the determination of emission factors. Methodological shortcomings are discussed in this section for the main pollutants SO2, NOX and heavy metals. 11.1 SO2 emissions
The approach for the determination of SO2 emission factors is based on a simple mass
balance calculation as the formation mechanisms of sulphur dioxide within the boiler depend almost entirely on the sulphur input. Therefore, for the formation of sulphur dioxide, fuel characteristics are of main influence. The accuracy of this approach is determined by the following fuel parameters: lower heating value, fuel sulphur content and sulphur retention in ash (see Equation (5)). The sulphur content and the lower heating value can be highly variable between different fuel categories and can furthermore vary to a large extent within one fuel category. Therefore, default values for sulphur content and lower heating value should be avoided. However, if emission factors for SO2 have to be calculated, representative values for the sulphur content and the lower heating value should be based on measured data from individual fuel analysis. The sulphur retention in ash αs depends mainly on the content of alkaline components of the
fuel. This is only relevant for coal (e.g. CaO, MgO, Na2O, K2O) and for the case of additive
injection. For a more precise determination of αs, the Ca/S ratio (amount of calcium/sulphur
content of fuel)8, the particulate diameter, the surface character of CaO, the temperature (optimum ca. 800 °C), the pressure, the residence time, etc. should be taken into account. Therefore, the assessment of αs should be based on an extended set of parameters.
Besides the fuel characteristics, the reduction efficiency and availability of secondary measures are of relevance for the determination of the SO2 emission factors. Default values are proposed in Table 7, but measured data from individual combustion plants should preferably be used. 11.2 NOX EMISSIONS
The approach for the calculation of NOX emission factors is based on empirical relations. For fuel-NO only fuel characteristics are taken into account. The formation of thermal-NO increases exponentially with combustion temperatures above 1,300 °C (see /56/). At this
8 Alternatively the Ca/S ratio is defined as the amount of additives related to the sulphur content of the flue
gas, and is given for a brown coal fired dry bottom boiler as 2.5 - 5 as an example, for a stationary FBC as 2 - 4, for a circulating FBC < 2 etc. /55/.
COMBUSTION IN ENERGY & TRANSFORMATION INDUSTRIES ps010101 Activities 010101 - 010105
Emission Inventory Guidebook December, 2006 B111-65
stage, no satisfactory result has been achieved to determine the thermal-NO formation by using kinetic equations. For inventory purposes, an empirical parameter γ has been introduced (see Annex 5), which represents the fraction of thermal-NO formed. At this stage default values of γ depending on the type of boiler are given. Further work should focus on a more precise determination of this factor. Load dependence of the pollutant NOx has been taken into account. For old installations a quantitative relation has been given as an example for German power plants. The validity of this relation should be verified for other countries. Furthermore, the reduction efficiency of primary or secondary measures are of relevance for the determination of NOx emission factors. Default values for reduction efficiencies and availabilities are proposed in Tables 10 and 11, but measured data from individual combustion plants should preferably be used. 11.3 Heavy metals
Heavy metals undergo complex transformations during the combustion process and downstream of the boiler, referring to e.g. fly ash formation mechanisms. The approaches for the determination of heavy metal emission factors are based on empirical relations, where fuel and technical characteristics are of main influence. The heavy metal contents can be highly variable between different fuel categories (e.g. coal and heavy fuel oil) and can furthermore vary to a large extent within one fuel category (up to 2 orders of magnitude). Therefore, default values for heavy metal contents in fuel should be avoided and measured values should be used as far as possible. For inventory purposes, parameters, such as enrichment factors, fractions of fly ash leaving the combustion chamber, fraction of heavy metals emitted in gaseous form, have been introduced. Further work should be invested into a more precise determination of these parameters. In addition, it should be taken into account, that the reduction efficiency of (dust) abatement measures depends on the heavy metal. Heavy metal specific reduction efficiencies should be determined. 11.4 Other aspects
Emission factors for SO2, NO2 and CO, whether calculated or given in the tables, are related to full load conditions. In order to assess the relevance of start-up emissions, a detailed investigation has been accomplished by using measured values from different types of boiler (see also Annex 15). The qualitative and quantitative statements obtained in this approach should be verified. The emission factors have been determined by considering the pollutants separately. Possible mutual interactions between the formation mechanisms of different pollutants (e.g. NO and N2O) have been neglected and should be assessed in further work.
COMBUSTION IN ENERGY & TRANSFORMATION INDUSTRIES
Activities 010101 - 010105 ps010101
B111-66 December, 2006 Emission Inventory Guidebook
12 SPATIAL DISAGGREGATION CRITERIA FOR AREA SOURCES
This section is not relevant for combustion plants considered as point sources. 13 TEMPORAL DISAGGREGATION CRITERIA
The temporal disaggregation of annual emission data (top-down approach) provides a split into monthly, weekly, daily and hourly emission data. Temporal disaggregation of annual emissions released from combustion plants as point sources can be obtained from the temporal change of the production of electrical power or the temporal change of the consumption, taking into account a split into:
- summer and winter time,
- working days and holidays,
- standstill times,
- times of partial load behaviour and
- number of start-ups / type of load design.
This split should be carried out for defined categories of power plants which take into account the main relevant combinations of types of fuel used and types of boiler installed (similar split as used for the emission factor Tables in Section 8). The disaggregation of annual emissions into monthly, daily or hourly emissions can be based on a step-by-step approach /76/ according to the following equations: - Monthly emission:
EE
fMA
nn= ⋅
12 (25)
EMn Emission in month n; n = 1, ..., 12 [Mg]
EA Annual emission [Mg]
fn Factor for month n; n = 1, ..., 12 [ ] - Daily emission:
EE
Df
CFDM
kk
nn k
n
,= ⋅ ⋅
1 (26)
EDn,k Emission of day k in month n; k = 1, ..., Dk ; n = 1, ..., 12 [Mg]
EMn Emission in month n; n = 1, ..., 12 [Mg]
Dk Number of days in month n [ ]
fk Factor for day k; k = 1, ..., Dk [ ]
CFn Correction factor for month n [ ]

COMBUSTION IN ENERGY & TRANSFORMATION INDUSTRIES ps010101 Activities 010101 - 010105
Emission Inventory Guidebook December, 2006 B111-67
- Hourly emission:
EE
fH
D
n ln k l
n k
, ,
,
,= ⋅24
(27)
EHn,k,l Emission in hour l in day k and month n; l = 1, ..., 24; k = 1, ..., Dk ; n = 1, ..., 12 [Mg]
EDn,k Emission of day k in month n; k = 1, ..., Dk ; n = 1, ..., 12 [Mg]
fn,l Factor for hour l in month n; l = 1, ..., 24; n = 1, ..., 12 [ ]
Dk Number of days in month n [ ] The factors (relative activities) for month fn, day fk and hour fn,l can be related e.g. to the total fuel consumption or the net electricity production in public power plants. Figure 4 gives an example of a split for monthly factors based on the fuel consumption e.g. for Public Power Plants:
0
0,5
1
1,5
2
2,5
3
1 2 3 4 5 6 7 8 9 10 11 12
Month
Factor
Figure 4: Example of monthly factors for total fuel consumption in Public Power Plants
A split concerning the load design, which determines the annual number of start-ups can be given as follows (see also Table 11):
- Base load: The boiler/plant is normally in continuous operation during the year; start-ups occur relatively seldom (ca. 15 times per year) depending on maintenance periods which occur mostly in summer. The fuel mostly used in base load boilers is brown coal.
- Middle load: The boiler/plant is in operation in order to meet the energy demand on working days (Monday until Friday); start-ups can occur up to 150 times per year. The fuel mostly used in middle load boilers is hard coal.
- Peak load: The boiler/plant is in operation in order to meet the short term energy demand; start-ups can occur up to 200 times per year. The fuels mostly used in peak load boilers are gas or oil.
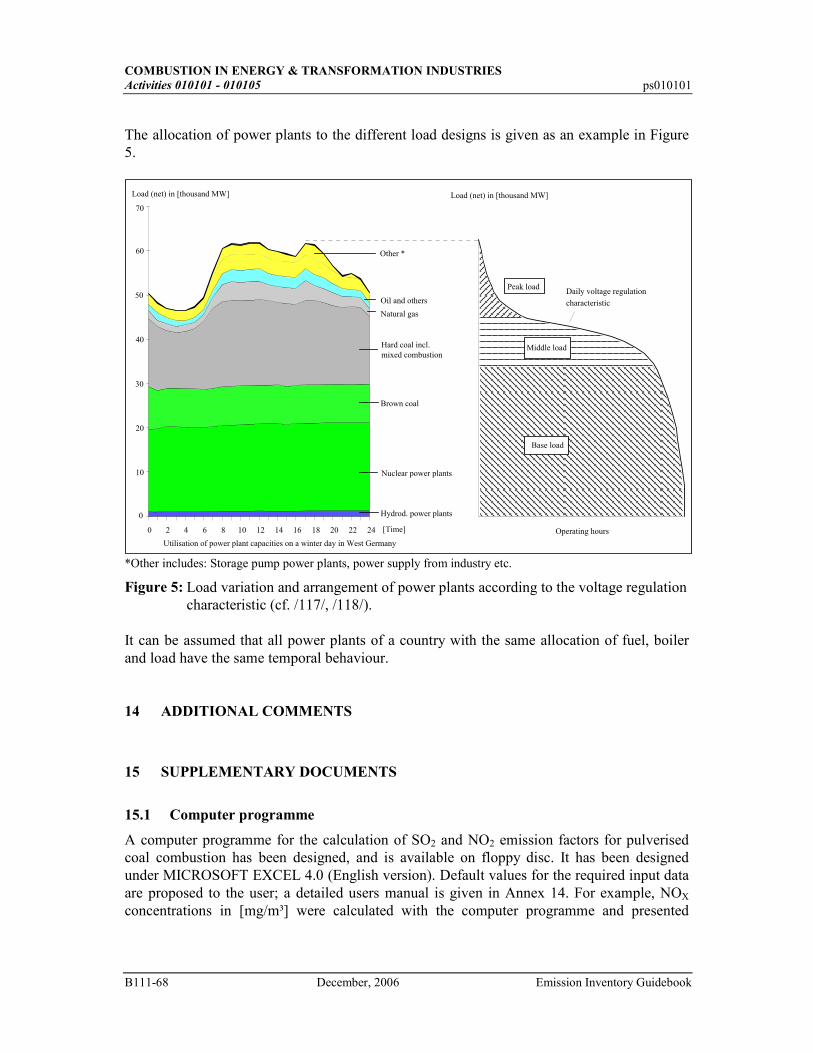
COMBUSTION IN ENERGY & TRANSFORMATION INDUSTRIES
Activities 010101 - 010105 ps010101
B111-68 December, 2006 Emission Inventory Guidebook
The allocation of power plants to the different load designs is given as an example in Figure 5.
0
10
20
30
40
50
60
70
Load (net) in [thousand MW]
Other *
Oil and others
Natural gas
Hard coal incl.mixed combustion
Brown coal
Nuclear power plants
Hydrod. power plants
0 2 4 6 8 10 12 14 16 18 20 22 24 [Time]
Utilisation of power plant capacities on a winter day in West Germany
Daily voltage regulation
Load (net) in [thousand MW]
Operating hours
Base load
Middle load
Peak load
characteristic
*Other includes: Storage pump power plants, power supply from industry etc.
Figure 5: Load variation and arrangement of power plants according to the voltage regulation characteristic (cf. /117/, /118/).
It can be assumed that all power plants of a country with the same allocation of fuel, boiler and load have the same temporal behaviour. 14 ADDITIONAL COMMENTS
15 SUPPLEMENTARY DOCUMENTS
15.1 Computer programme
A computer programme for the calculation of SO2 and NO2 emission factors for pulverised coal combustion has been designed, and is available on floppy disc. It has been designed under MICROSOFT EXCEL 4.0 (English version). Default values for the required input data are proposed to the user; a detailed users manual is given in Annex 14. For example, NOX concentrations in [mg/m³] were calculated with the computer programme and presented
COMBUSTION IN ENERGY & TRANSFORMATION INDUSTRIES ps010101 Activities 010101 - 010105
Emission Inventory Guidebook December, 2006 B111-69
together with the emission factors in [g/GJ] as listed in Annexes 10 and 11. An integral part of the computer programme is the calculation of the flue gas volume as given in Annex 6. 15.2 LIST OF ANNEXES
Annex 1: Example of different possible considerations of boilers as a common plant
Annex 2: Determination of SO2 emission factors (flow sheet)
Annex 3: Determination of SO2 emission factors (description)
Annex 4: Determination of NOx emission factors (flow sheet)
Annex 5: Determination of NOx emission factors (description)
Annex 6: Determination of the specific flue gas volume (flow sheet and description)
Annex 7: Composition and lower heating value (Hu) of hard coal in coal mining countries
Annex 8: Composition and lower heating value (Hu) of brown coal in coal mining countries
Annex 9: Conditions for exemplary calculation of NOx emission factors
Annex 10: Emission factors and flue gas concentrations for NOx obtained by model
calculations (see Annexes 4 and 5) for hard coal (see Annex 7)
Annex 11: Emission factors and flue gas concentrations for NOx obtained by model
calculations (see Annexes 4 and 5) for brown coal (see Annex 8)
Annex 12: Comparison between measured and calculated SO2 and NOx emission data
Annex 13. Sensitivity analysis of the computer programme results
Annex 14: Users’ manual for the emission factor calculation programme (for version September, 1995)
Annex 15: Determination of start-up emissions and start-up emission factors.
Annex 16: List of abbreviations
16 VERIFICATION PROCEDURES
As outlined in the chapter “Concepts for Emission Inventory Verification“, different general verification procedures can be recommended. The aim of this section is to develop specific verification procedures for emission data from combustion plants as point sources. The
COMBUSTION IN ENERGY & TRANSFORMATION INDUSTRIES
Activities 010101 - 010105 ps010101
B111-70 December, 2006 Emission Inventory Guidebook
verification procedures considered here are principally based on verification on a national and on a plant level. Moreover, it can be distinguished between the verification of activity data, of emission factors and of emission data. 16.1 Verification on a national level
For combustion plants as point sources, emissions and activities have to be verified. The total emissions from point sources are added together to obtain national total emissions (bottom-up approach). These national total emissions should be compared to emission data derived independently (top-down approach). Independent emission estimates can be obtained by using average emission factors and corresponding statistical data like the total fuel input for all sources, total thermal capacity, total heat or power produced, or by using emission estimates from other sources (e.g. organisations like energy agencies). The total fuel consumption should be reconciled with energy balances, which often have break-downs for large point sources (e.g. electricity, heat generation and industrial boilers). Furthermore, the total number of plants installed as well as their equipment should be checked with national statistics. Emission density comparisons can be achieved through comparison of e.g. emissions per capita or emissions per GDP with those of countries with a comparable economic structure. 16.2 Verification on a plant level
It should firstly be verified that separate inventories have been compiled for boilers, stationary engines, and gas turbines (according to SNAP code). The verification at plant level relies on comparisons between calculated emission factors and those derived from emission measurements. An example for such a comparison is given in Annex 12. 17 REFERENCES
/1/ Bretschneider, B.: Paper presented at the second panel meeting, Karlsruhe; Oct. 21/22, 1993 /2/ Hietamäki, M.: Personal communication, October 21, 1993
/3/ Fontelle, J.-P.: Paper presented at the first panel meeting, Karlsruhe; Feb. 18/19, 1993
/4/ Umweltbundesamt (ed.): Daten zur Umwelt 1990/91; Berlin; 1992
/5/ Civin, V.: Personal communication, October 21, 1993
/6/ Pulles, M.P.J.: Emission Inventory in the Netherlands, Industrial Emissions for 1988; Ministry of Housing, Physical Planning and Environment (ed.); s´-Gravenhage; Dec. 1992
/7/ Berdowski, J.J.M.: Combustion Emissions from Large Combustion Plants in the Netherlands in 1990 and
1991; Ministry of Housing, Physical Planning and Environment (ed.); s´-Gravenhage; March 1993
/8/ Paper presented by Mr. Debski at the first panel meeting: „Electricity generation and emission statistics"; Karlsruhe; Feb. 18/19, 1993
COMBUSTION IN ENERGY & TRANSFORMATION INDUSTRIES ps010101 Activities 010101 - 010105
Emission Inventory Guidebook December, 2006 B111-71
/9/ Council Directive of 24 November 1988 on the limitation of emissions of certain pollutants into the air from large combustion plants (88/699/EEC)
/10/ Proceedings of the second meeting of the UN-ECE Task Force on Heavy Metal Emissions, Prague,
October 15 - 17, 1991
/11/ Neckarwerke Elektrizitätsversorgungs-AG, Kraftwerk Walheim, Block 2: Demonstrationsanlage zur Reduzierung von NOx-Emissionen aus Schmelzkammerkessel mit Ascherückführung, Abschlußbericht,
Gesch.-Z: II 1.1-50441-1/43
/12/ Clarke, L.B.; Sloss, L.L.:Trace Element - Emissions from Coal Combustion and Gasification, IEA Coal Research, Rep.-Nr. IEACR, 1992
/13/ DeSoete, G.; Sharp, B.: Nitrous oxide emissions: Modifications as a consequence of current trends in
industrial fossil fuel combustion and in land use; Commission of the European Communities (ed.), Brussels, Luxemburg, 1991
/14/ Andersson, Curt; Brännström-Norberg, Britt-Marie; Hanell, Bengt: Nitrous oxide emissions from
different combustion sources; Swedish State Power Broad, Vaellingby (Schweden), 1989
/15/ DIN 51603: Flüssige Brennstoffe; Teil 1: Heizöl EL, Mindestanforderungen (1995); Teil 2: Heizöle L, T und M, Anforderungen an die Prüfung (1992)
/16/ VDI Richtlinie 2297: Emissionsminderung; Ölbefeuerte Dampf- und Heißwassererzeuger; 1982
/17/ Kolar, Jürgen; Stickstoffoxide und Luftreinhaltung, Springer Verlag Berlin, Heidelberg, New York, 1990
/18/ Rentz, O; Dorn, R.; Holschumacher, R.; Padberg, C.: Application of advanced SO2 and NOx emission
control technologies at stationary combustion installations in OECD countries; Institute for Industrial Production, University of Karlsruhe; June 1992
/19/ Rentz, O.; Ribeiro, J.: NOx Task Force - Operating Experience with NOx Abatement at Stationary
Sources; Report for the ECE; Dec. 1992
/20/ Gutberlet, H: Measurement of heavy metal removal by a flue gas desulfurization plant working by the lime scrubbing method, Research report No. ENV-492-D(B), Luxembourg, Commission of the European Communities, 1988
/21/ Maier, H.; Dahl, P.; Gutberlet, H.; Dieckmann, A.: Schwermetalle in kohlebefeuerten Kraftwerken, VGB
Kraftwerkstechnik, 72(1992)5, S. 439
/22/ Fahlke, J.: Untersuchungen zum Verhalten von Spurenelementen an kohlebefeuerten Dampferzeugern unter Berücksichtigung der Rauchgaseinigungsanlagen, VGB Kraftwerkstechnik, 73(1993)3, S. 254
/23/ Gutberlet, H.; Spiesberger, A.; Kastner, F.; Tembrink, J.: Zum Verhalten des Spurenelements Quecksilber
in Steinkohlenfeuerungen mit Rauchgasreinigungsanlagen, VGB Kraftwerkstechnik, 72(1992)7, S. 636 - 641
/24/ Rentz, O.; Holtmann, T.; Oertel, D.; Röll, C. et al: Konzeption zur Minderung der VOC-Emissionen in
Baden-Württemberg; Umweltministerium Baden-Württemberg (ed.); Heft 21; Karlsruhe (Germany), 1993
/25/ Hulgaard, Tore: Nitrous Emissions from Danish Power Plants; Danmarks Tekuiske Hoejkole, Lyngby
(Denmark); Institute for Kemiteknik, 1990
COMBUSTION IN ENERGY & TRANSFORMATION INDUSTRIES
Activities 010101 - 010105 ps010101
B111-72 December, 2006 Emission Inventory Guidebook
/26/ Clayton, Russ; Sykes, Alston; Machilek, Rudi; Krebs, Ken; Ryan, Jeff: NO Field study; prepared for the US-EPA; Research Triangle Park (NC), 1989
/27/ Bonn, B.: NOx-Emissionen bei Wirbelschichtfeuerungen; VDI-Berichte Nr. 1081; Düsseldorf (Germany),
1993
/28/ Economic Commission for Europe: NOx Task Force - Technologies for Controlling NOx Emissions from
Stationary Sources, April 1986
/29/ UN-ECE Task Force on Heavy Metal Emissions: State-of-the-Art Report; 1994
/30/ IEA-coal research (ed.): The problems on sulphur; London 1989
/31/ EVT Energie- und Verfahrenstechnik GmbH (ed.): Taschenbuch; Stuttgart, 1990
/32/ Reidick, H.: Primärmaßnahmen zur NOx-Minderung bei Neu- und Altanlagen als Voraussetzung für
optimale Sekundärmaßnahmen; in: Sammelband VGB-Konferenz "Kraftwerk und Umwelt 1985", p. 129-135
/33/ Reidick, H.: Erfahrungen mit primärer und sekundärer NOx-Minderung der Abgase von Dampferzeuger-
Feuerungen; in: EV-Register 45/86, S. 39 - 50
/34/ Rüsenberg, D.; Hein, K.; Hoppe, K.: Feuerungsseitige Maßnahmen zur Minderung der NOx-Emission; in:
VGB-Kraftwerkstechnik 67 (1987) 3, S. 275-279
/35/ van der Most, P.F.J.; Veldt, C.: Emission Factors Manual PARCOM-ATMOS, Emission factors for air pollutants 1992, Final version; TNO and Ministry of Housing, Physical Planning and the Environment, Air and Energy Directorate Ministry of Transport and Water Management; The Netherlands; Reference number 92 - 235; 1992
/36/ Jockel, W.; Hartje, J.: Die Entwicklung der Schwermetallemissionen in der Bundesrepublik Deutschland
von 1985 bis 1995; Forschungsbericht 94-104 03 524; TÜV Rheinland e. V. Köln; 1995
/37/ Stobbelaar, G.: Reduction of Atmospheric Emissions under the terms of the North Sea Action Programme, Report Lucht 102, Ministry of Housing, Physical Planning and Environment, The Netherlands, 1992
/38/ Bouchereau, J.M.: Estimation des Emissions Atmosphériques de Métaux Lourds en France pour le
Chrome, le Cuivre, le Nickel, le Plomb et le Zinc, CITEPA, France (1992)
/39/ Axenfeld, F.; Münch. J.; Pacyna, J.M.; Duiser, J.; Veldt, C.: Test-Emissionsdatenbasis der Spurenelemente As, Cd, Hg, Pb, Zn und der speziellen organischen Verbindungen Lindan, HCB, PCB und PAK für Modellrechnungen in Europa, Forschungsbericht 104 02 588, Dornier GmbH, NILU, TNO, 1992
/40/ Marx, E.: Reduzierung von Emissionen und Beseitigung von Rückständen unter Berücksichtigung
ernergetischer Nutzung; in: Die Industriefeuerung; 49 (1989); S. 75 - 87
/41/ CORINAIR 90 Emission Inventory (Proposals) - working paper for the 19 - 20 September 1991 meeting - Annex 4: Definition of Large Point Sources
/42/ Hernández, R.; Martínez, J.; Ortiz, A.: CORINAIR Relational schema and data dictionary 1st version;
AED; March 1992
COMBUSTION IN ENERGY & TRANSFORMATION INDUSTRIES ps010101 Activities 010101 - 010105
Emission Inventory Guidebook December, 2006 B111-73
/43/ Fontelle, J-P.: The Implementation of the Directive 88/609 on Large Combustion Plants - Proposal for the achievement of air emission inventories, CORINAIR (ed.); Nov. 1991
/44/ Fontelle, J-P.: The Implementation of the Directive 88/609 on Large Combustion Plants - LCP Directive
inventory reporting; CITEPA (ed.); June 1992
/45/ Necker, Peter; Lehmann, Bernhard: Kraftwerk Walheim, Block 2 - Demonstrationsanlage zur Reduzierung von NOx-Emissionen aus Schmelzkammerkesseln mit Ascherückführung; Neckarwerke
Elektrizitäts-versorgung AG; i. Zusammenarbeit mit Umweltbundesamt Berlin; Esslingen, 1992
/46/ VDI (ed.): Efficient Energy Supply with Combustion - Engine Plants; Part II; Aachen; 1993
/47/ Brandt, F: Brennstoffe und Verbrennungsrechnung, FDBR - Fachbuchreihe; Vol. 1; Essen; 1981
/48/ N.N.: Ruhrkohlenhandbuch; Verlag Glückauf GmbH, Essen, 1984, 6th Edition, p. 118
/49/ Wagner, W.: Thermische Apparate und Dampferzeuger - Planung und Berechnung; Vogel - Fachbuch Technik, Würzburg 1985
/50/ Schnell, U.: Berechnung der Stickoxidemissionen von Kohlenstaubfeuerungen; VDI Reihe 6:
Energieerzeugung Nr. 250, Düsseldorf 1991
/51/ Pohl, J.H.; Chen, S.L.; Heap, M.P.; Pershing, D.W.: Correlation of NOx Emissions with Basic Physical
and Chemical Characteristics of Coal; in: Joint Symposium on Stationary Combustion NOx Control,
Volume 2, Palo Alto 1982, S. (36-1) - (36-30).
/52/ Davis, W.T.; Fiedler, M.A.: The Retention of Sulfur in Fly Ash from Coal-Fired Boilers; in: Journal of the Air Pollution Control Association (JAPCA), 32 (1982), p. 395 - 397
/53/ Heer, W.: Zur Konfiguration von Emissionsminderungsmaßnahmen an Kohlekraftwerken, Dissertation
Universität Karlsruhe 1987
/54/ Zelkowski, J: Kohleverbrennung; Fachbuchreihe "Kraftwerkstechnik", Vol. 8, Essen 1986
/55/ Görner, K.: Technische Verbrennungssysteme - Grundlagen, Modellbildung, Simulation; Springer Verlag Berlin, Heidelberg, New York, 1991
/56/ Leuckel, W.; Römer, R.: Schadstoffe aus Verbrennungsprozessen; in: VDI Berichte Nr. 346, 1979, S. 323
- 347
/57/ Hansen, U.: Update and Temporal Resolution of Emissions from Power Plants; in: GENEMIS, Paper presented at the 3rd GENEMIS Workshop, Vienna 1993
/58/ CITEPA (ed.): CORINAIR Inventory - Default Emission Factor Handbook, Commission of the European
Community (ed.), second edition, January 1992
/59/ US-EPA (ed.): Compilation of Air Pollutant Emission Factor, Vol. 1; Stationary Point and Area Sources; 1985
/60/ Pacyna, Josef: Emission Inventorying for Heavy Metals in the ECE; Draft Paper for the Final Report of
the Task Force on Heavy Metals Emission; 1994
/61/ IPCC/OECD (ed.): Greenhouse Gas Inventory Workbook, IPCC Guidelines for National Greenhouse Gas Inventories, Volume 2; 1995
COMBUSTION IN ENERGY & TRANSFORMATION INDUSTRIES
Activities 010101 - 010105 ps010101
B111-74 December, 2006 Emission Inventory Guidebook
/62/ Ribeiro, Jacqueline: Techno-economic analysis of the SCR plant for NOx abatement; University of
Karlsruhe; Institute for Industrial Production; 1992 /63/ Umweltbundesamt, Germany (ed.): Umwelt- und Gesundheitskritierien für Quecksilber; UBA-Berichte
5/80; Berlin 1980 /64/ Personal communications with different power plant operators; answers to a questionnaire from March 8,
1994 /65/ Deutsche Verbundgesellschaft e. V. (ed.): Das versorgungsgerechte Verhalten der thermischen
Kraftwerke; Heidelberg; 1991 /66/ TNO report 88 - 355/R 22/ CAP included in /58/ /67/ Winiwater, D.; Schneider, M.: Abschätzung der Schwermetallemissionen in Österreich;
Umweltbundesamt Österreich, Wien; 1995 /68/ VDI (ed.): Gasturbineneinsatz in der Kraft-Wärme-Kopplung; Rationelle Energieversorgung mit
Verbrennungs-Kraftmaschinen-Anlagen; Teil V; Aachen; 1993 /69/ Veaux, C.; Rentz, O.: Entwicklung von Gasturbinen und Gasturbinenprozessen; Institut für
Industriebetriebslehre und Industrielle Produktion; Karlsruhe; 1994 (unpublished) /70/ VDI (ed.): Co-generation Technology-Efficient Energy Supply with Combustion Engine Plants; Part II;
Aachen; 1993 /71/ VGB (ed.): Hinweise zur Ausfertigung der Emissionserklärung für Anlagen aus dem Bereich der Kraft-
und Energiewirtschaft gemäß 11. Verordnung zur Durchführung des Bundesimmissionsschutzgesetzes vom 12.12.1991 (Stand März 1993); Essen; 1993
/72/ Association of German Coal Importers / Verein Deutscher Kohleimporteure e.V.: Datenbank
Kohleanalysen; Stand 27. Januar 1992; Hamburg (Germany) /73/ ASTM-ISO 3180-74: Standard Method for Calculating Coal and Coke Analyses from as-determined to
different Bases /74/ N. N.: Update and Temporal Resolution of Emissions from Power Plants in GENEMIS; Paper published
at the 3rd Genemis-Workshop in Vienna; 1983 /75/ Bartok, W. et. al.: Stationary sources und control of nitrogen oxide emissions; Proc. second International
Clean Air Congress; Washington; 1970; p. 801 - 818. /76/ N. N.: Update and Temporal Resolution of Emissions from Power Plants, in: GENEMIS; Paper from the
3rd Workshop; Vienna; 1993 /77/ Bundesministerium für Umwelt, Naturschutz und Reaktorsicherheit (ed.): Umwelt-politik - Klimaschutz
in Deutschland, Erster Bericht der Regierung der Bundesrepublik Deutschland nach dem Rahmen-übereinkommen der Vereinten Nationen über Klimaänderungen; 1994
The Federal Ministry for the Environment, Nature Conservation and Nuclear Safety (ed.): Environmental Policy - Climate Protection in Germany - First Report of the Federal Government of the Federal Republic of Germany according to the United Nations Framework Convention of Climate Change, 1994
/78/ Boelitz, J.; Esser-Schmittmann, W.; Kreusing, H.: Braunkohlenkoks zur Abgasreinigung; in: Entsorger-
Praxis (1993)11; S. 819 - 821 /79/ Breton, D.; Eberhard, R.: Handbuch der Gasverwendungstechnik, Oldenburg 1987
COMBUSTION IN ENERGY & TRANSFORMATION INDUSTRIES ps010101 Activities 010101 - 010105
Emission Inventory Guidebook December, 2006 B111-75
/80/ CITEPA: CORINAIR Inventory-Default Emission Factors Handbook (second edition); CEC-DG XI
(ed.); 1992 /81/ Davids, P.; Rouge M.: Die Großfeuerungsanlagenverordnung. Technischer Kommentar; VDI, Düsseldorf
1984 /82/ Davids, Peter; Rouge, Michael: Die TA Luft ´86, Technischer Kommentar; Düsseldorf; 1986 /83/ DeSoete, G.: Nitrous Oxide from Combustion and Industry: Chemistry, Emissions and Control; Working
Group Report: Methane Emissions from Biomass Burning; in: van Amstel, A.R. (ed.): Proceedings of an International IPCC Workshop on Methane and Nitrous Oxide: Methods in National Emission Inventories and Options for Control. RIVM Report no. 481507003; Bilthoven (The Netherlands); p. 324 - 325
/84/ Environment Agency: Air polluters unveiled by Tokio Government, Japan; Environment Summary 1973-
1982, Vol. 1, (1973); p. 18/19 /85/ US-EPA (ed.): Criteria Pollutant Emission Factors for the NAPAP Emission Inventory; EPA/600/7-
87/015; 1987 /86/ Gerold, F. et. al.: Emissionsfaktoren für Luftverunreinigungen; Materialien 2/80; Berlin; 1980 /87/ IPCC/OECD (ed.): Joint Work Programme on National Inventories of Greenhouse Gas Emissions:
National GHG-Inventories (ed.): Transparency in estimation and reporting; Parts I and II; Final report of the workshop held 1 October 1992 in Bracknell (U.K.); published in Paris; 1993
/88/ IPCC/OECD (ed.): Greenhouse Gas Inventory Reference Manual; IPCC Guidelines for National
Greenhouse Gas Inventories, Volume 3; 1995 /89/ Kamm, Klaus; Bauer, Frank; Matt, Andreas: CO-Emissionskataster 1990 für den Stadtkreis Karlsruhe; in:
WLB - Wasser, Luft und Boden (1993)10; p. 58 ff. /90/ Kremer, H.: NOx-Emissionen aus Feuerungsanlagen und aus anderen Quellen; in: Kraftwerk und Umwelt
1979; Essen; 1979; p. 163 - 170 /91/ Lim, K.J. et. al.: A promising NOx-control-technology; Environmental Progress, Vol. 1; Nr.3; 1982; p.
167 - 177 /92/ Landesanstalt für Immissionsschutz des Landes NRW (ed.): Emissionsfaktoren für Feuerungsanlagen für
feste Brennstoffe; in: Gesundheits-Ingenieur 98(1987)3; S. 58 - 68 /93/ Landesanstalt für Immissionsschutz des Landes NRW (ed.): Erstellung eines Emissionskatasters und einer
Emissionsprognose für Feuerungsanlagen im Sektor Haushalte und Kleinverbraucher des Belastungsgebietes Ruhrgebiet Ost; LIS Bericht Nr. 73; 1987
/94/ Marutzky, R: Emissionsminderung bei Feuerungsanlagen für Festbrennstoffe; in: Das Schornsteinfeger-
handwerk (1989)3, S. 7 - 15 /95/ Ministerium für Arbeit, Gesundheit und Soziales des Landes NRW (ed.): Luftreinhalteplan Ruhrgebiet
Ost 1979-1983; Luftreinhalteplan Ruhrgebiet Mitte 1980-1984; Düsseldorf; 1978 bzw. 1980 /96/ Mobley, J.D.; Jones G.D.: Review of U.S. NOx abatement technology; Proceedings: NOx-Symposium
Karlsruhe 1985 B1/B 74 /97/ MWV: Jahreszahlen 1992, Hamburg 1992
COMBUSTION IN ENERGY & TRANSFORMATION INDUSTRIES
Activities 010101 - 010105 ps010101
B111-76 December, 2006 Emission Inventory Guidebook
/98/ N.N.: Untersuchung zur Emissionsbegrenzung bei bestimmten Anlagenarten; in: Umweltschutz in Niedersachsen - Reinhaltung der Luft, Heft 8; S. 145 - 169
/99/ Ministry of Housing, Physical Planning and Environment (ed.): Handbook of Emission Factors,
Stationary Combustion Sources, Part 3; The Netherlands, The Hague; 1988 /100/ OECD Environment Directorate (ed.): Greenhouse Gas Emissions and Emission Factors; 1989 /101/ van der Most, P. F J.; Veldt, L.: Emission Factors Manual Parcom-Atmos, Emission factors for air
pollutants 1992; Final version; TNO; The Netherlands; Reference number 92 - 235, 1992 /102/ Radian Corporation (ed.): Emissions and Cost Estimates for Globally Significant Anthropogenic
Combustion Sources of NOx, N2O, CH4, CO and CO2; Prepared for the Office of Research and
Development; U.S. Environmental Protection Agency; Washington D.C.; 1990 /103/ Ratajczak, E.-A.; Akland, E.: Emissionen von Stickoxiden aus kohlegefeuerten Hausbrandfeuerstätten; in:
Staub, Reinhaltung Luft; 47(1987)1/2, p. 7 - 13 /104/ Riediger, Bruno: Die Verarbeitung des Erdöls, Springer-Verlag 1971, p. 31 /105/ Schenkel, W.; Barniske, L.; Pautz, D.; Glotzel, W.-D.: Müll als CO-neutrale Energieresource; in:
Kraftwerkstechnik 2000 - Resourcen-Schonung und CO-Minderung; VGB-Tagung 21./22.2.1990; p. 108 /106/ Skuschka, M; Straub, D.; Baumbach, C.: Schadstoffemissionen aus Kleinfeuerungen; Institut für
Verfahrenstechnik und Dampfkesselwesen; Abt. für Reinhaltung der Luft; Stuttgart; 1988 /107/ Steinmüller-Taschenbuch -Dampferzeugertechnik, Essen 1984 /108/ Stromthemen, 6(1989)6, p. 7 /109/ Tornier, W.: Derzeit erreichbare Emissionswerte von Kesselanlagen und ihre Minderung durch
Primärmaßnahmen; VDI-GET-VK-Tagung: Kessel- und Prozeßwärmeanlagen; Essen; 1985 /110/ Umweltbundesamt (ed.): Luftreinhaltung 1981; Berlin; 1981 /111/ Umweltbundesamt (ed.): Jahresbericht 1985; Berlin; 1986 /112/ VGB Technische Vereinigung der Großkraftwerksbetreiber e.V. (ed.): VGB- Handbücher VGB-B301:
NOx-Bildung und NOx-Minderung bei Dampferzeugern für fossile Brennstoffe; Essen; 1986
/113/ CEE (ed.): Directive du Conseil du 30 mars 1987 modifiant la directive 75/716/CEE relative au
rapprochement des législations des Ètats membres concernant la teneur en soufre de certains combustibles liquides, 87/219/CEE
/114/ Meijer, Jeroen: Personal communication, IEA (International Energy Agency), Fax of April 24, 1995. /115/ US-EPA (ed.): AP 42 - CD rom, 1994 /116/ Personal communication with power plant operators in Germany, 1995 /117/ Verein Deutscher Elektrizitätswerke (VDEW) (ed.): Jahresstatistik 1991; Frankfurt; 1992 /118/ Kugeler, F.; Philippen, P.: Energietechnik; 1990
COMBUSTION IN ENERGY & TRANSFORMATION INDUSTRIES ps010101 Activities 010101 - 010105
Emission Inventory Guidebook December, 2006 B111-77
18 BIBLIOGRAPHY
Additional literature, which is related to combustion: Strauß sen., K.: NOx-Bildung und NOx-Minderung bei Dampferzeugern für fossile Brennstoffe, VGB - B
301, Part B 5.1; Essen; 1986 Zelkowski, J.: NOx-Bildung bei der Kohleverbrennung und NOx-Emissionen aus Schmelzfeuerungen, in:
VGB Kraftwerkstechnik 66 (1986) 8, S. 733 - 738 Rennert, K. D.: Mögliche Seiten der Stickstoffreduzierung in Feuerräumen; Sonderdruck aus Fachreport
Rauchgasreinigung 2/86, S. FR 13 - 17 Schreiner, W.: Rennert, K. D.: Emissionsverhalten von Brennern mit Luftstufung in Groß- und
Versuchsanlagen, in: BWK Bd. 40 (1988) 5, Mai 1988 Visser, B.M.; Bakelmann, F.C.: NOx-Abatement in Gas Turbine Installations; in: Erdöl und Kohle-Erdgas-
Petrochemie vereinigt mit Brennstoff-Chemie, 46 (1993) 9, S. 333 - 335 Alaghon, H.; Becker, B.: Schadstoffarme Verbrennung von Kohlegas in GuD-Anlagen; in: VGB
Kraftwerkstechnik, 64 (1984) 11, S. 999 - 1064 Arbeitsgruppe Luftreinhaltung der Universität Stuttgart (ed.): Verbrennungsmotoren und Feuerungen-
Emissionsminderung; in: Jahresbericht der Arbeitsgruppe Luftreinhaltung; Stuttgart 1988 Scherer, R.: Konzept zur Rauchgasreinigung bei schwerölbetriebenen Motorheizkraftwerken; in: BWK 45
(1993) 11, S. 473 - 476 N.N.: NOx-Emissions by Stationary Internal Combustion Engines; in: Erdöl und Kohle-Erdgas-
Petrochemie vereinigt mit Brennstoff-Chemie, 40 (1987) 9, p. 375 - 376 Kehlhofer, R.; Kunze, N.; Lehmann, J.; Schüller, K.-H.: Gasturbinenkraftwerke, Kombikraftwerke,
Heizkraftwerke und Industriekraftwerke; Köln 1984, 1992
19 RELEASE VERSION, DATE AND SOURCE
Version: 3.1 Date: November 1995 Source: Otto Rentz; Dagmar Oertel University of Karlsruhe (TH) Germany Updated with particulate matter details by:
Mike Woodfield AEA Technology UK December 2006
COMBUSTION IN ENERGY & TRANSFORMATION INDUSTRIES
Activities 010101 - 010105 ps010101
B111-78 December, 2006 Emission Inventory Guidebook
20 POINT OF ENQUIRY
Any comments on this chapter or enquiries should be directed to:
Ute Karl
French-German Institute for Environmental Research University of Karlsruhe Hertzstr 16 D-76187 Karlsruhe Germany Tel: +49 721 608 4590 Fax: +49 721 75 89 09 Email: [email protected]
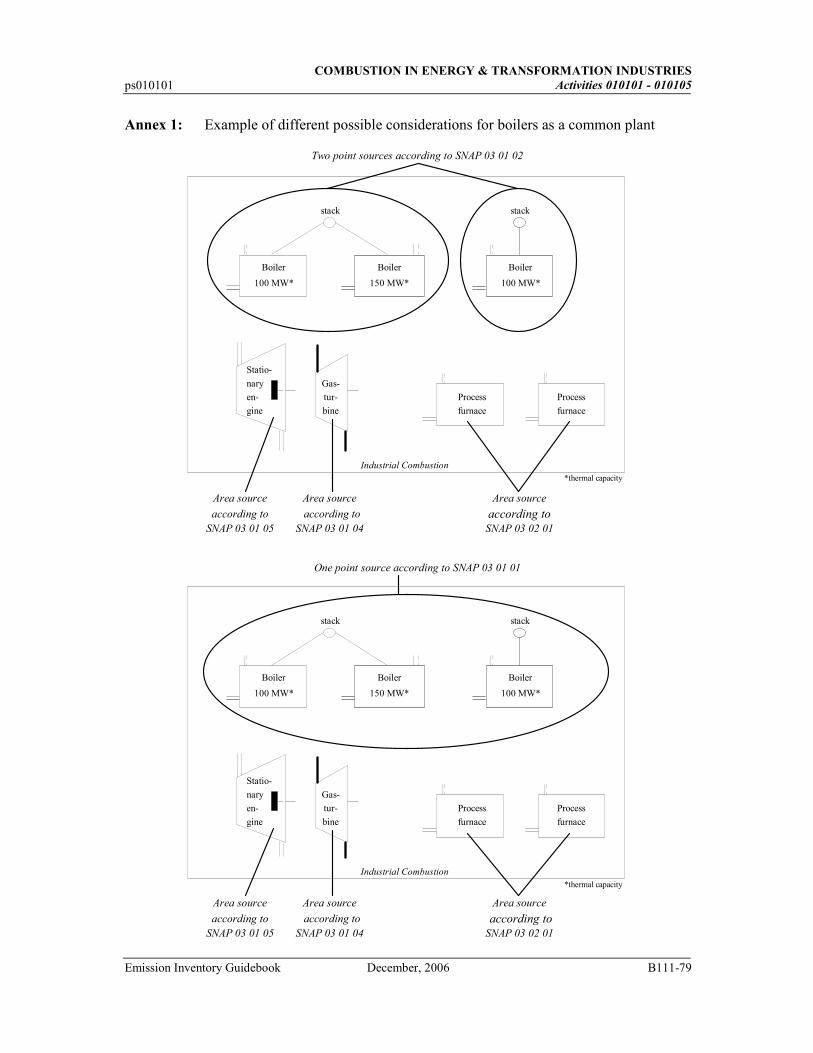
COMBUSTION IN ENERGY & TRANSFORMATION INDUSTRIES
ps010101 Activities 010101 - 010105
Emission Inventory Guidebook December, 2006 B111-79
Annex 1: Example of different possible considerations for boilers as a common plant
Two point sources according to SNAP 03 01 02
stack stack
Boiler Boiler Boiler
100 MW* 150 MW* 100 MW*
Statio-
nary Gas-
en- tur- Process Process
gine bine furnace furnace
Industrial Combustion
*thermal capacity
Area source Area source Area source
according to according to according to
SNAP 03 01 05 SNAP 03 01 04 SNAP 03 02 01
One point source according to SNAP 03 01 01
stack stack
Boiler Boiler Boiler
100 MW* 150 MW* 100 MW*
Statio-
nary Gas-
en- tur- Process Process
gine bine furnace furnace
Industrial Combustion
*thermal capacity
Area source Area source Area source
according to according to according to
SNAP 03 01 05 SNAP 03 01 04 SNAP 03 02 01
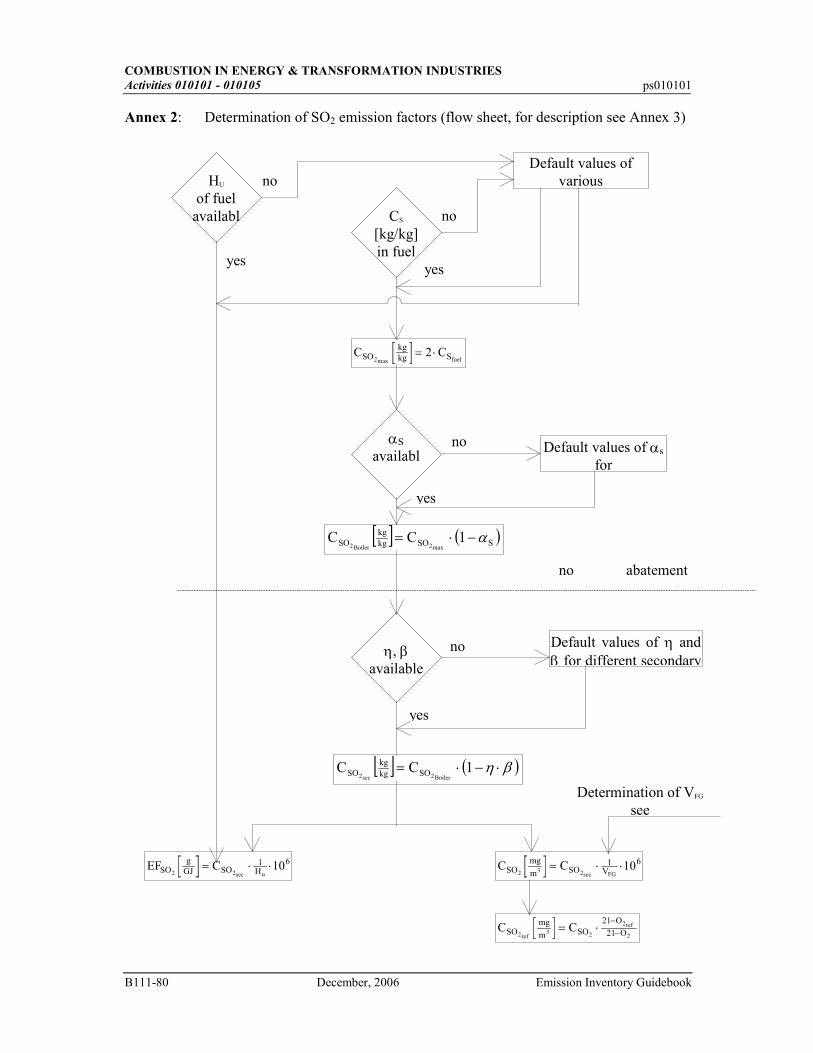
COMBUSTION IN ENERGY & TRANSFORMATION INDUSTRIES Activities 010101 - 010105 ps010101
B111-80 December, 2006 Emission Inventory Guidebook
Annex 2: Determination of SO2 emission factors (flow sheet, for description see Annex 3)
Default values of various
CS [kg/kg] in fuel
HU of fuel availabl
C 2 CSOkgkg S2max fuel
= ⋅
Default values of αs for
αS availabl
e
[ ] ( )SSOkgkg
SO 1CCmax2Boiler2
α−⋅=
η, β available
Default values of η and β for different secondary
[ ] ( )βη ⋅−⋅= 1CCBoiler2sec2 SOkg
kgSO
EF C 10SOg
GJ SO1
H6
2 2sec u= ⋅ ⋅ C C 10SO
mg
m SO1
V6
2 3 2sec FG= ⋅ ⋅
C CSOmg
m SO21 O
21 O2ref3 2
2ref
2= ⋅
−−
yes
no
no
yes
no
yes
no
yes
Determination of VFG see
no abatement measures
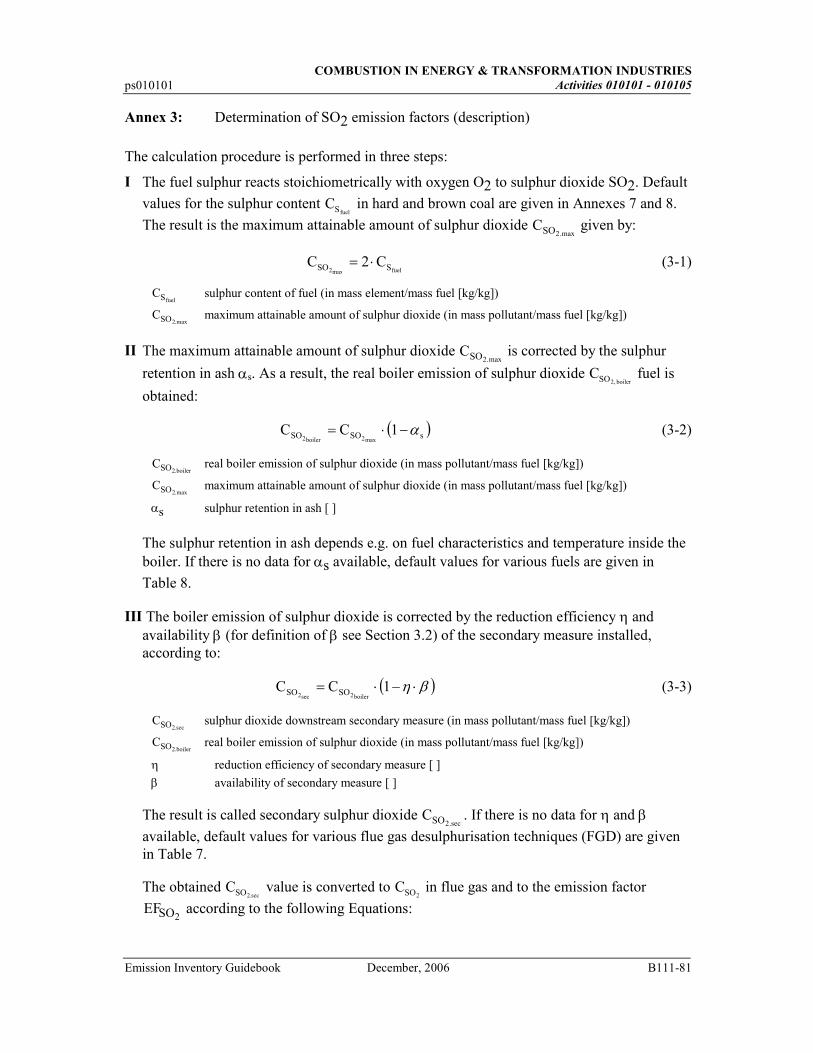
COMBUSTION IN ENERGY & TRANSFORMATION INDUSTRIES
ps010101 Activities 010101 - 010105
Emission Inventory Guidebook December, 2006 B111-81
Annex 3: Determination of SO2 emission factors (description)
The calculation procedure is performed in three steps:
I The fuel sulphur reacts stoichiometrically with oxygen O2 to sulphur dioxide SO2. Default
values for the sulphur content CSfuel in hard and brown coal are given in Annexes 7 and 8.
The result is the maximum attainable amount of sulphur dioxide CSO2.max given by:
C 2 CSO S2max fuel= ⋅ (3-1)
CSfuel sulphur content of fuel (in mass element/mass fuel [kg/kg])
CSO2.max maximum attainable amount of sulphur dioxide (in mass pollutant/mass fuel [kg/kg])
II The maximum attainable amount of sulphur dioxide CSO2.max is corrected by the sulphur
retention in ash αs. As a result, the real boiler emission of sulphur dioxide CSO boiler2, fuel is
obtained:
( )sSOSO 1CCmax2boiler2
α−⋅= (3-2)
CSO boiler2. real boiler emission of sulphur dioxide (in mass pollutant/mass fuel [kg/kg])
CSO2.max maximum attainable amount of sulphur dioxide (in mass pollutant/mass fuel [kg/kg])
αs sulphur retention in ash [ ]
The sulphur retention in ash depends e.g. on fuel characteristics and temperature inside the boiler. If there is no data for αs available, default values for various fuels are given in
Table 8.
III The boiler emission of sulphur dioxide is corrected by the reduction efficiency η and availability β (for definition of β see Section 3.2) of the secondary measure installed, according to:
( )βη ⋅−⋅= 1CCboiler2sec2 SOSO (3-3)
CSO2.sec sulphur dioxide downstream secondary measure (in mass pollutant/mass fuel [kg/kg])
CSO boiler2. real boiler emission of sulphur dioxide (in mass pollutant/mass fuel [kg/kg])
η reduction efficiency of secondary measure [ ]
β availability of secondary measure [ ]
The result is called secondary sulphur dioxide CSO2.sec. If there is no data for η and β
available, default values for various flue gas desulphurisation techniques (FGD) are given in Table 7.
The obtained CSO2.sec value is converted to CSO2
in flue gas and to the emission factor
EFSO2 according to the following Equations:
COMBUSTION IN ENERGY & TRANSFORMATION INDUSTRIES Activities 010101 - 010105 ps010101
B111-82 December, 2006 Emission Inventory Guidebook
C C 10SO SO6
2 2.sec= ⋅ ⋅
1
VFG
(3-4)
EF C 10SO SO6
2 2.sec= ⋅ ⋅
1
Hu
(3-5)
CSO2 sulphur dioxide in flue gas (in mass pollutant/volume flue gas [mg/m3])
CSO2.sec sulphur dioxide downstream of secondary measure (in mass pollutant/mass fuel [kg/kg])
VFG dry flue gas volume volume (in volume flue gas/mass fuel [m3/kg])
EFSO2 emission factor for sulphur dioxide [g/GJ]
Hu lower heating value [MJ/kg]
The dry flue gas volume VFG can be determined according to Annex 6. Emission data in
[mg/m3] are useful to compare measured and calculated values. The same equations are used for the unit conversion of CSO2.boiler
. Default values for the lower heating values of hard
and brown coal are given in Annexes 7 and 8.
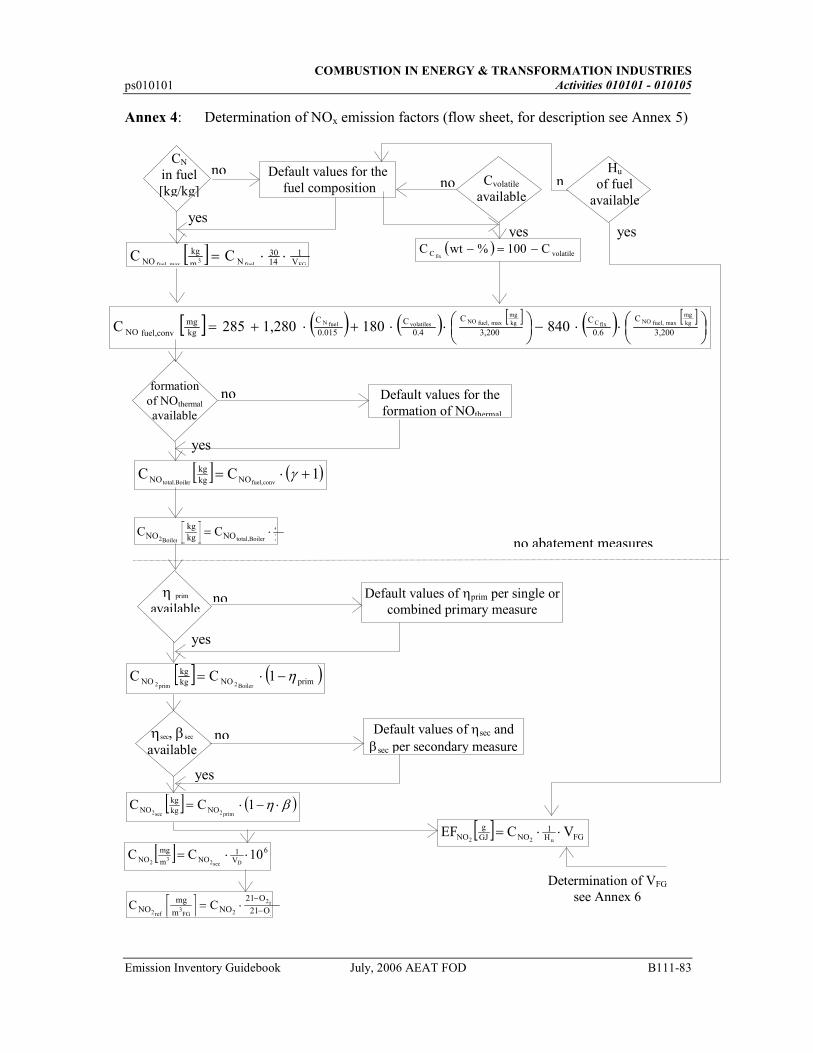
COMBUSTION IN ENERGY & TRANSFORMATION INDUSTRIES
ps010101 Activities 010101 - 010105
Emission Inventory Guidebook July, 2006 AEAT FOD B111-83
Annex 4: Determination of NOx emission factors (flow sheet, for description see Annex 5)
[ ] 6V1
NOm
mgNO 10CC
Dsec23
2⋅⋅=
C CNOmg
m NO21 O
21 O2ref3FG 2
2ref
2= ⋅
−−
[ ] FGH1
NOGJg
NO VCEFu22⋅⋅=
CN in fuel [kg/kg]
Default values for the fuel composition
[ ]FGfuel
3maxfuel, V
11430
Nm
kgNO CC ⋅⋅=
[ ] ( ) ( ) [ ] ( ) [ ]
⋅⋅−
⋅⋅+⋅+= 3,200
C
0.6
C
3,200
C
0.4C
0.015
C
kgmg
fuel,convNOkgmg
maxfuel,NOfixCkgmg
maxfuel,NOvolatilesfuelN 8401801,280285C
formation of NOthermal available
[ ] ( )1CCconvfuel,ertotal.Boil NOkg
kgNO +⋅= γ
C CNOkgkg NO
46302Boiler total,Boiler
= ⋅
η prim available
[ ] ( )primNOkgkg
NO 1CCBoiler2prim2
η−⋅=
Default values for the formation of NOthermal
Default values of ηprim per single or combined primary measure
( ) volatileC C100%wtCfix
−=−
Cvolatile available
Hu of fuel
available
ηsec, βsec available
Default values of ηsec and βsec per secondary measure
[ ] ( )βη ⋅−⋅= 1CCprim2sec2 NOkg
kgNO
no abatement measures
Determination of VFG see Annex 6
no no n
no
no
no
yes
yes
yes yes yes
yes
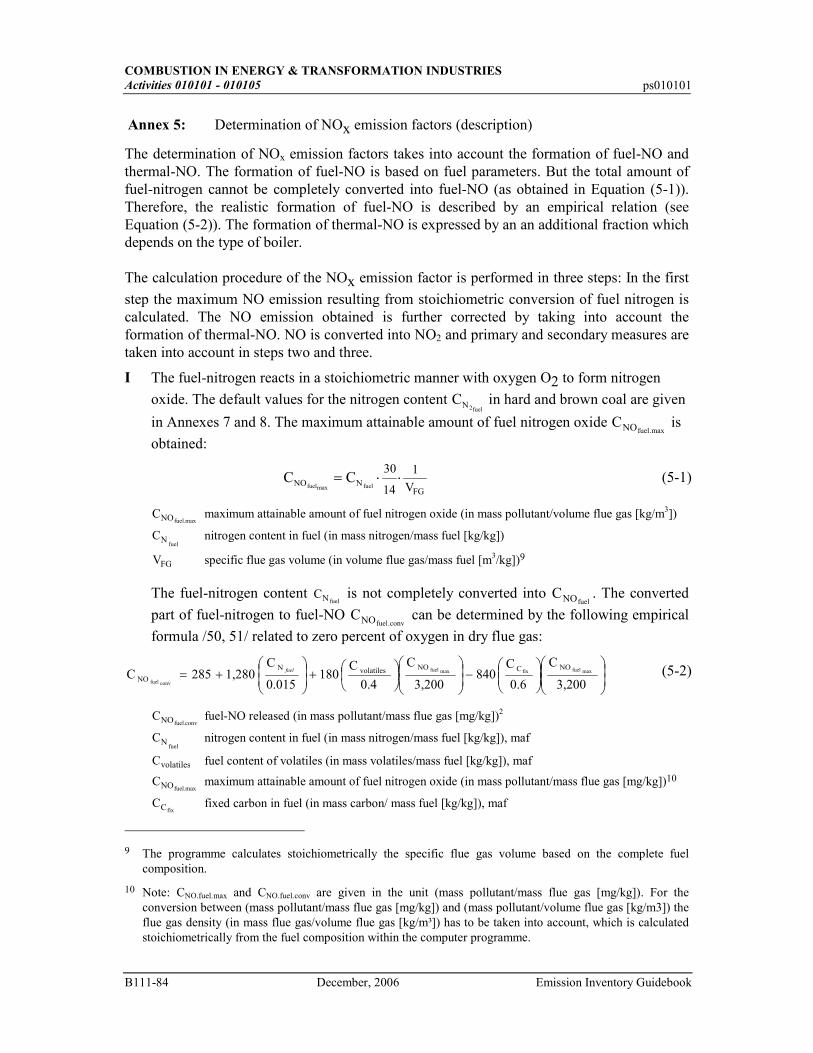
COMBUSTION IN ENERGY & TRANSFORMATION INDUSTRIES Activities 010101 - 010105 ps010101
B111-84 December, 2006 Emission Inventory Guidebook
Annex 5: Determination of NOx emission factors (description)
The determination of NOx emission factors takes into account the formation of fuel-NO and thermal-NO. The formation of fuel-NO is based on fuel parameters. But the total amount of fuel-nitrogen cannot be completely converted into fuel-NO (as obtained in Equation (5-1)). Therefore, the realistic formation of fuel-NO is described by an empirical relation (see Equation (5-2)). The formation of thermal-NO is expressed by an an additional fraction which depends on the type of boiler. The calculation procedure of the NOx emission factor is performed in three steps: In the first
step the maximum NO emission resulting from stoichiometric conversion of fuel nitrogen is calculated. The NO emission obtained is further corrected by taking into account the formation of thermal-NO. NO is converted into NO2 and primary and secondary measures are taken into account in steps two and three.
I The fuel-nitrogen reacts in a stoichiometric manner with oxygen O2 to form nitrogen
oxide. The default values for the nitrogen content CN2fuel in hard and brown coal are given
in Annexes 7 and 8. The maximum attainable amount of fuel nitrogen oxide CNOfuel.max is
obtained:
C CNO Nfuelmax fuel
30
14= ⋅ ⋅
1
VFG
(5-1)
CNOfuel.max maximum attainable amount of fuel nitrogen oxide (in mass pollutant/volume flue gas [kg/m3])
CNfuel
nitrogen content in fuel (in mass nitrogen/mass fuel [kg/kg])
VFG specific flue gas volume (in volume flue gas/mass fuel [m3/kg])9
The fuel-nitrogen content CN fuel is not completely converted into CNOfuel
. The converted
part of fuel-nitrogen to fuel-NO CNOfuel conv. can be determined by the following empirical
formula /50, 51/ related to zero percent of oxygen in dry flue gas:
−
+
+=
3,200
C
0.6
C840
3,200
C
0.4
C180
0.015
C1,280285C maxfuelfixmaxfuel
convfuel
NOCNOvolatilesN
NOfuel (5-2)
CNOfuel conv. fuel-NO released (in mass pollutant/mass flue gas [mg/kg])2
CNfuel
nitrogen content in fuel (in mass nitrogen/mass fuel [kg/kg]), maf
Cvolatiles fuel content of volatiles (in mass volatiles/mass fuel [kg/kg]), maf
CNOfuel.max maximum attainable amount of fuel nitrogen oxide (in mass pollutant/mass flue gas [mg/kg])10
CCfix fixed carbon in fuel (in mass carbon/ mass fuel [kg/kg]), maf
9 The programme calculates stoichiometrically the specific flue gas volume based on the complete fuel
composition.
10 Note: CNO.fuel.max and CNO.fuel.conv are given in the unit (mass pollutant/mass flue gas [mg/kg]). For the conversion between (mass pollutant/mass flue gas [mg/kg]) and (mass pollutant/volume flue gas [kg/m3]) the flue gas density (in mass flue gas/volume flue gas [kg/m³]) has to be taken into account, which is calculated stoichiometrically from the fuel composition within the computer programme.
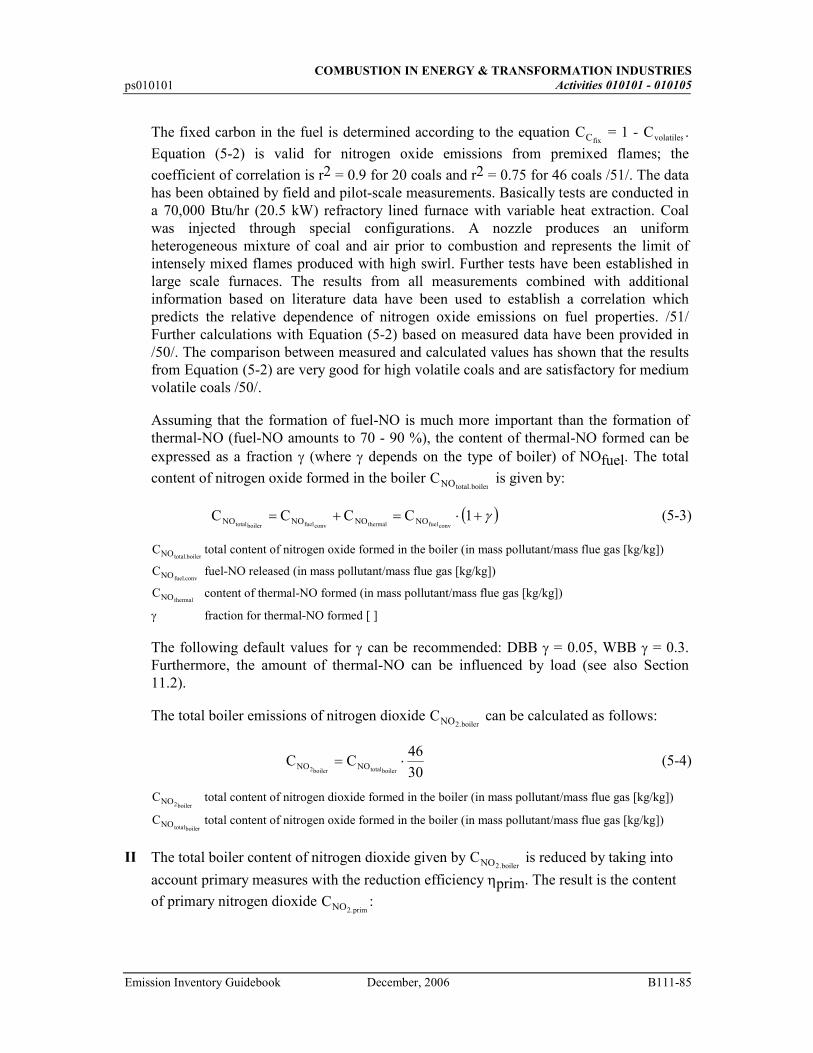
COMBUSTION IN ENERGY & TRANSFORMATION INDUSTRIES
ps010101 Activities 010101 - 010105
Emission Inventory Guidebook December, 2006 B111-85
The fixed carbon in the fuel is determined according to the equation CCfix = 1 - Cvolatiles .
Equation (5-2) is valid for nitrogen oxide emissions from premixed flames; the
coefficient of correlation is r2 = 0.9 for 20 coals and r2 = 0.75 for 46 coals /51/. The data has been obtained by field and pilot-scale measurements. Basically tests are conducted in a 70,000 Btu/hr (20.5 kW) refractory lined furnace with variable heat extraction. Coal was injected through special configurations. A nozzle produces an uniform heterogeneous mixture of coal and air prior to combustion and represents the limit of intensely mixed flames produced with high swirl. Further tests have been established in large scale furnaces. The results from all measurements combined with additional information based on literature data have been used to establish a correlation which predicts the relative dependence of nitrogen oxide emissions on fuel properties. /51/ Further calculations with Equation (5-2) based on measured data have been provided in /50/. The comparison between measured and calculated values has shown that the results from Equation (5-2) are very good for high volatile coals and are satisfactory for medium volatile coals /50/.
Assuming that the formation of fuel-NO is much more important than the formation of thermal-NO (fuel-NO amounts to 70 - 90 %), the content of thermal-NO formed can be expressed as a fraction γ (where γ depends on the type of boiler) of NOfuel. The total
content of nitrogen oxide formed in the boiler CNOtotal boiler. is given by:
( )γ+⋅=+= 1CCCCconvfuelthermalconvfuelboilertotal NONONONO (5-3)
CNO total boiler. total content of nitrogen oxide formed in the boiler (in mass pollutant/mass flue gas [kg/kg])
CNOfuel conv. fuel-NO released (in mass pollutant/mass flue gas [kg/kg])
CNO thermal content of thermal-NO formed (in mass pollutant/mass flue gas [kg/kg])
γ fraction for thermal-NO formed [ ]
The following default values for γ can be recommended: DBB γ = 0.05, WBB γ = 0.3. Furthermore, the amount of thermal-NO can be influenced by load (see also Section 11.2).
The total boiler emissions of nitrogen dioxide CNO boiler2. can be calculated as follows:
C C46
30NO NO2boiler totalboiler= ⋅ (5-4)
CNOboiler2
total content of nitrogen dioxide formed in the boiler (in mass pollutant/mass flue gas [kg/kg])
CNO totalboiler total content of nitrogen oxide formed in the boiler (in mass pollutant/mass flue gas [kg/kg])
II The total boiler content of nitrogen dioxide given by CNO boiler2. is reduced by taking into
account primary measures with the reduction efficiency ηprim. The result is the content
of primary nitrogen dioxide CNO prim2.:

COMBUSTION IN ENERGY & TRANSFORMATION INDUSTRIES Activities 010101 - 010105 ps010101
B111-86 December, 2006 Emission Inventory Guidebook
( )primNONO 1CCboiler2prim2
η−⋅= (5-5)
CNO prim2. content of primary nitrogen dioxide (in mass pollutant/mass flue gas [kg/kg])
CNOboiler2
total content of nitrogen dioxide formed in the boiler (in mass pollutant/mass flue gas [kg/kg])
ηprim reduction efficiency of primary measure(s) [ ]
As there is only incomplete data available for reduction efficiencies, default values are given for the individual and relevant combinations of primary measures for different types of boilers and fuels (see Table 8). In the case of combined primary measures with known individual reduction efficiencies ηprim,1, ηprim,2, etc., the following equation
can be used:
( ) ( ) ( )prim3prim2prim1NONO 111CCboiler2prim2
ηηη −⋅−⋅−⋅= (5-6)
CNO prim2. content of nitrogen dioxide taking into account primary measures (in mass pollutant/mass flue gas
[kg/kg])
CNOboiler2
total content of nitrogen dioxide formed in the boiler (in mass pollutant/mass flue gas [kg/kg])
ηprimk individual reduction efficiency of primary measure k [ ]
It should be taken into account, that the reduction efficiencies of primary measures are not independent of each other.
III The emission of primary nitrogen dioxide CNO prim2. is corrected by the reduction
efficiency ηsec [ ] and the availability βsec [ ] (for definition of β see Section 3.2) of the
secondary measure installed, according to:
( )secsecNONO 1CC2.primsec2
βη ⋅−⋅= (5-7)
CNO2.sec nitrogen dioxide downstream of secondary measure (in mass pollutant/mass flue gas [kg/kg])
CNO prim2. content of nitrogen dioxide taking into account primary measures (in mass pollutant/mass flue gas
[kg/kg])
ηsec reduction efficiency of secondary measure [ ]
βsec availability of secondary measure [ ]
If there is no data for ηsec and βsec available, default values for various DeNOx
techniques are given in Table 9.
The obtained value of CNO2.sec is converted into CNO2
and into the emission factor EFNO2
according to the following equations:
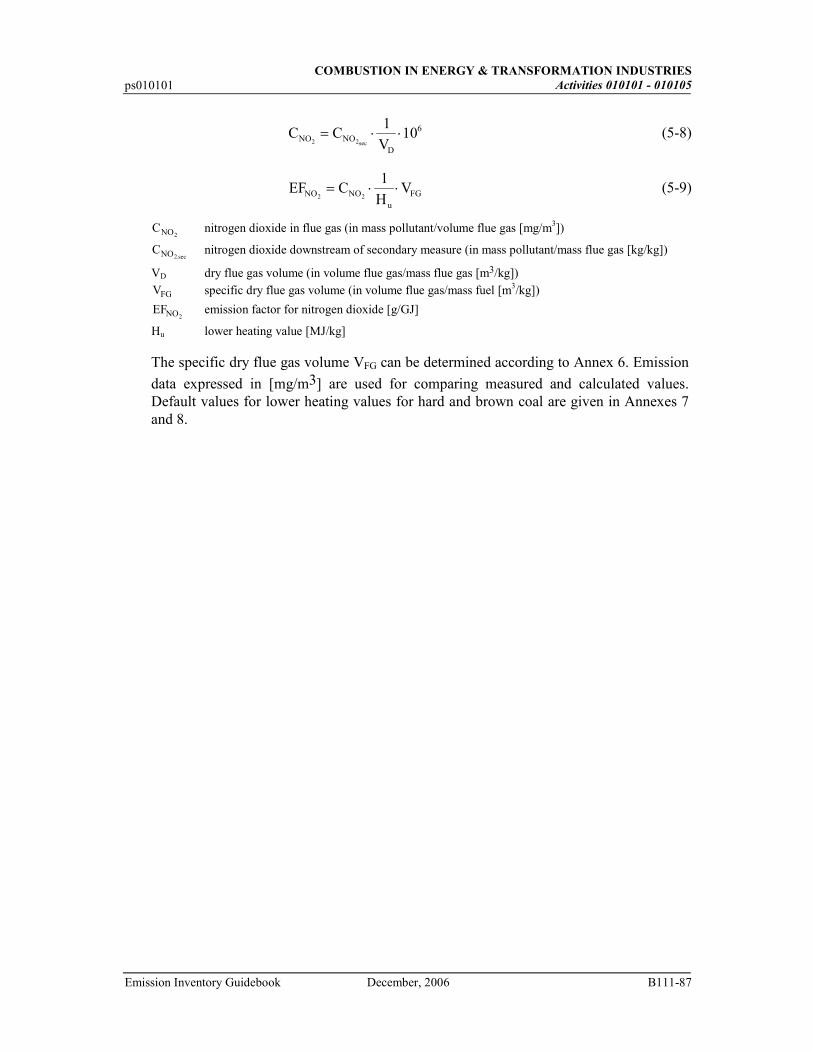
COMBUSTION IN ENERGY & TRANSFORMATION INDUSTRIES
ps010101 Activities 010101 - 010105
Emission Inventory Guidebook December, 2006 B111-87
C C1
V10NO NO
D
6
2 2sec= ⋅ ⋅ (5-8)
EF C1
HNO NOu
2 2= ⋅ ⋅VFG (5-9)
CNO2 nitrogen dioxide in flue gas (in mass pollutant/volume flue gas [mg/m3])
CNO2.sec nitrogen dioxide downstream of secondary measure (in mass pollutant/mass flue gas [kg/kg])
VD dry flue gas volume (in volume flue gas/mass flue gas [m3/kg])
VFG specific dry flue gas volume (in volume flue gas/mass fuel [m3/kg])
EFNO2 emission factor for nitrogen dioxide [g/GJ]
Hu lower heating value [MJ/kg]
The specific dry flue gas volume VFG can be determined according to Annex 6. Emission
data expressed in [mg/m3] are used for comparing measured and calculated values. Default values for lower heating values for hard and brown coal are given in Annexes 7 and 8.
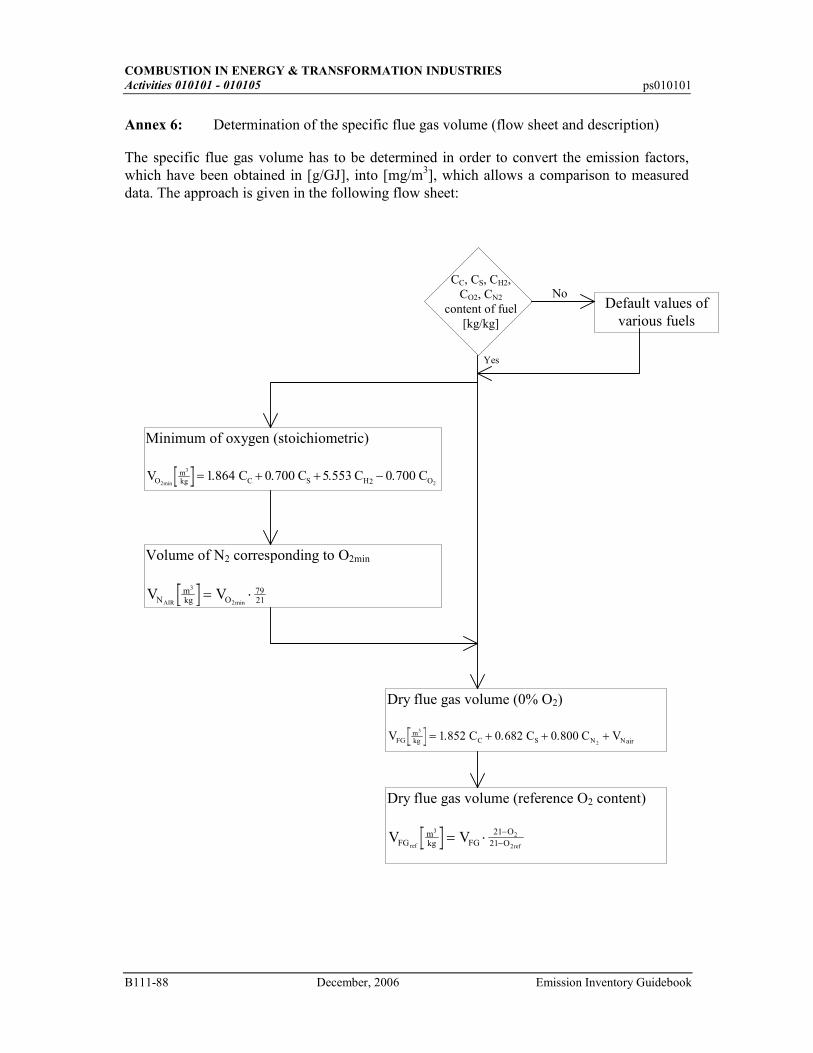
COMBUSTION IN ENERGY & TRANSFORMATION INDUSTRIES Activities 010101 - 010105 ps010101
B111-88 December, 2006 Emission Inventory Guidebook
Annex 6: Determination of the specific flue gas volume (flow sheet and description)
The specific flue gas volume has to be determined in order to convert the emission factors, which have been obtained in [g/GJ], into [mg/m3], which allows a comparison to measured data. The approach is given in the following flow sheet:
CC, CS, CH2, CO2, CN2
content of fuel [kg/kg]
Default values of various fuels
No
Minimum of oxygen (stoichiometric) V 1.864 C 0.700 C 5.553 C 0.700 CO
mkg C S H O2min
3
2= + + −2
Volume of N2 corresponding to O2min
V VNmkg O
7921AIR
3
2min= ⋅
Dry flue gas volume (0% O2) V 1.852 C 0.682 C 0.800 C VFG
mkg C S N N
3
2= + + + air
Dry flue gas volume (reference O2 content)
V VFGmkg FG
21 O21 Oref
32
2ref= ⋅ −
−
Yes
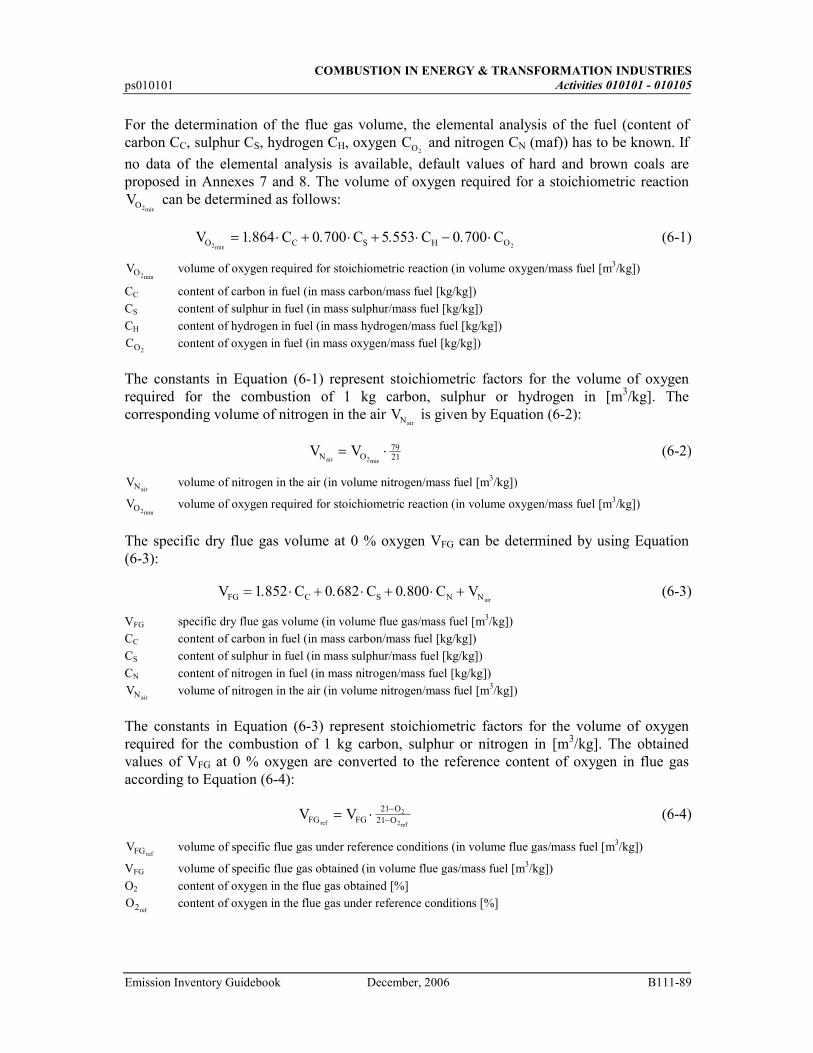
COMBUSTION IN ENERGY & TRANSFORMATION INDUSTRIES
ps010101 Activities 010101 - 010105
Emission Inventory Guidebook December, 2006 B111-89
For the determination of the flue gas volume, the elemental analysis of the fuel (content of carbon CC, sulphur CS, hydrogen CH, oxygen CO2
and nitrogen CN (maf)) has to be known. If
no data of the elemental analysis is available, default values of hard and brown coals are proposed in Annexes 7 and 8. The volume of oxygen required for a stoichiometric reaction VO2min
can be determined as follows:
V C C C CO C S H O2 21 864 0 700 5 553 0 700
min. . . .= ⋅ + ⋅ + ⋅ − ⋅ (6-1)
VO2min volume of oxygen required for stoichiometric reaction (in volume oxygen/mass fuel [m3/kg])
CC content of carbon in fuel (in mass carbon/mass fuel [kg/kg])
CS content of sulphur in fuel (in mass sulphur/mass fuel [kg/kg])
CH content of hydrogen in fuel (in mass hydrogen/mass fuel [kg/kg])
CO2 content of oxygen in fuel (in mass oxygen/mass fuel [kg/kg])
The constants in Equation (6-1) represent stoichiometric factors for the volume of oxygen required for the combustion of 1 kg carbon, sulphur or hydrogen in [m3/kg]. The corresponding volume of nitrogen in the air VNair
is given by Equation (6-2):
V VN Oair= ⋅
2
7921min
(6-2)
VNair volume of nitrogen in the air (in volume nitrogen/mass fuel [m3/kg])
VO2min volume of oxygen required for stoichiometric reaction (in volume oxygen/mass fuel [m3/kg])
The specific dry flue gas volume at 0 % oxygen VFG can be determined by using Equation (6-3):
V C C C VFG C S N Nair= ⋅ + ⋅ + ⋅ +1 852 0 682 0 800. . . (6-3)
VFG specific dry flue gas volume (in volume flue gas/mass fuel [m3/kg])
CC content of carbon in fuel (in mass carbon/mass fuel [kg/kg])
CS content of sulphur in fuel (in mass sulphur/mass fuel [kg/kg])
CN content of nitrogen in fuel (in mass nitrogen/mass fuel [kg/kg])
VNair volume of nitrogen in the air (in volume nitrogen/mass fuel [m3/kg])
The constants in Equation (6-3) represent stoichiometric factors for the volume of oxygen required for the combustion of 1 kg carbon, sulphur or nitrogen in [m3/kg]. The obtained values of VFG at 0 % oxygen are converted to the reference content of oxygen in flue gas according to Equation (6-4):
V VFG FGO
Oref ref= ⋅ −
−21
212
2 (6-4)
VFG ref volume of specific flue gas under reference conditions (in volume flue gas/mass fuel [m3/kg])
VFG volume of specific flue gas obtained (in volume flue gas/mass fuel [m3/kg])
O2 content of oxygen in the flue gas obtained [%]
Oref2 content of oxygen in the flue gas under reference conditions [%]
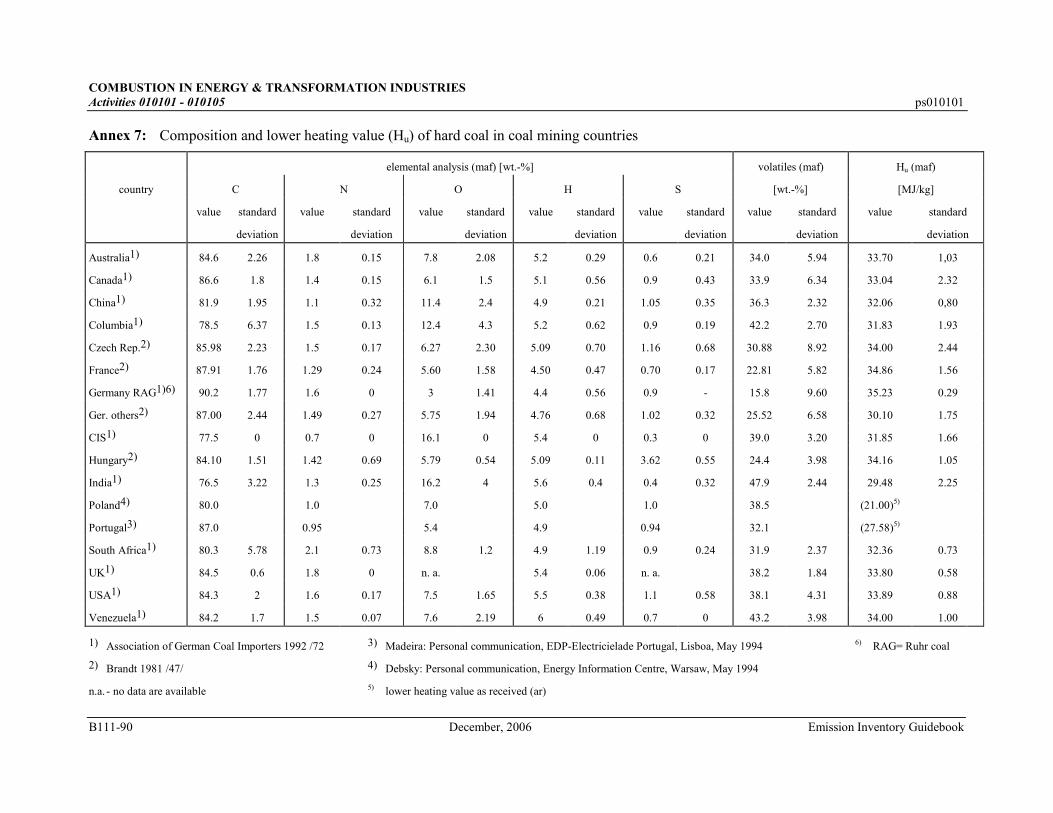
COMBUSTION IN ENERGY & TRANSFORMATION INDUSTRIES Activities 010101 - 010105 ps010101
B111-90 December, 2006 Emission Inventory Guidebook
Annex 7: Composition and lower heating value (Hu) of hard coal in coal mining countries
elemental analysis (maf) [wt.-%] volatiles (maf) Hu (maf)
country C N O H S [wt.-%] [MJ/kg]
value standard
deviation
value standard
deviation
value standard
deviation
value standard
deviation
value standard
deviation
value standard
deviation
value standard
deviation
Australia1) 84.6 2.26 1.8 0.15 7.8 2.08 5.2 0.29 0.6 0.21 34.0 5.94 33.70 1,03
Canada1) 86.6 1.8 1.4 0.15 6.1 1.5 5.1 0.56 0.9 0.43 33.9 6.34 33.04 2.32
China1) 81.9 1.95 1.1 0.32 11.4 2.4 4.9 0.21 1.05 0.35 36.3 2.32 32.06 0,80
Columbia1) 78.5 6.37 1.5 0.13 12.4 4.3 5.2 0.62 0.9 0.19 42.2 2.70 31.83 1.93
Czech Rep.2) 85.98 2.23 1.5 0.17 6.27 2.30 5.09 0.70 1.16 0.68 30.88 8.92 34.00 2.44
France2) 87.91 1.76 1.29 0.24 5.60 1.58 4.50 0.47 0.70 0.17 22.81 5.82 34.86 1.56
Germany RAG1)6) 90.2 1.77 1.6 0 3 1.41 4.4 0.56 0.9 - 15.8 9.60 35.23 0.29
Ger. others2) 87.00 2.44 1.49 0.27 5.75 1.94 4.76 0.68 1.02 0.32 25.52 6.58 30.10 1.75
CIS1) 77.5 0 0.7 0 16.1 0 5.4 0 0.3 0 39.0 3.20 31.85 1.66
Hungary2) 84.10 1.51 1.42 0.69 5.79 0.54 5.09 0.11 3.62 0.55 24.4 3.98 34.16 1.05
India1) 76.5 3.22 1.3 0.25 16.2 4 5.6 0.4 0.4 0.32 47.9 2.44 29.48 2.25
Poland4) 80.0 1.0 7.0 5.0 1.0 38.5 (21.00)5)
Portugal3) 87.0 0.95 5.4 4.9 0.94 32.1 (27.58)5)
South Africa1) 80.3 5.78 2.1 0.73 8.8 1.2 4.9 1.19 0.9 0.24 31.9 2.37 32.36 0.73
UK1) 84.5 0.6 1.8 0 n. a. 5.4 0.06 n. a. 38.2 1.84 33.80 0.58
USA1) 84.3 2 1.6 0.17 7.5 1.65 5.5 0.38 1.1 0.58 38.1 4.31 33.89 0.88
Venezuela1) 84.2 1.7 1.5 0.07 7.6 2.19 6 0.49 0.7 0 43.2 3.98 34.00 1.00
1) Association of German Coal Importers 1992 /72
2) Brandt 1981 /47/
n.a. - no data are available
3) Madeira: Personal communication, EDP-Electricielade Portugal, Lisboa, May 1994
4) Debsky: Personal communication, Energy Information Centre, Warsaw, May 1994
5) lower heating value as received (ar)
6) RAG= Ruhr coal
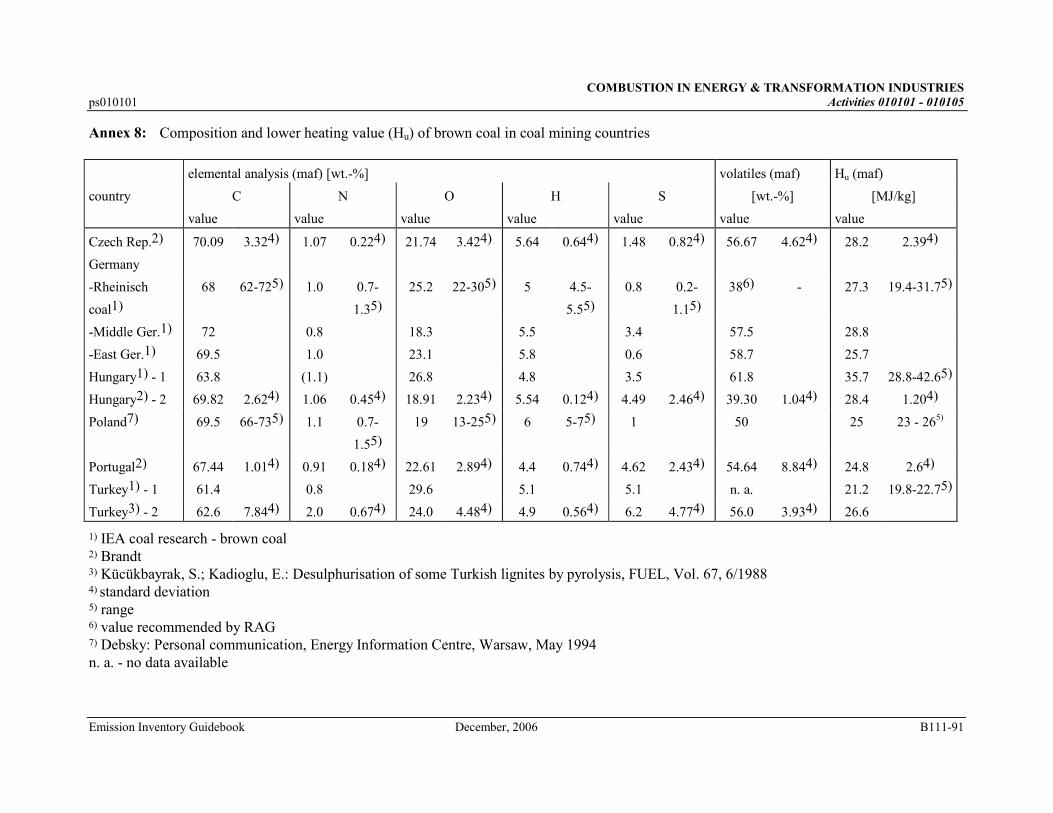
COMBUSTION IN ENERGY & TRANSFORMATION INDUSTRIES ps010101 Activities 010101 - 010105
Emission Inventory Guidebook December, 2006 B111-91
Annex 8: Composition and lower heating value (Hu) of brown coal in coal mining countries
elemental analysis (maf) [wt.-%] volatiles (maf) Hu (maf)
country C N O H S [wt.-%] [MJ/kg]
value value value value value value value
Czech Rep.2) 70.09 3.324) 1.07 0.224) 21.74 3.424) 5.64 0.644) 1.48 0.824) 56.67 4.624) 28.2 2.394)
Germany
-Rheinisch
coal1)
68 62-725) 1.0 0.7-
1.35)
25.2 22-305) 5 4.5-
5.55)
0.8 0.2-
1.15)
386) - 27.3 19.4-31.75)
-Middle Ger.1) 72 0.8 18.3 5.5 3.4 57.5 28.8
-East Ger.1) 69.5 1.0 23.1 5.8 0.6 58.7 25.7
Hungary1) - 1 63.8 (1.1) 26.8 4.8 3.5 61.8 35.7 28.8-42.65)
Hungary2) - 2 69.82 2.624) 1.06 0.454) 18.91 2.234) 5.54 0.124) 4.49 2.464) 39.30 1.044) 28.4 1.204)
Poland7) 69.5 66-735) 1.1 0.7-
1.55)
19 13-255) 6 5-75) 1 50 25 23 - 265)
Portugal2) 67.44 1.014) 0.91 0.184) 22.61 2.894) 4.4 0.744) 4.62 2.434) 54.64 8.844) 24.8 2.64)
Turkey1) - 1 61.4 0.8 29.6 5.1 5.1 n. a. 21.2 19.8-22.75)
Turkey3) - 2 62.6 7.844) 2.0 0.674) 24.0 4.484) 4.9 0.564) 6.2 4.774) 56.0 3.934) 26.6
1) IEA coal research - brown coal 2) Brandt 3) Kücükbayrak, S.; Kadioglu, E.: Desulphurisation of some Turkish lignites by pyrolysis, FUEL, Vol. 67, 6/1988 4) standard deviation 5) range 6) value recommended by RAG 7) Debsky: Personal communication, Energy Information Centre, Warsaw, May 1994 n. a. - no data available
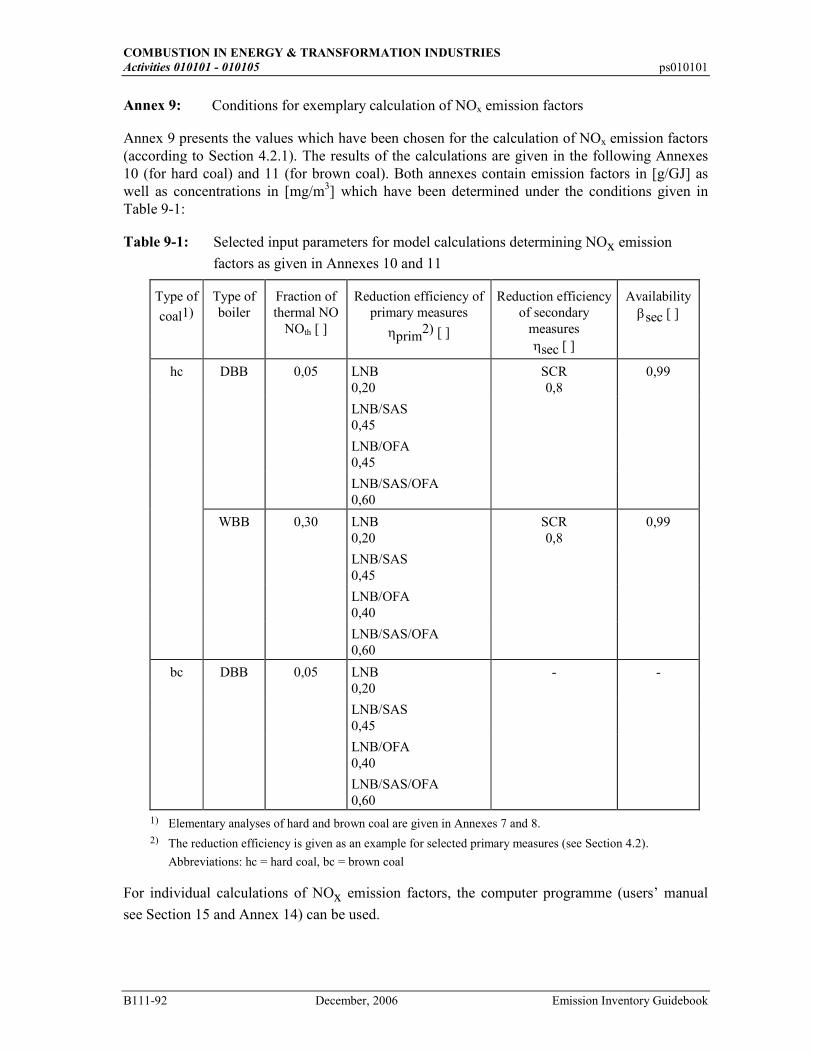
COMBUSTION IN ENERGY & TRANSFORMATION INDUSTRIES Activities 010101 - 010105 ps010101
B111-92 December, 2006 Emission Inventory Guidebook
Annex 9: Conditions for exemplary calculation of NOx emission factors
Annex 9 presents the values which have been chosen for the calculation of NOx emission factors (according to Section 4.2.1). The results of the calculations are given in the following Annexes 10 (for hard coal) and 11 (for brown coal). Both annexes contain emission factors in [g/GJ] as well as concentrations in [mg/m3] which have been determined under the conditions given in Table 9-1:
Table 9-1: Selected input parameters for model calculations determining NOx emission
factors as given in Annexes 10 and 11
Type of
coal1)
Type of boiler
Fraction of thermal NO
NOth [ ]
Reduction efficiency of primary measures
ηprim2) [ ]
Reduction efficiency of secondary
measures ηsec [ ]
Availability βsec [ ]
hc DBB 0,05 LNB 0,20
SCR 0,8
0,99
LNB/SAS 0,45
LNB/OFA 0,45
LNB/SAS/OFA 0,60
WBB 0,30 LNB 0,20
SCR 0,8
0,99
LNB/SAS 0,45
LNB/OFA 0,40
LNB/SAS/OFA 0,60
bc DBB 0,05 LNB 0,20
- -
LNB/SAS 0,45
LNB/OFA 0,40
LNB/SAS/OFA 0,60
1) Elementary analyses of hard and brown coal are given in Annexes 7 and 8. 2) The reduction efficiency is given as an example for selected primary measures (see Section 4.2).
Abbreviations: hc = hard coal, bc = brown coal
For individual calculations of NOx emission factors, the computer programme (users’ manual
see Section 15 and Annex 14) can be used.
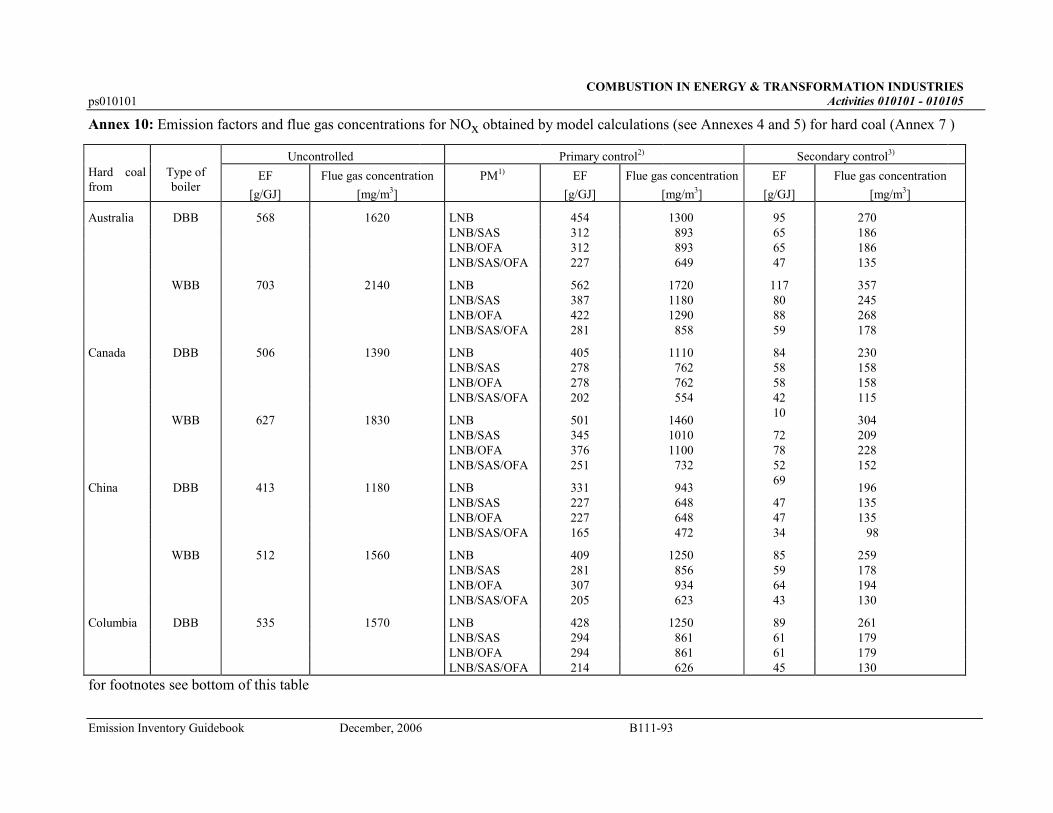
COMBUSTION IN ENERGY & TRANSFORMATION INDUSTRIES ps010101 Activities 010101 - 010105
Emission Inventory Guidebook December, 2006 B111-93
Annex 10: Emission factors and flue gas concentrations for NOx obtained by model calculations (see Annexes 4 and 5) for hard coal (Annex 7 )
Uncontrolled Primary control2) Secondary control3)
Hard coal from
Type of boiler
EF
[g/GJ]
Flue gas concentration
[mg/m3]
PM1) EF
[g/GJ]
Flue gas concentration
[mg/m3]
EF
[g/GJ]
Flue gas concentration
[mg/m3]
Australia DBB 568 1620 LNB 454 1300 95 270 LNB/SAS 312 893 65 186 LNB/OFA 312 893 65 186 LNB/SAS/OFA 227 649 47 135
WBB 703 2140 LNB 562 1720 117 357 LNB/SAS 387 1180 80 245 LNB/OFA 422 1290 88 268 LNB/SAS/OFA 281 858 59 178
Canada DBB 506 1390 LNB 405 1110 84 230 LNB/SAS 278 762 58 158 LNB/OFA 278 762 58 158 LNB/SAS/OFA 202 554 42 115
WBB 627 1830 LNB 501 1460 10
304 LNB/SAS 345 1010 72 209 LNB/OFA 376 1100 78 228 LNB/SAS/OFA 251 732 52 152
China DBB 413 1180 LNB 331 943 69
196 LNB/SAS 227 648 47 135 LNB/OFA 227 648 47 135 LNB/SAS/OFA 165 472 34 98
WBB 512 1560 LNB 409 1250 85 259 LNB/SAS 281 856 59 178 LNB/OFA 307 934 64 194 LNB/SAS/OFA 205 623 43 130
Columbia DBB 535 1570 LNB 428 1250 89 261 LNB/SAS 294 861 61 179 LNB/OFA 294 861 61 179 LNB/SAS/OFA 214 626 45 130
for footnotes see bottom of this table
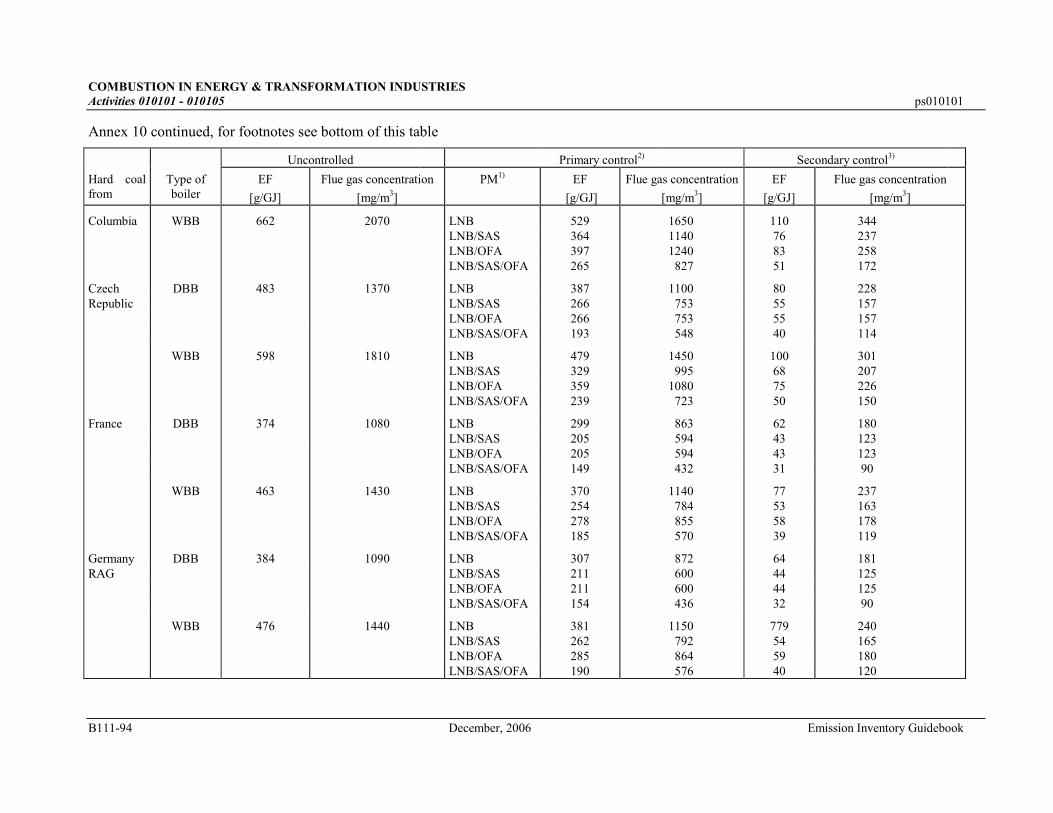
COMBUSTION IN ENERGY & TRANSFORMATION INDUSTRIES Activities 010101 - 010105 ps010101
B111-94 December, 2006 Emission Inventory Guidebook
Annex 10 continued, for footnotes see bottom of this table
Uncontrolled Primary control2) Secondary control3)
Hard coal from
Type of boiler
EF
[g/GJ]
Flue gas concentration
[mg/m3]
PM1) EF
[g/GJ]
Flue gas concentration
[mg/m3]
EF
[g/GJ]
Flue gas concentration
[mg/m3]
Columbia WBB 662 2070 LNB 529 1650 110 344 LNB/SAS 364 1140 76 237 LNB/OFA 397 1240 83 258 LNB/SAS/OFA 265 827 51 172
Czech DBB 483 1370 LNB 387 1100 80 228 Republic LNB/SAS 266 753 55 157 LNB/OFA 266 753 55 157 LNB/SAS/OFA 193 548 40 114
WBB 598 1810 LNB 479 1450 100 301 LNB/SAS 329 995 68 207 LNB/OFA 359 1080 75 226 LNB/SAS/OFA 239 723 50 150
France DBB 374 1080 LNB 299 863 62 180 LNB/SAS 205 594 43 123 LNB/OFA 205 594 43 123 LNB/SAS/OFA 149 432 31 90
WBB 463 1430 LNB 370 1140 77 237 LNB/SAS 254 784 53 163 LNB/OFA 278 855 58 178 LNB/SAS/OFA 185 570 39 119
Germany DBB 384 1090 LNB 307 872 64 181 RAG LNB/SAS 211 600 44 125 LNB/OFA 211 600 44 125 LNB/SAS/OFA 154 436 32 90
WBB 476 1440 LNB 381 1150 779 240 LNB/SAS 262 792 54 165 LNB/OFA 285 864 59 180 LNB/SAS/OFA 190 576 40 120

COMBUSTION IN ENERGY & TRANSFORMATION INDUSTRIES ps010101 Activities 010101 - 010105
Emission Inventory Guidebook December, 2006 B111-95
Annex 10 continued, for footnotes see bottom of this table
Uncontrolled Primary control2) Secondary control3) Hard coal from
Type of boiler
EF
[g/GJ]
Flue gas concentration
[mg/m3]
PM1) EF
[g/GJ]
Flue gas concentration
[mg/m3]
EF
[g/GJ]
Flue gas concentration
[mg/m3]
Germany DBB 495 1240 LNB 396 990 82 206 others LNB/SAS 272 681 57 142 LNB/OFA 272 681 57 142 LNB/SAS/OFA 198 495 41 103
WBB 613 1630 LNB 490 1310 102 272 LNB/SAS 337 899 70 187 LNB/OFA 368 980 76 204 LNB/SAS/OFA 245 654 51 136
Hungary DBB 401 1150 LNB 320 920 67 191 LNB/SAS 220 633 46 132 LNB/OFA 220 633 46 132 LNB/SAS/OFA 160 460 33 96
WBB 496 1520 LNB 397 1220 82 253 LNB/SAS 273 835 57 174 LNB/OFA 298 911 62 190 LNB/SAS/OFA 198 608 41 126
CIS DBB 308 923 LNB 247 739 51
154 LNB/SAS 169 508 35 106 LNB/OFA 169 508 35 106 LNB/SAS/OFA 123 369 26 77
WBB 382 1220 LNB 305 975 64
203 LNB/SAS 210 671 44 139 LNB/OFA 229 732 48 152 LNB/SAS/OFA 153 488 32 101
India DBB 551 1540 LNB 441 1230 92 256 LNB/SAS 303 845 63 176 LNB/OFA 303 845 63 176 LNB/SAS/OFA 220 615 46 128
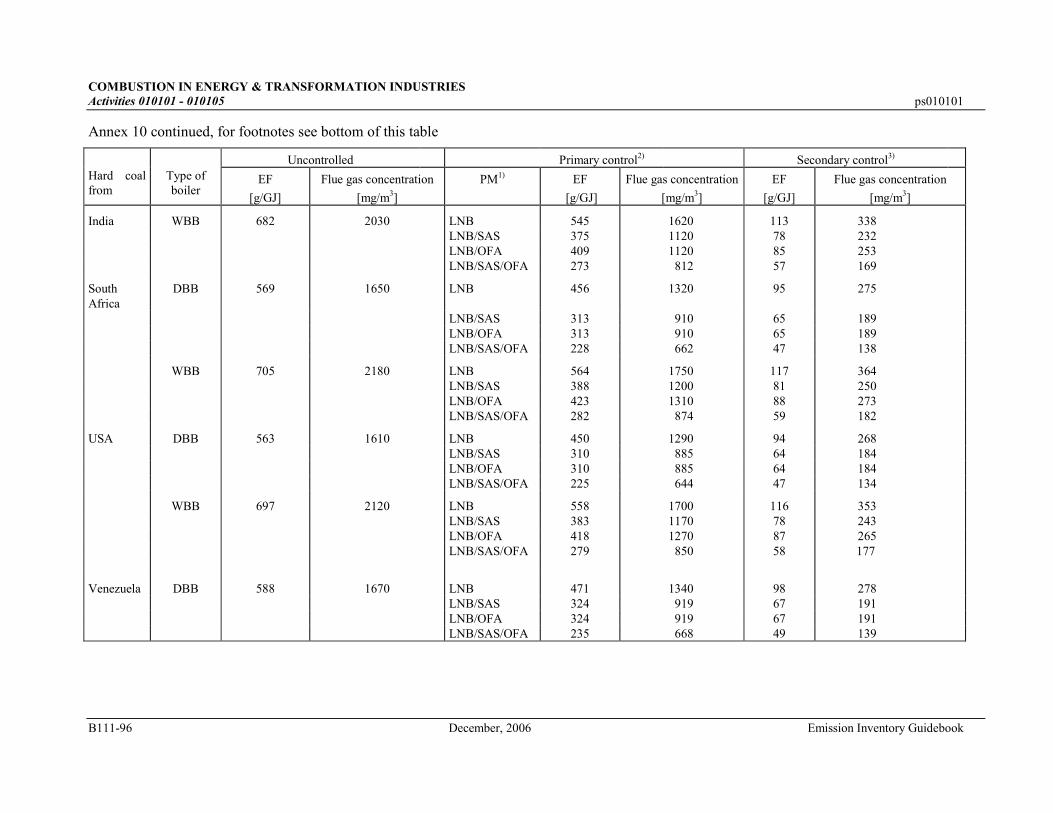
COMBUSTION IN ENERGY & TRANSFORMATION INDUSTRIES Activities 010101 - 010105 ps010101
B111-96 December, 2006 Emission Inventory Guidebook
Annex 10 continued, for footnotes see bottom of this table
Uncontrolled Primary control2) Secondary control3) Hard coal from
Type of boiler
EF
[g/GJ]
Flue gas concentration
[mg/m3]
PM1) EF
[g/GJ]
Flue gas concentration
[mg/m3]
EF
[g/GJ]
Flue gas concentration
[mg/m3]
India WBB 682 2030 LNB 545 1620 113 338 LNB/SAS 375 1120 78 232 LNB/OFA 409 1120 85 253 LNB/SAS/OFA 273 812 57 169
South Africa
DBB 569 1650 LNB 456 1320 95 275
LNB/SAS 313 910 65 189 LNB/OFA 313 910 65 189 LNB/SAS/OFA 228 662 47 138
WBB 705 2180 LNB 564 1750 117 364 LNB/SAS 388 1200 81 250 LNB/OFA 423 1310 88 273 LNB/SAS/OFA 282 874 59 182
USA DBB 563 1610 LNB 450 1290 94 268 LNB/SAS 310 885 64 184 LNB/OFA 310 885 64 184 LNB/SAS/OFA 225 644 47 134
WBB 697 2120 LNB 558 1700 116 353 LNB/SAS 383 1170 78 243 LNB/OFA 418 1270 87 265 LNB/SAS/OFA 279 850 58 177
Venezuela DBB 588 1670 LNB 471 1340 98 278 LNB/SAS 324 919 67 191 LNB/OFA 324 919 67 191 LNB/SAS/OFA 235 668 49 139
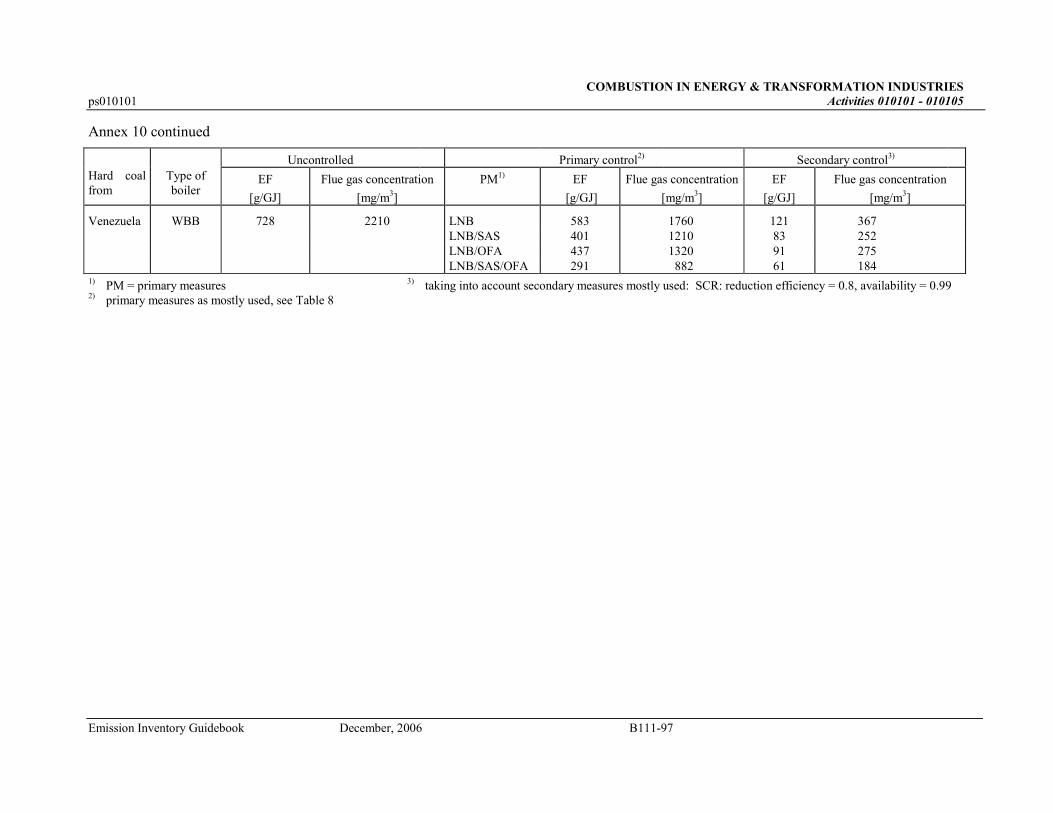
COMBUSTION IN ENERGY & TRANSFORMATION INDUSTRIES ps010101 Activities 010101 - 010105
Emission Inventory Guidebook December, 2006 B111-97
Annex 10 continued
Uncontrolled Primary control2) Secondary control3) Hard coal from
Type of boiler
EF
[g/GJ]
Flue gas concentration
[mg/m3]
PM1) EF
[g/GJ]
Flue gas concentration
[mg/m3]
EF
[g/GJ]
Flue gas concentration
[mg/m3]
Venezuela WBB 728 2210 LNB 583 1760 121 367 LNB/SAS 401 1210 83 252 LNB/OFA 437 1320 91 275 LNB/SAS/OFA 291 882 61 184 1) PM = primary measures 3) taking into account secondary measures mostly used: SCR: reduction efficiency = 0.8, availability = 0.99 2) primary measures as mostly used, see Table 8
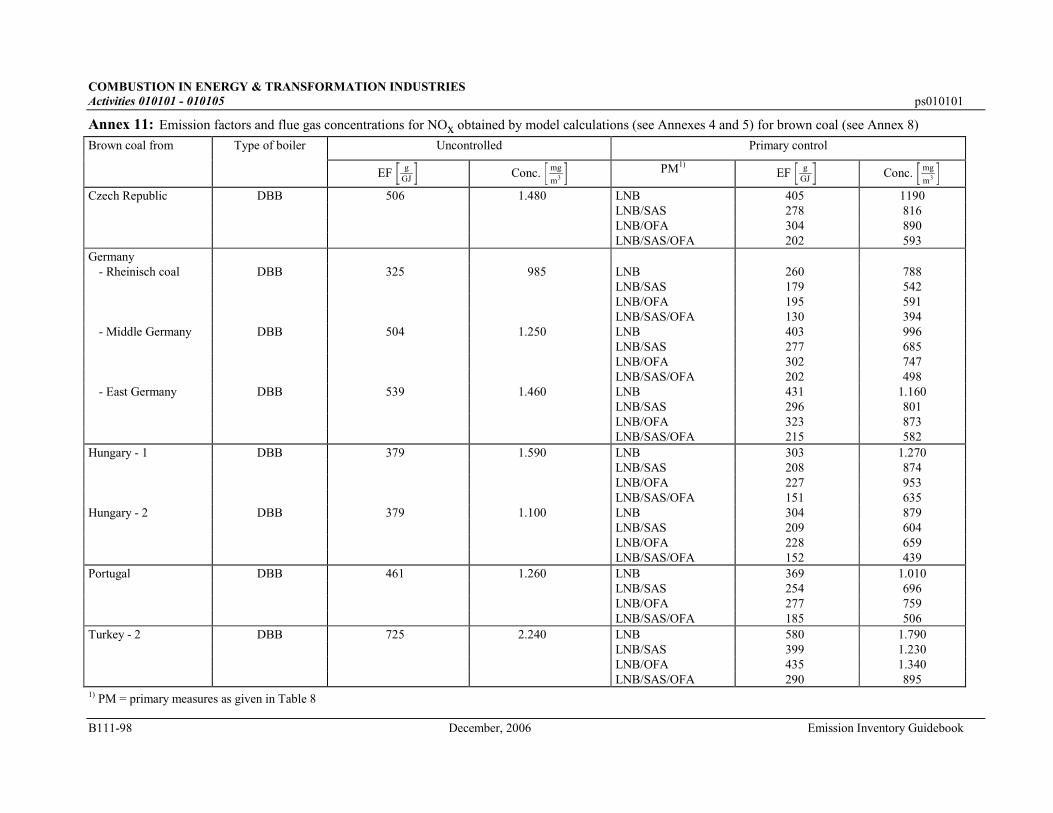
COMBUSTION IN ENERGY & TRANSFORMATION INDUSTRIES Activities 010101 - 010105 ps010101
B111-98 December, 2006 Emission Inventory Guidebook
Annex 11: Emission factors and flue gas concentrations for NOx obtained by model calculations (see Annexes 4 and 5) for brown coal (see Annex 8) Brown coal from Type of boiler Uncontrolled Primary control
EF gGJ Conc. mg
m3 PM1) EF gGJ Conc. mg
m3
Czech Republic DBB 506 1.480 LNB 405 1190 LNB/SAS 278 816 LNB/OFA 304 890 LNB/SAS/OFA 202 593 Germany
- Rheinisch coal DBB 325 985 LNB 260 788 LNB/SAS 179 542 LNB/OFA 195 591 LNB/SAS/OFA 130 394 - Middle Germany DBB 504 1.250 LNB 403 996 LNB/SAS 277 685 LNB/OFA 302 747 LNB/SAS/OFA 202 498 - East Germany DBB 539 1.460 LNB 431 1.160
LNB/SAS 296 801 LNB/OFA 323 873 LNB/SAS/OFA 215 582 Hungary - 1 DBB 379 1.590 LNB 303 1.270 LNB/SAS 208 874 LNB/OFA 227 953 LNB/SAS/OFA 151 635 Hungary - 2 DBB 379 1.100 LNB 304 879 LNB/SAS 209 604 LNB/OFA 228 659 LNB/SAS/OFA 152 439 Portugal DBB 461 1.260 LNB 369 1.010 LNB/SAS 254 696 LNB/OFA 277 759 LNB/SAS/OFA 185 506 Turkey - 2 DBB 725 2.240 LNB 580 1.790 LNB/SAS 399 1.230 LNB/OFA 435 1.340 LNB/SAS/OFA 290 895 1) PM = primary measures as given in Table 8
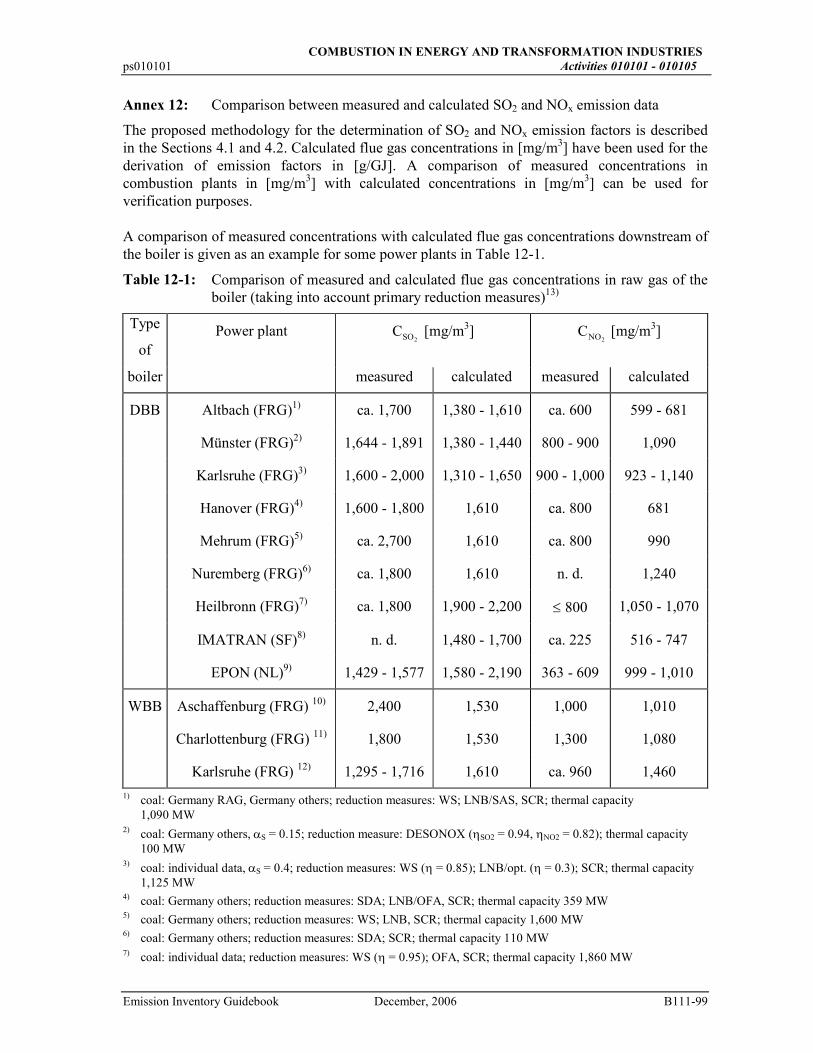
COMBUSTION IN ENERGY AND TRANSFORMATION INDUSTRIES ps010101 Activities 010101 - 010105
Emission Inventory Guidebook December, 2006 B111-99
Annex 12: Comparison between measured and calculated SO2 and NOx emission data
The proposed methodology for the determination of SO2 and NOx emission factors is described in the Sections 4.1 and 4.2. Calculated flue gas concentrations in [mg/m3] have been used for the derivation of emission factors in [g/GJ]. A comparison of measured concentrations in combustion plants in [mg/m3] with calculated concentrations in [mg/m3] can be used for verification purposes. A comparison of measured concentrations with calculated flue gas concentrations downstream of the boiler is given as an example for some power plants in Table 12-1.
Table 12-1: Comparison of measured and calculated flue gas concentrations in raw gas of the boiler (taking into account primary reduction measures)13)
Type
of Power plant CSO2
[mg/m3] CNO2 [mg/m3]
boiler measured calculated measured calculated
DBB Altbach (FRG)1) ca. 1,700 1,380 - 1,610 ca. 600 599 - 681
Münster (FRG)2) 1,644 - 1,891 1,380 - 1,440 800 - 900 1,090
Karlsruhe (FRG)3) 1,600 - 2,000 1,310 - 1,650 900 - 1,000 923 - 1,140
Hanover (FRG)4) 1,600 - 1,800 1,610 ca. 800 681
Mehrum (FRG)5) ca. 2,700 1,610 ca. 800 990
Nuremberg (FRG)6) ca. 1,800 1,610 n. d. 1,240
Heilbronn (FRG)7) ca. 1,800 1,900 - 2,200 ≤ 800 1,050 - 1,070
IMATRAN (SF)8) n. d. 1,480 - 1,700 ca. 225 516 - 747
EPON (NL)9) 1,429 - 1,577 1,580 - 2,190 363 - 609 999 - 1,010
WBB Aschaffenburg (FRG) 10) 2,400 1,530 1,000 1,010
Charlottenburg (FRG) 11) 1,800 1,530 1,300 1,080
Karlsruhe (FRG) 12) 1,295 - 1,716 1,610 ca. 960 1,460
1) coal: Germany RAG, Germany others; reduction measures: WS; LNB/SAS, SCR; thermal capacity 1,090 MW
2) coal: Germany others, αS = 0.15; reduction measure: DESONOX (ηSO2 = 0.94, ηNO2 = 0.82); thermal capacity 100 MW
3) coal: individual data, αS = 0.4; reduction measures: WS (η = 0.85); LNB/opt. (η = 0.3); SCR; thermal capacity 1,125 MW
4) coal: Germany others; reduction measures: SDA; LNB/OFA, SCR; thermal capacity 359 MW 5) coal: Germany others; reduction measures: WS; LNB, SCR; thermal capacity 1,600 MW 6) coal: Germany others; reduction measures: SDA; SCR; thermal capacity 110 MW 7) coal: individual data; reduction measures: WS (η = 0.95); OFA, SCR; thermal capacity 1,860 MW
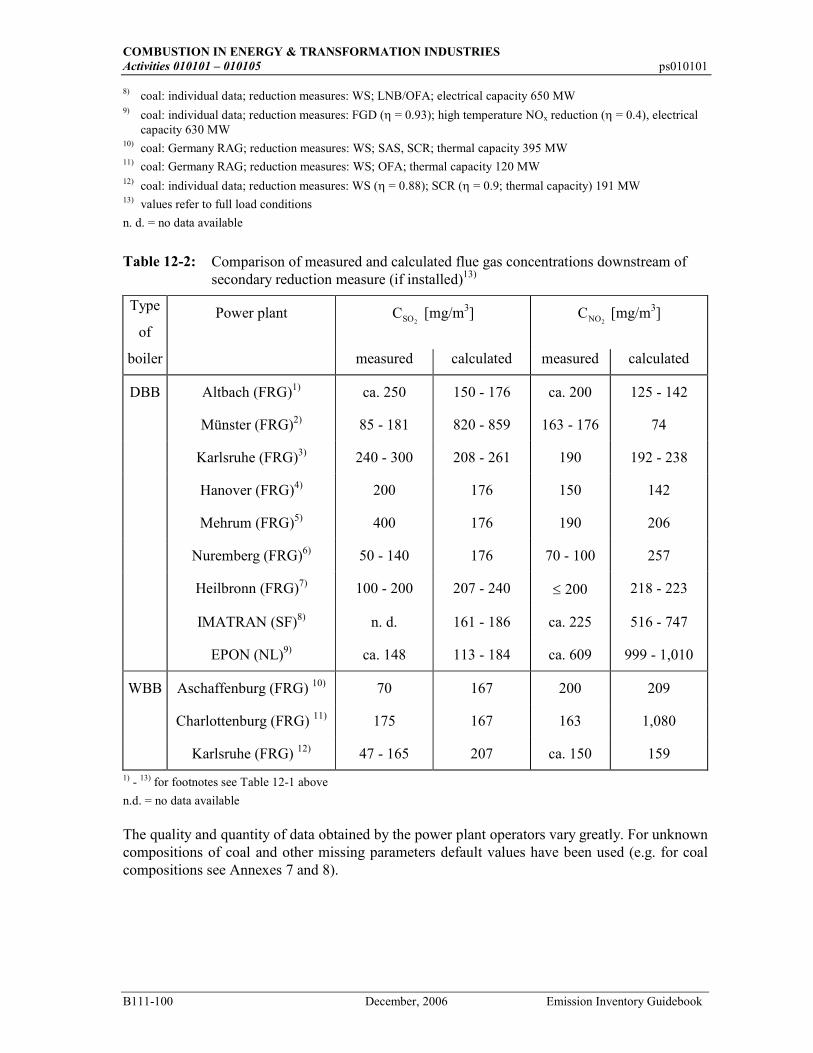
COMBUSTION IN ENERGY & TRANSFORMATION INDUSTRIES Activities 010101 – 010105 ps010101
B111-100 December, 2006 Emission Inventory Guidebook
8) coal: individual data; reduction measures: WS; LNB/OFA; electrical capacity 650 MW 9) coal: individual data; reduction measures: FGD (η = 0.93); high temperature NOx reduction (η = 0.4), electrical
capacity 630 MW 10) coal: Germany RAG; reduction measures: WS; SAS, SCR; thermal capacity 395 MW 11) coal: Germany RAG; reduction measures: WS; OFA; thermal capacity 120 MW 12) coal: individual data; reduction measures: WS (η = 0.88); SCR (η = 0.9; thermal capacity) 191 MW 13) values refer to full load conditions
n. d. = no data available
Table 12-2: Comparison of measured and calculated flue gas concentrations downstream of secondary reduction measure (if installed)13)
Type
of Power plant CSO2
[mg/m3] CNO2 [mg/m3]
boiler measured calculated measured calculated
DBB Altbach (FRG)1) ca. 250 150 - 176 ca. 200 125 - 142
Münster (FRG)2) 85 - 181 820 - 859 163 - 176 74
Karlsruhe (FRG)3) 240 - 300 208 - 261 190 192 - 238
Hanover (FRG)4) 200 176 150 142
Mehrum (FRG)5) 400 176 190 206
Nuremberg (FRG)6) 50 - 140 176 70 - 100 257
Heilbronn (FRG)7) 100 - 200 207 - 240 ≤ 200 218 - 223
IMATRAN (SF)8) n. d. 161 - 186 ca. 225 516 - 747
EPON (NL)9) ca. 148 113 - 184 ca. 609 999 - 1,010
WBB Aschaffenburg (FRG) 10) 70 167 200 209
Charlottenburg (FRG) 11) 175 167 163 1,080
Karlsruhe (FRG) 12) 47 - 165 207 ca. 150 159
1) - 13) for footnotes see Table 12-1 above
n.d. = no data available The quality and quantity of data obtained by the power plant operators vary greatly. For unknown compositions of coal and other missing parameters default values have been used (e.g. for coal compositions see Annexes 7 and 8).
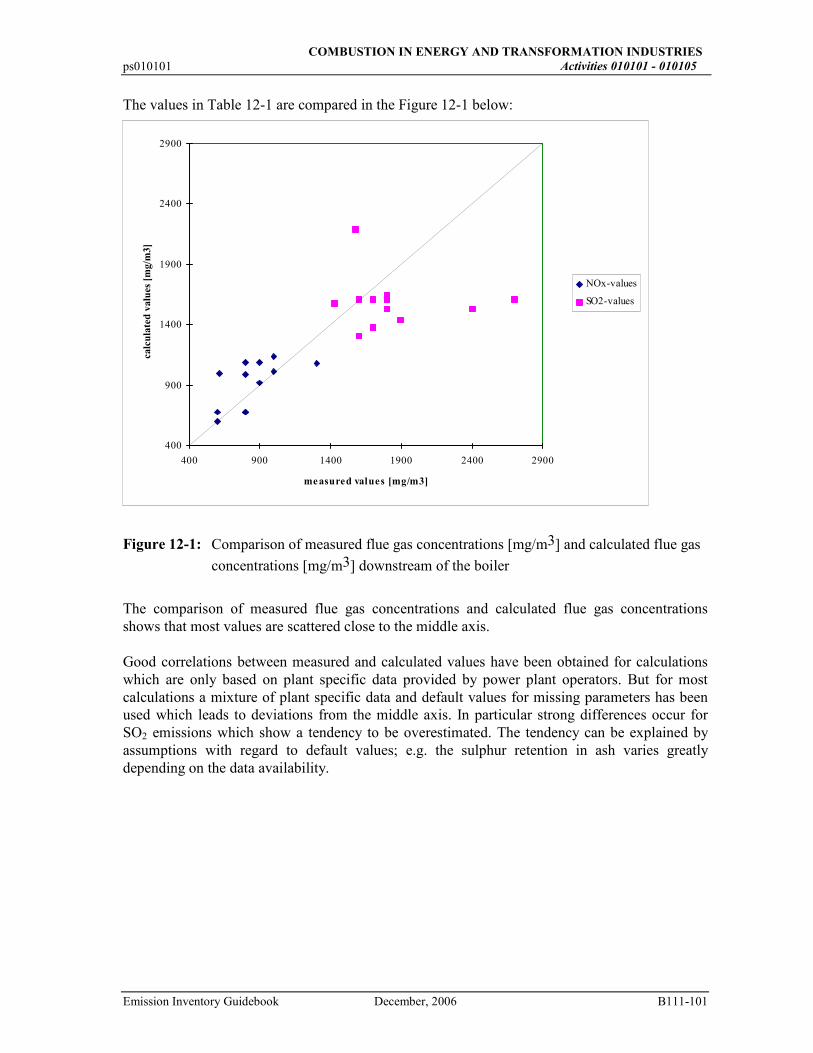
COMBUSTION IN ENERGY AND TRANSFORMATION INDUSTRIES ps010101 Activities 010101 - 010105
Emission Inventory Guidebook December, 2006 B111-101
The values in Table 12-1 are compared in the Figure 12-1 below:
400
900
1400
1900
2400
2900
400 900 1400 1900 2400 2900
measured values [mg/m3]
calculate
d valu
es [m
g/m
3]
NOx-values
SO2-values
Figure 12-1: Comparison of measured flue gas concentrations [mg/m3] and calculated flue gas
concentrations [mg/m3] downstream of the boiler
The comparison of measured flue gas concentrations and calculated flue gas concentrations shows that most values are scattered close to the middle axis. Good correlations between measured and calculated values have been obtained for calculations which are only based on plant specific data provided by power plant operators. But for most calculations a mixture of plant specific data and default values for missing parameters has been used which leads to deviations from the middle axis. In particular strong differences occur for SO2 emissions which show a tendency to be overestimated. The tendency can be explained by assumptions with regard to default values; e.g. the sulphur retention in ash varies greatly depending on the data availability.
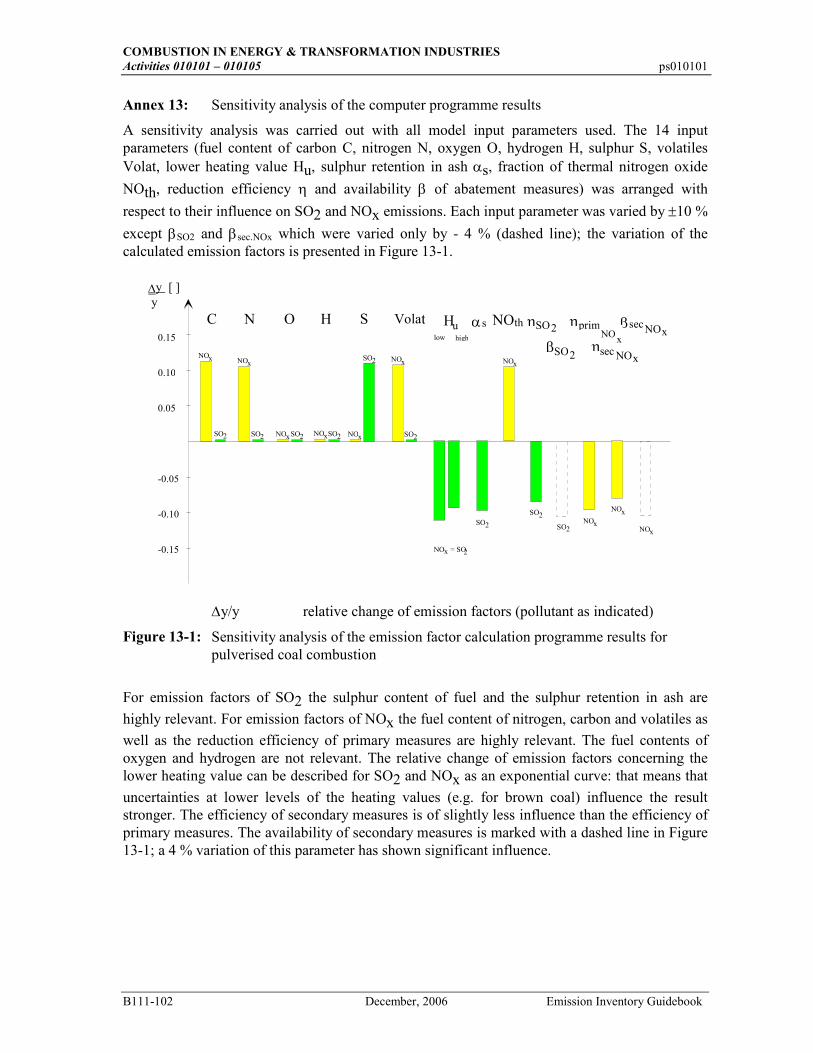
COMBUSTION IN ENERGY & TRANSFORMATION INDUSTRIES Activities 010101 – 010105 ps010101
B111-102 December, 2006 Emission Inventory Guidebook
Annex 13: Sensitivity analysis of the computer programme results
A sensitivity analysis was carried out with all model input parameters used. The 14 input parameters (fuel content of carbon C, nitrogen N, oxygen O, hydrogen H, sulphur S, volatiles Volat, lower heating value Hu, sulphur retention in ash αs, fraction of thermal nitrogen oxide
NOth, reduction efficiency η and availability β of abatement measures) was arranged with
respect to their influence on SO2 and NOx emissions. Each input parameter was varied by ±10 %
except βSO2 and βsec.NOx which were varied only by - 4 % (dashed line); the variation of the calculated emission factors is presented in Figure 13-1. ∆y [ ] y
NOx
NOx
NOx
NOx
NOx
NOxNOx
NOx NOx
NOx
SO2
SO2 SO2 SO2 SO2 SO2
SO2
SO2
SO2
2NO = SOx
low high
C N O H S Volat Hu αs NOth SO2
SO2
ηη prim
β ηNOx
βsecNOx
sec
-0.05
-0.10
0.05
0.10
0.15
-0.15
NOx
∆y/y relative change of emission factors (pollutant as indicated)
Figure 13-1: Sensitivity analysis of the emission factor calculation programme results for pulverised coal combustion
For emission factors of SO2 the sulphur content of fuel and the sulphur retention in ash are
highly relevant. For emission factors of NOx the fuel content of nitrogen, carbon and volatiles as
well as the reduction efficiency of primary measures are highly relevant. The fuel contents of oxygen and hydrogen are not relevant. The relative change of emission factors concerning the lower heating value can be described for SO2 and NOx as an exponential curve: that means that
uncertainties at lower levels of the heating values (e.g. for brown coal) influence the result stronger. The efficiency of secondary measures is of slightly less influence than the efficiency of primary measures. The availability of secondary measures is marked with a dashed line in Figure 13-1; a 4 % variation of this parameter has shown significant influence.
COMBUSTION IN ENERGY AND TRANSFORMATION INDUSTRIES ps010101 Activities 010101 - 010105
Emission Inventory Guidebook December, 2006 B111-103
Annex 14: Users’ manual for the emission factor calculation programme (for September 1995 version)
Determination of SO2 and NOx emission factors for large combustion plants
1 Computer specifications
This programme requires MICROSOFT WINDOWS 3.1, a 3½" floppy disc drive, and at least 200 Kbyte on the hard disc. The programme has been designed in MICROSOFT EXCEL 4.0 - English Version.
2 Installation
The floppy disc received contains 19 files. All these files have to be installed on the hard disc. The following users’ guide is stored under README.DOC (written with MICROSOFT WORD FOR WINDOWS 2.1). The software has to be installed on your hard disk "C" by using the following procedure:
- Create a new sub-directory with the name 'POWER_PL' by following the instructions:
- in DOS go to C:\ - type: MD POWER_PL - hit the <ENTER>-key - change into this sub-directory by typing: CD POWER_PL - hit the <ENTER>-key.
- To copy all the files from your floppy disc into the sub-directory 'POWER_PL' proceed as follows:
- insert your disk into slot A (or B) of your PC - type COPY A: (or B:)\*.* - hit the <ENTER>-key.
The installation of the programme is then complete.
3 How to work with the programme
3.1 Start the programme
- Start MICROSOFT WINDOWS 3.1 and MICROSOFT EXCEL 4.0 - English Version (or MICROSOFT EXCEL 5.0 - English Version).
- In 'FILE' - 'OPEN', go to hard disk 'C' and activate the sub-directory 'POWER_PL'. Then you will see all the necessary files in the programme in the left window.
- Choose the file 'POWER_PL.XLW' and hit the <ENTER>-key.
- Then the programme opens all the tables and macros needed.
COMBUSTION IN ENERGY & TRANSFORMATION INDUSTRIES Activities 010101 – 010105 ps010101
B111-104 December, 2006 Emission Inventory Guidebook
3.2 Further proceedings with the programme
- When you see the first screen please type 'Ctrl'-'a' (or 'Strg'-'a') to start the programme. By hitting these two keys you start a macro, which takes you through all the levels of the programme. The input data for the programme are divided into background tables for the fuel used, for SO2-specification and NOx-specification.
Fuel data input
- First the programme asks for an identification of the model run. You are free to put in the name of the power plant, type of boiler, type of fuel (e. g. Heilbronn - dry bottom boiler - hard coal).
- The next window requests the type of coal (hard coal or lignite).
- The programme asks you to choose one of the fuel compositions listed. Select one of them by typing the corresponding number and hitting the 'OK'-key on the screen1). If the default values of the given fuel compositions do not correspond with your power plant, you have the possibility of putting in corrected values by choosing the last line of the table (line 17 or 10). Then the programme asks you to enter in the individual values. The values given by the 'question-window' can be kept by hitting the 'OK'-key on the screen.
- Then the programme asks for the water content of the fuel and the reference-content of oxygen in the flue gas. The value given by the 'question-window' can be retained by hitting the 'OK'-key on the screen.
SO2 data specification
- The programme asks you to choose one of the listed numbers as a value for the sulphur retention in ash. Please select one of them by typing the corresponding number and hitting the 'OK'-key on the screen1). If the default values for the sulphur retention in ash do not correspond with your power plant, you have the possibility of putting in corrected values by choosing the last line of the table (line 3). Then the programme asks you to put in the value.
- The programme asks you to choose one of the listed secondary measures SO2 . Please
select one of them by typing the corresponding number and hitting the 'OK'-key on the screen1). If the default values of the efficiencies and availabilities of the secondary measures given do not correspond with those of your power plant, you have the possibility of putting put in corrected values by choosing the last line of the table (line 9). Then the programme asks you to put in the individual values.
At this point the calculations for SO2 are finished.
NOx data specification
- The programme proceeds with the calculations of NO2 by asking for a value for
NOthermal1. At this stage, the thermal NO (NOthermal) has to be put in as an exogenious
value as given in the table. You have the possibility of putting in a new value by following the instructions on the screen.
COMBUSTION IN ENERGY AND TRANSFORMATION INDUSTRIES ps010101 Activities 010101 - 010105
Emission Inventory Guidebook December, 2006 B111-105
- The next window requests the type of boiler (wet bottom boiler WBB- dry bottom boiler DBB).
- Then you have to choose a type of combination of primary measure installed. For some primary measures, reduction efficiencies are given as default values11. If you have better data available, you can put in new values choosing the last line of the table (line 17) and follow the instructions on the screen.
- Finally, you have to choose a type of combination of secondary measure installed1. As mentioned above, you can put in different values of efficiencies and availabilities by choosing one secondary measure from the table (typing the corresponding number). Or else you can put in your own values by selecting the last line of the table (line 6). Please follow the instructions on the screen.
At the end the following message appears on the screen: You can save the data-sheet named 'AINPUSO2.XLS' under a different name. If you want to do further model runs, just type 'Ctrl'-'a' (or 'Strg'-'a') and the programme starts again. In order to finish your calculation, just quit EXCEL without saving changes in any of the 19 basic files of this software.
11 If the tables with the default values are overlapped by a 'question-window' you can move this window: point on
the headline of this little window with your mouse-pointer, hold your left mouse-button and move it.
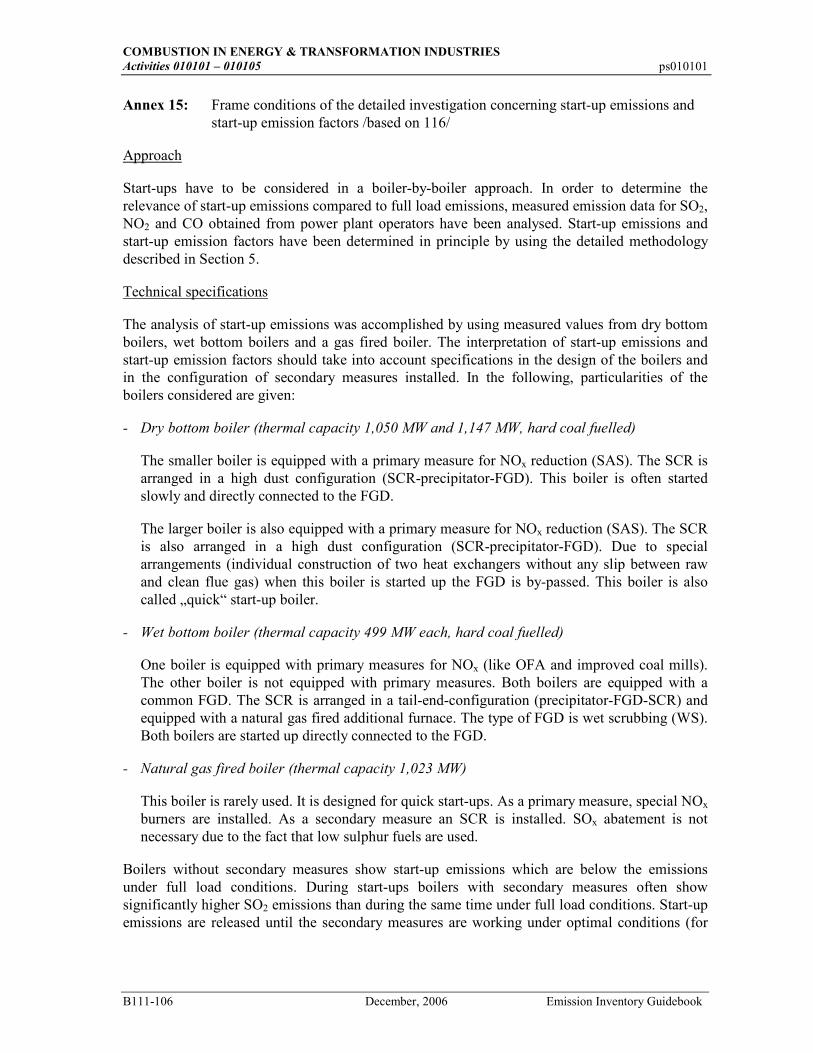
COMBUSTION IN ENERGY & TRANSFORMATION INDUSTRIES Activities 010101 – 010105 ps010101
B111-106 December, 2006 Emission Inventory Guidebook
Annex 15: Frame conditions of the detailed investigation concerning start-up emissions and start-up emission factors /based on 116/
Approach
Start-ups have to be considered in a boiler-by-boiler approach. In order to determine the relevance of start-up emissions compared to full load emissions, measured emission data for SO2, NO2 and CO obtained from power plant operators have been analysed. Start-up emissions and start-up emission factors have been determined in principle by using the detailed methodology described in Section 5.
Technical specifications
The analysis of start-up emissions was accomplished by using measured values from dry bottom boilers, wet bottom boilers and a gas fired boiler. The interpretation of start-up emissions and start-up emission factors should take into account specifications in the design of the boilers and in the configuration of secondary measures installed. In the following, particularities of the boilers considered are given:
- Dry bottom boiler (thermal capacity 1,050 MW and 1,147 MW, hard coal fuelled)
The smaller boiler is equipped with a primary measure for NOx reduction (SAS). The SCR is arranged in a high dust configuration (SCR-precipitator-FGD). This boiler is often started slowly and directly connected to the FGD.
The larger boiler is also equipped with a primary measure for NOx reduction (SAS). The SCR is also arranged in a high dust configuration (SCR-precipitator-FGD). Due to special arrangements (individual construction of two heat exchangers without any slip between raw and clean flue gas) when this boiler is started up the FGD is by-passed. This boiler is also called „quick“ start-up boiler.
- Wet bottom boiler (thermal capacity 499 MW each, hard coal fuelled)
One boiler is equipped with primary measures for NOx (like OFA and improved coal mills). The other boiler is not equipped with primary measures. Both boilers are equipped with a common FGD. The SCR is arranged in a tail-end-configuration (precipitator-FGD-SCR) and equipped with a natural gas fired additional furnace. The type of FGD is wet scrubbing (WS). Both boilers are started up directly connected to the FGD.
- Natural gas fired boiler (thermal capacity 1,023 MW)
This boiler is rarely used. It is designed for quick start-ups. As a primary measure, special NOx burners are installed. As a secondary measure an SCR is installed. SOx abatement is not necessary due to the fact that low sulphur fuels are used.
Boilers without secondary measures show start-up emissions which are below the emissions under full load conditions. During start-ups boilers with secondary measures often show significantly higher SO2 emissions than during the same time under full load conditions. Start-up emissions are released until the secondary measures are working under optimal conditions (for
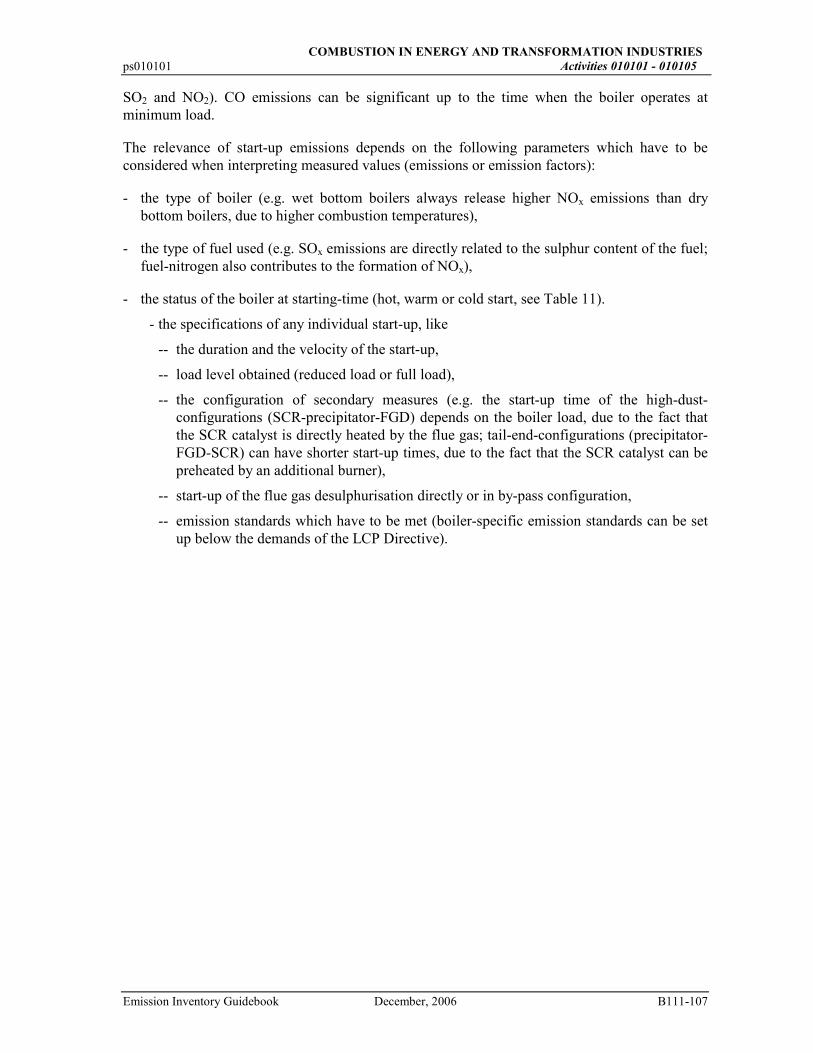
COMBUSTION IN ENERGY AND TRANSFORMATION INDUSTRIES ps010101 Activities 010101 - 010105
Emission Inventory Guidebook December, 2006 B111-107
SO2 and NO2). CO emissions can be significant up to the time when the boiler operates at minimum load.
The relevance of start-up emissions depends on the following parameters which have to be considered when interpreting measured values (emissions or emission factors):
- the type of boiler (e.g. wet bottom boilers always release higher NOx emissions than dry bottom boilers, due to higher combustion temperatures),
- the type of fuel used (e.g. SOx emissions are directly related to the sulphur content of the fuel; fuel-nitrogen also contributes to the formation of NOx),
- the status of the boiler at starting-time (hot, warm or cold start, see Table 11).
- the specifications of any individual start-up, like
-- the duration and the velocity of the start-up,
-- load level obtained (reduced load or full load),
-- the configuration of secondary measures (e.g. the start-up time of the high-dust-configurations (SCR-precipitator-FGD) depends on the boiler load, due to the fact that the SCR catalyst is directly heated by the flue gas; tail-end-configurations (precipitator-FGD-SCR) can have shorter start-up times, due to the fact that the SCR catalyst can be preheated by an additional burner),
-- start-up of the flue gas desulphurisation directly or in by-pass configuration,
-- emission standards which have to be met (boiler-specific emission standards can be set up below the demands of the LCP Directive).
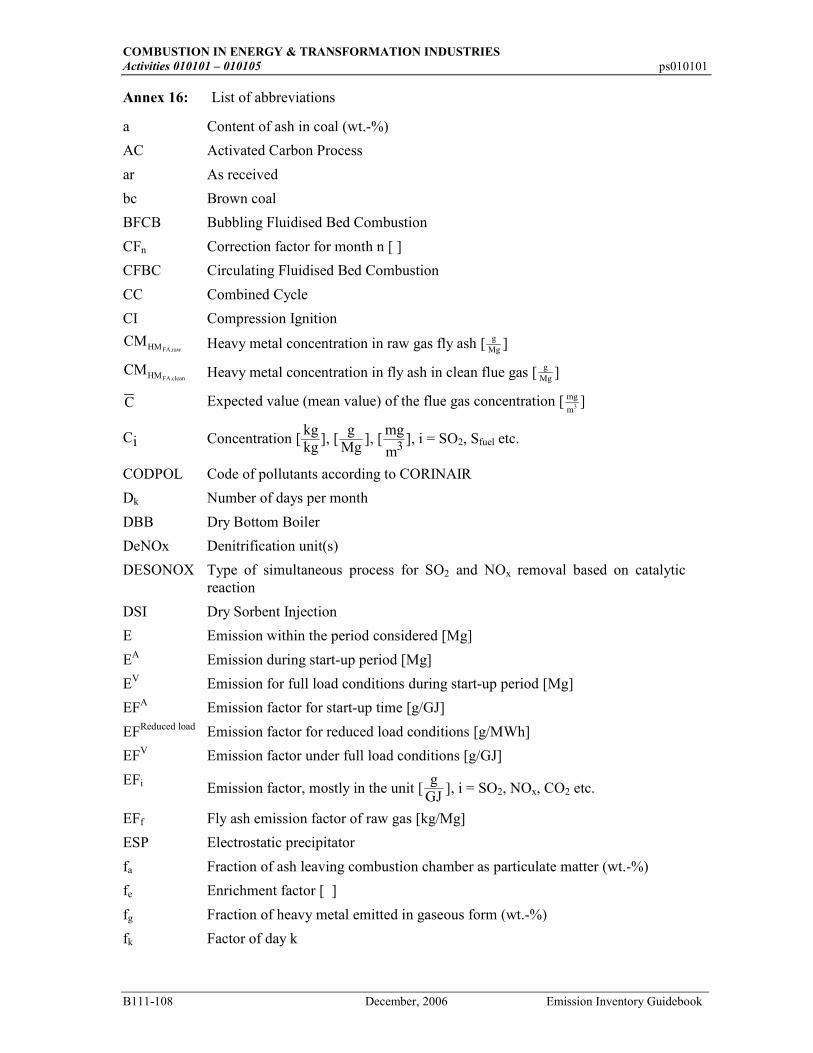
COMBUSTION IN ENERGY & TRANSFORMATION INDUSTRIES Activities 010101 – 010105 ps010101
B111-108 December, 2006 Emission Inventory Guidebook
Annex 16: List of abbreviations
a Content of ash in coal (wt.-%)
AC Activated Carbon Process
ar As received
bc Brown coal
BFCB Bubbling Fluidised Bed Combustion
CFn Correction factor for month n [ ]
CFBC Circulating Fluidised Bed Combustion
CC Combined Cycle
CI Compression Ignition
CMHMFA raw. Heavy metal concentration in raw gas fly ash [ g
Mg ]
CMHMFA clean. Heavy metal concentration in fly ash in clean flue gas [ g
Mg ]
C Expected value (mean value) of the flue gas concentration [ mg
m3 ]
Ci Concentration [kgkg
], [g
Mg], [
mg
m3 ], i = SO2, Sfuel etc.
CODPOL Code of pollutants according to CORINAIR
Dk Number of days per month
DBB Dry Bottom Boiler
DeNOx Denitrification unit(s)
DESONOX Type of simultaneous process for SO2 and NOx removal based on catalytic reaction
DSI Dry Sorbent Injection
E Emission within the period considered [Mg]
EA Emission during start-up period [Mg]
EV Emission for full load conditions during start-up period [Mg]
EFA Emission factor for start-up time [g/GJ]
EFReduced load Emission factor for reduced load conditions [g/MWh]
EFV Emission factor under full load conditions [g/GJ]
EFi Emission factor, mostly in the unit [g
GJ], i = SO2, NOx, CO2 etc.
EFf Fly ash emission factor of raw gas [kg/Mg]
ESP Electrostatic precipitator
fa Fraction of ash leaving combustion chamber as particulate matter (wt.-%)
fe Enrichment factor [ ]
fg Fraction of heavy metal emitted in gaseous form (wt.-%)
fk Factor of day k
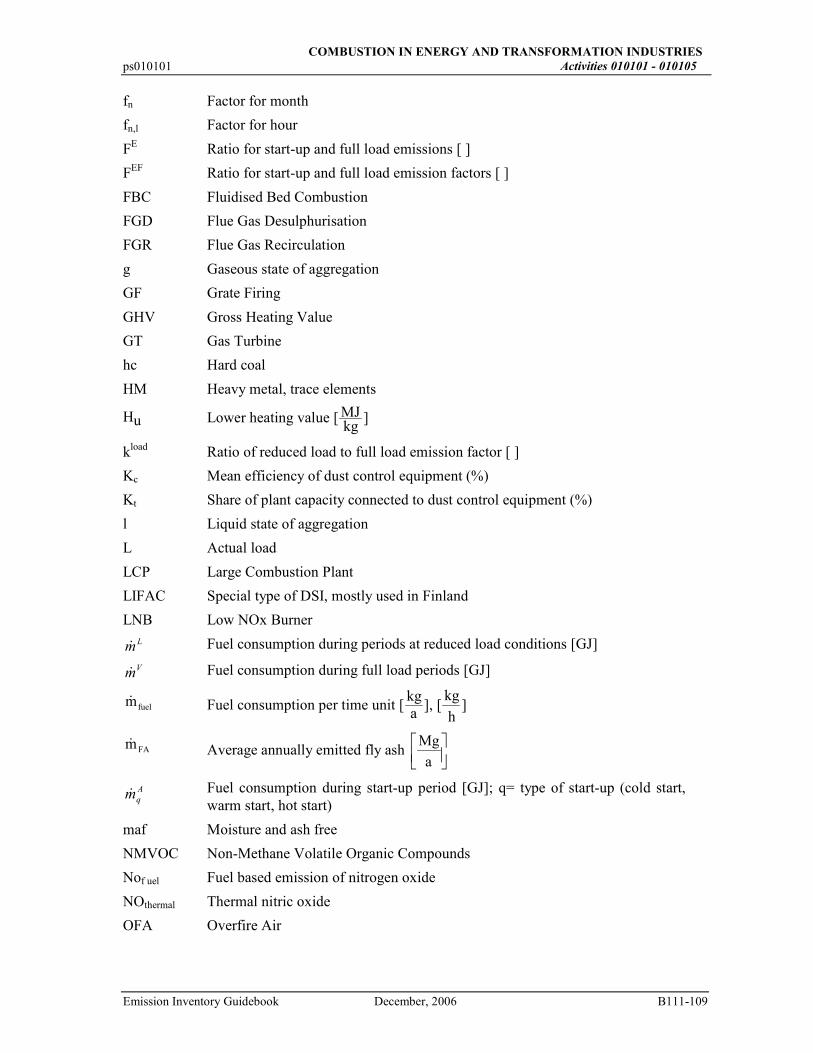
COMBUSTION IN ENERGY AND TRANSFORMATION INDUSTRIES ps010101 Activities 010101 - 010105
Emission Inventory Guidebook December, 2006 B111-109
fn Factor for month
fn,l Factor for hour
FE Ratio for start-up and full load emissions [ ]
FEF Ratio for start-up and full load emission factors [ ]
FBC Fluidised Bed Combustion
FGD Flue Gas Desulphurisation
FGR Flue Gas Recirculation
g Gaseous state of aggregation
GF Grate Firing
GHV Gross Heating Value
GT Gas Turbine
hc Hard coal
HM Heavy metal, trace elements
Hu Lower heating value [ MJkg
]
kload Ratio of reduced load to full load emission factor [ ]
Kc Mean efficiency of dust control equipment (%)
Kt Share of plant capacity connected to dust control equipment (%)
l Liquid state of aggregation
L Actual load
LCP Large Combustion Plant
LIFAC Special type of DSI, mostly used in Finland
LNB Low NOx Burner Lm& Fuel consumption during periods at reduced load conditions [GJ]
Vm& Fuel consumption during full load periods [GJ]
fuelm& Fuel consumption per time unit [kga
], [kg
h]
FAm& Average annually emitted fly ash
a
Mg
A
qm& Fuel consumption during start-up period [GJ]; q= type of start-up (cold start, warm start, hot start)
maf Moisture and ash free
NMVOC Non-Methane Volatile Organic Compounds
Nof uel Fuel based emission of nitrogen oxide
NOthermal Thermal nitric oxide
OFA Overfire Air
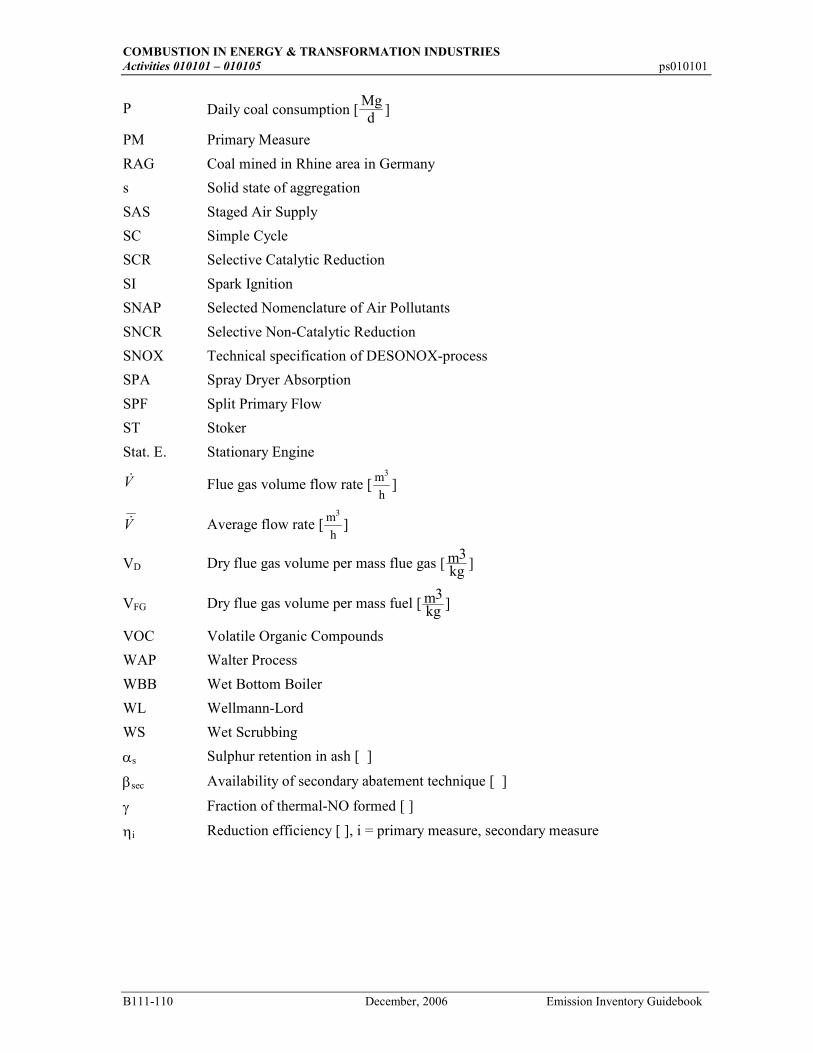
COMBUSTION IN ENERGY & TRANSFORMATION INDUSTRIES Activities 010101 – 010105 ps010101
B111-110 December, 2006 Emission Inventory Guidebook
P Daily coal consumption [Mgd
]
PM Primary Measure
RAG Coal mined in Rhine area in Germany
s Solid state of aggregation
SAS Staged Air Supply
SC Simple Cycle
SCR Selective Catalytic Reduction
SI Spark Ignition
SNAP Selected Nomenclature of Air Pollutants
SNCR Selective Non-Catalytic Reduction
SNOX Technical specification of DESONOX-process
SPA Spray Dryer Absorption
SPF Split Primary Flow
ST Stoker
Stat. E. Stationary Engine
V& Flue gas volume flow rate [ m
h
3
]
V& Average flow rate [ m
h
3
]
VD Dry flue gas volume per mass flue gas [ mkg
3]
VFG Dry flue gas volume per mass fuel [ mkg
3]
VOC Volatile Organic Compounds
WAP Walter Process
WBB Wet Bottom Boiler
WL Wellmann-Lord
WS Wet Scrubbing
αs Sulphur retention in ash [ ]
βsec Availability of secondary abatement technique [ ]
γ Fraction of thermal-NO formed [ ]
ηi Reduction efficiency [ ], i = primary measure, secondary measure

COMBUSTION IN ENERGY & TRANSFORMATION INDUSTRIES
Activities: Small Combustion Installations
Emission Inventory Guidebook December, 2006 B111(S1)-1
SNAP CODE: 010103
010203
020103
020202
020302
030103
SOURCE ACTIVITY TITLE: COMBUSTION IN ENERGY & TRANSFORMATION INDUSTRIES
Particulate emissions from smaller Combustion Plants
(<50MWth)
NOSE CODE: 101.03
NFR CODE: 1 A 1 a-c
1 A 2 a-f
1 A 4 a, bi, ci
ISIC 3510
1 ACTIVITIES INCLUDED
This chapter covers emissions of particulate matter released from smaller combustion
installations within the energy and transformation industries in boilers and furnaces with a
thermal capacity ≤ 50 MWth. Emissions of other pollutants from these sources can be found in
chapter B111. Note that Chapter B216 also includes some combustion technologies relevant to
the energy and transformation industries.
2 CONTRIBUTION TO TOTAL EMISSION
The contributions of PM10 and PM2.5 emissions released from combustion in small combustion
installations to total emissions in countries of the CORINAIR90 inventory is presented in Table
2.1.
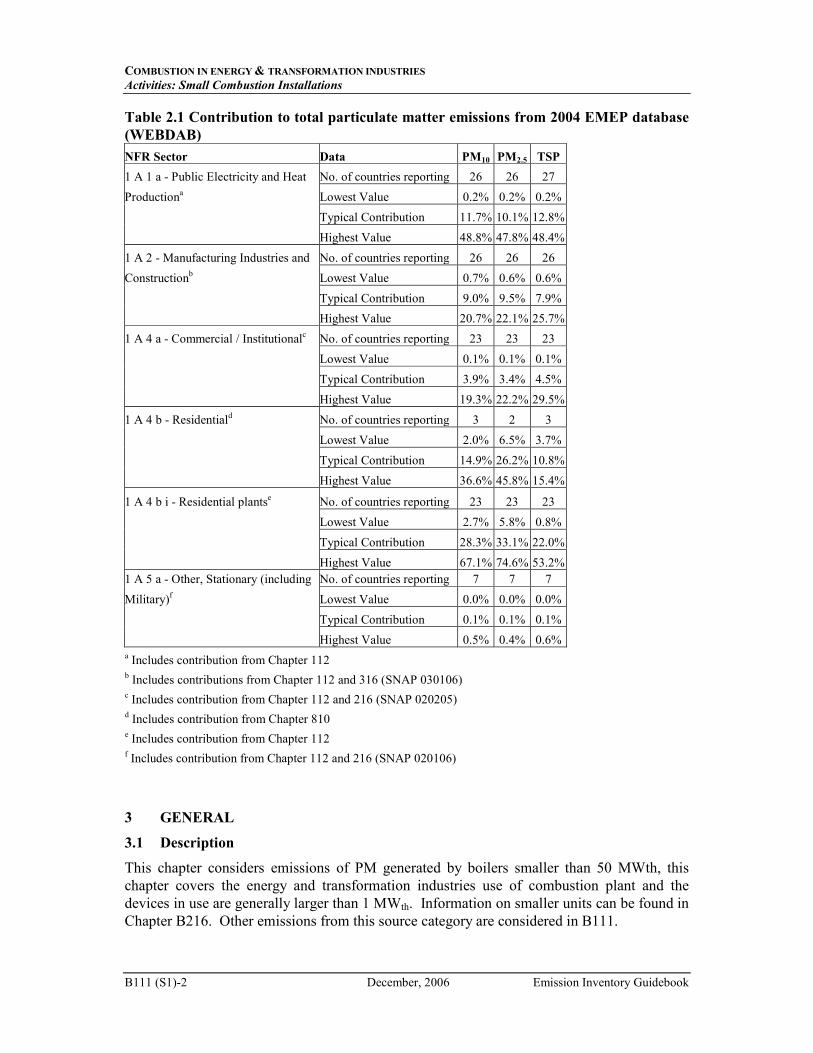
COMBUSTION IN ENERGY & TRANSFORMATION INDUSTRIES
Activities: Small Combustion Installations
B111 (S1)-2 December, 2006 Emission Inventory Guidebook
Table 2.1 Contribution to total particulate matter emissions from 2004 EMEP database
(WEBDAB)
NFR Sector Data PM10 PM2.5 TSP
1 A 1 a - Public Electricity and Heat No. of countries reporting 26 26 27
Productiona Lowest Value 0.2% 0.2% 0.2%
Typical Contribution 11.7% 10.1% 12.8%
Highest Value 48.8% 47.8% 48.4%
1 A 2 - Manufacturing Industries and No. of countries reporting 26 26 26
Constructionb Lowest Value 0.7% 0.6% 0.6%
Typical Contribution 9.0% 9.5% 7.9%
Highest Value 20.7% 22.1% 25.7%
1 A 4 a - Commercial / Institutionalc No. of countries reporting 23 23 23
Lowest Value 0.1% 0.1% 0.1%
Typical Contribution 3.9% 3.4% 4.5%
Highest Value 19.3% 22.2% 29.5%
1 A 4 b - Residentiald No. of countries reporting 3 2 3
Lowest Value 2.0% 6.5% 3.7%
Typical Contribution 14.9% 26.2% 10.8%
Highest Value 36.6% 45.8% 15.4%
1 A 4 b i - Residential plantse No. of countries reporting 23 23 23
Lowest Value 2.7% 5.8% 0.8%
Typical Contribution 28.3% 33.1% 22.0%
Highest Value 67.1% 74.6% 53.2%
1 A 5 a - Other, Stationary (including No. of countries reporting 7 7 7
Military)f Lowest Value 0.0% 0.0% 0.0%
Typical Contribution 0.1% 0.1% 0.1%
Highest Value 0.5% 0.4% 0.6%
a Includes contribution from Chapter 112 b Includes contributions from Chapter 112 and 316 (SNAP 030106) c Includes contribution from Chapter 112 and 216 (SNAP 020205) d Includes contribution from Chapter 810 e Includes contribution from Chapter 112 f Includes contribution from Chapter 112 and 216 (SNAP 020106)
3 GENERAL
3.1 Description
This chapter considers emissions of PM generated by boilers smaller than 50 MWth, this
chapter covers the energy and transformation industries use of combustion plant and the
devices in use are generally larger than 1 MWth. Information on smaller units can be found in
Chapter B216. Other emissions from this source category are considered in B111.
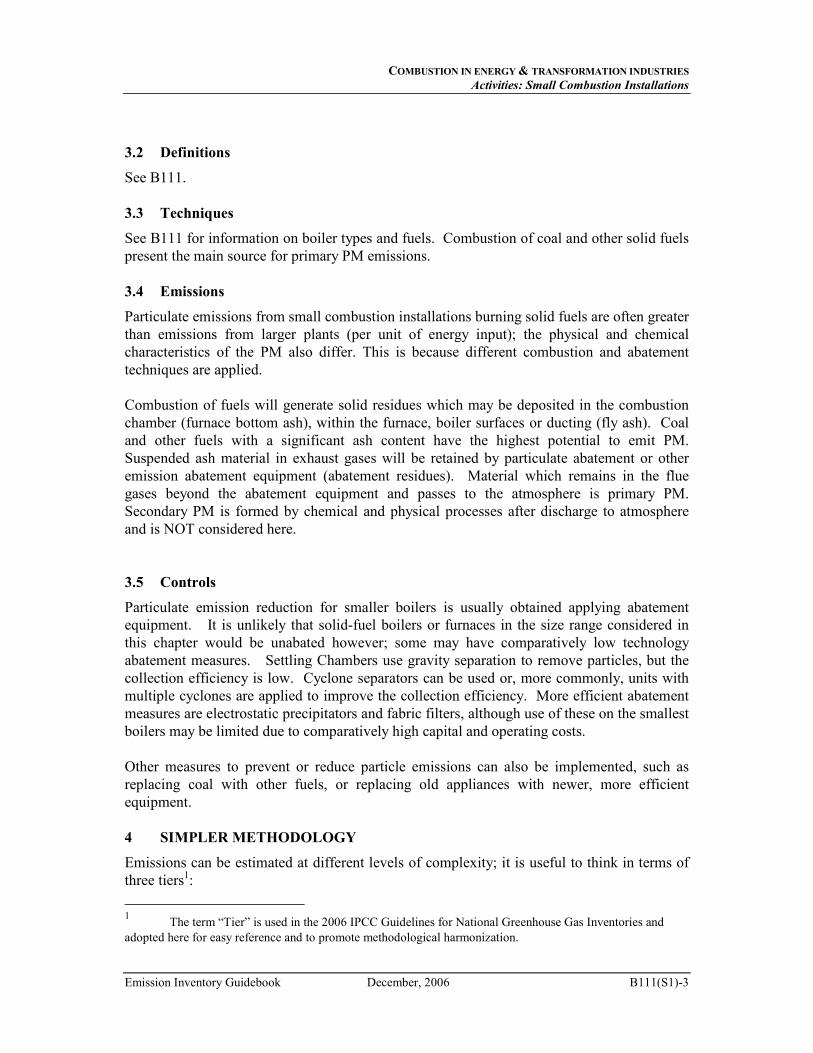
COMBUSTION IN ENERGY & TRANSFORMATION INDUSTRIES
Activities: Small Combustion Installations
Emission Inventory Guidebook December, 2006 B111(S1)-3
3.2 Definitions
See B111.
3.3 Techniques
See B111 for information on boiler types and fuels. Combustion of coal and other solid fuels
present the main source for primary PM emissions.
3.4 Emissions
Particulate emissions from small combustion installations burning solid fuels are often greater
than emissions from larger plants (per unit of energy input); the physical and chemical
characteristics of the PM also differ. This is because different combustion and abatement
techniques are applied.
Combustion of fuels will generate solid residues which may be deposited in the combustion
chamber (furnace bottom ash), within the furnace, boiler surfaces or ducting (fly ash). Coal
and other fuels with a significant ash content have the highest potential to emit PM.
Suspended ash material in exhaust gases will be retained by particulate abatement or other
emission abatement equipment (abatement residues). Material which remains in the flue
gases beyond the abatement equipment and passes to the atmosphere is primary PM.
Secondary PM is formed by chemical and physical processes after discharge to atmosphere
and is NOT considered here.
3.5 Controls
Particulate emission reduction for smaller boilers is usually obtained applying abatement
equipment. It is unlikely that solid-fuel boilers or furnaces in the size range considered in
this chapter would be unabated however; some may have comparatively low technology
abatement measures. Settling Chambers use gravity separation to remove particles, but the
collection efficiency is low. Cyclone separators can be used or, more commonly, units with
multiple cyclones are applied to improve the collection efficiency. More efficient abatement
measures are electrostatic precipitators and fabric filters, although use of these on the smallest
boilers may be limited due to comparatively high capital and operating costs.
Other measures to prevent or reduce particle emissions can also be implemented, such as
replacing coal with other fuels, or replacing old appliances with newer, more efficient
equipment.
4 SIMPLER METHODOLOGY
Emissions can be estimated at different levels of complexity; it is useful to think in terms of
three tiers1:
1 The term “Tier” is used in the 2006 IPCC Guidelines for National Greenhouse Gas Inventories and
adopted here for easy reference and to promote methodological harmonization.
COMBUSTION IN ENERGY & TRANSFORMATION INDUSTRIES
Activities: Small Combustion Installations
B111 (S1)-4 December, 2006 Emission Inventory Guidebook
Tier 1: a method using readily available statistical data on the intensity of processes
(“activity rates”) and default emission factors. These emission factors assume a
linear relation between the intensity of the process and the resulting emissions.
The Tier 1 default emission factors also assume an average or typical process
description.
Tier 2: is similar to Tier 1 but uses more specific emission factors developed on the
basis of knowledge of the types of processes and specific process conditions
that apply in the country for which the inventory is being developed.
Tier 3: is any method that goes beyond the above methods. These might include the
use of more detailed activity information, specific abatement strategies or other
relevant technical information.
By moving from a lower to a higher Tier it is expected that the resulting emission estimate
will be more precise and will have a lower uncertainty. Higher Tier methods will need more
input data and therefore will require more effort to implement.
For the Tier 1 simpler methodology, where limited information is available, a default
emission factor can be used together with production capacity information for the country or
region of interest without further specification on the type of industrial technology or the type
and efficiency of control equipment. For a Tier 2 approach an approximation to the most
appropriate technology factors can be adopted with potential, if more detailed activity data are
available, for use of default sector or technology factors.
Consequently the simplest methodology (Tier 1) is to combine an activity rate (AR) with a
comparable, representative, value of the emissions per unit activity, the emission factors (EF).
The basic equation is:
Emission = AR x EF
In the energy sector, for example, fuel consumption would be activity data and mass of
material emitted per unit of fuel consumed would be a compatible emission factor.
NOTE: The basic equation may be modified, in some circumstances, to include emission
reduction efficiency (abatement factors).
The Tier 2 methodology is a modified version of this basic equation :
Emission = ∑((AR1 x EF1) + (AR2 x EF2) +….(ARn x EFn))
Default emission factors for this purpose are provided in Sections 8.1 and 8.2.
COMBUSTION IN ENERGY & TRANSFORMATION INDUSTRIES
Activities: Small Combustion Installations
Emission Inventory Guidebook December, 2006 B111(S1)-5
5 DETAILED METHODOLOGY
The detailed methodology (equivalent to Tier 3) to estimate emissions of pollutants from
combustion plant <50 MWth is based on measurements or estimations using plant specific
emission factors for the types of plant and technologies used within the country - guidance on
determining plant specific emission factors is given in the Measurement Protocol Annex.
The recommended detailed methodology to estimate emissions of PM from combustion
activities is based on measurements and/or estimations using technology-specific emission
factors.
Information on the type of the process and activity data, for example combustion and
abatement technologies, is required to assign appropriate emission factors.
Reference emission factors for comparison with users’ own data are provided in Section 8.2.
6 ACTIVITY STATISTICS
Activity statistics for fuel consumption in industry sectors for estimating emissions using the
simpler estimation methodology (Tiers 1 and 2) are usually derived from national statistics.
However, data on fuel use by smaller combustion plant within industry sectors may not be
readily available. However, fuel suppliers, regulators and individual operators may be able to
provide some data and other information may be available through relevant surveys, energy
modelling and other studies.
The detailed methodology (Tier 3) requires more detailed information such as the amount and
types of fuel consumed and the type of installation it is used in. However, the large number
of plant in most countries will be a constraint on a Tier 3 approach and these data are not
always easily available.
Further guidance is provided in the 2006 IPCC Guidelines for National Greenhouse Gas
Inventories, volume 2 on energy, Chapter 1.
7 POINT SOURCE CRITERIA
The largest boilers may be considered point sources if plant specific data are available
however; in general, this chapter covers area sources only.
8 EMISSION FACTORS, QUALITY CODES AND REFERENCES
8.1 Default Emission Factors For Use With Simpler Methodology (Tier 1)
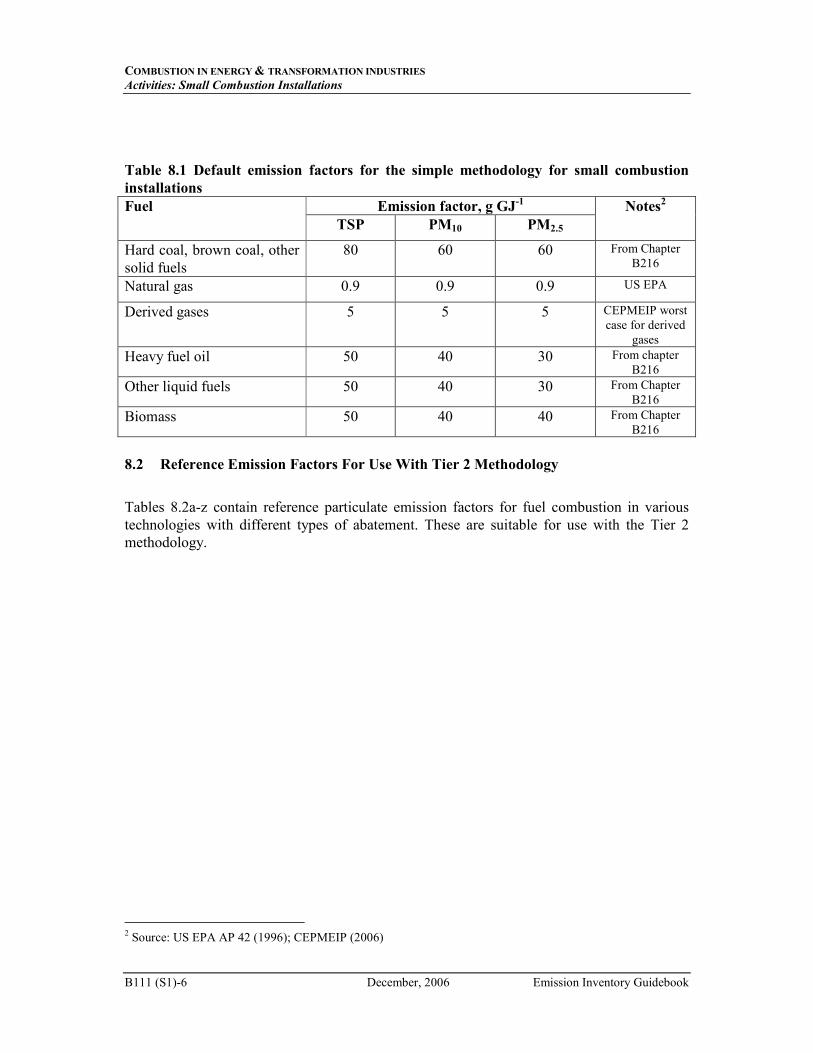
COMBUSTION IN ENERGY & TRANSFORMATION INDUSTRIES
Activities: Small Combustion Installations
B111 (S1)-6 December, 2006 Emission Inventory Guidebook
Table 8.1 Default emission factors for the simple methodology for small combustion
installations
Fuel Emission factor, g GJ-1 Notes2
TSP PM10 PM2.5
Hard coal, brown coal, other
solid fuels
80 60 60 From Chapter
B216
Natural gas 0.9
0.9 0.9 US EPA
Derived gases 5 5 5 CEPMEIP worst
case for derived
gases
Heavy fuel oil 50 40 30 From chapter
B216
Other liquid fuels 50 40 30 From Chapter
B216
Biomass 50 40 40 From Chapter
B216
8.2 Reference Emission Factors For Use With Tier 2 Methodology
Tables 8.2a-z contain reference particulate emission factors for fuel combustion in various
technologies with different types of abatement. These are suitable for use with the Tier 2
methodology.
2 Source: US EPA AP 42 (1996); CEPMEIP (2006)
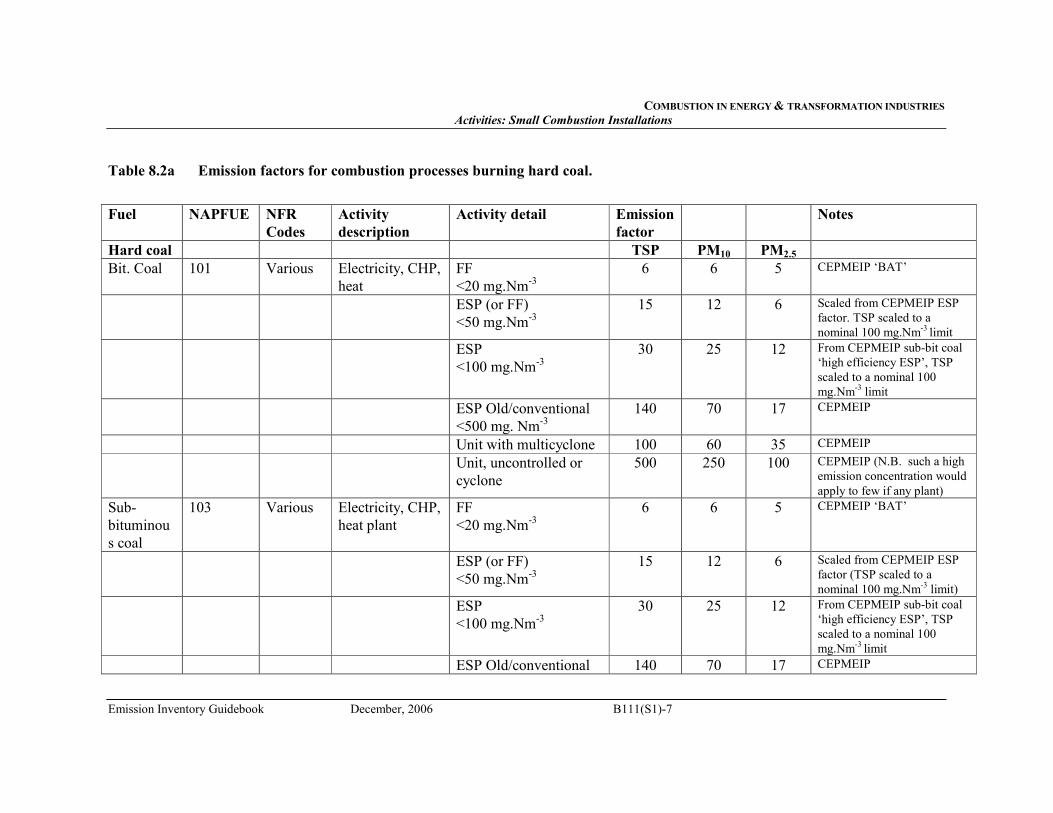
COMBUSTION IN ENERGY & TRANSFORMATION INDUSTRIES
Activities: Small Combustion Installations
Emission Inventory Guidebook December, 2006 B111(S1)-7
Table 8.2a Emission factors for combustion processes burning hard coal.
Fuel
NAPFUE NFR
Codes
Activity
description
Activity detail Emission
factor
Notes
Hard coal TSP PM10 PM2.5
Bit. Coal 101 Various Electricity, CHP,
heat
FF
<20 mg.Nm-3
6 6 5 CEPMEIP ‘BAT’
ESP (or FF)
<50 mg.Nm-3
15 12 6 Scaled from CEPMEIP ESP
factor. TSP scaled to a
nominal 100 mg.Nm-3 limit
ESP
<100 mg.Nm-3
30 25 12 From CEPMEIP sub-bit coal
‘high efficiency ESP’, TSP
scaled to a nominal 100
mg.Nm-3 limit
ESP Old/conventional
<500 mg. Nm-3
140 70 17 CEPMEIP
Unit with multicyclone 100 60 35 CEPMEIP
Unit, uncontrolled or
cyclone
500 250 100 CEPMEIP (N.B. such a high
emission concentration would
apply to few if any plant)
Sub-
bituminou
s coal
103 Various Electricity, CHP,
heat plant
FF
<20 mg.Nm-3
6 6 5 CEPMEIP ‘BAT’
ESP (or FF)
<50 mg.Nm-3
15 12 6 Scaled from CEPMEIP ESP
factor (TSP scaled to a
nominal 100 mg.Nm-3 limit)
ESP
<100 mg.Nm-3
30 25 12 From CEPMEIP sub-bit coal
‘high efficiency ESP’, TSP
scaled to a nominal 100
mg.Nm-3 limit
ESP Old/conventional 140 70 17 CEPMEIP
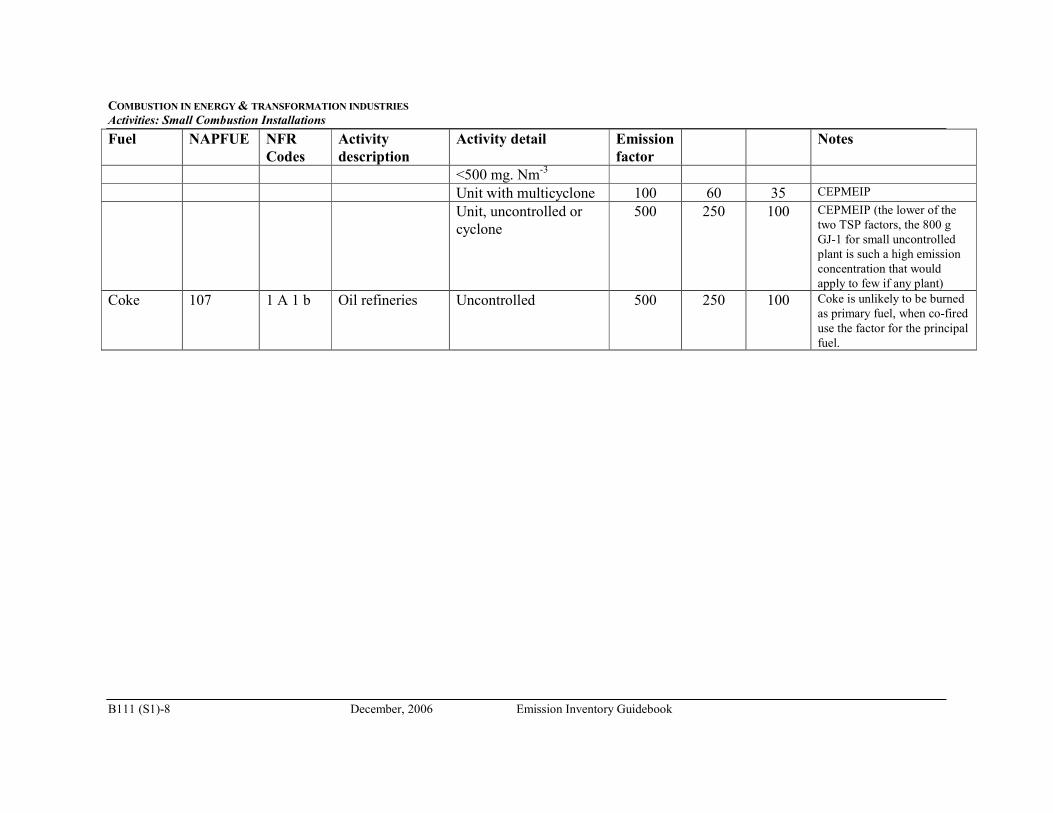
COMBUSTION IN ENERGY & TRANSFORMATION INDUSTRIES
Activities: Small Combustion Installations
B111 (S1)-8 December, 2006 Emission Inventory Guidebook
Fuel
NAPFUE NFR
Codes
Activity
description
Activity detail Emission
factor
Notes
<500 mg. Nm-3
Unit with multicyclone 100 60 35 CEPMEIP
Unit, uncontrolled or
cyclone
500 250 100 CEPMEIP (the lower of the
two TSP factors, the 800 g
GJ-1 for small uncontrolled
plant is such a high emission
concentration that would
apply to few if any plant)
Coke 107 1 A 1 b Oil refineries Uncontrolled 500 250 100 Coke is unlikely to be burned
as primary fuel, when co-fired
use the factor for the principal
fuel.
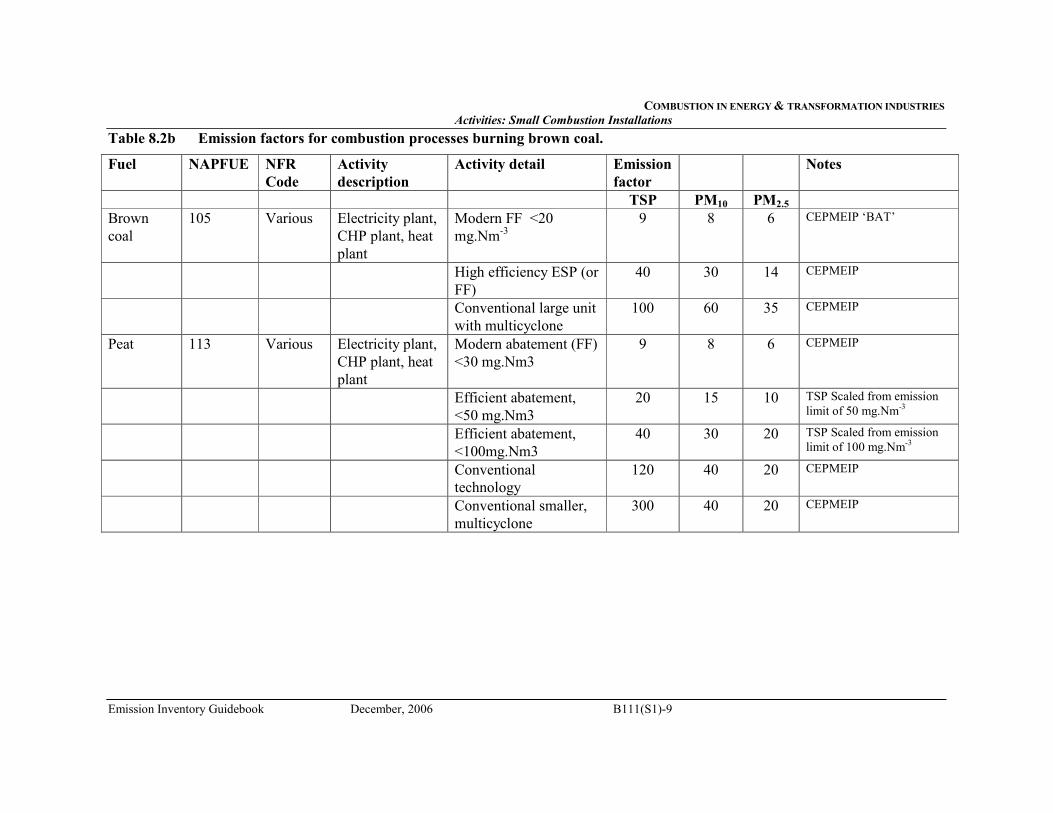
COMBUSTION IN ENERGY & TRANSFORMATION INDUSTRIES
Activities: Small Combustion Installations
Emission Inventory Guidebook December, 2006 B111(S1)-9
Table 8.2b Emission factors for combustion processes burning brown coal.
Fuel
NAPFUE NFR
Code
Activity
description
Activity detail Emission
factor
Notes
TSP PM10 PM2.5
Brown
coal
105 Various Electricity plant,
CHP plant, heat
plant
Modern FF <20
mg.Nm-3
9 8 6 CEPMEIP ‘BAT’
High efficiency ESP (or
FF)
40 30 14 CEPMEIP
Conventional large unit
with multicyclone
100 60 35 CEPMEIP
Peat 113 Various Electricity plant,
CHP plant, heat
plant
Modern abatement (FF)
<30 mg.Nm3
9 8 6 CEPMEIP
Efficient abatement,
<50 mg.Nm3
20 15 10 TSP Scaled from emission
limit of 50 mg.Nm-3
Efficient abatement,
<100mg.Nm3
40 30 20 TSP Scaled from emission
limit of 100 mg.Nm-3
Conventional
technology
120 40 20 CEPMEIP
Conventional smaller,
multicyclone
300 40 20 CEPMEIP
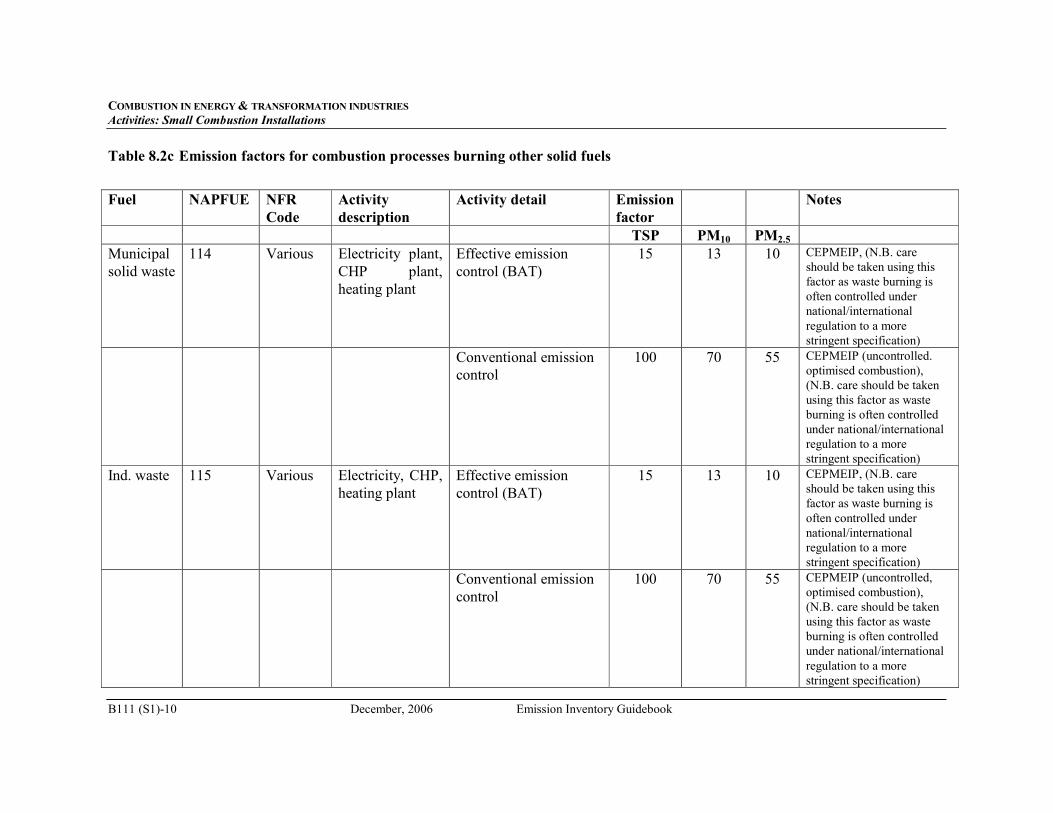
COMBUSTION IN ENERGY & TRANSFORMATION INDUSTRIES
Activities: Small Combustion Installations
B111 (S1)-10 December, 2006 Emission Inventory Guidebook
Table 8.2c Emission factors for combustion processes burning other solid fuels
Fuel
NAPFUE NFR
Code
Activity
description
Activity detail Emission
factor
Notes
TSP PM10 PM2.5
Municipal
solid waste
114 Various Electricity plant,
CHP plant,
heating plant
Effective emission
control (BAT)
15 13 10 CEPMEIP, (N.B. care
should be taken using this
factor as waste burning is
often controlled under
national/international
regulation to a more
stringent specification)
Conventional emission
control
100 70 55 CEPMEIP (uncontrolled.
optimised combustion),
(N.B. care should be taken
using this factor as waste
burning is often controlled
under national/international
regulation to a more
stringent specification)
Ind. waste 115 Various Electricity, CHP,
heating plant
Effective emission
control (BAT)
15 13 10 CEPMEIP, (N.B. care
should be taken using this
factor as waste burning is
often controlled under
national/international
regulation to a more
stringent specification)
Conventional emission
control
100 70 55 CEPMEIP (uncontrolled,
optimised combustion),
(N.B. care should be taken
using this factor as waste
burning is often controlled
under national/international
regulation to a more
stringent specification)
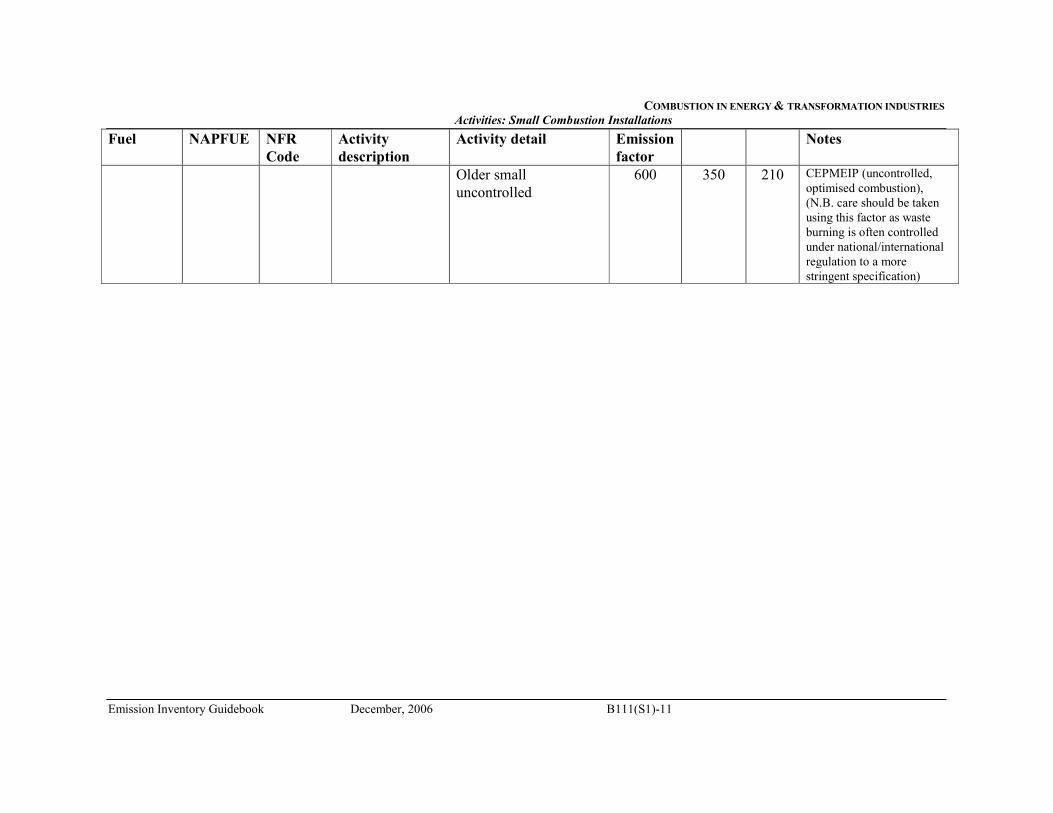
COMBUSTION IN ENERGY & TRANSFORMATION INDUSTRIES
Activities: Small Combustion Installations
Emission Inventory Guidebook December, 2006 B111(S1)-11
Fuel
NAPFUE NFR
Code
Activity
description
Activity detail Emission
factor
Notes
Older small
uncontrolled
600 350 210 CEPMEIP (uncontrolled,
optimised combustion),
(N.B. care should be taken
using this factor as waste
burning is often controlled
under national/international
regulation to a more
stringent specification)
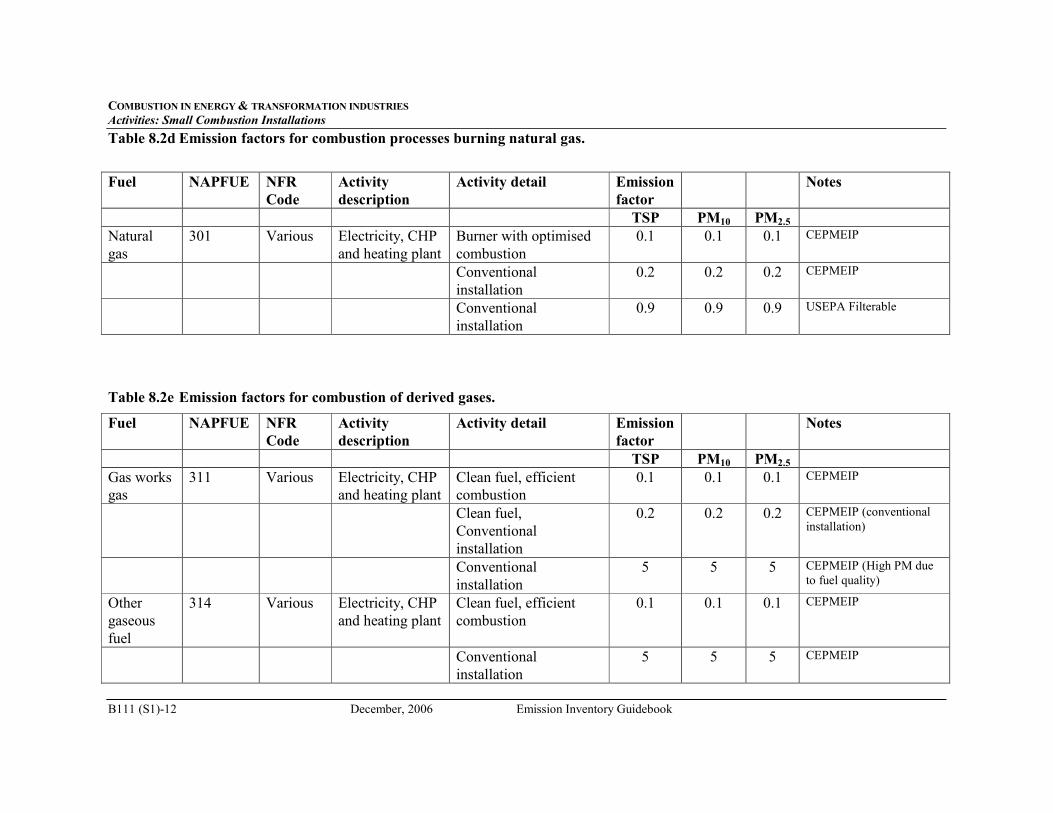
COMBUSTION IN ENERGY & TRANSFORMATION INDUSTRIES
Activities: Small Combustion Installations
B111 (S1)-12 December, 2006 Emission Inventory Guidebook
Table 8.2d Emission factors for combustion processes burning natural gas.
Fuel
NAPFUE NFR
Code
Activity
description
Activity detail Emission
factor
Notes
TSP PM10 PM2.5
Natural
gas
301 Various Electricity, CHP
and heating plant
Burner with optimised
combustion
0.1 0.1 0.1 CEPMEIP
Conventional
installation
0.2 0.2 0.2 CEPMEIP
Conventional
installation
0.9 0.9 0.9 USEPA Filterable
Table 8.2e Emission factors for combustion of derived gases.
Fuel
NAPFUE NFR
Code
Activity
description
Activity detail Emission
factor
Notes
TSP PM10 PM2.5
Gas works
gas
311 Various Electricity, CHP
and heating plant
Clean fuel, efficient
combustion
0.1 0.1 0.1 CEPMEIP
Clean fuel,
Conventional
installation
0.2 0.2 0.2 CEPMEIP (conventional
installation)
Conventional
installation
5 5 5 CEPMEIP (High PM due
to fuel quality)
Other
gaseous
fuel
314 Various Electricity, CHP
and heating plant
Clean fuel, efficient
combustion
0.1 0.1 0.1 CEPMEIP
Conventional
installation
5 5 5 CEPMEIP
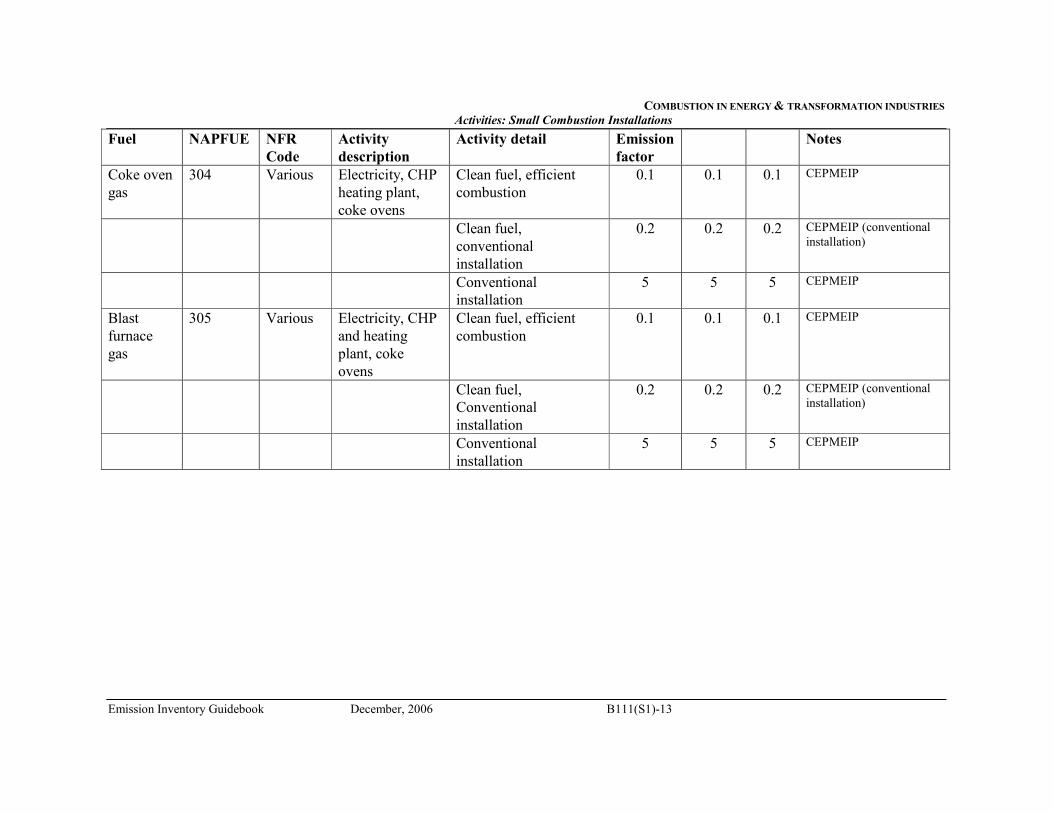
COMBUSTION IN ENERGY & TRANSFORMATION INDUSTRIES
Activities: Small Combustion Installations
Emission Inventory Guidebook December, 2006 B111(S1)-13
Fuel
NAPFUE NFR
Code
Activity
description
Activity detail Emission
factor
Notes
Coke oven
gas
304 Various Electricity, CHP
heating plant,
coke ovens
Clean fuel, efficient
combustion
0.1 0.1 0.1 CEPMEIP
Clean fuel,
conventional
installation
0.2 0.2 0.2 CEPMEIP (conventional
installation)
Conventional
installation
5 5 5 CEPMEIP
Blast
furnace
gas
305 Various Electricity, CHP
and heating
plant, coke
ovens
Clean fuel, efficient
combustion
0.1 0.1 0.1 CEPMEIP
Clean fuel,
Conventional
installation
0.2 0.2 0.2 CEPMEIP (conventional
installation)
Conventional
installation
5 5 5 CEPMEIP
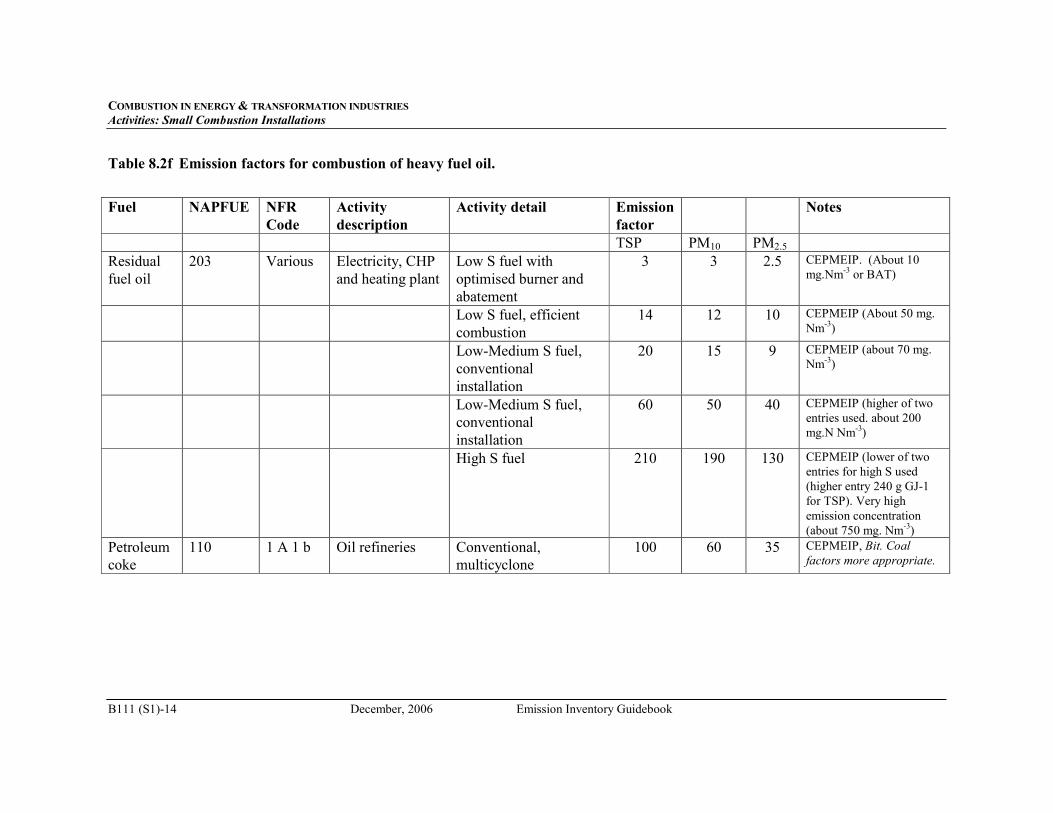
COMBUSTION IN ENERGY & TRANSFORMATION INDUSTRIES
Activities: Small Combustion Installations
B111 (S1)-14 December, 2006 Emission Inventory Guidebook
Table 8.2f Emission factors for combustion of heavy fuel oil.
Fuel
NAPFUE NFR
Code
Activity
description
Activity detail Emission
factor
Notes
TSP PM10 PM2.5
Residual
fuel oil
203 Various Electricity, CHP
and heating plant
Low S fuel with
optimised burner and
abatement
3 3 2.5 CEPMEIP. (About 10
mg.Nm-3 or BAT)
Low S fuel, efficient
combustion
14 12 10 CEPMEIP (About 50 mg.
Nm-3)
Low-Medium S fuel,
conventional
installation
20 15 9 CEPMEIP (about 70 mg.
Nm-3)
Low-Medium S fuel,
conventional
installation
60 50 40 CEPMEIP (higher of two
entries used. about 200
mg.N Nm-3)
High S fuel 210 190 130 CEPMEIP (lower of two
entries for high S used
(higher entry 240 g GJ-1
for TSP). Very high
emission concentration
(about 750 mg. Nm-3)
Petroleum
coke
110 1 A 1 b Oil refineries Conventional,
multicyclone
100 60 35 CEPMEIP, Bit. Coal
factors more appropriate.
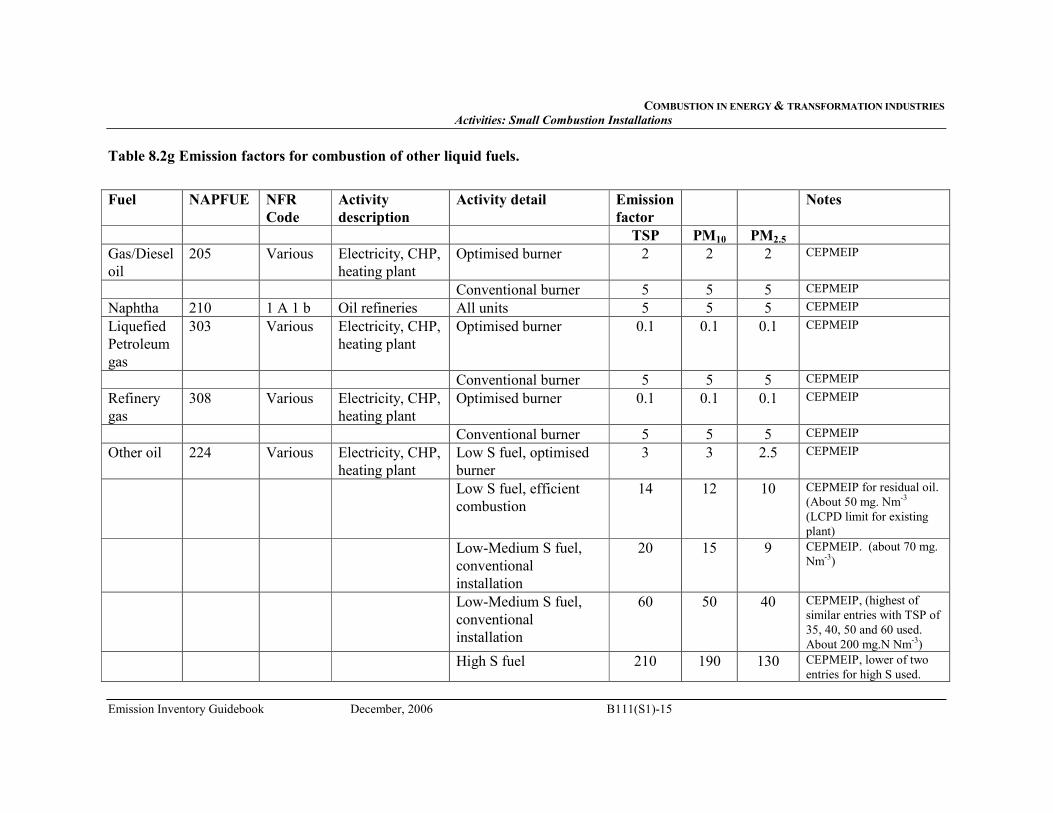
COMBUSTION IN ENERGY & TRANSFORMATION INDUSTRIES
Activities: Small Combustion Installations
Emission Inventory Guidebook December, 2006 B111(S1)-15
Table 8.2g Emission factors for combustion of other liquid fuels.
Fuel
NAPFUE NFR
Code
Activity
description
Activity detail Emission
factor
Notes
TSP PM10 PM2.5
Gas/Diesel
oil
205 Various Electricity, CHP,
heating plant
Optimised burner 2 2 2 CEPMEIP
Conventional burner 5 5 5 CEPMEIP
Naphtha 210 1 A 1 b Oil refineries All units 5 5 5 CEPMEIP
Liquefied
Petroleum
gas
303 Various Electricity, CHP,
heating plant
Optimised burner 0.1 0.1 0.1 CEPMEIP
Conventional burner 5 5 5 CEPMEIP
Refinery
gas
308 Various Electricity, CHP,
heating plant
Optimised burner 0.1 0.1 0.1 CEPMEIP
Conventional burner 5 5 5 CEPMEIP
Other oil 224 Various Electricity, CHP,
heating plant
Low S fuel, optimised
burner
3 3 2.5 CEPMEIP
Low S fuel, efficient
combustion
14 12 10 CEPMEIP for residual oil.
(About 50 mg. Nm-3
(LCPD limit for existing
plant)
Low-Medium S fuel,
conventional
installation
20 15 9 CEPMEIP. (about 70 mg.
Nm-3)
Low-Medium S fuel,
conventional
installation
60 50 40 CEPMEIP, (highest of
similar entries with TSP of
35, 40, 50 and 60 used.
About 200 mg.N Nm-3)
High S fuel 210 190 130 CEPMEIP, lower of two
entries for high S used.
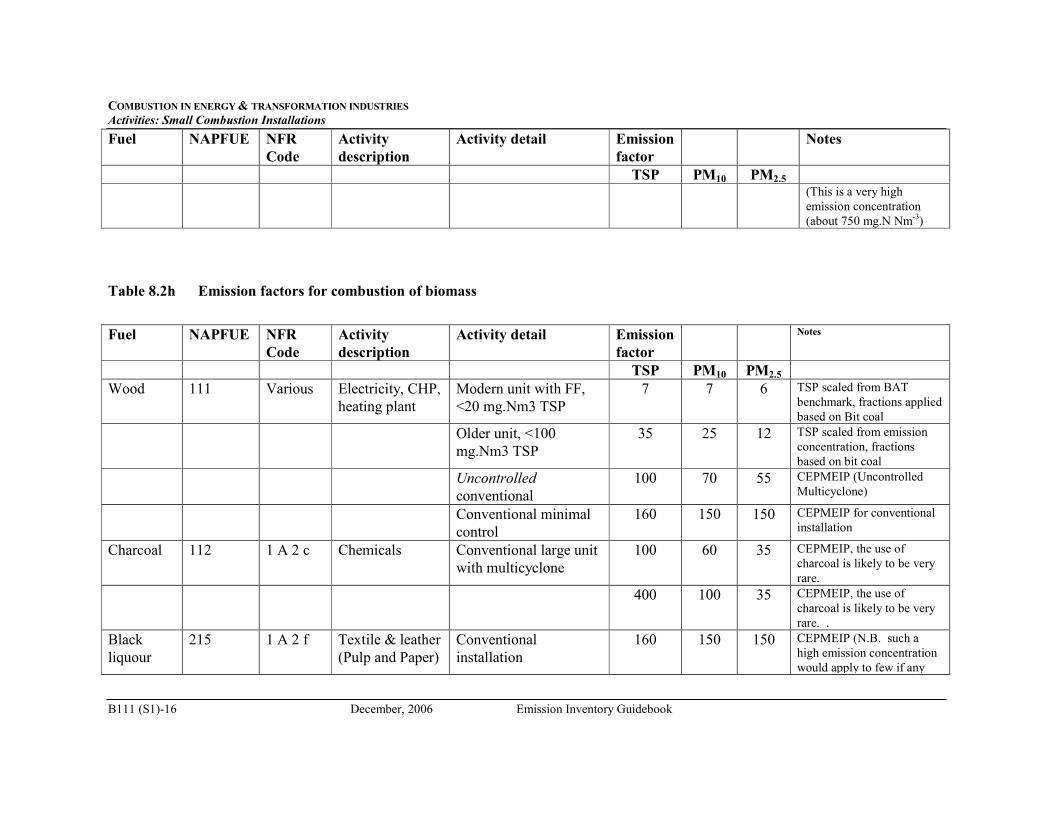
COMBUSTION IN ENERGY & TRANSFORMATION INDUSTRIES
Activities: Small Combustion Installations
B111 (S1)-16 December, 2006 Emission Inventory Guidebook
Fuel
NAPFUE NFR
Code
Activity
description
Activity detail Emission
factor
Notes
TSP PM10 PM2.5 (This is a very high
emission concentration
(about 750 mg.N Nm-3)
Table 8.2h Emission factors for combustion of biomass
Fuel
NAPFUE NFR
Code
Activity
description
Activity detail Emission
factor
Notes
TSP PM10 PM2.5
Wood 111 Various Electricity, CHP,
heating plant
Modern unit with FF,
<20 mg.Nm3 TSP
7 7 6 TSP scaled from BAT
benchmark, fractions applied
based on Bit coal
Older unit, <100
mg.Nm3 TSP
35 25 12 TSP scaled from emission
concentration, fractions
based on bit coal
Uncontrolled
conventional
100 70 55 CEPMEIP (Uncontrolled
Multicyclone)
Conventional minimal
control
160 150 150 CEPMEIP for conventional
installation
Charcoal 112 1 A 2 c Chemicals Conventional large unit
with multicyclone
100 60 35 CEPMEIP, the use of
charcoal is likely to be very
rare.
400 100 35 CEPMEIP, the use of
charcoal is likely to be very
rare. .
Black
liquour
215 1 A 2 f Textile & leather
(Pulp and Paper)
Conventional
installation
160 150 150 CEPMEIP (N.B. such a
high emission concentration
would apply to few if any
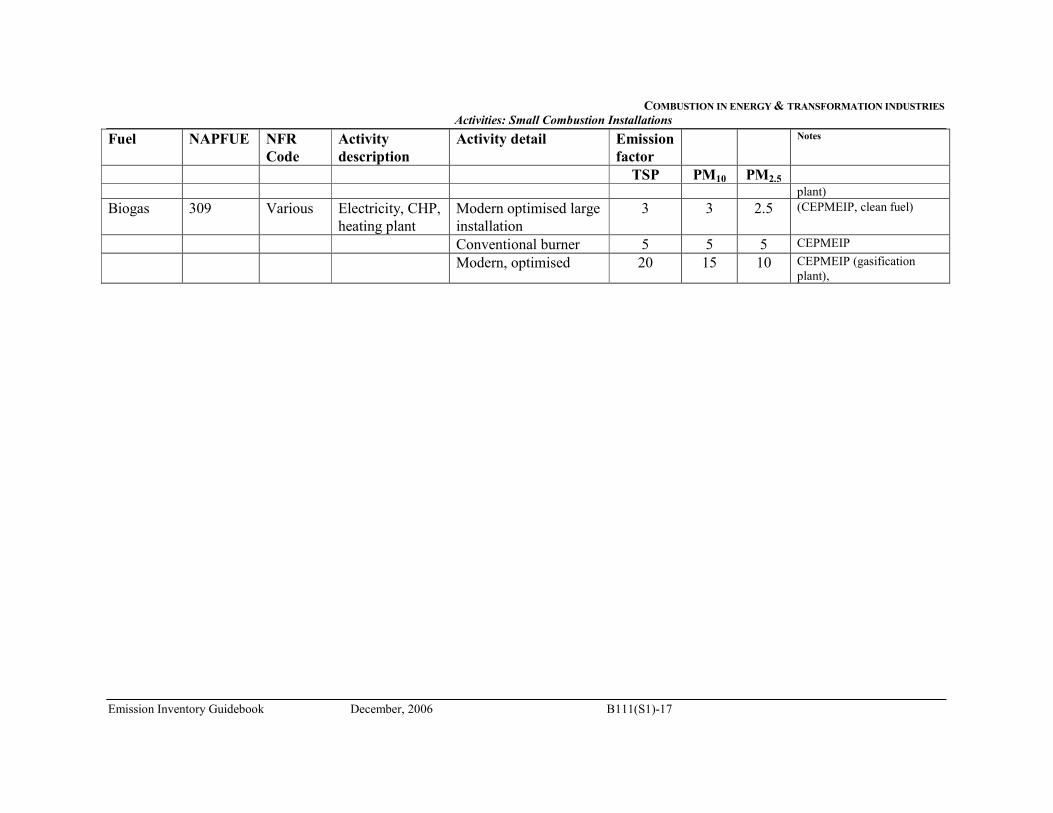
COMBUSTION IN ENERGY & TRANSFORMATION INDUSTRIES
Activities: Small Combustion Installations
Emission Inventory Guidebook December, 2006 B111(S1)-17
Fuel
NAPFUE NFR
Code
Activity
description
Activity detail Emission
factor
Notes
TSP PM10 PM2.5
plant)
Biogas 309 Various Electricity, CHP,
heating plant
Modern optimised large
installation
3 3 2.5 (CEPMEIP, clean fuel)
Conventional burner 5 5 5 CEPMEIP
Modern, optimised 20 15 10 CEPMEIP (gasification
plant),
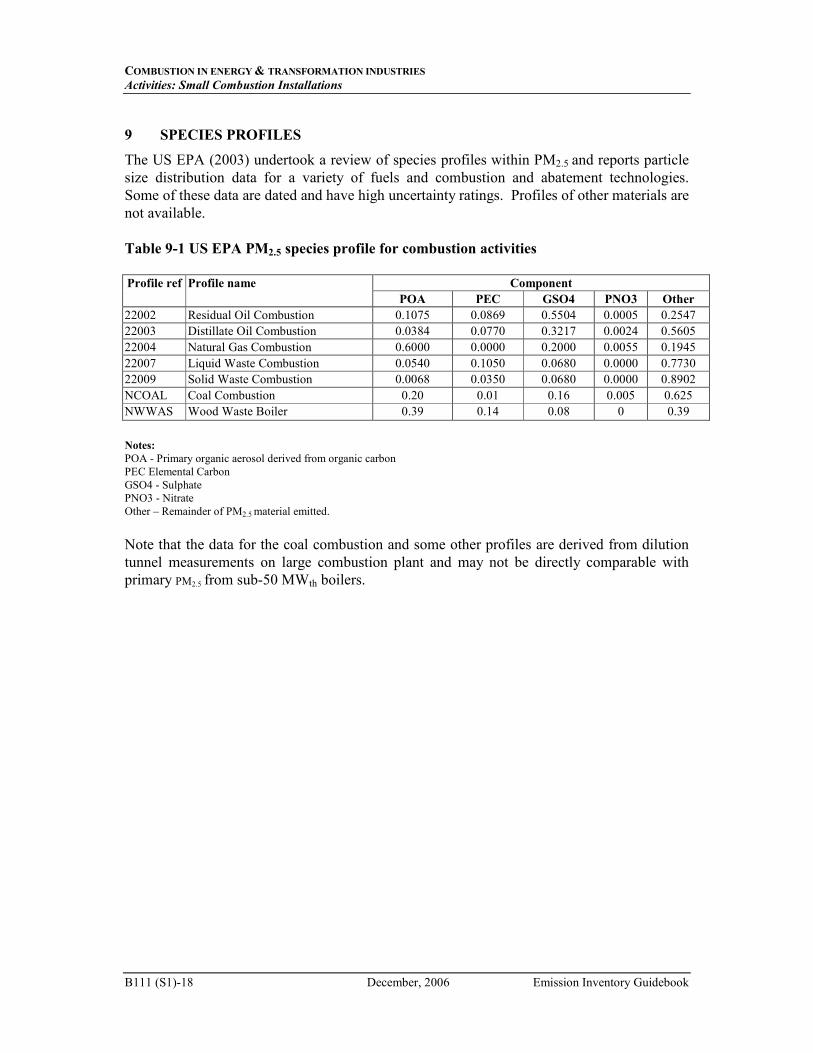
COMBUSTION IN ENERGY & TRANSFORMATION INDUSTRIES
Activities: Small Combustion Installations
B111 (S1)-18 December, 2006 Emission Inventory Guidebook
9 SPECIES PROFILES
The US EPA (2003) undertook a review of species profiles within PM2.5 and reports particle
size distribution data for a variety of fuels and combustion and abatement technologies.
Some of these data are dated and have high uncertainty ratings. Profiles of other materials are
not available.
Table 9-1 US EPA PM2.5 species profile for combustion activities
Profile ref Profile name Component
POA PEC GSO4 PNO3 Other
22002 Residual Oil Combustion 0.1075 0.0869 0.5504 0.0005 0.2547
22003 Distillate Oil Combustion 0.0384 0.0770 0.3217 0.0024 0.5605
22004 Natural Gas Combustion 0.6000 0.0000 0.2000 0.0055 0.1945
22007 Liquid Waste Combustion 0.0540 0.1050 0.0680 0.0000 0.7730
22009 Solid Waste Combustion 0.0068 0.0350 0.0680 0.0000 0.8902
NCOAL Coal Combustion 0.20 0.01 0.16 0.005 0.625
NWWAS Wood Waste Boiler 0.39 0.14 0.08 0 0.39
Notes:
POA - Primary organic aerosol derived from organic carbon
PEC Elemental Carbon
GSO4 - Sulphate
PNO3 - Nitrate
Other – Remainder of PM2.5 material emitted.
Note that the data for the coal combustion and some other profiles are derived from dilution
tunnel measurements on large combustion plant and may not be directly comparable with
primary PM2.5 from sub-50 MWth boilers.
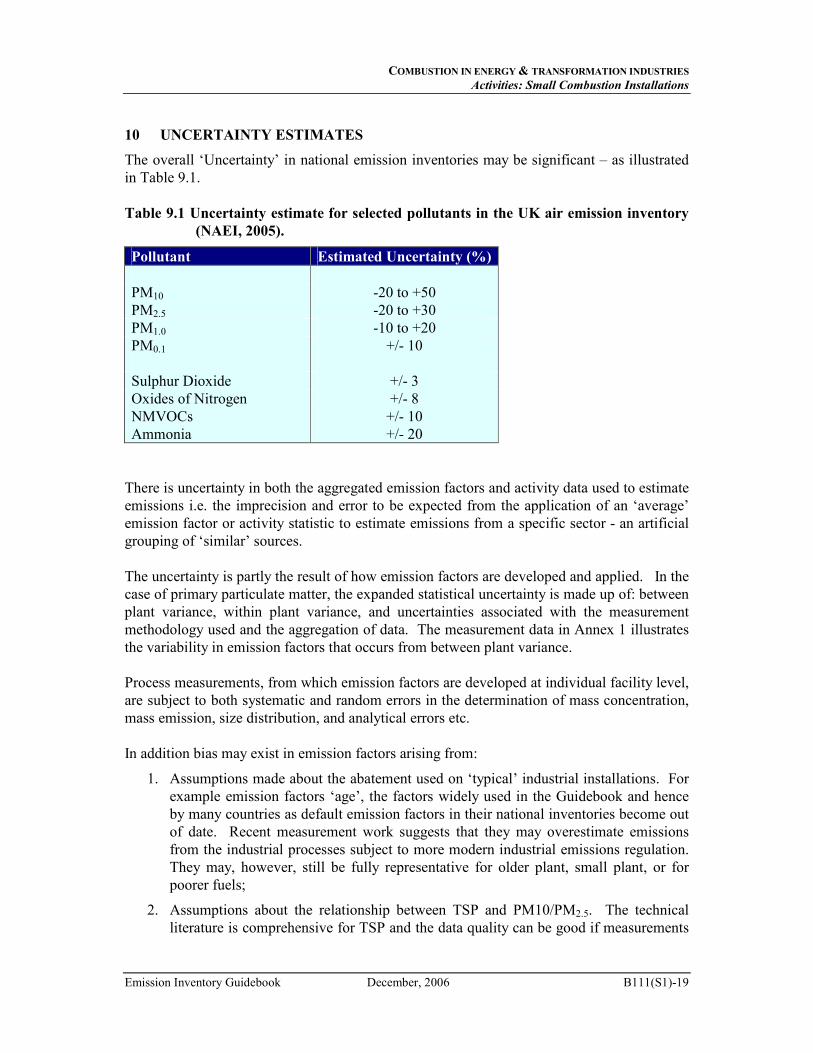
COMBUSTION IN ENERGY & TRANSFORMATION INDUSTRIES
Activities: Small Combustion Installations
Emission Inventory Guidebook December, 2006 B111(S1)-19
10 UNCERTAINTY ESTIMATES
The overall ‘Uncertainty’ in national emission inventories may be significant – as illustrated
in Table 9.1.
Table 9.1 Uncertainty estimate for selected pollutants in the UK air emission inventory
(NAEI, 2005).
Pollutant Estimated Uncertainty (%)
PM10 -20 to +50
PM2.5 -20 to +30
PM1.0 -10 to +20
PM0.1 +/- 10
Sulphur Dioxide +/- 3
Oxides of Nitrogen +/- 8
NMVOCs +/- 10
Ammonia +/- 20
There is uncertainty in both the aggregated emission factors and activity data used to estimate
emissions i.e. the imprecision and error to be expected from the application of an ‘average’
emission factor or activity statistic to estimate emissions from a specific sector - an artificial
grouping of ‘similar’ sources.
The uncertainty is partly the result of how emission factors are developed and applied. In the
case of primary particulate matter, the expanded statistical uncertainty is made up of: between
plant variance, within plant variance, and uncertainties associated with the measurement
methodology used and the aggregation of data. The measurement data in Annex 1 illustrates
the variability in emission factors that occurs from between plant variance.
Process measurements, from which emission factors are developed at individual facility level,
are subject to both systematic and random errors in the determination of mass concentration,
mass emission, size distribution, and analytical errors etc.
In addition bias may exist in emission factors arising from:
1. Assumptions made about the abatement used on ‘typical’ industrial installations. For
example emission factors ‘age’, the factors widely used in the Guidebook and hence
by many countries as default emission factors in their national inventories become out
of date. Recent measurement work suggests that they may overestimate emissions
from the industrial processes subject to more modern industrial emissions regulation.
They may, however, still be fully representative for older plant, small plant, or for
poorer fuels;
2. Assumptions about the relationship between TSP and PM10/PM2.5. The technical
literature is comprehensive for TSP and the data quality can be good if measurements
COMBUSTION IN ENERGY & TRANSFORMATION INDUSTRIES
Activities: Small Combustion Installations
B111 (S1)-20 December, 2006 Emission Inventory Guidebook
have been made using the international standard methods that are available (typically
the 95% confidence limit ~10%). But a variety of methods are used for particle size
fractionation and as yet there are no harmonised international standards to ensure
comparability. Published measurement data for PM10 is sparse, that for PM2.5
emissions more so. An added complication is that the methodology for the
determination of TSP differs from that of PM10 and PM2.5 and so the two need not
correlate directly.
11 WEAKEST ASPECTS/PRIORITY AREAS FOR IMPROVEMENT IN
CURRENT METHODOLOGY
Knowledge of combustion and abatement techniques, dust removal efficiencies and operating
techniques is limited.
Further work should be invested to develop emission factors, which include technical or fuel
dependent explanations concerning emission factor ranges. Emission factors also need to be
generated, which specifically relate to different levels of abatement on different types of
plant.
The stack emission factors described in the Guidebook, and all the PM10 emission factors, are
based whenever possible on measurements. Particle measurements have often been made on
the mass of total particulate matter and then converted to PM10 based either on the size
distribution of the sample collected or, more usually, on size distributions given in the
literature. There may be secondary sources of particulate matter, that are diffuse or fugitive in
nature e.g. emissions from coke ovens, stockpiles, ash handling etc. These emissions are
difficult to measure and in some cases it is likely that no entirely satisfactory measurements
have ever been made, in many cases estimates of emissions from such sources are missing.
There is very little published data suitable for emission inventory compilation. I.e.
representative data of known quality relating a) quantities of (particulate) material released to
b) the activity associated with the release of that pollutant. Suitable data and associated
information would record the determination of mass emissions rates using standardized
measurement methods or calculation-based methods. Ideally such methods would cover the
planning and execution of the data collection programme including: the selection of sampling
methodology, choice of equipment, suitable working procedures, the calculation of
representative emissions rates, the selection of matching activity data, the determination of
sampling/measurement uncertainty, and the reporting of information in a form that is suitable
for calculating emissions factors.
12 SPATIAL DISAGGREGATION CRITERIA FOR AREA SOURCES
Combustion plants should be considered as point sources if plant specific data are available.
Otherwise national emissions should be disaggregated on the basis of plant capacity,
employment, population or other relevant statistics.
COMBUSTION IN ENERGY & TRANSFORMATION INDUSTRIES
Activities: Small Combustion Installations
Emission Inventory Guidebook December, 2006 B111(S1)-21
13 TEMPORAL DISAGGREGATION CRITERIA
Combustion processes in most industrial sectors can be considered as a continuous process
however; district and agricultural heating plants will tend to have an operational profile
determined by the season. Individual combustion plant may have daily and/or seasonal
temporal profiles.
14 ADDITIONAL COMMENTS
See chapters B111 and B216.
15 SUPPLEMENTARY DOCUMENTS
16 VERIFICATION PROCESSES
17 REFERENCES
EMEP/CORINAIR Emission Inventory Guidebook – 2005, EEA (European Environment
Agency) Chapter B216 and B111
IPPC Best Available Techniques Reference Document on Large Combustion Plants,
December 2001, http://eippcb.jrc.es
NAEI (2005) UK National Atmospheric Emissions Inventory: UK Emissions of Air
Pollutants 1970 to 2003, October 2005
US EPA (1996) Compilation of Air Pollutant Emission Factors Vol.1 Report AP-42 (5th ed.)
US EPA (2003) PM2.5 Source Profiles
http://www.epa.gov/ttn/chief/emch/speciation/index.html
Visschedijk, A.J.H., J. Pacyna, T. Pulles, P. Zandveld and H. Denier van der Gon, 2004,
Cooordinated European Particulate Matter Emission Inventory Program (CEPMEIP), In: P.
Dilara et. Al (eds), Proceedings of the PM emission inventories scientific workshop, Lago
Maggiore, Italy, 18 October 2004, EUR 21302 EN, JRC, pp 163 - 174
18 BIBLIOGRAPHY
For a detailed bibliography the primary literature mentioned in AP 42 can be used.
COMBUSTION IN ENERGY & TRANSFORMATION INDUSTRIES
Activities: Small Combustion Installations
B111 (S1)-22 December, 2006 Emission Inventory Guidebook
19 RELEASE VERSION, DATE AND SOURCE
Version: 1
Date: Aug 2006
Source: R. Stewart
AEA Technology
The Gemini Building
Didcot,
OXON
OX11 0QR
20 POINT OF ENQUIRY
Any comments on this chapter or enquiries should be directed to:
Robert Stewart
AEA Technology Environment
The Gemini Building
Didcot
OXON
OX11 0QR
Tel: +44 870190 6575
Fax: +44 870190 6318
Email: [email protected]
Jozef Pacyna
NILU - Norwegian Institute of Air Research
PO Box 100
N-2027 Kjeller
Norway
Tel: +47 63 89 8155
Fax: +47 63 89 80 50
Email: [email protected]
COMBUSTION IN ENERGY & TRANSFORMATION INDUSTRIES
Activities : Large Combustion Installations
Emission Inventory Guidebook December, 2006 B111 (S2)-1
SNAP CODE: 010101 & 010102
010201 & 010202
010301
010401
010501 & 010502
020101 & 020102
020201
020301
020302
030101 & 030102
SOURCE ACTIVITY TITLE: COMBUSTION IN ENERGY & TRANSFORMATION INDUSTRIES
Particulate emissions from large Combustion Plants
(>50MWth)
NOSE CODE: 101.01
101.02
NFR CODE: 1 A 1 a,b,c
1 A 2 a-f
1 A 4 b,c,i
ISIC 3510
1 ACTIVITIES INCLUDED
This Supplement, to be read in conjunction with the existing Chapter B111, covers emissions of
particulate matter (PM) released from combustion processes within the energy and
transformation industries in boilers and furnaces larger than 50 MWth. This Supplement
includes guidance on estimating total PM (TSP), PM10 and PM2.5 emissions from these sources.
Emissions of other pollutants from this sector are provided in chapter B111.
2 CONTRIBUTION TO TOTAL EMISSION
The contributions of PM10 and PM2.5 emissions released from combustion in large combustion
plant to total emissions in countries of the CORINAIR90 inventory is presented in Table 2.1.
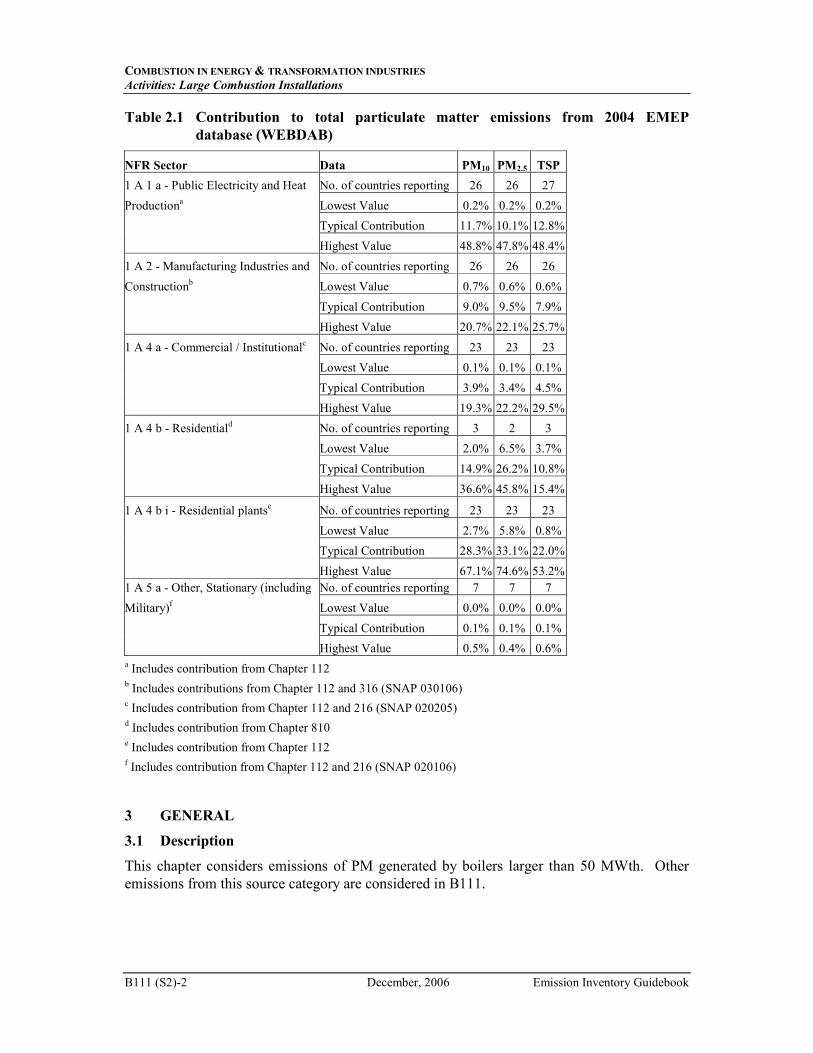
COMBUSTION IN ENERGY & TRANSFORMATION INDUSTRIES
Activities: Large Combustion Installations
B111 (S2)-2 December, 2006 Emission Inventory Guidebook
Table 2.1 Contribution to total particulate matter emissions from 2004 EMEP
database (WEBDAB)
NFR Sector Data PM10 PM2.5 TSP
1 A 1 a - Public Electricity and Heat No. of countries reporting 26 26 27
Productiona Lowest Value 0.2% 0.2% 0.2%
Typical Contribution 11.7% 10.1% 12.8%
Highest Value 48.8% 47.8% 48.4%
1 A 2 - Manufacturing Industries and No. of countries reporting 26 26 26
Constructionb Lowest Value 0.7% 0.6% 0.6%
Typical Contribution 9.0% 9.5% 7.9%
Highest Value 20.7% 22.1% 25.7%
1 A 4 a - Commercial / Institutionalc No. of countries reporting 23 23 23
Lowest Value 0.1% 0.1% 0.1%
Typical Contribution 3.9% 3.4% 4.5%
Highest Value 19.3% 22.2% 29.5%
1 A 4 b - Residentiald No. of countries reporting 3 2 3
Lowest Value 2.0% 6.5% 3.7%
Typical Contribution 14.9% 26.2% 10.8%
Highest Value 36.6% 45.8% 15.4%
1 A 4 b i - Residential plantse No. of countries reporting 23 23 23
Lowest Value 2.7% 5.8% 0.8%
Typical Contribution 28.3% 33.1% 22.0%
Highest Value 67.1% 74.6% 53.2%
1 A 5 a - Other, Stationary (including No. of countries reporting 7 7 7
Military)f Lowest Value 0.0% 0.0% 0.0%
Typical Contribution 0.1% 0.1% 0.1%
Highest Value 0.5% 0.4% 0.6%
a Includes contribution from Chapter 112 b Includes contributions from Chapter 112 and 316 (SNAP 030106) c Includes contribution from Chapter 112 and 216 (SNAP 020205) d Includes contribution from Chapter 810 e Includes contribution from Chapter 112 f Includes contribution from Chapter 112 and 216 (SNAP 020106)
3 GENERAL
3.1 Description
This chapter considers emissions of PM generated by boilers larger than 50 MWth. Other
emissions from this source category are considered in B111.
COMBUSTION IN ENERGY & TRANSFORMATION INDUSTRIES
Activities : Large Combustion Installations
Emission Inventory Guidebook December, 2006 B111 (S2)-3
3.2 Definitions
See B111.
3.3 Techniques
See B111 for information on boiler types and fuels. Combustion of coal and other solid fuels
present the main source for primary PM emissions.
3.4 Emissions
Particulate emissions result from activities such as storage of fuels; on site transportation of
solid fuel; combustion of fuels, transport, storage and disposal of combustion residues
including furnace bottom ash, fly ash and, abatement residues.
Combustion of fuels will generate solid residues which may be deposited in the combustion
chamber (furnace bottom ash), within the furnace, boiler surfaces or ducting (fly ash). Coal
and other fuels with a significant ash content have the highest potential to emit PM.
Suspended ash material in exhaust gases will be retained by particulate abatement or other
emission abatement equipment (abatement residues). Material which remains in the flue
gases beyond the abatement equipment and passes to the atmosphere is primary PM.
Secondary PM is formed by chemical and physical processes after discharge to atmosphere
and is NOT considered here.
3.5 Controls
Particulate emission reduction is usually achieved using abatement equipment. Electrostatic
precipitators (ESPs) and fabric filters (FFs) are widely used on boilers. Cyclones (particularly
multicyclones) can be found on smaller grate-fired boilers. Most pulverised coal fired power
station boilers use ESPs although fabric filters are becoming more common. Flue gas
desulphurisation (FGD) plant can also help reduce particulate emissions from pulverised
coal-fired boilers. Wet limestone FGD systems retrofitted to existing plant are generally
located downstream of existing ESPs and can provide a further stage of PM reduction. Dry
lime injection FGD systems incorporate a FF for sorbent capture and PM removal.
Fabric filters are capable of achieving higher emission reductions than electrostatic
precipitators but both are suitable1 for the sector and can achieve PM emission concentrations
of 5 - 30 mg/m3.
4 SIMPLER METHODOLOGY
Emissions can be estimated at different levels of complexity; it is useful to think in terms of
three tiers2:
1 Either technology is considered part of Best Available Techniques (BAT) under EU Integrated Pollution
Prevention and Control regulations. 2 The term “Tier” is used in the 2006 IPCC Guidelines for National Greenhouse Gas Inventories and adopted
here for easy reference and to promote methodological harmonization.
COMBUSTION IN ENERGY & TRANSFORMATION INDUSTRIES
Activities: Large Combustion Installations
B111 (S2)-4 December, 2006 Emission Inventory Guidebook
Tier 1: a method using readily available statistical data on the intensity of processes
(“activity rates”) and default emission factors. These emission factors assume a
linear relation between the intensity of the process and the resulting emissions.
The Tier 1 default emission factors also assume an average or typical process
description.
Tier 2: is similar to Tier 1 but uses more specific emission factors developed on the
basis of knowledge of the types of processes and specific process conditions
that apply in the country for which the inventory is being developed.
Tier 3: is any method that goes beyond the above methods. These might include the
use of more detailed activity information, specific abatement strategies or other
relevant technical information.
By moving from a lower to a higher Tier it is expected that the resulting emission estimate
will be more precise and will have a lower uncertainty. Higher Tier methods will need more
input data and therefore will require more effort to implement.
The Tier 1 simpler methodology, where limited information is available, uses a restricted set
of default emission factors together with production capacity information specific to the
country or region of interest; there is little or no specification of the type of industrial
technologies or the type and efficiency of control equipment in place. The Tier 2 approach,
in addition, requires an approximation of the mix of technologies in place, and more detailed
activity data, but still allows the use of default sector or technology factors.
Consequently the simplest methodology (Tier 1) is to combine an activity rate (AR) with a
comparable, representative, value of the emissions per unit activity, the emission factors (EF).
The basic equation is:
Emission = AR x EF
In the energy sector, for example, fuel consumption would be the measure of activity and
mass of material emitted per unit of fuel consumed would be a compatible emission factor.
NOTE: The basic equation may be modified, in some circumstances, to include emission
reduction efficiency (abatement factors).
The Tier 2 methodology is a modified version of this basic equation:
Emission = ∑((AR1 x EF1) + (AR2 x EF2) +….(ARn x EFn))
Default emission factors for this purpose are provided in Sections 8.1 and 8.2.
5 DETAILED METHODOLOGY
The detailed methodology (equivalent to Tier 3) to estimate emissions of pollutants from
combustion plant >50 MWth is based on measurements or estimations using plant specific
COMBUSTION IN ENERGY & TRANSFORMATION INDUSTRIES
Activities : Large Combustion Installations
Emission Inventory Guidebook December, 2006 B111 (S2)-5
emission factors - guidance on determining plant specific emission factors is given in
Measurement Protocol Annex.
In many countries, operators of combustion plant >50MWth will report emissions to comply
with regulatory requirements and this data can be used to help compile the national inventory.
The recommended detailed methodology to estimate emissions of PM from combustion
activities is based on measurements and/or estimations using technology-specific emission
factors.
Information on the type of the process and activity data, for example combustion and
abatement technologies, is required to assign appropriate emission factors.
Reference emission factors for comparison with users’ own data are provided in Section 8.2.
6 ACTIVITY STATISTICS
Activity statistics for energy consumption or other relevant national activity data for
estimating emissions using the simpler estimation methodology (Tiers 1 and 2) are available
from national statistics.
The detailed methodology (Tier 3) requires more detailed information such as the amount and
types of fuel consumed within individual combustion plant or industry sectors. These data
are not always easily available although in many countries operators do report fuel use for
emission trading or other legislative requirements.
Further guidance is provided in the 2006 IPCC Guidelines for National Greenhouse Gas
Inventories, volume 2 on energy, Chapter 1.
7 POINT SOURCE CRITERIA
Large combustion plants are regarded as point sources if plant specific data are available.
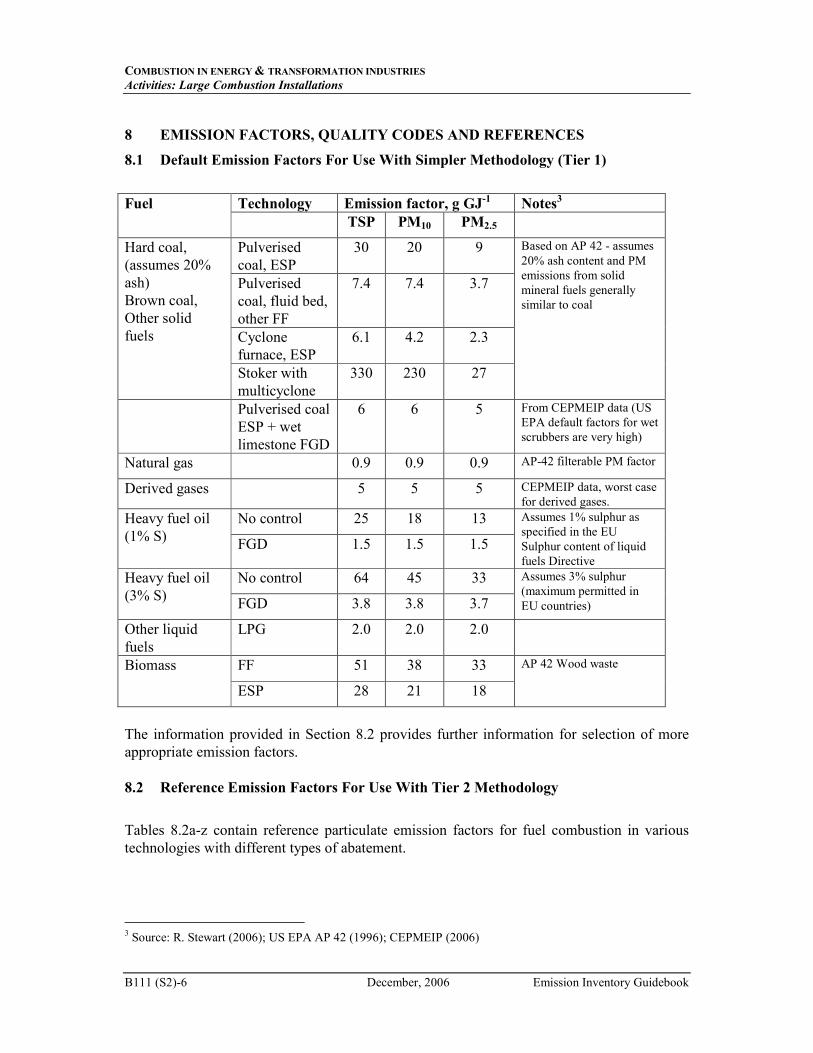
COMBUSTION IN ENERGY & TRANSFORMATION INDUSTRIES
Activities: Large Combustion Installations
B111 (S2)-6 December, 2006 Emission Inventory Guidebook
8 EMISSION FACTORS, QUALITY CODES AND REFERENCES
8.1 Default Emission Factors For Use With Simpler Methodology (Tier 1)
Fuel Technology Emission factor, g GJ-1 Notes3
TSP PM10 PM2.5
Pulverised
coal, ESP
30 20 9
Pulverised
coal, fluid bed,
other FF
7.4 7.4 3.7
Cyclone
furnace, ESP
6.1 4.2 2.3
Hard coal,
(assumes 20%
ash)
Brown coal,
Other solid
fuels
Stoker with
multicyclone
330 230 27
Based on AP 42 - assumes
20% ash content and PM
emissions from solid
mineral fuels generally
similar to coal
Pulverised coal
ESP + wet
limestone FGD
6 6 5 From CEPMEIP data (US
EPA default factors for wet
scrubbers are very high)
Natural gas 0.9 0.9 0.9 AP-42 filterable PM factor
Derived gases 5 5 5 CEPMEIP data, worst case
for derived gases.
No control 25 18 13 Heavy fuel oil
(1% S) FGD 1.5 1.5 1.5
Assumes 1% sulphur as
specified in the EU
Sulphur content of liquid
fuels Directive
No control 64 45 33 Heavy fuel oil
(3% S) FGD 3.8 3.8 3.7
Assumes 3% sulphur
(maximum permitted in
EU countries)
Other liquid
fuels
LPG 2.0 2.0 2.0
FF 51 38 33 Biomass
ESP 28 21 18
AP 42 Wood waste
The information provided in Section 8.2 provides further information for selection of more
appropriate emission factors.
8.2 Reference Emission Factors For Use With Tier 2 Methodology
Tables 8.2a-z contain reference particulate emission factors for fuel combustion in various
technologies with different types of abatement.
3 Source: R. Stewart (2006); US EPA AP 42 (1996); CEPMEIP (2006)
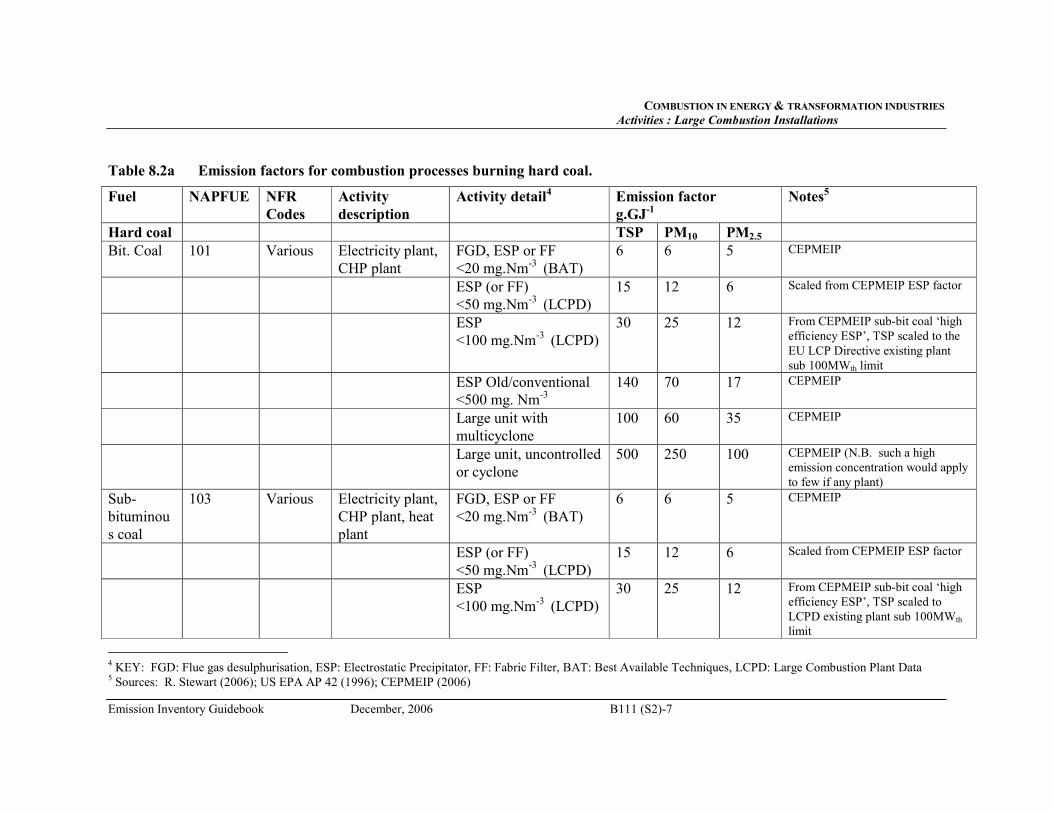
COMBUSTION IN ENERGY & TRANSFORMATION INDUSTRIES
Activities : Large Combustion Installations
Emission Inventory Guidebook December, 2006 B111 (S2)-7
Table 8.2a Emission factors for combustion processes burning hard coal.
Fuel NAPFUE NFR
Codes
Activity
description
Activity detail4 Emission factor
g.GJ-1
Notes5
Hard coal TSP PM10 PM2.5
Bit. Coal 101 Various Electricity plant,
CHP plant
FGD, ESP or FF
<20 mg.Nm-3 (BAT)
6 6 5 CEPMEIP
ESP (or FF)
<50 mg.Nm-3 (LCPD)
15 12 6 Scaled from CEPMEIP ESP factor
ESP
<100 mg.Nm-3 (LCPD)
30 25 12 From CEPMEIP sub-bit coal ‘high
efficiency ESP’, TSP scaled to the
EU LCP Directive existing plant
sub 100MWth limit
ESP Old/conventional
<500 mg. Nm-3
140 70 17 CEPMEIP
Large unit with
multicyclone
100 60 35 CEPMEIP
Large unit, uncontrolled
or cyclone
500 250 100 CEPMEIP (N.B. such a high
emission concentration would apply
to few if any plant)
Sub-
bituminou
s coal
103 Various Electricity plant,
CHP plant, heat
plant
FGD, ESP or FF
<20 mg.Nm-3 (BAT)
6 6 5 CEPMEIP
ESP (or FF)
<50 mg.Nm-3 (LCPD)
15 12 6 Scaled from CEPMEIP ESP factor
ESP
<100 mg.Nm-3 (LCPD)
30 25 12 From CEPMEIP sub-bit coal ‘high
efficiency ESP’, TSP scaled to
LCPD existing plant sub 100MWth
limit
4 KEY: FGD: Flue gas desulphurisation, ESP: Electrostatic Precipitator, FF: Fabric Filter, BAT: Best Available Techniques, LCPD: Large Combustion Plant Data 5 Sources: R. Stewart (2006); US EPA AP 42 (1996); CEPMEIP (2006)
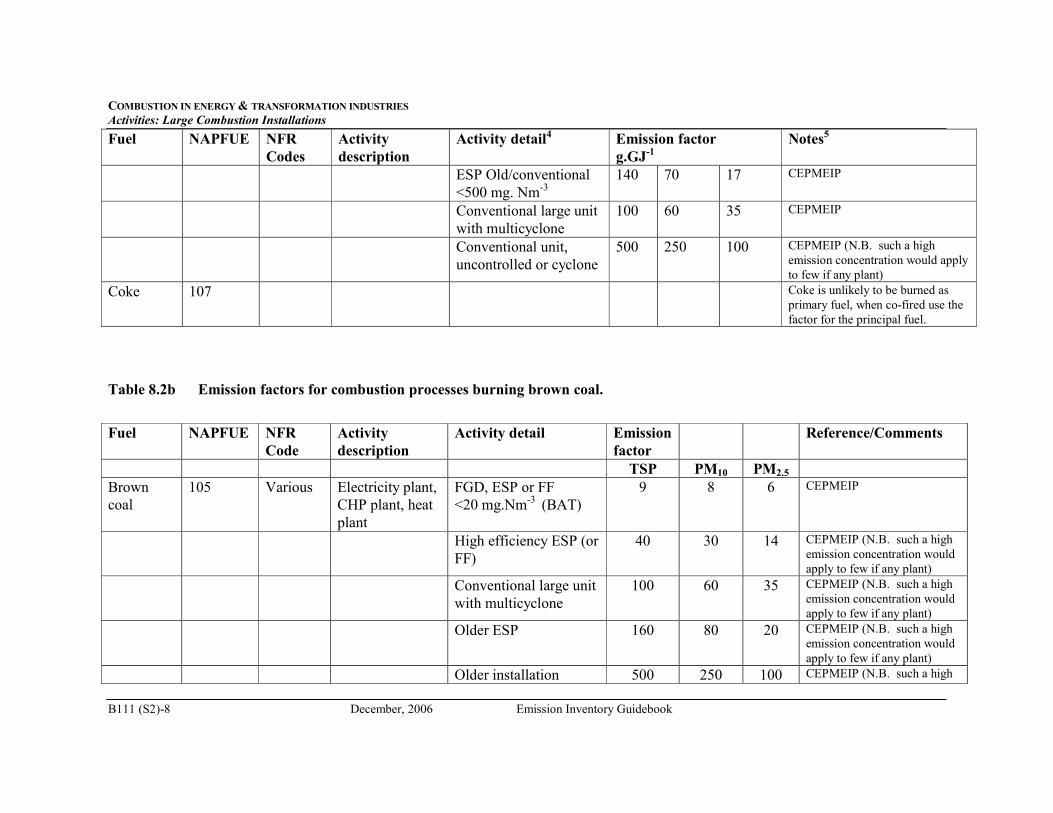
COMBUSTION IN ENERGY & TRANSFORMATION INDUSTRIES
Activities: Large Combustion Installations
B111 (S2)-8 December, 2006 Emission Inventory Guidebook
Fuel NAPFUE NFR
Codes
Activity
description
Activity detail4 Emission factor
g.GJ-1
Notes5
ESP Old/conventional
<500 mg. Nm-3
140 70 17 CEPMEIP
Conventional large unit
with multicyclone
100 60 35 CEPMEIP
Conventional unit,
uncontrolled or cyclone
500 250 100 CEPMEIP (N.B. such a high
emission concentration would apply
to few if any plant)
Coke 107 Coke is unlikely to be burned as
primary fuel, when co-fired use the
factor for the principal fuel.
Table 8.2b Emission factors for combustion processes burning brown coal.
Fuel
NAPFUE NFR
Code
Activity
description
Activity detail Emission
factor
Reference/Comments
TSP PM10 PM2.5
Brown
coal
105 Various Electricity plant,
CHP plant, heat
plant
FGD, ESP or FF
<20 mg.Nm-3 (BAT)
9 8 6 CEPMEIP
High efficiency ESP (or
FF)
40 30 14 CEPMEIP (N.B. such a high
emission concentration would
apply to few if any plant)
Conventional large unit
with multicyclone
100 60 35 CEPMEIP (N.B. such a high
emission concentration would
apply to few if any plant)
Older ESP 160 80 20 CEPMEIP (N.B. such a high
emission concentration would
apply to few if any plant)
Older installation 500 250 100 CEPMEIP (N.B. such a high
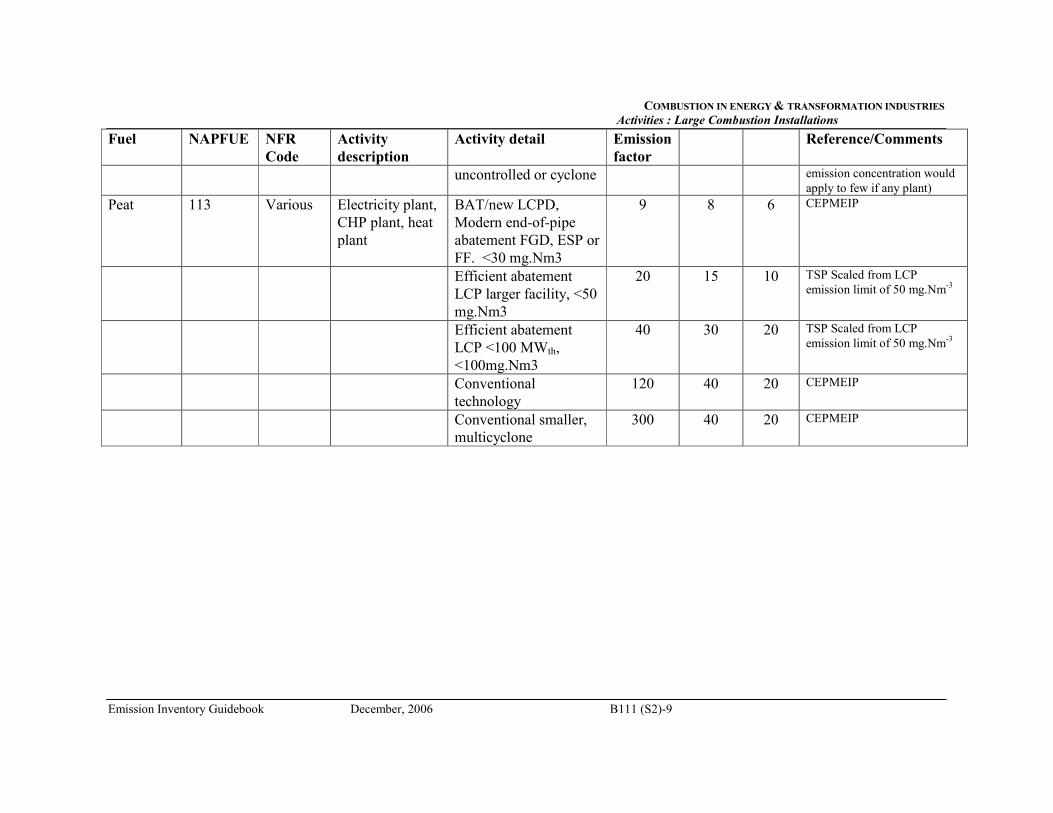
COMBUSTION IN ENERGY & TRANSFORMATION INDUSTRIES
Activities : Large Combustion Installations
Emission Inventory Guidebook December, 2006 B111 (S2)-9
Fuel
NAPFUE NFR
Code
Activity
description
Activity detail Emission
factor
Reference/Comments
uncontrolled or cyclone emission concentration would
apply to few if any plant)
Peat 113 Various Electricity plant,
CHP plant, heat
plant
BAT/new LCPD,
Modern end-of-pipe
abatement FGD, ESP or
FF. <30 mg.Nm3
9 8 6 CEPMEIP
Efficient abatement
LCP larger facility, <50
mg.Nm3
20 15 10 TSP Scaled from LCP
emission limit of 50 mg.Nm-3
Efficient abatement
LCP <100 MWth,
<100mg.Nm3
40 30 20 TSP Scaled from LCP
emission limit of 50 mg.Nm-3
Conventional
technology
120 40 20 CEPMEIP
Conventional smaller,
multicyclone
300 40 20 CEPMEIP
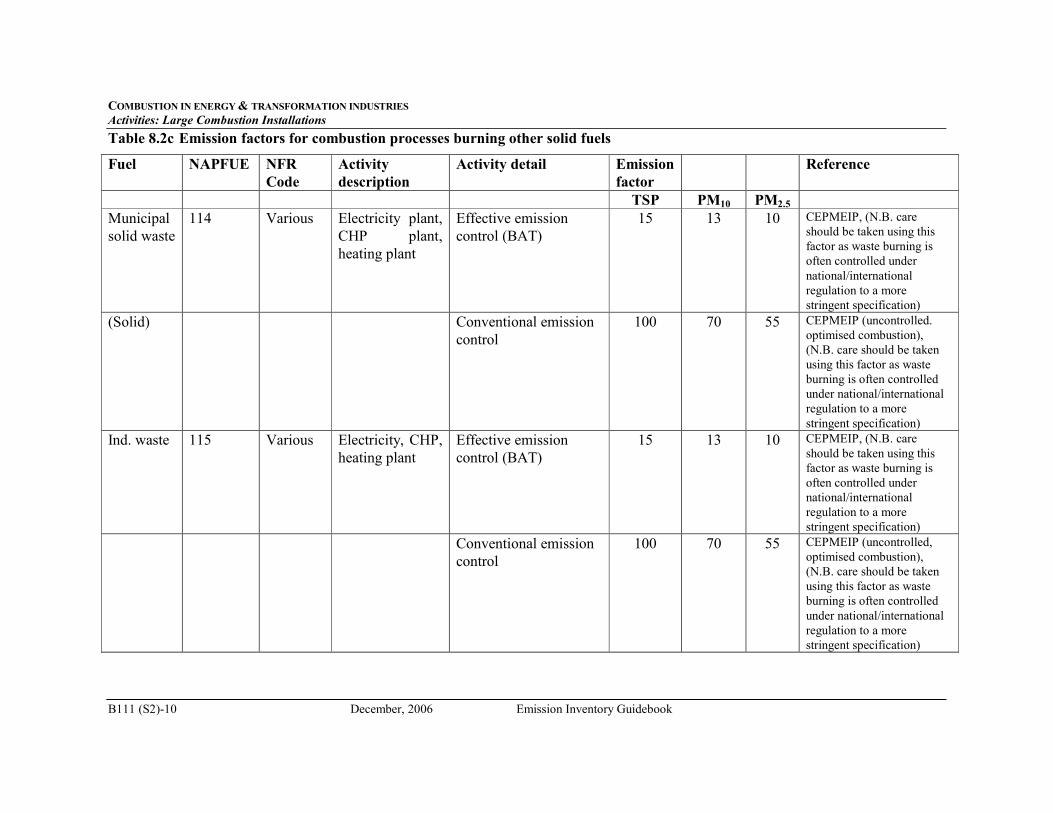
COMBUSTION IN ENERGY & TRANSFORMATION INDUSTRIES
Activities: Large Combustion Installations
B111 (S2)-10 December, 2006 Emission Inventory Guidebook
Table 8.2c Emission factors for combustion processes burning other solid fuels
Fuel
NAPFUE NFR
Code
Activity
description
Activity detail Emission
factor
Reference
TSP PM10 PM2.5
Municipal
solid waste
114 Various Electricity plant,
CHP plant,
heating plant
Effective emission
control (BAT)
15 13 10 CEPMEIP, (N.B. care
should be taken using this
factor as waste burning is
often controlled under
national/international
regulation to a more
stringent specification)
(Solid) Conventional emission
control
100 70 55 CEPMEIP (uncontrolled.
optimised combustion),
(N.B. care should be taken
using this factor as waste
burning is often controlled
under national/international
regulation to a more
stringent specification)
Ind. waste 115 Various Electricity, CHP,
heating plant
Effective emission
control (BAT)
15 13 10 CEPMEIP, (N.B. care
should be taken using this
factor as waste burning is
often controlled under
national/international
regulation to a more
stringent specification)
Conventional emission
control
100 70 55 CEPMEIP (uncontrolled,
optimised combustion),
(N.B. care should be taken
using this factor as waste
burning is often controlled
under national/international
regulation to a more
stringent specification)
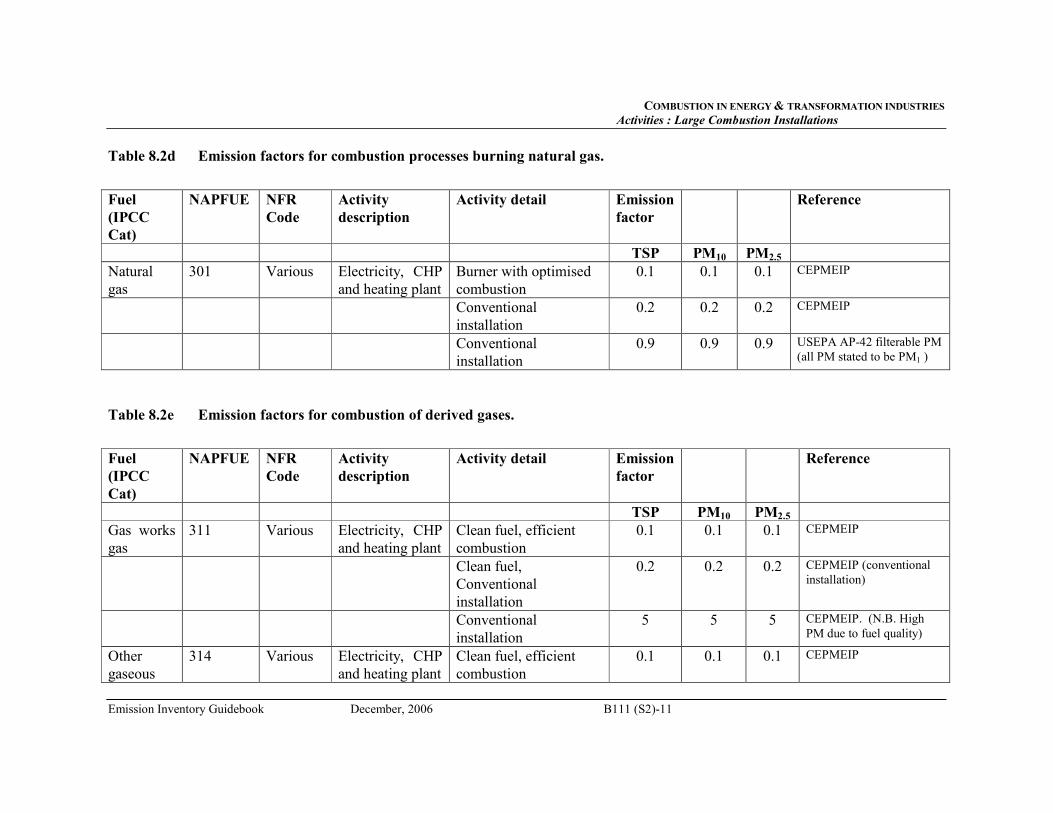
COMBUSTION IN ENERGY & TRANSFORMATION INDUSTRIES
Activities : Large Combustion Installations
Emission Inventory Guidebook December, 2006 B111 (S2)-11
Table 8.2d Emission factors for combustion processes burning natural gas.
Fuel
(IPCC
Cat)
NAPFUE NFR
Code
Activity
description
Activity detail Emission
factor
Reference
TSP PM10 PM2.5
Natural
gas
301 Various Electricity, CHP
and heating plant
Burner with optimised
combustion
0.1 0.1 0.1 CEPMEIP
Conventional
installation
0.2 0.2 0.2 CEPMEIP
Conventional
installation
0.9 0.9 0.9 USEPA AP-42 filterable PM
(all PM stated to be PM1 )
Table 8.2e Emission factors for combustion of derived gases.
Fuel
(IPCC
Cat)
NAPFUE NFR
Code
Activity
description
Activity detail Emission
factor
Reference
TSP PM10 PM2.5
Gas works
gas
311 Various Electricity, CHP
and heating plant
Clean fuel, efficient
combustion
0.1 0.1 0.1 CEPMEIP
Clean fuel,
Conventional
installation
0.2 0.2 0.2 CEPMEIP (conventional
installation)
Conventional
installation
5 5 5 CEPMEIP. (N.B. High
PM due to fuel quality)
Other
gaseous
314 Various Electricity, CHP
and heating plant
Clean fuel, efficient
combustion
0.1 0.1 0.1 CEPMEIP
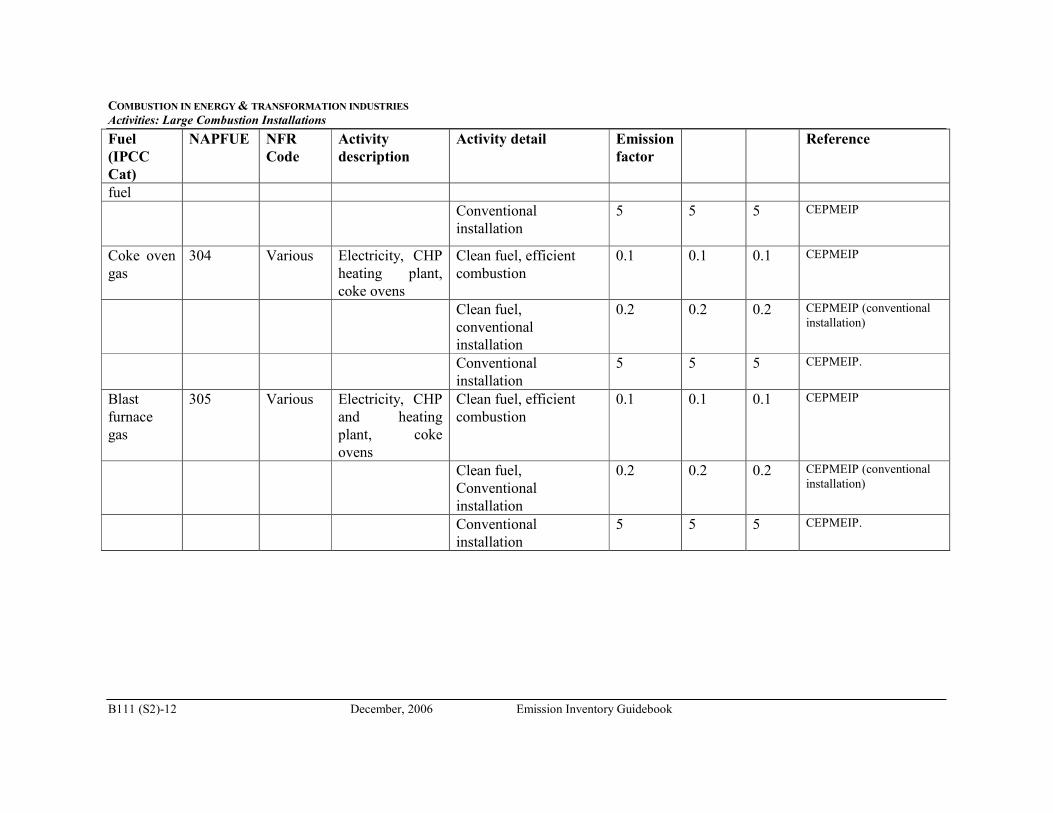
COMBUSTION IN ENERGY & TRANSFORMATION INDUSTRIES
Activities: Large Combustion Installations
B111 (S2)-12 December, 2006 Emission Inventory Guidebook
Fuel
(IPCC
Cat)
NAPFUE NFR
Code
Activity
description
Activity detail Emission
factor
Reference
fuel
Conventional
installation
5 5 5 CEPMEIP
Coke oven
gas
304 Various Electricity, CHP
heating plant,
coke ovens
Clean fuel, efficient
combustion
0.1 0.1 0.1 CEPMEIP
Clean fuel,
conventional
installation
0.2 0.2 0.2 CEPMEIP (conventional
installation)
Conventional
installation
5 5 5 CEPMEIP.
Blast
furnace
gas
305 Various Electricity, CHP
and heating
plant, coke
ovens
Clean fuel, efficient
combustion
0.1 0.1 0.1 CEPMEIP
Clean fuel,
Conventional
installation
0.2 0.2 0.2 CEPMEIP (conventional
installation)
Conventional
installation
5 5 5 CEPMEIP.

COMBUSTION IN ENERGY & TRANSFORMATION INDUSTRIES
Activities : Large Combustion Installations
Emission Inventory Guidebook December, 2006 B111 (S2)-13
Table 8.2f Emission factors for combustion of heavy fuel oil.
Fuel
(IPCC
Cat)
NAPFUE NFR
Code
Activity
description
Activity detail Emission
factor
Reference
TSP PM10 PM2.5
Residual
fuel oil
203 Various Electricity, CHP
and heating plant
Low S fuel with
optimised burner or
abatement
3 3 2.5 CEPMEIP (equivalent to
about 10 mg.Nm3 or BAT)
Low S fuel, efficient
combustion
14 12 10 CEPMEIP. About 50
mg.Nm3 (EU LCPD limit
for existing plant)
Low-Medium S fuel,
conventional
installation
20 15 9 CEPMEIP (equivalent. to
about 70 mg.Nm3.
Low-Medium S fuel,
conventional
installation
60 50 40 CEPMEIP, the higher of
two entries used about 200
mg.Nm3
High S fuel 210 190 130 CEPMEIP, the lower of
two entries for high S used.
(N.B. such a high
emission concentration 750
mg.Nm3 would apply to
few if any plant)
Petroleum
coke
110 1 A 1 b Oil refineries Conventional,
multicyclone
100 60 35 CEPMEIP, N.B the factor
is very high compared to
the EU LCP Directive
ELVs and BAT for large
furnaces. Bit Coal factors
more appropriate.
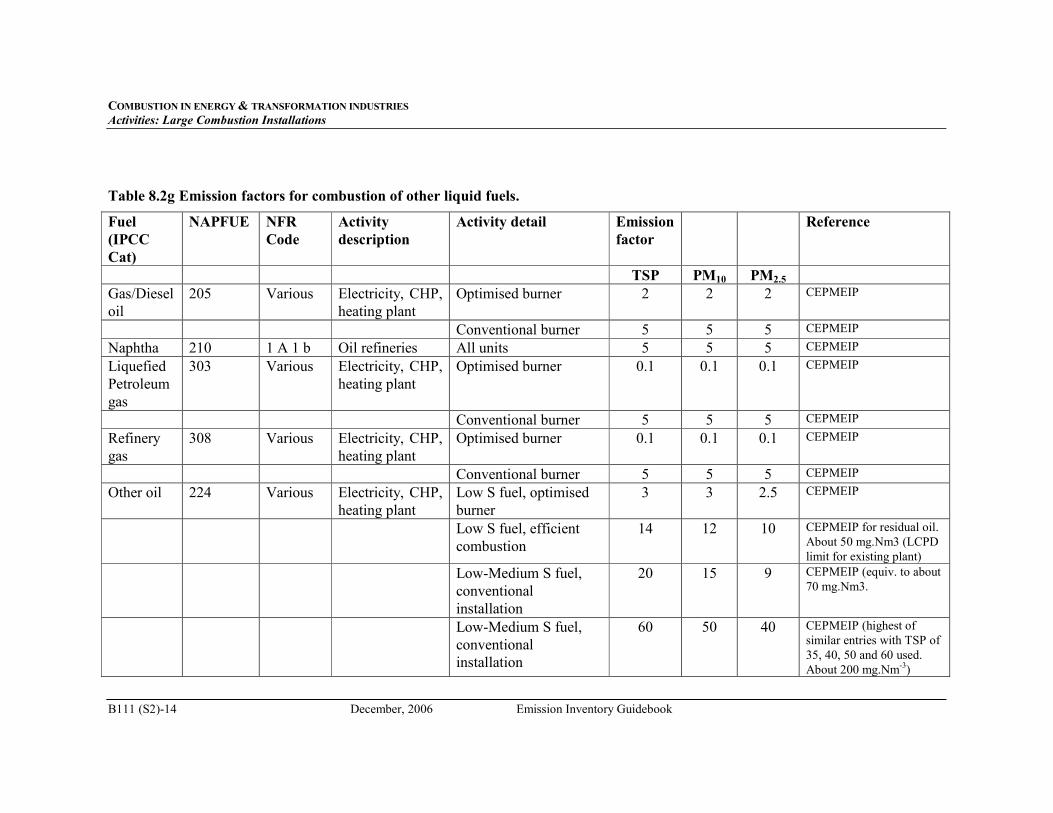
COMBUSTION IN ENERGY & TRANSFORMATION INDUSTRIES
Activities: Large Combustion Installations
B111 (S2)-14 December, 2006 Emission Inventory Guidebook
Table 8.2g Emission factors for combustion of other liquid fuels.
Fuel
(IPCC
Cat)
NAPFUE NFR
Code
Activity
description
Activity detail Emission
factor
Reference
TSP PM10 PM2.5
Gas/Diesel
oil
205 Various Electricity, CHP,
heating plant
Optimised burner 2 2 2 CEPMEIP
Conventional burner 5 5 5 CEPMEIP
Naphtha 210 1 A 1 b Oil refineries All units 5 5 5 CEPMEIP
Liquefied
Petroleum
gas
303 Various Electricity, CHP,
heating plant
Optimised burner 0.1 0.1 0.1 CEPMEIP
Conventional burner 5 5 5 CEPMEIP
Refinery
gas
308 Various Electricity, CHP,
heating plant
Optimised burner 0.1 0.1 0.1 CEPMEIP
Conventional burner 5 5 5 CEPMEIP
Other oil 224 Various Electricity, CHP,
heating plant
Low S fuel, optimised
burner
3 3 2.5 CEPMEIP
Low S fuel, efficient
combustion
14 12 10 CEPMEIP for residual oil.
About 50 mg.Nm3 (LCPD
limit for existing plant)
Low-Medium S fuel,
conventional
installation
20 15 9 CEPMEIP (equiv. to about
70 mg.Nm3.
Low-Medium S fuel,
conventional
installation
60 50 40 CEPMEIP (highest of
similar entries with TSP of
35, 40, 50 and 60 used.
About 200 mg.Nm-3)
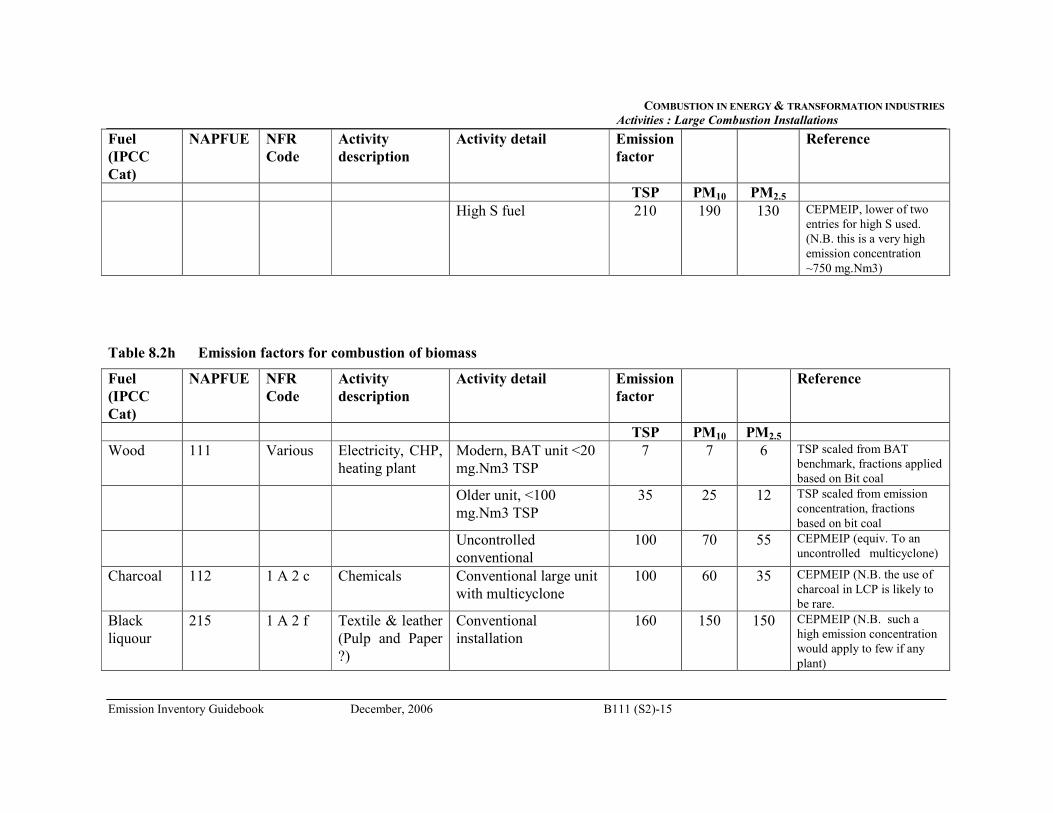
COMBUSTION IN ENERGY & TRANSFORMATION INDUSTRIES
Activities : Large Combustion Installations
Emission Inventory Guidebook December, 2006 B111 (S2)-15
Fuel
(IPCC
Cat)
NAPFUE NFR
Code
Activity
description
Activity detail Emission
factor
Reference
TSP PM10 PM2.5
High S fuel 210 190 130 CEPMEIP, lower of two
entries for high S used.
(N.B. this is a very high
emission concentration
~750 mg.Nm3)
Table 8.2h Emission factors for combustion of biomass
Fuel
(IPCC
Cat)
NAPFUE NFR
Code
Activity
description
Activity detail Emission
factor
Reference
TSP PM10 PM2.5
Wood 111 Various Electricity, CHP,
heating plant
Modern, BAT unit <20
mg.Nm3 TSP
7 7 6 TSP scaled from BAT
benchmark, fractions applied
based on Bit coal
Older unit, <100
mg.Nm3 TSP
35 25 12 TSP scaled from emission
concentration, fractions
based on bit coal
Uncontrolled
conventional
100 70 55 CEPMEIP (equiv. To an
uncontrolled multicyclone)
Charcoal 112 1 A 2 c Chemicals Conventional large unit
with multicyclone
100 60 35 CEPMEIP (N.B. the use of
charcoal in LCP is likely to
be rare.
Black
liquour
215 1 A 2 f Textile & leather
(Pulp and Paper
?)
Conventional
installation
160 150 150 CEPMEIP (N.B. such a
high emission concentration
would apply to few if any
plant)
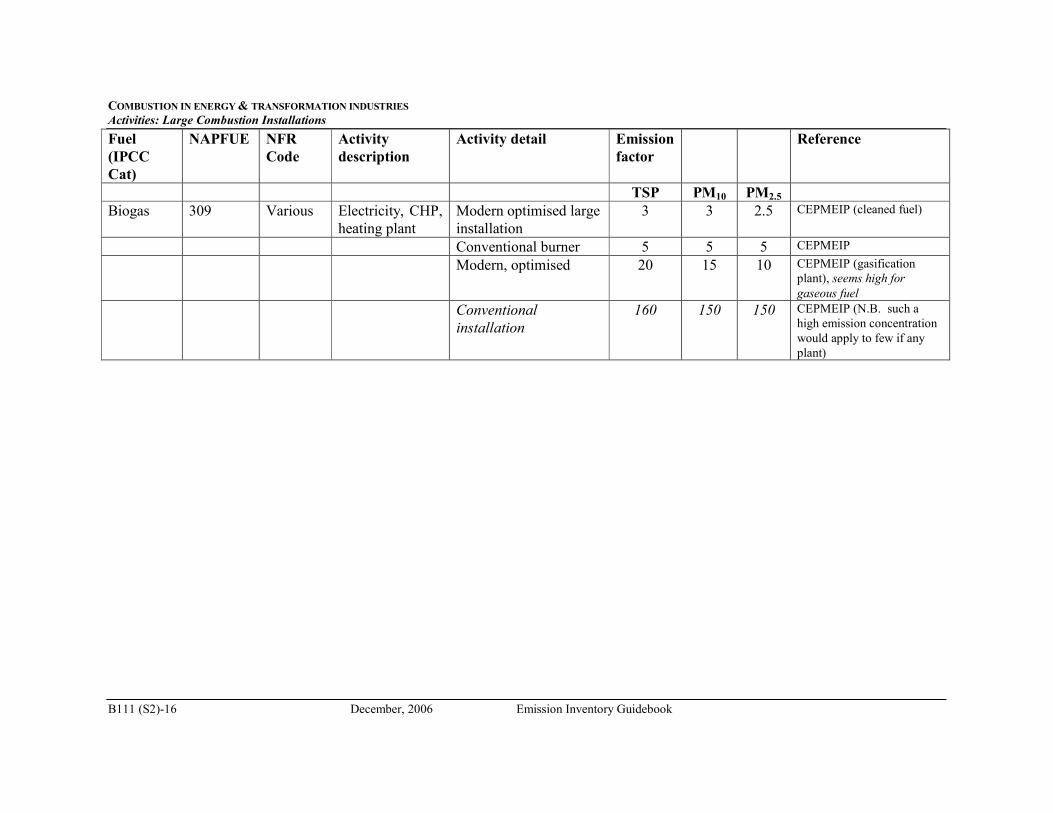
COMBUSTION IN ENERGY & TRANSFORMATION INDUSTRIES
Activities: Large Combustion Installations
B111 (S2)-16 December, 2006 Emission Inventory Guidebook
Fuel
(IPCC
Cat)
NAPFUE NFR
Code
Activity
description
Activity detail Emission
factor
Reference
TSP PM10 PM2.5
Biogas 309 Various Electricity, CHP,
heating plant
Modern optimised large
installation
3 3 2.5 CEPMEIP (cleaned fuel)
Conventional burner 5 5 5 CEPMEIP
Modern, optimised 20 15 10 CEPMEIP (gasification
plant), seems high for
gaseous fuel
Conventional
installation
160 150 150 CEPMEIP (N.B. such a
high emission concentration
would apply to few if any
plant)
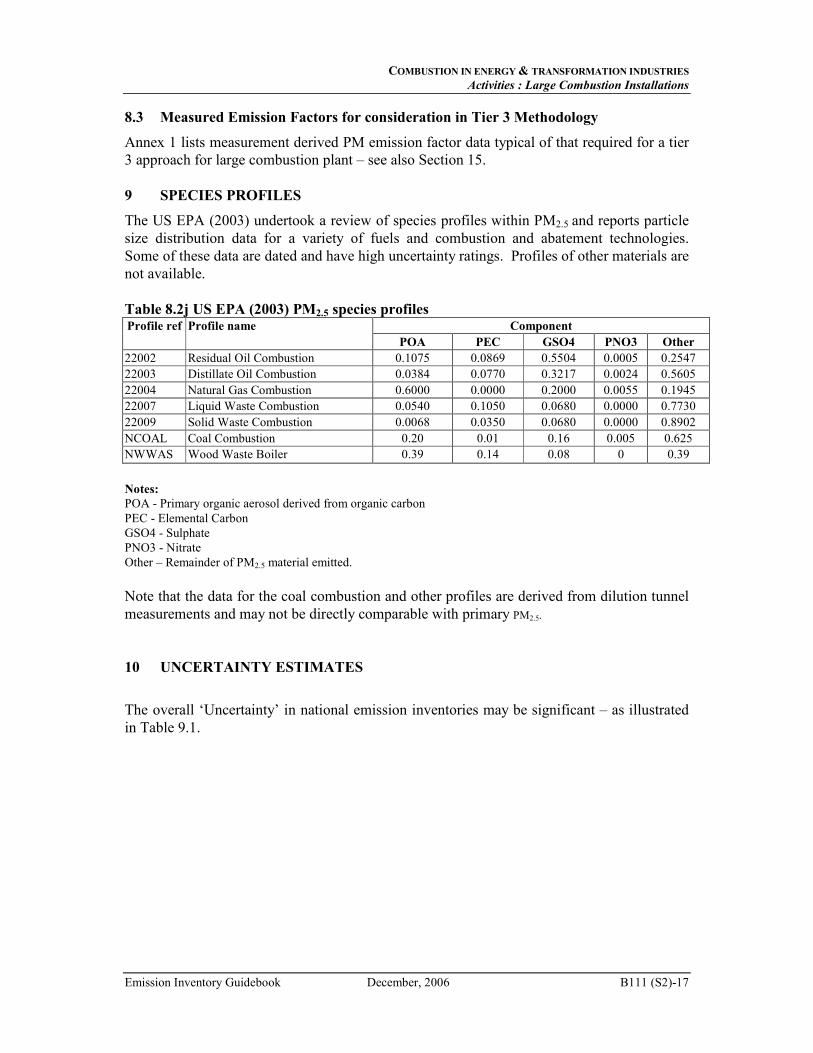
COMBUSTION IN ENERGY & TRANSFORMATION INDUSTRIES
Activities : Large Combustion Installations
Emission Inventory Guidebook December, 2006 B111 (S2)-17
8.3 Measured Emission Factors for consideration in Tier 3 Methodology
Annex 1 lists measurement derived PM emission factor data typical of that required for a tier
3 approach for large combustion plant – see also Section 15.
9 SPECIES PROFILES
The US EPA (2003) undertook a review of species profiles within PM2.5 and reports particle
size distribution data for a variety of fuels and combustion and abatement technologies.
Some of these data are dated and have high uncertainty ratings. Profiles of other materials are
not available.
Table 8.2j US EPA (2003) PM2.5 species profiles Profile ref Profile name Component
POA PEC GSO4 PNO3 Other
22002 Residual Oil Combustion 0.1075 0.0869 0.5504 0.0005 0.2547
22003 Distillate Oil Combustion 0.0384 0.0770 0.3217 0.0024 0.5605
22004 Natural Gas Combustion 0.6000 0.0000 0.2000 0.0055 0.1945
22007 Liquid Waste Combustion 0.0540 0.1050 0.0680 0.0000 0.7730
22009 Solid Waste Combustion 0.0068 0.0350 0.0680 0.0000 0.8902
NCOAL Coal Combustion 0.20 0.01 0.16 0.005 0.625
NWWAS Wood Waste Boiler 0.39 0.14 0.08 0 0.39
Notes:
POA - Primary organic aerosol derived from organic carbon
PEC - Elemental Carbon
GSO4 - Sulphate
PNO3 - Nitrate
Other – Remainder of PM2.5 material emitted.
Note that the data for the coal combustion and other profiles are derived from dilution tunnel
measurements and may not be directly comparable with primary PM2.5.
10 UNCERTAINTY ESTIMATES
The overall ‘Uncertainty’ in national emission inventories may be significant – as illustrated
in Table 9.1.
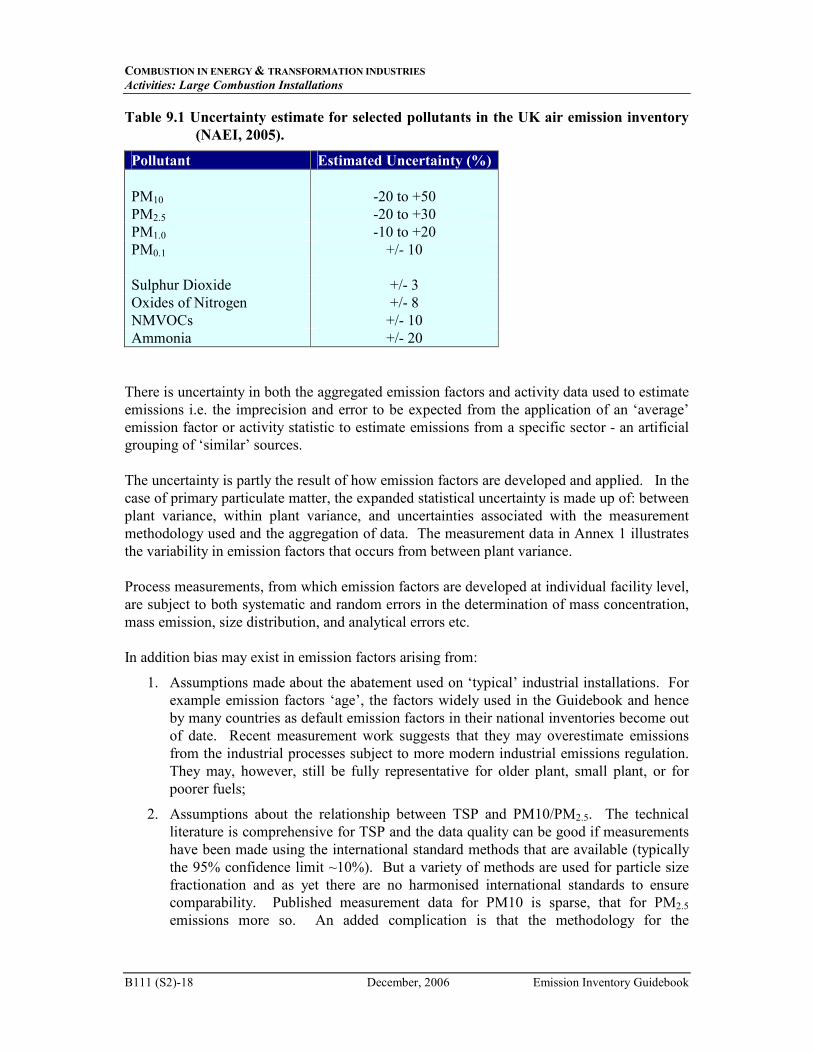
COMBUSTION IN ENERGY & TRANSFORMATION INDUSTRIES
Activities: Large Combustion Installations
B111 (S2)-18 December, 2006 Emission Inventory Guidebook
Table 9.1 Uncertainty estimate for selected pollutants in the UK air emission inventory
(NAEI, 2005).
Pollutant Estimated Uncertainty (%)
PM10 -20 to +50
PM2.5 -20 to +30
PM1.0 -10 to +20
PM0.1 +/- 10
Sulphur Dioxide +/- 3
Oxides of Nitrogen +/- 8
NMVOCs +/- 10
Ammonia +/- 20
There is uncertainty in both the aggregated emission factors and activity data used to estimate
emissions i.e. the imprecision and error to be expected from the application of an ‘average’
emission factor or activity statistic to estimate emissions from a specific sector - an artificial
grouping of ‘similar’ sources.
The uncertainty is partly the result of how emission factors are developed and applied. In the
case of primary particulate matter, the expanded statistical uncertainty is made up of: between
plant variance, within plant variance, and uncertainties associated with the measurement
methodology used and the aggregation of data. The measurement data in Annex 1 illustrates
the variability in emission factors that occurs from between plant variance.
Process measurements, from which emission factors are developed at individual facility level,
are subject to both systematic and random errors in the determination of mass concentration,
mass emission, size distribution, and analytical errors etc.
In addition bias may exist in emission factors arising from:
1. Assumptions made about the abatement used on ‘typical’ industrial installations. For
example emission factors ‘age’, the factors widely used in the Guidebook and hence
by many countries as default emission factors in their national inventories become out
of date. Recent measurement work suggests that they may overestimate emissions
from the industrial processes subject to more modern industrial emissions regulation.
They may, however, still be fully representative for older plant, small plant, or for
poorer fuels;
2. Assumptions about the relationship between TSP and PM10/PM2.5. The technical
literature is comprehensive for TSP and the data quality can be good if measurements
have been made using the international standard methods that are available (typically
the 95% confidence limit ~10%). But a variety of methods are used for particle size
fractionation and as yet there are no harmonised international standards to ensure
comparability. Published measurement data for PM10 is sparse, that for PM2.5
emissions more so. An added complication is that the methodology for the
COMBUSTION IN ENERGY & TRANSFORMATION INDUSTRIES
Activities: Large Combustion Installations
Emission Inventory Guidebook December, 2006 B111 (S2)-19
determination of TSP differs from that of PM10 and PM2.5 and so the two need not
correlate directly.
11 WEAKEST ASPECTS/PRIORITY AREAS FOR IMPROVEMENT IN
CURRENT METHODOLOGY
The stack emission factors described in the Guidebook, and all the PM10 emission factors, are
based whenever possible on measurements. Particle measurements have often been made on
the mass of total particulate matter and then converted to PM10 based either on the size
distribution of the sample collected or, more usually, on size distributions given in the
literature. There may be secondary sources of particulate matter, that are diffuse or fugitive in
nature e.g. emissions from coke ovens, stockpiles, ash handling etc. These emissions are
difficult to measure and in some cases it is likely that no entirely satisfactory measurements
have ever been made, in many cases estimates of emissions from such sources are missing.
There is very little published data suitable for emission inventory compilation. I.e.
representative data of known quality relating a) quantities of (particulate) material released to
b) the activity associated with the release of that pollutant. Suitable data and associated
information would record the determination of mass emissions rates using standardized
measurement methods or calculation-based methods. Ideally such methods would cover the
planning and execution of the data collection programme including: the selection of sampling
methodology, choice of equipment, suitable working procedures, the calculation of
representative emissions rates, the selection of matching activity data, the determination of
sampling/measurement uncertainty, and the reporting of information in a form that is suitable
for calculating emissions factors.
12 SPATIAL DISAGGREGATION CRITERIA FOR AREA SOURCES
Combustion plants should be considered as point sources if plant specific data are available.
Otherwise national emissions should be disaggregated on the basis of plant capacity,
employment or population statistics.
13 TEMPORAL DISAGGREGATION CRITERIA
Combustion processes can be considered as a continuous process however individual
combustion plant may have daily and/or seasonal temporal profiles.
14 ADDITIONAL COMMENTS
See chapter B111.
15 SUPPLEMENTARY DOCUMENTS
Digest of UK Energy Statistics
COMBUSTION IN ENERGY & TRANSFORMATION INDUSTRIES
Activities: Large Combustion Installations
B111 (S2)-20 December, 2006 Emission Inventory Guidebook
Recommendations for the Update and Improvement of Existing PM2.5 Split Factors – Note
from Pacific Environmental Services to US EPA 29 September 2003
IIASA RAINS data
16 VERIFICATION PROCESSES
The applicability of the emission factors quoted, in Section 8 above, for use with highly
regulated plant may be verified using the measurement data listed in Annex 1.
17 REFERENCES
EMEP/CORINAIR Emission Inventory Guidebook – 2005, EEA (European Environment
Agency) Chapter B111
IPPC Best Available Techniques Reference Document on the Production of Iron and Steel,
December 2001, http://eippcb.jrc.es
IPPC Best Available Techniques Reference Document on Large Combustion Plants,
December 2001, http://eippcb.jrc.es
IPPC Best Available Techniques Reference Document on the Production of Pulp and Paper,
December 2001, http://eippcb.jrc.es
NAEI (2005) UK National Atmospheric Emissions Inventory: UK Emissions of Air
Pollutants 1970 to 2003, October 2005
US EPA (1996) Compilation of Air Pollutant Emission Factors Vol.1 Report AP-42 (5th ed.)
US EPA (2003) PM2.5 Source Profiles
http://www.epa.gov/ttn/chief/emch/speciation/index.html
Visschedijk, A.J.H., J. Pacyna, T. Pulles, P. Zandveld and H. Denier van der Gon, 2004,
Cooordinated European Particulate Matter Emission Inventory Program (CEPMEIP), In: P.
Dilara et. Al (eds), Proceedings of the PM emission inventories scientific workshop, Lago
Maggiore, Italy, 18 October 2004, EUR 21302 EN, JRC, pp 163 - 174
18 BIBLIOGRAPHY
19 RELEASE VERSION, DATE AND SOURCE
Version: 1
COMBUSTION IN ENERGY & TRANSFORMATION INDUSTRIES
Activities: Large Combustion Installations
Emission Inventory Guidebook December, 2006 B111 (S2)-21
Date: Aug 2006
Source: R. Stewart
AEA Technology
The Gemini Building
Didcot,
OXON
OX11 0QR
20 POINT OF ENQUIRY
Any comments on this chapter or enquiries should be directed to:
Robert Stewart
AEA Technology Environment
The Gemini Building
Didcot
OXON
OX11 0QR
Tel: +44 870190 6575
Fax: +44 870190 6318
Email: [email protected]
Ute Karl
French-German Institute for Environmental Research
University of Karlsruhe
Hertzstr 16
D-76187 Karlsruhe
Germany
Tel: +49 721 608 4590
Fax: +49 721 75 89 09
Email: [email protected]
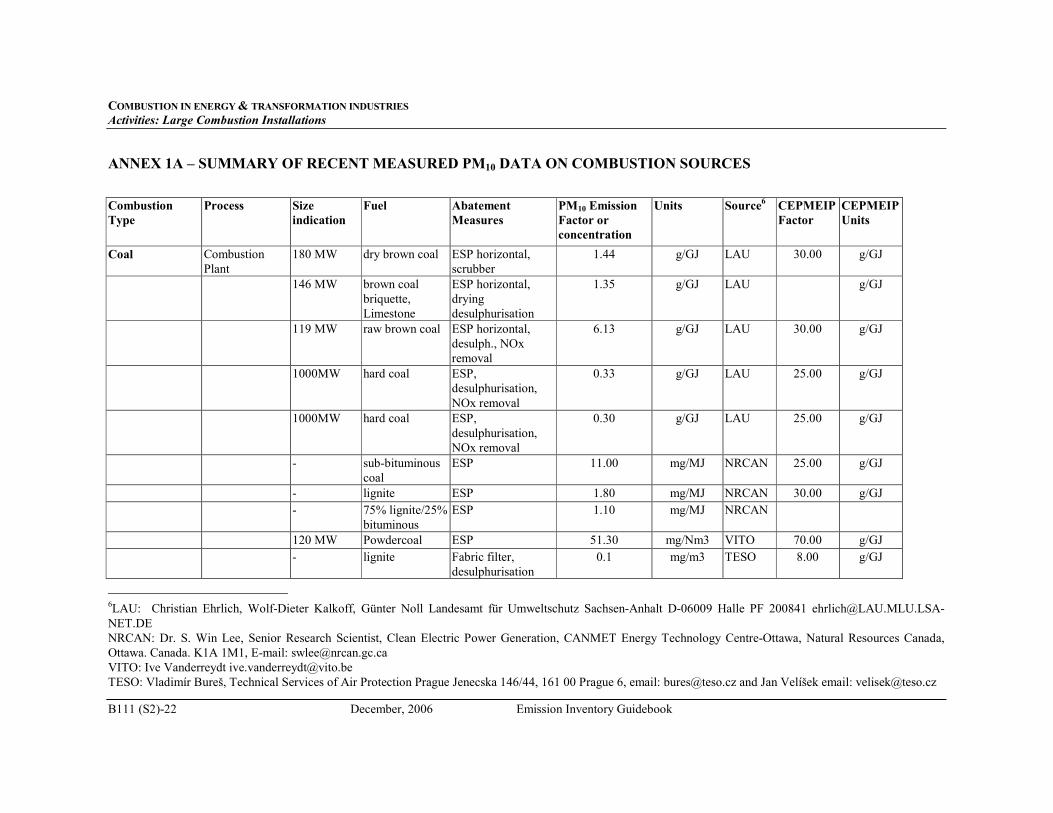
COMBUSTION IN ENERGY & TRANSFORMATION INDUSTRIES
Activities: Large Combustion Installations
B111 (S2)-22 December, 2006 Emission Inventory Guidebook
ANNEX 1A – SUMMARY OF RECENT MEASURED PM10 DATA ON COMBUSTION SOURCES
Combustion
Type
Process Size
indication
Fuel Abatement
Measures
PM10 Emission
Factor or
concentration
Units Source6 CEPMEIP
Factor
CEPMEIP
Units
Coal Combustion
Plant
180 MW dry brown coal ESP horizontal,
scrubber
1.44 g/GJ LAU 30.00 g/GJ
146 MW brown coal
briquette,
Limestone
ESP horizontal,
drying
desulphurisation
1.35 g/GJ LAU g/GJ
119 MW raw brown coal ESP horizontal,
desulph., NOx
removal
6.13 g/GJ LAU 30.00 g/GJ
1000MW hard coal ESP,
desulphurisation,
NOx removal
0.33 g/GJ LAU 25.00 g/GJ
1000MW hard coal ESP,
desulphurisation,
NOx removal
0.30 g/GJ LAU 25.00 g/GJ
- sub-bituminous
coal
ESP 11.00 mg/MJ NRCAN 25.00 g/GJ
- lignite ESP 1.80 mg/MJ NRCAN 30.00 g/GJ
- 75% lignite/25%
bituminous
ESP 1.10 mg/MJ NRCAN
120 MW Powdercoal ESP 51.30 mg/Nm3 VITO 70.00 g/GJ
- lignite Fabric filter,
desulphurisation
0.1 mg/m3 TESO 8.00 g/GJ
6LAU: Christian Ehrlich, Wolf-Dieter Kalkoff, Günter Noll Landesamt für Umweltschutz Sachsen-Anhalt D-06009 Halle PF 200841 [email protected]
NET.DE
NRCAN: Dr. S. Win Lee, Senior Research Scientist, Clean Electric Power Generation, CANMET Energy Technology Centre-Ottawa, Natural Resources Canada,
Ottawa. Canada. K1A 1M1, E-mail: [email protected]
VITO: Ive Vanderreydt [email protected]
TESO: Vladimír Bureš, Technical Services of Air Protection Prague Jenecska 146/44, 161 00 Prague 6, email: [email protected] and Jan Velíšek email: [email protected]
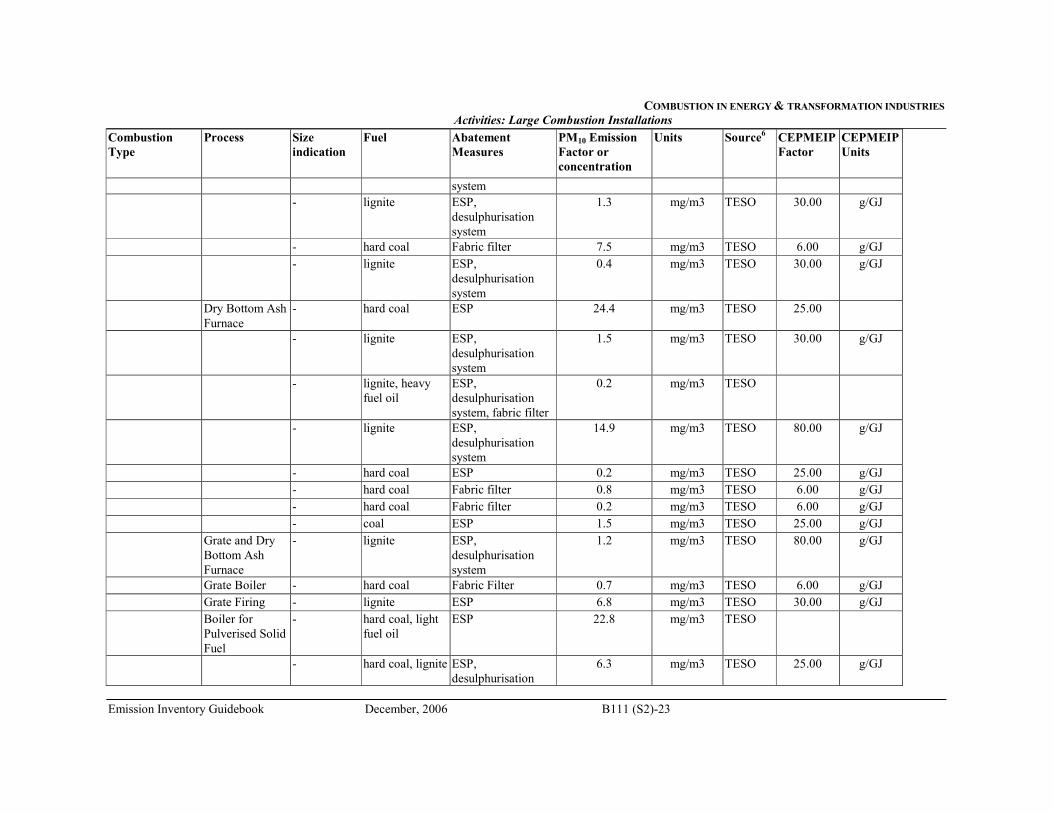
COMBUSTION IN ENERGY & TRANSFORMATION INDUSTRIES
Activities: Large Combustion Installations
Emission Inventory Guidebook December, 2006 B111 (S2)-23
Combustion
Type
Process Size
indication
Fuel Abatement
Measures
PM10 Emission
Factor or
concentration
Units Source6 CEPMEIP
Factor
CEPMEIP
Units
system
- lignite ESP,
desulphurisation
system
1.3 mg/m3 TESO 30.00 g/GJ
- hard coal Fabric filter 7.5 mg/m3 TESO 6.00 g/GJ
- lignite ESP,
desulphurisation
system
0.4 mg/m3 TESO 30.00 g/GJ
Dry Bottom Ash
Furnace
- hard coal ESP 24.4 mg/m3 TESO 25.00
- lignite ESP,
desulphurisation
system
1.5 mg/m3 TESO 30.00 g/GJ
- lignite, heavy
fuel oil
ESP,
desulphurisation
system, fabric filter
0.2 mg/m3 TESO
- lignite ESP,
desulphurisation
system
14.9 mg/m3 TESO 80.00 g/GJ
- hard coal ESP 0.2 mg/m3 TESO 25.00 g/GJ
- hard coal Fabric filter 0.8 mg/m3 TESO 6.00 g/GJ
- hard coal Fabric filter 0.2 mg/m3 TESO 6.00 g/GJ
- coal ESP 1.5 mg/m3 TESO 25.00 g/GJ
Grate and Dry
Bottom Ash
Furnace
- lignite ESP,
desulphurisation
system
1.2 mg/m3 TESO 80.00 g/GJ
Grate Boiler - hard coal Fabric Filter 0.7 mg/m3 TESO 6.00 g/GJ
Grate Firing - lignite ESP 6.8 mg/m3 TESO 30.00 g/GJ
Boiler for
Pulverised Solid
Fuel
- hard coal, light
fuel oil
ESP 22.8 mg/m3 TESO
- hard coal, lignite ESP,
desulphurisation
6.3 mg/m3 TESO 25.00 g/GJ
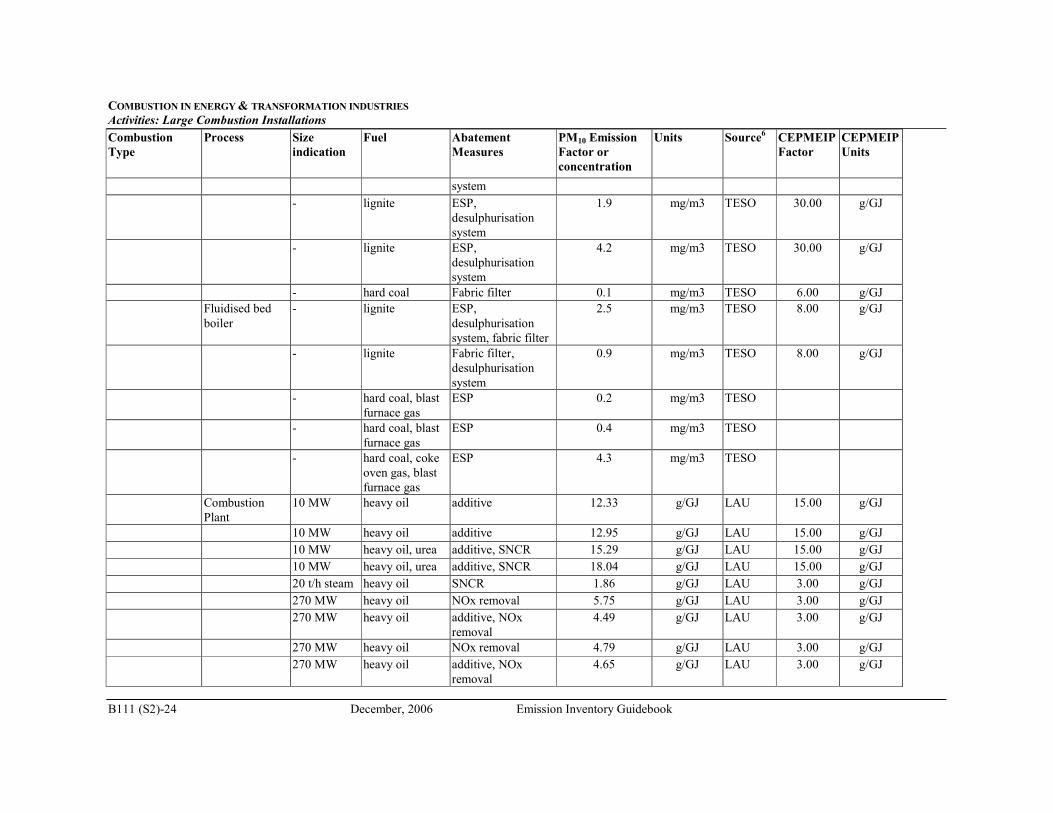
COMBUSTION IN ENERGY & TRANSFORMATION INDUSTRIES
Activities: Large Combustion Installations
B111 (S2)-24 December, 2006 Emission Inventory Guidebook
Combustion
Type
Process Size
indication
Fuel Abatement
Measures
PM10 Emission
Factor or
concentration
Units Source6 CEPMEIP
Factor
CEPMEIP
Units
system
- lignite ESP,
desulphurisation
system
1.9 mg/m3 TESO 30.00 g/GJ
- lignite ESP,
desulphurisation
system
4.2 mg/m3 TESO 30.00 g/GJ
- hard coal Fabric filter 0.1 mg/m3 TESO 6.00 g/GJ
Fluidised bed
boiler
- lignite ESP,
desulphurisation
system, fabric filter
2.5 mg/m3 TESO 8.00 g/GJ
- lignite Fabric filter,
desulphurisation
system
0.9 mg/m3 TESO 8.00 g/GJ
- hard coal, blast
furnace gas
ESP 0.2 mg/m3 TESO
- hard coal, blast
furnace gas
ESP 0.4 mg/m3 TESO
- hard coal, coke
oven gas, blast
furnace gas
ESP 4.3 mg/m3 TESO
Combustion
Plant
10 MW heavy oil additive 12.33 g/GJ LAU 15.00 g/GJ
10 MW heavy oil additive 12.95 g/GJ LAU 15.00 g/GJ
10 MW heavy oil, urea additive, SNCR 15.29 g/GJ LAU 15.00 g/GJ
10 MW heavy oil, urea additive, SNCR 18.04 g/GJ LAU 15.00 g/GJ
20 t/h steam heavy oil SNCR 1.86 g/GJ LAU 3.00 g/GJ
270 MW heavy oil NOx removal 5.75 g/GJ LAU 3.00 g/GJ
270 MW heavy oil additive, NOx
removal
4.49 g/GJ LAU 3.00 g/GJ
270 MW heavy oil NOx removal 4.79 g/GJ LAU 3.00 g/GJ
270 MW heavy oil additive, NOx
removal
4.65 g/GJ LAU 3.00 g/GJ
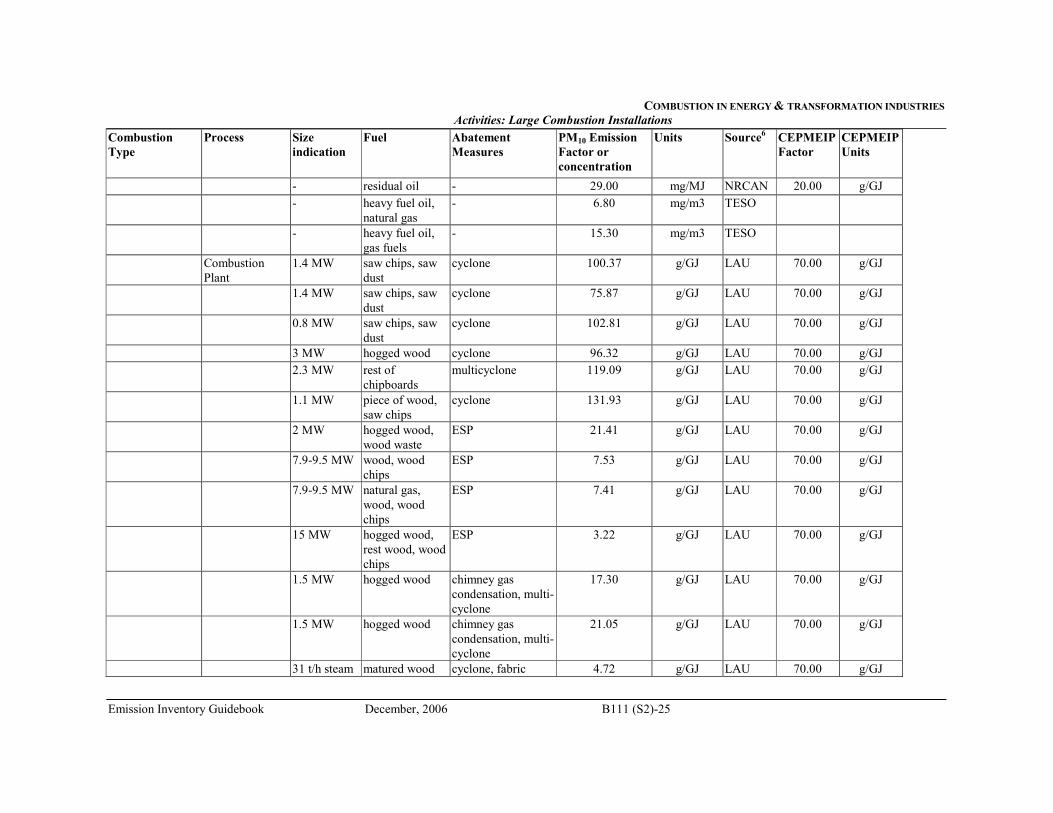
COMBUSTION IN ENERGY & TRANSFORMATION INDUSTRIES
Activities: Large Combustion Installations
Emission Inventory Guidebook December, 2006 B111 (S2)-25
Combustion
Type
Process Size
indication
Fuel Abatement
Measures
PM10 Emission
Factor or
concentration
Units Source6 CEPMEIP
Factor
CEPMEIP
Units
- residual oil - 29.00 mg/MJ NRCAN 20.00 g/GJ
- heavy fuel oil,
natural gas
- 6.80 mg/m3 TESO
- heavy fuel oil,
gas fuels
- 15.30 mg/m3 TESO
Combustion
Plant
1.4 MW saw chips, saw
dust
cyclone 100.37 g/GJ LAU 70.00 g/GJ
1.4 MW saw chips, saw
dust
cyclone 75.87 g/GJ LAU 70.00 g/GJ
0.8 MW saw chips, saw
dust
cyclone 102.81 g/GJ LAU 70.00 g/GJ
3 MW hogged wood cyclone 96.32 g/GJ LAU 70.00 g/GJ
2.3 MW rest of
chipboards
multicyclone 119.09 g/GJ LAU 70.00 g/GJ
1.1 MW piece of wood,
saw chips
cyclone 131.93 g/GJ LAU 70.00 g/GJ
2 MW hogged wood,
wood waste
ESP 21.41 g/GJ LAU 70.00 g/GJ
7.9-9.5 MW wood, wood
chips
ESP 7.53 g/GJ LAU 70.00 g/GJ
7.9-9.5 MW natural gas,
wood, wood
chips
ESP 7.41 g/GJ LAU 70.00 g/GJ
15 MW hogged wood,
rest wood, wood
chips
ESP 3.22 g/GJ LAU 70.00 g/GJ
1.5 MW hogged wood chimney gas
condensation, multi-
cyclone
17.30 g/GJ LAU 70.00 g/GJ
1.5 MW hogged wood chimney gas
condensation, multi-
cyclone
21.05 g/GJ LAU 70.00 g/GJ
31 t/h steam matured wood cyclone, fabric 4.72 g/GJ LAU 70.00 g/GJ
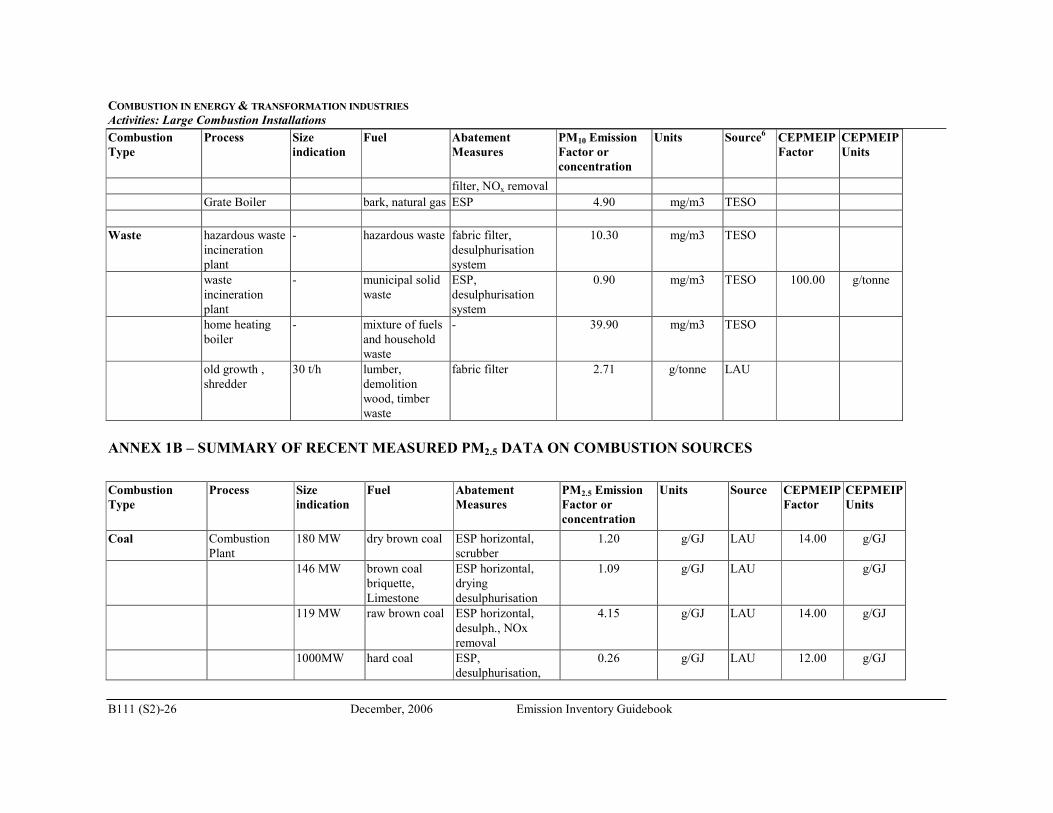
COMBUSTION IN ENERGY & TRANSFORMATION INDUSTRIES
Activities: Large Combustion Installations
B111 (S2)-26 December, 2006 Emission Inventory Guidebook
Combustion
Type
Process Size
indication
Fuel Abatement
Measures
PM10 Emission
Factor or
concentration
Units Source6 CEPMEIP
Factor
CEPMEIP
Units
filter, NOx removal
Grate Boiler bark, natural gas ESP 4.90 mg/m3 TESO
Waste hazardous waste
incineration
plant
- hazardous waste fabric filter,
desulphurisation
system
10.30 mg/m3 TESO
waste
incineration
plant
- municipal solid
waste
ESP,
desulphurisation
system
0.90 mg/m3 TESO 100.00 g/tonne
home heating
boiler
- mixture of fuels
and household
waste
- 39.90 mg/m3 TESO
old growth ,
shredder
30 t/h lumber,
demolition
wood, timber
waste
fabric filter 2.71 g/tonne LAU
ANNEX 1B – SUMMARY OF RECENT MEASURED PM2.5 DATA ON COMBUSTION SOURCES
Combustion
Type
Process Size
indication
Fuel Abatement
Measures
PM2.5 Emission
Factor or
concentration
Units Source CEPMEIP
Factor
CEPMEIP
Units
Coal Combustion
Plant
180 MW dry brown coal ESP horizontal,
scrubber
1.20 g/GJ LAU 14.00 g/GJ
146 MW brown coal
briquette,
Limestone
ESP horizontal,
drying
desulphurisation
1.09 g/GJ LAU g/GJ
119 MW raw brown coal ESP horizontal,
desulph., NOx
removal
4.15 g/GJ LAU 14.00 g/GJ
1000MW hard coal ESP,
desulphurisation,
0.26 g/GJ LAU 12.00 g/GJ
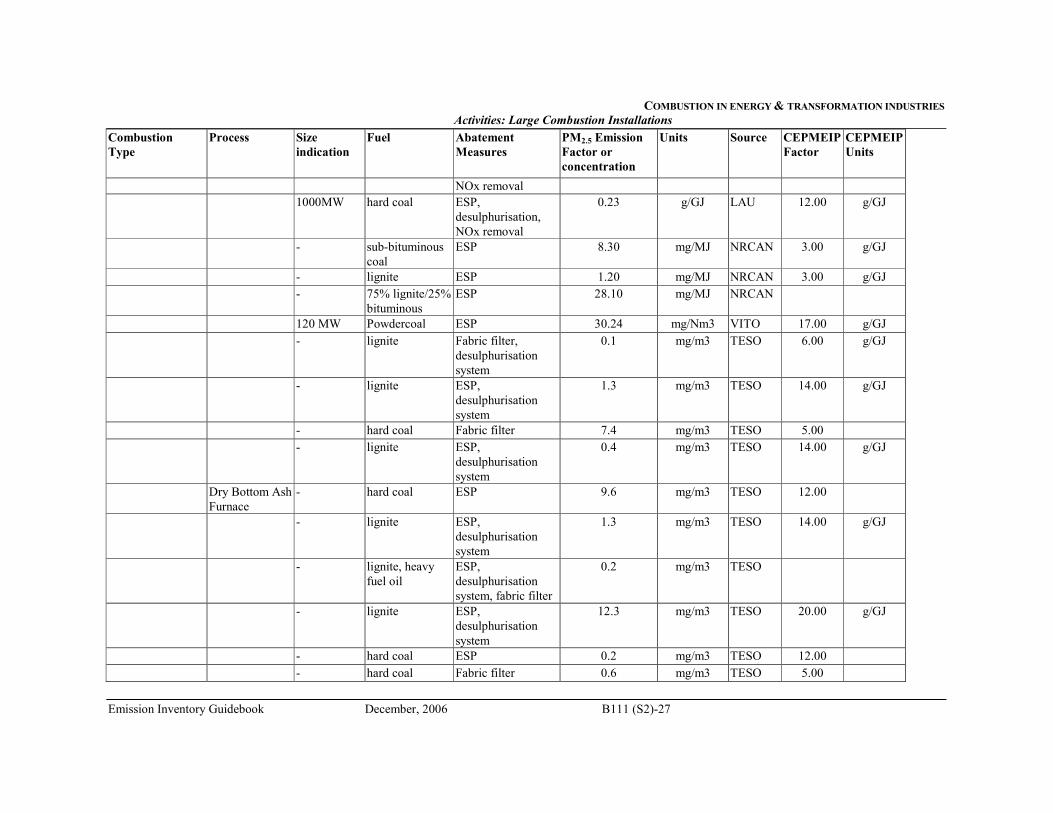
COMBUSTION IN ENERGY & TRANSFORMATION INDUSTRIES
Activities: Large Combustion Installations
Emission Inventory Guidebook December, 2006 B111 (S2)-27
Combustion
Type
Process Size
indication
Fuel Abatement
Measures
PM2.5 Emission
Factor or
concentration
Units Source CEPMEIP
Factor
CEPMEIP
Units
NOx removal
1000MW hard coal ESP,
desulphurisation,
NOx removal
0.23 g/GJ LAU 12.00 g/GJ
- sub-bituminous
coal
ESP 8.30 mg/MJ NRCAN 3.00 g/GJ
- lignite ESP 1.20 mg/MJ NRCAN 3.00 g/GJ
- 75% lignite/25%
bituminous
ESP 28.10 mg/MJ NRCAN
120 MW Powdercoal ESP 30.24 mg/Nm3 VITO 17.00 g/GJ
- lignite Fabric filter,
desulphurisation
system
0.1 mg/m3 TESO 6.00 g/GJ
- lignite ESP,
desulphurisation
system
1.3 mg/m3 TESO 14.00 g/GJ
- hard coal Fabric filter 7.4 mg/m3 TESO 5.00
- lignite ESP,
desulphurisation
system
0.4 mg/m3 TESO 14.00 g/GJ
Dry Bottom Ash
Furnace
- hard coal ESP 9.6 mg/m3 TESO 12.00
- lignite ESP,
desulphurisation
system
1.3 mg/m3 TESO 14.00 g/GJ
- lignite, heavy
fuel oil
ESP,
desulphurisation
system, fabric filter
0.2 mg/m3 TESO
- lignite ESP,
desulphurisation
system
12.3 mg/m3 TESO 20.00 g/GJ
- hard coal ESP 0.2 mg/m3 TESO 12.00
- hard coal Fabric filter 0.6 mg/m3 TESO 5.00
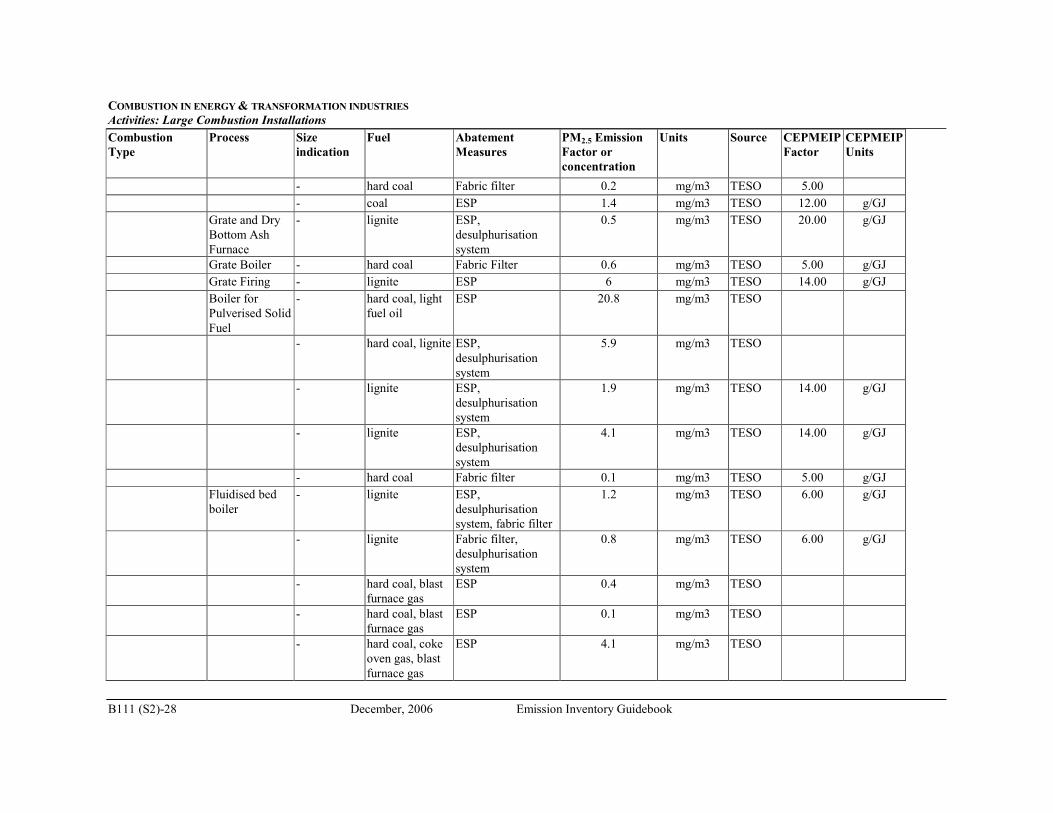
COMBUSTION IN ENERGY & TRANSFORMATION INDUSTRIES
Activities: Large Combustion Installations
B111 (S2)-28 December, 2006 Emission Inventory Guidebook
Combustion
Type
Process Size
indication
Fuel Abatement
Measures
PM2.5 Emission
Factor or
concentration
Units Source CEPMEIP
Factor
CEPMEIP
Units
- hard coal Fabric filter 0.2 mg/m3 TESO 5.00
- coal ESP 1.4 mg/m3 TESO 12.00 g/GJ
Grate and Dry
Bottom Ash
Furnace
- lignite ESP,
desulphurisation
system
0.5 mg/m3 TESO 20.00 g/GJ
Grate Boiler - hard coal Fabric Filter 0.6 mg/m3 TESO 5.00 g/GJ
Grate Firing - lignite ESP 6 mg/m3 TESO 14.00 g/GJ
Boiler for
Pulverised Solid
Fuel
- hard coal, light
fuel oil
ESP 20.8 mg/m3 TESO
- hard coal, lignite ESP,
desulphurisation
system
5.9 mg/m3 TESO
- lignite ESP,
desulphurisation
system
1.9 mg/m3 TESO 14.00 g/GJ
- lignite ESP,
desulphurisation
system
4.1 mg/m3 TESO 14.00 g/GJ
- hard coal Fabric filter 0.1 mg/m3 TESO 5.00 g/GJ
Fluidised bed
boiler
- lignite ESP,
desulphurisation
system, fabric filter
1.2 mg/m3 TESO 6.00 g/GJ
- lignite Fabric filter,
desulphurisation
system
0.8 mg/m3 TESO 6.00 g/GJ
- hard coal, blast
furnace gas
ESP 0.4 mg/m3 TESO
- hard coal, blast
furnace gas
ESP 0.1 mg/m3 TESO
- hard coal, coke
oven gas, blast
furnace gas
ESP 4.1 mg/m3 TESO
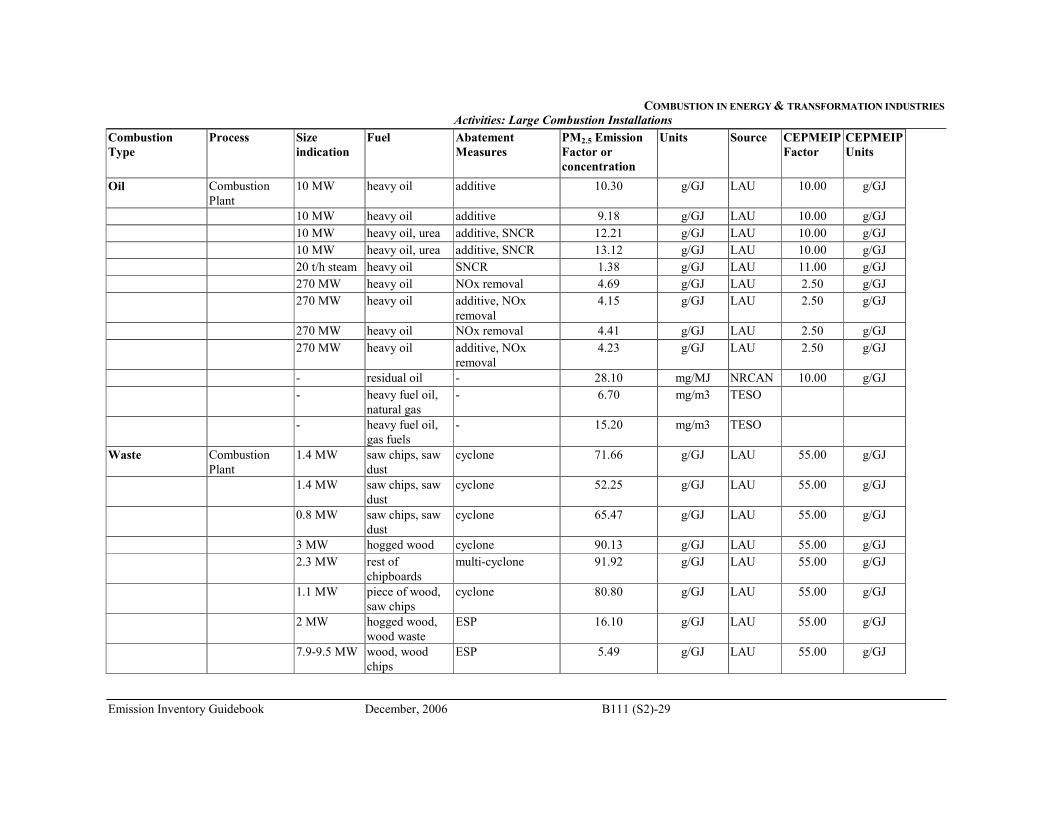
COMBUSTION IN ENERGY & TRANSFORMATION INDUSTRIES
Activities: Large Combustion Installations
Emission Inventory Guidebook December, 2006 B111 (S2)-29
Combustion
Type
Process Size
indication
Fuel Abatement
Measures
PM2.5 Emission
Factor or
concentration
Units Source CEPMEIP
Factor
CEPMEIP
Units
Oil Combustion
Plant
10 MW heavy oil additive 10.30 g/GJ LAU 10.00 g/GJ
10 MW heavy oil additive 9.18 g/GJ LAU 10.00 g/GJ
10 MW heavy oil, urea additive, SNCR 12.21 g/GJ LAU 10.00 g/GJ
10 MW heavy oil, urea additive, SNCR 13.12 g/GJ LAU 10.00 g/GJ
20 t/h steam heavy oil SNCR 1.38 g/GJ LAU 11.00 g/GJ
270 MW heavy oil NOx removal 4.69 g/GJ LAU 2.50 g/GJ
270 MW heavy oil additive, NOx
removal
4.15 g/GJ LAU 2.50 g/GJ
270 MW heavy oil NOx removal 4.41 g/GJ LAU 2.50 g/GJ
270 MW heavy oil additive, NOx
removal
4.23 g/GJ LAU 2.50 g/GJ
- residual oil - 28.10 mg/MJ NRCAN 10.00 g/GJ
- heavy fuel oil,
natural gas
- 6.70 mg/m3 TESO
- heavy fuel oil,
gas fuels
- 15.20 mg/m3 TESO
Waste Combustion
Plant
1.4 MW saw chips, saw
dust
cyclone 71.66 g/GJ LAU 55.00 g/GJ
1.4 MW saw chips, saw
dust
cyclone 52.25 g/GJ LAU 55.00 g/GJ
0.8 MW saw chips, saw
dust
cyclone 65.47 g/GJ LAU 55.00 g/GJ
3 MW hogged wood cyclone 90.13 g/GJ LAU 55.00 g/GJ
2.3 MW rest of
chipboards
multi-cyclone 91.92 g/GJ LAU 55.00 g/GJ
1.1 MW piece of wood,
saw chips
cyclone 80.80 g/GJ LAU 55.00 g/GJ
2 MW hogged wood,
wood waste
ESP 16.10 g/GJ LAU 55.00 g/GJ
7.9-9.5 MW wood, wood
chips
ESP 5.49 g/GJ LAU 55.00 g/GJ
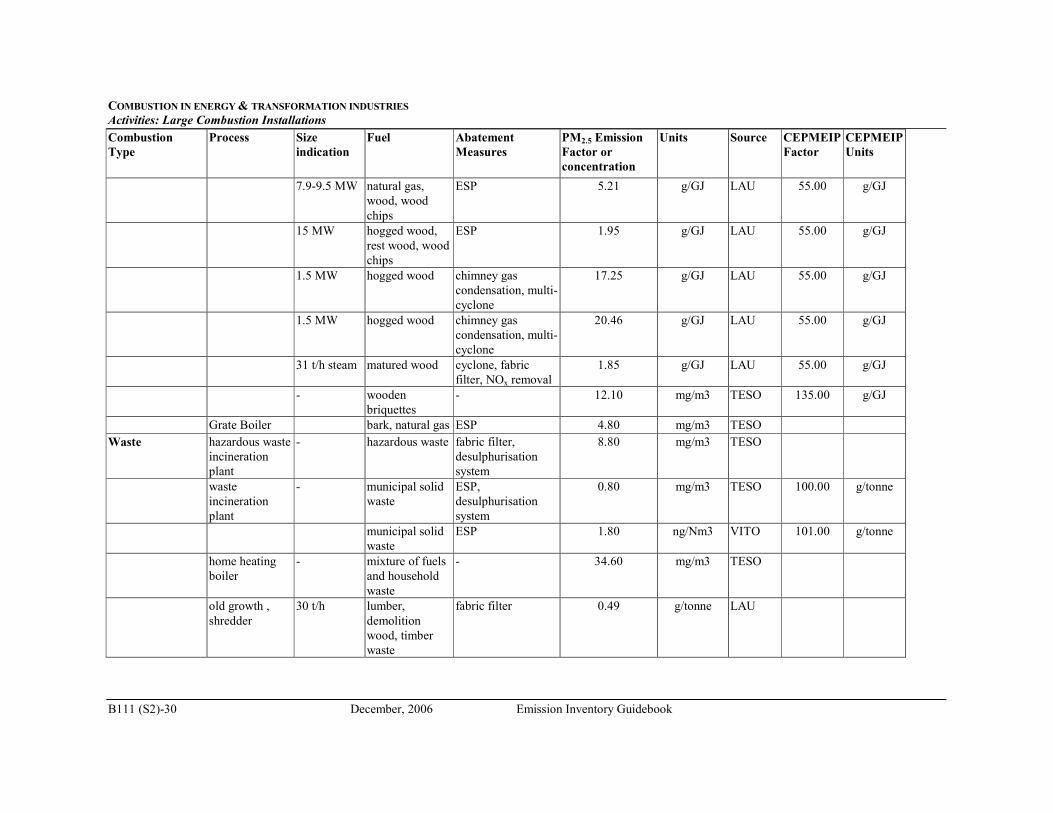
COMBUSTION IN ENERGY & TRANSFORMATION INDUSTRIES
Activities: Large Combustion Installations
B111 (S2)-30 December, 2006 Emission Inventory Guidebook
Combustion
Type
Process Size
indication
Fuel Abatement
Measures
PM2.5 Emission
Factor or
concentration
Units Source CEPMEIP
Factor
CEPMEIP
Units
7.9-9.5 MW natural gas,
wood, wood
chips
ESP 5.21 g/GJ LAU 55.00 g/GJ
15 MW hogged wood,
rest wood, wood
chips
ESP 1.95 g/GJ LAU 55.00 g/GJ
1.5 MW hogged wood chimney gas
condensation, multi-
cyclone
17.25 g/GJ LAU 55.00 g/GJ
1.5 MW hogged wood chimney gas
condensation, multi-
cyclone
20.46 g/GJ LAU 55.00 g/GJ
31 t/h steam matured wood cyclone, fabric
filter, NOx removal
1.85 g/GJ LAU 55.00 g/GJ
- wooden
briquettes
- 12.10 mg/m3 TESO 135.00 g/GJ
Grate Boiler bark, natural gas ESP 4.80 mg/m3 TESO
Waste hazardous waste
incineration
plant
- hazardous waste fabric filter,
desulphurisation
system
8.80 mg/m3 TESO
waste
incineration
plant
- municipal solid
waste
ESP,
desulphurisation
system
0.80 mg/m3 TESO 100.00 g/tonne
municipal solid
waste
ESP 1.80 ng/Nm3 VITO 101.00 g/tonne
home heating
boiler
- mixture of fuels
and household
waste
- 34.60 mg/m3 TESO
old growth ,
shredder
30 t/h lumber,
demolition
wood, timber
waste
fabric filter 0.49 g/tonne LAU
COMBUSTION IN ENERGY & TRANSFORMATION INDUSTRIES
Activities: Gas Turbines and Internal Combustion Engines
Emission Inventory Guidebook December, 2006 B111 (S3)-1
SNAP CODE: 010104 & 010105
010204 & 010205
010404 & 010405
020104 & 020105
020203 & 020204
020303 & 020304
030104 & 030105
SOURCE ACTIVITY TITLE: COMBUSTION IN ENERGY & TRANSFORMATION INDUSTRIES
Particulate emissions from gas turbines and internal combustion engines
NOSE CODE: 101.01
101.02
NFR CODE: 1 A 1 a,b,c
1 A 2 a-f
1 A 4 b,c,i
ISIC 3510
1 ACTIVITIES INCLUDED
This supplement covers emissions of particulate matter (PM) released from combustion
processes within the energy and transformation industries by internal combustion engines - gas
turbines and reciprocating engines . This supplement includes guidance on estimating total PM
(TSP), PM10 and PM2.5 emissions from these sources. Information related to the estimation of
emissions of other pollutants from this sector is given in chapter B111.
2 CONTRIBUTION TO TOTAL EMISSION
The contributions of PM10 and PM2.5 emissions from combustion plant to total emissions in
countries according to the CORINAIR90 inventory are indicated in Table 2.1.
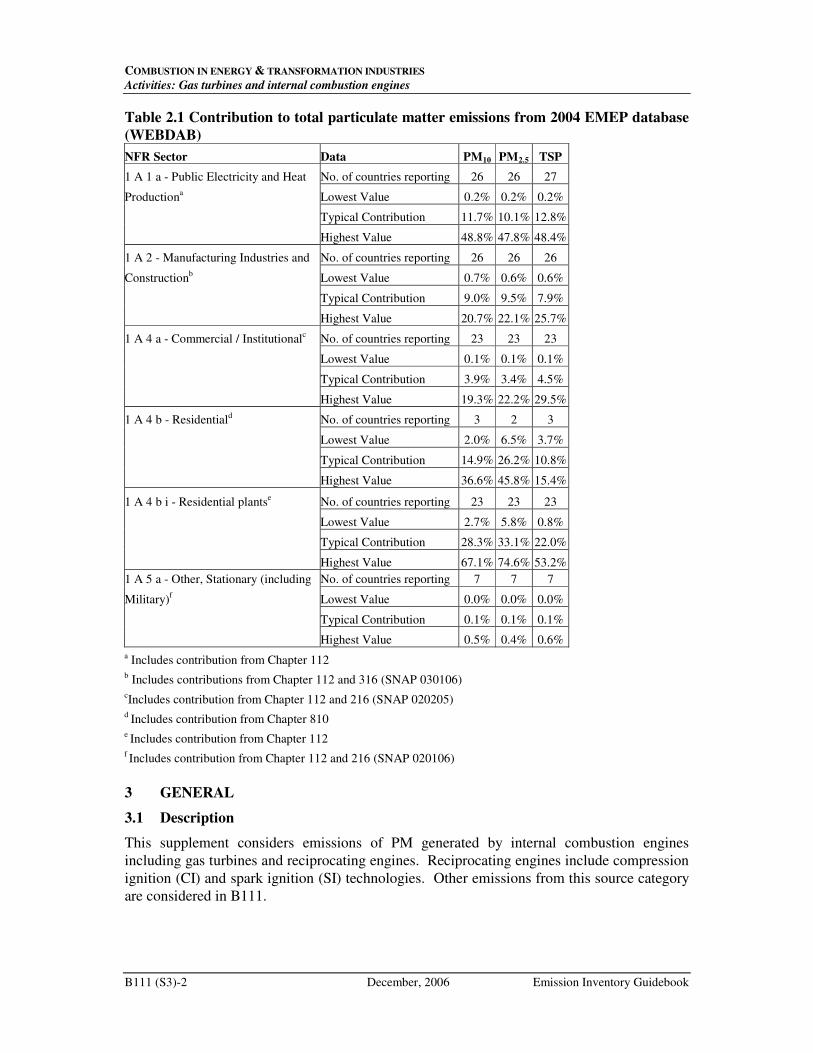
COMBUSTION IN ENERGY & TRANSFORMATION INDUSTRIES
Activities: Gas turbines and internal combustion engines
B111 (S3)-2 December, 2006 Emission Inventory Guidebook
Table 2.1 Contribution to total particulate matter emissions from 2004 EMEP database
(WEBDAB)
NFR Sector Data PM10 PM2.5 TSP
1 A 1 a - Public Electricity and Heat No. of countries reporting 26 26 27
Productiona Lowest Value 0.2% 0.2% 0.2%
Typical Contribution 11.7% 10.1% 12.8%
Highest Value 48.8% 47.8% 48.4%
1 A 2 - Manufacturing Industries and No. of countries reporting 26 26 26
Constructionb Lowest Value 0.7% 0.6% 0.6%
Typical Contribution 9.0% 9.5% 7.9%
Highest Value 20.7% 22.1% 25.7%
1 A 4 a - Commercial / Institutionalc No. of countries reporting 23 23 23
Lowest Value 0.1% 0.1% 0.1%
Typical Contribution 3.9% 3.4% 4.5%
Highest Value 19.3% 22.2% 29.5%
1 A 4 b - Residentiald No. of countries reporting 3 2 3
Lowest Value 2.0% 6.5% 3.7%
Typical Contribution 14.9% 26.2% 10.8%
Highest Value 36.6% 45.8% 15.4%
1 A 4 b i - Residential plantse No. of countries reporting 23 23 23
Lowest Value 2.7% 5.8% 0.8%
Typical Contribution 28.3% 33.1% 22.0%
Highest Value 67.1% 74.6% 53.2%
1 A 5 a - Other, Stationary (including No. of countries reporting 7 7 7
Military)f Lowest Value 0.0% 0.0% 0.0%
Typical Contribution 0.1% 0.1% 0.1%
Highest Value 0.5% 0.4% 0.6%
a Includes contribution from Chapter 112 b Includes contributions from Chapter 112 and 316 (SNAP 030106) cIncludes contribution from Chapter 112 and 216 (SNAP 020205)
d Includes contribution from Chapter 810
e Includes contribution from Chapter 112
f Includes contribution from Chapter 112 and 216 (SNAP 020106)
3 GENERAL
3.1 Description
This supplement considers emissions of PM generated by internal combustion engines
including gas turbines and reciprocating engines. Reciprocating engines include compression
ignition (CI) and spark ignition (SI) technologies. Other emissions from this source category
are considered in B111.
COMBUSTION IN ENERGY & TRANSFORMATION INDUSTRIES
Activities: Gas Turbines and Internal Combustion Engines
Emission Inventory Guidebook December, 2006 B111 (S3)-3
3.2 Definitions
See B111.
3.3 Techniques
See B111 for more information on combustion plant types and fuels.
Gas turbines range in size from <100kW electrical generation (microturbines) to over 250
MW electrical generation. The most common primary fuel is natural gas but gas oil and a
range of derived fuels are also used.
Diesel compression engines also range from a few kW to about 50 MW electrical generation.
The most typical fuel is gas oil but, various derived fuels can be used and heavy fuel oil is
used on some large units. Dual fuel engines burn natural gas or derived gases with a small
quantity of gas oil.
3.4 Emissions
Internal combustion engines use liquid or gaseous fuels and particulate emissions result
mainly from combustion of the fuels.
Combustion of liquid fuels can generate solid residues which may be deposited within
exhaust ducts oron heat exchanger surfaces (soot and fly ash). Suspended ash material in
exhaust gases may be retained by particulate abatement or other emission abatement
equipment (abatement residues). Material which remains in the flue gases beyond the
abatement equipment and passes to the atmosphere is primary PM. Secondary PM is formed
by chemical and physical processes after discharge to atmosphere and is NOT considered
here.
3.5 Controls
Particulate emission reduction is not usually associated with combustion of gaseous fuels
except where derived fuels are used (in which case filtering or other treatment of the fuel gas
is the preferred approach). Particulate abatement equipment may be used with oil fuels and
can include, fuel pre-treatment to reduce mineral content (particularly for heavy fuel oil),
diesel particle filters (on smaller units) or more traditional emission abatement equipment. .
N.B. Emission concentrations of TSP from compression ignition engines associated with Best
Available Techniques (BAT) as defined by EU Integrated Pollution Prevention and Control
regulations are 30 mg m-3
for gas oil and 50 mg m-3
for heavy fuel oil.
COMBUSTION IN ENERGY & TRANSFORMATION INDUSTRIES
Activities: Gas turbines and internal combustion engines
B111 (S3)-4 December, 2006 Emission Inventory Guidebook
4 SIMPLER METHODOLOGY
Emissions can be estimated at different levels of complexity; it is useful to think in terms of
three tiers1:
Tier 1: a method using readily available statistical data on the intensity of processes
(“activity rates”) and default emission factors. These emission factors assume a
linear relation between the intensity of the process and the resulting emissions.
The Tier 1 default emission factors also assume an average or typical process
description.
Tier 2: is similar to Tier 1 but uses more specific emission factors developed on the
basis of knowledge of the types of processes and specific process conditions
that apply in the country for which the inventory is being developed.
Tier 3: is any method that goes beyond the above methods. These might include the
use of more detailed activity information, specific abatement strategies or other
relevant technical information.
By moving from a lower to a higher Tier it is expected that the resulting emission estimate
will be more precise and will have a lower uncertainty. Higher Tier methods will need more
input data and therefore will require more effort to implement.
For the Tier 1 simpler methodology, where limited information is available, a default
emission factor can be used together with activity information for the country or region of
interest with limited or no specification on the type of technology or the type and efficiency of
control equipment. For a Tier 2 approach an approximation may be made of the most
representative technologies, thereby allowing the use of more appropriate default factors if
more detailed activity data are available.
Consequently the simplest methodology (Tier 1) is to combine an activity rate (AR) with a
comparable, representative, value of the emissions per unit activity, the emission factors (EF).
The basic equation is:
Emission = AR x EF
In the energy sector, for example, fuel consumption would be activity data and mass of
material emitted per unit of fuel consumed would be a compatible emission factor.
NOTE: The basic equation may be modified, in some circumstances, to include emission
reduction efficiency (abatement factors).
The Tier 2 methodology is a modified version of this basic equation:
Emission = ∑((AR1 x EF1) + (AR2 x EF2) +….(ARn x EFn))
Default emission factors for this purpose are provided in Sections 8.1 and 8.2.
1 The term “Tier” is used in the 2006 IPCC Guidelines for National Greenhouse Gas Inventories and
adopted here for easy reference and to promote methodological harmonization.
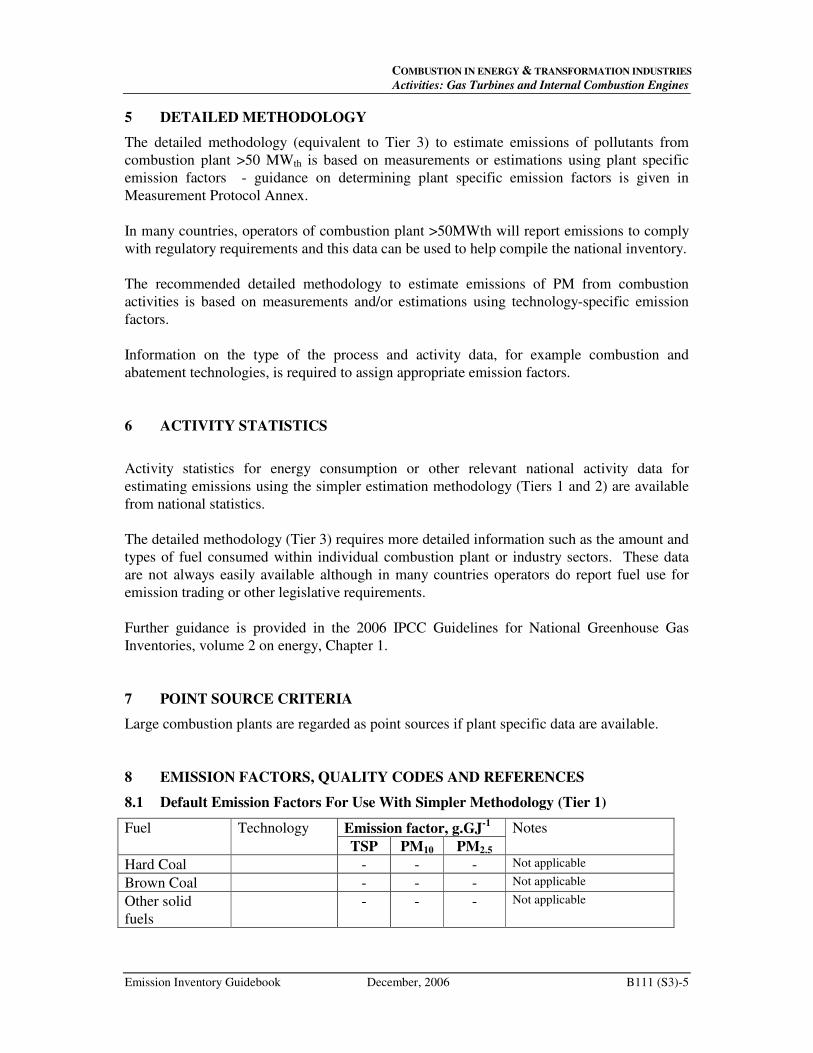
COMBUSTION IN ENERGY & TRANSFORMATION INDUSTRIES
Activities: Gas Turbines and Internal Combustion Engines
Emission Inventory Guidebook December, 2006 B111 (S3)-5
5 DETAILED METHODOLOGY
The detailed methodology (equivalent to Tier 3) to estimate emissions of pollutants from
combustion plant >50 MWth is based on measurements or estimations using plant specific
emission factors - guidance on determining plant specific emission factors is given in
Measurement Protocol Annex.
In many countries, operators of combustion plant >50MWth will report emissions to comply
with regulatory requirements and this data can be used to help compile the national inventory.
The recommended detailed methodology to estimate emissions of PM from combustion
activities is based on measurements and/or estimations using technology-specific emission
factors.
Information on the type of the process and activity data, for example combustion and
abatement technologies, is required to assign appropriate emission factors.
6 ACTIVITY STATISTICS
Activity statistics for energy consumption or other relevant national activity data for
estimating emissions using the simpler estimation methodology (Tiers 1 and 2) are available
from national statistics.
The detailed methodology (Tier 3) requires more detailed information such as the amount and
types of fuel consumed within individual combustion plant or industry sectors. These data
are not always easily available although in many countries operators do report fuel use for
emission trading or other legislative requirements.
Further guidance is provided in the 2006 IPCC Guidelines for National Greenhouse Gas
Inventories, volume 2 on energy, Chapter 1.
7 POINT SOURCE CRITERIA
Large combustion plants are regarded as point sources if plant specific data are available.
8 EMISSION FACTORS, QUALITY CODES AND REFERENCES
8.1 Default Emission Factors For Use With Simpler Methodology (Tier 1)
Fuel Technology Emission factor, g.GJ-1
Notes
TSP PM10 PM2.5
Hard Coal - - - Not applicable
Brown Coal - - - Not applicable
Other solid
fuels
- - - Not applicable
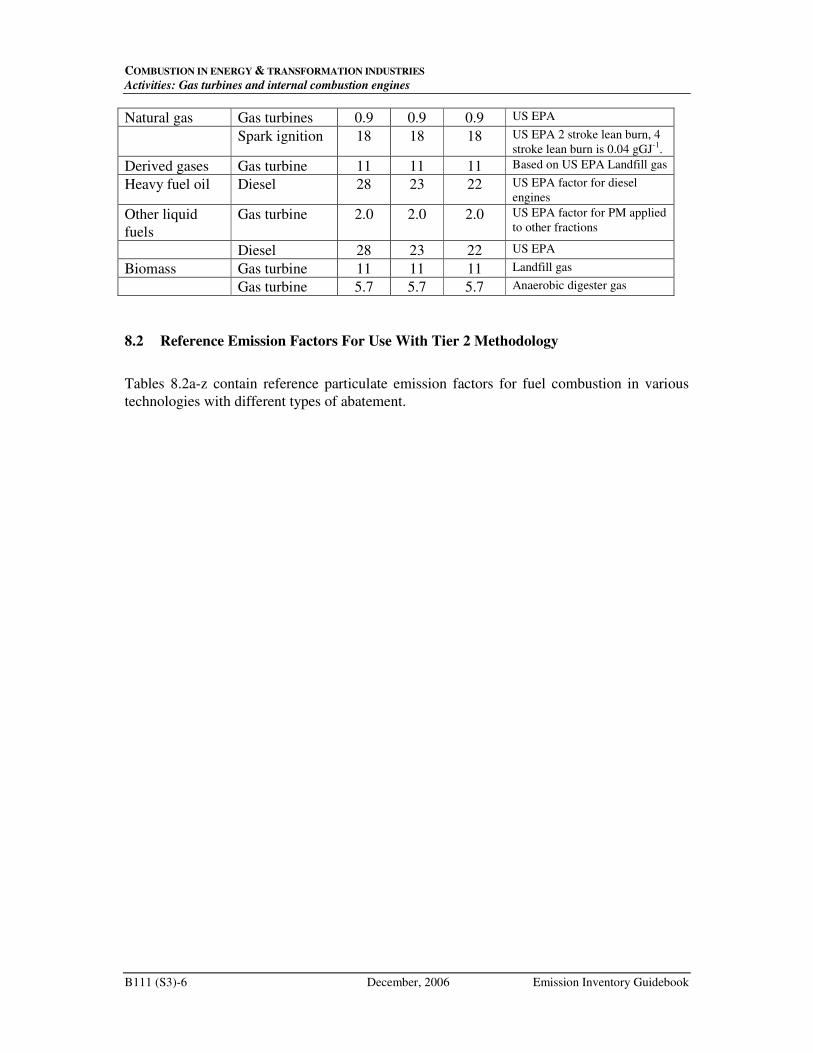
COMBUSTION IN ENERGY & TRANSFORMATION INDUSTRIES
Activities: Gas turbines and internal combustion engines
B111 (S3)-6 December, 2006 Emission Inventory Guidebook
Natural gas Gas turbines 0.9 0.9 0.9 US EPA
Spark ignition 18 18 18 US EPA 2 stroke lean burn, 4
stroke lean burn is 0.04 gGJ-1
.
Derived gases Gas turbine 11 11 11 Based on US EPA Landfill gas
Heavy fuel oil Diesel 28 23 22 US EPA factor for diesel
engines
Other liquid
fuels
Gas turbine 2.0 2.0 2.0 US EPA factor for PM applied
to other fractions
Diesel 28 23 22 US EPA
Biomass Gas turbine 11 11 11 Landfill gas
Gas turbine 5.7 5.7 5.7 Anaerobic digester gas
8.2 Reference Emission Factors For Use With Tier 2 Methodology
Tables 8.2a-z contain reference particulate emission factors for fuel combustion in various
technologies with different types of abatement.
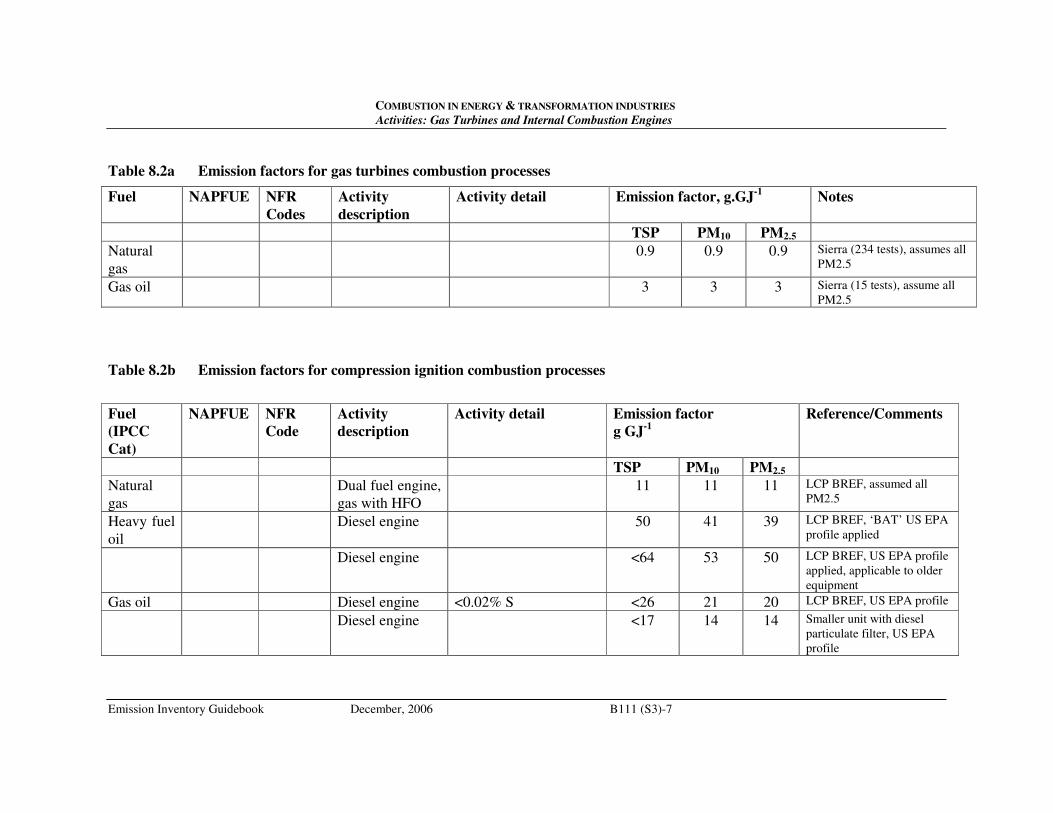
COMBUSTION IN ENERGY & TRANSFORMATION INDUSTRIES
Activities: Gas Turbines and Internal Combustion Engines
Emission Inventory Guidebook December, 2006 B111 (S3)-7
Table 8.2a Emission factors for gas turbines combustion processes
Fuel
NAPFUE NFR
Codes
Activity
description
Activity detail Emission factor, g.GJ-1
Notes
TSP PM10 PM2.5
Natural
gas
0.9 0.9 0.9 Sierra (234 tests), assumes all
PM2.5
Gas oil 3 3 3 Sierra (15 tests), assume all
PM2.5
Table 8.2b Emission factors for compression ignition combustion processes
Fuel
(IPCC
Cat)
NAPFUE NFR
Code
Activity
description
Activity detail Emission factor
g GJ-1
Reference/Comments
TSP PM10 PM2.5
Natural
gas
Dual fuel engine,
gas with HFO
11 11 11 LCP BREF, assumed all
PM2.5
Heavy fuel
oil
Diesel engine 50 41 39 LCP BREF, ‘BAT’ US EPA
profile applied
Diesel engine <64 53 50 LCP BREF, US EPA profile
applied, applicable to older
equipment
Gas oil Diesel engine <0.02% S <26 21 20 LCP BREF, US EPA profile
Diesel engine <17 14 14 Smaller unit with diesel
particulate filter, US EPA
profile
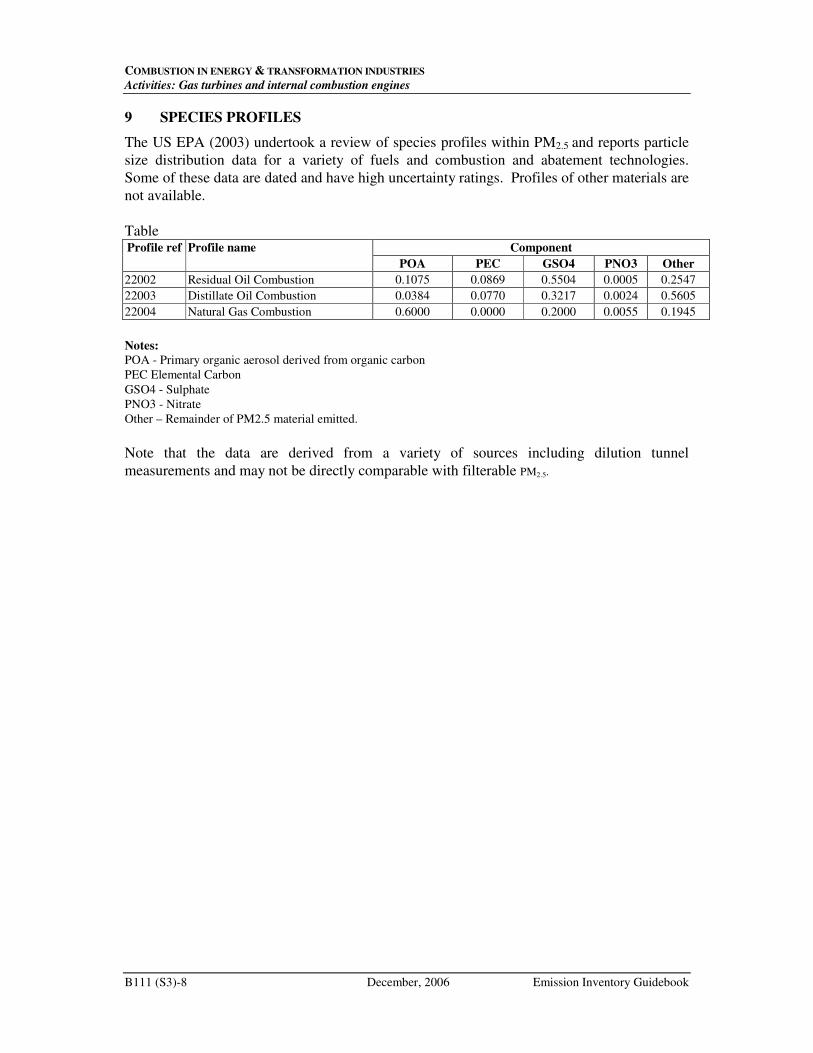
COMBUSTION IN ENERGY & TRANSFORMATION INDUSTRIES
Activities: Gas turbines and internal combustion engines
B111 (S3)-8 December, 2006 Emission Inventory Guidebook
9 SPECIES PROFILES
The US EPA (2003) undertook a review of species profiles within PM2.5 and reports particle
size distribution data for a variety of fuels and combustion and abatement technologies.
Some of these data are dated and have high uncertainty ratings. Profiles of other materials are
not available.
Table Profile ref Profile name Component
POA PEC GSO4 PNO3 Other
22002 Residual Oil Combustion 0.1075 0.0869 0.5504 0.0005 0.2547
22003 Distillate Oil Combustion 0.0384 0.0770 0.3217 0.0024 0.5605
22004 Natural Gas Combustion 0.6000 0.0000 0.2000 0.0055 0.1945
Notes:
POA - Primary organic aerosol derived from organic carbon
PEC Elemental Carbon
GSO4 - Sulphate
PNO3 - Nitrate
Other – Remainder of PM2.5 material emitted.
Note that the data are derived from a variety of sources including dilution tunnel
measurements and may not be directly comparable with filterable PM2.5.
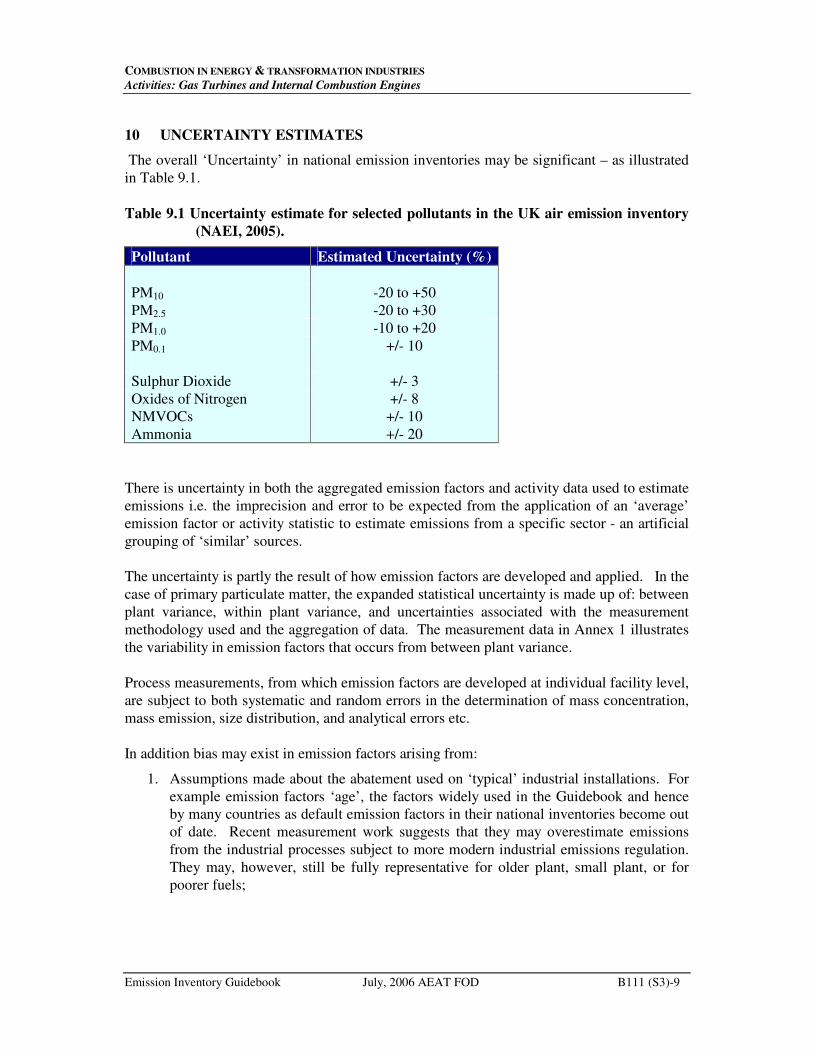
COMBUSTION IN ENERGY & TRANSFORMATION INDUSTRIES
Activities: Gas Turbines and Internal Combustion Engines
Emission Inventory Guidebook July, 2006 AEAT FOD B111 (S3)-9
10 UNCERTAINTY ESTIMATES
The overall ‘Uncertainty’ in national emission inventories may be significant – as illustrated
in Table 9.1.
Table 9.1 Uncertainty estimate for selected pollutants in the UK air emission inventory
(NAEI, 2005).
Pollutant Estimated Uncertainty (%)
PM10 -20 to +50
PM2.5 -20 to +30
PM1.0 -10 to +20
PM0.1 +/- 10
Sulphur Dioxide +/- 3
Oxides of Nitrogen +/- 8
NMVOCs +/- 10
Ammonia +/- 20
There is uncertainty in both the aggregated emission factors and activity data used to estimate
emissions i.e. the imprecision and error to be expected from the application of an ‘average’
emission factor or activity statistic to estimate emissions from a specific sector - an artificial
grouping of ‘similar’ sources.
The uncertainty is partly the result of how emission factors are developed and applied. In the
case of primary particulate matter, the expanded statistical uncertainty is made up of: between
plant variance, within plant variance, and uncertainties associated with the measurement
methodology used and the aggregation of data. The measurement data in Annex 1 illustrates
the variability in emission factors that occurs from between plant variance.
Process measurements, from which emission factors are developed at individual facility level,
are subject to both systematic and random errors in the determination of mass concentration,
mass emission, size distribution, and analytical errors etc.
In addition bias may exist in emission factors arising from:
1. Assumptions made about the abatement used on ‘typical’ industrial installations. For
example emission factors ‘age’, the factors widely used in the Guidebook and hence
by many countries as default emission factors in their national inventories become out
of date. Recent measurement work suggests that they may overestimate emissions
from the industrial processes subject to more modern industrial emissions regulation.
They may, however, still be fully representative for older plant, small plant, or for
poorer fuels;
COMBUSTION IN ENERGY & TRANSFORMATION INDUSTRIES
Activities: Gas turbines and internal combustion engines
B111 (S3)-10 December, 2006 Emission Inventory Guidebook
Assumptions about the relationship between TSP and PM10/PM2.5. The technical literature is
comprehensive for TSP and the data quality can be good if measurements have been made
using the international standard methods that are available (typically the 95% confidence limit
~10%). But a variety of methods are used for particle size fractionation and as yet there are
no harmonised international standards to ensure comparability. Published measurement data
for PM10 is sparse, that for PM2.5 emissions more so. An added complication is that the
methodology for the determination of TSP differs from that of PM10 and PM2.5 and so the
two need not correlate directly.
11 WEAKEST ASPECTS/PRIORITY AREAS FOR IMPROVEMENT IN
CURRENT METHODOLOGY
Published PM2.5 emission factor information for stationary engines is sparse. It is difficult to
form a representative estimate the emissions likely to arise from the range of engine/fuel
combinations commonly encountered. Further work is required to develop a more complete
range of emission factors.
12 SPATIAL DISAGGREGATION CRITERIA FOR AREA SOURCES
Combustion plants should be considered as point sources if plant specific data are available.
Otherwise national emissions should be disaggregated on the basis of plant capacity,
employment or population statistics.
13 TEMPORAL DISAGGREGATION CRITERIA
Combustion processes can be considered as a continuous process however individual
combustion plant may have daily and/or seasonal temporal profiles.
14 ADDITIONAL COMMENTS
See chapter B111 and B111 (S2) for measurement data in Annex 1.
15 SUPPLEMENTARY DOCUMENTS
None
16 VERIFICATION PROCESSES
Published PM2.5 emission data for stationary engines is sparse.
COMBUSTION IN ENERGY & TRANSFORMATION INDUSTRIES
Activities: Gas Turbines and Internal Combustion Engines
Emission Inventory Guidebook July, 2006 AEAT FOD B111 (S3)-11
17 REFERENCES
AEAT CCGT Measurement data
Digest of UK Energy Statistics
England, G.C., “Development of Fine Particulate Emission Factors and Speciation Profiles
for Oil and Gas-fired Combustion Systems, Final Report, 2004.”
EMEP/CORINAIR Emission Inventory Guidebook – 2005, EEA (European Environment
Agency) Chapter B111
IIASA RAINS data
IPPC Best Available Techniques Reference Document on Large Combustion Plants,
December 2001, http://eippcb.jrc.es
IPCC Guidance document
NAEI (2005) UK National Atmospheric Emissions Inventory: UK Emissions of Air
Pollutants 1970 to 2003, October 2005
US EPA (1996) Compilation of Air Pollutant Emission Factors Vol.1 Report AP-42 (5th
ed.)
US EPA (2003) PM2.5 Source Profiles
http://www.epa.gov/ttn/chief/emch/speciation/index.html
Recommendations for the Update and Improvement of Existing PM2.5 Split Factors – Note
from Pacific Environmental Services to US EPA 29 September 2003
Rentz, O.; Karl, U.; Peter, H. Determination and evaluation of emission factors for
combustion installations in Germany for the years 1995, 2000 and 2010. French-German
Institute for Environmental Research University of Karlsruhe (TH), Dec 2002.
Rubenstein, G. Gas Turbine PM Emissions – Update. Sierra Research, June 2003 Paper to
ASME/IGTI Turbo-Expo, Atlanta 2003
18 BIBLIOGRAPHY
19 RELEASE VERSION, DATE AND SOURCE
Version: 1
Date: Aug 2006
COMBUSTION IN ENERGY & TRANSFORMATION INDUSTRIES
Activities: Gas turbines and internal combustion engines
B111 (S3)-12 December, 2006 Emission Inventory Guidebook
Source: R. Stewart
AEA Technology
The Gemini Building
Didcot,
OXON
OX11 0QR
20 POINT OF ENQUIRY
Any comments on this chapter or enquiries should be directed to:
Robert Stewart
AEA Technology Environment
The Gemini Building
Didcot
OXON
OX11 0QR
Tel: +44 870190 6575
Fax: +44 870190 6318
Email: [email protected]
Jozef Pacyna
NILU - Norwegian Institute of Air Research
PO Box 100
N-2027 Kjeller
Norway
Tel: +47 63 89 8155
Fax: +47 63 89 80 50
Email: [email protected]
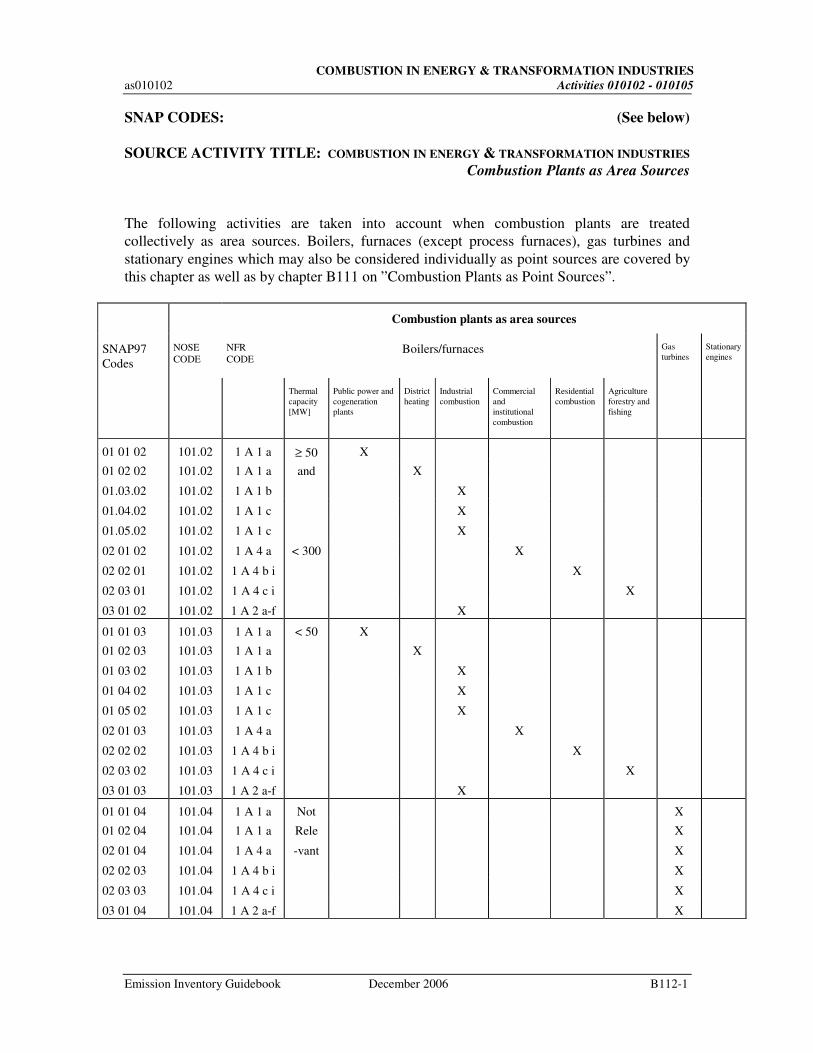
COMBUSTION IN ENERGY & TRANSFORMATION INDUSTRIES
as010102 Activities 010102 - 010105
Emission Inventory Guidebook December 2006 B112-1
SNAP CODES: (See below)
SOURCE ACTIVITY TITLE: COMBUSTION IN ENERGY & TRANSFORMATION INDUSTRIES
Combustion Plants as Area Sources
The following activities are taken into account when combustion plants are treated
collectively as area sources. Boilers, furnaces (except process furnaces), gas turbines and
stationary engines which may also be considered individually as point sources are covered by
this chapter as well as by chapter B111 on ”Combustion Plants as Point Sources”.
Combustion plants as area sources
SNAP97
Codes
NOSE
CODE
NFR
CODE Boilers/furnaces Gas
turbines
Stationary
engines
Thermal
capacity
[MW]
Public power and
cogeneration
plants
District
heating
Industrial
combustion
Commercial
and
institutional
combustion
Residential
combustion
Agriculture
forestry and
fishing
01 01 02 101.02 1 A 1 a ≥ 50 X
01 02 02 101.02 1 A 1 a and X
01.03.02 101.02 1 A 1 b X
01.04.02 101.02 1 A 1 c X
01.05.02 101.02 1 A 1 c X
02 01 02 101.02 1 A 4 a < 300 X
02 02 01 101.02 1 A 4 b i X
02 03 01 101.02 1 A 4 c i X
03 01 02 101.02 1 A 2 a-f X
01 01 03 101.03 1 A 1 a < 50 X
01 02 03 101.03 1 A 1 a X
01 03 02 101.03 1 A 1 b X
01 04 02 101.03 1 A 1 c X
01 05 02 101.03 1 A 1 c X
02 01 03 101.03 1 A 4 a X
02 02 02 101.03 1 A 4 b i X
02 03 02 101.03 1 A 4 c i X
03 01 03 101.03 1 A 2 a-f X
01 01 04 101.04 1 A 1 a Not X
01 02 04 101.04 1 A 1 a Rele X
02 01 04 101.04 1 A 4 a -vant X
02 02 03 101.04 1 A 4 b i X
02 03 03 101.04 1 A 4 c i X
03 01 04 101.04 1 A 2 a-f X

COMBUSTION IN ENERGY & TRANSFORMATION INDUSTRIES
Activities 010102 - 010105 as010102
B112-2 December 2006 Emission Inventory Guidebook
Combustion plants as area sources
SNAP97
Codes
NOSE
CODE
NFR
CODE Boilers/furnaces Gas
turbines
Stationary
engines
Thermal
capacity [MW]
Public
power and
cogeneratio
n plants
District
heating
Industrial
combustion
Commercial
and
institutional
combustion
Residential
combustion
Agriculture
forestry and
fishing
01 01 05 101.05 1 A 1 a Not X
01 02 05 101.05 1 A 1 a Relevant X
02 01 05 101.05 1 A 4 a X
02 02 04 101.05 1 A 4 b i X
02 03 04 101.05 1 A 4 c i X
03 01 05 101.05 1 A 2 a- X
X : indicates relevant combination
1 ACTIVITIES INCLUDED
This chapter covers emissions from combustion plants treated collectively as area sources.
However, e.g. if only a few units exist and thus only little data is available, the individual
approach may be preferable also for small combustion plants.
The subdivision of the SNAP activities according to CORINAIR90 concerning combustion
plants takes into account two criteria:
• the economic sector concerning the use of energy:
• public power and co-generation,
• district heating,
• commercial, institutional and residential combustion,
• industrial combustion,
(Note: process furnaces are allocated separately.)
• the technical characteristics:
• the installed thermal capacity,
− ≥ 50 to < 300 MW,
− < 50 MW,
• other combustion technologies,
− gas turbines,
− stationary engines.
The emissions considered in this section are released by a controlled combustion process
(boiler emissions, furnace emissions, emissions from gas turbines or stationary engines) and
are mainly characterised by the types of fuels used. Furthermore, a technical characterisation
of the combustion sources may be integrated according to the size and type of plants as well
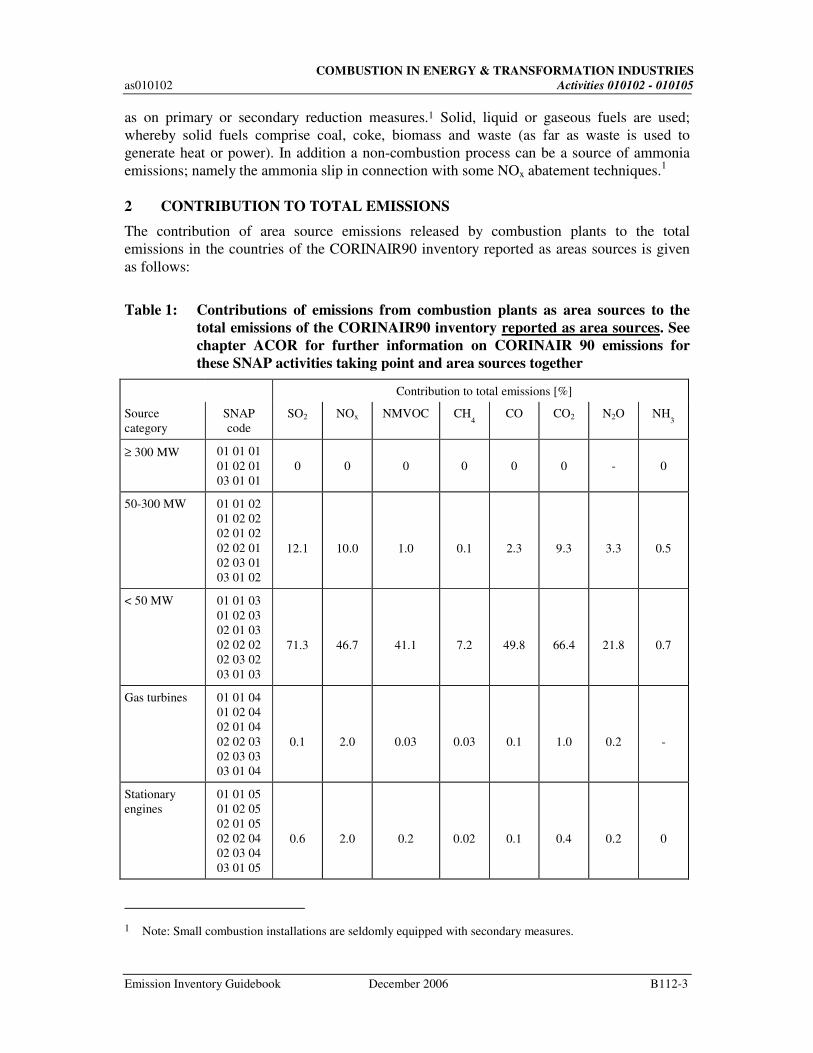
COMBUSTION IN ENERGY & TRANSFORMATION INDUSTRIES
as010102 Activities 010102 - 010105
Emission Inventory Guidebook December 2006 B112-3
as on primary or secondary reduction measures.1 Solid, liquid or gaseous fuels are used;
whereby solid fuels comprise coal, coke, biomass and waste (as far as waste is used to
generate heat or power). In addition a non-combustion process can be a source of ammonia
emissions; namely the ammonia slip in connection with some NOx abatement techniques.1
2 CONTRIBUTION TO TOTAL EMISSIONS
The contribution of area source emissions released by combustion plants to the total
emissions in the countries of the CORINAIR90 inventory reported as areas sources is given
as follows:
Table 1: Contributions of emissions from combustion plants as area sources to the
total emissions of the CORINAIR90 inventory reported as area sources. See
chapter ACOR for further information on CORINAIR 90 emissions for
these SNAP activities taking point and area sources together
Contribution to total emissions [%]
Source
category
SNAP
code
SO2 NOx NMVOC CH4 CO CO2 N2O NH
3
≥ 300 MW 01 01 01
01 02 01
03 01 01
0
0
0
0
0
0
-
0
50-300 MW 01 01 02
01 02 02
02 01 02
02 02 01
02 03 01
03 01 02
12.1
10.0
1.0
0.1
2.3
9.3
3.3
0.5
< 50 MW 01 01 03
01 02 03
02 01 03
02 02 02
02 03 02
03 01 03
71.3
46.7
41.1
7.2
49.8
66.4
21.8
0.7
Gas turbines 01 01 04
01 02 04
02 01 04
02 02 03
02 03 03
03 01 04
0.1
2.0
0.03
0.03
0.1
1.0
0.2
-
Stationary
engines
01 01 05
01 02 05
02 01 05
02 02 04
02 03 04
03 01 05
0.6
2.0
0.2
0.02
0.1
0.4
0.2
0
1 Note: Small combustion installations are seldomly equipped with secondary measures.
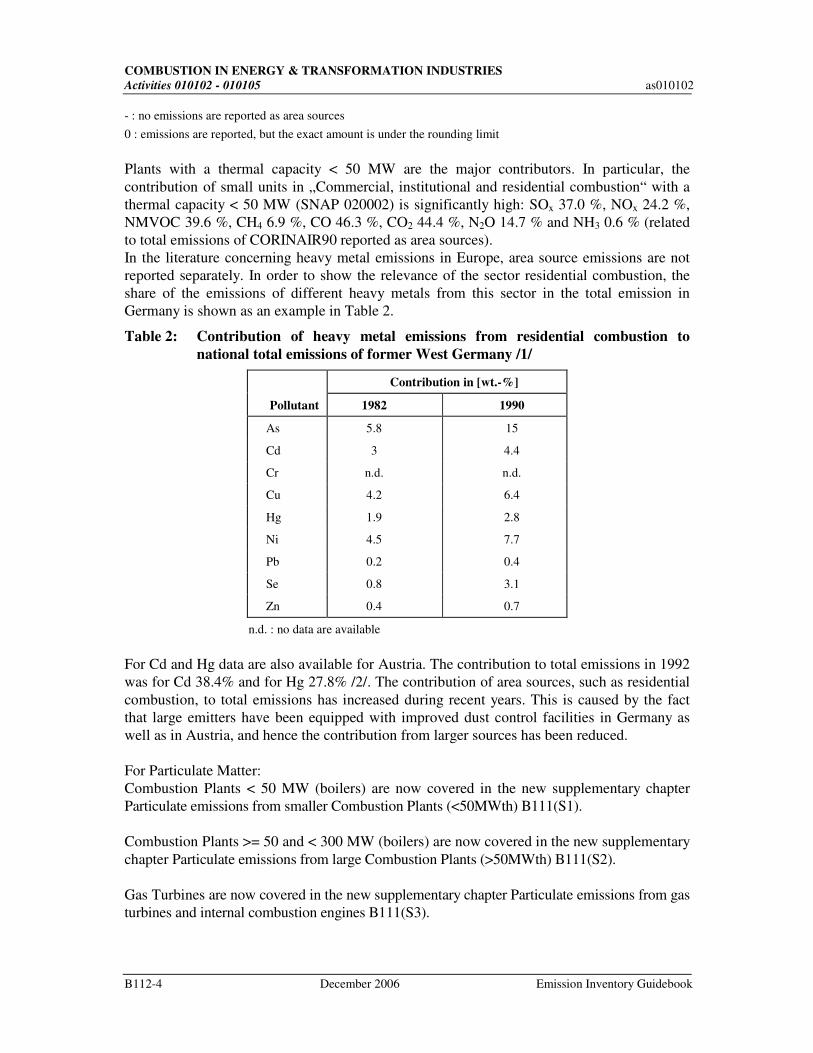
COMBUSTION IN ENERGY & TRANSFORMATION INDUSTRIES
Activities 010102 - 010105 as010102
B112-4 December 2006 Emission Inventory Guidebook
- : no emissions are reported as area sources
0 : emissions are reported, but the exact amount is under the rounding limit
Plants with a thermal capacity < 50 MW are the major contributors. In particular, the
contribution of small units in „Commercial, institutional and residential combustion“ with a
thermal capacity < 50 MW (SNAP 020002) is significantly high: SOx 37.0 %, NOx 24.2 %,
NMVOC 39.6 %, CH4 6.9 %, CO 46.3 %, CO2 44.4 %, N2O 14.7 % and NH3 0.6 % (related
to total emissions of CORINAIR90 reported as area sources).
In the literature concerning heavy metal emissions in Europe, area source emissions are not
reported separately. In order to show the relevance of the sector residential combustion, the
share of the emissions of different heavy metals from this sector in the total emission in
Germany is shown as an example in Table 2.
Table 2: Contribution of heavy metal emissions from residential combustion to
national total emissions of former West Germany /1/
Contribution in [wt.-%]
Pollutant 1982 1990
As 5.8 15
Cd 3 4.4
Cr n.d. n.d.
Cu 4.2 6.4
Hg 1.9 2.8
Ni 4.5 7.7
Pb 0.2 0.4
Se 0.8 3.1
Zn 0.4 0.7
n.d. : no data are available
For Cd and Hg data are also available for Austria. The contribution to total emissions in 1992
was for Cd 38.4% and for Hg 27.8% /2/. The contribution of area sources, such as residential
combustion, to total emissions has increased during recent years. This is caused by the fact
that large emitters have been equipped with improved dust control facilities in Germany as
well as in Austria, and hence the contribution from larger sources has been reduced.
For Particulate Matter:
Combustion Plants < 50 MW (boilers) are now covered in the new supplementary chapter
Particulate emissions from smaller Combustion Plants (<50MWth) B111(S1).
Combustion Plants >= 50 and < 300 MW (boilers) are now covered in the new supplementary
chapter Particulate emissions from large Combustion Plants (>50MWth) B111(S2).
Gas Turbines are now covered in the new supplementary chapter Particulate emissions from gas
turbines and internal combustion engines B111(S3).
COMBUSTION IN ENERGY & TRANSFORMATION INDUSTRIES
as010102 Activities 010102 - 010105
Emission Inventory Guidebook December 2006 B112-5
3 GENERAL
3.1 Description
The emissions considered in this chapter are generated in boilers or in gas turbines and
stationary engines regardless of the allocation of combustion plants to SNAP activities. In
addition, residential combustion is relevant for this chapter. Emissions from process furnaces
and from waste incineration are excluded.
3.2 Definitions
Integrated Coal Gasification
Combined Cycle Gas Turbine
(IGCC)
gas turbine fuelled by gas which is a product of a coal
gasification process.
Boiler any technical apparatus in which fuels are oxidised in
order to generate heat for locally separate use.
Co-generation plant steam production in (a) boiler(s) for both power
generation (in a steam turbine) and heat supply.
Combined Cycle Gas Turbine
(CCGT)
gas turbine combined with a steam turbine. The boiler can
also be fuelled separately.
Furnace fireplace in which fuels are oxidised to heat the direct
surroundings.
Plant element of the collective of emission sources
(e.g. residential combustion) treated as an area source.
Stationary engines spark-ignition engines or compression-ignition engines.
3.3 Techniques
3.3.1 Medium-sized combustion plants - boilers, gas turbines, stationary engines -
(thermal capacity ≥≥≥≥ 50 and < 300 MW)
For the combustion of solid, liquid and gaseous fuels in medium-sized combustion plants
techniques are used which have already been described in Section 3.3 of chapter B111 on
“Combustion Plants as Point Sources”.
3.3.2 Small-sized combustion plants - boilers and furnaces - (thermal capacity < 50
MW)
Small sized combustion plants are divided here into industrial combustion and non-industrial
combustion:
- Industrial combustion:
The techniques used for the combustion of solid, liquid and gaseous fuels in industrial
combustion plants have already been described in Section 3.3 of chapter B111 on
COMBUSTION IN ENERGY & TRANSFORMATION INDUSTRIES
Activities 010102 - 010105 as010102
B112-6 December 2006 Emission Inventory Guidebook
“Combustion Plants as Point Sources“. The share of combustion techniques used is
different: for the combustion of solid fuels mainly grate firing and stationary fluidised bed
combustion are applied.
- Non-industrial combustion:
Non-industrial combustion which includes other small consumers and residential
combustion, is characterised by a great variety of combustion techniques.
For the combustion of solid fuels e.g. mainly grate firing units are installed which can be
distinguished by the type of stoking and the air supply. For example, in manually fed
combustion units (such as single stoves) emissions mainly result from frequent start-
ups/shut-downs; automatically fed combustion units are mainly emission relevant when
the fuel is kept glowing. Normally, older combustion installations release more emissions
than modern combustion installations. Furthermore, combustion installations which often
operate with reduced load conditions are highly emission relevant: this operation mode
occurs frequently in the case of over-dimensioned combustion units. /4, 5/
For the combustion of liquid and gaseous fuels, in principle similar technologies are
applied, such as those described in chapter B111 on “Combustion Plants as Point Sources”
(Section 3.3).
3.4 Emissions
Relevant pollutants are sulphur oxides (SOx), nitrogen oxides (NOx), carbon dioxide (CO2),
carbon monoxide (CO), non-methane volatile organic compounds (NMVOC), methane (CH4)
and heavy metals (arsenic (As), cadmium (Cd), chromium (Cr), copper (Cu), mercury (Hg),
nickel (Ni), lead (Pb), selenium (Se), zinc (Zn) and in the case of heavy oil also vanadium
(V)). Emissions of nitrous oxide (N2O) and ammonia (NH3) are normally of less importance.
The main influencing parameters which determine the emissions and species profiles of some
pollutants are given in Sections 3.4 and 9 of chapter B111 on “Combustion Plants as Point
Sources”. In particular for small combustion installations (e.g. residential combustion)
emissions of NMVOC and CO can occur in considerable amounts; these emissions are mostly
released from inefficiently working stoves (e.g. wood-burning stoves). VOC emissions
released from domestic wood-fired boilers (0.5 - 10 MW) can be significant. Emissions can
be up to ten times higher at 20 % load than those at maximum load /29/.
The emissions are released through the stack. The relevance of fugitive emissions (from seals
etc.) can be neglected for combustion installations. Due to the fact that most references do not
clearly distinguish between SOx and SO2, for the following sections it can be assumed that
SO2 includes SO3, if not stated otherwise.
3.5 Controls
3.5.1 Medium-sized combustion plants - boilers, gas turbines, stationary engines -
(thermal capacity ≥≥≥≥ 50 and < 300 MW)
It can be assumed, that the smaller the combustion installation considered are, the lower is the
probability to be equipped with secondary measures. For cases where abatement technologies
for SO2, NOx or heavy metals (controlled as particulates) are installed, the corresponding
COMBUSTION IN ENERGY & TRANSFORMATION INDUSTRIES
as010102 Activities 010102 - 010105
Emission Inventory Guidebook December 2006 B112-7
technical details are given in Section 3.5 of chapter B111 on “Combustion Plants as Point
Sources”. For SO2 abatement in Germany, larger boilers are mainly controlled by the
limestone wet scrubbing process. In the case of smaller facilities dry sorption processes are
preferred.
3.5.2 Small-sized combustion plants - boilers and furnaces - (thermal capacity < 50
MW)
Small-sized combustion plants have been split into industrial combustion and non-industrial
combustion:
- Industrial combustion:
For cases where abatement technologies for SO2, NOx or heavy metals are installed the
corresponding technical details are given in Section 3.5 of chapter B111 on “Combustion
Plants as Point Sources”. If NOx reduction measures are installed mostly primary reduction
measures (e.g. low NOx burner) are applied.
- Non-industrial combustion:
For small consumers / residential combustion only primary emission control measures are
relevant. Emission reduction is mainly achieved by optimised operation conditions (older
installations) and improved combustion efficiencies (modern installations).
4 SIMPLER METHODOLOGY
For combustion plants treated as area sources only a simpler methodology is given; a detailed
methodology is not applicable (see Section 5). Here “simpler methodology“ refers to the
calculation of emissions based on emission factors and activities and covers all relevant
pollutants (SO2, NOx, NMVOC, CH4, CO, CO2, N2O, heavy metals). Emissions of NH3 are of
less relevance (they are only released as ammonia slip in connection with secondary measures
for NOx abatement).
The annual emission E is determined by an activity A and an emission factor:
Ei = ⋅EF Ai (1)
E i annual emission of pollutant i
EF i emission factor of pollutant i
A annual activity rate
The activity rate A and the emission factor EFi have to be determined on the same level of
aggregation depending on the availability of data. The activity A should be determined within
the considered territorial unit by using adequate statistics (see also Section 6). The activity
should refer to the energy input of the emission sources considered (fuel consumption in
[GJ]). Alternatively, secondary statistics (surrogate data) can be used for the determination of
the fuel consumption [GJ]. The quality of surrogate data can be characterised by two criteria:
- level of correlation
The surrogate data should be directly related to the required data (e.g. fuel consumption of
households derived from heat demand of households).
COMBUSTION IN ENERGY & TRANSFORMATION INDUSTRIES
Activities 010102 - 010105 as010102
B112-8 December 2006 Emission Inventory Guidebook
- level of aggregation
The surrogate data should be provided on the same level of aggregation (e.g. spatial,
sectoral and seasonal resolution).
Examples for activity rate and surrogate data and origins of possible inaccuracies are listed in
the following:
- annual fuel consumption (recommended activity rate):
- Statistics concerning the annual fuel consumption are often not further specified for
different economic branches, and emission source categories, respectively. Furthermore,
no technical split can be provided.
- annual fuel production [Gg], e.g. production of hard coal, lignite, natural gas:
- The specifications of the fuel used (e.g. different types of coal) are not given. For the
conversion of the unit [Gg] into unit [GJ] only an average heating value can be used.
- density of population, number of households:
- Population statistics correspond to a very high level of aggregation. Further information
has to be used (e.g. percentages of fuel consumed) in order to determine the activity rate
for small consumers (e.g. residential combustion). In particular for fuels which are
distributed by pipelines (e.g. natural gas ) this assessment leads to an uncertainty in the
activity rate determined.
- number of enterprises, number of employees, turnover of enterprises [Mio ECU]:
- The statistical data on enterprise level are often allocated to the economic sector (e.g.
“Production and Distribution of Electric Power, Production and Distribution of Steam,
Hot Water, Compressed Air, District Heating Plants” /EUROSTAT, see Section 6/). On
the other hand, emission factors are specified with regard to the type of fuel and often
also to the type of boiler used.
- heat consumption:
- The specific heat consumption per capita (e.g. [J/employee], [J/inhabitant]) or related to
the area heated (e.g. [J/building], [J/m²]) can be determined by using area and branch
specific data (e.g. differentiation between branches, number of employees, number of
inhabitants).
The emission factor EFi should be calculated as a mean value of all combustion installations
within the territorial unit considered. In practice, a limited number of installations are selected
to determine a representative emission factor which is applied to the total population of the
installations considered. Usually, such emission factors are only specified as a function of
fuel characteristics. However, further parameters should be taken into account, in particular
the technology distribution as well as the size and age distribution of the boilers. Furthermore,
evidence has been given that emissions are significantly affected by the operating conditions
(e.g. inefficiently working stoves).
The emission factor EFi (see Equation (1)) takes into account abatement measures (primary
and secondary). If not stated otherwise the emission factors presented refer to full load
conditions.
COMBUSTION IN ENERGY & TRANSFORMATION INDUSTRIES
as010102 Activities 010102 - 010105
Emission Inventory Guidebook December 2006 B112-9
In the following a calculation procedure for SO2 emission factors is proposed according to
Equation (2):
EF 2 C (1 ) 1 10Sfuel
6
SO s
uH2= ⋅ ⋅ − ⋅ ⋅α (2)
EFSO2 emission factor for SO2 [g/GJ]
CSfuel
average sulphur content of fuel (in mass S/mass fuel [kg/kg])
Hu average lower heating value [Mg/kg]
αs average sulphur retention in ash [ ]
In cases where secondary reduction measures are installed, the reduction efficiency has to be
integrated by applying one of the following assumptions:
- if the total population of combustion installations is equipped with secondary measures, a
mean reduction efficiency of these measures should be used;
- if only few combustion installations are equipped with secondary measures, either these
installations should be treated separately or the mean reduction efficiency should be
calculated with regard to the total population.
Reduction efficiencies for different individual secondary measures are given in Tables 10 and
11 in chapter B111 on “Combustion Plants as Point Sources”.
Equation (2) can be used for all fuels, but for liquid and gaseous fuels the sulphur retention in
ash αs is not relevant. If certain input data of Equation (2) are not available, provided default
values based on literature data can be used:
CSfuel sulphur contents of different fuels see Table 42 (in Section 8),
αS sulphur retention in ash of different types of boiler see Table 82 in chapter B111
on “Combustion Plants as Point Sources“,
Hu lower heating values of different types of fuels see Table 212 in chapter B111 on
“Combustion Plants as Point Sources“.
For other pollutants, according to Equation (1) fuel and technology specific emission factors
EFi are given in Tables 5 - 12 based on literature data; for activity data see Section 6.
5 DETAILED METHODOLOGY
For combustion plants a detailed methodology means the determination of emissions based
on measured data. This is not applicable to area sources as only few emission sources are
monitored directly.
2 A mean value has to be calcutated with regard to the area concerned.
COMBUSTION IN ENERGY & TRANSFORMATION INDUSTRIES
Activities 010102 - 010105 as010102
B112-10 December 2006 Emission Inventory Guidebook
6 RELEVANT ACTIVITY STATISTICS
The following gives a list of available statistics on a national level for the determination of
fuel consumption, installed capacities, socio-economic data, etc.:
- Office for Official Publication of the European Communities (ed.): Annual Statistics 1990;
Luxembourg; 1992
- Statistical Office of the European Communities (EUROSTAT) (ed.): CRONOS Databank;
1993
- OECD (ed.): Environmental Data, Données OCDE sur l’environnement; Compendium;
1993
- Commission of the European Communities (ed.): Energy in Europe; 1993 - Annual Energy
Review; Special Issue; Brussels; 1994
- EUROSTAT (ed.): Panorama of EU Industry’94; Office for official publications of the
European Communities; Luxembourg; 1994
A brief discussion of potential surrogate data for the determination of the activity rate is given
in Section 4.
7 POINT SOURCE CRITERIA
This section is not relevant since this chapter only covers area sources.
8 EMISSION FACTORS, QUALITY CODES AND REFERENCES
8.1 Medium-sized combustion plants (thermal capacity ≥≥≥≥ 50 and < 300 MW)
For medium combustion installations, emission factors for the pollutants NOx, NMVOC,
CH4, CO, CO2, N2O and heavy metals are given in Tables 24 - 31 in chapter B111 on
“Combustion Plants as Point Sources”.
8.2 Small-sized combustion plants (thermal capacity < 50 MW)
Tables 4 - 12 contain emission factors for all pollutants except for SO2 where sulphur
contents of different fuels are given. All emission factor tables have been designed in a
homogeneous structure: Table 3 provides a split of combustion techniques (types of boilers,
etc.); this standard table has been used for all pollutants. The selection of fuels is based on the
CORINAIR90 inventory.
For small-sized combustion installations, emission factors are given related to the type of fuel
consumed and, if useful, related to technical specifications based on literature data. These
emission factors normally refer to stationary operating conditions. Modifications are indicated
as footnotes (instationary conditions e.g. due to manually fed boilers, etc.).
The sequence of the following emission factor tables is:
Table 3: Standard table for emission factors for different pollutants

COMBUSTION IN ENERGY & TRANSFORMATION INDUSTRIES
as010102 Activities 010102 - 010105
Emission Inventory Guidebook December 2006 B112-11
Table 4: Sulphur contents of selected fuels
Table 5: NOx emission factors [g/GJ]
Table 6: NMVOC emission factors [g/GJ]
Table 7: CH4 emission factors [g/GJ]
Table 8: CO emission factors [g/GJ]
Table 9: CO2 emission factors [kg/GJ]
Table 10: N2O emission factors [g/GJ]
Table 11: NH3 emission factors [g/GJ]
Table 12: Heavy metal emission factors (mass pollutant/mass fuel [g/Mg])
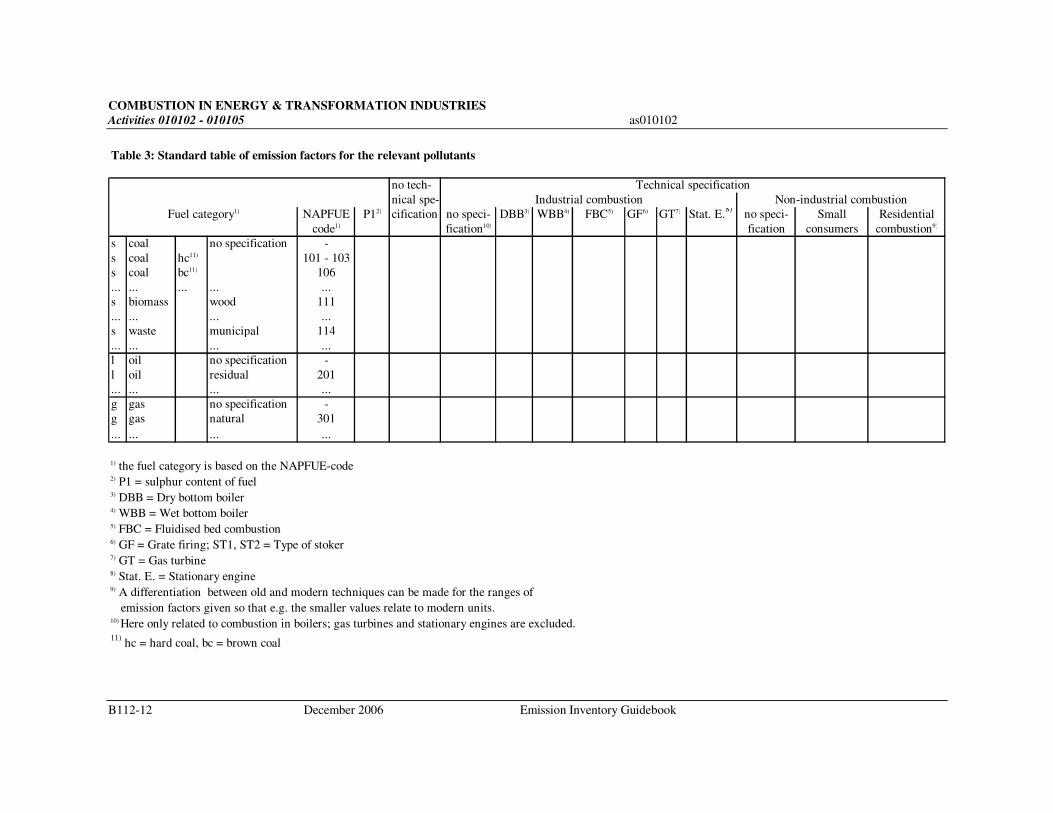
COMBUSTION IN ENERGY & TRANSFORMATION INDUSTRIES
Activities 010102 - 010105 as010102
B112-12 December 2006 Emission Inventory Guidebook
Table 3: Standard table of emission factors for the relevant pollutants
no tech- Technical specification
nical spe- Industrial combustion Non-industrial combustion
Fuel category1) NAPFUE P12) cification no speci- DBB3) WBB4) FBC5) GF6) GT7) Stat. E.8)
no speci- Small Residential
code1) fication10) fication consumers combustion9)
s coal no specification -
s coal hc11) 101 - 103
s coal bc11) 106
... ... ... ... ...
s biomass wood 111
... ... ... ...
s waste municipal 114
... ... ... ...
l oil no specification -
l oil residual 201
... ... ... ...
g gas no specification -
g gas natural 301
... ... ... ...
1) the fuel category is based on the NAPFUE-code2) P1 = sulphur content of fuel3) DBB = Dry bottom boiler4) WBB = Wet bottom boiler5) FBC = Fluidised bed combustion6) GF = Grate firing; ST1, ST2 = Type of stoker7) GT = Gas turbine8) Stat. E. = Stationary engine9) A differentiation between old and modern techniques can be made for the ranges of
emission factors given so that e.g. the smaller values relate to modern units.10) Here only related to combustion in boilers; gas turbines and stationary engines are excluded.11)
hc = hard coal, bc = brown coal
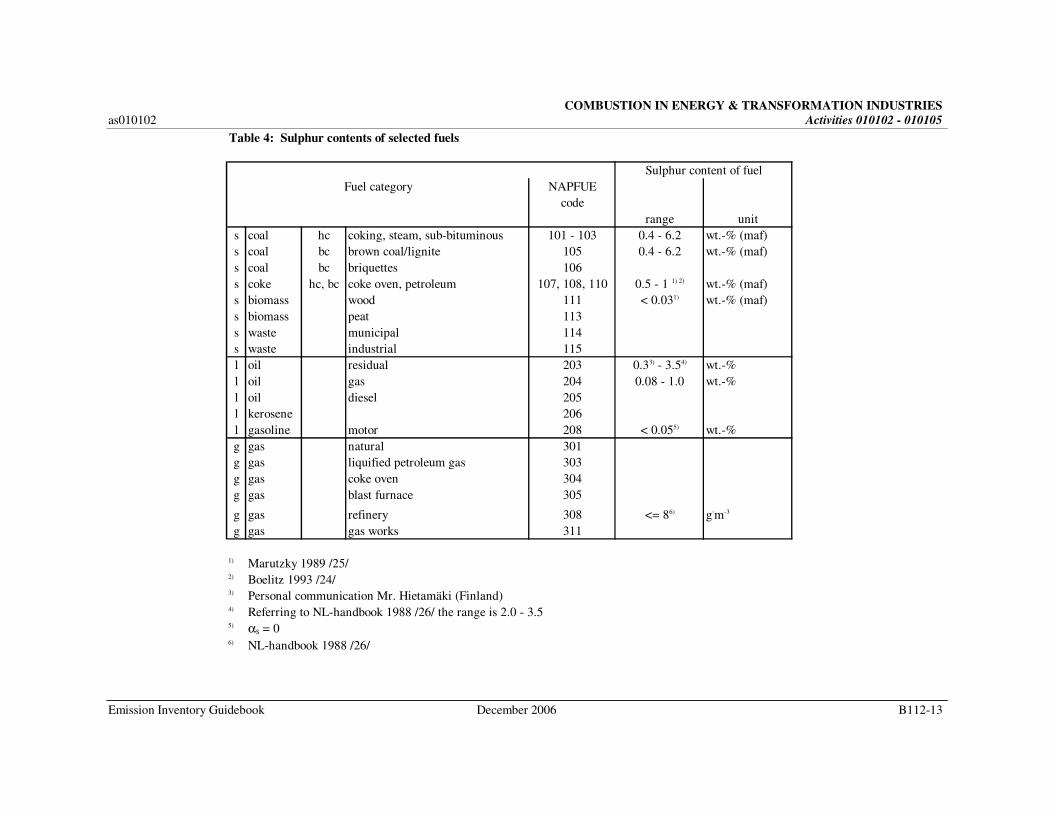
COMBUSTION IN ENERGY & TRANSFORMATION INDUSTRIES
as010102 Activities 010102 - 010105
Emission Inventory Guidebook December 2006 B112-13
Table 4: Sulphur contents of selected fuels
Sulphur content of fuel
Fuel category NAPFUE
code
range unit
s coal hc coking, steam, sub-bituminous 101 - 103 0.4 - 6.2 wt.-% (maf)
s coal bc brown coal/lignite 105 0.4 - 6.2 wt.-% (maf)
s coal bc briquettes 106
s coke hc, bc coke oven, petroleum 107, 108, 110 0.5 - 1 1) 2) wt.-% (maf)
s biomass wood 111 < 0.031) wt.-% (maf)
s biomass peat 113
s waste municipal 114
s waste industrial 115
l oil residual 203 0.33) - 3.54) wt.-%
l oil gas 204 0.08 - 1.0 wt.-%
l oil diesel 205
l kerosene 206
l gasoline motor 208 < 0.055) wt.-%
g gas natural 301
g gas liquified petroleum gas 303
g gas coke oven 304
g gas blast furnace 305
g gas refinery 308 <= 86) g.m-3
g gas gas works 311
1) Marutzky 1989 /25/2) Boelitz 1993 /24/3) Personal communication Mr. Hietamäki (Finland)4) Referring to NL-handbook 1988 /26/ the range is 2.0 - 3.55)
αS = 06) NL-handbook 1988 /26/
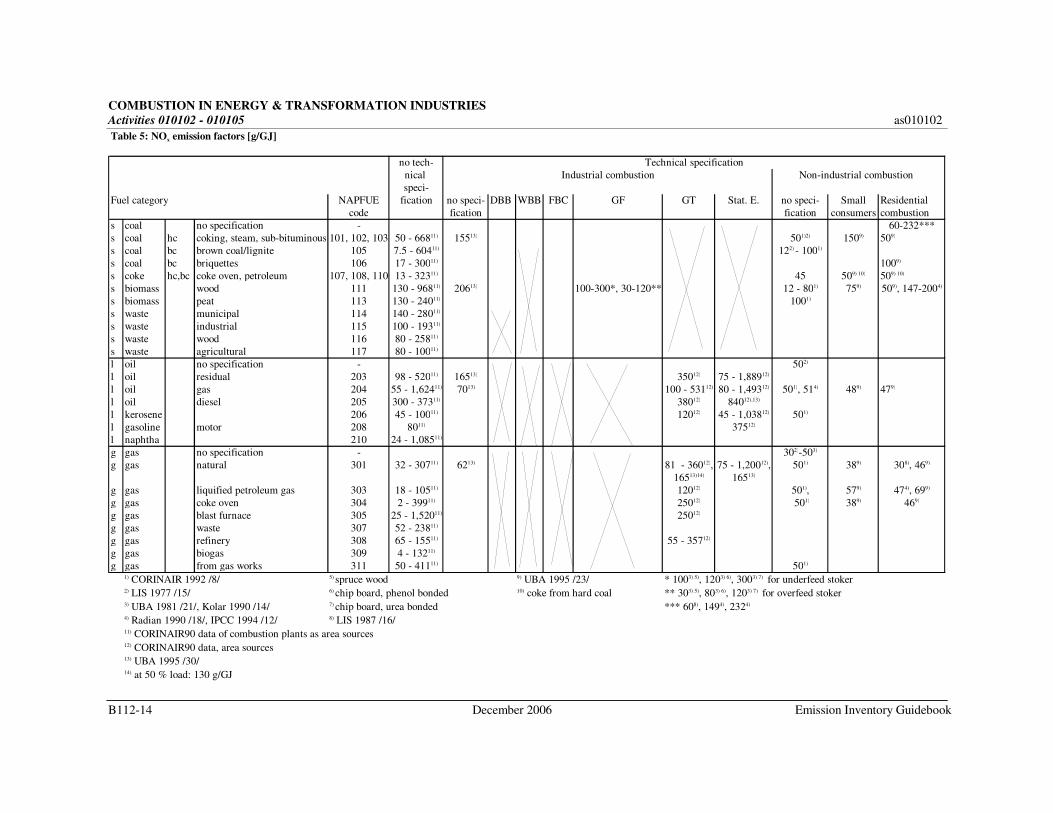
COMBUSTION IN ENERGY & TRANSFORMATION INDUSTRIES
Activities 010102 - 010105 as010102
B112-14 December 2006 Emission Inventory Guidebook
Table 5: NOx emission factors [g/GJ]
no tech- Technical specification
nical Industrial combustion Non-industrial combustion
speci-
Fuel category NAPFUE fication no speci- DBB WBB FBC GF GT Stat. E. no speci- Small Residential
code fication fication consumers combustion
s coal no specification - 60-232***
s coal hc coking, steam, sub-bituminous 101, 102, 103 50 - 66811) 15513) 501)2) 1509) 509)
s coal bc brown coal/lignite 105 7.5 - 60411) 122) - 1001)
s coal bc briquettes 106 17 - 30011) 1009)
s coke hc,bc coke oven, petroleum 107, 108, 110 13 - 32311) 45 509) 10) 509) 10)
s biomass wood 111 130 - 96811) 20613) 100-300*, 30-120** 12 - 801) 759) 509), 147-2004)
s biomass peat 113 130 - 24011) 1001)
s waste municipal 114 140 - 28011)
s waste industrial 115 100 - 19311)
s waste wood 116 80 - 25811)
s waste agricultural 117 80 - 10011)
l oil no specification - 502)
l oil residual 203 98 - 52011) 16513) 35012) 75 - 1,88912)
l oil gas 204 55 - 1,62411) 7013) 100 - 53112) 80 - 1,49312) 501), 514) 489) 479)
l oil diesel 205 300 - 37311) 38012) 84012),13)
l kerosene 206 45 - 10011) 12012) 45 - 1,03812) 501)
l gasoline motor 208 8011) 37512)
l naphtha 210 24 - 1,08511)
g gas no specification - 302)-503)
g gas natural 301 32 - 30711) 6213) 81 - 36012), 75 - 1,20012), 501) 389) 308), 469)
16513)14) 16513)
g gas liquified petroleum gas 303 18 - 10511) 12012) 501), 579) 474), 699)
g gas coke oven 304 2 - 39911) 25012) 501) 389) 469)
g gas blast furnace 305 25 - 1,52011) 25012)
g gas waste 307 52 - 23811)
g gas refinery 308 65 - 15511) 55 - 35712)
g gas biogas 309 4 - 13211)
g gas from gas works 311 50 - 41111) 501)
1) CORINAIR 1992 /8/ 5) spruce wood 9) UBA 1995 /23/ * 1003) 5), 1203) 6), 3003) 7) for underfeed stoker2) LIS 1977 /15/ 6) chip board, phenol bonded 10) coke from hard coal ** 303) 5), 803) 6), 1203) 7) for overfeed stoker3) UBA 1981 /21/, Kolar 1990 /14/ 7) chip board, urea bonded *** 608), 1494), 2324)
4) Radian 1990 /18/, IPCC 1994 /12/ 8) LIS 1987 /16/11) CORINAIR90 data of combustion plants as area sources12) CORINAIR90 data, area sources13) UBA 1995 /30/14) at 50 % load: 130 g/GJ
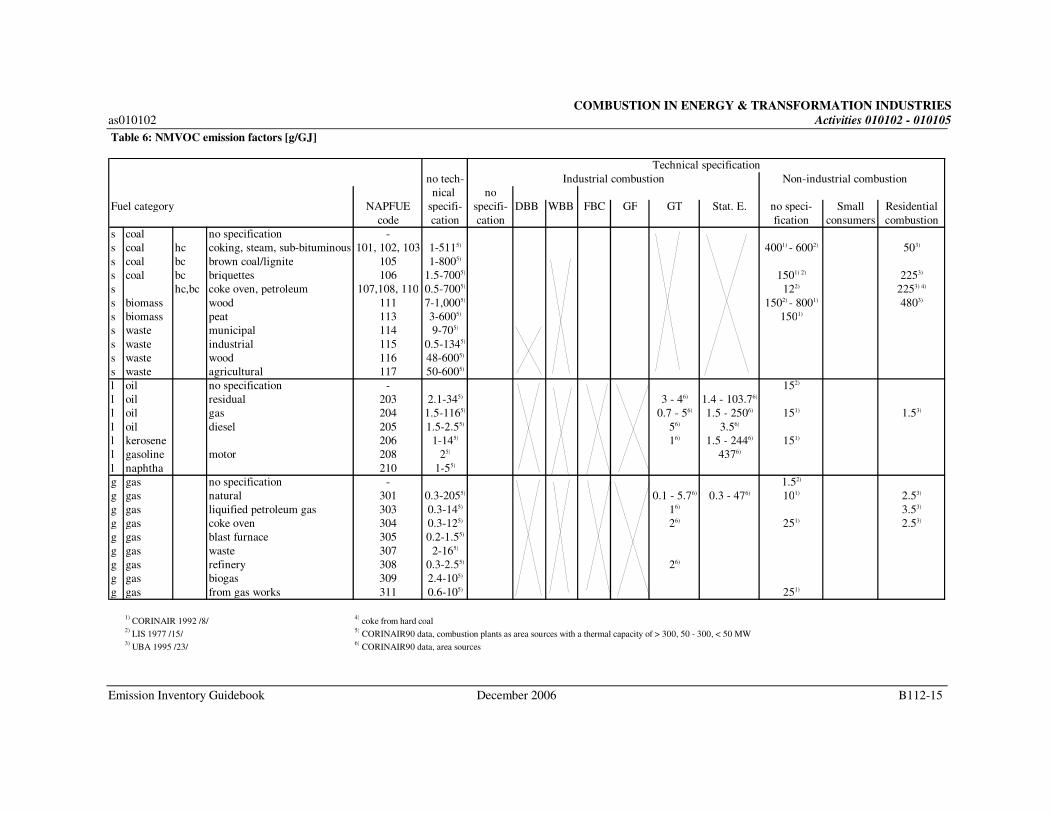
COMBUSTION IN ENERGY & TRANSFORMATION INDUSTRIES
as010102 Activities 010102 - 010105
Emission Inventory Guidebook December 2006 B112-15
Table 6: NMVOC emission factors [g/GJ]
Technical specification
no tech- Industrial combustion Non-industrial combustion
nical no
Fuel category NAPFUE specifi- specifi- DBB WBB FBC GF GT Stat. E. no speci- Small Residential
code cation cation fication consumers combustion
s coal no specification -
s coal hc coking, steam, sub-bituminous 101, 102, 103 1-5115) 4001) - 6002) 503)
s coal bc brown coal/lignite 105 1-8005)
s coal bc briquettes 106 1.5-7005) 1501) 2) 2253)
s hc,bc coke oven, petroleum 107,108, 110 0.5-7005) 122) 2253) 4)
s biomass wood 111 7-1,0005) 1502) - 8001) 4803)
s biomass peat 113 3-6005) 1501)
s waste municipal 114 9-705)
s waste industrial 115 0.5-1345)
s waste wood 116 48-6005)
s waste agricultural 117 50-6005)
l oil no specification - 152)
l oil residual 203 2.1-345) 3 - 46) 1.4 - 103.76)
l oil gas 204 1.5-1165) 0.7 - 56) 1.5 - 2506) 151) 1.53)
l oil diesel 205 1.5-2.55) 56) 3.56)
l kerosene 206 1-145) 16) 1.5 - 2446) 151)
l gasoline motor 208 25) 4376)
l naphtha 210 1-55)
g gas no specification - 1.52)
g gas natural 301 0.3-2055) 0.1 - 5.76) 0.3 - 476) 101) 2.53)
g gas liquified petroleum gas 303 0.3-145) 16) 3.53)
g gas coke oven 304 0.3-125) 26) 251) 2.53)
g gas blast furnace 305 0.2-1.55)
g gas waste 307 2-165)
g gas refinery 308 0.3-2.55) 26)
g gas biogas 309 2.4-105)
g gas from gas works 311 0.6-105) 251)
1) CORINAIR 1992 /8/
4) coke from hard coal
2) LIS 1977 /15/
5) CORINAIR90 data, combustion plants as area sources with a thermal capacity of > 300, 50 - 300, < 50 MW
3) UBA 1995 /23/
6) CORINAIR90 data, area sources
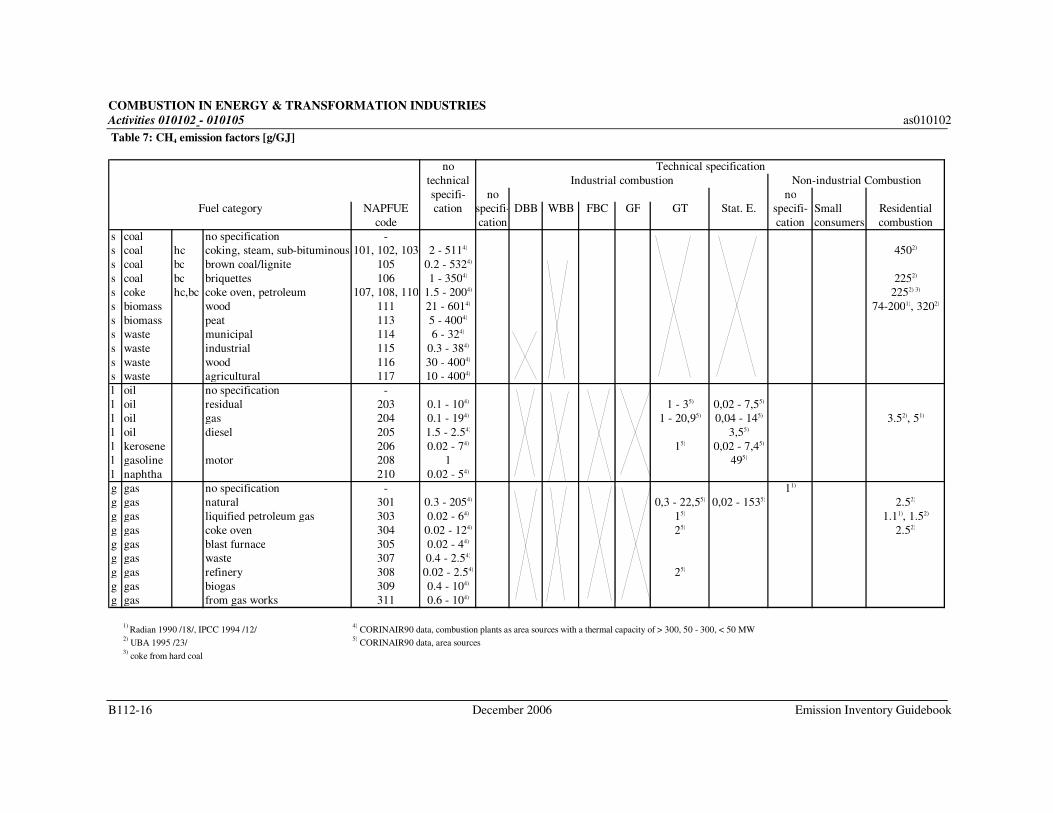
COMBUSTION IN ENERGY & TRANSFORMATION INDUSTRIES
Activities 010102 - 010105 as010102
B112-16 December 2006 Emission Inventory Guidebook
Table 7: CH4 emission factors [g/GJ]
no Technical specification
technical Industrial combustion Non-industrial Combustion
specifi- no no
Fuel category NAPFUE cation specifi- DBB WBB FBC GF GT Stat. E. specifi- Small Residential
code cation cation consumers combustion
s coal no specification -
s coal hc coking, steam, sub-bituminous 101, 102, 103 2 - 5114) 4502)
s coal bc brown coal/lignite 105 0.2 - 5324)
s coal bc briquettes 106 1 - 3504) 2252)
s coke hc,bc coke oven, petroleum 107, 108, 110 1.5 - 2004) 2252) 3)
s biomass wood 111 21 - 6014) 74-2001), 3202)
s biomass peat 113 5 - 4004)
s waste municipal 114 6 - 324)
s waste industrial 115 0.3 - 384)
s waste wood 116 30 - 4004)
s waste agricultural 117 10 - 4004)
l oil no specification -
l oil residual 203 0.1 - 104) 1 - 35) 0,02 - 7,55)
l oil gas 204 0.1 - 194) 1 - 20,95) 0,04 - 145) 3.52), 51)
l oil diesel 205 1.5 - 2.54) 3,55)
l kerosene 206 0.02 - 74) 15) 0,02 - 7,45)
l gasoline motor 208 1 495)
l naphtha 210 0.02 - 54)
g gas no specification - 11)
g gas natural 301 0.3 - 2054) 0,3 - 22,55) 0,02 - 1535) 2.52)
g gas liquified petroleum gas 303 0.02 - 64) 15) 1.11), 1.52)
g gas coke oven 304 0.02 - 124) 25) 2.52)
g gas blast furnace 305 0.02 - 44)
g gas waste 307 0.4 - 2.54)
g gas refinery 308 0.02 - 2.54) 25)
g gas biogas 309 0.4 - 104)
g gas from gas works 311 0.6 - 104)
1) Radian 1990 /18/, IPCC 1994 /12/
4) CORINAIR90 data, combustion plants as area sources with a thermal capacity of > 300, 50 - 300, < 50 MW
2) UBA 1995 /23/
5) CORINAIR90 data, area sources
3) coke from hard coal
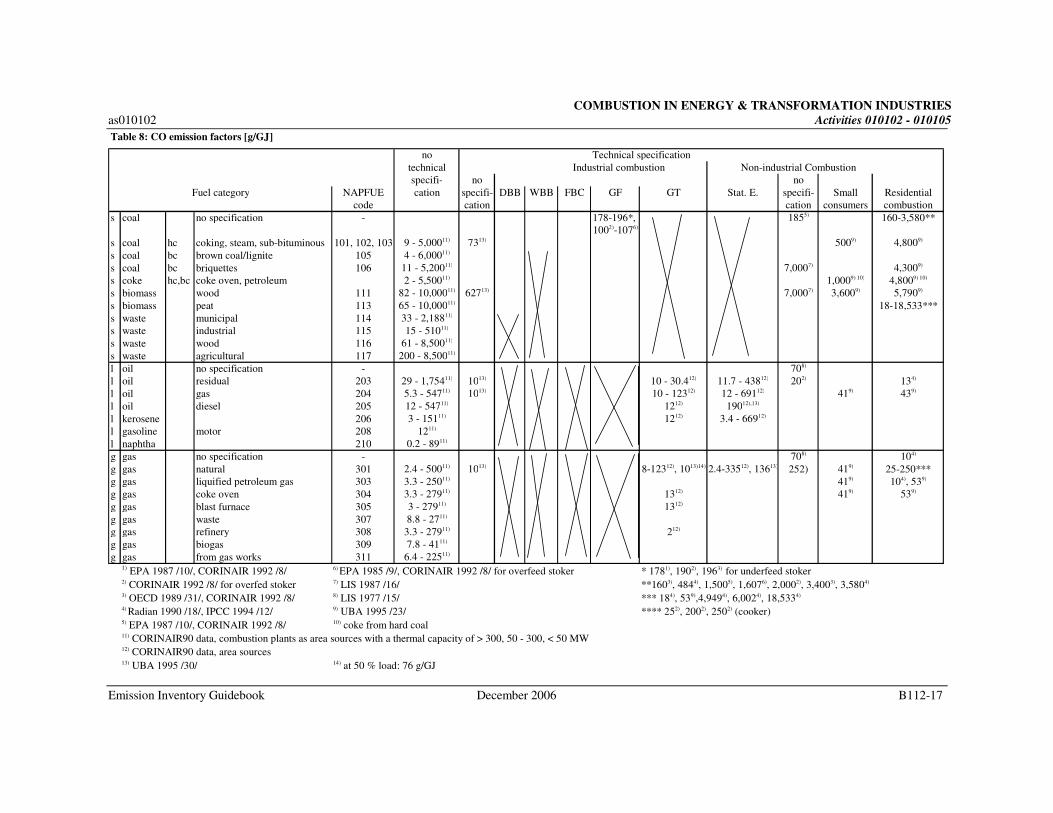
COMBUSTION IN ENERGY & TRANSFORMATION INDUSTRIES
as010102 Activities 010102 - 010105
Emission Inventory Guidebook December 2006 B112-17
Table 8: CO emission factors [g/GJ]
no Technical specification
technical Industrial combustion Non-industrial Combustion
specifi- no no
Fuel category NAPFUE cation specifi- DBB WBB FBC GF GT Stat. E. specifi- Small Residential
code cation cation consumers combustion
s coal no specification - 178-196*, 1855) 160-3,580**
1002)-1076)
s coal hc coking, steam, sub-bituminous 101, 102, 103 9 - 5,00011) 7313) 5009) 4,8009)
s coal bc brown coal/lignite 105 4 - 6,00011)
s coal bc briquettes 106 11 - 5,20011) 7,0007) 4,3009)
s coke hc,bc coke oven, petroleum 2 - 5,50011) 1,0009) 10) 4,8009) 10)
s biomass wood 111 82 - 10,00011) 62713) 7,0007) 3,6009) 5,7909)
s biomass peat 113 65 - 10,00011) 18-18,533***
s waste municipal 114 33 - 2,18811)
s waste industrial 115 15 - 51011)
s waste wood 116 61 - 8,50011)
s waste agricultural 117 200 - 8,50011)
l oil no specification - 708)
l oil residual 203 29 - 1,75411) 1013) 10 - 30.412) 11.7 - 43812) 202) 134)
l oil gas 204 5.3 - 54711) 1013) 10 - 12312) 12 - 69112) 419) 439)
l oil diesel 205 12 - 54711) 1212) 19012),13)
l kerosene 206 3 - 15111) 1212) 3.4 - 66912)
l gasoline motor 208 1211)
l naphtha 210 0.2 - 8911)
g gas no specification - 708) 104)
g gas natural 301 2.4 - 50011) 1013) 8-12312), 1013)14) 2.4-33512), 13613) 252) 419) 25-250***
g gas liquified petroleum gas 303 3.3 - 25011) 419) 104), 539)
g gas coke oven 304 3.3 - 27911) 1312) 419) 539)
g gas blast furnace 305 3 - 27911) 1312)
g gas waste 307 8.8 - 2711)
g gas refinery 308 3.3 - 27911) 212)
g gas biogas 309 7.8 - 4111)
g gas from gas works 311 6.4 - 22511)
1) EPA 1987 /10/, CORINAIR 1992 /8/ 6) EPA 1985 /9/, CORINAIR 1992 /8/ for overfeed stoker * 1781), 1902), 1963) for underfeed stoker2) CORINAIR 1992 /8/ for overfed stoker 7) LIS 1987 /16/ **1603), 4844), 1,5005), 1,6076), 2,0002), 3,4003), 3,5804)
3) OECD 1989 /31/, CORINAIR 1992 /8/ 8) LIS 1977 /15/ *** 184), 539),4,9494), 6,0024), 18,5334)
4) Radian 1990 /18/, IPCC 1994 /12/ 9) UBA 1995 /23/ **** 252), 2002), 2502) (cooker)5) EPA 1987 /10/, CORINAIR 1992 /8/ 10) coke from hard coal11) CORINAIR90 data, combustion plants as area sources with a thermal capacity of > 300, 50 - 300, < 50 MW 12) CORINAIR90 data, area sources13) UBA 1995 /30/ 14) at 50 % load: 76 g/GJ
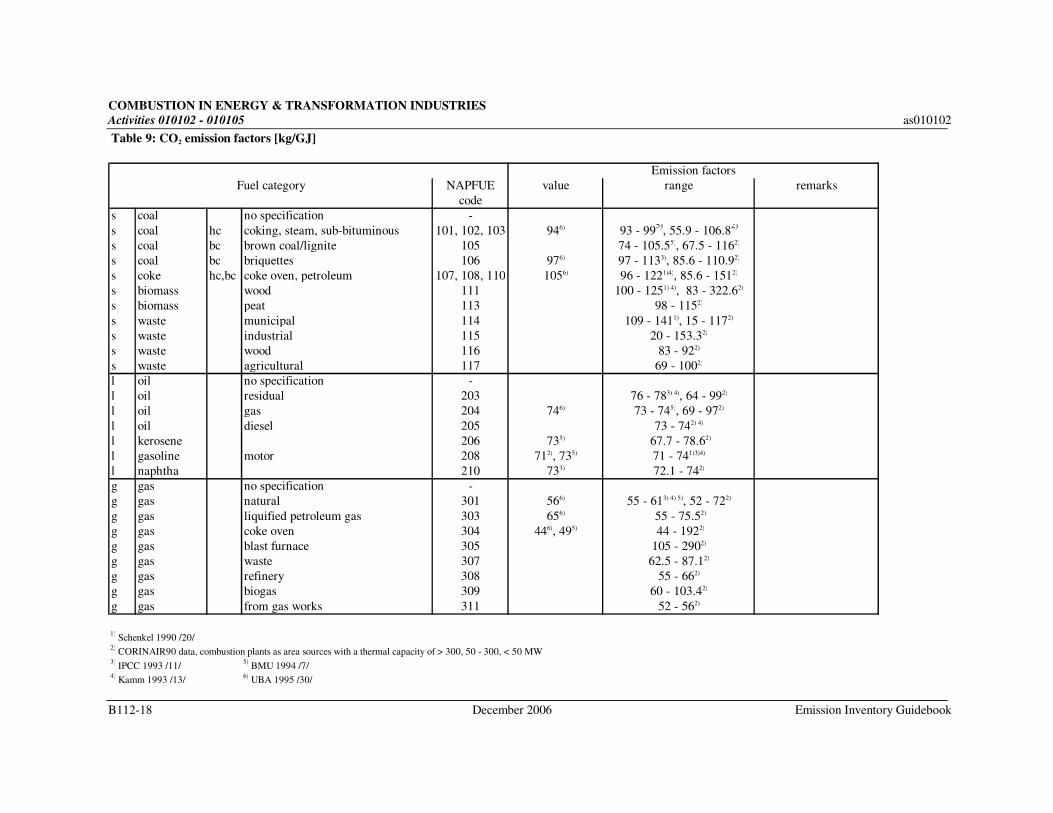
COMBUSTION IN ENERGY & TRANSFORMATION INDUSTRIES
Activities 010102 - 010105 as010102
B112-18 December 2006 Emission Inventory Guidebook
Table 9: CO2 emission factors [kg/GJ]
Emission factors
Fuel category NAPFUE value range remarks
code
s coal no specification -
s coal hc coking, steam, sub-bituminous 101, 102, 103 946) 93 - 995)
, 55.9 - 106.82)
s coal bc brown coal/lignite 105 74 - 105.55), 67.5 - 1162)
s coal bc briquettes 106 976) 97 - 1133), 85.6 - 110.92)
s coke hc,bc coke oven, petroleum 107, 108, 110 1056) 96 - 1221)4), 85.6 - 1512)
s biomass wood 111 100 - 1251) 4), 83 - 322.62)
s biomass peat 113 98 - 1152)
s waste municipal 114 109 - 1411), 15 - 1172)
s waste industrial 115 20 - 153.32)
s waste wood 116 83 - 922)
s waste agricultural 117 69 - 1002)
l oil no specification -
l oil residual 203 76 - 783) 4), 64 - 992)
l oil gas 204 746) 73 - 745), 69 - 972)
l oil diesel 205 73 - 742) 4)
l kerosene 206 735) 67.7 - 78.62)
l gasoline motor 208 712), 735) 71 - 741)3)4)
l naphtha 210 733) 72.1 - 742)
g gas no specification -
g gas natural 301 566) 55 - 613) 4) 5), 52 - 722)
g gas liquified petroleum gas 303 656) 55 - 75.52)
g gas coke oven 304 446), 495) 44 - 1922)
g gas blast furnace 305 105 - 2902)
g gas waste 307 62.5 - 87.12)
g gas refinery 308 55 - 662)
g gas biogas 309 60 - 103.42)
g gas from gas works 311 52 - 562)
1) Schenkel 1990 /20/
2) CORINAIR90 data, combustion plants as area sources with a thermal capacity of > 300, 50 - 300, < 50 MW
3) IPCC 1993 /11/
5) BMU 1994 /7/
4) Kamm 1993 /13/
6) UBA 1995 /30/
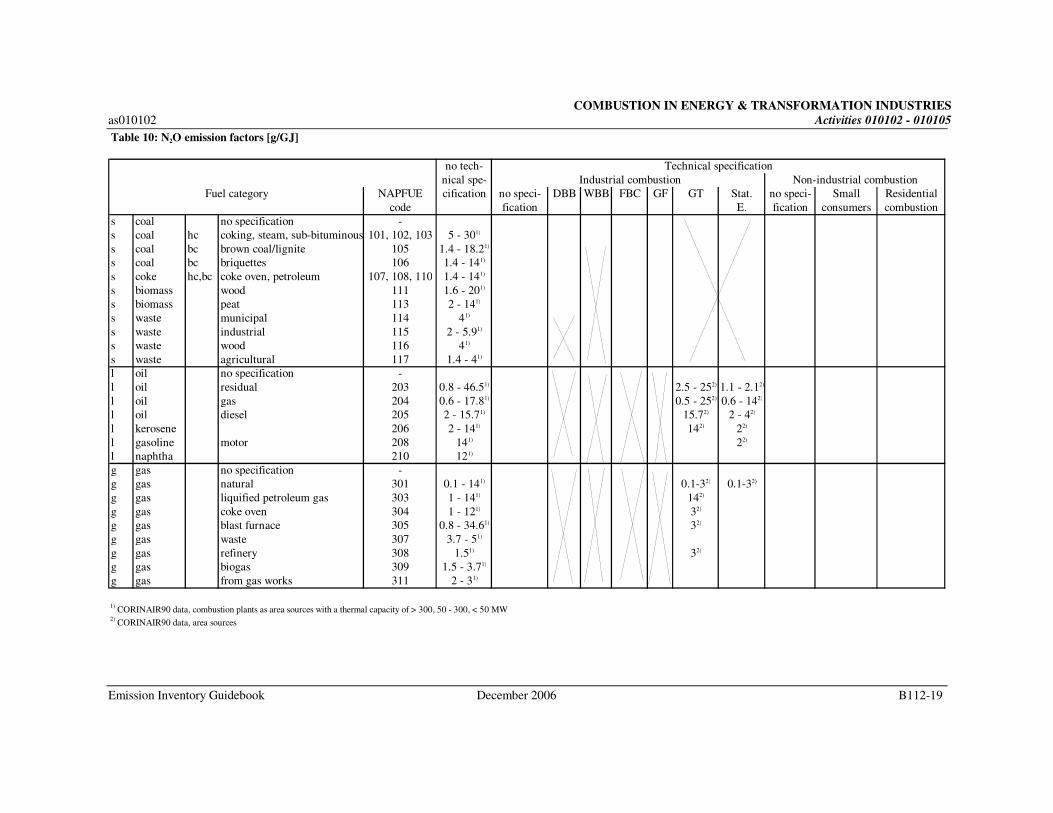
COMBUSTION IN ENERGY & TRANSFORMATION INDUSTRIES
as010102 Activities 010102 - 010105
Emission Inventory Guidebook December 2006 B112-19
Table 10: N2O emission factors [g/GJ]
no tech- Technical specification
nical spe- Industrial combustion Non-industrial combustion
Fuel category NAPFUE cification no speci- DBB WBB FBC GF GT Stat. no speci- Small Residential
code fication E. fication consumers combustion
s coal no specification -
s coal hc coking, steam, sub-bituminous 101, 102, 103 5 - 301)
s coal bc brown coal/lignite 105 1.4 - 18.21)
s coal bc briquettes 106 1.4 - 141)
s coke hc,bc coke oven, petroleum 107, 108, 110 1.4 - 141)
s biomass wood 111 1.6 - 201)
s biomass peat 113 2 - 141)
s waste municipal 114 41)
s waste industrial 115 2 - 5.91)
s waste wood 116 41)
s waste agricultural 117 1.4 - 41)
l oil no specification -
l oil residual 203 0.8 - 46.51) 2.5 - 252) 1.1 - 2.12)
l oil gas 204 0.6 - 17.81) 0.5 - 252) 0.6 - 142)
l oil diesel 205 2 - 15.71) 15.72) 2 - 42)
l kerosene 206 2 - 141) 142) 22)
l gasoline motor 208 141) 22)
l naphtha 210 121)
g gas no specification -
g gas natural 301 0.1 - 141) 0.1-32) 0.1-32)
g gas liquified petroleum gas 303 1 - 141) 142)
g gas coke oven 304 1 - 121) 32)
g gas blast furnace 305 0.8 - 34.61) 32)
g gas waste 307 3.7 - 51)
g gas refinery 308 1.51) 32)
g gas biogas 309 1.5 - 3.71)
g gas from gas works 311 2 - 31)
1) CORINAIR90 data, combustion plants as area sources with a thermal capacity of > 300, 50 - 300, < 50 MW
2) CORINAIR90 data, area sources
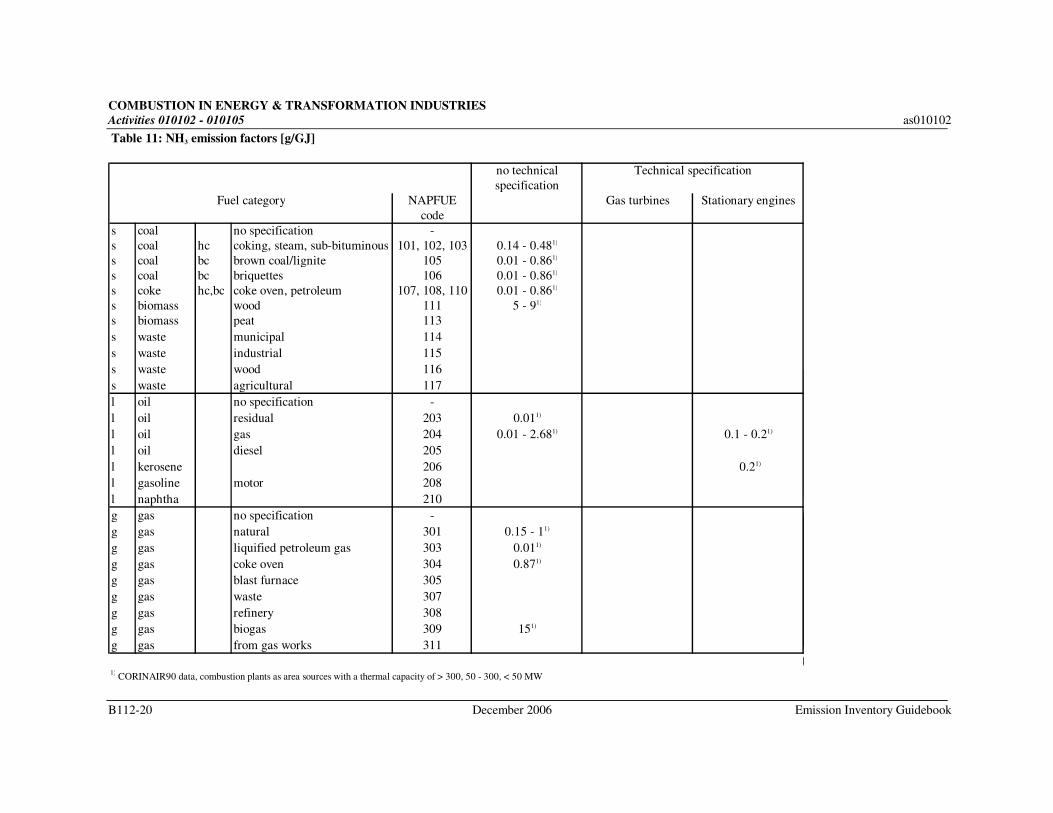
COMBUSTION IN ENERGY & TRANSFORMATION INDUSTRIES
Activities 010102 - 010105 as010102
B112-20 December 2006 Emission Inventory Guidebook
Table 11: NH3 emission factors [g/GJ]
no technical Technical specification
specification
Fuel category NAPFUE Gas turbines Stationary engines
code
s coal no specification -
s coal hc coking, steam, sub-bituminous 101, 102, 103 0.14 - 0.481)
s coal bc brown coal/lignite 105 0.01 - 0.861)
s coal bc briquettes 106 0.01 - 0.861)
s coke hc,bc coke oven, petroleum 107, 108, 110 0.01 - 0.861)
s biomass wood 111 5 - 91)
s biomass peat 113
s waste municipal 114
s waste industrial 115
s waste wood 116
s waste agricultural 117
l oil no specification -
l oil residual 203 0.011)
l oil gas 204 0.01 - 2.681) 0.1 - 0.21)
l oil diesel 205
l kerosene 206 0.21)
l gasoline motor 208
l naphtha 210
g gas no specification -
g gas natural 301 0.15 - 11)
g gas liquified petroleum gas 303 0.011)
g gas coke oven 304 0.871)
g gas blast furnace 305
g gas waste 307
g gas refinery 308
g gas biogas 309 151)
g gas from gas works 311
1) CORINAIR90 data, combustion plants as area sources with a thermal capacity of > 300, 50 - 300, < 50 MW
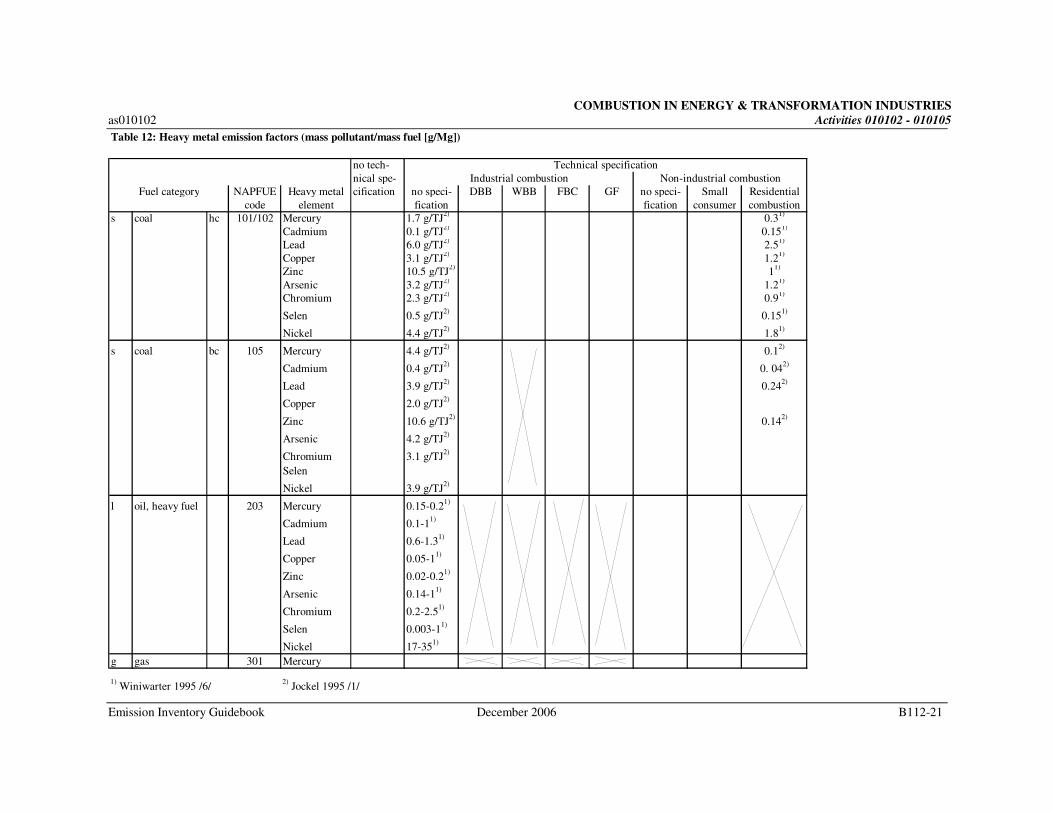
COMBUSTION IN ENERGY & TRANSFORMATION INDUSTRIES
as010102 Activities 010102 - 010105
Emission Inventory Guidebook December 2006 B112-21
Table 12: Heavy metal emission factors (mass pollutant/mass fuel [g/Mg])
no tech- Technical specification
nical spe- Industrial combustion Non-industrial combustion
Fuel category NAPFUE Heavy metal cification no speci- DBB WBB FBC GF no speci- Small Residential
code element fication fication consumer combustion
s coal hc 101/102 Mercury 1.7 g/TJ2)
0.31)
Cadmium 0.1 g/TJ2)
0.151)
Lead 6.0 g/TJ2)
2.51)
Copper 3.1 g/TJ2)
1.21)
Zinc 10.5 g/TJ2)
11)
Arsenic 3.2 g/TJ2)
1.21)
Chromium 2.3 g/TJ2)
0.91)
Selen 0.5 g/TJ2)
0.151)
Nickel 4.4 g/TJ2)
1.81)
s coal bc 105 Mercury 4.4 g/TJ2)
0.12)
Cadmium 0.4 g/TJ2)
0. 042)
Lead 3.9 g/TJ2)
0.242)
Copper 2.0 g/TJ2)
Zinc 10.6 g/TJ2)
0.142)
Arsenic 4.2 g/TJ2)
Chromium 3.1 g/TJ2)
Selen
Nickel 3.9 g/TJ2)
l oil, heavy fuel 203 Mercury 0.15-0.21)
Cadmium 0.1-11)
Lead 0.6-1.31)
Copper 0.05-11)
Zinc 0.02-0.21)
Arsenic 0.14-11)
Chromium 0.2-2.51)
Selen 0.003-11)
Nickel 17-351)
g gas 301 Mercury
1) Winiwarter 1995 /6/
2) Jockel 1995 /1/

COMBUSTION IN ENERGY & TRANSFORMATION INDUSTRIES
Activities 010102 - 010105 as010102
B112-22 December 2006 Emission Inventory Guidebook
9 SPECIES PROFILES
For species profiles of selected pollutants see Section 9 in chapter B111 on “Combustion
Plants as Point Sources”.
10 UNCERTAINTY ESTIMATES
Uncertainties of emission data result from inappropriate emission factors and from missing
statistical information on the emission generating activity. Those discussed here are related to
emission factors. Usually uncertainties associated with emission factors can be assessed by
comparing them with emission factors obtained by using measured data or other literature
data. However, at this stage, the available emission factors based on literature data are often
poorly documented without a specification concerning the area of application. A range of
emission factors, depending on the parameters available (as given in chapter B111 on
“Combustion Plants as Point Sources“, Section 10), can therefore not be given here.
11 WEAKEST ASPECTS/PRIORITY AREAS FOR IMPROVEMENT IN
CURRENT METHODOLOGY
Weakest aspects discussed here are related to emission factors.
The average emission factor of a territorial unit should integrate the diversity of the
combustion techniques installed within the territorial unit. Therefore, the number and
diversity of the selected combustion installations for the calculation of the average emission
factor should correspond with the number and diversity of the installations within the
territorial unit (target population). Further work should be carried out to characterise
territorial units with regard to the technologies in place (technology distribution, age
distribution of combustion technique, etc.).
For all pollutants considered, neither qualitative nor quantitative load dependencies have yet
been integrated into the emission factors. In particular for oil, coal and wood fired small
stoves, increased emissions occur due to a high number of start-ups per year (e.g. up to 1,000
times a year) or due to load variations (e.g. manual furnace charging). Emissions from
residential firing can be highly relevant (e.g. combustion of wood in the Nordic countries, in
particular for VOC and CO emissions). Further work should be invested to clarify this
influence with respect to the emission factors published.
For the weakest aspects related to the determination of activities based on surrogate data see
Section 4. Uncertainty estimates of activity data should take into account the quality of
available statistics. In particular, emissions from the combustion of wood in single stoves may
increase as some national statistics have underestimated wood consumption to date /3/.
COMBUSTION IN ENERGY & TRANSFORMATION INDUSTRIES
as010102 Activities 010102 - 010105
Emission Inventory Guidebook December 2006 B112-23
12 SPATIAL DISAGGREGATION CRITERIA FOR AREA SOURCES
Spatial disaggregation of annual emission data (top-down approach) can be related
- for industrial combustion e.g. to the number of industrial employees in industrial areas
and
- for residential combustion e.g. to the number of inhabitants in high density and low
density areas and to the type of fuel.
In general the following disaggregation steps for emissions released from residential
combustion can be used /cf. 27/:
- differentiation in spatial areas, e.g. administrative units (country, province, district, etc.),
inhabited areas, settlement areas (divided in high and low density settlements),
- determination of regional emission factor per capita depending on the population density
and the type of fuel used.
For emissions released from industrial combustion, spatial disaggregation takes into account
the following steps:
- differentiation in spatial areas with regard to industrial areas,
- determination of emission factors related to the number of industrial employees.
13 TEMPORAL DISAGGREGATION CRITERIA
Temporal disaggregation of annual emission data (top-down approach) provides a split into
monthly, weekly, daily and/or hourly emission data. For annual emissions released from
combustion plants as area sources this data can be obtained for:
- industrial combustion by using in principle the disaggregation criteria and the procedure
as described in Section 13 of chapter B111 on “Combustion Plants as Point Sources” by
taking into account the number of plants in the area considered.
- non-industrial combustion (small consumer/residential combustion) by using a relation
between the consumption of fuel and the heating degree-days.
The disaggregation of annual emissions released from non-industrial combustion (small
consumers/residential combustion) has to take into account a split into:
- summer and winter time (heating periods),
- working days and holidays and
- daily fluctuations of load
for the main relevant fuels and, if possible, for the main relevant combustion techniques
(manually fed stoves, etc.)
The procedure of disaggregation consists of the following step-by-step approach /cf. 28/:
- determination of the temporal variation of the heat consumption (based e.g. on user
behaviour),
COMBUSTION IN ENERGY & TRANSFORMATION INDUSTRIES
Activities 010102 - 010105 as010102
B112-24 December 2006 Emission Inventory Guidebook
- determination of the fuel consumption e.g. by using statistics for district heat or
consumption of gas, by using fuel balances for the estimation of coal and wood
consumption (e.g. as given in /3/),
- correlation of the heating degree-days with the consumption of fuel (e.g. for gas, district
heat). Typical heating degree-days are available in statistics. The correlation can be linear
as given e.g. in /28/.
- determination of the relative activity (e.g. fuel consumption per hour per day) by using
adequate statistics.
This approach makes it possible to determine annual, weekly and/or daily correction factors.
For the determination of hourly emissions the following Equation (3)
/cf. 28/ can be given as an example:
E tE
hf t f t f tH
Aa w d( )
,( ) ( ) ( )= ⋅ ⋅ ⋅
8 760 (3)
EH emission per hour(s) [Mg/h]
EA annual emission [Mg]
fa annual correction factor [ ]
fw weekly correction factor [ ]
fd daily correction factor [ ]
t time
The constant (8,760 h) in Equation (3) represents the number of hours per year.
14 ADDITIONAL COMMENTS
15 SUPPLEMENTARY DOCUMENTS
16 VERIFICATION PROCEDURES
As outlined in chapter B111 on ”Concepts for Emission Inventory Verification“ different
verification procedures can be used. The aim of this section is to select those which are most
adequate for emission data from combustion plants as area sources. Verification procedures
considered here are principally based on the verification of emission data on a territorial unit
level (national level).
The annual emissions related to a territorial unit can be compared to independently derived
emission estimates. These independent emission estimates can be obtained by using
econometric relations between annual emissions and exogenous variables, such as population
equivalents, number of households, fossil fuel prices, etc.
Another possibility is to make emission density comparisons of e.g. emissions per capita or
emissions per GDP between countries with comparable economic structures.
COMBUSTION IN ENERGY & TRANSFORMATION INDUSTRIES
as010102 Activities 010102 - 010105
Emission Inventory Guidebook December 2006 B112-25
17 REFERENCES
/1/ Jockel, W.; Hartje, J.:Die Entwicklung der Schwermetallemissionen in der Bundesrepublik Deutschland
von 1985-1995; Forschungsbericht 91-104 03 524, TÜV Rheinland e. V. Köln; 1995
/2/ Stobbelaar, G.: Reduction of Atmospheric Emissions under the terms of the North Sea Action Programme,
Report Lucht 102; Ministry of Housing, Physical Planning and Environment; The Netherlands; 1992
/3/ Gerhold, S: Stoffstromrechnung: Holzbilanz 1955 bis 1991; in: Statistische Nachrichten; 47(1992)8;
S. 651 - 656; published in Austria
/4/ Baumbach, G.; Angerer, M.: Schadstoffemission gewerblicher und industrieller Holzverbrennung;
Erfassung des Stands der Technik und Möglichkeiten zur Emissionsminderung; Projekt Europäisches
Forschungszentrum für Maßnahmen zur Luftreinhaltung (PEF) Bericht Nr. 103; Institut für
Verfahrenstechnik und Dampfkesselwesen; Universität Stuttgart; 1993
/5/ Struschka, M; Straub, D.; Baumbach, G.: Schadstoffemissionen von Kleinfeuerungsanlagen, Derzeitiger
Stand - Möglichkeiten zur Schadstoffminderung - Zukünftige Förderschwerpunkte; Institut für
Verfahrenstechnik und Dampfkesselwesen - Abt.: Reinhaltung der Luft; Stuttgart; 1988
/6/ Winiwarter, Wilfried; Schneider, Manfred: Abschätzung der Schwermetallemissionen in Österreich;
Umweltbundesamt (Hrsg.); Wien; 1995
/7/ Bundesministerium für Umwelt, Naturschutz und Reaktorsicherheit (ed.): Umweltpolitik - Klimaschutz in
Deutschland, Erster Bericht der Regierung der Bundesrepublik Deutschland nach dem
Rahmenübereinkommen der Vereinten Nationen über Klimaänderungen; 1994
/8/ CITEPA: CORINAIR Inventory-Default Emission Factors Handbook (second edition); CEC - DG XI (ed.);
1992
/9/ US-EPA (ed.): Compilation of Air Pollutant Emission Factors; Stationary Point and Area Sources; Fourth
Edition; 1985
/10/ US-EPA (ed.): Criteria Pollutant Emission Factors for the NAPAP Emission Inventory; EPA/600/7-87/015;
1987
/11/ IPCC/OECD (ed.): Joint Work Programme on National Inventories of Greenhouse Gas Emissions:
National GHG-Inventories (ed.): Transparency in estimation and reporting; Parts I and II; Final report of
the workshop held October 1, 1992 in Bracknell (U.K.); published in Paris; 1993
/12/ IPCC/OECD (ed.): Greenhouse Gas Inventory Reference Manual; First Draft, Volume 3; 1994
/13/ Kamm, Klaus; Bauer, Frank; Matt, Andreas: CO-Emissionskataster 1990 für den Stadtkreis Karlsruhe; in:
WLB - Wasser, Luft und Boden (1993)10; S. 58 ff.
/14/ Kolar, Jürgen: Stickstoffoxide und Luftreinhaltung; Springer Verlag Berlin, Heidelberg; 1990
/15/ Landesanstalt für Immissionsschutz des Landes NRW (ed.): Emissionsfaktoren für Feuerungsanlagen für
feste Brennstoffe; in: Gesundheits-Ingenieur 98(1977)3; S. 58 - 68
/16/ Landesanstalt für Immissionsschutz des Landes NRW (ed.): Erstellung eines Emissionskatasters und einer
Emissionsprognose für Feuerungsanlagen im Sektor Haushalte und Kleinverbraucher des
Belastungsgebietes Ruhrgebiet Ost; LIS Bericht Nr. 73; 1987
/17/ Mobley, J.D.; Jones G.D.: Review of U.S. NOx abatement technology; Proceedings: NOx-Symposium
Karlsruhe 1985 B1/B 74
/18/ Radian Corporation (ed.): Emissions and Cost Estimates for Globally Significant Anthropogenic
Combustion Sources of NOx, N2O, CO and CO2; Prepared for the Office of Research and Development;
U.S. Environmental Protection Agency; Washington D.C.; 1990
/19/ Ratajczak, E.-A.; Akland, E.: Emissionen von Stickoxiden aus kohlegefeuerten Hausbrandfeuerstätten; in:
Staub, Reinhaltung Luft; 47(1987)1/2, S. 7 - 13
COMBUSTION IN ENERGY & TRANSFORMATION INDUSTRIES
Activities 010102 - 010105 as010102
B112-26 December 2006 Emission Inventory Guidebook
/20/ Schenkel, W.; Barniske, L.; Pautz, D.; Glotzel, W.-D.: Müll als CO-neutrale Energieresource; in:
Kraftwerkstechnik 2000 - Resourcen-Schonung und CO-Minderung; VGB-Tagung 21./22.2.1990; S. 108
/21/ Umweltbundesamt (ed.): Luftreinhaltung 1981; Berlin; 1981
/22/ Umweltbundesamt (ed.): Jahresbericht 1985; Berlin; 1986
/23/ Mr. Schäl (Umweltbundesamt Berlin); personal communication, April 10, 1995; based on “3. Bericht der
Interministeriellen Arbeitsgruppe “CO2-Reduktion“
/24/ Boelitz, J.; Esser-Schmittmann, W.; Kreusing, H.: Braunkohlenkoks zur Abgasreinigung; in:
EntsorgerPraxis (1993)11; S. 819 - 821
/25/ Marutzky,R: Emissionsminderung bei Feuerungsanlagen für Festbrennstoffe; in: Das Schornsteinfeger-
handwerk (1989)3; S. 7 - 15
/26/ Ministry of Housing, Physical Planning and Environment (ed.): Handbook of Emission Factors, Stationary
Combustion Sources, Part 3; The Netherlands, The Hague; 1988
/27/ Loibl, W.; Orthofer, R.; Winiwarter, W.: Spatially Disaggregated Emission Inventory for Anthropogenic
NMVOC in Austria; Seibersdorf; 1993
/28/ Winiwarter, W.; Kopsca, A.; Loibl, W.: Zeitliche Disaggregation von Emissionsinventuren;
OE FZS-A--2490; Seibersdorf (Austria); 1993
/29/ Gustavsson, L.; Karlsson, M.-L.; Wallin, P.-A.: Emissions from Biomass Combustion; Swedish National
Testing Research Institute; 1993
/30/ Mr. Beckers (Umweltbundesamt Berlin); Personal communication; August 22, 1995
/31/ OECD Environment Directorate (ed.): Greenhouse Gas Emissions and Emission Factors; 1989
18 BIBLIOGRAPHY
Additional literature is related to combustion:
Struschka, M.; Angerer, M.; Straub, D.: Schadstoffemissionen von Kachel-Grundöfen; VDI Reihe 5:
Umwelttechik, Nr. 82; Düsseldorf; 1991
Umweltbundesamt, Austria (ed.): Entwicklung und fortschrittlicher Stand der Technik zur Emissionsminderung
von Stickoxiden und Schwefeloxiden aus Feuerungsanlagen im Leistungsbereich von 3 bis 50 MW;
Expertenhearing Laxenburg 18/19 November 1992; Wien; 1993
Engewald, W.; Knobloch, Th.; Efer, J.: Flüchtige organische Verbindungen in Emissionen aus dem Hausbrand
von Braunkohle; in: UWSF-Z. Umweltchem. Ökotox. 5 (1993) 6; S. 303-308
Institut Français de l´Energie (ed.): Reduction of Emissions of Air Pollutants from New and Existing
Combustion Installations less than 50 MW (th); Draft final report; Contract no: B6611-90-011041; 1991
Jockel, W.; Hartje, J.: Datenerhebung über die Emissionen umweltgefährdender Schwermetalle; im Auftrag des
Umweltbundesamtes FB: 91-104 02 588; Berlin; 1991
Kolar, J.: Stickstoffoxide und Luftreinhaltung; Berlin; 1989
Allhorn, H.; Breme, V.; Strehler, A.;Rogenhofer, H.; Kraus, U.; Hellwig, M.; Schulze Lammers, P.: Verfeuerung
von Stroh als Briketts in Kleinanlagen (Hausbrand) und über Großballen in Großanlagen (Brennereien,
Gärtnereien) ab 500 kW Heizleistung; Kurzfassung; KfA Jülich/TU München; Bundesministerium für
Forschung und Technologie (ed.); Bonn; 1987
Deutsche Gesellschaft für Mineralölwissenschaft und Kohlechemie e.V. (DGMK) (ed.): Untersuchungen über
das Brennverhalten von heutigen und zukünftigen Heizölen in Heizkesseln mit Ölzerstäubungsbrennern; Projekt
185; Hamburg; 1984
COMBUSTION IN ENERGY & TRANSFORMATION INDUSTRIES
as010102 Activities 010102 - 010105
Emission Inventory Guidebook December 2006 B112-27
Rentz, O.; Holtmann, T.; Oertel, D.; Obermeier, A. et al.: Konzeption zur Minderung der VOC-Emissionen in
Baden-Würtemberg; Umweltministerium Baden-Würtemberg (ed.); Heft 21; Karlsruhe; 1993
19 RELEASE VERSION, DATE AND SOURCE
Version : 3.1
Date : December 1995
Source : Otto Rentz; Dagmar Oertel
University of Karlsruhe (TH)
Germany
Updated with particulate matter details by:
Mike Woodfield
AEA Technology
UK
December 2006
20 POINT OF ENQUIRY
Any comments on this chapter or enquiries should be directed to:
Ute Karl
French-German Institute for Environmental Research
University of Karlsruhe
Hertzstr 16
D-76187 Karlsruhe
Germany
Tel: +49 721 608 4590
Fax: +49 721 75 89 09
Email: [email protected]
COMBUSTION IN ENERGY & TRANSFORMATION INDUSTRIES
Activities 010102 - 010105 as010102
B112-28 December 2006 Emission Inventory Guidebook
Annex 1: List of abbreviations
Ai Activity rate of the emission source i
bc Brown coal
CCGT Combined Cycle Gas Turbine
CFBC Circulating Fluidised Bed Combustion
DBB Dry Bottom Boiler
E Emission
EFi Emission factor of the emission source i, e.g. in [g/GJ]
fa Annual correction factor [ ]
fd Daily correction factor [ ]
fw Weekly correction factor [ ]
FBC Fluidised Bed Combustion
g Gaseous state of aggregation
GF Grate Firing
GT Gas Turbine
H Lower heating value of fuel
hc Hard coal
IGCC Integrated Coal Gasification Combined Cycle Gas Turbine
l Liquid state of aggregation
PFBC Pressurised Fluidised Bed Combustion
s Solid state of aggregation
S Sulphur content of fuel
Stat. E. Stationary Engine
t Time
WBB Wet Bottom Boiler
NON-INDUSTRIAL COMBUSTION PLANTS
Activities: Various
Emission Inventory Guidebook December, 2006 B216-1
SNAP CODE:
010203 020103 020202 020205 020302 020305 020106
SOURCE ACTIVITY TITLE: SMALL COMBUSTION INSTALLATIONS
NOSE CODE:
NFR CODE: 1A4a; 1A4bi; 1A4ci; 1A5a and small installations in 1A1a
Table 1: Relevant SNAP Codes
Source SNAP CODE NFR category
Small installations in district heating 010203 1A1a Commercial / institutional 020103 1A4a Residential 020202
020205 1A4bi
Agriculture / Forestry / Fishing 020302 020305
1A4ci
Other stationary (including military) 020106 1A5a
1 ACTIVITIES INCLUDED
This chapter covers emissions from small combustion installations, excluding industrial sources, with a thermal capacity ≤ 50 MWth. However, some industrial sources of a lower capacity might have very similar emission characteristics to the ones described here in the category “medium size boilers”. As long as there is no guidebook chapter addressing small industrial sources the data presented here might be used also as defaults for these sources.
Activities covered in this chapter are divided into the following categories:
• District heating • Commercial and institutional • Residential • Agriculture / Forestry / Fishing, and • Other (including military).
These activities can be further sub-divided considering the combustion techniques used:
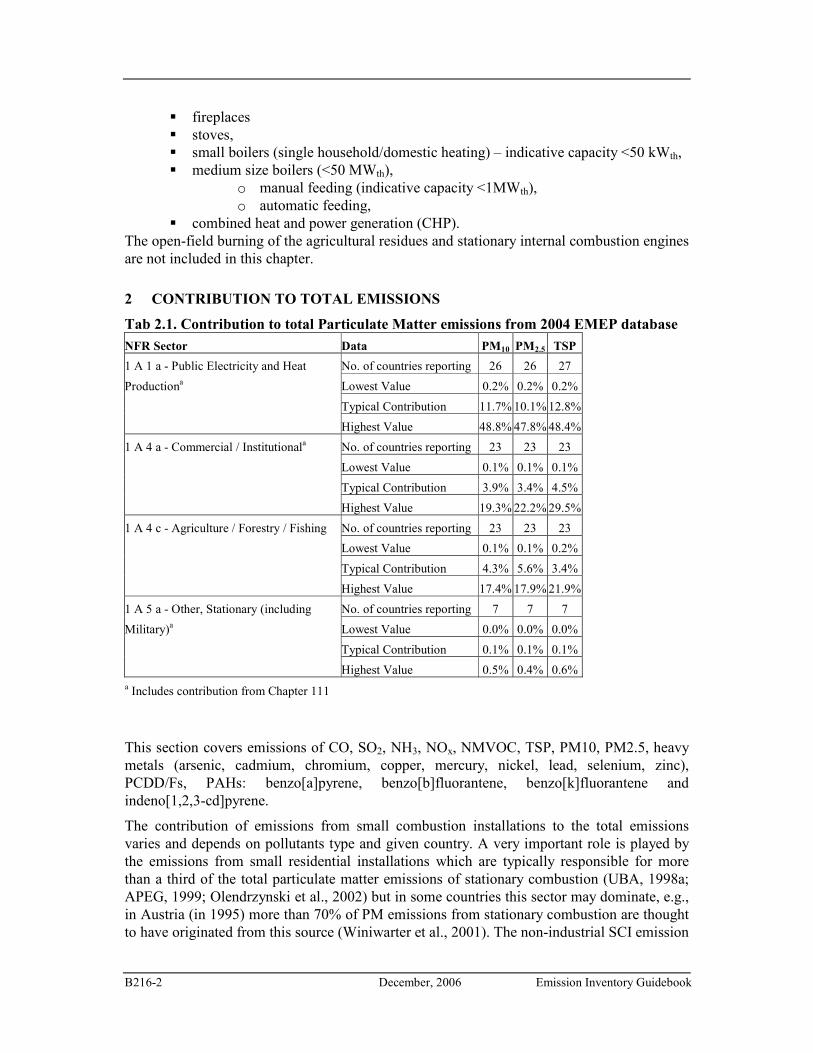
B216-2 December, 2006 Emission Inventory Guidebook
� fireplaces � stoves, � small boilers (single household/domestic heating) – indicative capacity <50 kWth, � medium size boilers (<50 MWth),
o manual feeding (indicative capacity <1MWth), o automatic feeding,
� combined heat and power generation (CHP). The open-field burning of the agricultural residues and stationary internal combustion engines are not included in this chapter.
2 CONTRIBUTION TO TOTAL EMISSIONS
Tab 2.1. Contribution to total Particulate Matter emissions from 2004 EMEP database
NFR Sector Data PM10 PM2.5 TSP
1 A 1 a - Public Electricity and Heat No. of countries reporting 26 26 27
Productiona Lowest Value 0.2% 0.2% 0.2%
Typical Contribution 11.7% 10.1% 12.8%
Highest Value 48.8% 47.8% 48.4%
1 A 4 a - Commercial / Institutionala No. of countries reporting 23 23 23
Lowest Value 0.1% 0.1% 0.1%
Typical Contribution 3.9% 3.4% 4.5%
Highest Value 19.3% 22.2% 29.5%
1 A 4 c - Agriculture / Forestry / Fishing No. of countries reporting 23 23 23
Lowest Value 0.1% 0.1% 0.2%
Typical Contribution 4.3% 5.6% 3.4%
Highest Value 17.4% 17.9% 21.9%
1 A 5 a - Other, Stationary (including No. of countries reporting 7 7 7
Military)a Lowest Value 0.0% 0.0% 0.0%
Typical Contribution 0.1% 0.1% 0.1%
Highest Value 0.5% 0.4% 0.6% a Includes contribution from Chapter 111
This section covers emissions of CO, SO2, NH3, NOx, NMVOC, TSP, PM10, PM2.5, heavy metals (arsenic, cadmium, chromium, copper, mercury, nickel, lead, selenium, zinc), PCDD/Fs, PAHs: benzo[a]pyrene, benzo[b]fluorantene, benzo[k]fluorantene and indeno[1,2,3-cd]pyrene.
The contribution of emissions from small combustion installations to the total emissions varies and depends on pollutants type and given country. A very important role is played by the emissions from small residential installations which are typically responsible for more than a third of the total particulate matter emissions of stationary combustion (UBA, 1998a; APEG, 1999; Olendrzynski et al., 2002) but in some countries this sector may dominate, e.g., in Austria (in 1995) more than 70% of PM emissions from stationary combustion are thought to have originated from this source (Winiwarter et al., 2001). The non-industrial SCI emission
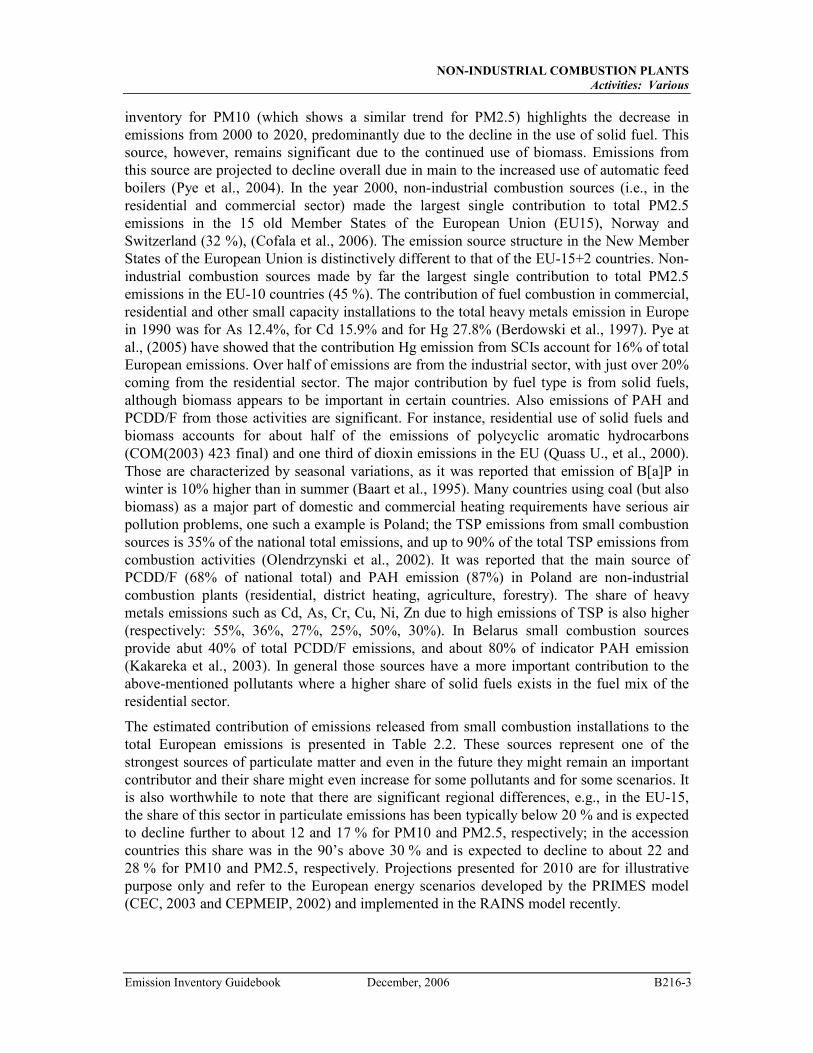
NON-INDUSTRIAL COMBUSTION PLANTS
Activities: Various
Emission Inventory Guidebook December, 2006 B216-3
inventory for PM10 (which shows a similar trend for PM2.5) highlights the decrease in emissions from 2000 to 2020, predominantly due to the decline in the use of solid fuel. This source, however, remains significant due to the continued use of biomass. Emissions from this source are projected to decline overall due in main to the increased use of automatic feed boilers (Pye et al., 2004). In the year 2000, non-industrial combustion sources (i.e., in the residential and commercial sector) made the largest single contribution to total PM2.5 emissions in the 15 old Member States of the European Union (EU15), Norway and Switzerland (32 %), (Cofala et al., 2006). The emission source structure in the New Member States of the European Union is distinctively different to that of the EU-15+2 countries. Non-industrial combustion sources made by far the largest single contribution to total PM2.5 emissions in the EU-10 countries (45 %). The contribution of fuel combustion in commercial, residential and other small capacity installations to the total heavy metals emission in Europe in 1990 was for As 12.4%, for Cd 15.9% and for Hg 27.8% (Berdowski et al., 1997). Pye at al., (2005) have showed that the contribution Hg emission from SCIs account for 16% of total European emissions. Over half of emissions are from the industrial sector, with just over 20% coming from the residential sector. The major contribution by fuel type is from solid fuels, although biomass appears to be important in certain countries. Also emissions of PAH and PCDD/F from those activities are significant. For instance, residential use of solid fuels and biomass accounts for about half of the emissions of polycyclic aromatic hydrocarbons (COM(2003) 423 final) and one third of dioxin emissions in the EU (Quass U., et al., 2000). Those are characterized by seasonal variations, as it was reported that emission of B[a]P in winter is 10% higher than in summer (Baart et al., 1995). Many countries using coal (but also biomass) as a major part of domestic and commercial heating requirements have serious air pollution problems, one such a example is Poland; the TSP emissions from small combustion sources is 35% of the national total emissions, and up to 90% of the total TSP emissions from combustion activities (Olendrzynski et al., 2002). It was reported that the main source of PCDD/F (68% of national total) and PAH emission (87%) in Poland are non-industrial combustion plants (residential, district heating, agriculture, forestry). The share of heavy metals emissions such as Cd, As, Cr, Cu, Ni, Zn due to high emissions of TSP is also higher (respectively: 55%, 36%, 27%, 25%, 50%, 30%). In Belarus small combustion sources provide abut 40% of total PCDD/F emissions, and about 80% of indicator PAH emission (Kakareka et al., 2003). In general those sources have a more important contribution to the above-mentioned pollutants where a higher share of solid fuels exists in the fuel mix of the residential sector.
The estimated contribution of emissions released from small combustion installations to the total European emissions is presented in Table 2.2. These sources represent one of the strongest sources of particulate matter and even in the future they might remain an important contributor and their share might even increase for some pollutants and for some scenarios. It is also worthwhile to note that there are significant regional differences, e.g., in the EU-15, the share of this sector in particulate emissions has been typically below 20 % and is expected to decline further to about 12 and 17 % for PM10 and PM2.5, respectively; in the accession countries this share was in the 90’s above 30 % and is expected to decline to about 22 and 28 % for PM10 and PM2.5, respectively. Projections presented for 2010 are for illustrative purpose only and refer to the European energy scenarios developed by the PRIMES model (CEC, 2003 and CEPMEIP, 2002) and implemented in the RAINS model recently.
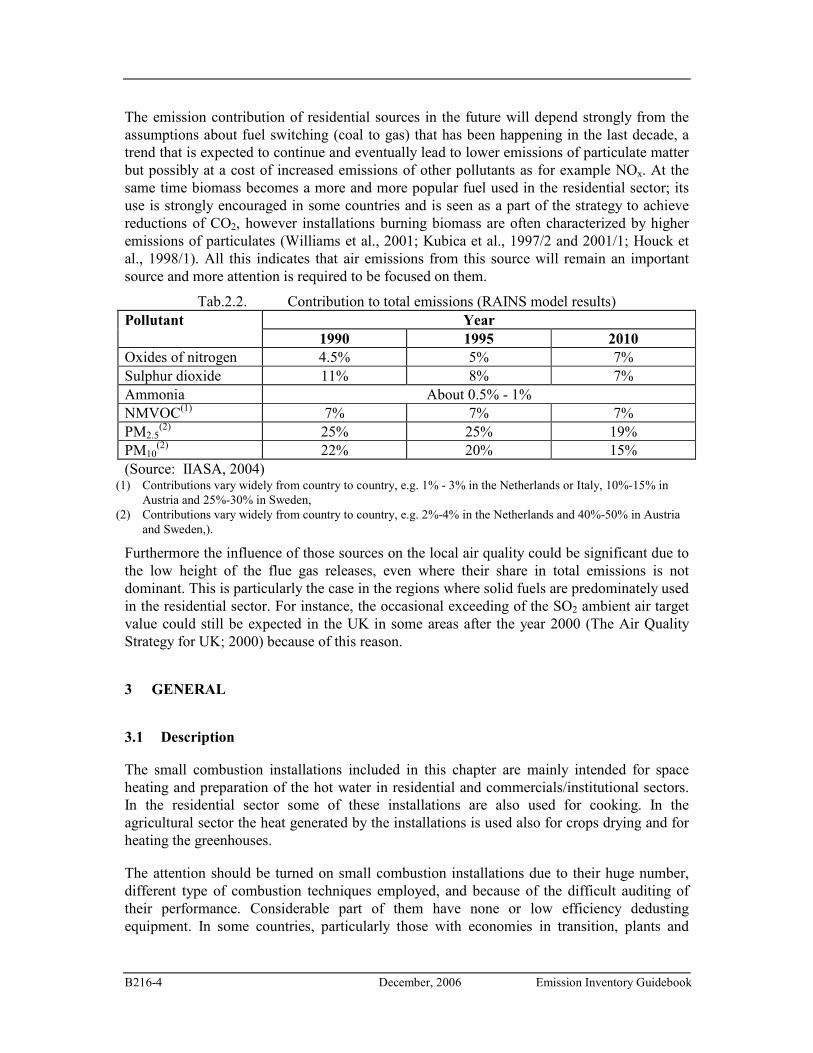
B216-4 December, 2006 Emission Inventory Guidebook
The emission contribution of residential sources in the future will depend strongly from the assumptions about fuel switching (coal to gas) that has been happening in the last decade, a trend that is expected to continue and eventually lead to lower emissions of particulate matter but possibly at a cost of increased emissions of other pollutants as for example NOx. At the same time biomass becomes a more and more popular fuel used in the residential sector; its use is strongly encouraged in some countries and is seen as a part of the strategy to achieve reductions of CO2, however installations burning biomass are often characterized by higher emissions of particulates (Williams et al., 2001; Kubica et al., 1997/2 and 2001/1; Houck et al., 1998/1). All this indicates that air emissions from this source will remain an important source and more attention is required to be focused on them.
Tab.2.2. Contribution to total emissions (RAINS model results) Year Pollutant
1990 1995 2010
Oxides of nitrogen 4.5% 5% 7% Sulphur dioxide 11% 8% 7% Ammonia About 0.5% - 1% NMVOC(1) 7% 7% 7% PM2.5
(2) 25% 25% 19% PM10
(2) 22% 20% 15% (Source: IIASA, 2004)
(1) Contributions vary widely from country to country, e.g. 1% - 3% in the Netherlands or Italy, 10%-15% in Austria and 25%-30% in Sweden,
(2) Contributions vary widely from country to country, e.g. 2%-4% in the Netherlands and 40%-50% in Austria and Sweden,).
Furthermore the influence of those sources on the local air quality could be significant due to the low height of the flue gas releases, even where their share in total emissions is not dominant. This is particularly the case in the regions where solid fuels are predominately used in the residential sector. For instance, the occasional exceeding of the SO2 ambient air target value could still be expected in the UK in some areas after the year 2000 (The Air Quality Strategy for UK; 2000) because of this reason.
3 GENERAL
3.1 Description
The small combustion installations included in this chapter are mainly intended for space heating and preparation of the hot water in residential and commercials/institutional sectors. In the residential sector some of these installations are also used for cooking. In the agricultural sector the heat generated by the installations is used also for crops drying and for heating the greenhouses.
The attention should be turned on small combustion installations due to their huge number, different type of combustion techniques employed, and because of the difficult auditing of their performance. Considerable part of them have none or low efficiency dedusting equipment. In some countries, particularly those with economies in transition, plants and
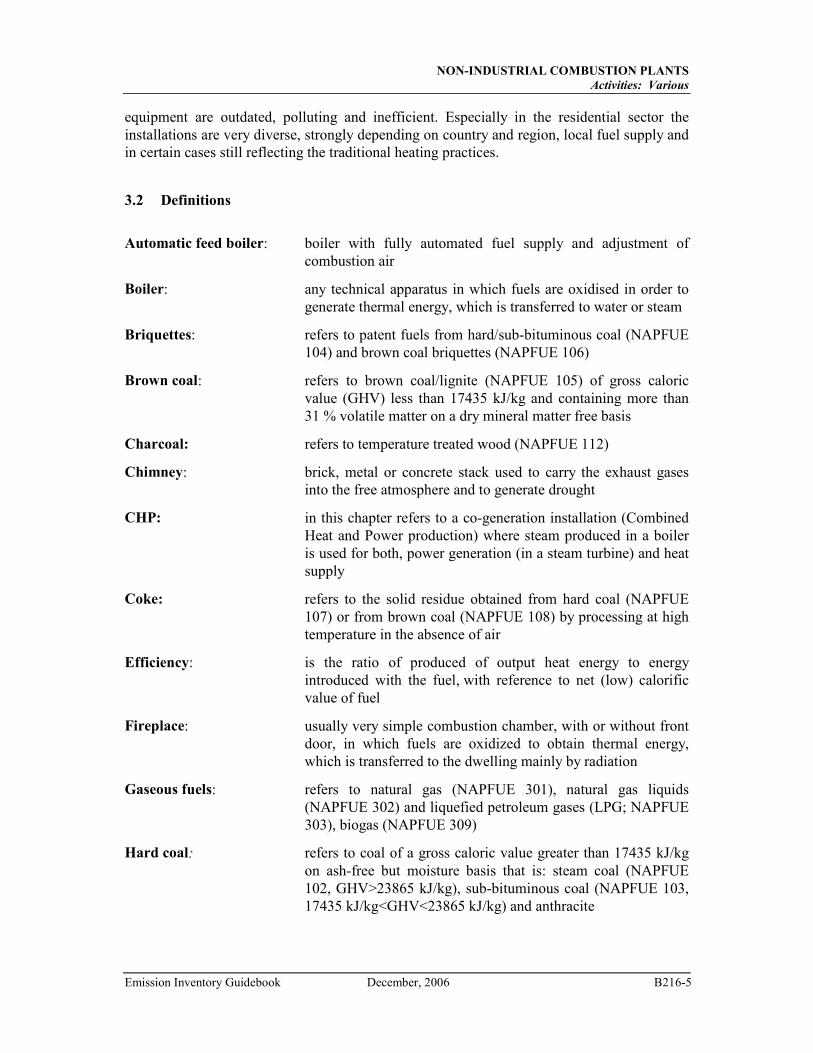
NON-INDUSTRIAL COMBUSTION PLANTS
Activities: Various
Emission Inventory Guidebook December, 2006 B216-5
equipment are outdated, polluting and inefficient. Especially in the residential sector the installations are very diverse, strongly depending on country and region, local fuel supply and in certain cases still reflecting the traditional heating practices.
3.2 Definitions
Automatic feed boiler: boiler with fully automated fuel supply and adjustment of
combustion air
Boiler: any technical apparatus in which fuels are oxidised in order to generate thermal energy, which is transferred to water or steam
Briquettes: refers to patent fuels from hard/sub-bituminous coal (NAPFUE 104) and brown coal briquettes (NAPFUE 106)
Brown coal: refers to brown coal/lignite (NAPFUE 105) of gross caloric value (GHV) less than 17435 kJ/kg and containing more than 31 % volatile matter on a dry mineral matter free basis
Charcoal: refers to temperature treated wood (NAPFUE 112)
Chimney: brick, metal or concrete stack used to carry the exhaust gases into the free atmosphere and to generate drought
CHP: in this chapter refers to a co-generation installation (Combined Heat and Power production) where steam produced in a boiler is used for both, power generation (in a steam turbine) and heat supply
Coke: refers to the solid residue obtained from hard coal (NAPFUE 107) or from brown coal (NAPFUE 108) by processing at high temperature in the absence of air
Efficiency: is the ratio of produced of output heat energy to energy introduced with the fuel, with reference to net (low) calorific value of fuel
Fireplace: usually very simple combustion chamber, with or without front door, in which fuels are oxidized to obtain thermal energy, which is transferred to the dwelling mainly by radiation
Gaseous fuels: refers to natural gas (NAPFUE 301), natural gas liquids (NAPFUE 302) and liquefied petroleum gases (LPG; NAPFUE 303), biogas (NAPFUE 309)
Hard coal: refers to coal of a gross caloric value greater than 17435 kJ/kg on ash-free but moisture basis that is: steam coal (NAPFUE 102, GHV>23865 kJ/kg), sub-bituminous coal (NAPFUE 103, 17435 kJ/kg<GHV<23865 kJ/kg) and anthracite
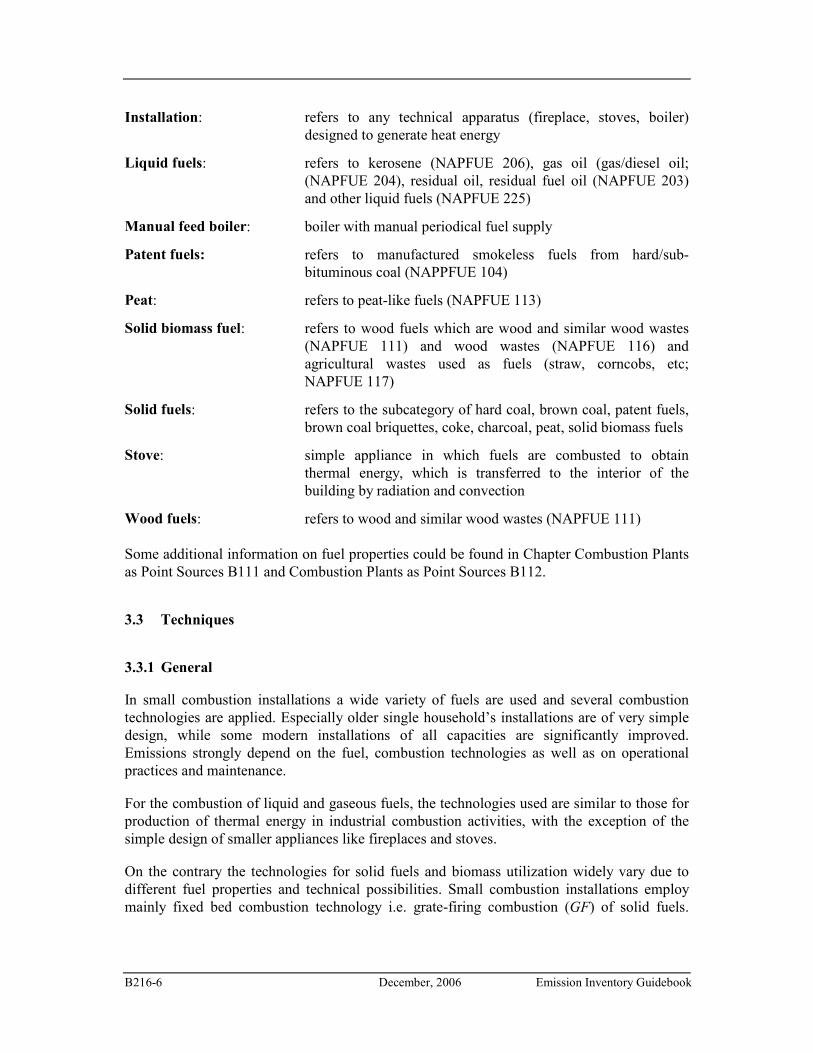
B216-6 December, 2006 Emission Inventory Guidebook
Installation: refers to any technical apparatus (fireplace, stoves, boiler) designed to generate heat energy
Liquid fuels: refers to kerosene (NAPFUE 206), gas oil (gas/diesel oil; (NAPFUE 204), residual oil, residual fuel oil (NAPFUE 203) and other liquid fuels (NAPFUE 225)
Manual feed boiler: boiler with manual periodical fuel supply
Patent fuels: refers to manufactured smokeless fuels from hard/sub-bituminous coal (NAPPFUE 104)
Peat: refers to peat-like fuels (NAPFUE 113)
Solid biomass fuel: refers to wood fuels which are wood and similar wood wastes (NAPFUE 111) and wood wastes (NAPFUE 116) and agricultural wastes used as fuels (straw, corncobs, etc; NAPFUE 117)
Solid fuels: refers to the subcategory of hard coal, brown coal, patent fuels, brown coal briquettes, coke, charcoal, peat, solid biomass fuels
Stove: simple appliance in which fuels are combusted to obtain thermal energy, which is transferred to the interior of the building by radiation and convection
Wood fuels: refers to wood and similar wood wastes (NAPFUE 111)
Some additional information on fuel properties could be found in Chapter Combustion Plants as Point Sources B111 and Combustion Plants as Point Sources B112.
3.3 Techniques
3.3.1 General
In small combustion installations a wide variety of fuels are used and several combustion technologies are applied. Especially older single household’s installations are of very simple design, while some modern installations of all capacities are significantly improved. Emissions strongly depend on the fuel, combustion technologies as well as on operational practices and maintenance.
For the combustion of liquid and gaseous fuels, the technologies used are similar to those for production of thermal energy in industrial combustion activities, with the exception of the simple design of smaller appliances like fireplaces and stoves.
On the contrary the technologies for solid fuels and biomass utilization widely vary due to different fuel properties and technical possibilities. Small combustion installations employ mainly fixed bed combustion technology i.e. grate-firing combustion (GF) of solid fuels.
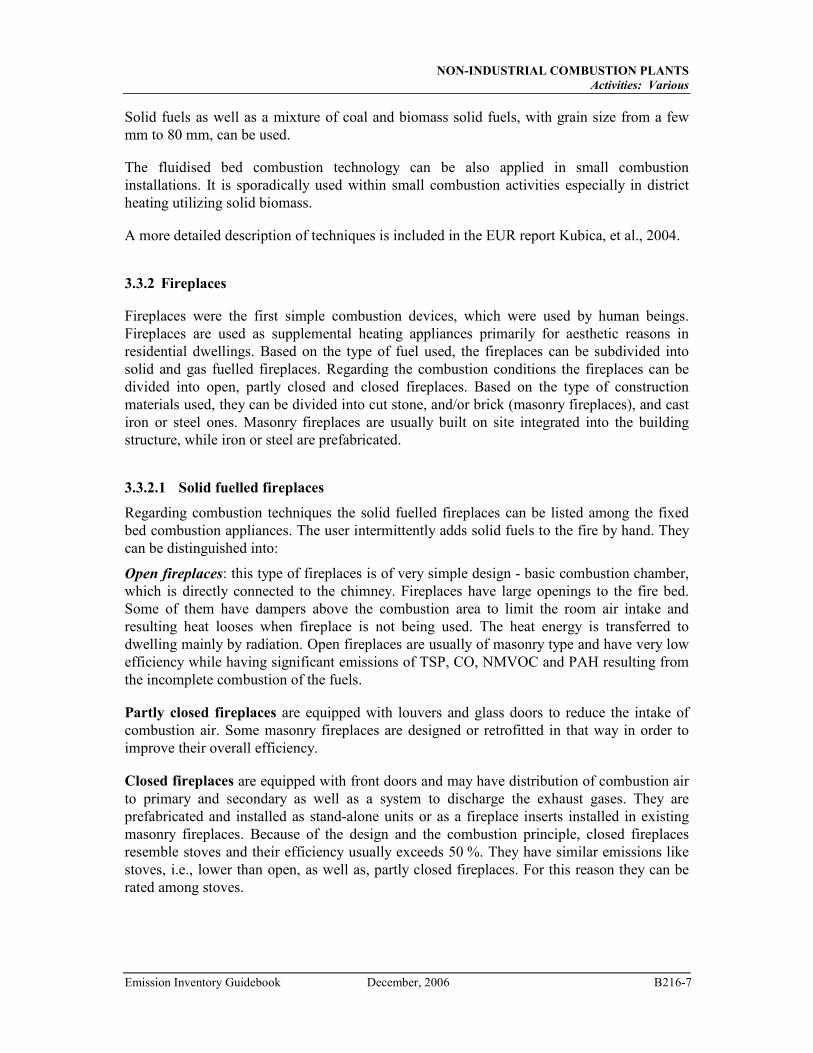
NON-INDUSTRIAL COMBUSTION PLANTS
Activities: Various
Emission Inventory Guidebook December, 2006 B216-7
Solid fuels as well as a mixture of coal and biomass solid fuels, with grain size from a few mm to 80 mm, can be used.
The fluidised bed combustion technology can be also applied in small combustion installations. It is sporadically used within small combustion activities especially in district heating utilizing solid biomass.
A more detailed description of techniques is included in the EUR report Kubica, et al., 2004.
3.3.2 Fireplaces
Fireplaces were the first simple combustion devices, which were used by human beings. Fireplaces are used as supplemental heating appliances primarily for aesthetic reasons in residential dwellings. Based on the type of fuel used, the fireplaces can be subdivided into solid and gas fuelled fireplaces. Regarding the combustion conditions the fireplaces can be divided into open, partly closed and closed fireplaces. Based on the type of construction materials used, they can be divided into cut stone, and/or brick (masonry fireplaces), and cast iron or steel ones. Masonry fireplaces are usually built on site integrated into the building structure, while iron or steel are prefabricated.
3.3.2.1 Solid fuelled fireplaces
Regarding combustion techniques the solid fuelled fireplaces can be listed among the fixed bed combustion appliances. The user intermittently adds solid fuels to the fire by hand. They can be distinguished into:
Open fireplaces: this type of fireplaces is of very simple design - basic combustion chamber, which is directly connected to the chimney. Fireplaces have large openings to the fire bed. Some of them have dampers above the combustion area to limit the room air intake and resulting heat looses when fireplace is not being used. The heat energy is transferred to dwelling mainly by radiation. Open fireplaces are usually of masonry type and have very low efficiency while having significant emissions of TSP, CO, NMVOC and PAH resulting from the incomplete combustion of the fuels.
Partly closed fireplaces are equipped with louvers and glass doors to reduce the intake of combustion air. Some masonry fireplaces are designed or retrofitted in that way in order to improve their overall efficiency.
Closed fireplaces are equipped with front doors and may have distribution of combustion air to primary and secondary as well as a system to discharge the exhaust gases. They are prefabricated and installed as stand-alone units or as a fireplace inserts installed in existing masonry fireplaces. Because of the design and the combustion principle, closed fireplaces resemble stoves and their efficiency usually exceeds 50 %. They have similar emissions like stoves, i.e., lower than open, as well as, partly closed fireplaces. For this reason they can be rated among stoves.
B216-8 December, 2006 Emission Inventory Guidebook
Fuels used in solid fuel fireplaces are mainly: log, lump wood, biomass briquettes, and charcoal, coal and coal briquettes.
Traditional solid-fuelled fireplaces have high emissions and for that reason upgrade to a closed fireplace by installing inserts or their conversion to gas could reduce its emissions. Fireplaces might also be equipped with catalytic converters in an effort to limit emissions, but the control options are described in details later in chapter 3.5.
3.3.2.2 Gas fuelled fireplaces
The gas fireplaces are also of simple design; materials and equipment are similar to those of solid fuels fireplaces, yet equipped with a gas burner. Because of the simple valves employed for adjustment of fuel/air ratio and non-premixing burners, NOx emissions are lower but emissions of CO and NMVOC are higher in comparison to the boilers using the same fuel.
3.3.3 Stoves
Stoves are simple appliances in which hand supplied fuels are combusted; useful heat is transmitted to the surroundings by radiation and convection. Depending on the main mode of heat transfer they are generally classified as radiating stoves or convection stoves (circulating, heat storing – heat accumulating). They can vary widely due to fuels type, application, design and construction materials, and also combustion process organisation. Due to the fuel properties they can be divided into the following subgroups:
• solid fuels • liquid fuels • gaseous fuels
The stoves utilizing solid fuels are usually used for heating of the rooms, but also for cooking, and hot water preparation (bath stove/furnace), while liquid and gas stoves are used for heating only.
3.3.3.1 Solid fuel stoves
The solid fuel stoves are classified on the basis of the combustion principle, which primarily depends on the airflow path through the charge of fuel in a combustion chamber. Two main types exist: up-draught (under-fire, down-burning combustion) and downdraught (up-burning combustion). The vast majority of older stoves are of the up-draught type, which is of simpler design, but has higher emissions.
The stoves can be made as prefabricated iron or steel appliances or masonry stoves, which are usually assembled on site with bricks, stone or ceramic materials. Regarding the main mode of heat transfer, solid fuel stoves can be divided into two main subgroups which are: radiating stoves, and heat storing - heat accumulating stoves.
Radiating stove; usually prefabricated iron or steel appliances; some of them used as cooking stoves. Radiating ordinary stoves are characterized by high emissions. The development of
NON-INDUSTRIAL COMBUSTION PLANTS
Activities: Various
Emission Inventory Guidebook December, 2006 B216-9
their design resulted in new constructions such as pellet stoves and stoves with advanced combustion process organization having higher efficiency and lower emissions. Considering the combustion process organization they can be differentiated as follows:
� Conventional stoves have poorly organised combustion process resulting in low efficiency (40% to 50%) and significant emissions of pollutants mainly originating from incomplete combustion (TSP, CO, NMVOC and PAH). Their autonomy is low, lasting from 3 to 8 hours. Those, which are equipped with hot plate zones, are used also for cooking - kitchen stoves. Some of them could also be used for hot water preparation.
� Classic energy efficient stoves; due to the utilization of secondary air in the combustion chamber their efficiency is between 55% to 75% and emission of pollutants are lower, their autonomy ranges from 6 to 12 hours.
� Advanced combustion stoves: These stoves are characterized by multiple air inlets and pre-heating of secondary combustion air by heat exchange with hot flue gases. This design results in increased efficiency (near 70% at full load) and reduced CO, NMVOC and TSP emissions in comparison with the conventional stoves.
� Pellet stoves: They can be fed only with pelletised fuels such as wood pellets, which are distributed to the combustion chamber by a fuel feeder from a small fuel storage. Pellets stoves are equipped with a fan and electronic control system for supply of the combustion air. For this reason they are characterized by high efficiency (above 80% up to 90%) and low emissions of CO, NMVOC, TSP and PAH.
Heat storing, heat accumulating stoves; depending on a country and regional tradition, masonry stoves are made of bricks, stones or combinations of both together with fireproof materials, such as ceramic (chamotte, faience). Sometimes they are made as prefabricated devices. Heat accumulating stoves are characterized with relatively low emissions of pollutants compared with the classical radiating stoves. Efficiency of masonry heating stoves ranges between 60% and 80%. Due to its function they can be diversified into:
� Room heating stoves; some more advanced of them employ contraflow system (Kubica et al, 2004) for heat transfer.
� Heat accumulating cooking stoves can be divided into two categories: simple residential cooking and boiler cooking stoves. The first ones are equipped with a combustion chamber with hot plate zones for food preparation and room heating; the second ones are simultaneously used as kitchen stove, room heating and hot water preparation (e.g. “Russian stoves”).
Catalytic combustor stove; Stoves, in particular for wood combustion, can be equipped with a catalytic converter in order to reduce emissions caused by incomplete combustion. Due to more complete oxidation of the fuels also energy efficiency increases. Catalytic combustors are not common for coal stoves.
Different kinds of solid fuels are used such as: coal and its products (usual anthracite, hard coal, brown coal, patent fuels, and brown coal briquettes) and biomass - lump wood and biomass pellets and briquettes. Coals of different grain sizes are used usually 20-40mm, and above 40mm, or mixtures of both. Peat is also occasionally used.
B216-10 December, 2006 Emission Inventory Guidebook
3.3.3.2 Liquid/gas fuelled stoves
The liquid/gas stoves have simple design; materials are alike for solid fuels stoves. Gas stoves are equipped with simple valves for fuel/air ratio adjustment and non-pre-mixing burners. For that reason emissions NOx from these are lower in comparison to boilers. Simple liquid fuel stoves use evaporation systems for preparation of fuel/air mixture.
Regarding construction material and design, liquid and gas stoves are generally less diversified than those for solid fuels. They are made of steel and prefabricated.
3.3.4 Small boilers (single household/domestic heating) – indicative capacity ≤ 50 kWth
Small boilers of this capacity are used in flats and single houses. All types of fuels could be used. They are mainly intended for generation of heat for the central heating system, but also hot water supply or combination of both.
3.3.4.1 Solid fuel small boilers
Small boilers for central heating for individual households are more widespread in temperate regions and usually have a nominal capacity between 12kWth to 50kWth. They use different types of solid fossil fuels and biomass usually depending on their regional availability. They could be divided into two broad categories regarding the organisation of combustion process: overfeed boiler (overfeed burning - over-fire and under-fire -, down-burning) and underfeed boiler (underfeed burning - upper-fire). They can be differentiated between conventional and advanced combustion boilers.
Conventional, coal/biomass boilers
Over-fire boilers: Over-fire boilers are commonly used in residential heating due to their simple operation and low investment cost. An incomplete combustion process takes place due to the non-optimal combustion air supply, which is usually generated by natural draught. The fuel is periodical fed onto the top of the burning fuel bed. The efficiency of the over-fire boiler is similar to the efficiency of conventional stoves, and is usually between 50% and 65%, depending on construction design and load. The emission of pollutants resulting from incomplete combustion of fuel may be very high particularly if they are operated at low load.
Under-fire boilers: Under-fire boilers have manual fuel feeding systems, and stationary or sloping grates. They have a two-part combustion chamber. The first part is used for storage of fuel and for partial devolatilization and combustion of the fuel layer. In the second part of the combustion chamber the combustible gases are oxidized. In the old design boilers natural draught is used. Combustion in under-fire boilers is more stable than in over-fire boilers, due to continuous gravity feed of fuel onto the fire bed. This results in higher energy efficiency (60-70%) and lower emissions in comparison to overfeed combustion.
Over-fire and under-fire boilers use all types of solid fuels except pellets, wood chips and fine-grained coal.
NON-INDUSTRIAL COMBUSTION PLANTS
Activities: Various
Emission Inventory Guidebook December, 2006 B216-11
Advanced combustion boilers
Advance, under-fire coal boilers: In general the design and the combustion technique are similar to the conventional under-fire boiler. The main difference is that a fan controls the flue gases flow. Control system for the primary and secondary air might lead to increase in efficiency above 80% (usually between 70% and 80%).
Downdraught wood boilers: This type of boiler is considered state of the art in the lump wood combustion. It has two chambers, first one where the fuel is fed for partial devolatilisation and combustion of the fuel layer, and a secondary chamber, where burning of the released combustible gases occurs. The advantage of this boiler is that the flue gases are forced to flow down through holes in a ceramic grate and thus are burned at high temperature within the secondary combustion chamber and ceramic tunnel. Owing to the optimised combustion process, emissions due to incomplete combustion are low.
Stoker coal burners: The fuel with low ash contents and the grain size of between 4 mm up to 25 mm is automatically fed into to a retort by a screw conveyor. Stoker boiler is characterized by higher efficiency, usually above 80%. The advantage of stoker boiler is that it can operate with high efficiency within load range from 30% to nominal capacity. In a properly operated stoker, emissions of pollutants resulting from incomplete combustion are significantly lower, however NOx increases due to the higher combustion temperature.
Wood pellet boiler has a fully automatic system for feeding of pellet fuels and for supply of combustion air, which is distributed into primary and secondary. The boilers are equipped with a smaller pellet storage, which is fuelled manually or by an automatic system from larger chamber storage. The pellets are introduced by screw into burner. These boilers are characterised by a high efficiency (usually above 80%) and their emissions are comparable to those of liquid fuel boilers.
3.3.4.2 Liquid/gas fuelled small boilers
These are usually two-function appliances used for hot water preparation and for heat generation for the central heating system. In the capacity range below 50 kWth they are used mainly in single households. Water-tube low temperature boilers (temperature of water below 100oC) (see 3.3.5.2) with open combustion chamber are usually used. These devices can be made of cast iron or steel. The boilers of capacity below 50 kWth, can be divided into two main groups, i.e., standard boiler and condensation boilers.
Standard boilers; with open combustion chamber, having a maximum energy efficiency above 80%, because of the fact that flue gases are discharged at a temperature above 200oC and the inlet/return water temperature is usually above 60oC. Due to very simple design of combustion process automation system they are characterized by higher emission of CO and VOC in comparison to medium size boilers and industrial installations.
Condensation boilers; with closed combustion chamber; can operate with efficiency more than 90%. Recovering part of the latent heat from flue gases contributes to increased energy efficiency. It is achieved by condensation of the water vapour from the flue gases, which, in
B216-12 December, 2006 Emission Inventory Guidebook
the optimal operation, have a temperature below 60oC at the chimney inlet. Gaseous fuels are mainly used in condensation boilers.
3.3.5 Boilers with indicative capacity between 50 kWth and 50 MWth
Boilers of such a capacity are used in multiresidential houses, block of flats and are the most commonly found small sources in commercial and institutional sector as well as in agriculture.
3.3.5.1 Solid fuels fuelled boilers
Fixed bed combustion technology is mainly used for combustion of solid fuels in this capacity range. This is a well-established technology, and a great variety of fixed bed layer and moving layer boilers (travelling grate combustion, stokers) are in use. Installations are differentiated into two main subgroups:
• manually fuelled • automatically fuelled
In addition to fixed bed combustion also fluidised bed combustion boilers are in use in this capacity range, mostly for biomass combustion.
3.3.5.1.1 Manual feed boilers
Due to economical and technical reasons manual feeding boilers usually have a nominal capacity lower than 1MWth.
Coal/wood boilers
Manually fed boilers in this capacity range apply two combustion techniques, under-fire and upper-fire, similar as in boilers of lower capacity range (see 3.3.4.1).
Overfeed boilers, under-fire boilers: Coal fuels of different grain size (usually between 5mm and 40 mm) or lump wood are used in this type of installations. Their thermal efficiency ranges from 60% to 80% and depends on the air distribution into primary/secondary system and secondary sub-chamber design. The emissions of pollutants, i.e., CO, NMVOC, TSP and PAH resulting from incomplete combustion are generally high.
Overfeed boilers, upper-fire boilers: Fine coal, or mixture of fine coal with biomass chips, which are periodically moved into combustion chamber are used in this type of boilers. The ignition of fuel charge is started from its top. Their efficiency ranges from 75% to 80%. The emissions of pollutants of TSP, CO, NMVOC, PAH are lower in comparison to overfeed boilers due to different combustion process organization, which is similar to stoker combustion.
Both the under-fire and upper-fire boilers, in this capacity range, have better organisation of the combustion air compared with the ones used in single households.
NON-INDUSTRIAL COMBUSTION PLANTS
Activities: Various
Emission Inventory Guidebook December, 2006 B216-13
Biomass/straw boilers
Overfeed boilers, biomass/straw fixed grate boilers: These are developed and applied for straw and cereal bale combustion. The straw bales are fed to the combustion chamber by hand. Because of very fast combustion of this kind of biomass these installations contain hot water accumulation system. For this reason they are used only in small-scale applications up to a nominal boiler capacity of 1,5 MWth. They are very popular in the agricultural regions due to their relatively low costs and simple maintenance.
3.3.5.1.2 Automatic feed boilers
The automatic feed boilers usually have a capacity above 1MWth, but nowadays also lower capacity boilers are equipped with automatic feeding. In addition these installations have in general better control of the combustion process compared with manually fed ones. They typically require fuels of standardised and stable quality. These installations might also have dedusting equipment.
Moving bed (GF) combustion: They are commonly classified according to the way in which fuel is fed to the grate, as spreader stokers, overfeed stokers, and underfeed stokers.
The coal of smaller granulation or fine wood (e.g., chips or sawdust) is charged on a mechanical moving grate. The combustion temperatures are between 1000°C and 1300°C. The grate-fired installations are used also for co-combustion of coal with biomass. General applications are aimed at production of heat and/or hot water, and/or low-pressure steam for commercial and institutional users, in particular for district heating. Due to highly controlled combustion process of solid fuels in moving bed techniques and usually fully automatic process control systems the emissions of pollutants, resulting from incomplete combustion, is significantly lower in comparison to manual feed boilers.
Advanced techniques:
Underfeed coal/wood boilers; upper-fire burning, stoker boilers, underfeed rotating grate; are used for both coal and wood combustion. The process principle is combustion in underfeeding stoker. The fuel with low ash contents (wood chips, sawdust, pellets; particle sizes up to 50 mm, or coal up to 30 mm) is fed into the combustion chamber through a screw conveyor and is transported to a retort when is oxidised.
Cigar straw boiler is developed and applied for combustion of straw and cereal bales. The fuel bales are automatically transported to the combustion chamber by a hydraulic piston through an inlet tunnel into the combustion chamber.
Indirect combustor, gasification of wood biomass uses a separate gasification system for the chipped wood fuels, and the successive combustion of the product fuel gases in the gas boiler. An advantage of this technology is a possibility to use wet wood fuels of varying quality. This technique has low emissions of pollutants resulting from incomplete combustion of fuels.
B216-14 December, 2006 Emission Inventory Guidebook
Pre-ovens combustion system: Wood chip combustion installations are used in some countries, especially in the countryside, heating larger houses and farms. This system contains automatic chips fuel feeding by a screw and pre-ovens (well-insulated chamber) and could be connected to an existing boiler. Pre-ovens system applies full automatic combustion process and consequently emissions are low.
3.3.5.1.3 Fluidised bed combustion
The fluidised bed combustion (FBC) can be divided into bubbling fluidised bed (BFB) and circulating fluidised bed combustion (CFB), depending on the fluidisation velocity. The solid fuels are injected with combustion air through the bottom of the boiler into a turbulent bed. FBC is in particular adapted to poor quality, rich in ash coal. The FBC is most appropriate installation for co-combustion of coal with biomass and/or with waste fuels, or combustion of biomass. There are only few medium size installations of this type in operation.
3.3.5.2 Liquid/gas fuels
For gas and oil boilers the fuel and air are introduced as a mixture in the combustion chamber. The main distinction between gas/oil and coal pulverized combustion is the design of the individual burners of the boiler.
Boilers fired with gaseous and liquid fuels are produced in a wide range of different designs and are classified considering especially: burner configuration (injection burner or blow burner), material they are made of, the type of medium transferring heat (hot water, steam) and their power, the water temperature in the water boiler which can be: low temperature ≤ 100oC; medium-temperature >100oC to ≤ 115oC; high-temperature > 115oC), the heat transfer method (water-tube, fire -tube) and the arrangement of the heat transfer surfaces (horizontal or vertical, straight or bent over tube).
Cast iron boilers produce mainly low-pressure steam or hot water. Typically, they are used in residential and commercial/institutional sectors up to a nominal boiler capacity of about 1,5 MWth.
Steel boilers are manufactured, up to a nominal capacity of 50 MWth, from steel plates and pipes by means of welding. Their characteristic feature is the multiplicity of their design considering the orientation of heat transfer surface. The most common are: water-tube boilers, fire-tube boilers, furnace-fire-tube boilers and condensation boilers.
Water-tube boilers; are equipped with external, cubicle, steel water jacket. Water-tubes (water flows inside, exhaust gasses outside) are welded in the opposite walls of the cubicle.
Fire-tube boilers; in these boilers combustion gasses flow inside smoke tube, which are surrounded by the water. They are designed as cylinder or cubicle.
Furnace-fire-tube boilers made of steel; these devices are produced as the horizontal cylinders. The cylinder made of rolled steel plate ends at both sides with bottoms. The front
NON-INDUSTRIAL COMBUSTION PLANTS
Activities: Various
Emission Inventory Guidebook December, 2006 B216-15
bottom in its lower part (under the cylinder axis) is equipped with a furnace tube, which plays the role of combustion chamber.
Condensation boilers partly utilize the latent heat of the water vapour in the flue gases due to its condensation in the heat exchanger. For that reason their efficiency is higher than for other boiler systems. Their efficiency is more than 90%. They could efficiently operate at lower inlet water temperatures. Besides high efficiency their advantage is also lower emission of NOx.
3.3.6 Combined Heat and Power (CHP)
Requirements to increase the efficiency of the energy transformation and the use of renewable energy sources have led to the development of the smaller CHP units using in particular biomass and other by-products as fuels. The steam produced by the boiler is used by backpressure steam turbine (ST) with subsequent heat utilization. Electricity generation efficiency is slightly reduced, however the overall efficiency is improved compared with separate generation of power and heat. CHP using internal combustion engines are not covered in this chapter.
3.4 Emissions
Relevant pollutants are SO2, NOx, CO, NMVOC, particulate matter, heavy metals, PAH and PCDD/F. Emission of ammonia (NH3) is of lower importance.
For solid fuels generally the emissions due to incomplete combustion are many times greater in small appliances than in bigger plants. This is particularly valid for manually fed appliances and poorly controlled automatic installations.
For both, gaseous and liquid fuels, the emissions of pollutants are not significantly higher in comparison to industrial scale boilers due to the quality of fuels and design of burners and boilers, except for gaseous and liquid fuelled fireplaces and stoves because of their simple organization of combustion process. For the above-mentioned installations the same pollutants are generated as for solid fuels but their quantities are in general significantly lower.
Emissions caused by incomplete combustion are mainly a result of insufficient mixing of combustion air and fuel in the combustion chamber (local fuel-rich combustion zone), an overall lack of available oxygen, too low temperature, short residence times and too high radical concentrations (Kubica, 1997/1 and 2003/1). The following components are emitted to the atmosphere as a result of incomplete combustion in small combustion installations: CO, PM and NMVOCs, PAHs as well as PCDD/F. Small amounts of NH3 may also be released as a result of incomplete conversion of NH3.
The main influencing parameters, which determine the emissions and species profiles of some pollutants from combustion plants, are given in Section 3.4 and 9 of chapter B111 on
B216-16 December, 2006 Emission Inventory Guidebook
“Combustion Plant as Point Sources”. Because pollutants from incomplete combustion, in particular from solid fuels use, have a significant share they are further discussed here together with heavy metals since their emissions from biomass are different.
NH3 – Small amounts of ammonia may be emitted as a result of incomplete combustion process of all solid fuels containing nitrogen. This occurs in cases where the combustion temperatures are very low (fireplaces, stoves, old design boilers). NH3 emissions generally can be reduced by primary measures aiming to reduce products of incomplete combustion and increase of efficiency.
TSP, PM10, PM2.5 –Particulate matter in flue gases from combustion of fuels (in particular of solid fuels and biomass) might be defined as carbon, smoke, soot, stack solid or fly ash. Emitted particulate matter can be classified into three groups of fuel combustion products.
The first group is formed via gaseous phase combustion or pyrolysis as a result of incomplete combustion of fuels (the products of incomplete combustion - PIC): soot and organic carbon particles (OC) are formed during combustion as well as from gaseous precursors through nucleation and condensation processes (secondary organic carbon) as a product of aliphatic, aromatic radical’s reactions in a flame reaction zone in the presence of hydrogen and oxygenated species: CO and some mineral compounds as catalytic species, and VOC, tar/heavy aromatic compounds species as a results of incomplete combustion of coal/biomass devolatilization/pyrolysis products (from the first combustion step), and secondary sulphuric and nitric compounds. Condensed heavy hydrocarbons (tar substances) are an important, and in some cases, the main contributor to the total level of particles emission, in small-scale solid fuels combustion appliances such as fireplaces, stoves and old design boilers.
The next groups (second and third) may contain ash particles or cenospheres that are largely produced from fuels mineral matter, they contain oxides and salts (S, Cl) of Ca, Mg, Si, Fe, K, Na, P, and heavy metals, and unburned carbon form from incomplete combustion of carbonaceous material (black carbon or elemental carbon – BC; Kupiainen, et al., 2004); this is called carbon-in-ash (or loss on ignition).
Particulate matter emission from SCIs, mainly from different residential and commercial solid fuel appliances is typically combined with high emission of PICs associated and/or adsorbed. Size distribution depends on combustion conditions. Optimization of solid fuel combustion process by introduction of continuously controlled conditions (automatic fuel feeding, distribution of combustion air) leads to decrease of TSP emission and to change of PM distribution (Kubica, 2002/1 and Kubica et al., 2004/4). Application of co-combustion of coal and biomass leads to decrease of TSP, mainly PIC that are OC, (Kubica et al., 1997/2 and Kubica, 2004/5). Several studies have shown that the use of modern and "low-emitting" residential biomass combustion technologies leads to particle emissions dominated by submicron particles (< 1µm) and the mass concentration of particles larger than 10 µm is normally < 90 % for SCIs Boman et al., 2004 and 2005; Hays et al., 2003. Heavy metals (HM) – Most of heavy metals considered (As, Cd, Cr, Cu, Hg, Ni, Pb, Se, and Zn) are usually released as compounds associated and/or adsorbed with particles (e.g. sulfides, chlorides or organic compounds). Hg, Se, As and Pb are at least partially present in the vapour phase only. Less volatile elements tend to condensate onto the surface of smaller
NON-INDUSTRIAL COMBUSTION PLANTS
Activities: Various
Emission Inventory Guidebook December, 2006 B216-17
particles in the exhaust gases. Therefore the emission of heavy metals strongly depends on their contents in the fuels. Coal and its derivatives normally contain amounts several orders of magnitude higher than in oil (exceptionally for Ni and V in heavy oils) and in natural gas (about 2-5 µg/m3; van der Most et al., 1992). All “virgin” biomass also contains heavy metals. Their content depends on the type of biomass. Higher emission of Cd, and Zn were observed in comparison to those from coal. During the combustion of coal and biomass, particles undergo complex changes, which lead to vaporization of volatile elements. The rate of volatilization of heavy metal compounds depends on technology characteristics (type of boilers; combustion temperature) and on fuel characteristics (their contents of metals, fraction of inorganic species, such as chlorine, calcium, etc.). The chemical form of the mercury emitted may depend in particular on the presence of chlorine compounds. The nature of the combustion appliance used and any associated abatement equipment will also have an effect (Pye et al., 2005/1). Mercry emitted form SCIs, similarly to emission from large scale combustion, occurs in elementary form (elemental Mercury vapour Hg0), reactive gaseous form (Reactive Gaseous Mercury, RGM) and total particulate form (Total Particulate Mercury, TPM), Pacyna et al, 2004. Whereas it Has been show by Pye et al., 2005, that In case of SCIs distribution of particular species of emitted mercury is different to the one observed under large scale combustion. Contamination of biomass fuels, such as impregnated or painted wood may cause significantly higher amounts of heavy metals emitted (e.g. Cr, As). Heavy metals emissions can be reduced by secondary emission reduction measures, with the exception of Hg, As, Cd and Pb . Pye et al., 2005, have showed that limited technical abatement options (e.g. removal of mercury from flue gases after combustion) were identified specifically for SCIs, and those that were tended to be via abatement equipment that would normally be implemented for other pollutants, and which would have only indirect benefits for mercury emission reduction.
PCDD/F – The emissions of dioxins and furans are highly dependent on the conditions under which cooling of the combustion and exhaust gases is carried on. Carbon, chlorine, a catalyst and oxygen excess are necessary for the formation of PCDD/F. They are found to be consequence of the de-novo synthesis in the temperature interval between 180oC and 500oC (Karasek et al., 1987). Coal fired stoves in particular were reported to release very high levels of PCDD/F when using certain kinds of coal (Quass U., et al., 2000). The emission of PCDD/F is significantly increased when plastic waste is co-combusted in residential appliances or when contaminated/treated wood is used. The emissions of PCDD/F can be reduced by introduction of advanced combustion techniques of solid fuels (Kubica, 2003/3).
PAH – Emissions of polycyclic aromatic hydrocarbons results from incomplete (intermediate) conversion of fuels. As for CO, and NMVOC emissions of PAH depend on the organization of the combustion process, particularly on the temperature (too low temperature favourably increases their emission), the residence time in the reaction zone and the availability of oxygen (Kubica K., 1997/1, 2003/1). It was reported that coal stoves and old type boilers (hand fuelled) emit several times higher amounts of PAH in comparison to new design boilers (capacity below 50kWth), such as boilers with semi-automatic feeding (Kubica K., 2003/1, 2002/1,3). Technology of co-combustion of coal and biomass that can be applied in commercial/institutional and in industrial SCIs leads to reduction of emission PAHs, as well as TSP, NMVOCs and CO, Kubica et al., 1997/2 and 2004/5).

B216-18 December, 2006 Emission Inventory Guidebook
CO – Carbon monoxide is found in gas combustion products of all carbonaceous fuels, as an intermediate product of the combustion process and in particular for under-stoichiometric conditions. CO is the most important intermediate product of fuel conversion to CO2; it is oxidized to CO2 under appropriate temperature and oxygen availability. Thus CO can be considered as a good indicator of the combustion quality. The mechanisms of CO formation, thermal-NO, NMVOC and PAH are in general similarly influenced by the combustion conditions. The emissions level is also a function of the excess air ratio as well as of the combustion temperature and residence time of the combustion products in the reaction zone. Hence, small combustion installations of capacity above 1MWth, mainly with automatic feeding, have favourable conditions to achieve lower CO emission. Thus the emissions of CO from solid fuels fuelled small appliances are several thousand ppm in comparison to 50-100 ppm for industrial combustion chambers, used in power plants.
NMVOC – They are all intermediates in the oxidation of fuels. They can adsorb on, condense, and form particles. Similarly as for CO, emission of NMVOC is a result of too low temperature, too short residence time in oxidation zone, and/or insufficient oxygen availability. The emissions of NMVOC tend to decrease as the capacity of the combustion installation increases, due to the use of advanced techniques, which are typically characterized by improved combustion efficiency.
3.5 Controls
Reduction of emissions from combustion process can be achieved by either avoiding formation of such substances (primary measures) or by removal of pollutants from exhaust gases (secondary measures).
Primary measures. These actions, preventing or reducing emission comprise of several possibilities (Kubica, 2002/3, Pye et al., 2004):
• replacing of coal by upgraded solid derived fuel, biomass, oil, gas • modification of fuels composition and improvement of their quality; preparation and
improvement of quality of solid fuels, in particular of coal (in reference to S, Cl, ash contents, and fine sub-fraction contents); modification of the fuels granulation by means of compacting - briquetting, pelletizing; pre-cleaning – washing; selection of grain size in relation to the requirements of the heating appliances (stove, boilers) and supervision of its distribution; partial replacement of coal with biomass (implementation of co-combustion technologies enabling reduction of SO2, and NOx), application of combustion modifier; catalytic and S-sorbent additives (limestone, dolomite), reduction and modification of the moisture contents in the fuel, especially in the case of solid biomass fuels
• selection of the combustion appliances type: replacement of low effective heating appliances with newly designed appliances, and supervision of their distribution by obligatory certification system; chimney sweeper supervision over residential and communal system heating
• improved construction of the combustion appliances; implementation of advanced technologies in fire places, stoves and boilers construction (implementation of BAT for combustion techniques and good combustion practice)
NON-INDUSTRIAL COMBUSTION PLANTS
Activities: Various
Emission Inventory Guidebook December, 2006 B216-19
• control optimization of combustion process, mainly in small combustion installations capacity above 1MWth.
Co-combustion of coal and biomass that can be applied in commercial/institutional and in industrial SCIs leads to reduction of TSP and PIC emission, mainly PAHs, NMVOCs and CO, Kubica et al., 1997/2 and 2004/5).
Secondary emission reduction measures: For small combustion installations a secondary measure can be applied to remove emissions, in particular PM. In this way emissions of pollutants linked with the PM, such as heavy metals, PAHs and PCDD/F can also be significantly reduced due to their removal together with particulate matter. These measures/controls are characterized by various dedusting efficiency (Perry at al., 1997 and Bryczkowski at al., 2002) and may be used mainly in medium size sources in small combustion installations (capacity at least 1 MWth), due to technical reasons. For particulate matter the following options can be considered:
• settling chambers; gravity separation where the low collection efficiency (about 35% of fine dust, which contains 90% PM below 75 µm) is the main disadvantage,
• cyclone separators; disadvantage - low collection efficiency - their efficiency for fine particles is 78-85% - when compared to other filtration options, such as electrostatic precipitators or fabric filters, also tar substances may condense inside the apparatus,
• for higher effectiveness (94-99%) units with multiple cyclones (cyclone batteries) are applied, and multi-cyclones for increased gas flow rates,
• electrostatic precipitators (their efficiency is between 99,5% to 99,9%) or fabric filters (with efficiency about 99,9%) are typically not used in medium combustion plants due to their high costs. Fabric filters, which are relatively cheaper, also have the added constraint of operating temperatures below 200ºC and high-pressure drop.
Wood combustion appliances, stoves in particular, can be equipped with a catalytic converter in order to reduce emissions caused by incomplete combustion. The catalytic converter (a cellular or honeycomb, heat ceramic monolith covered with a very small amount of platinum, rhodium, or combination of these) is usually placed inside the flue gas channel beyond the main combustion chamber. When the flue gas passes through catalytic combustor, some pollutants are oxidized. The catalyst efficiency of emission reduction depends on the catalyst material, its construction – active surface, the conditions of flue gases flow inside converter (temperature, flow pattern, residence time, homogeneity, type of pollutants). For wood stoves with forced draught, equipped with catalytic converter (Hustad, et al., 1995) the efficiency of emission reduction of pollutants is as follows: CO 70-93%,, CH4 29-77%, other hydrocarbons more than 80%, PAH 43-80% and tar 56-60%. Reduction of CO emissions from stoves equipped with catalytic converter is significant in comparison to an advanced downdraught staged-air wood stove under similar operating conditions, (Skreiberg, 1994). However, the catalysts needs frequent inspection and cleaning. The lifetime of a catalyst in a wood stove with proper maintenance is usually about 10,000 hours.
Secondary measures with reference to, NOx and SO2 cannot be applied for small combustion installations from a technical and economical point of view. Because of the significant share of PM and the linked substances, technical methods for their reduction are currently under intense development especially for small sources of capacity below 1MWth.
B216-20 December, 2006 Emission Inventory Guidebook
Due to the heterogeneity of SCIs across Europe, and the difference in energy markets, it is clear that technical measures for emission reduction will be implemented on a country-by-country basis, taking into consideration such differences. Primary (preventative) technical controls (such as replacement of appliance or change in type of fuel) will be used for smaller SCIs, while secondary abatement measures will be more applicable to larger institutional and industrial plant, Pye et al., 2005/1.
4 SIMPLER METHODOLOGY
4.1 General
This simpler methodology is intended for calculating and reporting emissions when the contribution of sources 1A1a; 1A4a; 1A4bi; 1A4ci; 1A5a (and small installations in 1A1a) in the national totals is small or for the first assessment of emissions from these sources when there are no data available for application of the detailed methodology. The simpler methodology described in this chapter refers to the calculation of the emissions, based on the split of the small combustion sources in the relevant sectors only with regard to the fuel used and anticipates the application of default emission factors. It covers all relevant emissions that are: SO2, CO, NMVOC, NOx, NH3, TSP, PM10, PM2.5, heavy metals, PCDD/PCDF and PAH.
4.2 Applicability
The simpler methodology does not take into account differences in the emissions due to the wide variety of technologies, which is present among these sources, neither the different level of maintenance nor the influence of locally specific fuels. This is why the simpler approach might lead to a significant uncertainty in the estimated emissions. Moreover this approach does not take into account the penetration of new technologies, and thus might not represent appropriately the trends in emissions. Therefore the simpler methodology should be
applied only if the contribution of these sources in the national totals is small or for the
first assessment of emissions from these sources when there are no data available for
application of the detailed methodology. In most cases when the share of solid fuels in covered sector is significant, the detailed methodology should be applied.
4.3 Methodology
The simpler methodology involves applying an appropriate emission factor to activity data given at the level of sectors (commercial/institutional, residential, agriculture and others). Within each sector only different fuels are distinguished. Default emission factors to facilitate this approach are provided in section 8.1.
NON-INDUSTRIAL COMBUSTION PLANTS
Activities: Various
Emission Inventory Guidebook December, 2006 B216-21
Emissions can be estimated at different levels of complexity; it is useful to think in terms of three tiers1:
Tier 1: a method using readily available statistical data on the intensity of processes (“activity rates”) and default emission factors. These emission factors assume a linear relation between the intensity of the process and the resulting emissions. The Tier 1 default emission factors also assume an average or typical process description.
Tier 2: is similar to Tier 1 but uses more specific emission factors developed on the basis of knowledge of the types of processes and specific process conditions that apply in the country for which the inventory is being developed.
Tier 3: is any method that goes beyond the above methods. These might include the use of more detailed activity information, specific abatement strategies or other relevant technical information.
By moving from a lower to a higher Tier it is expected that the resulting emission estimate will be more precise and will have a lower uncertainty. Higher Tier methods will need more input data and therefore will require more effort to implement. For the Tier 1 simpler methodology, where limited information is available, a default emission factor can be used together with activity information for the country or region of interest with limited or no specification on the type of technology or the type and efficiency of control equipment. For a Tier 2 approach an approximation may be made of the most representative technologies, thereby allowing the use of more appropriate default factors if more detailed activity data are available. Consequently the simplest methodology (Tier 1) is to combine an activity rate (AR) with a comparable, representative, value of the emissions per unit activity, the emission factors (EF). The basic equation is:
Emission = AR x EF
In the energy sector, for example, fuel consumption would be activity data and mass of material emitted per unit of fuel consumed would be a compatible emission factor.
NOTE: The basic equation may be modified, in some circumstances, to include emission reduction efficiency (abatement factors). The Tier 2 methodology is a modified version of this basic equation: Emission = ∑((AR1 x EF1) + (AR2 x EF2) +….(ARn x EFn))
Default emission factors for this purpose are provided in Sections 8.1 and 8.2.
1 The term “Tier” is used in the 2006 IPCC Guidelines for National Greenhouse Gas Inventories and adopted here for easy reference and to promote methodological harmonization.
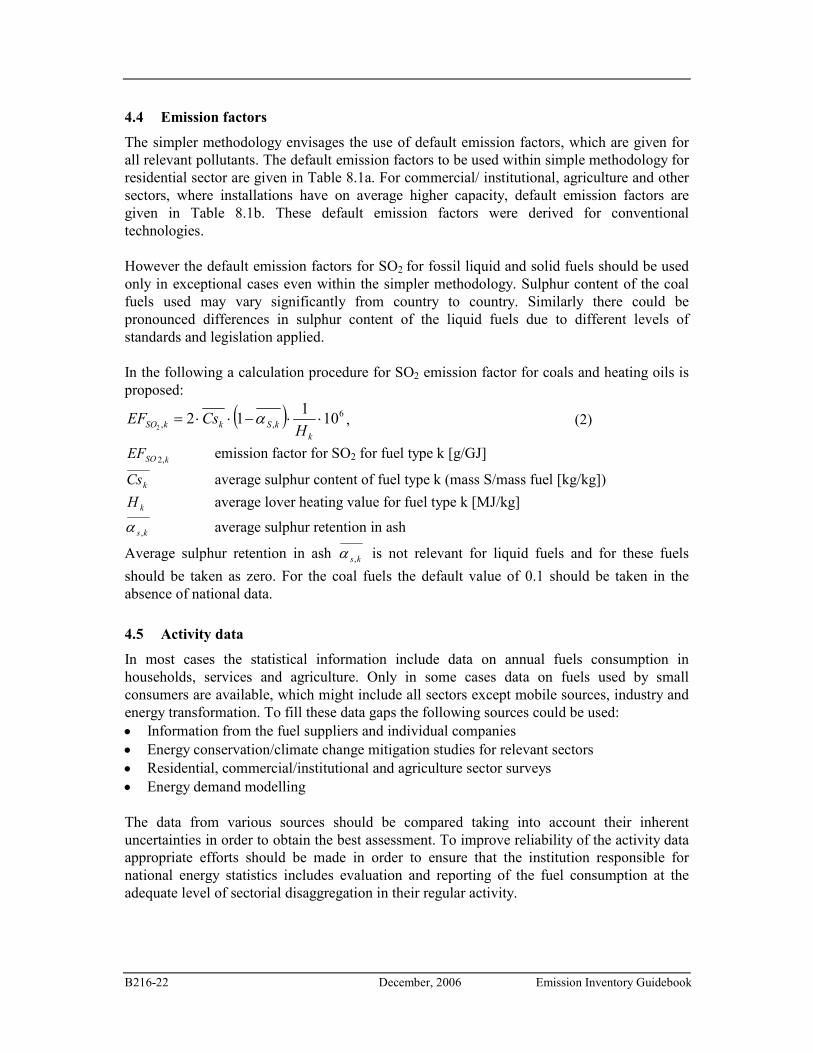
B216-22 December, 2006 Emission Inventory Guidebook
4.4 Emission factors
The simpler methodology envisages the use of default emission factors, which are given for all relevant pollutants. The default emission factors to be used within simple methodology for residential sector are given in Table 8.1a. For commercial/ institutional, agriculture and other sectors, where installations have on average higher capacity, default emission factors are given in Table 8.1b. These default emission factors were derived for conventional technologies. However the default emission factors for SO2 for fossil liquid and solid fuels should be used only in exceptional cases even within the simpler methodology. Sulphur content of the coal fuels used may vary significantly from country to country. Similarly there could be pronounced differences in sulphur content of the liquid fuels due to different levels of standards and legislation applied. In the following a calculation procedure for SO2 emission factor for coals and heating oils is proposed:
( ) 6,, 10
112
2⋅⋅−⋅⋅=
k
kSkkSOH
CsEF α , (2)
kSOEF ,2 emission factor for SO2 for fuel type k [g/GJ]
kCs average sulphur content of fuel type k (mass S/mass fuel [kg/kg])
kH average lover heating value for fuel type k [MJ/kg]
ks,α average sulphur retention in ash
Average sulphur retention in ash ks,α is not relevant for liquid fuels and for these fuels
should be taken as zero. For the coal fuels the default value of 0.1 should be taken in the absence of national data.
4.5 Activity data
In most cases the statistical information include data on annual fuels consumption in households, services and agriculture. Only in some cases data on fuels used by small consumers are available, which might include all sectors except mobile sources, industry and energy transformation. To fill these data gaps the following sources could be used: • Information from the fuel suppliers and individual companies • Energy conservation/climate change mitigation studies for relevant sectors • Residential, commercial/institutional and agriculture sector surveys • Energy demand modelling The data from various sources should be compared taking into account their inherent uncertainties in order to obtain the best assessment. To improve reliability of the activity data appropriate efforts should be made in order to ensure that the institution responsible for national energy statistics includes evaluation and reporting of the fuel consumption at the adequate level of sectorial disaggregation in their regular activity.
NON-INDUSTRIAL COMBUSTION PLANTS
Activities: Various
Emission Inventory Guidebook December, 2006 B216-23
Also when data on the fuel consumption are provided at an appropriate level of sectorial split, they should be checked for possible anomalies. Wood and other type biomass and in some cases also gas oil consumption in the households requires particular consideration. The self-supply and direct purchase of the wood from farmers might not be taken into account when energy statistics are based mainly on the data obtained from the fuel suppliers. This could lead to a significant underestimation of the wood consumption especially in the countries with abundant wood supplies and greater share of heating with stoves and small solid fuel boilers. In that case the data on wood consumption should be adjusted. Consultation with the forestry experts and/or energy demand modelling is recommended. Wood consumption should be consistent with the related data reported to the UNFCCC. Activity data may also be affected by the improper sectorial attribution of gas oil consumption. Due to the tax difference cheaper gas oil sold to households might be in particular circumstances used instead of diesel oil in vehicles and off–road machinery. In that case not only sectorial distribution of emissions is affected, but also emissions of certain pollutants at the national level could be underestimated due to the difference in emission factors. Evidence of such a situation could be obtained by energy demand modelling of the households and complementary bottom–up modelling of the fuel consumption of the mobile sources. Irregular changes in the time series of the gas and diesel oil quantities sold, not correlated with changes in economic situation could also indicate such phenomena. Inventorying agencies are encouraged to make most appropriate adjustments, however they have to be well documented.
5 DETAILED METHODOLOGY
5.1 General
This detailed methodology is intended for calculating emissions when the contribution of sources 1A1a; 1A4a; 1A4bi; 1A4ci; 1A5a (and small installations in 1A1a) in the national totals is significant or data are available which enable its application. The detailed methodology described in this chapter refers to the calculation of the emissions, based on the split of the small combustion sources not only to different fuel types, but also to different types of installations, which are found in those sectors. Default emission factor given for the detailed methodology, national emission factors or combination of both could be used. The detailed methodology applies the same approach like the simpler methodology by using activity data and emission factors to estimate the emissions. The main difference is that the detailed methodology involves more country specific information like the specific emission factors for main installation types, further subdivision of the main installation types including those with control measures and/or use of the locally specific fuels. Development of the detailed methodology has to be focused to the combinations of the main installation
B216-24 December, 2006 Emission Inventory Guidebook
types/fuels used, which consume most fuels and/or have the greatest share of the emissions from the considered sources.
5.2 Applicability
The detailed methodology envisages a more detailed split of the combustion installations. For that reason the national circumstances are taken more into account, especially if national emission factors are used. The detailed methodology should be used when the considered
sources have significant share of the national totals or significant changes of emissions
are expected. However the application of the detailed methodology is recommended
always when a country has more detailed or more specific, yet reliable enough
information than those needed for the simpler methodology.
5.3 Methodology
The annual emission is determined by an activity data and an emission factor:
∑ ⋅=kj
kjkjii AEFE,
,,, , (1)
where
iE annual emission of pollutant i
kjiEF ,, default emission factor of pollutant i for source type j and fuel k
kjA , annual consumption of fuel k in source type j
The main source types are:
� fire places, � stoves, � small boilers (single household/domestic heating) – indicative capacity <50 kWth, � medium size boilers (<50 MWth),
o manual feeding (indicative capacity <1MWth), o automatic feeding,
All those source types are not relevant for all sectors, as for instance fireplaces and stoves are mainly used in the residential sector. The detailed methodology (equivalent to Tier 3) to estimate emissions of pollutants from combustion plant >50 MWth is based on measurements or estimations using plant specific emission factors - guidance on determining plant specific emission factors is given in the Measurement Protocol Annex. In many countries, operators of combustion plant >50MWth will report emissions to comply with regulatory requirements and this data can be used to help compile the national inventory.
NON-INDUSTRIAL COMBUSTION PLANTS
Activities: Various
Emission Inventory Guidebook December, 2006 B216-25
The recommended detailed methodology to estimate emissions of PM from combustion activities is based on measurements and/or estimations using technology-specific emission factors. Information on the type of the process and activity data, for example combustion and abatement technologies, is required to assign appropriate emission factors.
5.4 Emission factors
The detailed methodology envisages the use of default emission factors (Tables 8.2 a-g) developed for this purpose or their substitution/complementing with national emission factors. The development of national emission factors should be focused on a combination of installation types and fuels, where specific national circumstances exist and/or contribution to the emission is the highest. When deriving specific emission factors the emphasis has to be given in taking into account also start–up emissions. These could, especially in the case of stoves and solid fuel small boilers, significantly influence the emissions of the total combustion cycle. For medium size installations data obtained from environmental inspectorates could be used taking into account whether there are representative or not.
5.5 Activity data
The detailed methodology requires further allocation of the fuel consumed according to the installation types. Those data are generally not available in the regular statistics reports. In most cases the inventorying agency would have to use surrogate data to assess the activity data at the required level of desegregation. National approaches have to be developed depending on the availability and quality of surrogate data. Some examples of surrogate data sources are: • Residential, commercial/institutional and agriculture sector surveys • Energy conservation/climate change mitigation studies for relevant sectors • Energy demand modelling • Information from the fuel suppliers • Information from producers and sellers of heating appliances • Chimney sweeping organisations Particularly in the case of households it should be emphasised, that the surveys have to be based on a representative sample. In some countries the means of heating of the households are regionally very inhomogeneous with significantly greater share of solid fuel stoves and boilers in traditionally coal mining regions and at some rural areas. Additional data could be obtained from the chimneysweeper organisations and from environmental inspectorates particularly for the commercial-institutional sector.
B216-26 December, 2006 Emission Inventory Guidebook
Another important source of data could be dwelling statistics. Within the scope of national census the data on dwellings, occupied by the households are usually collected. Data on individual dwelling might include: • number of residents, • area of the dwelling, • type of building (individual house, attached house, block of flats), • construction year, • existence or not of central heating, • central heating boiler in the flat or common for block of flats • fuels used for heating. Dwelling statistics could be used to extrapolate results of the household survey or to perform detailed energy demand/emission modelling. Especially in the case where household emissions represent an important share in national totals or are of a great relevance due to local air pollution it is recommended to perform such an exercise. Detailed energy demand/emission modelling may be usually performed at local or regional level, however the extension to the national level does not pose significant additional requirements. To justify the additional effort required for energy demand/emission modelling of the households, the emission inventorying agency might find it appropriate to initiate a common project with other stakeholders, as for instance agencies competent for energy conservation, climate change mitigation or energy supply. In the following a brief outline of the energy demand/emission modelling based on a dwelling census is given. The demand for useful energy for space heating could be calculated from the area of the flat and specific heat loses which depend on building code implied by the construction year of the building and ratio of outer building surface to dwellings surface. The latter could be characterised by the type of the building. Required useful energy depends on the climatologically parameters, which are characterised by heating degree-days and the level of the heating, which is higher when the dwelling is equipped with the central heating. The heating energy demand is partly covered by gains of energy due to use of household electrical appliances and heat released directly by the residents. The heat gains could be considered as proportional to the number of residents. The remaining part of the required useful energy is supplied by the heating system. The fuel consumption depends on efficiency of the heating installation, which is characterised by the installation type and fuel used. Where fossil fuels or biomass are used and no central heating exists it could be considered that stoves are used for space heating. The data on the use of fireplaces (i.e. number and average fuel use) has to be obtained from other sources, where relevant. Preparation of the hot water in households has also to be taken into the account, as it is at least partly supplied by the central heating boilers or special small boilers using natural gas. Model parameters as for instance specific heat losses have to be determined at the national level due to differences in building code and practices. In some cases where there are significant climatic differences within the country, which are reflected in the different
NON-INDUSTRIAL COMBUSTION PLANTS
Activities: Various
Emission Inventory Guidebook December, 2006 B216-27
building codes for certain regions, it might be necessary, to derive and apply regionally specific heat loses. In almost all cases the heating degree-days have to be used at higher spatial resolution than country level. Energy demand/emission modelling is the most appropriate to be performed at the level of the individual flat. In principle it could be possible to obtain data from the National Statistical office at such a level of details, however with individual dwellings located at the level of statistical district or within a grid large enough to satisfy the criteria of security of personal and individual data.
The census is usually performed once every 10-years. Thus the method has to be developed to periodically up-date the input data, most preferably on the basis of household surveys extrapolation complemented by the data from the fuel suppliers.
6 RELEVANT ACTIVITY STATISTICS
National or international statistics should be used e.g. fuels use and consumption. The following statistical publications could be recommended:
Statistical Office of the European Communities (EUROSTAT): NEWCRONOS database
Statistical Office of the European Communities (EUROSTAT): Energy Consumption in households – European Union and Norway, 1995 survey - Central and eastern European countries, 1996 survey
Statistical Office of the European Communities (EUROSTAT): Energy Consumption in the service sector – Surveys of EU Member states
7 POINT SOURCE CRITERIA
This section is not relevant since this chapter covers area sources only.
B216-28 December, 2006 Emission Inventory Guidebook
8 EMISSION FACTORS, QUALITY CODES AND REFERENCES
Default emissions factors contained in the following tables are estimated representative values derived from collected data that are quoted later in Annex 1 as well as national experts judgments. For the calculation of default emission factors for a simple methodology for residential sources, NFR: 1A4bi (Table 8.1a) the share of fireplaces, stoves and boilers fuelled by solid coal fuels, biomass and gaseous fuels was assumed as 5%, 65% and 30%, respectively and the emissions factors were taken from the detailed methodology tables. Within solid coal fuels a figure of about 5% was assumed for briquettes. For liquid fuels the share of stoves was assumed as 10% and boilers as 90%. Because the share of biomass and coal advanced stove and boilers was assumed to be currently lower than 5% in most of the countries they haven’t been taken into consideration. For the activities NFR: 1A4a, 1A4ci, 1A5a and 1A1a (table 8.1b) the share of coal, gas and oil boilers with capacity between 50kW and 1MW and from 1MW to 50MW was assumed as 50% and 50% respectively. For coal fuels boilers the share of briquettes was assumed to be 5% similar to activity NFR 1A4bi. However the share of wood boilers with capacity between 50kW and 1MW and above 1MW to 50MW was assumed to be 60% and 40% respectively. Automatic fuelled solid and biomass installations, as stokers and other automatic feed boilers, especially those larger than 1 MW, are usually equipped with some particulate matter control equipment. In this case mainly settling chambers and cyclones to reduce primary coarse particles and related pollutants. They are characterised by low collection efficiency, i.e., about 35% and 85% of dust, respectively. This collection efficiency refers to the 90% of PM below 75 µm. The default emission factors for the detailed methodology (Tables 8.2d, 8.2e and 8.2f) make allowance for using of this type of dedusting systems. In the modern installations also advanced dedusting equipment are employed.
8.1 Default Emission Factors For Use With Simpler Methodology
A summary of default emission factors for uses the simpler methodology for estimating emissions is provided in the following Tables.
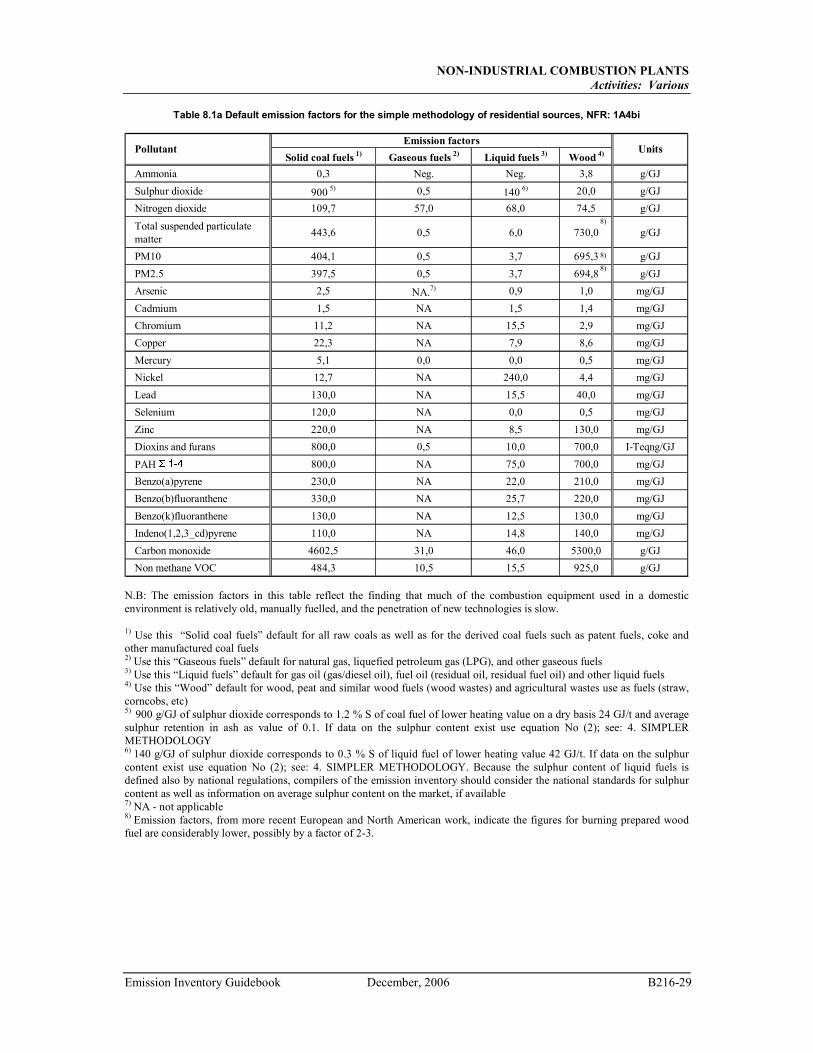
NON-INDUSTRIAL COMBUSTION PLANTS
Activities: Various
Emission Inventory Guidebook December, 2006 B216-29
Solid coal fuels 1)
Gaseous fuels 2)
Liquid fuels 3)
Wood 4)
Ammonia 0,3 Neg. Neg. 3,8 g/GJ
Sulphur dioxide 900 5) 0,5 140 6) 20,0 g/GJ
Nitrogen dioxide 109,7 57,0 68,0 74,5 g/GJ
Total suspended particulate matter
443,6 0,5 6,0 730,0 g/GJ
PM10 404,1 0,5 3,7 695,3 g/GJ
PM2.5 397,5 0,5 3,7 694,8 g/GJ
Arsenic 2,5 NA.7) 0,9 1,0 mg/GJ
Cadmium 1,5 NA 1,5 1,4 mg/GJ
Chromium 11,2 NA 15,5 2,9 mg/GJ
Copper 22,3 NA 7,9 8,6 mg/GJ
Mercury 5,1 0,0 0,0 0,5 mg/GJ
Nickel 12,7 NA 240,0 4,4 mg/GJ
Lead 130,0 NA 15,5 40,0 mg/GJ
Selenium 120,0 NA 0,0 0,5 mg/GJ
Zinc 220,0 NA 8,5 130,0 mg/GJ
Dioxins and furans 800,0 0,5 10,0 700,0 I-Teqng/GJ
PAH � � � �
800,0 NA 75,0 700,0 mg/GJ
Benzo(a)pyrene 230,0 NA 22,0 210,0 mg/GJ
Benzo(b)fluoranthene 330,0 NA 25,7 220,0 mg/GJ
Benzo(k)fluoranthene 130,0 NA 12,5 130,0 mg/GJ
Indeno(1,2,3_cd)pyrene 110,0 NA 14,8 140,0 mg/GJ
Carbon monoxide 4602,5 31,0 46,0 5300,0 g/GJ
Non methane VOC 484,3 10,5 15,5 925,0 g/GJ
Table 8.1a Default emission factors for the simple methodology of residential sources, NFR: 1A4bi
PollutantEmission factors
Units
N.B: The emission factors in this table reflect the finding that much of the combustion equipment used in a domestic environment is relatively old, manually fuelled, and the penetration of new technologies is slow.
1) Use this “Solid coal fuels” default for all raw coals as well as for the derived coal fuels such as patent fuels, coke and other manufactured coal fuels 2) Use this “Gaseous fuels” default for natural gas, liquefied petroleum gas (LPG), and other gaseous fuels 3) Use this “Liquid fuels” default for gas oil (gas/diesel oil), fuel oil (residual oil, residual fuel oil) and other liquid fuels 4) Use this “Wood” default for wood, peat and similar wood fuels (wood wastes) and agricultural wastes use as fuels (straw, corncobs, etc) 5) 900 g/GJ of sulphur dioxide corresponds to 1.2 % S of coal fuel of lower heating value on a dry basis 24 GJ/t and average sulphur retention in ash as value of 0.1. If data on the sulphur content exist use equation No (2); see: 4. SIMPLER METHODOLOGY 6) 140 g/GJ of sulphur dioxide corresponds to 0.3 % S of liquid fuel of lower heating value 42 GJ/t. If data on the sulphur content exist use equation No (2); see: 4. SIMPLER METHODOLOGY. Because the sulphur content of liquid fuels is defined also by national regulations, compilers of the emission inventory should consider the national standards for sulphur content as well as information on average sulphur content on the market, if available 7) NA - not applicable 8) Emission factors, from more recent European and North American work, indicate the figures for burning prepared wood fuel are considerably lower, possibly by a factor of 2-3.
8)
8)
8)
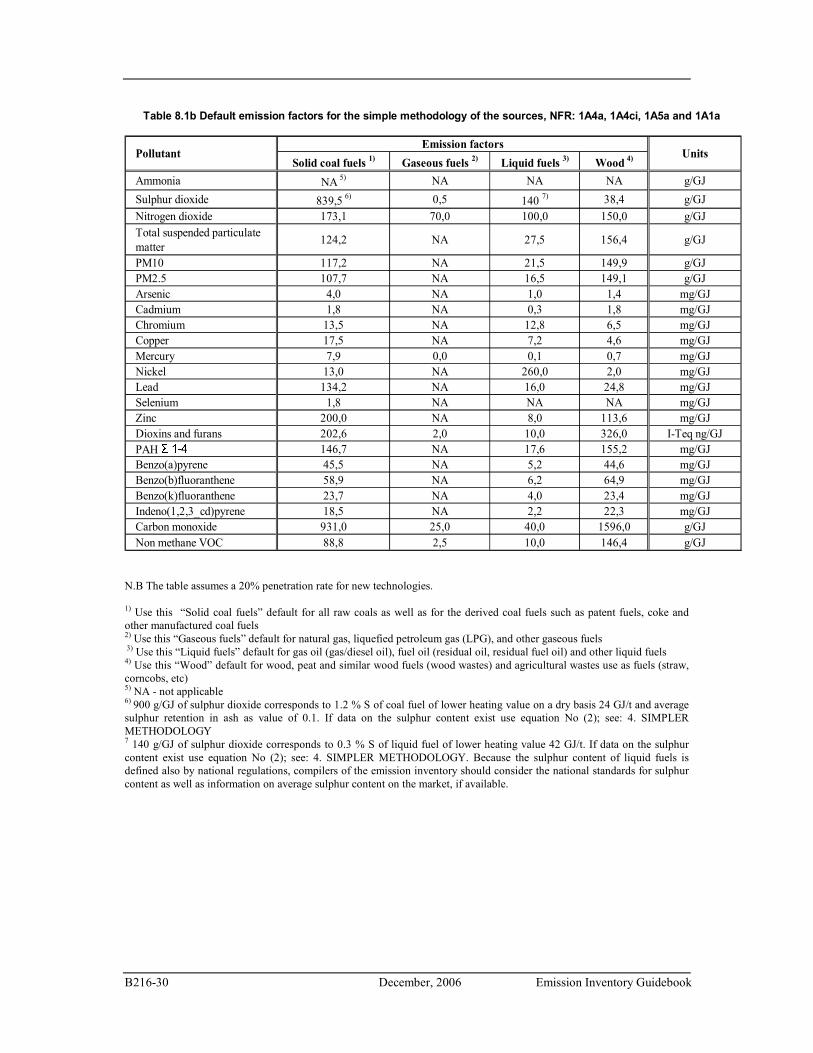
B216-30 December, 2006 Emission Inventory Guidebook
Solid coal fuels 1)
Gaseous fuels 2)
Liquid fuels 3)
Wood 4)
Ammonia NA 5) NA NA NA g/GJ
Sulphur dioxide 839,5 6) 0,5 140 7) 38,4 g/GJ
Nitrogen dioxide 173,1 70,0 100,0 150,0 g/GJ
Total suspended particulate matter
124,2 NA 27,5 156,4 g/GJ
PM10 117,2 NA 21,5 149,9 g/GJPM2.5 107,7 NA 16,5 149,1 g/GJArsenic 4,0 NA 1,0 1,4 mg/GJCadmium 1,8 NA 0,3 1,8 mg/GJChromium 13,5 NA 12,8 6,5 mg/GJCopper 17,5 NA 7,2 4,6 mg/GJMercury 7,9 0,0 0,1 0,7 mg/GJNickel 13,0 NA 260,0 2,0 mg/GJLead 134,2 NA 16,0 24,8 mg/GJSelenium 1,8 NA NA NA mg/GJZinc 200,0 NA 8,0 113,6 mg/GJDioxins and furans 202,6 2,0 10,0 326,0 I-Teq ng/GJPAH � � � � 146,7 NA 17,6 155,2 mg/GJBenzo(a)pyrene 45,5 NA 5,2 44,6 mg/GJBenzo(b)fluoranthene 58,9 NA 6,2 64,9 mg/GJBenzo(k)fluoranthene 23,7 NA 4,0 23,4 mg/GJIndeno(1,2,3_cd)pyrene 18,5 NA 2,2 22,3 mg/GJCarbon monoxide 931,0 25,0 40,0 1596,0 g/GJNon methane VOC 88,8 2,5 10,0 146,4 g/GJ
Table 8.1b Default emission factors for the simple methodology of the sources, NFR: 1A4a, 1A4ci, 1A5a and 1A1a
PollutantEmission factors
Units
N.B The table assumes a 20% penetration rate for new technologies.
1) Use this “Solid coal fuels” default for all raw coals as well as for the derived coal fuels such as patent fuels, coke and other manufactured coal fuels 2) Use this “Gaseous fuels” default for natural gas, liquefied petroleum gas (LPG), and other gaseous fuels 3) Use this “Liquid fuels” default for gas oil (gas/diesel oil), fuel oil (residual oil, residual fuel oil) and other liquid fuels
4) Use this “Wood” default for wood, peat and similar wood fuels (wood wastes) and agricultural wastes use as fuels (straw, corncobs, etc) 5) NA - not applicable 6) 900 g/GJ of sulphur dioxide corresponds to 1.2 % S of coal fuel of lower heating value on a dry basis 24 GJ/t and average sulphur retention in ash as value of 0.1. If data on the sulphur content exist use equation No (2); see: 4. SIMPLER METHODOLOGY 7 140 g/GJ of sulphur dioxide corresponds to 0.3 % S of liquid fuel of lower heating value 42 GJ/t. If data on the sulphur content exist use equation No (2); see: 4. SIMPLER METHODOLOGY. Because the sulphur content of liquid fuels is defined also by national regulations, compilers of the emission inventory should consider the national standards for sulphur content as well as information on average sulphur content on the market, if available.
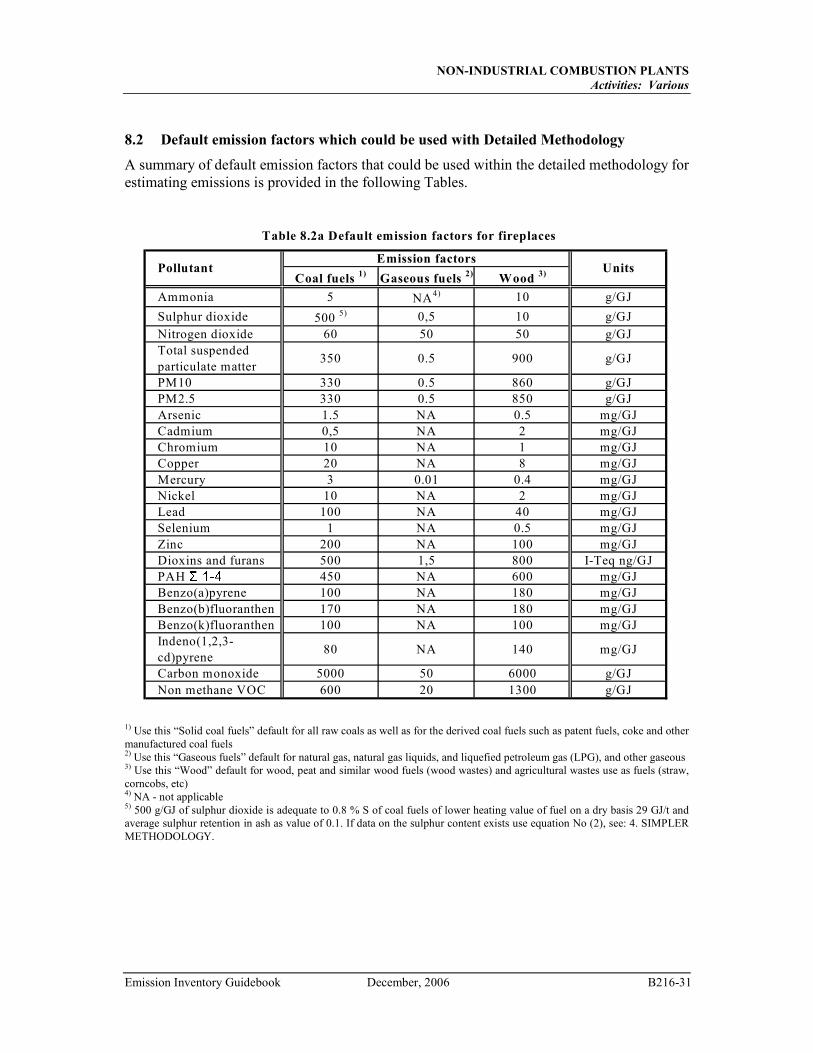
NON-INDUSTRIAL COMBUSTION PLANTS
Activities: Various
Emission Inventory Guidebook December, 2006 B216-31
8.2 Default emission factors which could be used with Detailed Methodology
A summary of default emission factors that could be used within the detailed methodology for estimating emissions is provided in the following Tables.
Coal fuels 1)
Gaseous fuels 2)
Wood 3)
Ammonia 5 NA4) 10 g/GJ
Sulphur dioxide 500 5) 0,5 10 g/GJ
Nitrogen dioxide 60 50 50 g/GJTotal suspended particulate matter
350 0.5 900 g/GJ
PM10 330 0.5 860 g/GJPM2.5 330 0.5 850 g/GJArsenic 1.5 NA 0.5 mg/GJCadmium 0,5 NA 2 mg/GJChromium 10 NA 1 mg/GJCopper 20 NA 8 mg/GJMercury 3 0.01 0.4 mg/GJNickel 10 NA 2 mg/GJLead 100 NA 40 mg/GJSelenium 1 NA 0.5 mg/GJZinc 200 NA 100 mg/GJDioxins and furans 500 1,5 800 I-Teq ng/GJPAH � � � � 450 NA 600 mg/GJBenzo(a)pyrene 100 NA 180 mg/GJBenzo(b)fluoranthen 170 NA 180 mg/GJBenzo(k)fluoranthen 100 NA 100 mg/GJIndeno(1,2,3-cd)pyrene
80 NA 140 mg/GJ
Carbon monoxide 5000 50 6000 g/GJNon methane VOC 600 20 1300 g/GJ
PollutantEmission factors
Units
Table 8.2a Default emission factors for fireplaces
1) Use this “Solid coal fuels” default for all raw coals as well as for the derived coal fuels such as patent fuels, coke and other manufactured coal fuels 2) Use this “Gaseous fuels” default for natural gas, natural gas liquids, and liquefied petroleum gas (LPG), and other gaseous 3) Use this “Wood” default for wood, peat and similar wood fuels (wood wastes) and agricultural wastes use as fuels (straw, corncobs, etc) 4) NA - not applicable 5) 500 g/GJ of sulphur dioxide is adequate to 0.8 % S of coal fuels of lower heating value of fuel on a dry basis 29 GJ/t and average sulphur retention in ash as value of 0.1. If data on the sulphur content exists use equation No (2), see: 4. SIMPLER METHODOLOGY.
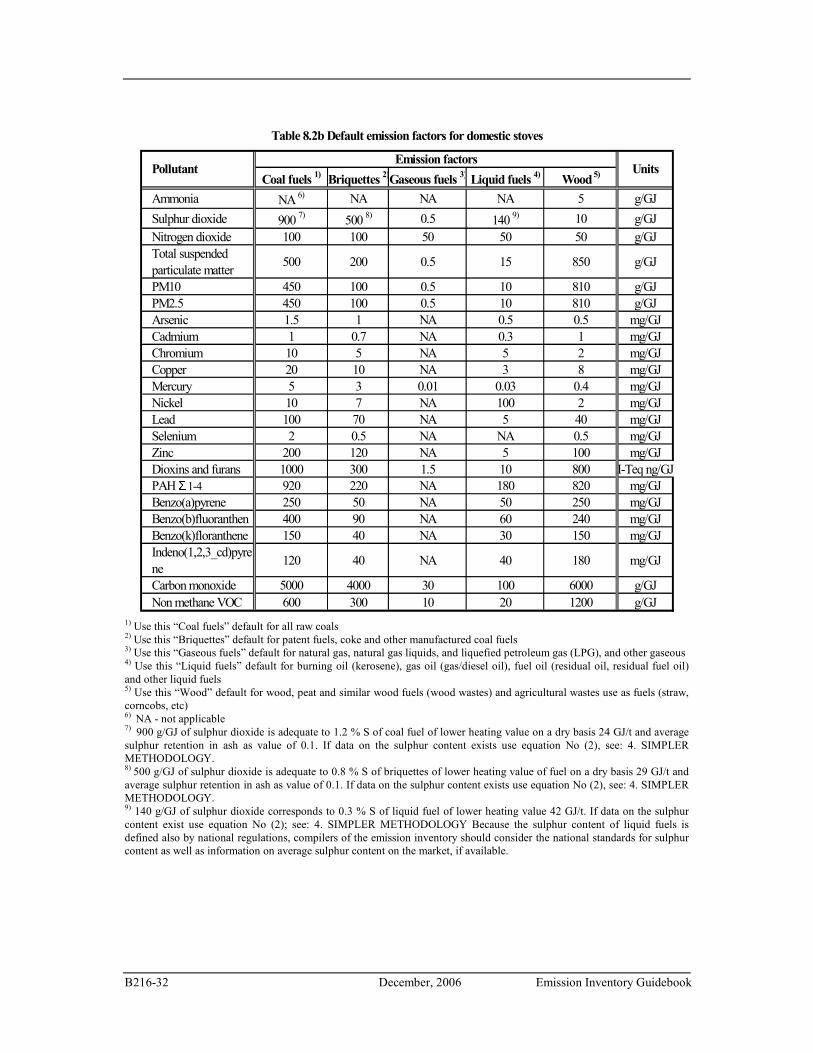
B216-32 December, 2006 Emission Inventory Guidebook
Coal fuels 1)
Briquettes 2)Gaseous fuels
3)Liquid fuels
4)Wood
5)
Ammonia NA 6) NA NA NA 5 g/GJ
Sulphur dioxide 900 7) 500 8) 0.5 140 9) 10 g/GJ
Nitrogen dioxide 100 100 50 50 50 g/GJTotal suspended particulate matter
500 200 0.5 15 850 g/GJ
PM10 450 100 0.5 10 810 g/GJPM2.5 450 100 0.5 10 810 g/GJArsenic 1.5 1 NA 0.5 0.5 mg/GJCadmium 1 0.7 NA 0.3 1 mg/GJChromium 10 5 NA 5 2 mg/GJCopper 20 10 NA 3 8 mg/GJMercury 5 3 0.01 0.03 0.4 mg/GJNickel 10 7 NA 100 2 mg/GJLead 100 70 NA 5 40 mg/GJSelenium 2 0.5 NA NA 0.5 mg/GJZinc 200 120 NA 5 100 mg/GJDioxins and furans 1000 300 1.5 10 800 I-Teq ng/GJPAH � 1-4 920 220 NA 180 820 mg/GJBenzo(a)pyrene 250 50 NA 50 250 mg/GJBenzo(b)fluoranthen 400 90 NA 60 240 mg/GJBenzo(k)floranthene 150 40 NA 30 150 mg/GJIndeno(1,2,3_cd)pyrene
120 40 NA 40 180 mg/GJ
Carbon monoxide 5000 4000 30 100 6000 g/GJNon methane VOC 600 300 10 20 1200 g/GJ
Table 8.2b Default emission factors for domestic stoves
PollutantEmission factors
Units
1) Use this “Coal fuels” default for all raw coals 2) Use this “Briquettes” default for patent fuels, coke and other manufactured coal fuels 3) Use this “Gaseous fuels” default for natural gas, natural gas liquids, and liquefied petroleum gas (LPG), and other gaseous 4) Use this “Liquid fuels” default for burning oil (kerosene), gas oil (gas/diesel oil), fuel oil (residual oil, residual fuel oil) and other liquid fuels 5) Use this “Wood” default for wood, peat and similar wood fuels (wood wastes) and agricultural wastes use as fuels (straw, corncobs, etc) 6) NA - not applicable 7) 900 g/GJ of sulphur dioxide is adequate to 1.2 % S of coal fuel of lower heating value on a dry basis 24 GJ/t and average sulphur retention in ash as value of 0.1. If data on the sulphur content exists use equation No (2), see: 4. SIMPLER METHODOLOGY. 8) 500 g/GJ of sulphur dioxide is adequate to 0.8 % S of briquettes of lower heating value of fuel on a dry basis 29 GJ/t and average sulphur retention in ash as value of 0.1. If data on the sulphur content exists use equation No (2), see: 4. SIMPLER METHODOLOGY. 9) 140 g/GJ of sulphur dioxide corresponds to 0.3 % S of liquid fuel of lower heating value 42 GJ/t. If data on the sulphur content exist use equation No (2); see: 4. SIMPLER METHODOLOGY Because the sulphur content of liquid fuels is defined also by national regulations, compilers of the emission inventory should consider the national standards for sulphur content as well as information on average sulphur content on the market, if available.
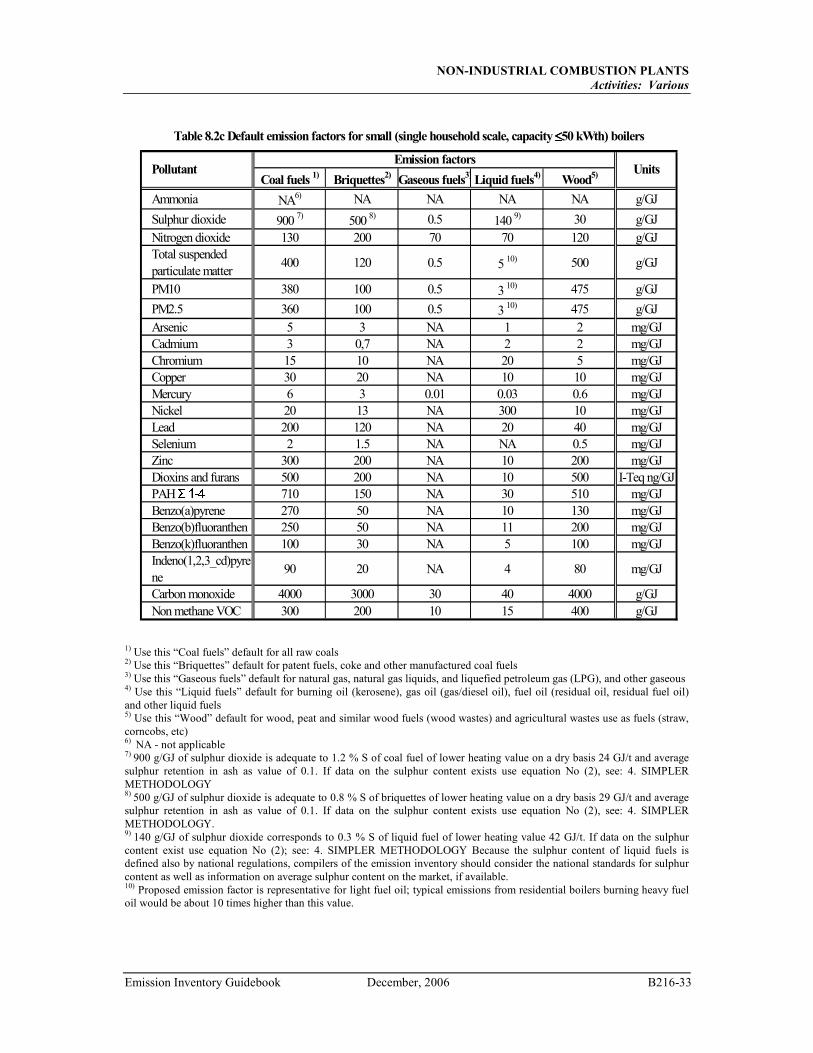
NON-INDUSTRIAL COMBUSTION PLANTS
Activities: Various
Emission Inventory Guidebook December, 2006 B216-33
Coal fuels 1)
Briquettes2)
Gaseous fuels3)Liquid fuels
4)Wood
5)
Ammonia NA6) NA NA NA NA g/GJ
Sulphur dioxide 900 7) 500 8) 0.5 140 9) 30 g/GJ
Nitrogen dioxide 130 200 70 70 120 g/GJTotal suspended particulate matter
400 120 0.5 5 10) 500 g/GJ
PM10 380 100 0.5 3 10) 475 g/GJ
PM2.5 360 100 0.5 3 10) 475 g/GJ
Arsenic 5 3 NA 1 2 mg/GJCadmium 3 0,7 NA 2 2 mg/GJChromium 15 10 NA 20 5 mg/GJCopper 30 20 NA 10 10 mg/GJMercury 6 3 0.01 0.03 0.6 mg/GJNickel 20 13 NA 300 10 mg/GJLead 200 120 NA 20 40 mg/GJSelenium 2 1.5 NA NA 0.5 mg/GJZinc 300 200 NA 10 200 mg/GJDioxins and furans 500 200 NA 10 500 I-Teq ng/GJPAH � � � � 710 150 NA 30 510 mg/GJBenzo(a)pyrene 270 50 NA 10 130 mg/GJBenzo(b)fluoranthen 250 50 NA 11 200 mg/GJBenzo(k)fluoranthen 100 30 NA 5 100 mg/GJIndeno(1,2,3_cd)pyrene
90 20 NA 4 80 mg/GJ
Carbon monoxide 4000 3000 30 40 4000 g/GJNon methane VOC 300 200 10 15 400 g/GJ
Emission factorsUnits
Table 8.2c Default emission factors for small (single household scale, capacity ≤≤≤≤50 kWth) boilers
Pollutant
1) Use this “Coal fuels” default for all raw coals 2) Use this “Briquettes” default for patent fuels, coke and other manufactured coal fuels 3) Use this “Gaseous fuels” default for natural gas, natural gas liquids, and liquefied petroleum gas (LPG), and other gaseous 4) Use this “Liquid fuels” default for burning oil (kerosene), gas oil (gas/diesel oil), fuel oil (residual oil, residual fuel oil) and other liquid fuels 5) Use this “Wood” default for wood, peat and similar wood fuels (wood wastes) and agricultural wastes use as fuels (straw, corncobs, etc) 6) NA - not applicable 7) 900 g/GJ of sulphur dioxide is adequate to 1.2 % S of coal fuel of lower heating value on a dry basis 24 GJ/t and average sulphur retention in ash as value of 0.1. If data on the sulphur content exists use equation No (2), see: 4. SIMPLER METHODOLOGY 8) 500 g/GJ of sulphur dioxide is adequate to 0.8 % S of briquettes of lower heating value on a dry basis 29 GJ/t and average sulphur retention in ash as value of 0.1. If data on the sulphur content exists use equation No (2), see: 4. SIMPLER METHODOLOGY. 9) 140 g/GJ of sulphur dioxide corresponds to 0.3 % S of liquid fuel of lower heating value 42 GJ/t. If data on the sulphur content exist use equation No (2); see: 4. SIMPLER METHODOLOGY Because the sulphur content of liquid fuels is defined also by national regulations, compilers of the emission inventory should consider the national standards for sulphur content as well as information on average sulphur content on the market, if available. 10) Proposed emission factor is representative for light fuel oil; typical emissions from residential boilers burning heavy fuel oil would be about 10 times higher than this value.
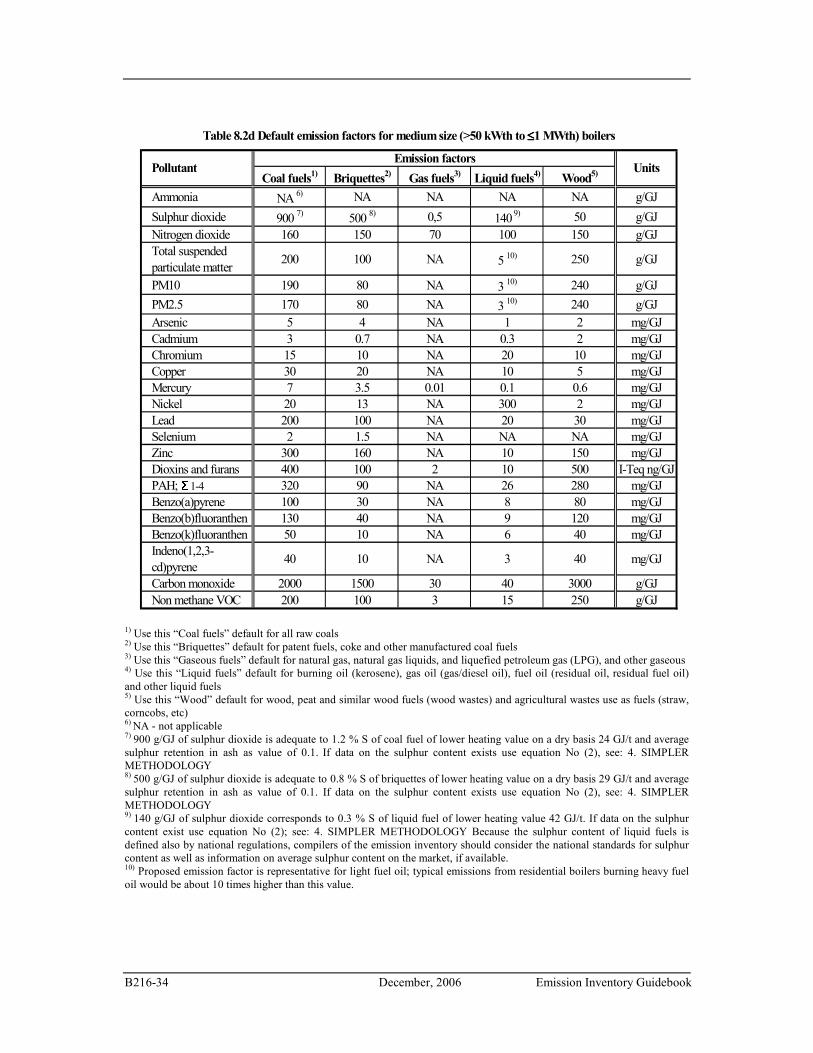
B216-34 December, 2006 Emission Inventory Guidebook
Coal fuels1)
Briquettes2)
Gas fuels3)
Liquid fuels4)
Wood5)
Ammonia NA 6) NA NA NA NA g/GJ
Sulphur dioxide 900 7) 500 8) 0,5 140 9) 50 g/GJ
Nitrogen dioxide 160 150 70 100 150 g/GJTotal suspended particulate matter
200 100 NA 5 10) 250 g/GJ
PM10 190 80 NA 3 10) 240 g/GJ
PM2.5 170 80 NA 3 10) 240 g/GJ
Arsenic 5 4 NA 1 2 mg/GJCadmium 3 0.7 NA 0.3 2 mg/GJChromium 15 10 NA 20 10 mg/GJCopper 30 20 NA 10 5 mg/GJMercury 7 3.5 0.01 0.1 0.6 mg/GJNickel 20 13 NA 300 2 mg/GJLead 200 100 NA 20 30 mg/GJSelenium 2 1.5 NA NA NA mg/GJZinc 300 160 NA 10 150 mg/GJDioxins and furans 400 100 2 10 500 I-Teq ng/GJPAH; � 1-4 320 90 NA 26 280 mg/GJBenzo(a)pyrene 100 30 NA 8 80 mg/GJBenzo(b)fluoranthen 130 40 NA 9 120 mg/GJBenzo(k)fluoranthen 50 10 NA 6 40 mg/GJIndeno(1,2,3-cd)pyrene
40 10 NA 3 40 mg/GJ
Carbon monoxide 2000 1500 30 40 3000 g/GJNon methane VOC 200 100 3 15 250 g/GJ
Emission factorsUnits
Table 8.2d Default emission factors for medium size (>50 kWth to ≤≤≤≤1 MWth) boilers
Pollutant
1) Use this “Coal fuels” default for all raw coals 2) Use this “Briquettes” default for patent fuels, coke and other manufactured coal fuels 3) Use this “Gaseous fuels” default for natural gas, natural gas liquids, and liquefied petroleum gas (LPG), and other gaseous 4) Use this “Liquid fuels” default for burning oil (kerosene), gas oil (gas/diesel oil), fuel oil (residual oil, residual fuel oil) and other liquid fuels 5) Use this “Wood” default for wood, peat and similar wood fuels (wood wastes) and agricultural wastes use as fuels (straw, corncobs, etc) 6) NA - not applicable 7) 900 g/GJ of sulphur dioxide is adequate to 1.2 % S of coal fuel of lower heating value on a dry basis 24 GJ/t and average sulphur retention in ash as value of 0.1. If data on the sulphur content exists use equation No (2), see: 4. SIMPLER METHODOLOGY 8) 500 g/GJ of sulphur dioxide is adequate to 0.8 % S of briquettes of lower heating value on a dry basis 29 GJ/t and average sulphur retention in ash as value of 0.1. If data on the sulphur content exists use equation No (2), see: 4. SIMPLER METHODOLOGY 9) 140 g/GJ of sulphur dioxide corresponds to 0.3 % S of liquid fuel of lower heating value 42 GJ/t. If data on the sulphur content exist use equation No (2); see: 4. SIMPLER METHODOLOGY Because the sulphur content of liquid fuels is defined also by national regulations, compilers of the emission inventory should consider the national standards for sulphur content as well as information on average sulphur content on the market, if available. 10) Proposed emission factor is representative for light fuel oil; typical emissions from residential boilers burning heavy fuel oil would be about 10 times higher than this value.

NON-INDUSTRIAL COMBUSTION PLANTS
Activities: Various
Emission Inventory Guidebook December, 2006 B216-35
Coal fuels1)
Gaseous fuels2)
Liquid fuels3)
Wood fuels4)
Ammonia NA5) NA NA NA g/GJ
Sulphur dioxide 900 6) 0.5 140 7) 30 g/GJ
Nitrogen dioxide 180 70 100 150 g/GJTotal suspended particulate matter
80 NA 50 8) 70 g/GJ
PM10 76 NA 40 8) 67 g/GJ
PM2.5 72 NA 30 8) 65 g/GJ
Arsenic 4 NA 1 1 mg/GJCadmium 1 NA 0,3 2 mg/GJChromium 15 NA 2 3 mg/GJCopper 10 NA 3 5 mg/GJMercury 9 0.01 0.1 0.8 mg/GJNickel 10 NA 200 2 mg/GJLead 100 NA 10 20 mg/GJSelenium 2 NA NA NA mg/GJZinc 150 NA 5 80 mg/GJDioxins and furans 100 2 10 200 I-Teq ng/GJPAH � � � � 45 NA 5 40 mg/GJBenzo(a)pyrene 13 NA 1 12 mg/GJBenzo(b)fluoranthen 17 NA 2 14 mg/GJBenzo(k)fluoranthen 9 NA 1 8 mg/GJIndeno(1,2,3-cd)pyrene
6 NA 1 6 mg/GJ
Carbon monoxide 200 20 40 300 g/GJNon methane VOC 20 2 5 60 g/GJ
Emission factorsUnits
Table 8.2e Default emission factors for medium size (>1 MWth to ≤≤≤≤50 MWth) boilers
Pollutant
1) Use this “Coal fuels” default for all raw coals 2) Use this “Gaseous fuels” default for natural gas, natural gas liquids, and liquefied petroleum gas (LPG), and other gaseous 3) Use this “Liquid fuels” default for burning oil (kerosene), gas oil (gas/diesel oil), fuel oil (residual oil, residual fuel oil) and other liquid fuels 4) Use this “Wood” default for wood, peat and similar wood fuels (wood wastes) and agricultural wastes use as fuels (straw, corncobs, etc) 5) NA - not applicable 6) 900 g/GJ of sulphur dioxide is adequate to 1.2 % S of coal fuel of lower heating value on dry basis 24 GJ/t and average sulphur retention in ash as value of 0.1. If data on the sulphur content exists use equation No (2), see: 4. SIMPLER METHODOLOGY. 7) 140 g/GJ of sulphur dioxide corresponds to 0.3 % S of liquid fuel of lower heating value 42 GJ/t. If data on the sulphur content exist use equation No (2); see: 4. SIMPLER METHODOLOGY Because the sulphur content of liquid fuels is defined also by national regulations, compilers of the emission inventory should consider the national standards for sulphur content as well as information on average sulphur content on the market, if available. 8) Proposed emission factor is more representative for heavy fuel oil; typical emissions from boilers burning light fuel oil would be about 10% of this value, see table 8.2c.
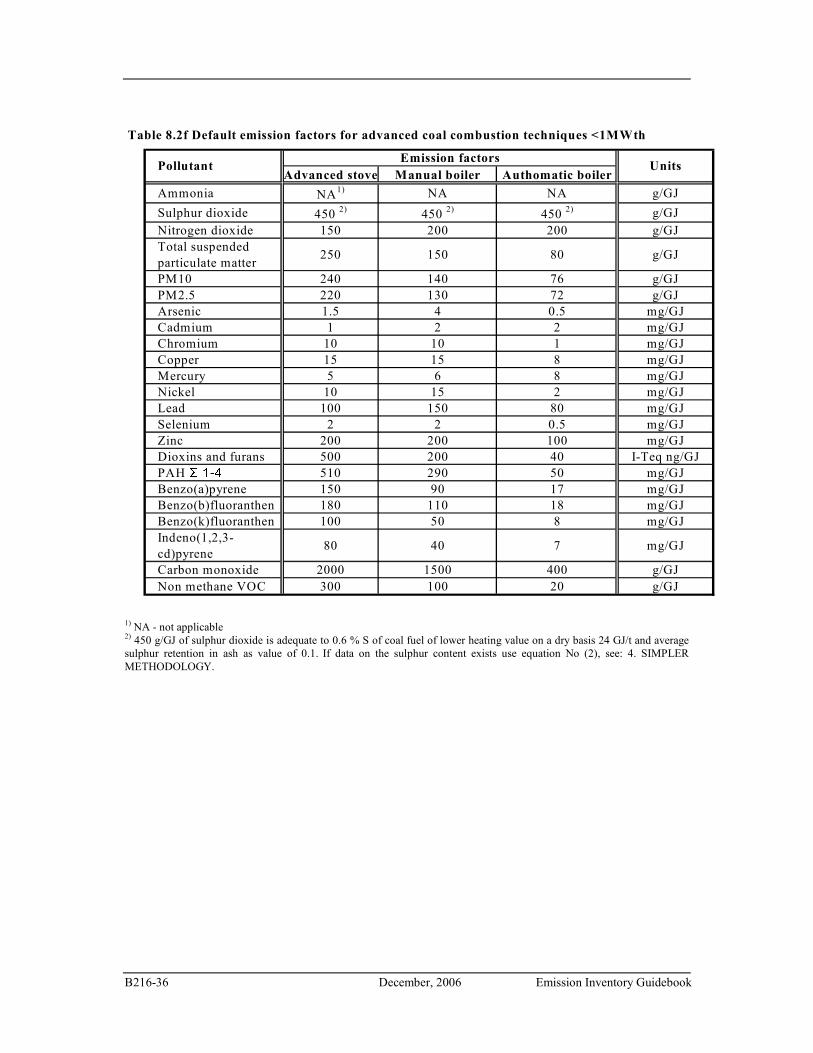
B216-36 December, 2006 Emission Inventory Guidebook
Advanced stove Manual boiler Authomatic boiler
Ammonia NA1) NA NA g/GJ
Sulphur dioxide 450 2) 450 2) 450 2) g/GJ
Nitrogen dioxide 150 200 200 g/GJTotal suspended particulate matter
250 150 80 g/GJ
PM10 240 140 76 g/GJPM2.5 220 130 72 g/GJArsenic 1.5 4 0.5 mg/GJCadmium 1 2 2 mg/GJChromium 10 10 1 mg/GJCopper 15 15 8 mg/GJMercury 5 6 8 mg/GJNickel 10 15 2 mg/GJLead 100 150 80 mg/GJSelenium 2 2 0.5 mg/GJZinc 200 200 100 mg/GJDioxins and furans 500 200 40 I-Teq ng/GJPAH � � � � 510 290 50 mg/GJBenzo(a)pyrene 150 90 17 mg/GJBenzo(b)fluoranthen 180 110 18 mg/GJBenzo(k)fluoranthen 100 50 8 mg/GJIndeno(1,2,3-cd)pyrene
80 40 7 mg/GJ
Carbon monoxide 2000 1500 400 g/GJNon methane VOC 300 100 20 g/GJ
PollutantEmission factors
Units
Table 8.2f Default emission factors for advanced coal combustion techniques <1MWth
1) NA - not applicable 2) 450 g/GJ of sulphur dioxide is adequate to 0.6 % S of coal fuel of lower heating value on a dry basis 24 GJ/t and average sulphur retention in ash as value of 0.1. If data on the sulphur content exists use equation No (2), see: 4. SIMPLER METHODOLOGY.

NON-INDUSTRIAL COMBUSTION PLANTS
Activities: Various
Emission Inventory Guidebook December, 2006 B216-37
Advanced fireplaces Advanced stove Pellet stove Manual boiler Authomatic boiler
Ammonia NA1) NA1) NA NA NA g/GJ
Sulphur dioxide 20 20 20 20 20 g/GJNitrogen dioxide 90 90 90 150 150 g/GJTotal suspended particulate matter
250 250 80 80 70 g/GJ
PM10 240 240 76 76 66 g/GJPM2.5 240 240 76 76 66 g/GJArsenic 0.5 0.5 0.5 1 0.5 mg/GJCadmium 1.0 1.0 0.5 0.3 0.5 mg/GJChromium 8 8 3 2 4 mg/GJCopper 2 2 1 3 2 mg/GJMercury 0.4 0.4 0.4 0.5 0.6 mg/GJNickel 2 2 2 200 2 mg/GJLead 30 30 20 10 20 mg/GJSelenium 0.5 0.5 NA NA NA mg/GJZinc 80 80 80 5 80 mg/GJDioxins and furans 300 300 50 300 30 I-Teq ng/GJPAH � � � � 290 290 50 150 40 mg/GJBenzo(a)pyrene 100 100 15 50 12 mg/GJBenzo(b)fluoranthen 90 90 16 60 14 mg/GJBenzo(k)fluoranthen 40 40 10 20 8 mg/GJIndeno(1,2,3-cd)pyrene
60 60 9 20 6 mg/GJ
Carbon monoxide 4500 3000 500 3000 300 g/GJNon methane VOC 450 250 20 250 20 g/GJ
Emission factorsUnits
Table 8.2g Default emission factors for advanced wood combustion techniques <1MW
Pollutant
1) NA - not applicable
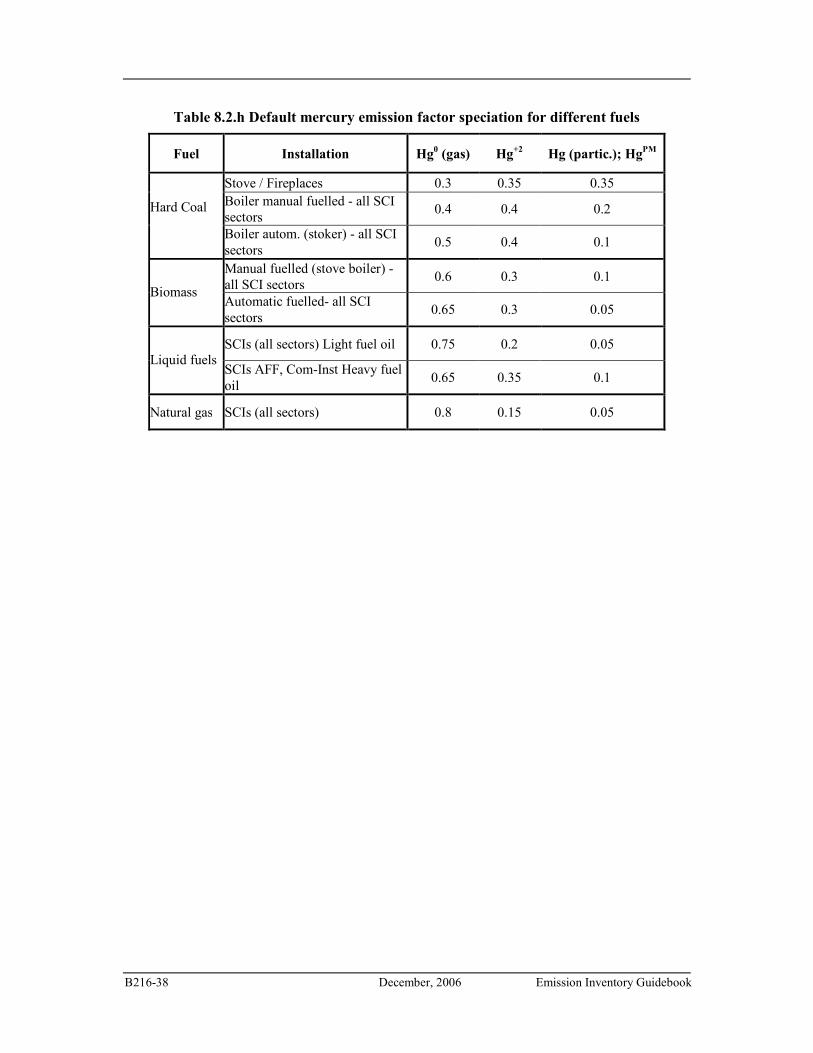
B216-38 December, 2006 Emission Inventory Guidebook
Table 8.2.h Default mercury emission factor speciation for different fuels
Fuel Installation Hg0 (gas) Hg
+2 Hg (partic.); Hg
PM
Stove / Fireplaces 0.3 0.35 0.35 Boiler manual fuelled - all SCI sectors
0.4 0.4 0.2 Hard Coal
Boiler autom. (stoker) - all SCI sectors
0.5 0.4 0.1
Manual fuelled (stove boiler) - all SCI sectors
0.6 0.3 0.1 Biomass
Automatic fuelled- all SCI sectors
0.65 0.3 0.05
SCIs (all sectors) Light fuel oil 0.75 0.2 0.05 Liquid fuels
SCIs AFF, Com-Inst Heavy fuel oil
0.65 0.35 0.1
Natural gas SCIs (all sectors) 0.8 0.15 0.05
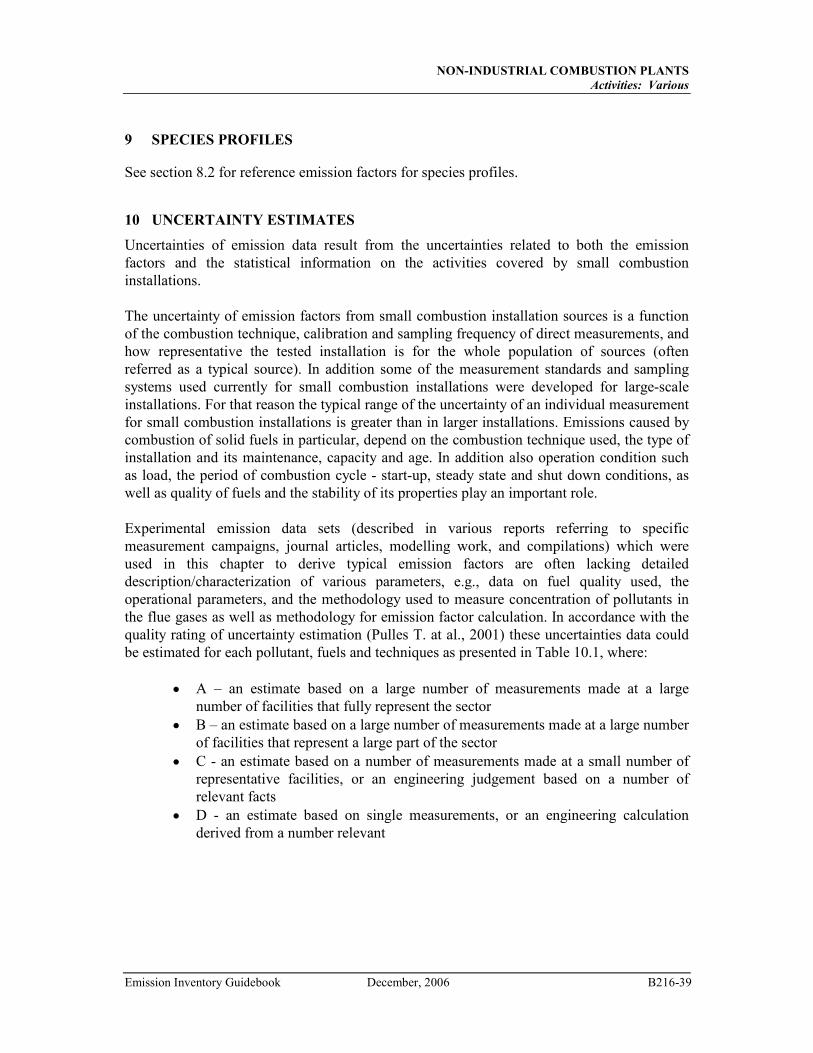
NON-INDUSTRIAL COMBUSTION PLANTS
Activities: Various
Emission Inventory Guidebook December, 2006 B216-39
9 SPECIES PROFILES
See section 8.2 for reference emission factors for species profiles.
10 UNCERTAINTY ESTIMATES
Uncertainties of emission data result from the uncertainties related to both the emission factors and the statistical information on the activities covered by small combustion installations. The uncertainty of emission factors from small combustion installation sources is a function of the combustion technique, calibration and sampling frequency of direct measurements, and how representative the tested installation is for the whole population of sources (often referred as a typical source). In addition some of the measurement standards and sampling systems used currently for small combustion installations were developed for large-scale installations. For that reason the typical range of the uncertainty of an individual measurement for small combustion installations is greater than in larger installations. Emissions caused by combustion of solid fuels in particular, depend on the combustion technique used, the type of installation and its maintenance, capacity and age. In addition also operation condition such as load, the period of combustion cycle - start-up, steady state and shut down conditions, as well as quality of fuels and the stability of its properties play an important role. Experimental emission data sets (described in various reports referring to specific measurement campaigns, journal articles, modelling work, and compilations) which were used in this chapter to derive typical emission factors are often lacking detailed description/characterization of various parameters, e.g., data on fuel quality used, the operational parameters, and the methodology used to measure concentration of pollutants in the flue gases as well as methodology for emission factor calculation. In accordance with the quality rating of uncertainty estimation (Pulles T. at al., 2001) these uncertainties data could be estimated for each pollutant, fuels and techniques as presented in Table 10.1, where:
• A – an estimate based on a large number of measurements made at a large number of facilities that fully represent the sector
• B – an estimate based on a large number of measurements made at a large number of facilities that represent a large part of the sector
• C - an estimate based on a number of measurements made at a small number of representative facilities, or an engineering judgement based on a number of relevant facts
• D - an estimate based on single measurements, or an engineering calculation derived from a number relevant
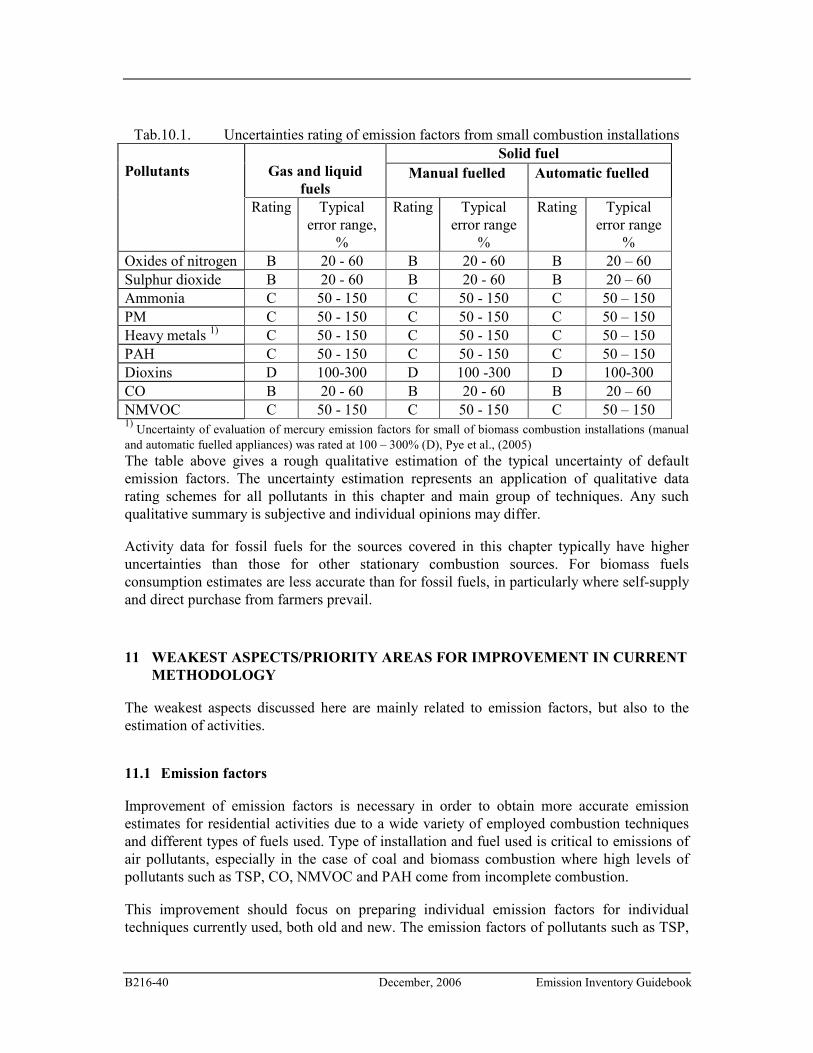
B216-40 December, 2006 Emission Inventory Guidebook
Tab.10.1. Uncertainties rating of emission factors from small combustion installations
Solid fuel
Gas and liquid
fuels Manual fuelled Automatic fuelled
Pollutants
Rating Typical error range,
%
Rating
Typical error range
%
Rating
Typical error range
% Oxides of nitrogen B 20 - 60 B 20 - 60 B 20 – 60 Sulphur dioxide B 20 - 60 B 20 - 60 B 20 – 60 Ammonia C 50 - 150 C 50 - 150 C 50 – 150 PM C 50 - 150 C 50 - 150 C 50 – 150 Heavy metals 1) C 50 - 150 C 50 - 150 C 50 – 150 PAH C 50 - 150 C 50 - 150 C 50 – 150 Dioxins D 100-300 D 100 -300 D 100-300 CO B 20 - 60 B 20 - 60 B 20 – 60 NMVOC C 50 - 150 C 50 - 150 C 50 – 150 1)
Uncertainty of evaluation of mercury emission factors for small of biomass combustion installations (manual and automatic fuelled appliances) was rated at 100 – 300% (D), Pye et al., (2005) The table above gives a rough qualitative estimation of the typical uncertainty of default emission factors. The uncertainty estimation represents an application of qualitative data rating schemes for all pollutants in this chapter and main group of techniques. Any such qualitative summary is subjective and individual opinions may differ. Activity data for fossil fuels for the sources covered in this chapter typically have higher uncertainties than those for other stationary combustion sources. For biomass fuels consumption estimates are less accurate than for fossil fuels, in particularly where self-supply and direct purchase from farmers prevail.
11 WEAKEST ASPECTS/PRIORITY AREAS FOR IMPROVEMENT IN CURRENT
METHODOLOGY
The weakest aspects discussed here are mainly related to emission factors, but also to the estimation of activities.
11.1 Emission factors
Improvement of emission factors is necessary in order to obtain more accurate emission estimates for residential activities due to a wide variety of employed combustion techniques and different types of fuels used. Type of installation and fuel used is critical to emissions of air pollutants, especially in the case of coal and biomass combustion where high levels of pollutants such as TSP, CO, NMVOC and PAH come from incomplete combustion.
This improvement should focus on preparing individual emission factors for individual techniques currently used, both old and new. The emission factors of pollutants such as TSP,
NON-INDUSTRIAL COMBUSTION PLANTS
Activities: Various
Emission Inventory Guidebook December, 2006 B216-41
CO, NMVOC and PAH, affected by the poor performance of the used combustion technology, can be reduced by introducing measures (or new technologies) to improve combustion efficiency, although some pollutants, e.g., NOx and heavy metals (Hg, Cd, As) might increase.
For particulate matter (especially fine fraction), PAHs, PCDD/Fs, NMVOCs, and heavy metals small combustion installations contribute a high proportion of total emission and generation of specified data for this source should be the priority. The fuel specific emission factors cited from different sources (Annex 1, table A1 1 – A1 48) are often not representative and refer to the typically observed range. Establishing a measurement program that would allow characterisation of techniques and fuels used as well as development of inventory for small sources should be of high priority. Such a program could also investigate national and regional specific parameters (climatic, cultural, level of control, etc.) relevant for emissions.
Emission factors are related usually to full load conditions. Due to common low load of the small combustion installations and a high number of start-ups per year (e.g up to 1,000 times a year for solid fossil fuels and biomass stoves with manual fuel charging) the emissions are higher in comparison to full load conditions.
In order to assess the relevance of start–ups and low load conditions, a detailed investigation should be performed for small combustion installation, in particular manual fuelled with capacity of below 1 MWth.
Sampling methods developed for industrial and other larger combustion plants are not suitable for small residential sources, especially for particulate matter and particulate related pollutants like PAH, heavy metals and PCDD/F. Further work should be invested to clarify this influence as well as influence of laboratory conditions (mainly regarding to the natural and forced draught) with respect to the emission factors published.
11.2 Activities
Collecting more reliable information on actual consumption of biomass, in particular “virgin” wood, waste wood, and straw, is essential in order to improve the accuracy of emission estimates for this sector. Uncertainties also occur due to the fact, that fuel such as coal or wood can be also used as mixtures. Also methodologies for estimation of the quantity of contaminated/ treated wood combusted, crucial for PAH and dioxin emissions, have to be developed. The same is valid also for the assessment of the residential waste combusted in the residential sector.
Further work should be carried out to differentiate between fuel coal used in manual and automatic boilers with capacity below 1MWth, as well as to distinguish between various fuel wood types, e.g., log wood, chips and pellets.
Since the current international (and possibly a number of national) statistics do not represent this sector well, the establishment of a “communication line” with the respective agencies to discuss ways of improving collection and reporting of activity data in this sector should be considered.
B216-42 December, 2006 Emission Inventory Guidebook
12 SPATIAL DISAGGREGATION CRITERIA FOR AREA SOURCES
Spatial disaggregation of annual emissions when using top-down approach could be performed by using surrogate data. For the residential sector the emissions could be taken as proportional to the population density. Because in most countries the means of heating in residential greatly differs among urban and rural settlements and also among the regions (usually coal is much more used in traditionally mining regions), this approach could be taken only as a last resort. In general the following steps could be taken for disaggregation of the emissions from the residential sector (Loibel, 1993):
• Differentiated in spatial areas: administrative units, inhabited areas, settlement areas divided in low and high density populated
• Determination of per capita emission factor depending on population density, type of fuel and main installation types used in for each spatial area
If emissions have been determined by bottom-up energy modelling, the spatial disagreagation is straightforward.
For commercial/institutional sector emissions could be disaggregated according to the number of employees in the considered spatial unit. It has however to be checked that the number of employees are given as actually employed per spatial unit and not according to the headquarters site.
13 TEMPORAL DISAGGREGATION CRITERIA
Most heating related emissions covered in this chapter are released due to heating of buildings and are therefore released predominantly during the heating season. In the residential sector a smaller part of emissions are released year-round due to preparation of hot water. In agriculture crops drying and greenhouse heating is seasonal. Building heating demand is related to ambient temperature and user behaviour. Influence of ambient temperature is correlated to heating degree-days, which could be found usually in publications of meteorological services for different towns/cities. The user behaviour is reflected in different load and emissions during workdays and weekends. Daily fluctuations of load depend also on combustion techniques, for instance manually feed stoves and boilers, and on working hours distribution, and are for that reason country specific.
14 ADDITIONAL COMMENTS
The default emission factors given in the tables in Section 8 are derived from various measurements, of which some are laboratory measurements and some are in-field measurements. In order to derive representative default emission factors from available data, expert judgement is necessary. This has taken into account the variations in fuels, technologies and firing practices as well as the various conditions due to national conditions, to the best of our current knowledge. The default emission factors are general and derived to
NON-INDUSTRIAL COMBUSTION PLANTS
Activities: Various
Emission Inventory Guidebook December, 2006 B216-43
be as representative as possible for real conditions with the current knowledge. More in-field measurement would improve the basis for and the quality of the default emission factors.
15 SUPPLEMENTARY DOCUMENTS
16 VERIFICATION PROCEDURES
Verification of the emissions can be undertaken by calculating the emissions using the default factors given in Section 8.1 of this chapter and comparing the results with a mean profile.
17 REFERENCES
• APEG (The Airborne Particle Expert Group) (1999); “Source apportionment of airborne particulate matter in the United Kingdom”; Prepared on behalf of the Department of the Environment, Transport and the Regions, the Welsh Office, the Scottish Office and the Department of the Environment (Northern Ireland)
• Baumbach G., Zuberbühler U., Struschka M., Straub D., Hein K.R.G. (1999); „Feinstaubuntersuchungen an Holzfeuerunge“; Teil 1: Bereich Hausbrand und Kleingewerbe. Institut für Verfahrenstechnik und Dampfkesselwesen, Report No. – 44-1999, Universtät Stuttgart. Juli 1999
• Baart A., Berdowski J., van Jaarsveld J. and Wulffraat K., (1995); “Calculation of atmospheric deposition of contaminants on the North Sea”, TNO-MEP-R 95/138, Delft, The Netherlands
• Bartle K.D., Ściążko M., Kubica K. (1996); “Clean Coal –Derived Solid Fuels for Domestic and power Plant Combustion”; Report 1996, Contract CIPA-CT92-3009, 1996
• Berdowski J.J.M., Bass J., Bloos J.P.J., Visschedijk A.J.H., Zandveld P.Y.J., (1997); “The European Atmospheric Emission Inventory for Heavy Metals and Persistent Organic Pollutants”; Umweltforschungsplan des Bundesministers fur Umwelt, Naturchutz und Raktorsicherheit. Luftreinhaltung. Forschunbericht 104 02 672/03. TNO, Apeldorn, The Netherlands, 1997
• BLT (1999); BLT - Biomass · Logistics · Technology Francisco Josephinum, Wieselburg, Austria; http://www.blt.bmlfuw.gv.at/pruefber/g1999062.pdf
• BLT (2000/1); BLT - Biomass · Logistics · Technology Francisco Josephinum, Wieselburg, Austria; http://www.blt.bmlfuw.gv.at/pruefber/g2000117.pdf
• BLT (2000/2); BLT - Biomass · Logistics · Technology Francisco Josephinum, Wieselburg, Austria; http://www.blt.bmlfuw.gv.at/pruefber/g2000074.pdf
• BLT (2001/1); BLT - Biomass · Logistics · Technology Francisco Josephinum, Wieselburg, Austria;http://www.blt.bmlfuw.gv.at/pruefber/g2004075.pdf
• BLT (2003); BLT - Biomass · Logistics · Technology Francisco Josephinum, Wieselburg, Austria; http://www.blt.bmlfuw.gv.at/pruefber/g2003048.pdf
• BLT (2004/2); BLT - Biomass · Logistics · Technology Francisco Josephinum, Wieselburg, Austria; http://www.blt.bmlfuw.gv.at/pruefber/g2004020.pdf
• BLT (2005/1); BLT - Biomass · Logistics · Technology Francisco Josephinum, Wieselburg, Austria; http://www.blt.bmlfuw.gv.at/pruefber/g2005093.pdf
B216-44 December, 2006 Emission Inventory Guidebook
• BLT (2005/2); BLT - Biomass · Logistics · Technology Francisco Josephinum, Wieselburg, Austria; http://www.blt.bmlf.gv.at/menu/index_e.htm
• Boman C., Nordin A., Öhman M., Boström D. (2005); “Emissions from small-scale combustion of biomass fuels - extensive quantification and characterization”; Energy Technology and Thermal Process Chemistry Umeå University, STEM-BHM (P12648-1 and P21906-1), Umeå, February 2005
• Boman Ch., Nordin A., Boström D., and Öhman M. (2004); “Characterization of Inorganic Particulate Matter from Residential Combustion of Pelletized Biomass Fuels”; Energy&Fuels 18, pp. 338-348, 2004
• Bostrom Curt-Ake, (2002); “Emission Factors for Small Scale Combustors (Bio-Fuels). IVL, Sweden”; UN-ECE TFEIP Combustion and Industry Expert Panel Workshop on: ”Emissions from Small and Medium Combustion Plants”, Ispra, April 2002, Procc. No.I.02.87
• Broderick D.R., Houck J.E. (2005); “Development of a Fireplace Baseline Particulate Emission Factor Database”; OMNI Consulting Services, Inc.; http://www.omni-test.com/Publications/baselinepaper1.pdf
• Bryczkowski A., Kubica R. (2002): Inżynieria i Aparatura Chemiczna; 41, nr 4, 14, 2002 (polish)
• BUWAL (Bundesamt für Umwelt, Wald und Landschaft) (1995); „Emissionsfaktoren für Stationäre Quellen“; BUWAL, Bern
• BUWAL (Bundesamt für Umwelt, Wald und Landschaft) (2001); „Massnahmen zur Reduktion von PM10-Emissionnen“; Schlussbericht, BUWAL Abteilung Luftreinhaltung und NIS, January, 2001
• Caserini Stefano, (2004); Private Communication; Technical University Milano • Caserini S., Monguzzi A.M., Fracaroli A., Moretti M., Giudici A. (2003),
Distribuzione delle emissioni di diossine in atmosfera in Lombardia: scenario attuale e trend per le principali sorgenti; 1 Convegno: Ingegneria e Chimica per l'Ambiente "POP: diffusione nell'ambiente, loro controllo e tecnologie di abbattimento" Milano, 26-27 Novembre, 2003; http://www.aidic.it/POP/convegno%20novembre%202003.htm
• CEC (2003): “European energy and transport. Trends to 2030”; KO-AC-02-001-EN-C, European Commission, Directorate General for Energy and Transport, Luxembourg
• CEPMEIP (2002): “Co-ordinated European Programme on Particulate Matter Emission Inventories, Projections and Guidance”; 2002,: http://www.air.sk/tno/cepmeip/
• Chapter Combustion Plants as Point Sources -B111, EMEP/CORINAIR Atmospheric Emission Inventory Guidebook
• CITEPA, (2003), “Wood Combustion in Domestic Appliances”; Final Background Document on the sector; 30.06.2003
• Cofala J., Klimont, Z., Amann, M. (2006); “The potential for further control of emissions of fine particulate matter in Europe”; IIASA IR 06-011. http://www.iiasa.ac.at/rains/reports/wp-06-011.pdf
• COM(2003) 423 final; “Proposal for a Directive of the European Parliament and of the Council relating to arsenic, cadmium, mercury, nickel and polycyclic aromatic hydrocarbons in ambient air”; Brussels, 16.07.2003
NON-INDUSTRIAL COMBUSTION PLANTS
Activities: Various
Emission Inventory Guidebook December, 2006 B216-45
• Compilation of Air Pollutant Emission Factors (AP-42) (1996), Volume 1: “Stationery Point and Planning and Standards”; Research triangle Park. North Carolina, 1996
• Czekalski B., Drodz W.; (2003); “Emission from oil and gas boilers – the results of investigation in Poland. Personal communicate”; EN-POL, Katowice, Poland, October 2003
• Davies M., Rantall, T.D., Stokes B.J., Williamson F., (1992); “Characterisation of Trace Hydrocarbon Emissions from Coal Fired Appliances”; Final Report on Ecsc. Project No 7220-ED821, Report No. ENV/27
• Determination of Mean Emission Factors as Representative Figures for Emission of Stuttgart – IVD (1996; Final Report to P&D. Project 29546364/ Emission Factors; 1996
• Dreiseidler, A., Baumbach, G., Pregger, T., and Obermeier, A. (1999): „Studie zur Korngröβenverteilung (< PM10 und PM2.5) von Staubemissionen“; Forschungsbericht 297 44 853, i. A. Des Umweltbundesamtes Berlin, Germany (different UBA sources, partly personal communication, cited in this study)
• Emission Factors Manual PARCOPM-ATMOS (1993); “Emission Factors for Air Pollutants”; Final version – TNO Report 92-233/112322-24285, 1992, 1993
• EPA (Environmental Protection Agency) (1998a); Compilation of Air Pollutant Emission Factors, 5-th ed: EPA AP-42; United States Environmental Protection Agency. Research Triangle Park, North Carolina
• EPA (Environmental Protection Agency) (1996); “Report on Revisions to 5th Edition AP-42 Section 1.10 Residential Wood Stoves”, pp.10/92, United States Environmental Protection Agency. Research Triangle Park, North Carolina, U.S.
• EPA (Environmental Protection Agency) (1998b); “Compilation of Air Pollutant Emission Factors, Section 7.1, Residential Wood Combustion”, 5-th ed.: EPA AP-42. United States Environmental Protection Agency. Research Triangle Park, North Carolina, U.S.
• Ehrlich Ch., Noll G., Kalkoff W.-D. (2001); “Overview of investigations on aerosols from combustion (including biomass) in Germany”, pp.50 in Aerosols from Biomass Combustion, ISBN 3-908705-00-2, International Seminar at 27 June 2001 in Zurich by IEA Bioenergy Task 32 and Swiss Federal Office of Energy, Verenum, Zurich 2001 http://www.ieabcc.nl/publications/aerosols.pdf
• Fine P.M., Cass G.R., Simoneit B.T. (2001); “Chemical Characterization of Fine Particle Emissions from Fireplace Combustion of Woods Grown in the Northeastern United States”; Environ. Sci. Technol., 35, pp. 2665-2675, 2001
• Fine P.M., Cass G.R., Simoneit B.T. (2002); ‘Chemical Characterization of Fine Particle Emissions from the Fireplace Combustion of Woods Grown in the Southern United States’; Environ. Sci. Technol., 36, pp.1442-1451, 2002
• Gaegauf U.Ch., Wieser, Y. Macquat W.Y. (2001); “Field investigation of nanoparticle emissions from various biomass combustion systems” pp. 80 in Aerosols from Biomass Combustion, ISBN 3-908705-00-2, International Seminar at 27 June 2001 in Zurich by IEA Bioenergy Task 32 and Swiss Federal Office of Energy, Verenum, Zurich 2001 http://www.ieabcc.nl/publications/aerosols.pdf
B216-46 December, 2006 Emission Inventory Guidebook
• Geueke K.J., Gessner A., Hiester E., Quaß U., Bröker G., (2000); “Elevated Emissions of Dioxine and Furanes from Domestic Single Stove Coal Combustion”; Organohalogen Compounds; vol. 46, pp 272 – 275, 2000
• Glasius, M, Vikelsoe, J, Bossi, R, Vibeke Andersson, H, Holst, J, Johansen, E and Schleicher, O. 2005. Dioxin, PAH og partikler fra braendeovne. Danmarks Miljöundersogelser, Miljöministeriet. DMU nr 212. In Dannish.
• Grochowalski A; (2002), „Ambient air concentration and emission of dioxins in Poland”; and Grochwalski A., „Results of dioxins emission measurements from thermal processes in Poland 1996-2002”; Proc., of JRC Workshop on the Determination of Dioxins in Industrial Emissions; Brno, Czech Republic, 16-19 April, 2002, pp. 87
• Gulland J. (2003); “Residential Wood Combustion, Overview of Appliance Categories”, June 2003, Updated September 2003;
http://www.bcbudget.gov.bc.ca/sp2004/wlap/wlap.pdf) • Gullett B.K., Touati A., Hays M.D. (2003); “PCDD/F, PCB, HxCBz, PAH, and PM
Emission Factors for Fireplace and Woodstove Combustion in the San Francisco Bay Region”; Environ. Sci. Technol. 37, pp. 1758-1765, 2003
• Hays M.D., Smith N.D., Kinsey J., Dongb Y., Kariherb P. (2003); “Polycyclic aromatic hydrocarbon size distributions in aerosols from appliances of residential wood combustion as determined by direct thermal desorption—GC/MS”; Aerosol Science, 34, pp. 1061–1084, 2003
• Hedberg E., Kristensson A., Ohlsson M., Johansson C., Johansson P., Swietlicki E., Vesely V., Wideqvist U., Westerholm R. (2002); “Chemical and physical characterization of emissions from birch wood combustion in a wood stove”; Atmospheric Environment 36, pp. 4823–4837, 2002
• Hlawiczka S., Kubica K., Zielonka U., (2003); “Partitioning factor of mercury during coal combustion in low capacity domestic heating appliances”; The Science of the Total Environment; Elsevier; 312, 2003, 261-265
• Hlawiczka S., Fudala J. (2003); “Distribution of Cd, Pb and Hg emissions among sectors of economy in Poland and the emission assessment for the years 1990-2000” in: Environmental Engineering Studies, Polish Research on the way to the EU; Kluwer Academic/Plenum Publishers, New York, 2003
• Hesling D., (2002); “Emission from stationary combustion sources smaller that 20kW in the Netherlands: methodology and emission factors”; UN-ECE TFEIP Combustion and Industry Expert Panel Workshop on: ”Emissions from Small and Medium Combustion Plants”, Ispra, April 2002, Procc. No.I.02.87
• Hobson M., Thistlethwaite G., (2003); “Emission factors programme Task 7 – Review of Residential & Small-Scale Commercial Combustion Sources”; AEAT/ENV/R/1407, Issue 1
• Houck J.E., Tiegs P., E., (1998); “Residential Wood Combustion – PM2.5 Emissions”; WESTAR PM2.5 Emission Inventory Workshop; Reno, Nevada, July 22-23, 1998
• Houck J.E., Tiegs P., E., (1998/1); “Residential Wood Combustion Technology Review”. Volume 1.Technical Report; EPA-600/R-98-174a, December 1998
• Houck, J. and Tiegs, P.E. (1998); “Residential Wood Combustion Technology Review” EPA-600/R-98-174 (Volume 1 and 2)
NON-INDUSTRIAL COMBUSTION PLANTS
Activities: Various
Emission Inventory Guidebook December, 2006 B216-47
• Houck J.E., Scott A.T., Purvis C.R., Kariher P.H., Crouch J. and Van Buren M.J. (2000); “Low emission and high efficiency residential pellet-fired Heaters”; Proceedings of the Ninth Biennial Bioenergy Conference, Buffalo, NY, October 15-19, 2000; http://www.omni-test.com/Publications.htm
• Houck J.E., Crouch J., Huntley R.H. (2001); Review of Wood Heater and Fireplace Emission Factors”; OMNI Consulting Services Inc.; Hearth Products Association; U.S. EPA. http://www.omni-test.com/Publications/ei.pdf
• Houck J.E., Broderick D.R. (2005); “PM2.5 Emission Reduction Benefits of Replacing Conventional Uncertified Cordwood Stoves with Certified Cordwood Stoves or Modern Pellet Stoves”; OMNI Environmental Services, Inc., Prepared for Hearth, Patio and Barbecue Association, May 26, 2005; http://www.omni-test.com/Publications/Emission_Reduction.pdf
• Hustad J. E., Skreiberg Ø., and Sønju O. K., (1995);“Biomass Combustion Research and Utilisation in IEA Countries, Biomass and Bioenergy”, vol. 9, Nos 1-5, 1995
• Hübner C., Boos R., Prey T. (2005); “In-field measurements of PCDD/F emissions from domestic heating appliances for solid fuels”; Chemosphere 58 (2005) 367–372
• IIASA (International Institute for Applied Systems Analysis), 2004; “Results of the RAINS model developed at IIASA”; Laxenburg, Austria (www.iiasa.ac.at/rains)
• Johansson L., TullinC., Leckner B. (2001);“Particulate emissions from small-scale biomass combustion” pp. 87 in Aerosols from Biomass Combustion, ISBN 3-908705-00-2, International Seminar at 27 June 2001 in Zurich by IEA Bioenergy Task 32 and Swiss Federal Office of Energy, Verenum, Zurich 2001 http://www.ieabcc.nl/publications/aerosols.pdf
• Johansson, L et al.. Fältmätningar av metan och andra viktiga komponenter från ved pannor. 2006. (Field measurements of methane and other parameters from wood log boilers). SP Swedish National Testing and Research Institute. Borås, Sweden 2006. STEM-BHM (21826-1, 21826-2, 5030403). In Swedish with English summary.
• Johansson, L, Johansson, M, Tullin, C. Emissionsnivåer av komponenter som omfattas av miljömålet ”Frisk luft” vid P-märkning och miljöprovning av eldningsutrustning för villor. 2004 a. (Emission parameters within the Swedish environmental objective clean air to the emission levels obtained during the testing of domestic combustion devices for testing of emission limits and by the P-mark. SP Swedish National Testing and Research Institute. Borås, Sweden 2004. STEM-BHM (20710-1). In Swedish with English summary.
• Johansson, L, Leckner, B, Gustavsson, L, Cooper, D, Tullin, C, Potter, A. 2004 b. Emission characteristics of modern and old-type residential boilers fired with wood logs and wood pellets. Atmospheric Environment 38 (2004) 4183–4195.
• Kakareka S., Kukharchyk T., Khomisch V., (2003); “Belarusian Contribution to EMEP”; Annual report 2002, Minsk-Moscow, January 2003”
• Karasek F., Dickson L., (1987); Science, 237, 1987 • Karcz A., Kubica K., Ściążko M.; “Fuel coke — an environment friendly alternative
to coal. II CUSTNET Conference on Coal Research a Development through Collaboration in Europe”; Ostrawa, Republika Czeska, 2–4.09.1996
• Karvosenoja, N. (2000; “Results of investigation in Finland. Personal communication”
B216-48 December, 2006 Emission Inventory Guidebook
• Klimont Z., Cofala J., Bertok I., Amann M., Heyes Ch., and Gyarfas F. (2002; “Modelling Particulate Emissions in Europe; A Framework to Estimate Reduction Potential and Control Costs”; Interim Report IR-02-076, International Institute for Applied Systems Analysis (IIASA), Laxenburg, Austria (can be found on the Internet at: http://www.iiasa.ac.at/rains/reports/ir-02-076.pdf)
• Krucki A., Juńczyk J. (2006); Private communication, Instytut Techniki Cieplnej w Lodzi, June 2006
• Kubica K., (1997/1): “Distribution of PAH generated in domestic fuels boilers”; Proc. of 9th International Conference on Coal Science; Essen, Niemcy, 7–12.09.1997
• Kubica, K., Raińczak, J., Rzepa, S., Ściążko, M., (1997/2); „Influence of „biofuel” addition on emission of pollutants from fine coal combustion”, Proc. 4th Polish-Danish Workshop on Biofuels, Starbieniewo, 12-14 czerwca 1997/2
• Kubica K., (1998); “The effect of coal combustion process in stable bed conditions on generation and distribution of PAHs”; Proc. of the II International Scientific Conference “Air Protection in theory & Application, 2-4 June, Szczyrk, 1998, s 339
• Kubica K., Misztal M., (1997/3), “Promotion of Low Emission Coal Fired Boilers”; Report THERMIE B Action DIS-0715-95-UK, IChPW, Zabrze, March, 1997
• Kubica K., Sciążko M. (1994); ”Correlation of coal properties to char, briquette, and utilization characteristics”; Int. Conf. “Production and Utilization of Ecological Fuels from East Central European Coals”, Praga, Republika Czeska, 31.10-1.11.1994
• Kubica K., Ranczak J., Wilkosz K. (1999); Report ICHPW 2696/99 “Determination of non-metanic organic compounds emission factors for solid fuels (coal coke), gas and oil fire appliances”, Zabrze, 31.05.99 (Polish)
• Kubica K. (2001/1): „Combustion of biomass in small capacity appliances – emission of pollutants”; Międzynarodowa Konferencja nt. „Odnawialne źródła energii u progu XXI wieku”; s. 419, Warszawa 2001, (Polish, abstract in English)
• Kubica K., (2002/1); “Emission of Pollutants during Combustion of Solid Fuels and Biomass in Small Appliances”; UN-ECE TFEIP Combustion and Industry Expert Panel Workshop on: ”Emissions from Small and Medium Combustion Plants”, Ispra, April 2002, Procc. No.I.02.87
• Kubica K., J. Rańczak J. (2003/3); “Co-firing of coal and biomass in mechanical great boilers”; Procc., of Int., Conf., Combustion of alternative fuels in power and cement industry, 20-21 February, 2003, Opole, Poland, pp. 81-97
• Kubica K., et al. (2002/2); “Development of technologies for biomass utilization”, Report IChPW 1.03/2002 (Polish)
• Kubica K. (2002/3): “Low emission coal boilers as alternative for oil and gas boilers for residential and communal sectors; Coal hasn’t to contaminate” Katalog ochrony środowiska – Ekoprofit nr 1 (61)/2002, Katowice, 2002 (Polish)
• Kubica K., (2003/1); “Environment Pollutants from Thermal Processing of Fuels and Biomass”, and “Thermochemical Transformation of Coal and Biomass” in Termochemical Processing of Coal and Biomass; pp 145-232, ISBN 83-913434-1-3, Publication, Copyright by IChPW and IGSMiE PAN; Zabrze-Kraków; 2003, (Polish)
• Kubica K., Ranczak J, Matuszek K., Hrycko P., Mosakowski S., Kordas T., “Emission of Pollutants from Combustion of Coal and Biomass and Its Co-firing in Small and Medium Size Combustion Installation “ (2003/2); 4th JOINT UNECE Task Force &
NON-INDUSTRIAL COMBUSTION PLANTS
Activities: Various
Emission Inventory Guidebook December, 2006 B216-49
EIONET Workshop on Emission Inventories and Projections in Warsaw, Poland, 22-24 September, 2003
• Kubica K. (2003/3), „Zagrożenia trwałymi zanieczyszczeniami, zwłaszcza dioksynami i furanami z indywidualnych palenisk domowych i kierunki działań dla ich ograniczenia” („Threats caused by persistent pollutants, particularly by dioxine and phuranes from residential heating and the directions of protection actions aiming at their emission reduction”); Project: GF/POL/01/004 - Enabling activities to facilitate early action on the impementation of the Stockholm Convention on Persistent Organic Pollutants (POPs Convention); Warszawa, 2004; http://ks.ios.edu.pl/gef/doc/gf-pol-nip-r1.pdf
• Kubica K. (2004/1); “Toxic Pollutants Emission from either Combustion Process and Co-Combustion of Coal and Biomass”; ”Ochrona Powietrza w Teorii i Praktyce”, ISBN 83-921514-0-2 pp. 213-229, Zabrze, 2004 (polish, abstract in english)
• Kubica K. (2004/2); „Analiza wskaźników emisji zanieczyszczeń do powietrza – pyłów, wielopierścieniowych węglowodorów aromatycznych – ze spalania paliw”; Raport 30-011-BK-3086 dla IOS; Warszawa, 30 grudzień, 2004 (polish)
• Kubica K., Paradiz B., Dilara (2004/4); “Toxic emissions from Solid Fuel Combustion in Small Residential Appliances”; Procc. 6th International Conference on Emission Monitoring CEM-2004, June 9-11, 2004, Milano Italy; www.cem2004.it
• Kubica K. (2004/5); „Spalanie i współspalanie paliw stałych w miastach” („Combustion and co-combustion of solid fuels”); Rozdział w monografii „Zarządzanie energią w miastach” („Management of energy in the town”) ; red. R. Zarzycki; ISBN 83-86492-26-0; Polska Akademia Nauk Oddział w Łodzi, Łódź 2004 s. 102-140
• Kubica K., Zawistowski J., Rańczak J. (2005/1); „Spalanie paliw stałych w instalacjach małej mocy – rozwój technik spalania węgla i biomasy”; Karbo, 50, pp. 2, 2005 (polish, abstract in english)
• Kubica K., Kubica R., Zawiejska Z., Szyrwińska I. (2005/2); „Ocena efektów ekologicznych i społecznych programu obniżenia niskiej emisji, zrealizowanego w Tychach w latach 2002 - 2004 w dzielnicach obrzeżnych miasta”; Raport Nr 0433/05 z dnia 01-03-2005 NILU Polska Sp. z o.o., SOZOPROJEKT Sp. z o.o., Katowice, maj, 2005
• Kubica K., Hlawiczka S., Cenowski M., Kubica R. (2005/3); „Analiza zmian wskaźników emisji pyłu z wybranych procesów w okresie 1990 – 1999”, Raport dla IOS, Warszawa, wrzesień, 2005 (polish)
• Kubica K., Kubica R., Pacyna J., Pye S., Woodfield M. (2006/1); “Mercury emission from combustion of coal in SCIs”; MEC3 - Mercury Emissions from Coal 3rd International Experts’ Workshop, Katowice, Poland, 5th-7th June 2006; � � � � � � � � � � � � � � � � � � � �
• Kubica K. (2006/2); „Występowanie metali ciężkich w biomasie drzewnej Gmin
Zabrze i Bytom w aspekcie jej wykorzystania w energetyce i produkcji kompostu” (“Appearence of heavy metals in wood biomass of Zabrze and Bytom Communes owing to its use in energy and compost production”); Interim Report; July, 2006, WSEiA, Bytom
• Kubica K., Paradiz B., Dilara P., (2004) “Small combustion installations – techniques, emissions and measurements”; Ispra, EUR Report 2004
B216-50 December, 2006 Emission Inventory Guidebook
• Kupiainen, K., Klimont, Z., (2004); “Primary Emissions of Submicron and Carbonaceous Particles in Europe and the Potential for their Control”; IIASA IR 04-079, http://www.iiasa.ac.at/rains/reports.html
• Lammi K., Lehtonen E. and Timonen T. (1993); “Energiantuotannon hiukkaspäästöjen teknis-taloudelliset vähentämismahdollisuudet (Technical and economical alternatives to reduce particulate emissions from energy production)”; Helsinki, Finland, Ministry of the Environment, Report 120. 64 pp. (In Finnish with English summary)
• Loibel W., Orthofer O., Winiwarter W. (1993); “Spatially disaggregated emission inventory for antrophogenic NMVOC emissions in Austia”; Atmospheric Environment, 27A, 16, pp. 2575-2590, 1993
• Lee R.M., Coleman P., Jones J.L., Jones K.C., Lohmann R. (2005); “Emission Factors and Importance of PCDD/Fs, PCBs, PCNs, PAHs and PM10 from the Domestic Burning of Coal and Wood in the UK”; Environ. Sci. Technol. 39, pp.1436-1447, 2005
• McDonald J.D., Zielinska B., Fujita E., Sagebie J.C., Chow J.C., and Watson J.G. (2000); “Fine Particle and Gaseous Emission Rates from Residential Wood Combustion”; Environ. Sci. Technol. 2000, 34, pp. 2080-2091, 2000
• Meier, E. and Bischoff, U. (1996); „Alkalische Emisisonsfaktoren beim Einsatz ballastreicher Braunkohlen in Vebrennunganlagen“; IfE Leipzig i.A des BMBF, Beitrag C2.2 des Verbundvorhabens SANA, in: Wissenschaftliches Begleitprogramm zur Sanierung der Atmmosphäre über den neuen Bundesländern, Abschlussbericht Band II
• Moritomi H., Fujiwara N. (2005); “Mercury emission from coal combustion in Japan”; Mercury Experts Conference 2; MEC2 – May 25, 2005 Ottava, Canada
• Nielsen M., Illerup J.B., Kristensen P.G., Jensen J., Jacobsen H.H., Johansen L., P., (2002); “Emission factors for CHP plants < 25MWe”; (2003); 4th JOINT UNECE Task Force & EIONET Workshop on Emission Inventories and Projections in Warsaw, Poland, 22-24 September, 2003
• Nussbaumer T. (2001); “Relevance of aerosols for the air quality in Switzerland” pp.1 in Aerosols from Biomass Combustion, ISBN 3-908705-00-2, International Seminar at 27 June 2001; http://www.ieabcc.nl/publications/aerosols.pdf
• NUTEK (1997); “Environmentally - Adapted Local Energy Systems”; Report 4733, Swedish Environmental Agency, Stockholm
• Oanh N.T.K., Reutergårdh L.B., Dung N.T. (1999); “Emission of Polycyclic Aromatic Hydrocarbons and Particulate Matter from Domestic Combustion of Selected Fuels”; Environ. Sci. Technol., 33, pp. 2703-2709, 1999
• Ohlström, M. (1998); “Energiantuotannon pienhiukkaspäästöt Suomessa (The fine particle emissions of energy production in Finland)”; Espoo, Finland, Technical Research Center of Finland, VTT Research Notes 1934. 114 pp. (In Finnish with English summary)
• Ohlström, Mikael, Tsupari, Eemeli, Lehtilä, Antti & Raunemaa, Taisto. Pienhiukkaspäästöt. (2005). Fine particle emissions and their reduction potentials in Finland. The effects of greenhouse gas emission reduction. Espoo 2005. VTT Tiedotteita Research Notes 2300. 91 s. + liitt. 1 s. Finland. (In Finnish with English summary)
NON-INDUSTRIAL COMBUSTION PLANTS
Activities: Various
Emission Inventory Guidebook December, 2006 B216-51
• Olendrzynski K., Fudala J., Hlawiczka S., Cenowski S., Kachniarz M., Kargulewicz I., Debski B. Skoskiewicz J.(2002); “Emission Inventory of SO2, NO2, NH3, CO, PM, HMs, NMVOCs and POPs in Poland 2000”; UN-ECE – EMEP/Poland – Report/2002; IOS, Warszawa
• Pacyna J.M., Pacyna E.G., (2001); “An assessment of global and regional emissions of trace metals to the atmosphere from anthropogenic sources worldwide”; Environ.Rev.2001, No 9 pp 269 – 298
• Pacyna J.M., Munthe J. (2004), “Summary of research of projects on mercury funded by EC DG Research”; Workshop on Mercury Needs for further International Environmental Agreements, Brussels, March 29-30, 2004
• Paulrud, S et al. 2006. Användningsmönster och emissioner från vedeldade lokaleldstäder. (The use of domestic wood burning and emissions from wood stoves). IVL-report, Swedish Environmental Research Institute, Gothenburg, Sweden 2006. (In Swedish with English summary)
• Purvis, C. & Mccrills, R. 2000. Fine particulate matter (PM) and organic speciation of fireplace emissions. Environ. Sci. Technol. 2000, 34, 1653-1658.
• Pye S., Thistlethwaite G., Adams M., Woodfield M., Goodwin J., Forster D., Holland M. (2004); Study Contract on the Cost and Environmental Effectiveness of Reducing Air Pollution from Small-scale Combustion Installations” (EC reference ENV.C.1/SER/2003/0099r); http://europa.eu.int/comm/environment/air/cafe/
• Pye S., Jones G., Stewart R., Woodfield M., Kubica K., Kubica R., Pacyna J. (2005/1); “Costs and environmental effectiveness of options for reducing mercury emissions to air from small-scale combustion installations”; AEAT/ED48706/Final report v2, December 2005
• Pye S. (2005/2); UK National atmospheric Emission Inventory (supplied by Pye S, UK, July 2005)
• Perry R.H., Green D.W., (1997); Chemical Engineers Handbook, Ed.7, Mc Grow-Hill, London, 1997
• Pfeiffer F., Struschka, M., Baumbach, G. (2000); „Ermittlung der mittleren Emissionsfaktoren zur Darstellung der Emissiionsentwicklung aus Feuerungsanlagen im Bereich der Haushalte und Kleinverbraucher“; UBA-FB 295 46 36414/00, Umwelbundesamt, Berlin Mai 2000 (Germany, English abstract)
• Struschka, M., Zuberbühler U., Dreiseidler A., Dreizler D., Baumbach, G. (2003); „Ermittlung und Evaluierung der Feinstaubemissionen aus Kleinfeurungsanlagen im Bereich der Haushalte und Kleinverbraucher sovie Ableitung von geeingenten Maßnahmen zur Emissionminderung“; UBA-FB 299 44 140, Umwelbundesamt, Berlin Juli 2003 (Germany, English abstract)
• Pulles T., van Aardenne J., Tooly L., Rypdal K., (2001); “Good Practice Guidance for CLRTAP Emission Inventories”; European Topic Centre on Air and Climate Change (ETC/ACC), 7 November, 2001, www.emep.int or on the Internet site of the European Environment Agency http://reports.eea.eu.int/EMEPCORINAR/en
• Purvis, C. & Mccrills, R. 2000. Fine particulate matter (PM) and organic speciation of fireplace emissions. Environ. Sci. Technol. 2000, 34, 1653-1658.
• Quass U., Fermann M., Bröker G.; (2000);“The European Dioxin Emission Inventory - Stage II” Desktop studies and case studies”; Final Report 31.21. 2000; Volume 2, pp. 115-120, North Rhine Westphalia State Environment Agency
B216-52 December, 2006 Emission Inventory Guidebook
• Ross A.B., Jones J.M., Chaiklangmuang S., Pourkahanian M., Williams A., Kubica K., Andersson J.T., Kerst M., Danihelka P. i Bartle K.D. (2002); “Measurement and prdiction of the emission of pollutants from the combustion of coal and biomass in a fixed bed furnace”; Fuel, 81, 5, pp 571, 2002
• Skreiberg, Ø., 1994; “Advanced techniques for Wood Log Combustion”; Procc. From COMETT Expert Workshop on Biomass Combustion May 1994
• Saanum et al, (1995); “Emissions from Biomass Combustion”, Norway Institute of Technology, 1995
• Schauer, J., Kleeman, M, Cass, G, Simoneit, B. 2001. Measurement of emissions from air pollution sources 3. C1-C29 organic compounds from fireplace combustion of wood. Environ. Sci. Technol, 2001, 35, 1716-1728.
• Senior C. (2004); “Mercury Tutorial – Mercury Transformations”; Connie Senior (private presentation) Reaction Engineering International; The 29th International Technical Conference on Coal Utilization & Fuel Systems Clearwater, Florida April 18-22, 2004 (behalf of EPA)
• Smith, K.R. (1987); “Biofuels, Air Pollution, and Health, A Global Review”; Plenum Press, New York, p. 452
• Spitzer, J., Enzinger, P., Fankhauser, G., Fritz, W., Golja, F., Stiglbrunner, R. (1998; „Emissionsfaktoren für Feste Brennstoffe“; Endbericht Nr.: IEF-B-07/98, Joanneum Research, Graz, December 1998, p. 50
• Strand, M. 2004. Particle Formation and Emission in Moving Grate Boilers Operating on Woody Biofuels. Doctorial thesis. Department of Chemistry, TD, Växjö University, Sweden.
• Tan Y., Mortazavi R., Bob Dureau B., Mark A. Douglas M.A. (2004); “An investigation of mercury distribution and speciation during coal combustion”; Fuel 83 (2004), pp. 2229–2236
• Thanner G., Moche W., (2002); „Emission von Dioxine, PCBs und PAHs aus Kleinfeuerungen“; Umweltbundesamt, Federal Environment Agency – Austria, Monographien Band 153, Wien, 2002
• The Air Quality Strategy for UK; 2000; “The Air Quality Strategy for England, Scotland, Wales and Northern Ireland”, Working Together for Clean Air, Cm 4548 January, 2000
• Tullin C., Johansson L., Leckner B. (2000); “Particulate emissions from small-scale biomass combustion”; Nordic Seminar on Small Scale Wood Combustion, Nadendal, Finland, 2000
• UBA (Umweltbundesamt) (1989); „Luftreinhaltung’88, Tendenzzen – Probleme – Lösungen“, Federal Environmental Agency (Umweltbundesamt), Berlin, in Dreiseidler et al. 1999
• UBA (Umweltbundesamt) (1998); „Schriftliche Mitteilung von Hr. Nöcker vom 01.09.1998, UBA II 4.6“; Federal Environmental Agency (Umweltbundesamt), Berlin, in Dreiseidler et al. 1999
• UBA (Umweltbundesamt) (1998a); „Schatzung der Staubemissionen in Deutschland (Industrieprozesse, Kraftwerke und Fernheizwerke, industriefeuereungen)“; Schriftliche Mitteilung von Hr.Remus vom 09.2000. Federal Environmental Agency (Umweltbundesamt), Berlin
NON-INDUSTRIAL COMBUSTION PLANTS
Activities: Various
Emission Inventory Guidebook December, 2006 B216-53
• UBA (Umweltbundesamt) (1999a), “Various estimates of particulate emission factors and particle size distributions” by Federal Environmental Agency (Umweltbundesamt), Berlin, in Dreiseidler et al., 1999
• UMEG (Gesellschaft für Umweltmessungen und Umwelterhebungen mbH) (1999); „Feinstaubuntersuchungen an Holzfeuerungen, Teil 2: Bereich Industriefeuerungen > 1 MW“, Institut für Verfahrenstechnik und Dampfkesselwesen, Report No – 44-1999, Universtät Stuttgart, July, 1999
• UNEP Chemicals (2003); “Standardized Toolkit for Identification and Quantification of Dioxin and Furan Releases”; Geneva, Switzerland, 1st Edition May 2003
• Van Loo S., and Koppejan J. (2002); Handbook of Biomass Combustion and Co-firing., Twente University Press, Enschede, 2002
• Van der Most, P.F.J., Veldt, C. (1992); “Emission Factors Manual PARCOM-ATMOS, Emission factors for air pollutants 1992, Final version”; TNO and Ministry of Housing, Physical Planning and the Environment, Air and Energy Directorate Ministry of Transport and Water Management: The Netherlands; Reference number 92-235; 1992
• Williams A., Kubica K., Anderson J., Bartle K.D., Danihelka P., (2001), INCO-Copernicus Contr. No. ERB IC15-CT98-053: „Influence of co-combustion of coal and biomass on the emission of pollutants in domestic appliances”; Final Report 1999-2001
• Winiwarter, W., Trenker, Ch., Höflinger, W. (2001); „Österreichische Emissionsinventur für Stau“; A study for Austrian Environmental Agency (Umwelbundesamt), Final Report, ARC Seibersdorf Research Report, ARC—S-0151, 121 p., September 2001
• Wierzbicka, A., Lillieblad, L., Pagels, J., Strand, M., Gudmundsson, A., Ghaibi, A., Swietlicli, M. Sanati, M., Bohgard, M. Particle emissions from district heating units operating on three commonly used biofuels. Atmospheric Environment 39 (2005), 139-150.
• Zhang J., Smith K., Ma Y., Ye S., Jiang S., Qi W., Liu P., Khalil M., Rasmussen R., Thorneloe S., (2000); Greenhouse gases and other airborne pollutants from household stoves in China: a database for emission factors. Atmospheric Environment 34 (2000) 4537-4549
18 BIBLOGRAPHY
Additional literature, which is related to combustion and emissions:
• Ahuja, M.S., Paskind, J.J., Houck, J.E., and Chow, J.C. (1989); “Design of a study for the chemical and size characterization of particulate matter emissions from selected sources in California”, In: Watson, J.G. (ed.) Transaction, and receptor models in air resources management. Air & Waste Management Association, Pittsburgh, PA, pp. 145-158
• Ambient Air Pollution by Mercury (Hg) Position Paper, Prepared by the Working Group On Mercury 17 October 2001; http://europa.eu.int
B216-54 December, 2006 Emission Inventory Guidebook
• Amann M, Bertok I, Cofala J, Gyarfas F, Heyes Ch, Klimont Z, Makowski M, Schöpp W, Shibayev S (1998); “Cost-effective control of acidification and ground-level ozone”; Brussels: European Communities, 131 p, ISBN 92-828-4346-7
• Berdowski, J.J.M., Mulder, W., Veldt, C., Visschedijk, A.J.H., and Zandveld, P.Y.J. (1997): “Particulate matter emissions (PM10 - PM2.5 - PM0.1) in Europe in 1990 and 1993”; TNO-report, TNO_MEP - R 96/472
• Artjushenko N.M., “Heating of Private Houses” (1985); Kiev, 178 p. 1985 (in Rusia) • Bryczkowski A., Kubica R. (2002); Inżynieria i Aparatura Chemiczna, 41, nr 3, 13,
2002 • Crowther M., (1997) CRE Group LTD., “Scoping study for the transfer of clean coal
technology in the domestic and small industrial markets”; ETSU for DTI, Crown Copyright 1997
• CAFE Working Group on Particulate Matter; “Second Position Paper on Particulate Matter”; December 20th, 2004; http://europa.eu.int
• Capros, et al., (1999); “European Energy and CO2 emission Trends to 2020”; PRIMES model v.2. Bulletin of Science, Technology and Society 19(6): 474-492
• DIN 51603 (1992): „Flüssige Brennstofe“; Teil 1: Heizöl EL, Mindestanforderungen (1995); Teil: Heizöl L, T und M, Anforderungen an die Prüng (1992)
• Draft Guidlines for Estimating and Reporting Emissions Data; GE02-31778; EB.AIR/GE.1/2002/7; www.emep.int or on the Internet site of the European Environment Agency http://reports.eea.eu.int/EMEPCORINAR/en
• EA-4/02, (1999); Expression of the Uncertainty of Measurement in Calibration, EA-4/02, European co-operation for Accreditation, December 1999, www.european-accreditation.or
• Flagan, R.C. and Seinfeld, J.H. (1988); “Fundamentals of air pollution engineering”; New Jersey, USA, Prentice-Hall Inc., pp. 542
• Good Practice Guidance and Uncertainty Management in National Greenhouse Gas Inventories; UNFCCC for the Intergovernmental Panel on Climate Change (IPCC); 2000; http://www.ipcc-nggip.iges.or.jp
• Hein K.R.G., Bemtgen J.M., EU (1998); “Clean technology – co-combustion of coal and biomass”; Fuel Processing Technology; 54, 1998, pp. 159-169
• Houck, J.E., Goulet, J.M., Chow, J.C., Watson, J.G., and Pritchett, L.C. (1989) “Chemical characterization of emission sources contributing to light extinction”; In: Mathai, C.V. (ed.) Transaction, visibility and fine particles. Air & Waste Management Association, Pittsburgh, PA, pp. 145-158
• Houck, J.E., Crouch, J., Huntley, R.H. (2001); “Review of Wood Heater and Fireplace Emission Factors”; Paper presented at the 10th Annual Emission Inventory Meeting, 30th April – 3rd May, 2001, Denver, CO
• Kolar J., „Stickstoffoxide und Luftreinhaltung“; Springer Verlag Berlin, Heilderberg, New York, 1990
• Kubica K. (2001/2): “Predicting coal quality influence on generation and emission of TOC, VOCs and PAHs during their combustion fixed bed furnaces”; Proc. of 17th International Symposium on Combustion Processes, s. 122, Poznań 24–27.09.2001
• K.Kubica, M.Ściążko, et al., “Proposal of certification system of fuels for communal economy”; No 981/94/W-50/OA-PO-Ex/D Founded by Ministry of Environment; Report IChPW 2440/95 (Polish)
NON-INDUSTRIAL COMBUSTION PLANTS
Activities: Various
Emission Inventory Guidebook December, 2006 B216-55
• Klimont Z., Cofala J., Bertok I., Amann M., Heyes Ch. and Gyarfas F.: (2002) “Modelling Particulate Emissions in EuropeA Framework to Estimate Reduction Potential and Control Costs” ; http://www.iiasa.ac.at/rains/reports/ir-02-076.pdf
• McElroy, M.W., Carr, R.C., Ensor, D.S., Markowski, G.R. (1982); “Size Distribution of Fine Particles from Coal Combustion”; Science, Vol. 215, No. 4528, 1 January 1982, pp. 13-19 (Polish)
• Marutzky, R. and Seeger, K., 1999: „Energie aus Holz und anderer Biomasse“; ISBN 3-87181-347-8, DRW-Verlag Weinbrenner (ed.), Leinfelden-Echtlingen, Germany
• VDI (1982) Richtlinie 2297:Emissionsminderung; Ölbefeurte Dampf- und Heisßwassererzeurger; 1982
• Nielsen M., Illerup J. B.; National Environmental Research Institute, Denmark; (2003) “Emission factors for CHP plants < 25MWe”; 4th JOINT UNECE Task Force & EIONET Workshop on Emission Inventories and Projections in Warsaw, Poland, 22-24 September, 2003
• Pacyna E., Pacyna J.M., J. Pirrone N. (2001); “European emissions of atmospheric mercury from anthropogenic sources in 1995”; Atmospheric Environment, vol. 35, no. 17, pp. 2987-2996 (10), June 2001
• Tullin C. and Johansson L. (2000). Particulate emissions from small-scale biomass combustion. Background paper for Nordic Seminar on Small Scale Wood Combustion, 17-18.2.2000, Naantali, Finland
• Williams A., Pourkashanian M., Jones J.M., Skorupska N., (2000); “Combustion and Gasification of Coal”, Taylor and Francis, New York, 2000
• Winiwarter, W. and Klimont, Z., (2005); “Co-ordinated international activities to abate European PM emissions” In: I. Obernberger and T. Brunner (ed.) Aerosols in Biomass Combustion. 6: 13-22. ISBN 3-9501980-2-4. University of Graz, Institute for Resource Efficient and Sustainable Systems., Graz, Austria
• www.fireplaceast.com; Fireplaces East; Russo Products. Inc. • www.hef.com.pl • www.mikrofill.com; Mikrofill Systems Limited • www.metalerg.pl; METALERG s.c. • www.romotop.cz • www.zamer.com.pl
19 RELEASE VERSION, DATE AND SOURCE
Version: 3.0 (Final)
Date: July 2004
Original authors: K.Kubica, B. Paradiz, P.Dilara, Z. Klimont, S. Kakareka, B. Debski
B216-56 December, 2006 Emission Inventory Guidebook
Substantially updated: K. Kubica 2006, with supplementary particulate matter details added by:
Mike Woodfield AEA Technology UK December 2006
20 POINT OF ENQUIRY
Panagiota Dilara: [email protected]
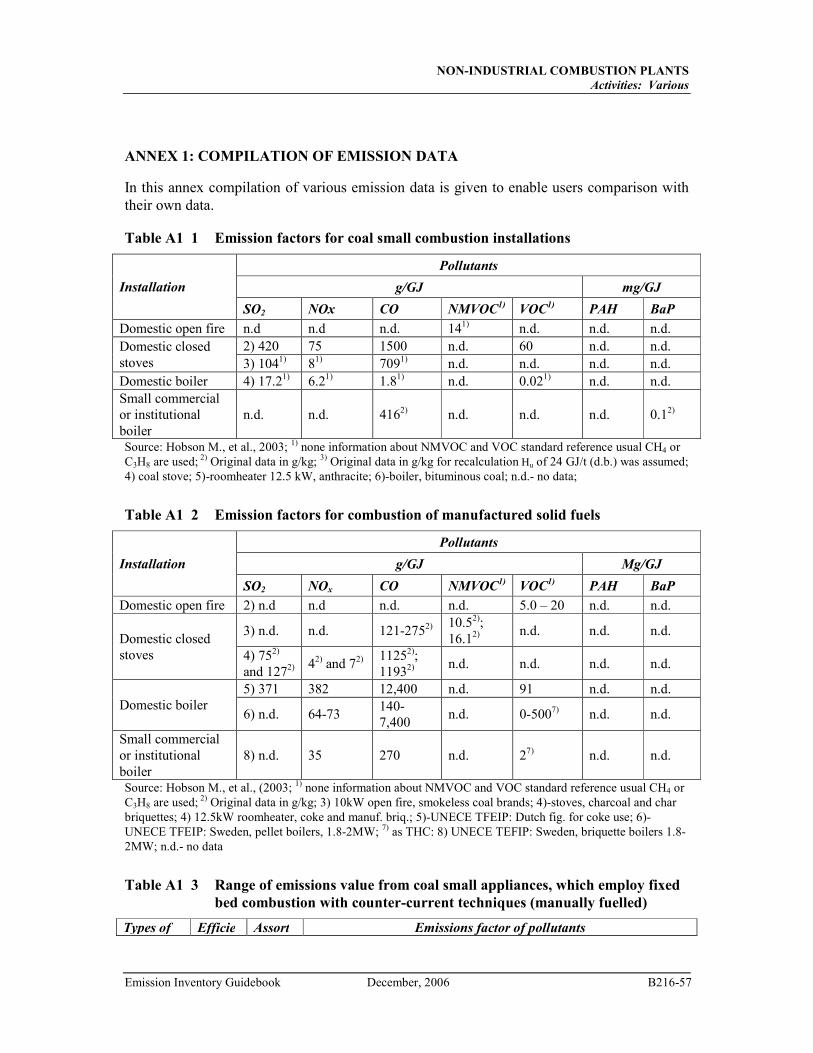
NON-INDUSTRIAL COMBUSTION PLANTS
Activities: Various
Emission Inventory Guidebook December, 2006 B216-57
ANNEX 1: COMPILATION OF EMISSION DATA
In this annex compilation of various emission data is given to enable users comparison with their own data.
Table A1 1 Emission factors for coal small combustion installations
Pollutants
g/GJ mg/GJ Installation
SO2 NOx CO NMVOC1)
VOC1)
PAH BaP
Domestic open fire n.d n.d n.d. 141) n.d. n.d. n.d. 2) 420 75 1500 n.d. 60 n.d. n.d. Domestic closed
stoves 3) 1041) 81) 7091) n.d. n.d. n.d. n.d. Domestic boiler 4) 17.21) 6.21) 1.81) n.d. 0.021) n.d. n.d. Small commercial or institutional boiler
n.d. n.d. 4162) n.d. n.d. n.d. 0.12)
Source: Hobson M., et al., 2003; 1) none information about NMVOC and VOC standard reference usual CH4 or C3H8 are used; 2) Original data in g/kg; 3) Original data in g/kg for recalculation Hu of 24 GJ/t (d.b.) was assumed; 4) coal stove; 5)-roomheater 12.5 kW, anthracite; 6)-boiler, bituminous coal; n.d.- no data;
Table A1 2 Emission factors for combustion of manufactured solid fuels
Pollutants
g/GJ Mg/GJ Installation
SO2 NOx CO NMVOC1)
VOC1)
PAH BaP
Domestic open fire 2) n.d n.d n.d. n.d. 5.0 – 20 n.d. n.d.
3) n.d. n.d. 121-2752) 10.52); 16.12) n.d. n.d. n.d.
Domestic closed stoves 4) 752)
and 1272) 42) and 72) 11252); 11932) n.d. n.d. n.d. n.d.
5) 371 382 12,400 n.d. 91 n.d. n.d. Domestic boiler
6) n.d. 64-73 140-7,400
n.d. 0-5007) n.d. n.d.
Small commercial or institutional boiler
8) n.d. 35 270 n.d. 27) n.d. n.d.
Source: Hobson M., et al., (2003; 1) none information about NMVOC and VOC standard reference usual CH4 or C3H8 are used; 2) Original data in g/kg; 3) 10kW open fire, smokeless coal brands; 4)-stoves, charcoal and char briquettes; 4) 12.5kW roomheater, coke and manuf. briq.; 5)-UNECE TFEIP: Dutch fig. for coke use; 6)-UNECE TFEIP: Sweden, pellet boilers, 1.8-2MW; 7) as THC: 8) UNECE TEFIP: Sweden, briquette boilers 1.8-2MW; n.d.- no data
Table A1 3 Range of emissions value from coal small appliances, which employ fixed
bed combustion with counter-current techniques (manually fuelled)
Types of Efficie Assort Emissions factor of pollutants
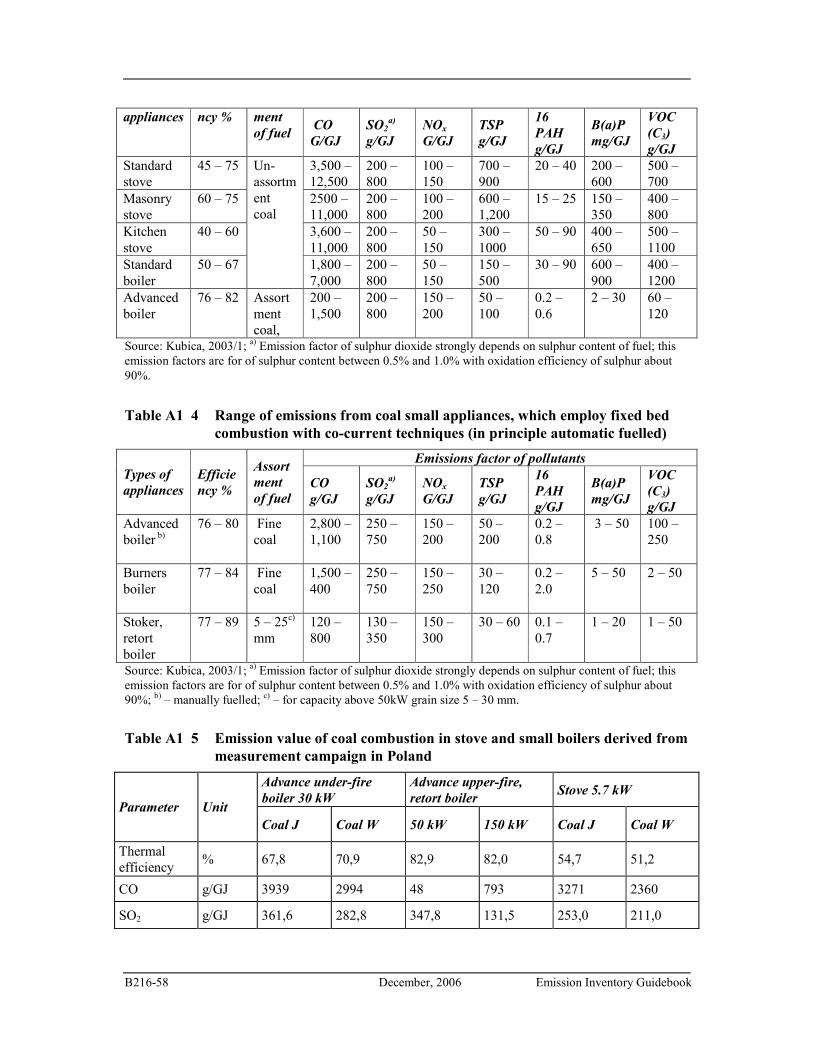
B216-58 December, 2006 Emission Inventory Guidebook
appliances ncy % ment
of fuel CO
G/GJ
SO2a)
g/GJ
NOx
G/GJ
TSP
g/GJ
16
PAH
g/GJ
B(a)P
mg/GJ
VOC
(C3)
g/GJ
Standard stove
45 – 75 3,500 – 12,500
200 – 800
100 – 150
700 – 900
20 – 40 200 – 600
500 – 700
Masonry stove
60 – 75 2500 – 11,000
200 – 800
100 – 200
600 – 1,200
15 – 25 150 –350
400 – 800
Kitchen stove
40 – 60 3,600 – 11,000
200 – 800
50 – 150
300 – 1000
50 – 90 400 –650
500 – 1100
Standard boiler
50 – 67
Un-assortment coal
1,800 – 7,000
200 –800
50 – 150
150 –500
30 – 90 600 – 900
400 – 1200
Advanced boiler
76 – 82 Assortment coal,
200 – 1,500
200 –800
150 – 200
50 – 100
0.2 – 0.6
2 – 30 60 – 120
Source: Kubica, 2003/1; a) Emission factor of sulphur dioxide strongly depends on sulphur content of fuel; this emission factors are for of sulphur content between 0.5% and 1.0% with oxidation efficiency of sulphur about 90%.
Table A1 4 Range of emissions from coal small appliances, which employ fixed bed
combustion with co-current techniques (in principle automatic fuelled)
Emissions factor of pollutants
Types of
appliances
Efficie
ncy %
Assort
ment
of fuel
CO
g/GJ
SO2a)
g/GJ
NOx
G/GJ
TSP
g/GJ
16
PAH
g/GJ
B(a)P
mg/GJ
VOC
(C3)
g/GJ
Advanced boiler b)
76 – 80 Fine coal
2,800 – 1,100
250 – 750
150 – 200
50 – 200
0.2 – 0.8
3 – 50 100 – 250
Burners boiler
77 – 84 Fine coal
1,500 – 400
250 – 750
150 – 250
30 – 120
0.2 – 2.0
5 – 50 2 – 50
Stoker, retort boiler
77 – 89 5 – 25c) mm
120 – 800
130 – 350
150 – 300
30 – 60 0.1 – 0.7
1 – 20 1 – 50
Source: Kubica, 2003/1; a) Emission factor of sulphur dioxide strongly depends on sulphur content of fuel; this emission factors are for of sulphur content between 0.5% and 1.0% with oxidation efficiency of sulphur about 90%; b) – manually fuelled; c) – for capacity above 50kW grain size 5 – 30 mm.
Table A1 5 Emission value of coal combustion in stove and small boilers derived from
measurement campaign in Poland
Advance under-fire
boiler 30 kW
Advance upper-fire,
retort boiler Stove 5.7 kW
Parameter Unit
Coal J Coal W 50 kW 150 kW Coal J Coal W
Thermal efficiency
% 67,8 70,9 82,9 82,0 54,7 51,2
CO g/GJ 3939 2994 48 793 3271 2360
SO2 g/GJ 361,6 282,8 347,8 131,5 253,0 211,0
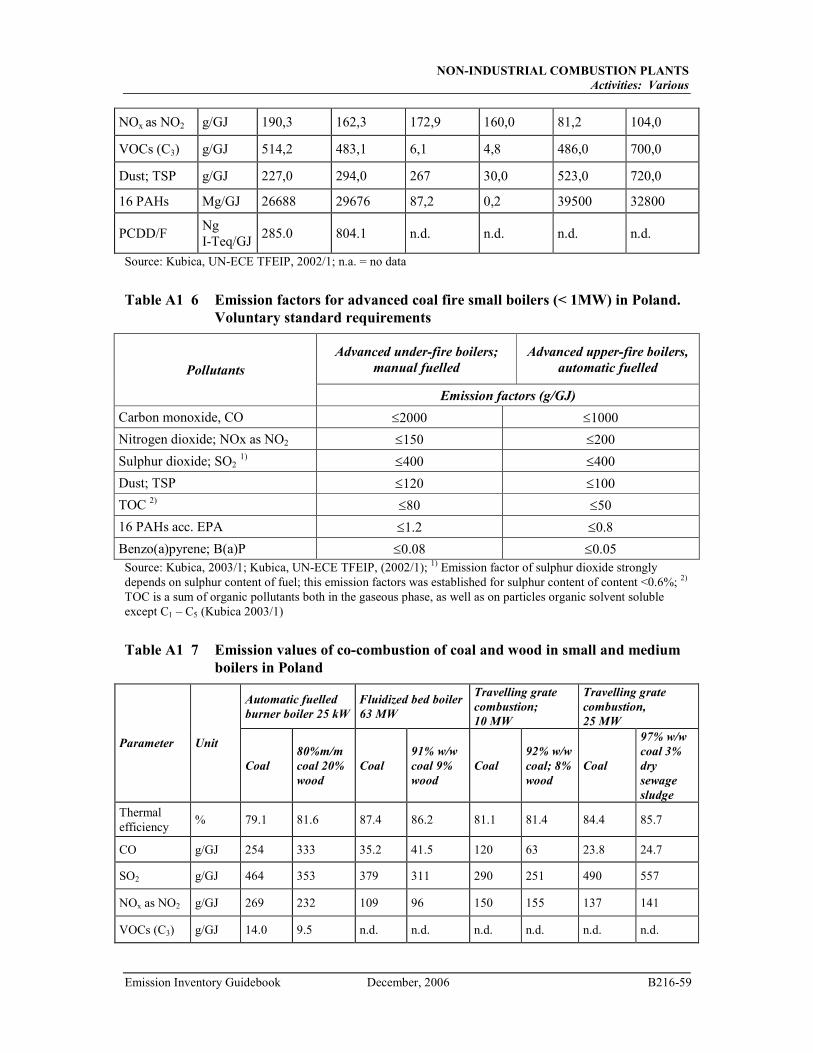
NON-INDUSTRIAL COMBUSTION PLANTS
Activities: Various
Emission Inventory Guidebook December, 2006 B216-59
NOx as NO2 g/GJ 190,3 162,3 172,9 160,0 81,2 104,0
VOCs (C3) g/GJ 514,2 483,1 6,1 4,8 486,0 700,0
Dust; TSP g/GJ 227,0 294,0 267 30,0 523,0 720,0
16 PAHs Mg/GJ 26688 29676 87,2 0,2 39500 32800
PCDD/F Ng I-Teq/GJ
285.0 804.1 n.d. n.d. n.d. n.d.
Source: Kubica, UN-ECE TFEIP, 2002/1; n.a. = no data
Table A1 6 Emission factors for advanced coal fire small boilers (< 1MW) in Poland.
Voluntary standard requirements
Advanced under-fire boilers;
manual fuelled
Advanced upper-fire boilers,
automatic fuelled Pollutants
Emission factors (g/GJ)
Carbon monoxide, CO ≤2000 ≤1000
Nitrogen dioxide; NOx as NO2 ≤150 ≤200
Sulphur dioxide; SO2 1)
≤400 ≤400
Dust; TSP ≤120 ≤100
TOC 2) ≤80 ≤50
16 PAHs acc. EPA ≤1.2 ≤0.8
Benzo(a)pyrene; B(a)P ≤0.08 ≤0.05 Source: Kubica, 2003/1; Kubica, UN-ECE TFEIP, (2002/1); 1) Emission factor of sulphur dioxide strongly depends on sulphur content of fuel; this emission factors was established for sulphur content of content <0.6%; 2) TOC is a sum of organic pollutants both in the gaseous phase, as well as on particles organic solvent soluble except C1 – C5 (Kubica 2003/1)
Table A1 7 Emission values of co-combustion of coal and wood in small and medium
boilers in Poland
Automatic fuelled
burner boiler 25 kW
Fluidized bed boiler
63 MW
Travelling grate
combustion;
10 MW
Travelling grate
combustion,
25 MW
Parameter Unit
Coal
80%m/m
coal 20%
wood
Coal
91% w/w
coal 9%
wood
Coal
92% w/w
coal; 8%
wood
Coal
97% w/w
coal 3%
dry
sewage
sludge
Thermal efficiency
% 79.1 81.6 87.4 86.2 81.1 81.4 84.4 85.7
CO g/GJ 254 333 35.2 41.5 120 63 23.8 24.7
SO2 g/GJ 464 353 379 311 290 251 490 557
NOx as NO2 g/GJ 269 232 109 96 150 155 137 141
VOCs (C3) g/GJ 14.0 9.5 n.d. n.d. n.d. n.d. n.d. n.d.
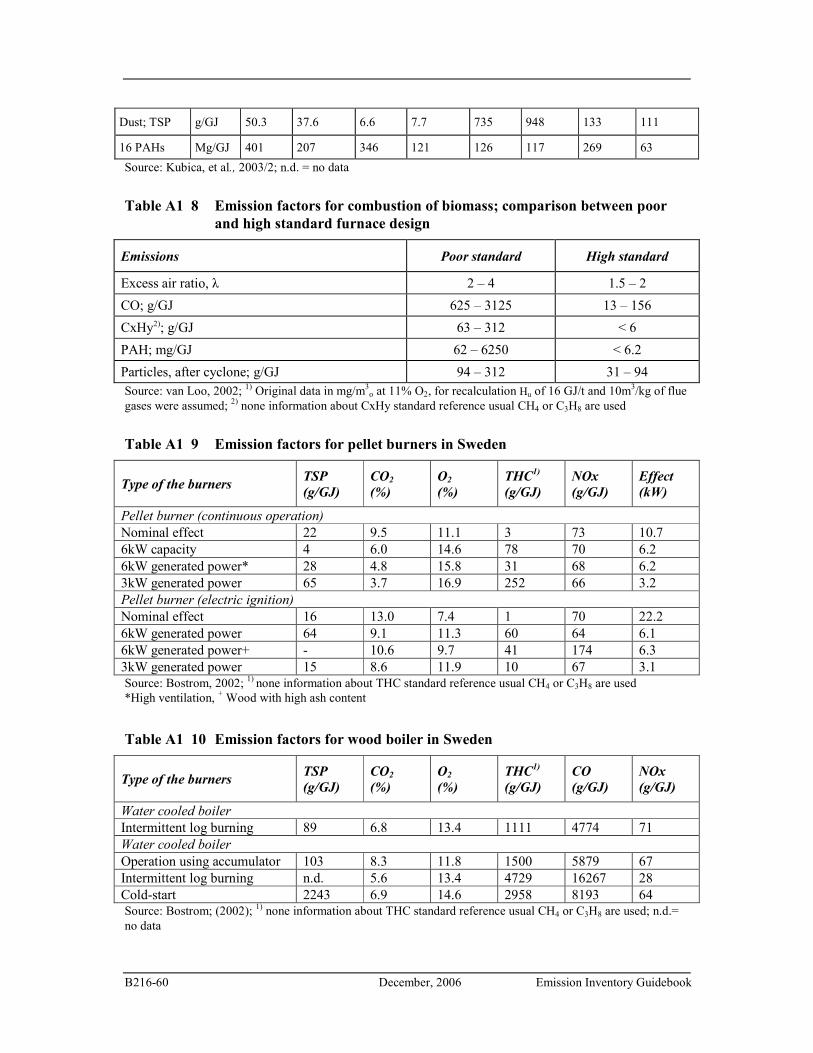
B216-60 December, 2006 Emission Inventory Guidebook
Dust; TSP g/GJ 50.3 37.6 6.6 7.7 735 948 133 111
16 PAHs Mg/GJ 401 207 346 121 126 117 269 63
Source: Kubica, et al., 2003/2; n.d. = no data
Table A1 8 Emission factors for combustion of biomass; comparison between poor
and high standard furnace design
Emissions Poor standard High standard
Excess air ratio, λ 2 – 4 1.5 – 2
CO; g/GJ 625 – 3125 13 – 156
CxHy2); g/GJ 63 – 312 < 6
PAH; mg/GJ 62 – 6250 < 6.2
Particles, after cyclone; g/GJ 94 – 312 31 – 94 Source: van Loo, 2002; 1) Original data in mg/m3
o at 11% O2, for recalculation Hu of 16 GJ/t and 10m3/kg of flue gases were assumed; 2) none information about CxHy standard reference usual CH4 or C3H8 are used
Table A1 9 Emission factors for pellet burners in Sweden
Type of the burners TSP
(g/GJ)
CO2
(%)
O2
(%)
THC1)
(g/GJ)
NOx
(g/GJ)
Effect
(kW)
Pellet burner (continuous operation) Nominal effect 22 9.5 11.1 3 73 10.7 6kW capacity 4 6.0 14.6 78 70 6.2 6kW generated power* 28 4.8 15.8 31 68 6.2 3kW generated power 65 3.7 16.9 252 66 3.2 Pellet burner (electric ignition) Nominal effect 16 13.0 7.4 1 70 22.2 6kW generated power 64 9.1 11.3 60 64 6.1 6kW generated power+ - 10.6 9.7 41 174 6.3 3kW generated power 15 8.6 11.9 10 67 3.1 Source: Bostrom, 2002; 1) none information about THC standard reference usual CH4 or C3H8 are used *High ventilation, + Wood with high ash content
Table A1 10 Emission factors for wood boiler in Sweden
Type of the burners TSP
(g/GJ)
CO2
(%)
O2
(%)
THC1)
(g/GJ)
CO
(g/GJ)
NOx
(g/GJ)
Water cooled boiler Intermittent log burning 89 6.8 13.4 1111 4774 71 Water cooled boiler Operation using accumulator 103 8.3 11.8 1500 5879 67 Intermittent log burning n.d. 5.6 13.4 4729 16267 28 Cold-start 2243 6.9 14.6 2958 8193 64 Source: Bostrom; (2002); 1) none information about THC standard reference usual CH4 or C3H8 are used; n.d.= no data
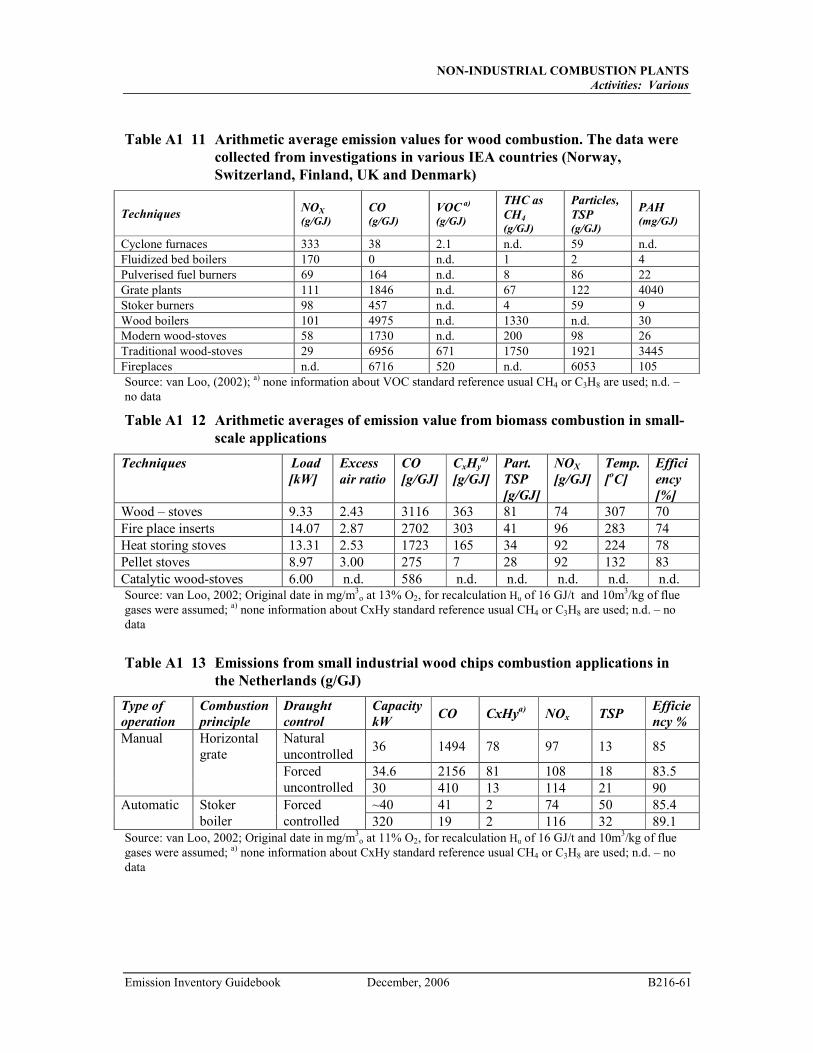
NON-INDUSTRIAL COMBUSTION PLANTS
Activities: Various
Emission Inventory Guidebook December, 2006 B216-61
Table A1 11 Arithmetic average emission values for wood combustion. The data were
collected from investigations in various IEA countries (Norway,
Switzerland, Finland, UK and Denmark)
Techniques NOX
(g/GJ) CO (g/GJ)
VOC a)
(g/GJ)
THC as
CH4
(g/GJ)
Particles,
TSP (g/GJ)
PAH
(mg/GJ)
Cyclone furnaces 333 38 2.1 n.d. 59 n.d. Fluidized bed boilers 170 0 n.d. 1 2 4 Pulverised fuel burners 69 164 n.d. 8 86 22 Grate plants 111 1846 n.d. 67 122 4040 Stoker burners 98 457 n.d. 4 59 9 Wood boilers 101 4975 n.d. 1330 n.d. 30 Modern wood-stoves 58 1730 n.d. 200 98 26 Traditional wood-stoves 29 6956 671 1750 1921 3445 Fireplaces n.d. 6716 520 n.d. 6053 105 Source: van Loo, (2002); a) none information about VOC standard reference usual CH4 or C3H8 are used; n.d. – no data
Table A1 12 Arithmetic averages of emission value from biomass combustion in small-
scale applications
Techniques Load
[kW]
Excess
air ratio
CO
[g/GJ]
CxHya)
[g/GJ]
Part.
TSP
[g/GJ]
NOX
[g/GJ]
Temp.
[oC]
Effici
ency
[%]
Wood – stoves 9.33 2.43 3116 363 81 74 307 70 Fire place inserts 14.07 2.87 2702 303 41 96 283 74 Heat storing stoves 13.31 2.53 1723 165 34 92 224 78 Pellet stoves 8.97 3.00 275 7 28 92 132 83 Catalytic wood-stoves 6.00 n.d. 586 n.d. n.d. n.d. n.d. n.d. Source: van Loo, 2002; Original date in mg/m3
o at 13% O2, for recalculation Hu of 16 GJ/t and 10m3/kg of flue gases were assumed; a) none information about CxHy standard reference usual CH4 or C3H8 are used; n.d. – no data
Table A1 13 Emissions from small industrial wood chips combustion applications in
the Netherlands (g/GJ)
Type of
operation
Combustion
principle
Draught
control
Capacity
kW CO CxHy
a) NOx TSP
Efficie
ncy %
Natural uncontrolled
36 1494 78 97 13 85
34.6 2156 81 108 18 83.5
Manual Horizontal grate
Forced uncontrolled 30 410 13 114 21 90
~40 41 2 74 50 85.4 Automatic Stoker boiler
Forced controlled 320 19 2 116 32 89.1
Source: van Loo, 2002; Original date in mg/m3o at 11% O2, for recalculation Hu of 16 GJ/t and 10m3/kg of flue
gases were assumed; a) none information about CxHy standard reference usual CH4 or C3H8 are used; n.d. – no data
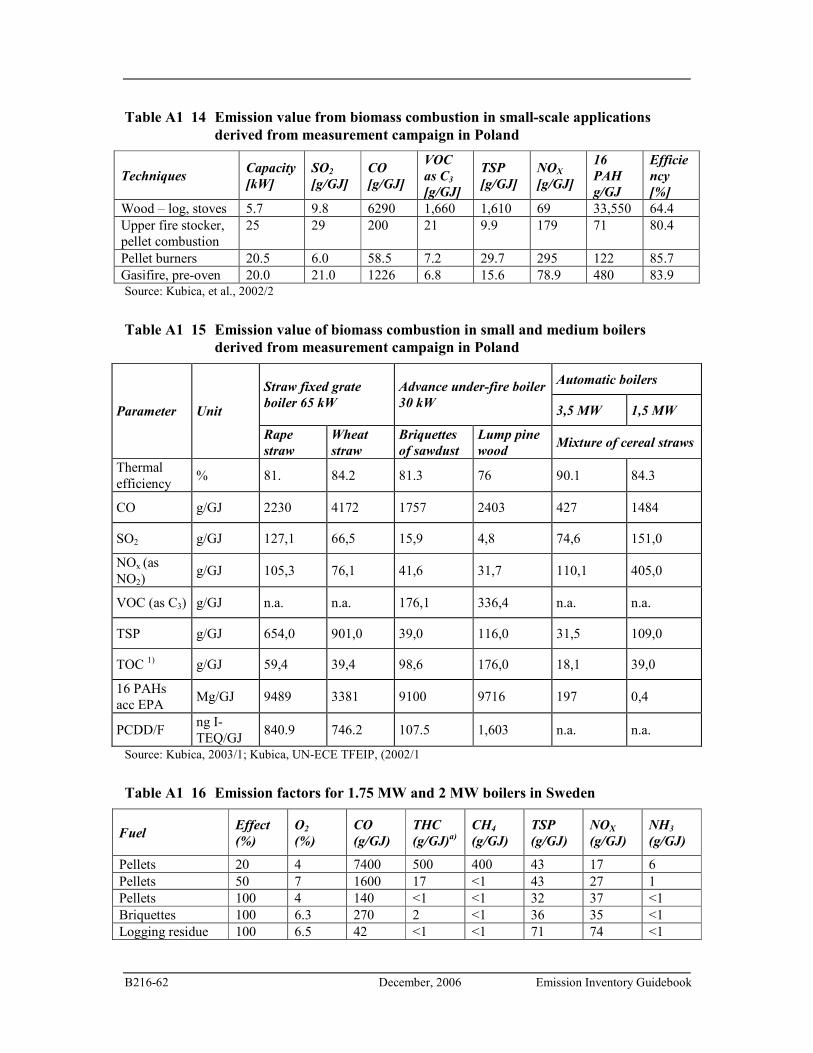
B216-62 December, 2006 Emission Inventory Guidebook
Table A1 14 Emission value from biomass combustion in small-scale applications
derived from measurement campaign in Poland
Techniques Capacity
[kW]
SO2
[g/GJ]
CO
[g/GJ]
VOC
as C3
[g/GJ]
TSP
[g/GJ]
NOX
[g/GJ]
16
PAH
g/GJ
Efficie
ncy
[%]
Wood – log, stoves 5.7 9.8 6290 1,660 1,610 69 33,550 64.4 Upper fire stocker, pellet combustion
25 29 200 21 9.9 179 71 80.4
Pellet burners 20.5 6.0 58.5 7.2 29.7 295 122 85.7 Gasifire, pre-oven 20.0 21.0 1226 6.8 15.6 78.9 480 83.9 Source: Kubica, et al., 2002/2
Table A1 15 Emission value of biomass combustion in small and medium boilers
derived from measurement campaign in Poland
Automatic boilers Straw fixed grate
boiler 65 kW
Advance under-fire boiler
30 kW 3,5 MW 1,5 MW Parameter Unit
Rape
straw
Wheat
straw
Briquettes
of sawdust
Lump pine
wood Mixture of cereal straws
Thermal efficiency
% 81. 84.2 81.3 76 90.1 84.3
CO g/GJ 2230 4172 1757 2403 427 1484
SO2 g/GJ 127,1 66,5 15,9 4,8 74,6 151,0
NOx (as NO2)
g/GJ 105,3 76,1 41,6 31,7 110,1 405,0
VOC (as C3) g/GJ n.a. n.a. 176,1 336,4 n.a. n.a.
TSP g/GJ 654,0 901,0 39,0 116,0 31,5 109,0
TOC 1) g/GJ 59,4 39,4 98,6 176,0 18,1 39,0
16 PAHs acc EPA
Mg/GJ 9489 3381 9100 9716 197 0,4
PCDD/F ng I-TEQ/GJ
840.9 746.2 107.5 1,603 n.a. n.a.
Source: Kubica, 2003/1; Kubica, UN-ECE TFEIP, (2002/1
Table A1 16 Emission factors for 1.75 MW and 2 MW boilers in Sweden
Fuel Effect
(%)
O2
(%)
CO
(g/GJ)
THC
(g/GJ)a)
CH4
(g/GJ)
TSP
(g/GJ)
NOX
(g/GJ)
NH3
(g/GJ)
Pellets 20 4 7400 500 400 43 17 6 Pellets 50 7 1600 17 <1 43 27 1 Pellets 100 4 140 <1 <1 32 37 <1 Briquettes 100 6.3 270 2 <1 36 35 <1 Logging residue 100 6.5 42 <1 <1 71 74 <1
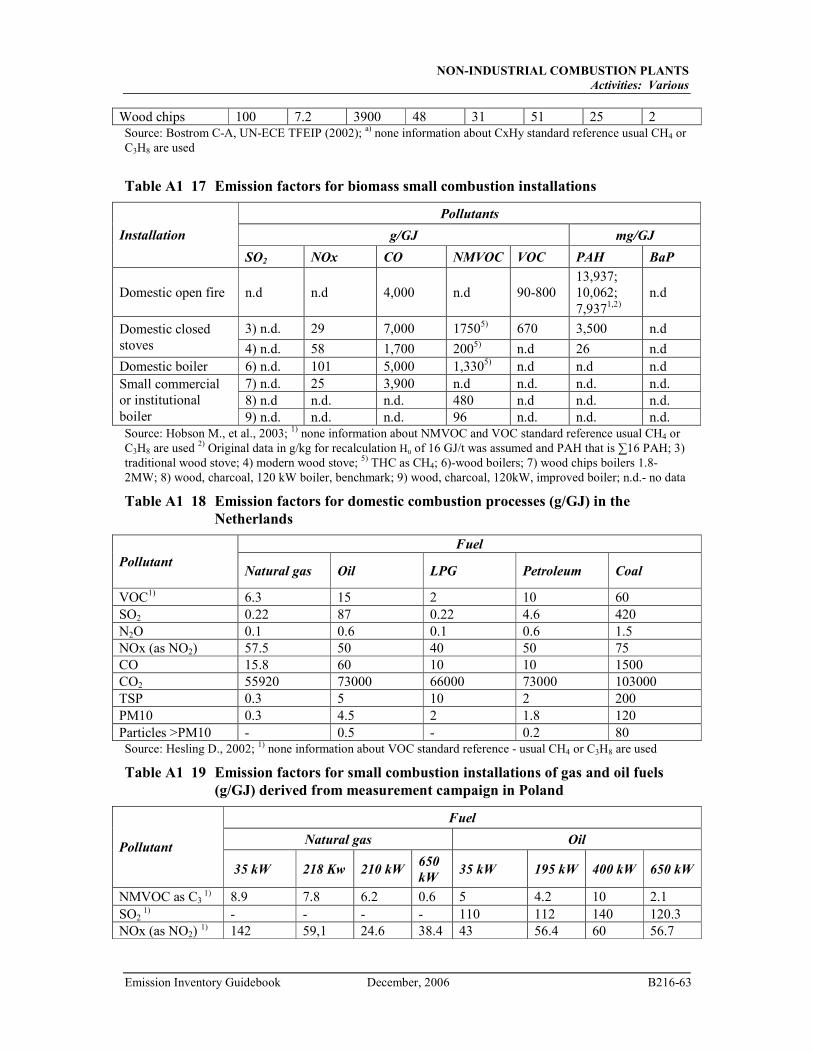
NON-INDUSTRIAL COMBUSTION PLANTS
Activities: Various
Emission Inventory Guidebook December, 2006 B216-63
Wood chips 100 7.2 3900 48 31 51 25 2 Source: Bostrom C-A, UN-ECE TFEIP (2002); a) none information about CxHy standard reference usual CH4 or C3H8 are used
Table A1 17 Emission factors for biomass small combustion installations
Pollutants
g/GJ mg/GJ Installation
SO2 NOx CO NMVOC
VOC
PAH BaP
Domestic open fire n.d n.d 4,000 n.d 90-800 13,937; 10,062; 7,9371,2)
n.d
3) n.d. 29 7,000 17505) 670 3,500 n.d Domestic closed stoves 4) n.d. 58 1,700 2005) n.d 26 n.d Domestic boiler 6) n.d. 101 5,000 1,3305) n.d n.d n.d
7) n.d. 25 3,900 n.d n.d. n.d. n.d. 8) n.d n.d. n.d. 480 n.d n.d. n.d.
Small commercial or institutional boiler 9) n.d. n.d. n.d. 96 n.d. n.d. n.d. Source: Hobson M., et al., 2003; 1) none information about NMVOC and VOC standard reference usual CH4 or C3H8 are used 2) Original data in g/kg for recalculation Hu of 16 GJ/t was assumed and PAH that is ∑16 PAH; 3) traditional wood stove; 4) modern wood stove; 5) THC as CH4; 6)-wood boilers; 7) wood chips boilers 1.8-2MW; 8) wood, charcoal, 120 kW boiler, benchmark; 9) wood, charcoal, 120kW, improved boiler; n.d.- no data
Table A1 18 Emission factors for domestic combustion processes (g/GJ) in the
Netherlands
Fuel
Pollutant Natural gas Oil LPG Petroleum Coal
VOC1) 6.3 15 2 10 60 SO2 0.22 87 0.22 4.6 420 N2O 0.1 0.6 0.1 0.6 1.5 NOx (as NO2) 57.5 50 40 50 75 CO 15.8 60 10 10 1500 CO2 55920 73000 66000 73000 103000 TSP 0.3 5 10 2 200 PM10 0.3 4.5 2 1.8 120 Particles >PM10 - 0.5 - 0.2 80 Source: Hesling D., 2002; 1) none information about VOC standard reference - usual CH4 or C3H8 are used
Table A1 19 Emission factors for small combustion installations of gas and oil fuels
(g/GJ) derived from measurement campaign in Poland
Fuel
Natural gas Oil Pollutant
35 kW 218 Kw 210 kW 650
kW 35 kW 195 kW 400 kW 650 kW
NMVOC as C3 1)
8.9 7.8 6.2 0.6 5 4.2 10 2.1 SO2
1) - - - - 110 112 140 120.3 NOx (as NO2)
1) 142 59,1 24.6 38.4 43 56.4 60 56.7
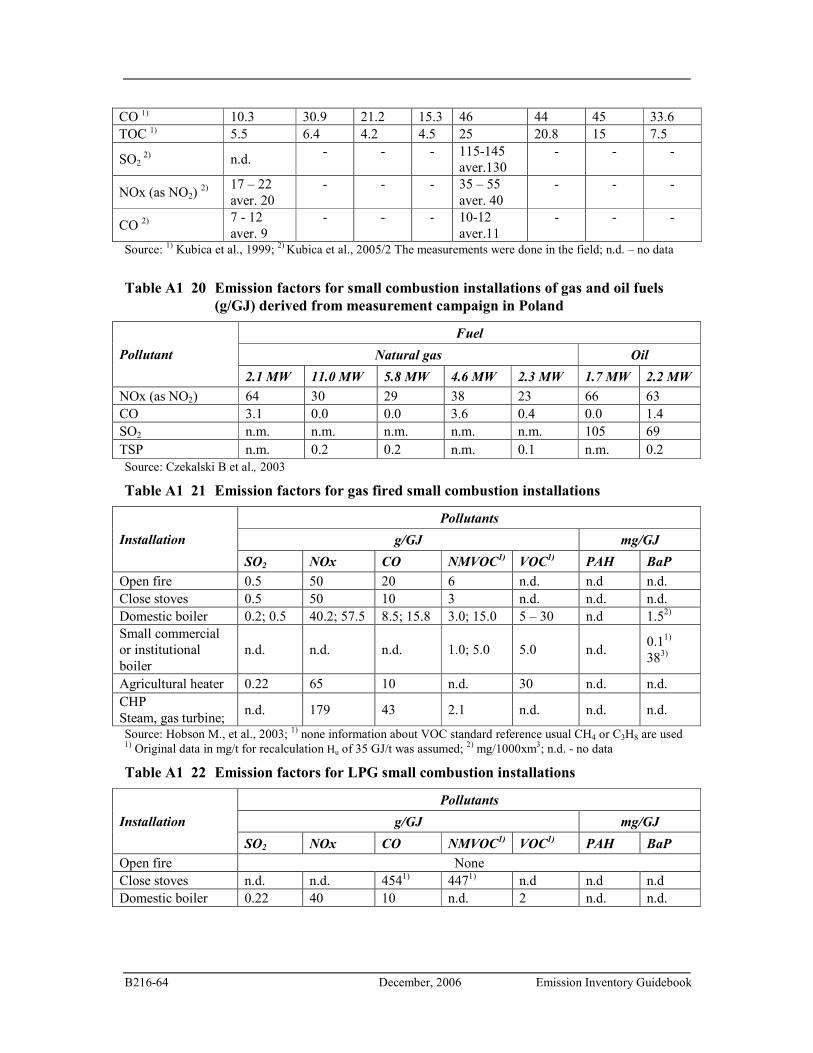
B216-64 December, 2006 Emission Inventory Guidebook
CO 1) 10.3 30.9 21.2 15.3 46 44 45 33.6 TOC 1) 5.5 6.4 4.2 4.5 25 20.8 15 7.5
SO2 2) n.d.
- - - 115-145 aver.130
- - -
NOx (as NO2) 2)
17 – 22 aver. 20
- - - 35 – 55 aver. 40
- - -
CO 2) 7 - 12 aver. 9
- - - 10-12 aver.11
- - -
Source: 1) Kubica et al., 1999; 2) Kubica et al., 2005/2 The measurements were done in the field; n.d. – no data
Table A1 20 Emission factors for small combustion installations of gas and oil fuels
(g/GJ) derived from measurement campaign in Poland
Fuel
Natural gas Oil Pollutant
2.1 MW 11.0 MW 5.8 MW 4.6 MW 2.3 MW 1.7 MW 2.2 MW
NOx (as NO2) 64 30 29 38 23 66 63 CO 3.1 0.0 0.0 3.6 0.4 0.0 1.4 SO2 n.m. n.m. n.m. n.m. n.m. 105 69 TSP n.m. 0.2 0.2 n.m. 0.1 n.m. 0.2 Source: Czekalski B et al., 2003
Table A1 21 Emission factors for gas fired small combustion installations
Pollutants
g/GJ mg/GJ Installation
SO2 NOx CO NMVOC1)
VOC1)
PAH BaP
Open fire 0.5 50 20 6 n.d. n.d n.d. Close stoves 0.5 50 10 3 n.d. n.d. n.d. Domestic boiler 0.2; 0.5 40.2; 57.5 8.5; 15.8 3.0; 15.0 5 – 30 n.d 1.52)
Small commercial or institutional boiler
n.d. n.d. n.d. 1.0; 5.0 5.0 n.d. 0.11) 383)
Agricultural heater 0.22 65 10 n.d. 30 n.d. n.d. CHP Steam, gas turbine;
n.d. 179 43 2.1 n.d. n.d. n.d.
Source: Hobson M., et al., 2003; 1) none information about VOC standard reference usual CH4 or C3H8 are used 1) Original data in mg/t for recalculation Hu of 35 GJ/t was assumed; 2) mg/1000xm3; n.d. - no data
Table A1 22 Emission factors for LPG small combustion installations
Pollutants
g/GJ mg/GJ Installation
SO2 NOx CO NMVOC1)
VOC1)
PAH BaP
Open fire None Close stoves n.d. n.d. 4541) 4471) n.d n.d n.d Domestic boiler 0.22 40 10 n.d. 2 n.d. n.d.
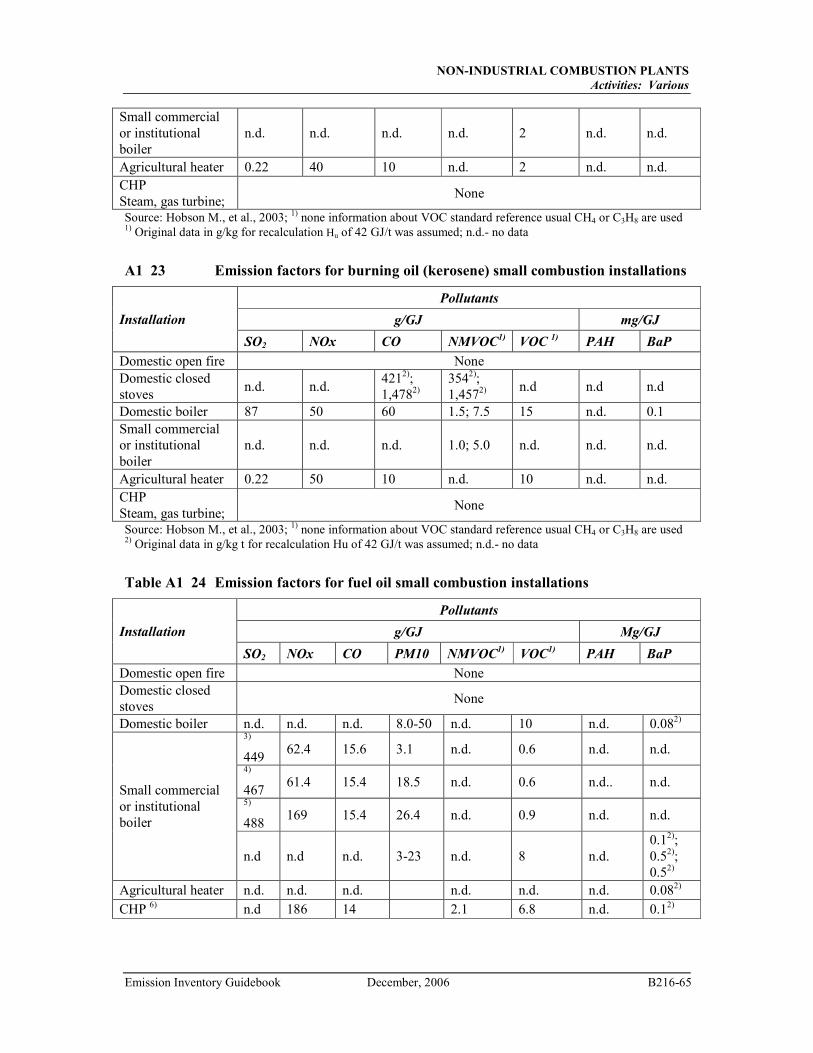
NON-INDUSTRIAL COMBUSTION PLANTS
Activities: Various
Emission Inventory Guidebook December, 2006 B216-65
Small commercial or institutional boiler
n.d. n.d. n.d. n.d. 2 n.d. n.d.
Agricultural heater 0.22 40 10 n.d. 2 n.d. n.d. CHP Steam, gas turbine;
None
Source: Hobson M., et al., 2003; 1) none information about VOC standard reference usual CH4 or C3H8 are used 1) Original data in g/kg for recalculation Hu of 42 GJ/t was assumed; n.d.- no data
A1 23 Emission factors for burning oil (kerosene) small combustion installations
Pollutants
g/GJ mg/GJ Installation
SO2 NOx CO NMVOC1)
VOC 1)
PAH BaP
Domestic open fire None Domestic closed stoves
n.d. n.d. 4212); 1,4782)
3542); 1,4572) n.d n.d n.d
Domestic boiler 87 50 60 1.5; 7.5 15 n.d. 0.1
Small commercial or institutional boiler
n.d. n.d. n.d. 1.0; 5.0 n.d. n.d. n.d.
Agricultural heater 0.22 50 10 n.d. 10 n.d. n.d. CHP Steam, gas turbine;
None
Source: Hobson M., et al., 2003; 1) none information about VOC standard reference usual CH4 or C3H8 are used 2) Original data in g/kg t for recalculation Hu of 42 GJ/t was assumed; n.d.- no data
Table A1 24 Emission factors for fuel oil small combustion installations
Pollutants
g/GJ Mg/GJ Installation
SO2 NOx CO PM10 NMVOC1)
VOC1)
PAH BaP
Domestic open fire None Domestic closed stoves
None
Domestic boiler n.d. n.d. n.d. 8.0-50 n.d. 10 n.d. 0.082)
3)
449 62.4 15.6 3.1 n.d. 0.6 n.d. n.d.
4)
467 61.4 15.4 18.5 n.d. 0.6 n.d.. n.d.
5)
488 169 15.4 26.4 n.d. 0.9 n.d. n.d.
Small commercial or institutional boiler
n.d n.d n.d. 3-23 n.d. 8 n.d. 0.12); 0.52); 0.52)
Agricultural heater n.d. n.d. n.d. n.d. n.d. n.d. 0.082)
CHP 6) n.d 186 14 2.1 6.8 n.d. 0.12)
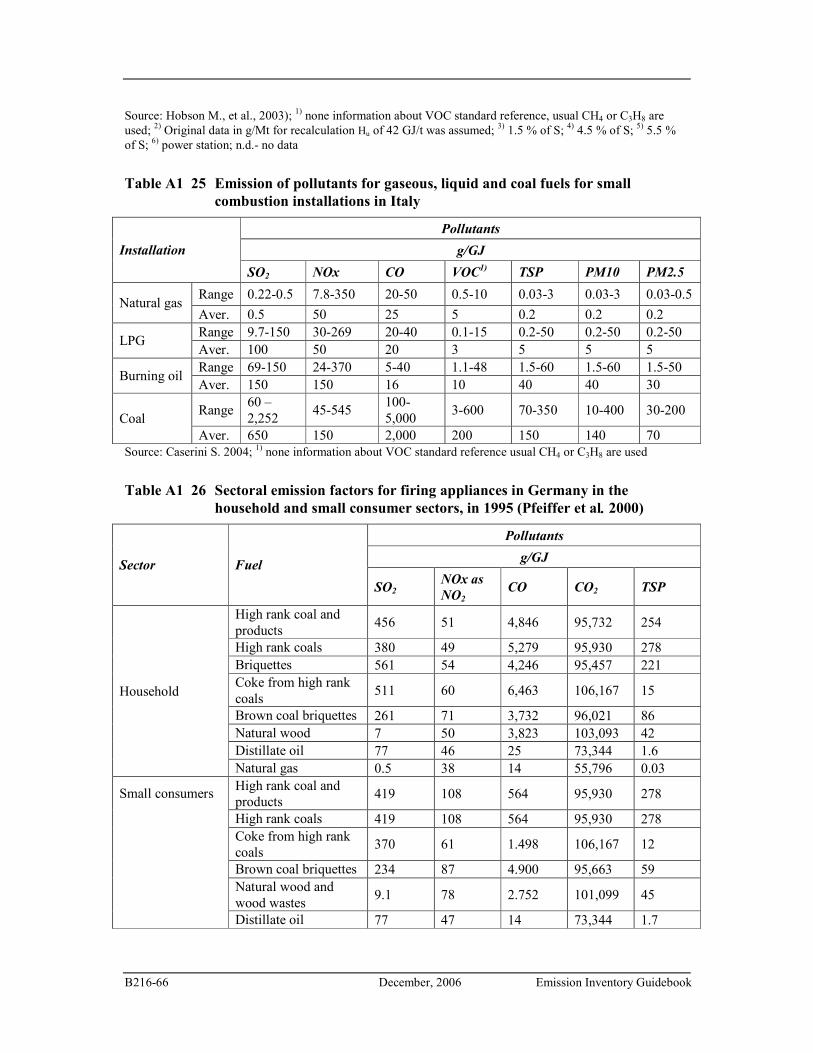
B216-66 December, 2006 Emission Inventory Guidebook
Source: Hobson M., et al., 2003); 1) none information about VOC standard reference, usual CH4 or C3H8 are used; 2) Original data in g/Mt for recalculation Hu of 42 GJ/t was assumed; 3) 1.5 % of S; 4) 4.5 % of S; 5) 5.5 % of S; 6) power station; n.d.- no data
Table A1 25 Emission of pollutants for gaseous, liquid and coal fuels for small
combustion installations in Italy
Pollutants
g/GJ Installation
SO2 NOx CO VOC1)
TSP PM10 PM2.5
Range 0.22-0.5 7.8-350 20-50 0.5-10 0.03-3 0.03-3 0.03-0.5 Natural gas
Aver. 0.5 50 25 5 0.2 0.2 0.2 Range 9.7-150 30-269 20-40 0.1-15 0.2-50 0.2-50 0.2-50
LPG Aver. 100 50 20 3 5 5 5 Range 69-150 24-370 5-40 1.1-48 1.5-60 1.5-60 1.5-50
Burning oil Aver. 150 150 16 10 40 40 30
Range 60 – 2,252
45-545 100-5,000
3-600 70-350 10-400 30-200 Coal
Aver. 650 150 2,000 200 150 140 70 Source: Caserini S. 2004; 1) none information about VOC standard reference usual CH4 or C3H8 are used
Table A1 26 Sectoral emission factors for firing appliances in Germany in the
household and small consumer sectors, in 1995 (Pfeiffer et al. 2000)
Pollutants
g/GJ Sector Fuel
SO2
NOx as
NO2
CO CO2 TSP
High rank coal and products
456 51 4,846 95,732 254
High rank coals 380 49 5,279 95,930 278 Briquettes 561 54 4,246 95,457 221 Coke from high rank coals
511 60 6,463 106,167 15
Brown coal briquettes 261 71 3,732 96,021 86 Natural wood 7 50 3,823 103,093 42 Distillate oil 77 46 25 73,344 1.6
Household
Natural gas 0.5 38 14 55,796 0.03 High rank coal and products
419 108 564 95,930 278
High rank coals 419 108 564 95,930 278 Coke from high rank coals
370 61 1.498 106,167 12
Brown coal briquettes 234 87 4.900 95,663 59 Natural wood and wood wastes
9.1 78 2.752 101,099 45
Small consumers
Distillate oil 77 47 14 73,344 1.7
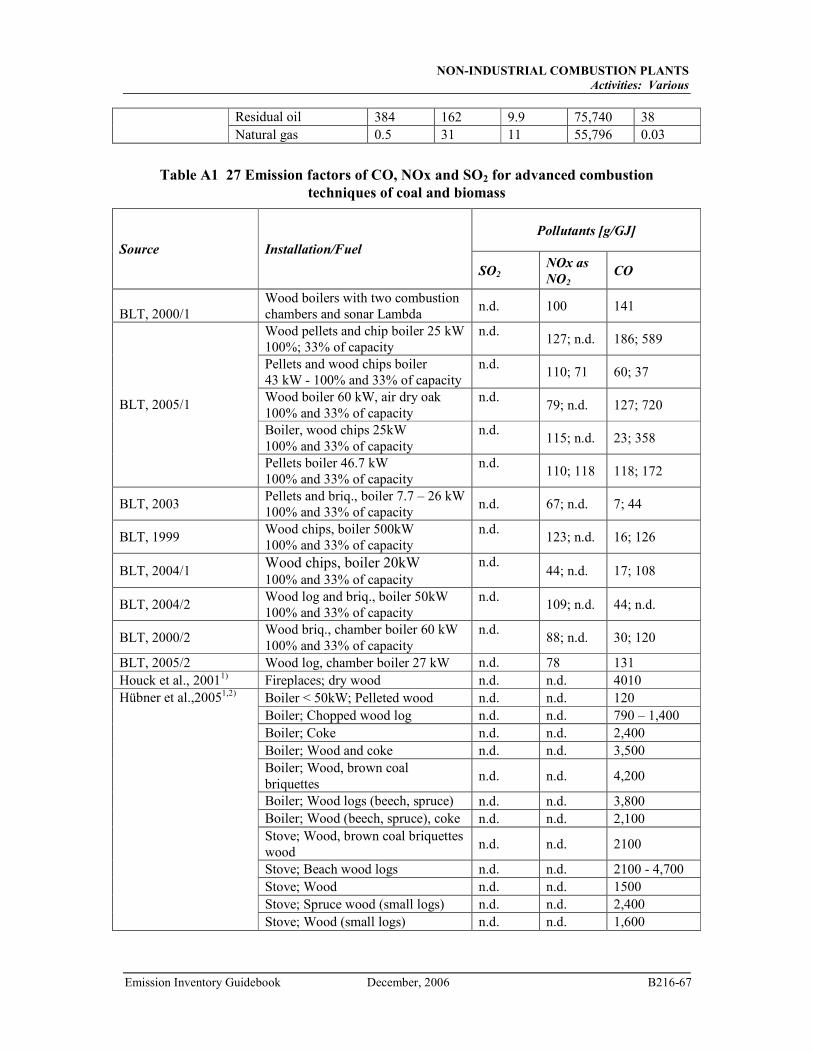
NON-INDUSTRIAL COMBUSTION PLANTS
Activities: Various
Emission Inventory Guidebook December, 2006 B216-67
Residual oil 384 162 9.9 75,740 38 Natural gas 0.5 31 11 55,796 0.03
Table A1 27 Emission factors of CO, NOx and SO2 for advanced combustion
techniques of coal and biomass
Pollutants [g/GJ]
Source Installation/Fuel
SO2
NOx as
NO2
CO
BLT, 2000/1
Wood boilers with two combustion chambers and sonar Lambda
n.d. 100 141
Wood pellets and chip boiler 25 kW 100%; 33% of capacity
n.d. 127; n.d. 186; 589
Pellets and wood chips boiler 43 kW - 100% and 33% of capacity
n.d. 110; 71 60; 37
Wood boiler 60 kW, air dry oak 100% and 33% of capacity
n.d. 79; n.d. 127; 720
Boiler, wood chips 25kW 100% and 33% of capacity
n.d. 115; n.d. 23; 358
BLT, 2005/1
Pellets boiler 46.7 kW 100% and 33% of capacity
n.d. 110; 118 118; 172
BLT, 2003 Pellets and briq., boiler 7.7 – 26 kW 100% and 33% of capacity
n.d. 67; n.d. 7; 44
BLT, 1999 Wood chips, boiler 500kW 100% and 33% of capacity
n.d. 123; n.d. 16; 126
BLT, 2004/1 Wood chips, boiler 20kW 100% and 33% of capacity
n.d. 44; n.d. 17; 108
BLT, 2004/2 Wood log and briq., boiler 50kW 100% and 33% of capacity
n.d. 109; n.d. 44; n.d.
BLT, 2000/2 Wood briq., chamber boiler 60 kW 100% and 33% of capacity
n.d. 88; n.d. 30; 120
BLT, 2005/2 Wood log, chamber boiler 27 kW n.d. 78 131 Houck et al., 20011) Fireplaces; dry wood n.d. n.d. 4010
Boiler < 50kW; Pelleted wood n.d. n.d. 120 Boiler; Chopped wood log n.d. n.d. 790 – 1,400 Boiler; Coke n.d. n.d. 2,400 Boiler; Wood and coke n.d. n.d. 3,500 Boiler; Wood, brown coal briquettes
n.d. n.d. 4,200
Boiler; Wood logs (beech, spruce) n.d. n.d. 3,800 Boiler; Wood (beech, spruce), coke n.d. n.d. 2,100 Stove; Wood, brown coal briquettes wood
n.d. n.d. 2100
Stove; Beach wood logs n.d. n.d. 2100 - 4,700 Stove; Wood n.d. n.d. 1500 Stove; Spruce wood (small logs) n.d. n.d. 2,400
Hübner et al.,20051,2)
Stove; Wood (small logs) n.d. n.d. 1,600
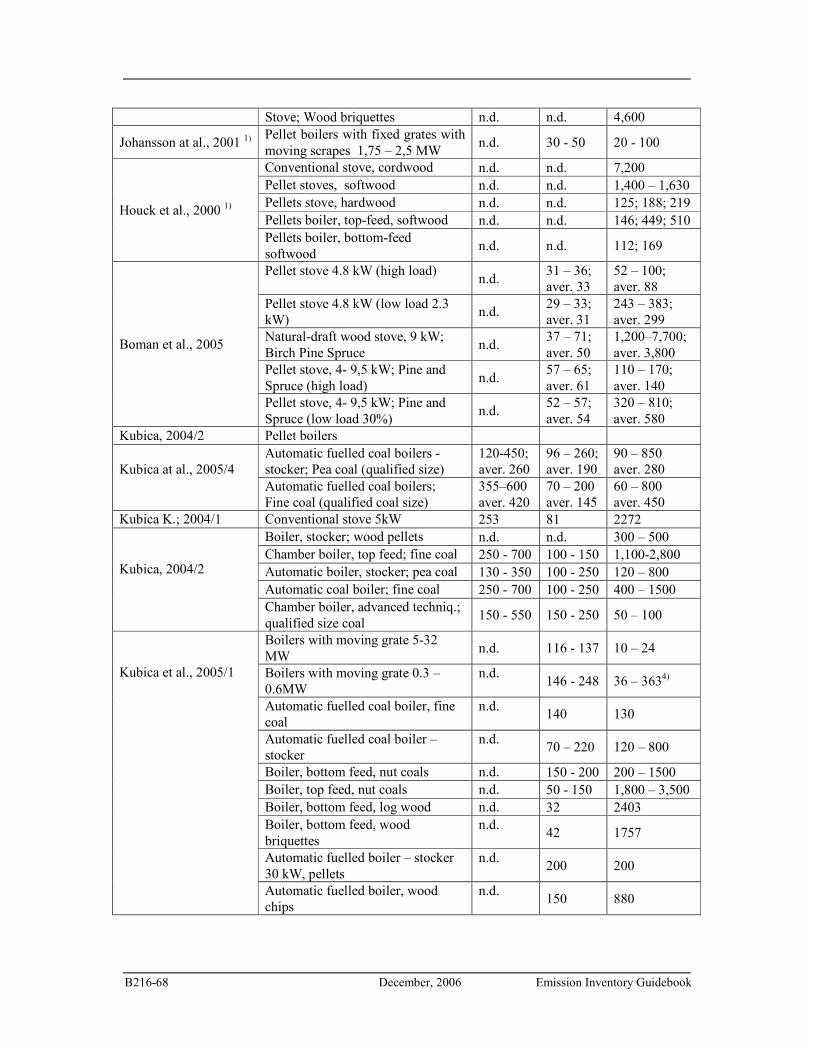
B216-68 December, 2006 Emission Inventory Guidebook
Stove; Wood briquettes n.d. n.d. 4,600
Johansson at al., 2001 1) Pellet boilers with fixed grates with moving scrapes 1,75 – 2,5 MW
n.d. 30 - 50 20 - 100
Conventional stove, cordwood n.d. n.d. 7,200 Pellet stoves, softwood n.d. n.d. 1,400 – 1,630 Pellets stove, hardwood n.d. n.d. 125; 188; 219 Pellets boiler, top-feed, softwood n.d. n.d. 146; 449; 510
Houck et al., 2000 1)
Pellets boiler, bottom-feed softwood
n.d. n.d. 112; 169
Pellet stove 4.8 kW (high load) n.d.
31 – 36; aver. 33
52 – 100; aver. 88
Pellet stove 4.8 kW (low load 2.3 kW)
n.d. 29 – 33; aver. 31
243 – 383; aver. 299
Natural-draft wood stove, 9 kW; Birch Pine Spruce
n.d. 37 – 71; aver. 50
1,200–7,700; aver. 3,800
Pellet stove, 4- 9,5 kW; Pine and Spruce (high load)
n.d. 57 – 65; aver. 61
110 – 170; aver. 140
Boman et al., 2005
Pellet stove, 4- 9,5 kW; Pine and Spruce (low load 30%)
n.d. 52 – 57; aver. 54
320 – 810; aver. 580
Kubica, 2004/2 Pellet boilers Automatic fuelled coal boilers - stocker; Pea coal (qualified size)
120-450; aver. 260
96 – 260; aver. 190
90 – 850 aver. 280
Kubica at al., 2005/4
Automatic fuelled coal boilers; Fine coal (qualified coal size)
355–600 aver. 420
70 – 200 aver. 145
60 – 800 aver. 450
Kubica K.; 2004/1 Conventional stove 5kW 253 81 2272 Boiler, stocker; wood pellets n.d. n.d. 300 – 500 Chamber boiler, top feed; fine coal 250 - 700 100 - 150 1,100-2,800 Automatic boiler, stocker; pea coal 130 - 350 100 - 250 120 – 800 Automatic coal boiler; fine coal 250 - 700 100 - 250 400 – 1500
Kubica, 2004/2
Chamber boiler, advanced techniq.; qualified size coal
150 - 550 150 - 250 50 – 100
Boilers with moving grate 5-32 MW
n.d. 116 - 137 10 – 24
Boilers with moving grate 0.3 – 0.6MW
n.d. 146 - 248 36 – 3634)
Automatic fuelled coal boiler, fine coal
n.d. 140 130
Automatic fuelled coal boiler – stocker
n.d. 70 – 220 120 – 800
Boiler, bottom feed, nut coals n.d. 150 - 200 200 – 1500 Boiler, top feed, nut coals n.d. 50 - 150 1,800 – 3,500 Boiler, bottom feed, log wood n.d. 32 2403 Boiler, bottom feed, wood briquettes
n.d. 42 1757
Automatic fuelled boiler – stocker 30 kW, pellets
n.d. 200 200
Kubica et al., 2005/1
Automatic fuelled boiler, wood chips
n.d. 150 880
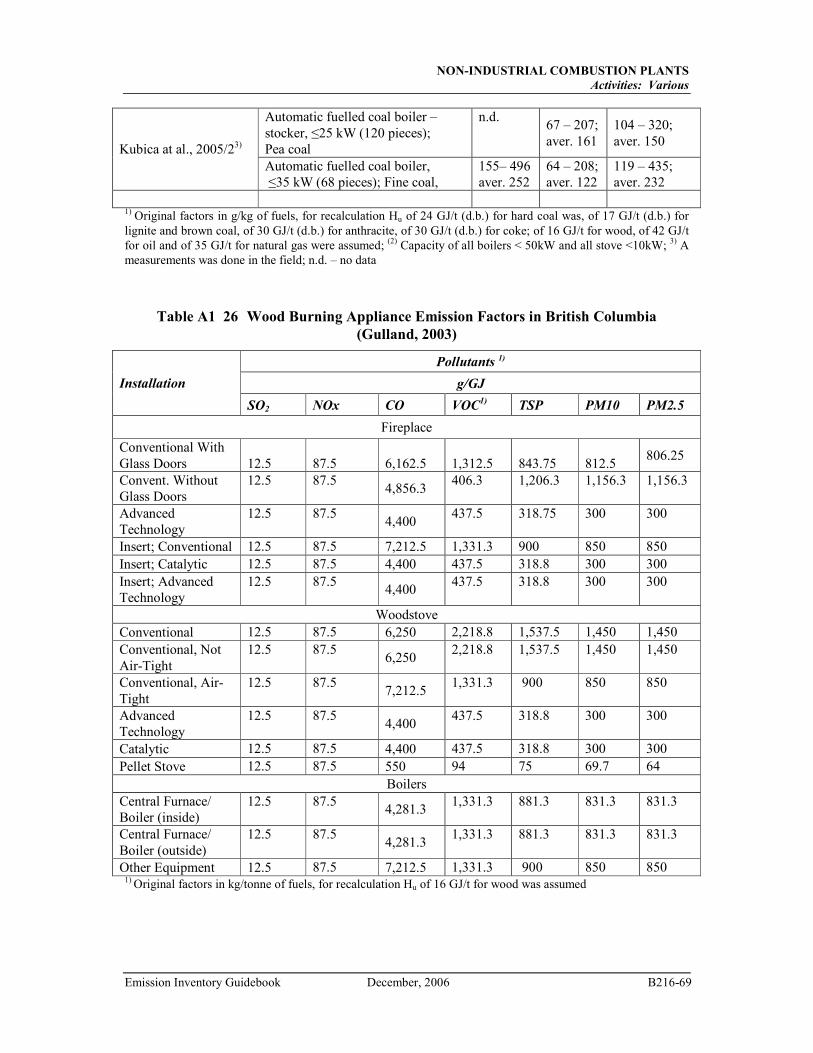
NON-INDUSTRIAL COMBUSTION PLANTS
Activities: Various
Emission Inventory Guidebook December, 2006 B216-69
Automatic fuelled coal boiler – stocker, ≤25 kW (120 pieces); Pea coal
n.d. 67 – 207; aver. 161
104 – 320; aver. 150
Kubica at al., 2005/23)
Automatic fuelled coal boiler, ≤35 kW (68 pieces); Fine coal,
155– 496 aver. 252
64 – 208; aver. 122
119 – 435; aver. 232
1) Original factors in g/kg of fuels, for recalculation Hu of 24 GJ/t (d.b.) for hard coal was, of 17 GJ/t (d.b.) for lignite and brown coal, of 30 GJ/t (d.b.) for anthracite, of 30 GJ/t (d.b.) for coke; of 16 GJ/t for wood, of 42 GJ/t for oil and of 35 GJ/t for natural gas were assumed; (2) Capacity of all boilers < 50kW and all stove <10kW; 3) A measurements was done in the field; n.d. – no data
Table A1 26 Wood Burning Appliance Emission Factors in British Columbia
(Gulland, 2003)
Pollutants 1)
g/GJ Installation
SO2 NOx CO VOC1)
TSP PM10 PM2.5
Fireplace
Conventional With Glass Doors
12.5
87.5
6,162.5
1,312.5
843.75
812.5
806.25
Convent. Without Glass Doors
12.5 87.5 4,856.3
406.3 1,206.3 1,156.3 1,156.3
Advanced Technology
12.5 87.5 4,400
437.5 318.75 300 300
Insert; Conventional 12.5 87.5 7,212.5 1,331.3 900 850 850 Insert; Catalytic 12.5 87.5 4,400 437.5 318.8 300 300 Insert; Advanced Technology
12.5 87.5 4,400
437.5 318.8 300 300
Woodstove Conventional 12.5 87.5 6,250 2,218.8 1,537.5 1,450 1,450 Conventional, Not Air-Tight
12.5 87.5 6,250
2,218.8 1,537.5 1,450 1,450
Conventional, Air-Tight
12.5 87.5 7,212.5
1,331.3 900 850 850
Advanced Technology
12.5 87.5 4,400
437.5 318.8 300 300
Catalytic 12.5 87.5 4,400 437.5 318.8 300 300 Pellet Stove 12.5 87.5 550 94 75 69.7 64
Boilers Central Furnace/ Boiler (inside)
12.5 87.5 4,281.3
1,331.3 881.3 831.3 831.3
Central Furnace/ Boiler (outside)
12.5 87.5 4,281.3
1,331.3 881.3 831.3 831.3
Other Equipment 12.5 87.5 7,212.5 1,331.3 900 850 850 1) Original factors in kg/tonne of fuels, for recalculation Hu of 16 GJ/t for wood was assumed
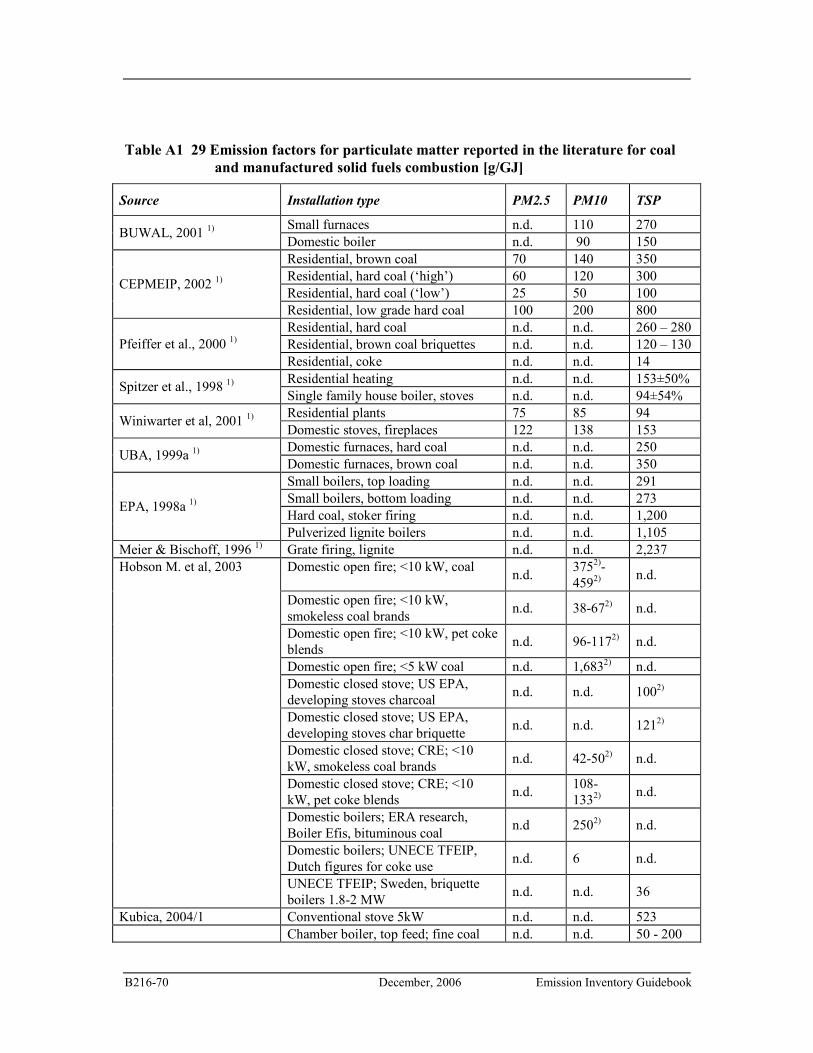
B216-70 December, 2006 Emission Inventory Guidebook
Table A1 29 Emission factors for particulate matter reported in the literature for coal
and manufactured solid fuels combustion [g/GJ]
Source Installation type PM2.5 PM10 TSP
Small furnaces n.d. 110 270 BUWAL, 2001 1)
Domestic boiler n.d. 90 150 Residential, brown coal 70 140 350 Residential, hard coal (‘high’) 60 120 300 Residential, hard coal (‘low’) 25 50 100
CEPMEIP, 2002 1)
Residential, low grade hard coal 100 200 800 Residential, hard coal n.d. n.d. 260 – 280 Residential, brown coal briquettes n.d. n.d. 120 – 130 Pfeiffer et al., 2000 1) Residential, coke n.d. n.d. 14 Residential heating n.d. n.d. 153±50%
Spitzer et al., 1998 1) Single family house boiler, stoves n.d. n.d. 94±54% Residential plants 75 85 94
Winiwarter et al, 2001 1) Domestic stoves, fireplaces 122 138 153 Domestic furnaces, hard coal n.d. n.d. 250
UBA, 1999a 1) Domestic furnaces, brown coal n.d. n.d. 350 Small boilers, top loading n.d. n.d. 291 Small boilers, bottom loading n.d. n.d. 273 Hard coal, stoker firing n.d. n.d. 1,200
EPA, 1998a 1)
Pulverized lignite boilers n.d. n.d. 1,105 Meier & Bischoff, 1996 1) Grate firing, lignite n.d. n.d. 2,237
Domestic open fire; <10 kW, coal n.d.
3752)-4592) n.d.
Domestic open fire; <10 kW, smokeless coal brands
n.d. 38-672) n.d.
Domestic open fire; <10 kW, pet coke blends
n.d. 96-1172) n.d.
Domestic open fire; <5 kW coal n.d. 1,6832) n.d. Domestic closed stove; US EPA, developing stoves charcoal
n.d. n.d. 1002)
Domestic closed stove; US EPA, developing stoves char briquette
n.d. n.d. 1212)
Domestic closed stove; CRE; <10 kW, smokeless coal brands
n.d. 42-502) n.d.
Domestic closed stove; CRE; <10 kW, pet coke blends
n.d. 108-1332)
n.d.
Domestic boilers; ERA research, Boiler Efis, bituminous coal
n.d 2502) n.d.
Domestic boilers; UNECE TFEIP, Dutch figures for coke use
n.d. 6 n.d.
Hobson M. et al, 2003
UNECE TFEIP; Sweden, briquette boilers 1.8-2 MW
n.d. n.d. 36
Kubica, 2004/1 Conventional stove 5kW n.d. n.d. 523 Chamber boiler, top feed; fine coal n.d. n.d. 50 - 200
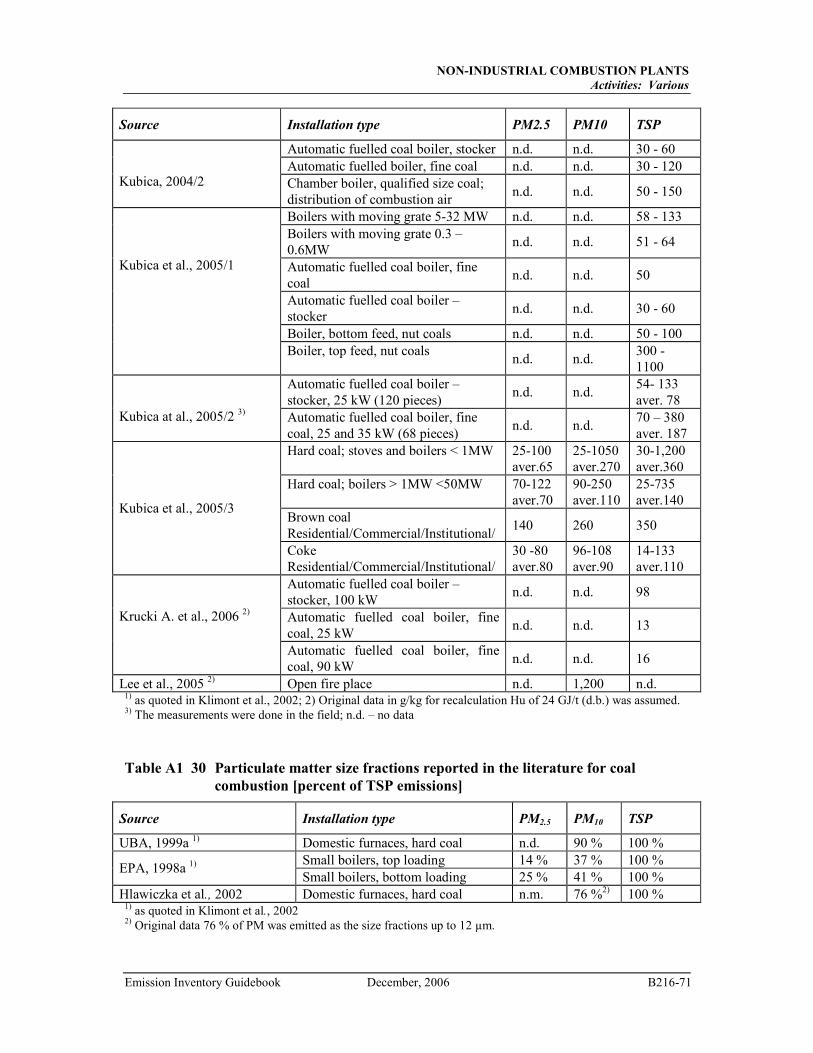
NON-INDUSTRIAL COMBUSTION PLANTS
Activities: Various
Emission Inventory Guidebook December, 2006 B216-71
Source Installation type PM2.5 PM10 TSP
Automatic fuelled coal boiler, stocker n.d. n.d. 30 - 60 Automatic fuelled boiler, fine coal n.d. n.d. 30 - 120
Kubica, 2004/2 Chamber boiler, qualified size coal;
distribution of combustion air n.d. n.d. 50 - 150
Boilers with moving grate 5-32 MW n.d. n.d. 58 - 133 Boilers with moving grate 0.3 – 0.6MW
n.d. n.d. 51 - 64
Automatic fuelled coal boiler, fine coal
n.d. n.d. 50
Automatic fuelled coal boiler – stocker
n.d. n.d. 30 - 60
Boiler, bottom feed, nut coals n.d. n.d. 50 - 100
Kubica et al., 2005/1
Boiler, top feed, nut coals n.d. n.d.
300 - 1100
Automatic fuelled coal boiler – stocker, 25 kW (120 pieces)
n.d. n.d. 54- 133 aver. 78
Kubica at al., 2005/2 3) Automatic fuelled coal boiler, fine
coal, 25 and 35 kW (68 pieces) n.d. n.d.
70 – 380 aver. 187
Hard coal; stoves and boilers < 1MW 25-100 aver.65
25-1050 aver.270
30-1,200 aver.360
Hard coal; boilers > 1MW <50MW 70-122 aver.70
90-250 aver.110
25-735 aver.140
Brown coal Residential/Commercial/Institutional/
140 260 350 Kubica et al., 2005/3
Coke Residential/Commercial/Institutional/
30 -80 aver.80
96-108 aver.90
14-133 aver.110
Automatic fuelled coal boiler – stocker, 100 kW
n.d. n.d. 98
Automatic fuelled coal boiler, fine coal, 25 kW
n.d. n.d. 13
Krucki A. et al., 2006 2)
Automatic fuelled coal boiler, fine coal, 90 kW
n.d. n.d. 16
Lee et al., 2005 2) Open fire place n.d. 1,200 n.d. 1) as quoted in Klimont et al., 2002; 2) Original data in g/kg for recalculation Hu of 24 GJ/t (d.b.) was assumed. 3) The measurements were done in the field; n.d. – no data
Table A1 30 Particulate matter size fractions reported in the literature for coal
combustion [percent of TSP emissions]
Source Installation type PM2.5 PM10 TSP
UBA, 1999a 1) Domestic furnaces, hard coal n.d. 90 % 100 % Small boilers, top loading 14 % 37 % 100 %
EPA, 1998a 1)
Small boilers, bottom loading 25 % 41 % 100 % Hlawiczka et al., 2002 Domestic furnaces, hard coal n.m. 76 %2) 100 %
1) as quoted in Klimont et al., 2002
2) Original data 76 % of PM was emitted as the size fractions up to 12 µm.
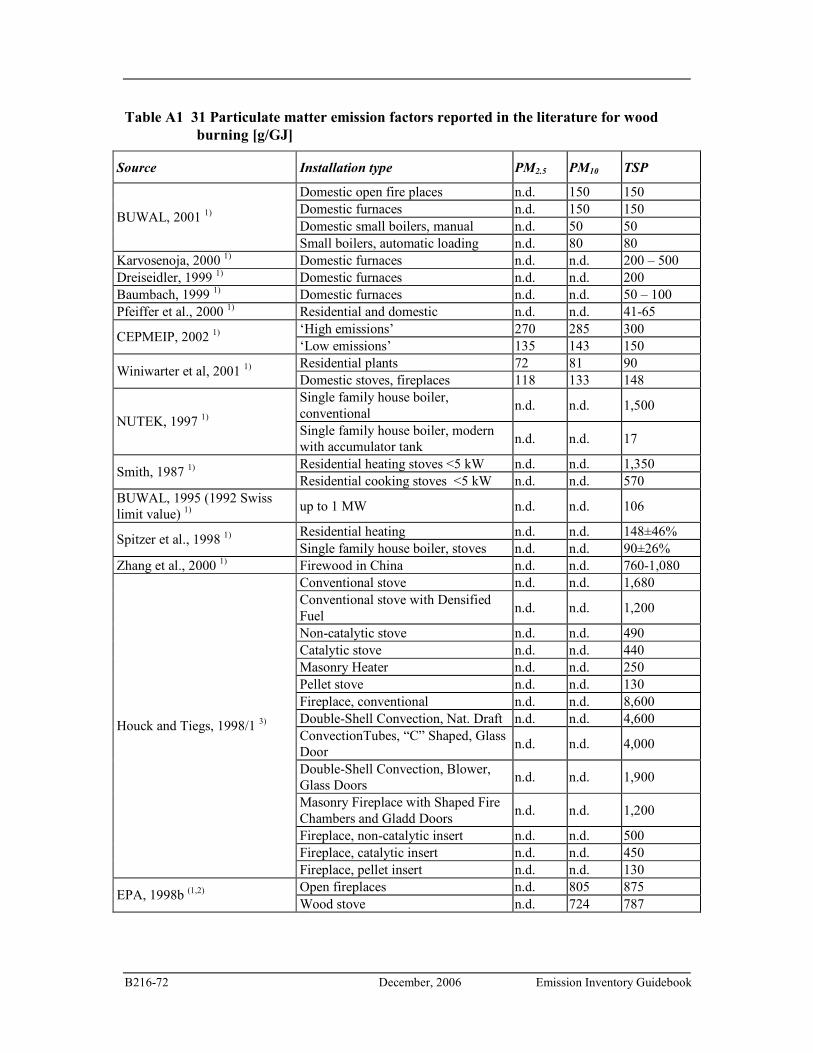
B216-72 December, 2006 Emission Inventory Guidebook
Table A1 31 Particulate matter emission factors reported in the literature for wood
burning [g/GJ]
Source Installation type PM2.5 PM10 TSP
Domestic open fire places n.d. 150 150 Domestic furnaces n.d. 150 150 Domestic small boilers, manual n.d. 50 50
BUWAL, 2001 1)
Small boilers, automatic loading n.d. 80 80 Karvosenoja, 2000 1) Domestic furnaces n.d. n.d. 200 – 500 Dreiseidler, 1999 1) Domestic furnaces n.d. n.d. 200 Baumbach, 1999 1) Domestic furnaces n.d. n.d. 50 – 100 Pfeiffer et al., 2000 1) Residential and domestic n.d. n.d. 41-65
‘High emissions’ 270 285 300 CEPMEIP, 2002 1)
‘Low emissions’ 135 143 150 Residential plants 72 81 90
Winiwarter et al, 2001 1)
Domestic stoves, fireplaces 118 133 148 Single family house boiler, conventional
n.d. n.d. 1,500 NUTEK, 1997 1)
Single family house boiler, modern with accumulator tank
n.d. n.d. 17
Residential heating stoves <5 kW n.d. n.d. 1,350 Smith, 1987 1)
Residential cooking stoves <5 kW n.d. n.d. 570 BUWAL, 1995 (1992 Swiss limit value) 1) up to 1 MW n.d. n.d. 106
Residential heating n.d. n.d. 148±46% Spitzer et al., 1998 1)
Single family house boiler, stoves n.d. n.d. 90±26% Zhang et al., 2000 1) Firewood in China n.d. n.d. 760-1,080
Conventional stove n.d. n.d. 1,680 Conventional stove with Densified Fuel
n.d. n.d. 1,200
Non-catalytic stove n.d. n.d. 490 Catalytic stove n.d. n.d. 440 Masonry Heater n.d. n.d. 250 Pellet stove n.d. n.d. 130 Fireplace, conventional n.d. n.d. 8,600 Double-Shell Convection, Nat. Draft n.d. n.d. 4,600 ConvectionTubes, “C” Shaped, Glass Door
n.d. n.d. 4,000
Double-Shell Convection, Blower, Glass Doors
n.d. n.d. 1,900
Masonry Fireplace with Shaped Fire Chambers and Gladd Doors
n.d. n.d. 1,200
Fireplace, non-catalytic insert n.d. n.d. 500 Fireplace, catalytic insert n.d. n.d. 450
Houck and Tiegs, 1998/1 3)
Fireplace, pellet insert n.d. n.d. 130 Open fireplaces n.d. 805 875
EPA, 1998b (1,2) Wood stove n.d. 724 787
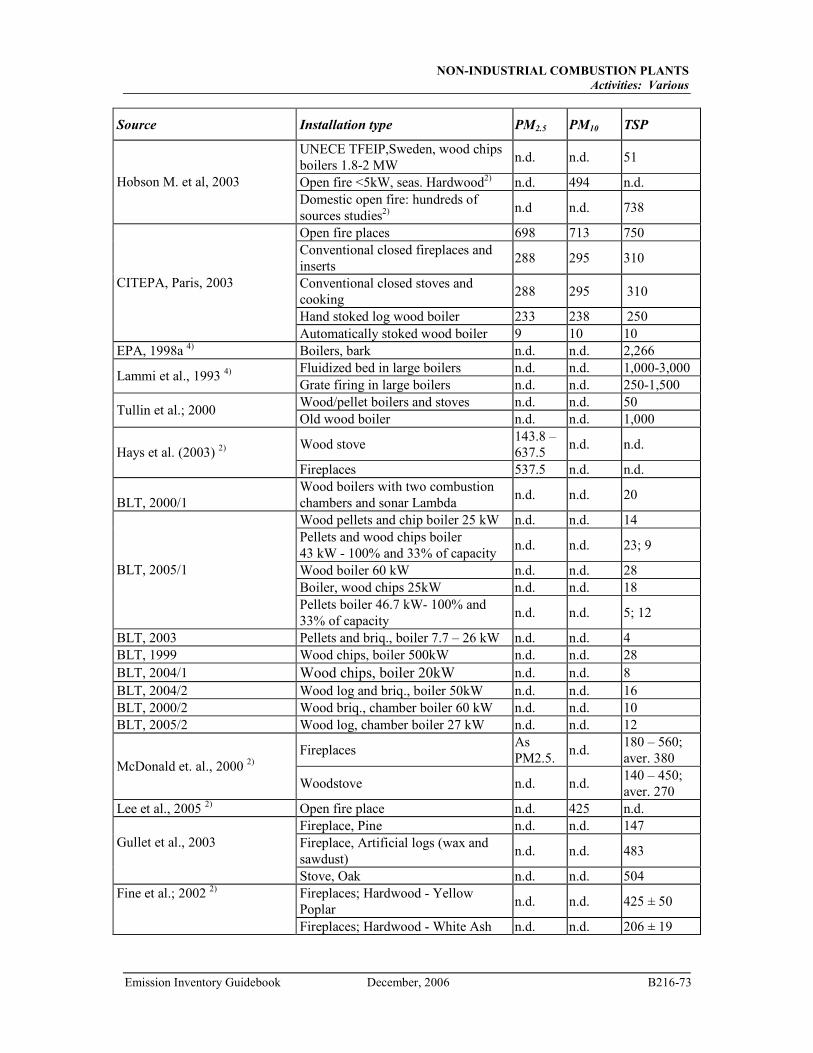
NON-INDUSTRIAL COMBUSTION PLANTS
Activities: Various
Emission Inventory Guidebook December, 2006 B216-73
Source Installation type PM2.5 PM10 TSP
UNECE TFEIP,Sweden, wood chips boilers 1.8-2 MW
n.d. n.d. 51
Open fire <5kW, seas. Hardwood2) n.d. 494 n.d. Hobson M. et al, 2003 Domestic open fire: hundreds of sources studies2)
n.d n.d. 738
Open fire places 698 713 750 Conventional closed fireplaces and inserts
288 295 310
Conventional closed stoves and cooking
288 295 310
Hand stoked log wood boiler 233 238 250
CITEPA, Paris, 2003
Automatically stoked wood boiler 9 10 10 EPA, 1998a 4) Boilers, bark n.d. n.d. 2,266
Fluidized bed in large boilers n.d. n.d. 1,000-3,000 Lammi et al., 1993 4)
Grate firing in large boilers n.d. n.d. 250-1,500 Wood/pellet boilers and stoves n.d. n.d. 50
Tullin et al.; 2000 Old wood boiler n.d. n.d. 1,000
Wood stove 143.8 – 637.5
n.d. n.d. Hays et al. (2003) 2)
Fireplaces 537.5 n.d. n.d. BLT, 2000/1
Wood boilers with two combustion chambers and sonar Lambda
n.d. n.d. 20
Wood pellets and chip boiler 25 kW n.d. n.d. 14 Pellets and wood chips boiler 43 kW - 100% and 33% of capacity
n.d. n.d. 23; 9
Wood boiler 60 kW n.d. n.d. 28 Boiler, wood chips 25kW n.d. n.d. 18
BLT, 2005/1
Pellets boiler 46.7 kW- 100% and 33% of capacity
n.d. n.d. 5; 12
BLT, 2003 Pellets and briq., boiler 7.7 – 26 kW n.d. n.d. 4 BLT, 1999 Wood chips, boiler 500kW n.d. n.d. 28 BLT, 2004/1 Wood chips, boiler 20kW n.d. n.d. 8 BLT, 2004/2 Wood log and briq., boiler 50kW n.d. n.d. 16 BLT, 2000/2 Wood briq., chamber boiler 60 kW n.d. n.d. 10 BLT, 2005/2 Wood log, chamber boiler 27 kW n.d. n.d. 12
Fireplaces As PM2.5.
n.d. 180 – 560; aver. 380
McDonald et. al., 2000 2) Woodstove n.d. n.d.
140 – 450; aver. 270
Lee et al., 2005 2) Open fire place n.d. 425 n.d. Fireplace, Pine n.d. n.d. 147 Fireplace, Artificial logs (wax and sawdust)
n.d. n.d. 483 Gullet et al., 2003
Stove, Oak n.d. n.d. 504 Fireplaces; Hardwood - Yellow Poplar
n.d. n.d. 425 ± 50 Fine et al.; 2002 2)
Fireplaces; Hardwood - White Ash n.d. n.d. 206 ± 19
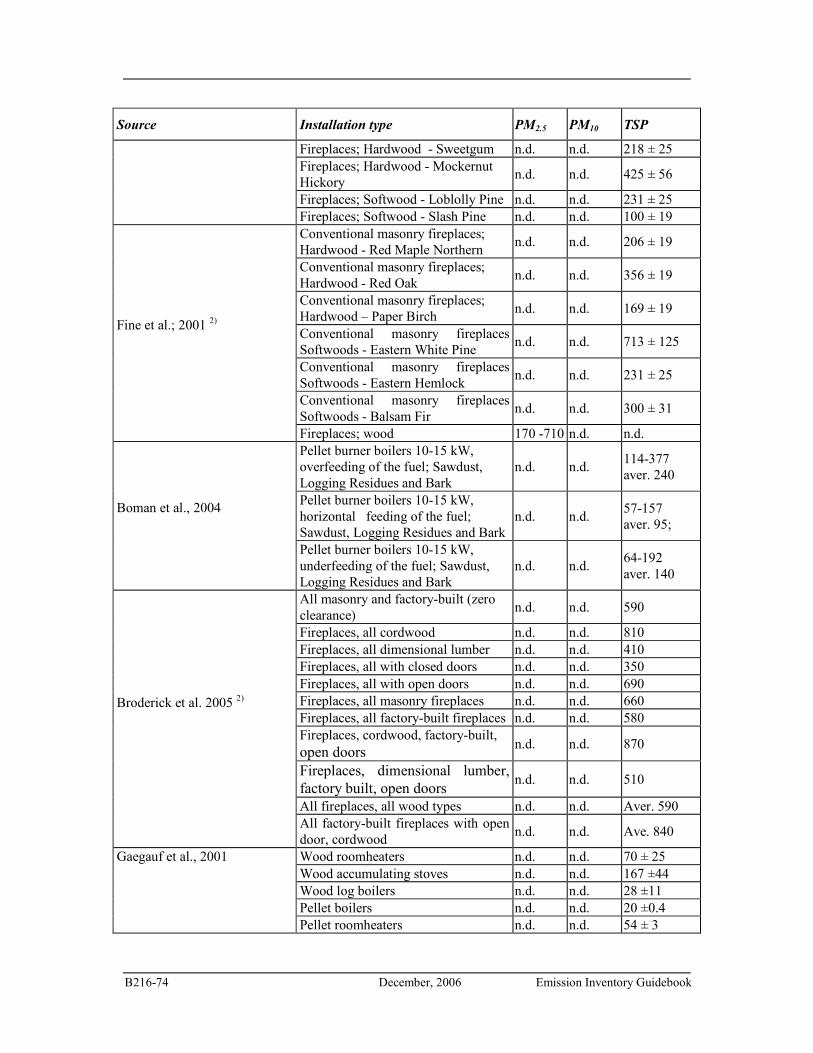
B216-74 December, 2006 Emission Inventory Guidebook
Source Installation type PM2.5 PM10 TSP
Fireplaces; Hardwood - Sweetgum n.d. n.d. 218 ± 25 Fireplaces; Hardwood - Mockernut Hickory
n.d. n.d. 425 ± 56
Fireplaces; Softwood - Loblolly Pine n.d. n.d. 231 ± 25
Fireplaces; Softwood - Slash Pine n.d. n.d. 100 ± 19 Conventional masonry fireplaces; Hardwood - Red Maple Northern
n.d. n.d. 206 ± 19
Conventional masonry fireplaces; Hardwood - Red Oak
n.d. n.d. 356 ± 19
Conventional masonry fireplaces; Hardwood – Paper Birch
n.d. n.d. 169 ± 19
Conventional masonry fireplaces Softwoods - Eastern White Pine
n.d. n.d. 713 ± 125
Conventional masonry fireplaces Softwoods - Eastern Hemlock
n.d. n.d. 231 ± 25
Conventional masonry fireplaces Softwoods - Balsam Fir
n.d. n.d. 300 ± 31
Fine et al.; 2001 2)
Fireplaces; wood 170 -710 n.d. n.d. Pellet burner boilers 10-15 kW, overfeeding of the fuel; Sawdust, Logging Residues and Bark
n.d. n.d. 114-377 aver. 240
Pellet burner boilers 10-15 kW, horizontal feeding of the fuel; Sawdust, Logging Residues and Bark
n.d. n.d. 57-157 aver. 95;
Boman et al., 2004
Pellet burner boilers 10-15 kW, underfeeding of the fuel; Sawdust, Logging Residues and Bark
n.d. n.d. 64-192 aver. 140
All masonry and factory-built (zero clearance)
n.d. n.d. 590
Fireplaces, all cordwood n.d. n.d. 810 Fireplaces, all dimensional lumber n.d. n.d. 410 Fireplaces, all with closed doors n.d. n.d. 350 Fireplaces, all with open doors n.d. n.d. 690 Fireplaces, all masonry fireplaces n.d. n.d. 660 Fireplaces, all factory-built fireplaces n.d. n.d. 580 Fireplaces, cordwood, factory-built, open doors
n.d. n.d. 870
Fireplaces, dimensional lumber, factory built, open doors
n.d. n.d. 510
All fireplaces, all wood types n.d. n.d. Aver. 590
Broderick et al. 2005 2)
All factory-built fireplaces with open door, cordwood
n.d. n.d. Ave. 840
Wood roomheaters n.d. n.d. 70 ± 25 Wood accumulating stoves n.d. n.d. 167 ±44 Wood log boilers n.d. n.d. 28 ±11 Pellet boilers n.d. n.d. 20 ±0.4
Gaegauf et al., 2001
Pellet roomheaters n.d. n.d. 54 ± 3
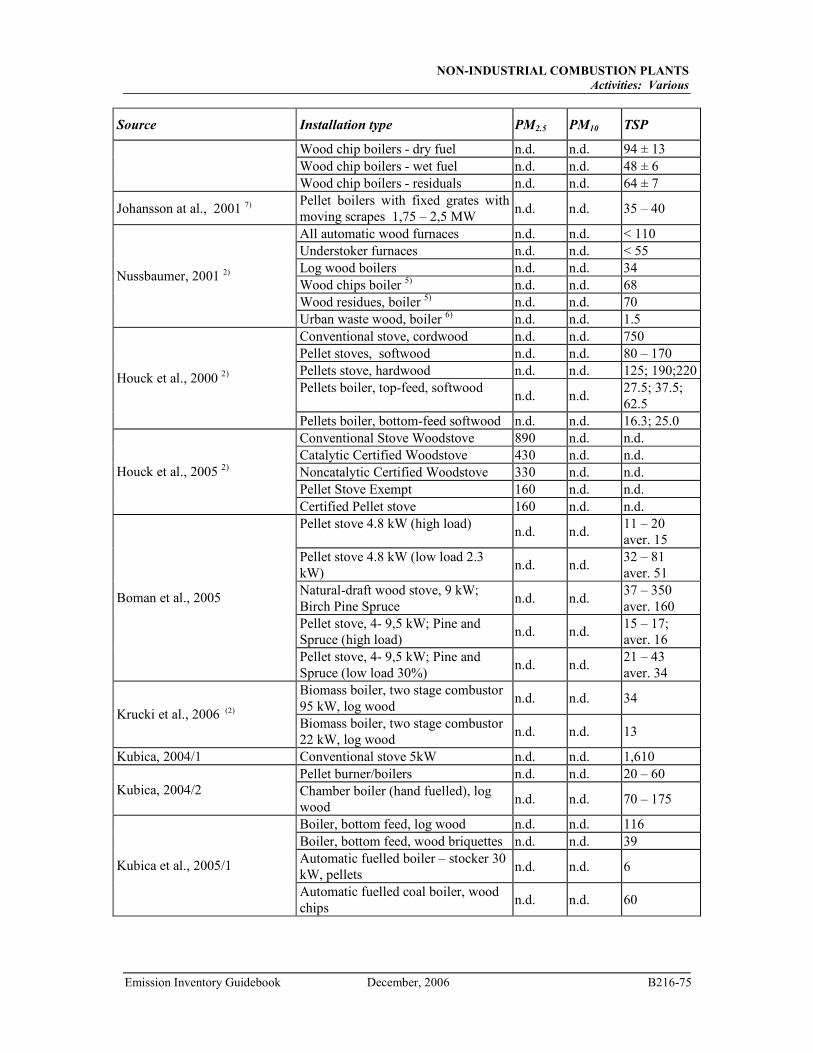
NON-INDUSTRIAL COMBUSTION PLANTS
Activities: Various
Emission Inventory Guidebook December, 2006 B216-75
Source Installation type PM2.5 PM10 TSP
Wood chip boilers - dry fuel n.d. n.d. 94 ± 13 Wood chip boilers - wet fuel n.d. n.d. 48 ± 6
Wood chip boilers - residuals n.d. n.d. 64 ± 7
Johansson at al., 2001 7) Pellet boilers with fixed grates with moving scrapes 1,75 – 2,5 MW
n.d. n.d. 35 – 40
All automatic wood furnaces n.d. n.d. < 110 Understoker furnaces n.d. n.d. < 55 Log wood boilers n.d. n.d. 34 Wood chips boiler 5) n.d. n.d. 68 Wood residues, boiler 5) n.d. n.d. 70
Nussbaumer, 2001 2)
Urban waste wood, boiler 6) n.d. n.d. 1.5 Conventional stove, cordwood n.d. n.d. 750 Pellet stoves, softwood n.d. n.d. 80 – 170 Pellets stove, hardwood n.d. n.d. 125; 190;220 Pellets boiler, top-feed, softwood
n.d. n.d. 27.5; 37.5; 62.5
Houck et al., 2000 2)
Pellets boiler, bottom-feed softwood n.d. n.d. 16.3; 25.0 Conventional Stove Woodstove 890 n.d. n.d. Catalytic Certified Woodstove 430 n.d. n.d. Noncatalytic Certified Woodstove 330 n.d. n.d. Pellet Stove Exempt 160 n.d. n.d.
Houck et al., 2005 2)
Certified Pellet stove 160 n.d. n.d. Pellet stove 4.8 kW (high load)
n.d. n.d. 11 – 20 aver. 15
Pellet stove 4.8 kW (low load 2.3 kW)
n.d. n.d. 32 – 81 aver. 51
Natural-draft wood stove, 9 kW; Birch Pine Spruce
n.d. n.d. 37 – 350 aver. 160
Pellet stove, 4- 9,5 kW; Pine and Spruce (high load)
n.d. n.d. 15 – 17; aver. 16
Boman et al., 2005
Pellet stove, 4- 9,5 kW; Pine and Spruce (low load 30%)
n.d. n.d. 21 – 43 aver. 34
Biomass boiler, two stage combustor 95 kW, log wood
n.d. n.d. 34 Krucki et al., 2006 (2)
Biomass boiler, two stage combustor 22 kW, log wood
n.d. n.d. 13
Kubica, 2004/1 Conventional stove 5kW n.d. n.d. 1,610 Pellet burner/boilers n.d. n.d. 20 – 60
Kubica, 2004/2
Chamber boiler (hand fuelled), log wood
n.d. n.d. 70 – 175
Boiler, bottom feed, log wood n.d. n.d. 116 Boiler, bottom feed, wood briquettes n.d. n.d. 39 Automatic fuelled boiler – stocker 30 kW, pellets
n.d. n.d. 6 Kubica et al., 2005/1
Automatic fuelled coal boiler, wood chips
n.d. n.d. 60
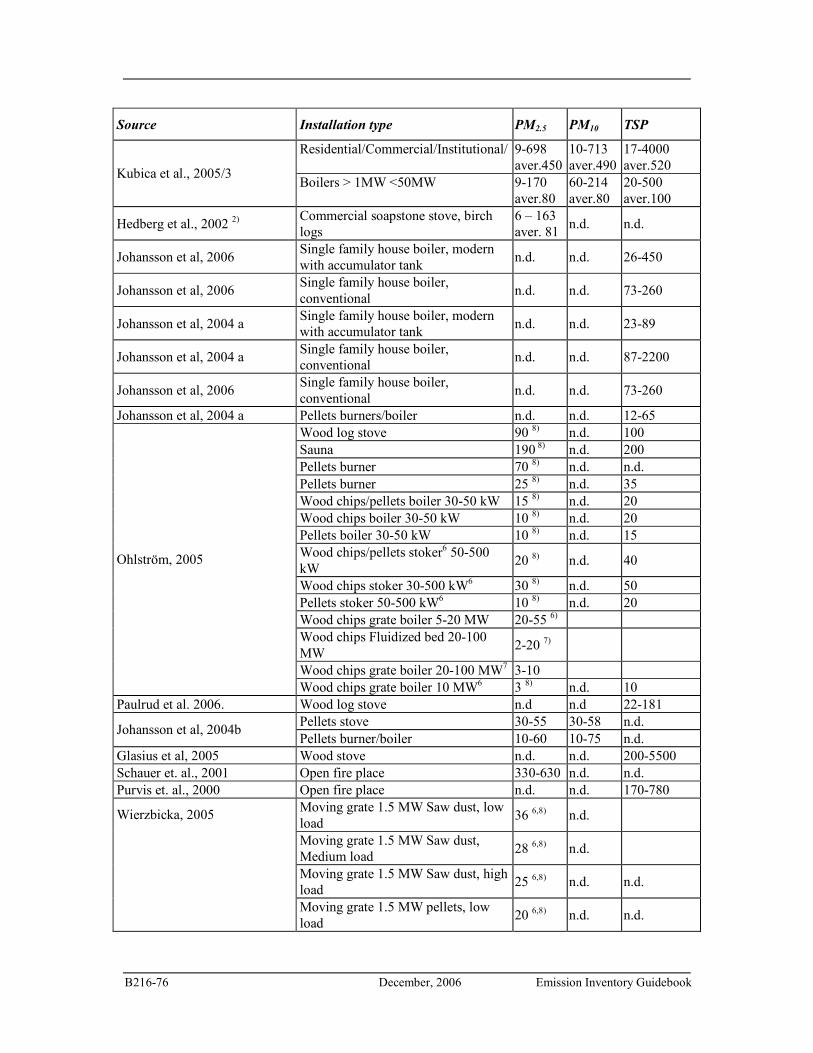
B216-76 December, 2006 Emission Inventory Guidebook
Source Installation type PM2.5 PM10 TSP
Residential/Commercial/Institutional/ 9-698 aver.450
10-713 aver.490
17-4000 aver.520
Kubica et al., 2005/3 Boilers > 1MW <50MW 9-170
aver.80 60-214 aver.80
20-500 aver.100
Hedberg et al., 2002 2) Commercial soapstone stove, birch logs
6 – 163 aver. 81
n.d. n.d.
Johansson et al, 2006 Single family house boiler, modern with accumulator tank
n.d. n.d. 26-450
Johansson et al, 2006 Single family house boiler, conventional
n.d. n.d. 73-260
Johansson et al, 2004 a Single family house boiler, modern with accumulator tank
n.d. n.d. 23-89
Johansson et al, 2004 a Single family house boiler, conventional
n.d. n.d. 87-2200
Johansson et al, 2006 Single family house boiler, conventional
n.d. n.d. 73-260
Johansson et al, 2004 a Pellets burners/boiler n.d. n.d. 12-65 Wood log stove 90 8) n.d. 100 Sauna 190 8) n.d. 200 Pellets burner 70 8) n.d. n.d. Pellets burner 25 8) n.d. 35 Wood chips/pellets boiler 30-50 kW 15 8) n.d. 20 Wood chips boiler 30-50 kW 10 8) n.d. 20 Pellets boiler 30-50 kW 10 8) n.d. 15 Wood chips/pellets stoker6 50-500 kW
20 8) n.d. 40
Wood chips stoker 30-500 kW6 30 8) n.d. 50 Pellets stoker 50-500 kW6 10 8) n.d. 20 Wood chips grate boiler 5-20 MW 20-55 6) Wood chips Fluidized bed 20-100 MW
2-20 7)
Wood chips grate boiler 20-100 MW7 3-10
Ohlström, 2005
Wood chips grate boiler 10 MW6 3 8) n.d. 10 Paulrud et al. 2006. Wood log stove n.d n.d 22-181
Pellets stove 30-55 30-58 n.d. Johansson et al, 2004b
Pellets burner/boiler 10-60 10-75 n.d. Glasius et al, 2005 Wood stove n.d. n.d. 200-5500 Schauer et. al., 2001 Open fire place 330-630 n.d. n.d. Purvis et. al., 2000 Open fire place n.d. n.d. 170-780
Moving grate 1.5 MW Saw dust, low load
36 6,8) n.d.
Moving grate 1.5 MW Saw dust, Medium load
28 6,8) n.d.
Moving grate 1.5 MW Saw dust, high load
25 6,8) n.d. n.d.
Wierzbicka, 2005
Moving grate 1.5 MW pellets, low load
20 6,8) n.d. n.d.
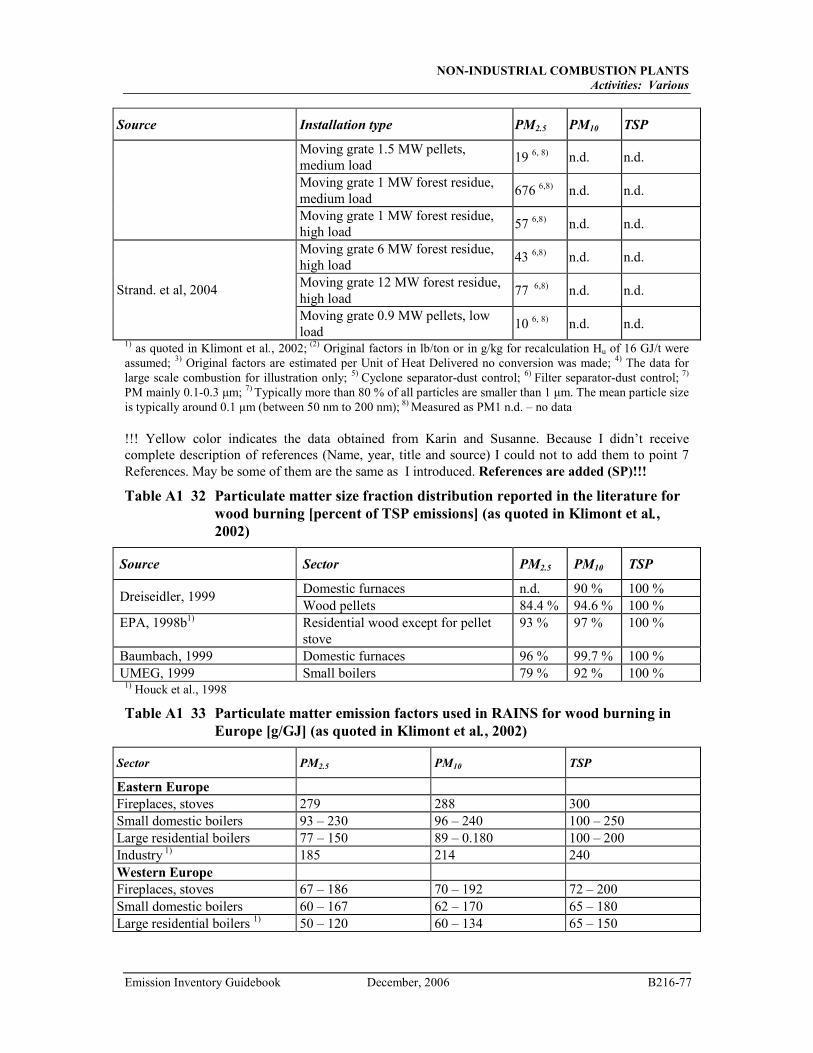
NON-INDUSTRIAL COMBUSTION PLANTS
Activities: Various
Emission Inventory Guidebook December, 2006 B216-77
Source Installation type PM2.5 PM10 TSP
Moving grate 1.5 MW pellets, medium load
19 6, 8) n.d. n.d.
Moving grate 1 MW forest residue, medium load
676 6,8) n.d. n.d.
Moving grate 1 MW forest residue, high load
57 6,8) n.d. n.d.
Moving grate 6 MW forest residue, high load
43 6,8) n.d. n.d.
Moving grate 12 MW forest residue, high load
77 6,8) n.d. n.d. Strand. et al, 2004
Moving grate 0.9 MW pellets, low load
10 6, 8) n.d. n.d. 1) as quoted in Klimont et al., 2002; (2) Original factors in lb/ton or in g/kg for recalculation Hu of 16 GJ/t were assumed; 3) Original factors are estimated per Unit of Heat Delivered no conversion was made; 4) The data for large scale combustion for illustration only; 5) Cyclone separator-dust control; 6) Filter separator-dust control; 7)
PM mainly 0.1-0.3 µm; 7) Typically more than 80 % of all particles are smaller than 1 µm. The mean particle size is typically around 0.1 µm (between 50 nm to 200 nm); 8) Measured as PM1 n.d. – no data !!! Yellow color indicates the data obtained from Karin and Susanne. Because I didn’t receive complete description of references (Name, year, title and source) I could not to add them to point 7 References. May be some of them are the same as I introduced. References are added (SP)!!!
Table A1 32 Particulate matter size fraction distribution reported in the literature for
wood burning [percent of TSP emissions] (as quoted in Klimont et al.,
2002)
Source Sector PM2.5 PM10 TSP
Domestic furnaces n.d. 90 % 100 % Dreiseidler, 1999
Wood pellets 84.4 % 94.6 % 100 % EPA, 1998b1) Residential wood except for pellet
stove 93 % 97 % 100 %
Baumbach, 1999 Domestic furnaces 96 % 99.7 % 100 % UMEG, 1999 Small boilers 79 % 92 % 100 %
1) Houck et al., 1998
Table A1 33 Particulate matter emission factors used in RAINS for wood burning in
Europe [g/GJ] (as quoted in Klimont et al., 2002)
Sector PM2.5 PM10 TSP
Eastern Europe
Fireplaces, stoves 279 288 300 Small domestic boilers 93 – 230 96 – 240 100 – 250 Large residential boilers 77 – 150 89 – 0.180 100 – 200 Industry 1) 185 214 240 Western Europe Fireplaces, stoves 67 – 186 70 – 192 72 – 200 Small domestic boilers 60 – 167 62 – 170 65 – 180 Large residential boilers 1) 50 – 120 60 – 134 65 – 150
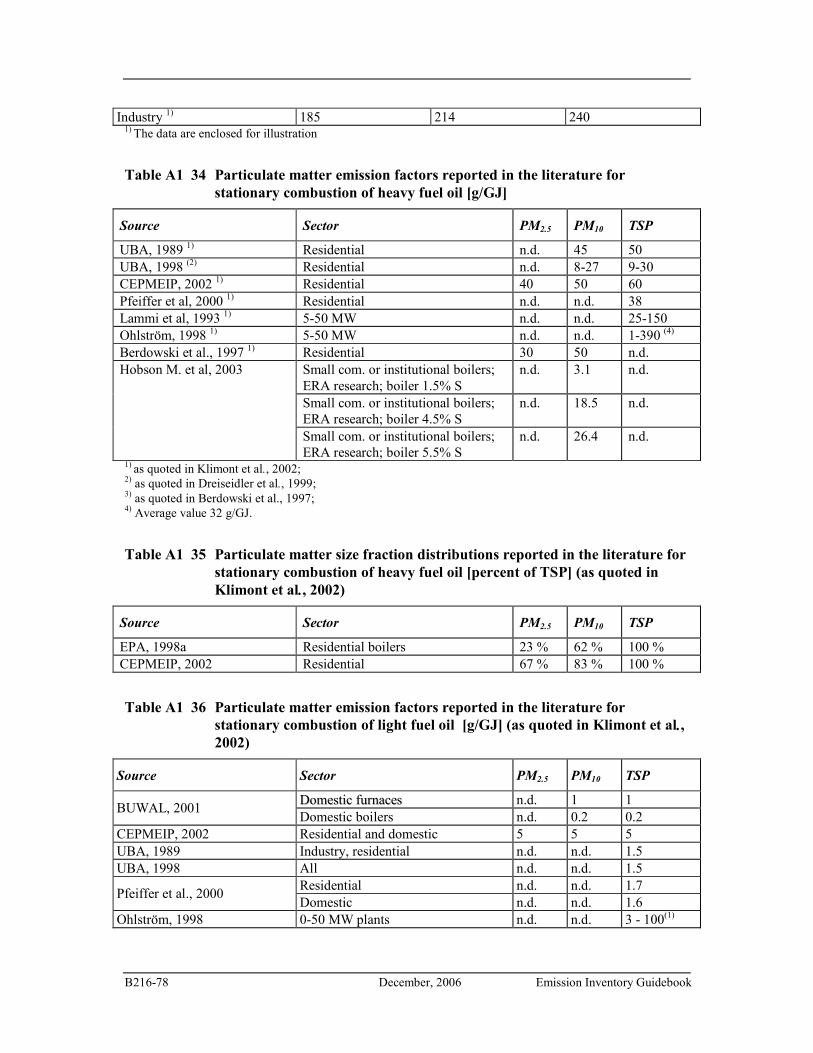
B216-78 December, 2006 Emission Inventory Guidebook
Industry 1) 185 214 240 1) The data are enclosed for illustration
Table A1 34 Particulate matter emission factors reported in the literature for
stationary combustion of heavy fuel oil [g/GJ]
Source Sector PM2.5 PM10 TSP
UBA, 1989 1) Residential n.d. 45 50 UBA, 1998 (2) Residential n.d. 8-27 9-30 CEPMEIP, 2002 1) Residential 40 50 60 Pfeiffer et al, 2000 1) Residential n.d. n.d. 38 Lammi et al, 1993 1) 5-50 MW n.d. n.d. 25-150 Ohlström, 1998 1) 5-50 MW n.d. n.d. 1-390 (4)
Berdowski et al., 1997 1) Residential 30 50 n.d. Small com. or institutional boilers; ERA research; boiler 1.5% S
n.d. 3.1 n.d.
Small com. or institutional boilers; ERA research; boiler 4.5% S
n.d. 18.5 n.d.
Hobson M. et al, 2003
Small com. or institutional boilers; ERA research; boiler 5.5% S
n.d. 26.4 n.d.
1) as quoted in Klimont et al., 2002; 2) as quoted in Dreiseidler et al., 1999; 3) as quoted in Berdowski et al., 1997; 4) Average value 32 g/GJ.
Table A1 35 Particulate matter size fraction distributions reported in the literature for
stationary combustion of heavy fuel oil [percent of TSP] (as quoted in
Klimont et al., 2002)
Source Sector PM2.5 PM10 TSP
EPA, 1998a Residential boilers 23 % 62 % 100 % CEPMEIP, 2002 Residential 67 % 83 % 100 %
Table A1 36 Particulate matter emission factors reported in the literature for
stationary combustion of light fuel oil [g/GJ] (as quoted in Klimont et al.,
2002)
Source Sector PM2.5 PM10 TSP
DDoommeessttiicc ffuurrnnaacceess n.d. 1 1 BUWAL, 2001
Domestic boilers n.d. 0.2 0.2 CEPMEIP, 2002 Residential and domestic 5 5 5 UBA, 1989 Industry, residential n.d. n.d. 1.5 UBA, 1998 All n.d. n.d. 1.5
Residential n.d. n.d. 1.7 Pfeiffer et al., 2000
Domestic n.d. n.d. 1.6 Ohlström, 1998 0-50 MW plants n.d. n.d. 3 - 100(1)

NON-INDUSTRIAL COMBUSTION PLANTS
Activities: Various
Emission Inventory Guidebook December, 2006 B216-79
Berdowski et al., 1997 Residential sector 30 30 n.d. 1) Average value 70 g/GJ
Table A1 37 Particulate matter size fraction distributions reported in the literature for
stationary combustion of light fuel oil [%](as quoted in Klimont et al.,
2002)
Source Sector PM2.5 PM10 TSP
EPA, 1998a Domestic boilers 42% 55% 100% APEG, 1999 (1) Residential sector 76-
94% 100 % n.d.
Berdowski et al., 1997 (1) Domestic 60 % 100 % n.d. 1) The values refer to PM10 and not to TSP
Table A1 38 Percentage of particle fraction PM10 referring to the sectoral emission
factors for particles [%]
Source Fuel Households Small consumers
Households and
Small
consumers
High rank coals and products
100 97 99
Brown coal briquettes
96 n.d. 96
Wood 97 94 96
Struschka et al., 2003
Distillate oil 100 100 100 Ehrlich et al., 2001 Biomass n.d. n.d. > 90 Gaegauf et al., 2001 Biomass n.d. n.d. 95 1)
Houck et al., 2005 Biomass n.d. n.d. 84 2) Boman et al., 2005 Biomass (pellet
burners) n.d. n.d. 100 3)
1) 95% PM below 0.4 µm; 2) Approximately 81% of PM is PM2.5; 3) It was found, in principle, that all PM can be considered as PM 1 with an average PM1 of 89.5% ± 7.4% of total PM.
Table A1 39 Particulate matter emission factors reported in the literature for
stationary combustion of natural gas [g/GJ]
Source Sector PM2.5 PM10 TSP
Domestic furnaces n.d. 0.5 0.5 BUWAL, 2001 1)
Domestic boilers n.d. 0.2 0.2 CEPMEIP, 2002 1) Residential and domestic 0.2 0.2 0.2 Pfeiffer et al., 2000 1) Residential and domestic n.d. n.d. 0.03 UBA, 1989; UBA, 1998 1) All n.d. 0.095 0.1
UNECE TFEIP; Dutch date for domestic gas use
n.d. 0.3 n.d.
ERA; research boiler Efs. n.d. 4.8 n.d.
Hobson M. et al, 2003
UNECE TFEIP; Dutch date for agricultural gas use
n.d. 0.15 n.d.
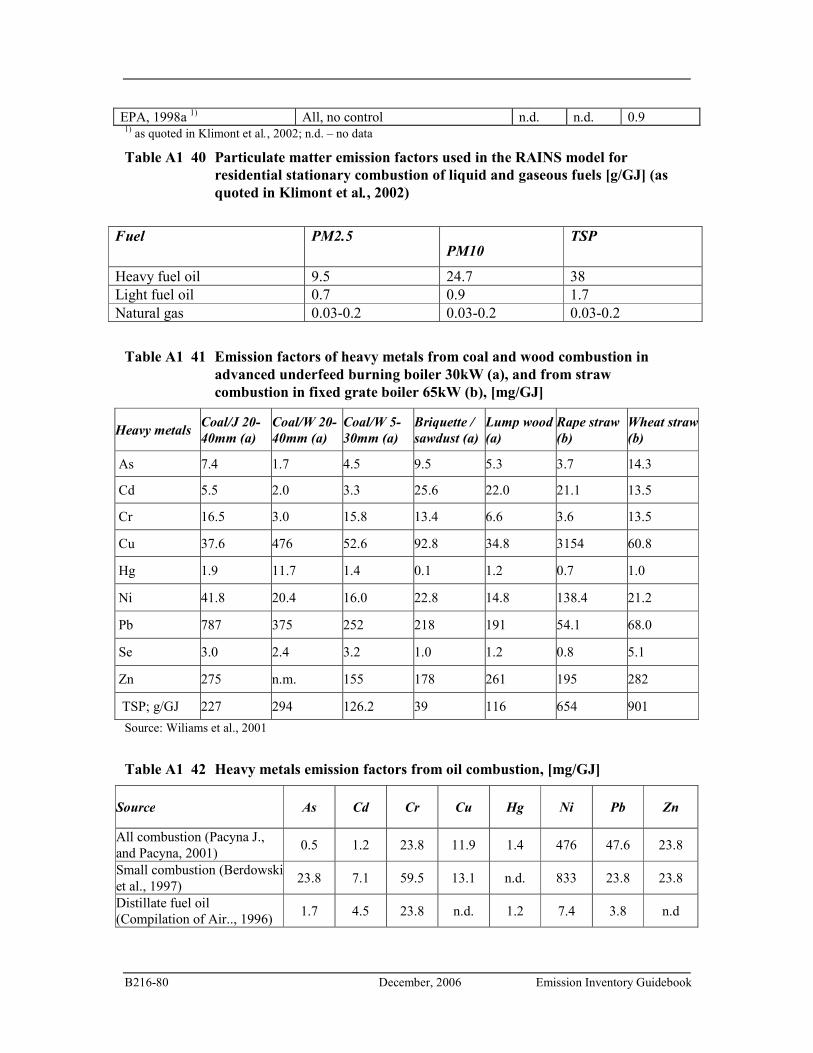
B216-80 December, 2006 Emission Inventory Guidebook
EPA, 1998a 1) All, no control n.d. n.d. 0.9 1) as quoted in Klimont et al., 2002; n.d. – no data
Table A1 40 Particulate matter emission factors used in the RAINS model for
residential stationary combustion of liquid and gaseous fuels [g/GJ] (as
quoted in Klimont et al., 2002)
Fuel PM2.5
PM10 TSP
Heavy fuel oil 9.5 24.7 38 Light fuel oil 0.7 0.9 1.7 Natural gas 0.03-0.2 0.03-0.2 0.03-0.2
Table A1 41 Emission factors of heavy metals from coal and wood combustion in
advanced underfeed burning boiler 30kW (a), and from straw
combustion in fixed grate boiler 65kW (b), [mg/GJ]
Heavy metals Coal/J 20-
40mm (a)
Coal/W 20-
40mm (a)
Coal/W 5-
30mm (a)
Briquette /
sawdust (a)
Lump wood
(a)
Rape straw
(b)
Wheat straw
(b)
As 7.4 1.7 4.5 9.5 5.3 3.7 14.3
Cd 5.5 2.0 3.3 25.6 22.0 21.1 13.5
Cr 16.5 3.0 15.8 13.4 6.6 3.6 13.5
Cu 37.6 476 52.6 92.8 34.8 3154 60.8
Hg 1.9 11.7 1.4 0.1 1.2 0.7 1.0
Ni 41.8 20.4 16.0 22.8 14.8 138.4 21.2
Pb 787 375 252 218 191 54.1 68.0
Se 3.0 2.4 3.2 1.0 1.2 0.8 5.1
Zn 275 n.m. 155 178 261 195 282
TSP; g/GJ 227 294 126.2 39 116 654 901
Source: Wiliams et al., 2001
Table A1 42 Heavy metals emission factors from oil combustion, [mg/GJ]
Source As Cd Cr Cu Hg Ni Pb Zn
All combustion (Pacyna J., and Pacyna, 2001)
0.5 1.2 23.8 11.9 1.4 476 47.6 23.8
Small combustion (Berdowski et al., 1997)
23.8 7.1 59.5 13.1 n.d. 833 23.8 23.8
Distillate fuel oil (Compilation of Air.., 1996)
1.7 4.5 23.8 n.d. 1.2 7.4 3.8 n.d
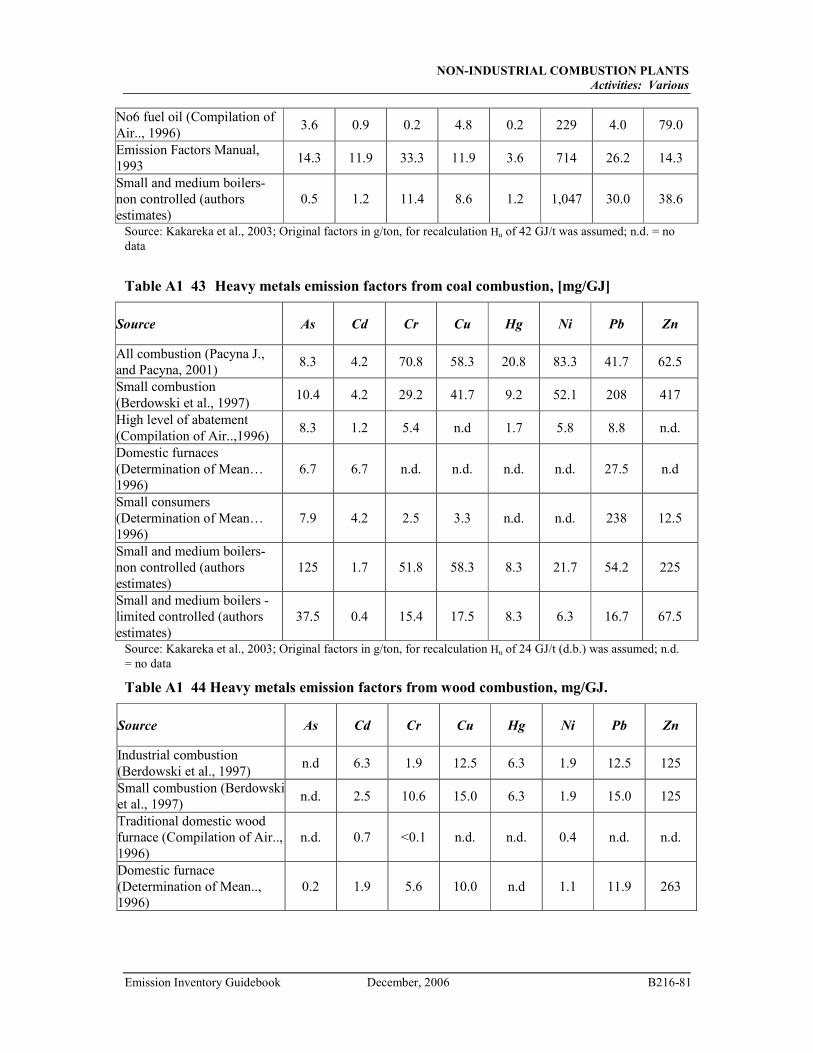
NON-INDUSTRIAL COMBUSTION PLANTS
Activities: Various
Emission Inventory Guidebook December, 2006 B216-81
No6 fuel oil (Compilation of Air.., 1996)
3.6 0.9 0.2 4.8 0.2 229 4.0 79.0
Emission Factors Manual, 1993
14.3 11.9 33.3 11.9 3.6 714 26.2 14.3
Small and medium boilers-non controlled (authors estimates)
0.5 1.2 11.4 8.6 1.2 1,047 30.0 38.6
Source: Kakareka et al., 2003; Original factors in g/ton, for recalculation Hu of 42 GJ/t was assumed; n.d. = no data
Table A1 43 Heavy metals emission factors from coal combustion, [mg/GJ]
Source As Cd Cr Cu Hg Ni Pb Zn
All combustion (Pacyna J., and Pacyna, 2001)
8.3 4.2 70.8 58.3 20.8 83.3 41.7 62.5
Small combustion (Berdowski et al., 1997)
10.4 4.2 29.2 41.7 9.2 52.1 208 417
High level of abatement (Compilation of Air..,1996)
8.3 1.2 5.4 n.d 1.7 5.8 8.8 n.d.
Domestic furnaces (Determination of Mean… 1996)
6.7 6.7 n.d. n.d. n.d. n.d. 27.5 n.d
Small consumers (Determination of Mean… 1996)
7.9 4.2 2.5 3.3 n.d. n.d. 238 12.5
Small and medium boilers-non controlled (authors estimates)
125 1.7 51.8 58.3 8.3 21.7 54.2 225
Small and medium boilers -limited controlled (authors estimates)
37.5 0.4 15.4 17.5 8.3 6.3 16.7 67.5
Source: Kakareka et al., 2003; Original factors in g/ton, for recalculation Hu of 24 GJ/t (d.b.) was assumed; n.d. = no data
Table A1 44 Heavy metals emission factors from wood combustion, mg/GJ.
Source As Cd Cr Cu Hg Ni Pb Zn
Industrial combustion (Berdowski et al., 1997)
n.d 6.3 1.9 12.5 6.3 1.9 12.5 125
Small combustion (Berdowski et al., 1997)
n.d. 2.5 10.6 15.0 6.3 1.9 15.0 125
Traditional domestic wood furnace (Compilation of Air.., 1996)
n.d. 0.7 <0.1 n.d. n.d. 0.4 n.d. n.d.
Domestic furnace (Determination of Mean.., 1996)
0.2 1.9 5.6 10.0 n.d 1.1 11.9 263
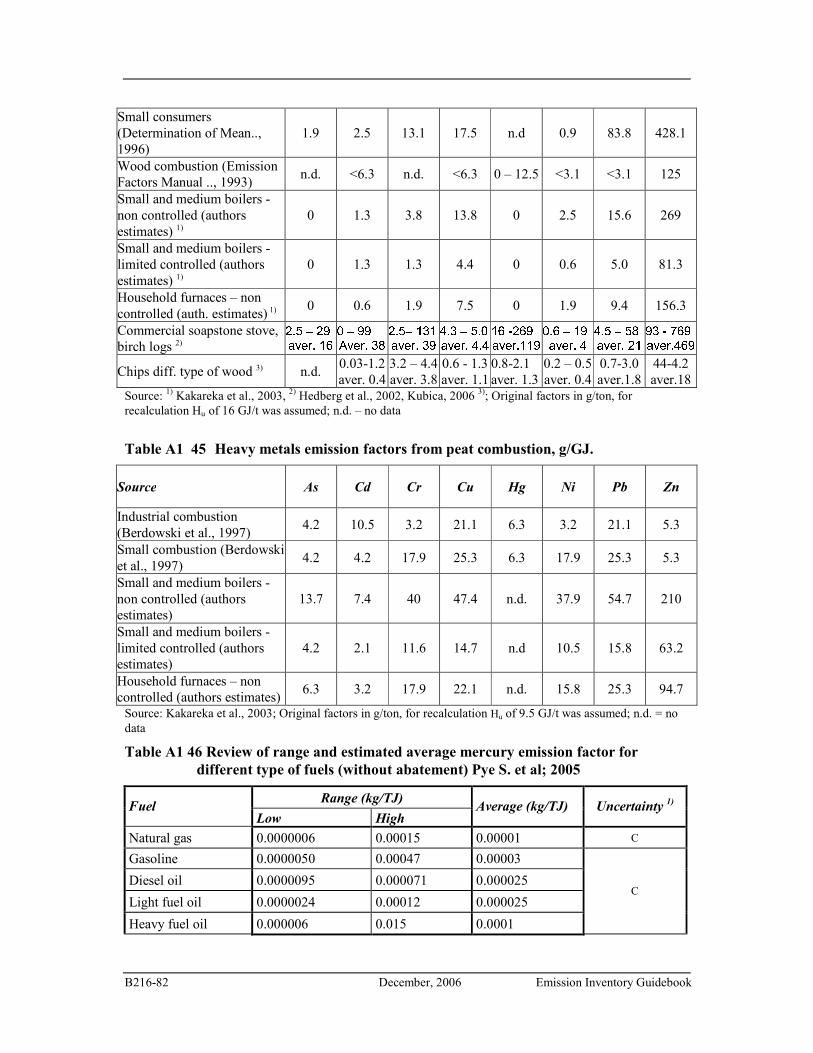
B216-82 December, 2006 Emission Inventory Guidebook
Small consumers (Determination of Mean.., 1996)
1.9 2.5 13.1 17.5 n.d 0.9 83.8 428.1
Wood combustion (Emission Factors Manual .., 1993)
n.d. <6.3 n.d. <6.3 0 – 12.5 <3.1 <3.1 125
Small and medium boilers - non controlled (authors estimates) 1)
0 1.3 3.8 13.8 0 2.5 15.6 269
Small and medium boilers -limited controlled (authors estimates) 1)
0 1.3 1.3 4.4 0 0.6 5.0 81.3
Household furnaces – non controlled (auth. estimates) 1)
0 0.6 1.9 7.5 0 1.9 9.4 156.3
Commercial soapstone stove, birch logs 2)
� � � � � �� � � � � � � � � � � � � � � �
� � � � � � �� � � � � � �
� � � � � � � � � � � � � �
� � � � �� � � � � � � �
� � � � �� � � � � �
� � � � � �� � � � � � �
� � � � �� � � � � � � �
Chips diff. type of wood 3) n.d. 0.03-1.2 aver. 0.4
3.2 – 4.4 aver. 3.8
0.6 - 1.3 aver. 1.1
0.8-2.1 aver. 1.3
0.2 – 0.5 aver. 0.4
0.7-3.0 aver.1.8
44-4.2 aver.18
Source: 1) Kakareka et al., 2003, 2) Hedberg et al., 2002, Kubica, 2006 3); Original factors in g/ton, for recalculation Hu of 16 GJ/t was assumed; n.d. – no data
Table A1 45 Heavy metals emission factors from peat combustion, g/GJ.
Source As Cd Cr Cu Hg Ni Pb Zn
Industrial combustion (Berdowski et al., 1997)
4.2 10.5 3.2 21.1 6.3 3.2 21.1 5.3
Small combustion (Berdowski et al., 1997)
4.2 4.2 17.9 25.3 6.3 17.9 25.3 5.3
Small and medium boilers - non controlled (authors estimates)
13.7 7.4 40 47.4 n.d. 37.9 54.7 210
Small and medium boilers -limited controlled (authors estimates)
4.2 2.1 11.6 14.7 n.d 10.5 15.8 63.2
Household furnaces – non controlled (authors estimates)
6.3 3.2 17.9 22.1 n.d. 15.8 25.3 94.7
Source: Kakareka et al., 2003; Original factors in g/ton, for recalculation Hu of 9.5 GJ/t was assumed; n.d. = no data
Table A1 46 Review of range and estimated average mercury emission factor for
different type of fuels (without abatement) Pye S. et al; 2005
Range (kg/TJ) Fuel
Low High Average (kg/TJ) Uncertainty
1)
Natural gas 0.0000006 0.00015 0.00001 C
Gasoline 0.0000050 0.00047 0.00003
Diesel oil 0.0000095 0.000071 0.000025
Light fuel oil 0.0000024 0.00012 0.000025
Heavy fuel oil 0.000006 0.015 0.0001
C
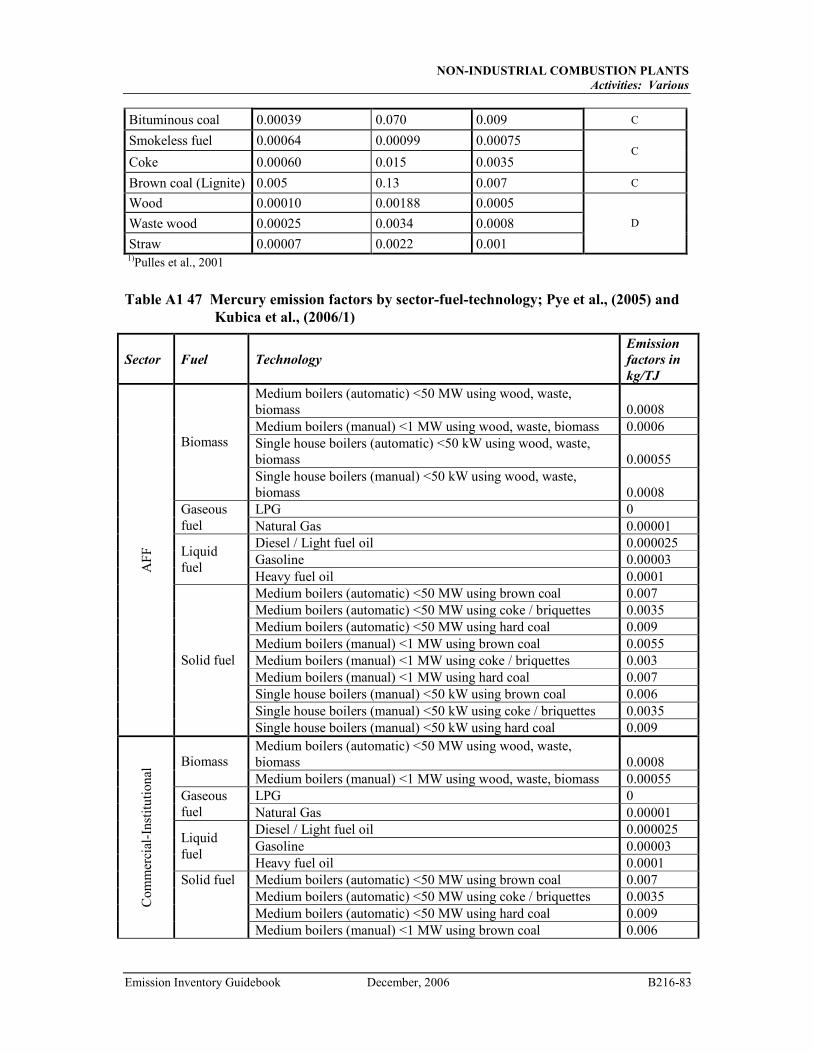
NON-INDUSTRIAL COMBUSTION PLANTS
Activities: Various
Emission Inventory Guidebook December, 2006 B216-83
Bituminous coal 0.00039 0.070 0.009 C
Smokeless fuel 0.00064 0.00099 0.00075
Coke 0.00060 0.015 0.0035 C
Brown coal (Lignite) 0.005 0.13 0.007 C
Wood 0.00010 0.00188 0.0005
Waste wood 0.00025 0.0034 0.0008
Straw 0.00007 0.0022 0.001
D
1)Pulles et al., 2001
Table A1 47 Mercury emission factors by sector-fuel-technology; Pye et al., (2005) and
Kubica et al., (2006/1)
Sector Fuel Technology
Emission
factors in
kg/TJ
Medium boilers (automatic) <50 MW using wood, waste, biomass 0.0008 Medium boilers (manual) <1 MW using wood, waste, biomass 0.0006 Single house boilers (automatic) <50 kW using wood, waste, biomass 0.00055
Biomass
Single house boilers (manual) <50 kW using wood, waste, biomass 0.0008 LPG 0 Gaseous
fuel Natural Gas 0.00001 Diesel / Light fuel oil 0.000025 Gasoline 0.00003
Liquid fuel
Heavy fuel oil 0.0001 Medium boilers (automatic) <50 MW using brown coal 0.007 Medium boilers (automatic) <50 MW using coke / briquettes 0.0035 Medium boilers (automatic) <50 MW using hard coal 0.009 Medium boilers (manual) <1 MW using brown coal 0.0055 Medium boilers (manual) <1 MW using coke / briquettes 0.003 Medium boilers (manual) <1 MW using hard coal 0.007 Single house boilers (manual) <50 kW using brown coal 0.006 Single house boilers (manual) <50 kW using coke / briquettes 0.0035
AF
F
Solid fuel
Single house boilers (manual) <50 kW using hard coal 0.009 Medium boilers (automatic) <50 MW using wood, waste, biomass 0.0008 Biomass Medium boilers (manual) <1 MW using wood, waste, biomass 0.00055 LPG 0 Gaseous
fuel Natural Gas 0.00001 Diesel / Light fuel oil 0.000025 Gasoline 0.00003
Liquid fuel
Heavy fuel oil 0.0001 Medium boilers (automatic) <50 MW using brown coal 0.007 Medium boilers (automatic) <50 MW using coke / briquettes 0.0035 Medium boilers (automatic) <50 MW using hard coal 0.009
Com
mer
cial
-Ins
titu
tion
al
Solid fuel
Medium boilers (manual) <1 MW using brown coal 0.006

B216-84 December, 2006 Emission Inventory Guidebook
Medium boilers (manual) <1 MW using coke / briquettes 0.003 Medium boilers (manual) <1 MW using hard coal 0.007 Fireplaces using wood, waste, biomass 0.0004 Single house boilers (automatic) <50 kW using wood, waste, biomass 0.00055 Single house boilers (manual) <50 kW using wood, waste, biomass 0.0005
Biomass
Stoves using wood, waste, biomass 0.0004 LPG 0 Gaseous
fuel Natural Gas 0.00001 Diesel / Light fuel oil 0.000025 Gasoline 0.00003
Liquid fuel
Heavy fuel oil NA Fireplaces 0.003 Single house boilers (manual) <50 kW using brown coal 0.007 Single house boilers (manual) <50 kW using coke / briquettes 0.003 Single house boilers (manual) <50 kW using hard coal 0.006 Single house boilers (automatic) <50 kW using hard coal 0.009 Stoves using brown coal 0.004
Res
iden
tial
Solid fuel
Stoves using hard coal 0.006
Table 208 Mercury emission factor speciation for different fuels (as quoted in Pye et al.,
2005)
Fuel Installation Hg0 (gas) Hg
+2 Hg (partic.);
HgPM
Uncertainty1) Source
Power plant 0.5 0.4 0.1 -
Residential 0.5 0.4 0.1 C
Pacyna et.al., 2004
General 0.5 0.4 0.1 - Senior, 2004 Power plant 0.5 0.4 0.1 -
Power station stack monit. 0.269 0.695 0.036 -
Domestic coal burning 0.4 0.4 0.2 C
Pye, 2005/2
FBC a) 0.55-0.6 0.4 <0.05 - FBC b) 0.05 – 0.10 0.8 0.15 – 0.10 -
Moritomi, 2005
Research facility design to replicate typical power plant
0.2 0.8 - - Tan et a., 2004
Stove 0.6 0.4 - Bartle et al., 1996
Power plant 0.42 0.58 - - Hlawiczka, et al., 2003
Stove / Fireplaces 0.3 0.35 0.35 C Boiler manual fuelled - all SCI sectors
0.4 0.4 0.2 C
Hard Coal
Boiler autom. (stoker) - all SCI sectors
0.5 0.4 0.1 C
Pye et al., 2005/1
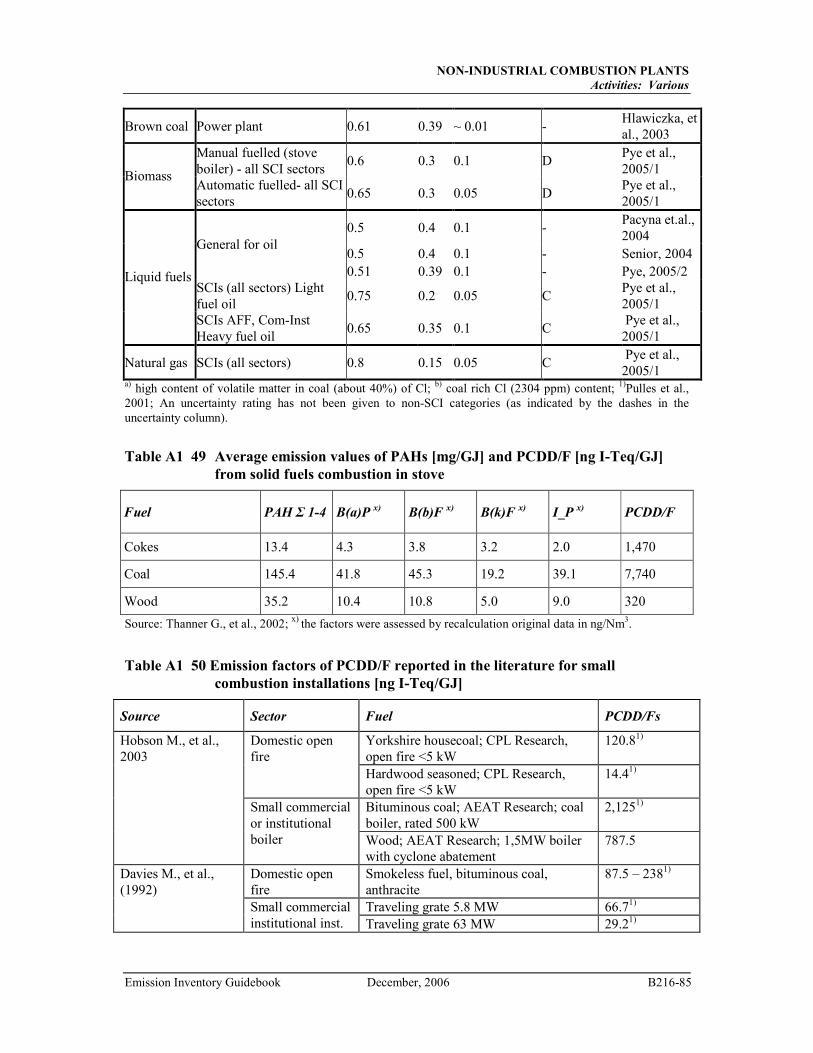
NON-INDUSTRIAL COMBUSTION PLANTS
Activities: Various
Emission Inventory Guidebook December, 2006 B216-85
Brown coal Power plant 0.61 0.39 ~ 0.01 - Hlawiczka, et al., 2003
Manual fuelled (stove boiler) - all SCI sectors
0.6 0.3 0.1 D Pye et al., 2005/1 Biomass
Automatic fuelled- all SCI sectors
0.65 0.3 0.05 D Pye et al., 2005/1
0.5 0.4 0.1 - Pacyna et.al., 2004
0.5 0.4 0.1 - Senior, 2004 General for oil
0.51 0.39 0.1 - Pye, 2005/2 SCIs (all sectors) Light fuel oil
0.75 0.2 0.05 C Pye et al., 2005/1
Liquid fuels
SCIs AFF, Com-Inst Heavy fuel oil
0.65 0.35 0.1 C Pye et al., 2005/1
Natural gas SCIs (all sectors) 0.8 0.15 0.05 C Pye et al., 2005/1
a) high content of volatile matter in coal (about 40%) of Cl; b) coal rich Cl (2304 ppm) content; 1)Pulles et al., 2001; An uncertainty rating has not been given to non-SCI categories (as indicated by the dashes in the uncertainty column).
Table A1 49 Average emission values of PAHs [mg/GJ] and PCDD/F [ng I-Teq/GJ]
from solid fuels combustion in stove
Fuel PAH Σ 1-4 B(a)P x)
B(b)F x)
B(k)F x)
I_P x)
PCDD/F
Cokes 13.4 4.3 3.8 3.2 2.0 1,470
Coal 145.4 41.8 45.3 19.2 39.1 7,740
Wood 35.2 10.4 10.8 5.0 9.0 320
Source: Thanner G., et al., 2002; x) the factors were assessed by recalculation original data in ng/Nm3.
Table A1 50 Emission factors of PCDD/F reported in the literature for small
combustion installations [ng I-Teq/GJ]
Source Sector Fuel PCDD/Fs
Yorkshire housecoal; CPL Research, open fire <5 kW
120.81) Domestic open fire
Hardwood seasoned; CPL Research, open fire <5 kW
14.41)
Bituminous coal; AEAT Research; coal boiler, rated 500 kW
2,1251)
Hobson M., et al., 2003
Small commercial or institutional boiler Wood; AEAT Research; 1,5MW boiler
with cyclone abatement 787.5
Domestic open fire
Smokeless fuel, bituminous coal, anthracite
87.5 – 2381)
Traveling grate 5.8 MW 66.71)
Davies M., et al., (1992)
Small commercial institutional inst. Traveling grate 63 MW 29.21)
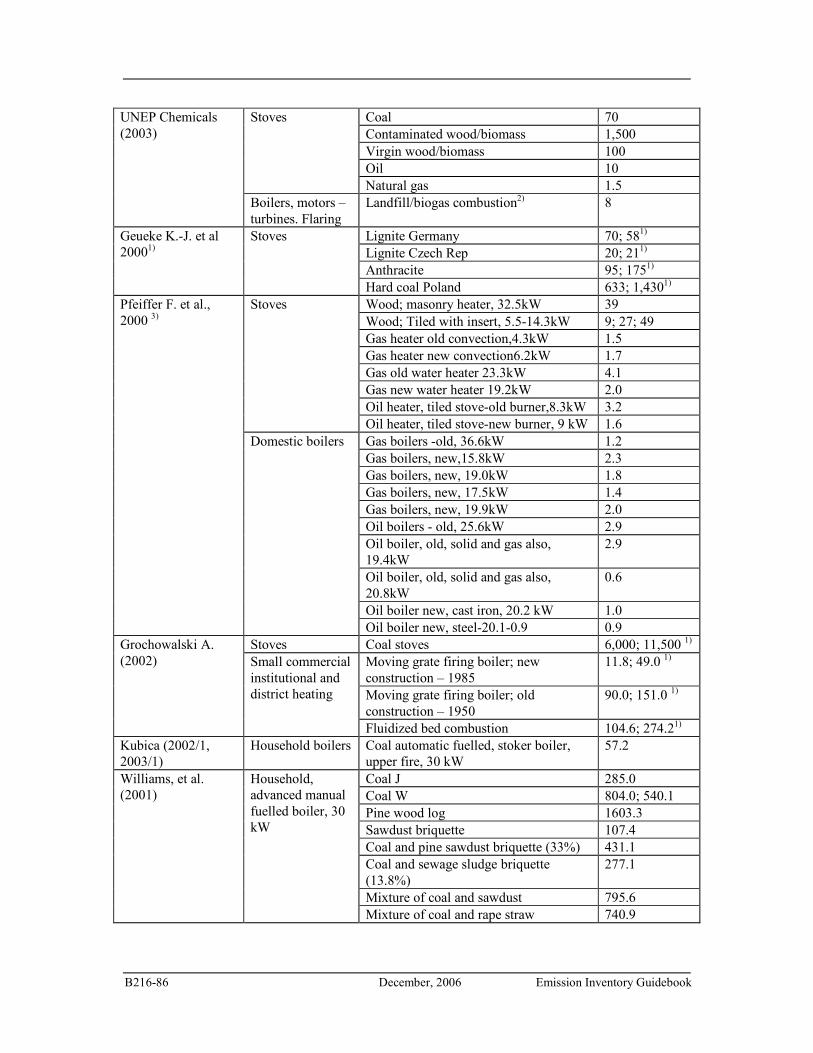
B216-86 December, 2006 Emission Inventory Guidebook
Coal 70 Contaminated wood/biomass 1,500 Virgin wood/biomass 100 Oil 10
Stoves
Natural gas 1.5
UNEP Chemicals (2003)
Boilers, motors – turbines. Flaring
Landfill/biogas combustion2) 8
Lignite Germany 70; 581)
Lignite Czech Rep 20; 211)
Anthracite 95; 1751)
Geueke K.-J. et al 20001)
Stoves
Hard coal Poland 633; 1,4301)
Wood; masonry heater, 32.5kW 39 Wood; Tiled with insert, 5.5-14.3kW 9; 27; 49 Gas heater old convection,4.3kW 1.5 Gas heater new convection6.2kW 1.7 Gas old water heater 23.3kW 4.1 Gas new water heater 19.2kW 2.0 Oil heater, tiled stove-old burner,8.3kW 3.2
Stoves
Oil heater, tiled stove-new burner, 9 kW 1.6 Gas boilers -old, 36.6kW 1.2 Gas boilers, new,15.8kW 2.3 Gas boilers, new, 19.0kW 1.8 Gas boilers, new, 17.5kW 1.4 Gas boilers, new, 19.9kW 2.0 Oil boilers - old, 25.6kW 2.9 Oil boiler, old, solid and gas also, 19.4kW
2.9
Oil boiler, old, solid and gas also, 20.8kW
0.6
Oil boiler new, cast iron, 20.2 kW 1.0
Pfeiffer F. et al., 2000 3)
Domestic boilers
Oil boiler new, steel-20.1-0.9 0.9 Stoves Coal stoves 6,000; 11,500 1)
Moving grate firing boiler; new construction – 1985
11.8; 49.0 1)
Moving grate firing boiler; old construction – 1950
90.0; 151.0 1)
Grochowalski A. (2002) Small commercial
institutional and district heating
Fluidized bed combustion 104.6; 274.21)
Kubica (2002/1, 2003/1)
Household boilers Coal automatic fuelled, stoker boiler, upper fire, 30 kW
57.2
Coal J 285.0 Coal W 804.0; 540.1 Pine wood log 1603.3 Sawdust briquette 107.4 Coal and pine sawdust briquette (33%) 431.1 Coal and sewage sludge briquette (13.8%)
277.1
Mixture of coal and sawdust 795.6
Williams, et al. (2001)
Household, advanced manual fuelled boiler, 30 kW
Mixture of coal and rape straw 740.9
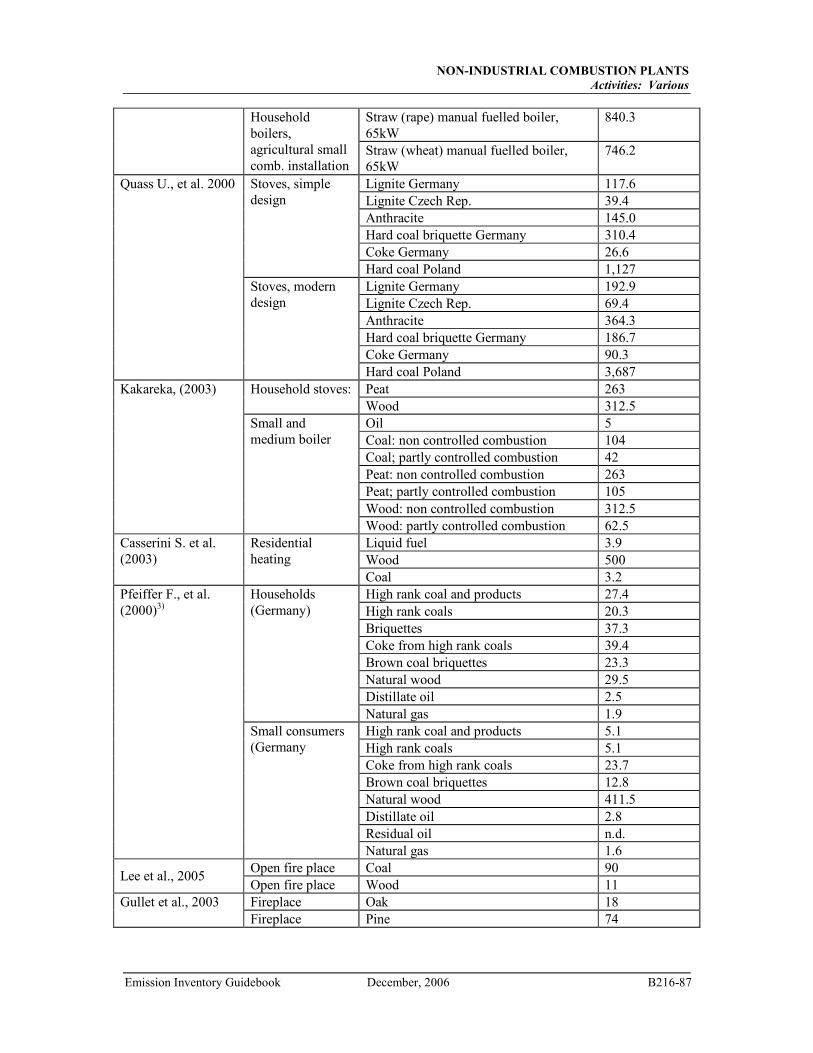
NON-INDUSTRIAL COMBUSTION PLANTS
Activities: Various
Emission Inventory Guidebook December, 2006 B216-87
Straw (rape) manual fuelled boiler, 65kW
840.3 Household boilers, agricultural small comb. installation
Straw (wheat) manual fuelled boiler, 65kW
746.2
Lignite Germany 117.6 Lignite Czech Rep. 39.4 Anthracite 145.0 Hard coal briquette Germany 310.4 Coke Germany 26.6
Stoves, simple design
Hard coal Poland 1,127 Lignite Germany 192.9 Lignite Czech Rep. 69.4 Anthracite 364.3 Hard coal briquette Germany 186.7 Coke Germany 90.3
Quass U., et al. 2000
Stoves, modern design
Hard coal Poland 3,687 Peat 263 Household stoves: Wood 312.5 Oil 5 Coal: non controlled combustion 104 Coal; partly controlled combustion 42 Peat: non controlled combustion 263 Peat; partly controlled combustion 105 Wood: non controlled combustion 312.5
Kakareka, (2003)
Small and medium boiler
Wood: partly controlled combustion 62.5 Liquid fuel 3.9 Wood 500
Casserini S. et al. (2003)
Residential heating
Coal 3.2 High rank coal and products 27.4 High rank coals 20.3 Briquettes 37.3 Coke from high rank coals 39.4 Brown coal briquettes 23.3 Natural wood 29.5 Distillate oil 2.5
Households (Germany)
Natural gas 1.9 High rank coal and products 5.1 High rank coals 5.1 Coke from high rank coals 23.7 Brown coal briquettes 12.8 Natural wood 411.5 Distillate oil 2.8 Residual oil n.d.
Pfeiffer F., et al. (2000)3)
Small consumers (Germany
Natural gas 1.6 Open fire place Coal 90
Lee et al., 2005 Open fire place Wood 11 Fireplace Oak 18 Gullet et al., 2003
Fireplace Pine 74
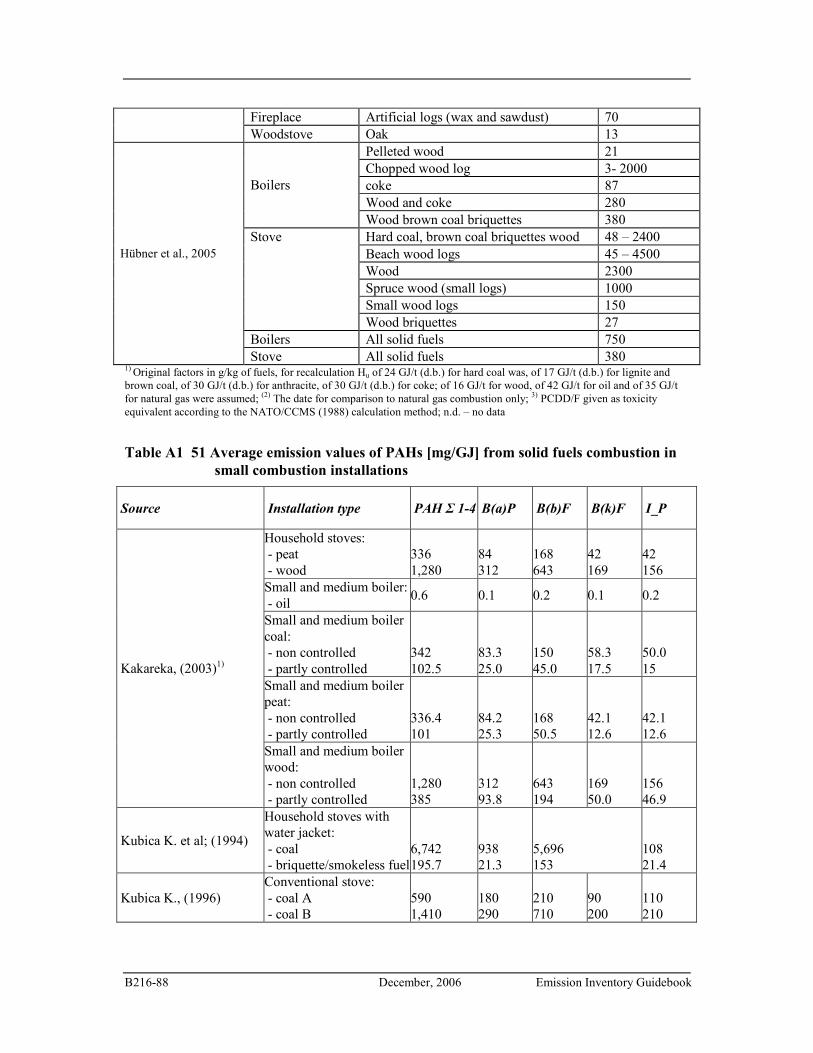
B216-88 December, 2006 Emission Inventory Guidebook
Fireplace Artificial logs (wax and sawdust) 70 Woodstove Oak 13
Pelleted wood 21 Chopped wood log 3- 2000 coke 87 Wood and coke 280
Boilers
Wood brown coal briquettes 380 Hard coal, brown coal briquettes wood 48 – 2400 Beach wood logs 45 – 4500 Wood 2300 Spruce wood (small logs) 1000 Small wood logs 150
Stove
Wood briquettes 27 Boilers All solid fuels 750
Hübner et al., 2005
Stove All solid fuels 380 1) Original factors in g/kg of fuels, for recalculation Hu of 24 GJ/t (d.b.) for hard coal was, of 17 GJ/t (d.b.) for lignite and brown coal, of 30 GJ/t (d.b.) for anthracite, of 30 GJ/t (d.b.) for coke; of 16 GJ/t for wood, of 42 GJ/t for oil and of 35 GJ/t for natural gas were assumed; (2) The date for comparison to natural gas combustion only; 3) PCDD/F given as toxicity equivalent according to the NATO/CCMS (1988) calculation method; n.d. – no data
Table A1 51 Average emission values of PAHs [mg/GJ] from solid fuels combustion in
small combustion installations
Source Installation type PAH Σ 1-4 B(a)P
B(b)F
B(k)F
I_P
Household stoves: - peat - wood
336 1,280
84 312
168 643
42 169
42 156
Small and medium boiler: - oil
0.6 0.1 0.2 0.1 0.2
Small and medium boiler coal: - non controlled - partly controlled
342 102.5
83.3 25.0
150 45.0
58.3 17.5
50.0 15
Small and medium boiler peat: - non controlled - partly controlled
336.4 101
84.2 25.3
168 50.5
42.1 12.6
42.1 12.6
Kakareka, (2003)1)
Small and medium boiler wood: - non controlled - partly controlled
1,280 385
312 93.8
643 194
169 50.0
156 46.9
Kubica K. et al; (1994)
Household stoves with water jacket: - coal - briquette/smokeless fuel
6,742 195.7
938 21.3
5,696 153
108 21.4
Kubica K., (1996) Conventional stove: - coal A - coal B
590 1,410
180 290
210 710
90 200
110 210

NON-INDUSTRIAL COMBUSTION PLANTS
Activities: Various
Emission Inventory Guidebook December, 2006 B216-89
Conventional stove: - wood log - wood pellets
1,210 267.7
390 131.1
380 65.0
180 30.4
260 41.2
Advanced wood pellets burner
15.3 4.4 6.3 3.3 1.3
Upper-fire, automatic stocker boiler: - pellet
33
5
18
8
2
Kubica K. et al; (1997/3; 2002/2)
Advanced under fire coal boiler 20kW: - fine coal - fine coal/chips wood (80/20)
56 17
13 6
22 5
9 1
12 5
Conventional coal boiler 30kW
1,520 450 750 170 150
Advanced coal boiler manual fuelled 30 kW
326 82 130 80 34 Kubica K.; (2003/1)
Automatic fuelled coal boiler 30 kW
33 5 18 8 2
Williams, et al. (2001)
Advanced under-fire boiler, manual 30kW - coal WI - wood - sawdust briquettes - coal WI briquettes - straw (65 kW)
850 610 120 42 165
290 120 50 10 80
280 220 50 20 50
120 180 20 10 20
60 90 10 2 15
Manual fuelled coke boiler 150 kW
21.31) 6.0 12 3.3 n.d. Kubica K., et al, (1997/3)
Automatic fuelled coal boiler, retort; 150 kW
951) 27 40 19 9
Commercial, institutional and district heat.; Moving grate firing coal boiler 10MW
13.2 5.2 4.4 2.0 1.6
Commercial, institutional and district heat; Moving grate firing coal boiler 10MW
8.0 2.5 4.4 1.0 0.1
Kubica K. et al; (2003/3)
Fluidized bed combustion 21.0 6.7 8.5 4.0 1.8
Conventional stove 375.0 125.0 187.5 62.5 0.0
Non-catalytic stove 1062.5 187.5 125.0 125.0 625.0 EPA (1996)1)
Catalytic stove 500.0 125.0 125.0 125.0 125.0
High rank coal and products
270 n.d. n.d. n.d. n.d.
High rank coals 60 n.d. n.d. n.d. n.d.
Pfeiffer F., et al (2000) Households (Germany) 3)
Briquettes 580 n.d. n.d. n.d. n.d.
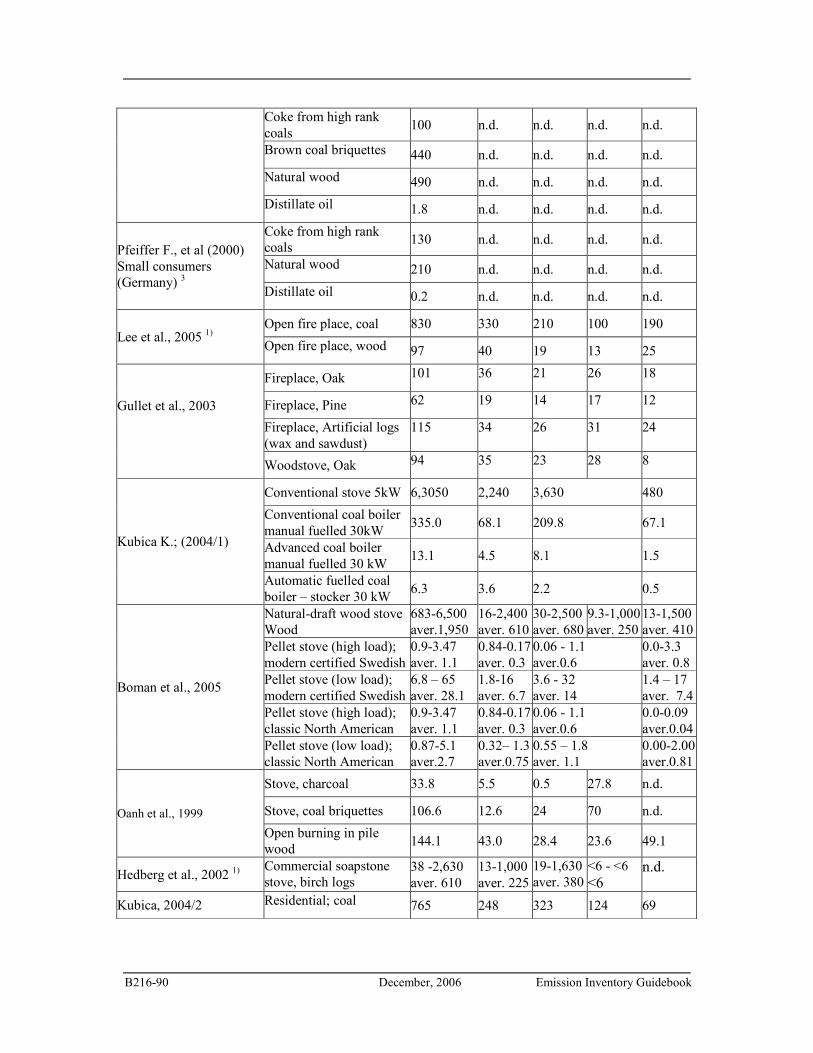
B216-90 December, 2006 Emission Inventory Guidebook
Coke from high rank coals
100 n.d. n.d. n.d. n.d.
Brown coal briquettes 440 n.d. n.d. n.d. n.d.
Natural wood 490 n.d. n.d. n.d. n.d.
Distillate oil 1.8 n.d. n.d. n.d. n.d.
Coke from high rank coals
130 n.d. n.d. n.d. n.d.
Natural wood 210 n.d. n.d. n.d. n.d.
Pfeiffer F., et al (2000) Small consumers (Germany) 3
Distillate oil 0.2 n.d. n.d. n.d. n.d.
Open fire place, coal 830 330 210 100 190 Lee et al., 2005 1)
Open fire place, wood 97 40 19 13 25
Fireplace, Oak 101 36 21 26 18
Fireplace, Pine 62 19 14 17 12
Fireplace, Artificial logs (wax and sawdust)
115 34 26 31 24
Gullet et al., 2003
Woodstove, Oak 94 35 23 28 8
Conventional stove 5kW 6,3050 2,240 3,630 480
Conventional coal boiler manual fuelled 30kW
335.0 68.1 209.8 67.1
Advanced coal boiler manual fuelled 30 kW
13.1 4.5 8.1 1.5 Kubica K.; (2004/1)
Automatic fuelled coal boiler – stocker 30 kW
6.3 3.6 2.2 0.5
Natural-draft wood stove Wood
683-6,500 aver.1,950
16-2,400 aver. 610
30-2,500 aver. 680
9.3-1,000 aver. 250
13-1,500 aver. 410
Pellet stove (high load); modern certified Swedish
0.9-3.47 aver. 1.1
0.84-0.17 aver. 0.3
0.06 - 1.1 aver.0.6
0.0-3.3 aver. 0.8
Pellet stove (low load); modern certified Swedish
6.8 – 65 aver. 28.1
1.8-16 aver. 6.7
3.6 - 32 aver. 14
1.4 – 17 aver. 7.4
Pellet stove (high load); classic North American
0.9-3.47 aver. 1.1
0.84-0.17 aver. 0.3
0.06 - 1.1 aver.0.6
0.0-0.09 aver.0.04
Boman et al., 2005
Pellet stove (low load); classic North American
0.87-5.1 aver.2.7
0.32– 1.3 aver.0.75
0.55 – 1.8 aver. 1.1
0.00-2.00 aver.0.81
Stove, charcoal 33.8 5.5 0.5 27.8 n.d.
Stove, coal briquettes 106.6 12.6 24 70 n.d. Oanh et al., 1999
Open burning in pile wood
144.1 43.0 28.4 23.6 49.1
Hedberg et al., 2002 1) Commercial soapstone stove, birch logs
38 -2,630 aver. 610
13-1,000 aver. 225
19-1,630 aver. 380
<6 - <6 <6
n.d.
Kubica, 2004/2 Residential; coal 765 248 323 124 69

NON-INDUSTRIAL COMBUSTION PLANTS
Activities: Various
Emission Inventory Guidebook December, 2006 B216-91
Residential; wood 712 211 216 131 154
Residen./Comm./Institut. Coal
563 195 245 68 55
Residen./Comm./Institut. Coal 458 143 171 73 71
1) Original factors in g/kg of fuels, for recalculation Hu of 24 GJ/t (d.b.) for coal was, of 16GJ/t for wood, of 42GJ/t for oil and of 35GJ/t for natural gas were assumed; (2) The original date of PAH without the description of PAH type; 3) PAH it is the sum of the 8 cancerogenic PAHs: anthracene, benzo(a)pyrene, benzo(a)anthracene, indeno(1,2,3-cd)pyrene, chrysene (+triphenylene), dibenzo(a,h)antracene, benzo(b+j+k)fluoranthene and benzo(ghi)perylene; n.d. – no data
Table A1 52 Emission factors of VOC and NMVOC [as C3H8] reported in the
literature for small combustion installations [g/GJ]
Source Sector/appliances Fuel VOC NMVOC
Bituminous coal; BCC Research, domestic open grate
n.d. 5831)
Manufactured fuels; BCC Research, domestic coke use
5-20 n.d.
Domestic open fire
Wood; BCC Research; UK use of wood in domestic appliances
90-800 n.d.
Bituminous coal; BCC Research, 17 kW underfeed boiler
n.d. 25
Bituminous coal; BCC Research, 13 kW, gravity feed, anthracite
n.d. 71
Hard coal 35kW boiler, benchmark n.d 195 Hard coal 35kW boiler, improved n.d. 40 Brown coal 35kW boiler, bench. n.d. 380 Brown coal 35 kW boiler, improved
n.d. 76
Coke, 35 kW boiler, benchmark n.d. 220 Coke, 35 kW boiler, improved n.d. 44 Wood, charcoal, 35 kW boiler, benchmark
n.d. 480
Burning oil, 35 kW boiler, benchmark
n.d. 7.5
Burning oil, 35 kW boiler, improved
n.d. 1.5
Kerosene; BCC Research; UK use of kerosene in dom. appliances
15 n.d.
Gas, 35 kW boiler, benchmark n.d. 15 Gas, 35 kW boiler, improved n.d. 3
Domestic boilers
Gas; BCC Research; UK use of gas in domestic appliances
5.0-30 n.d.
Bituminous coal; BCC Research; 0.9-48 MW boilers
n.d. 2.1
Hard coal 200kW boiler, benchm. n.d 30 Hard coal 200kW boiler, improved n.d. 6
Hobson M., et al., 2003
Small commercial or institutional boiler
Brown coal 200kW boiler, benchm n.d. 30
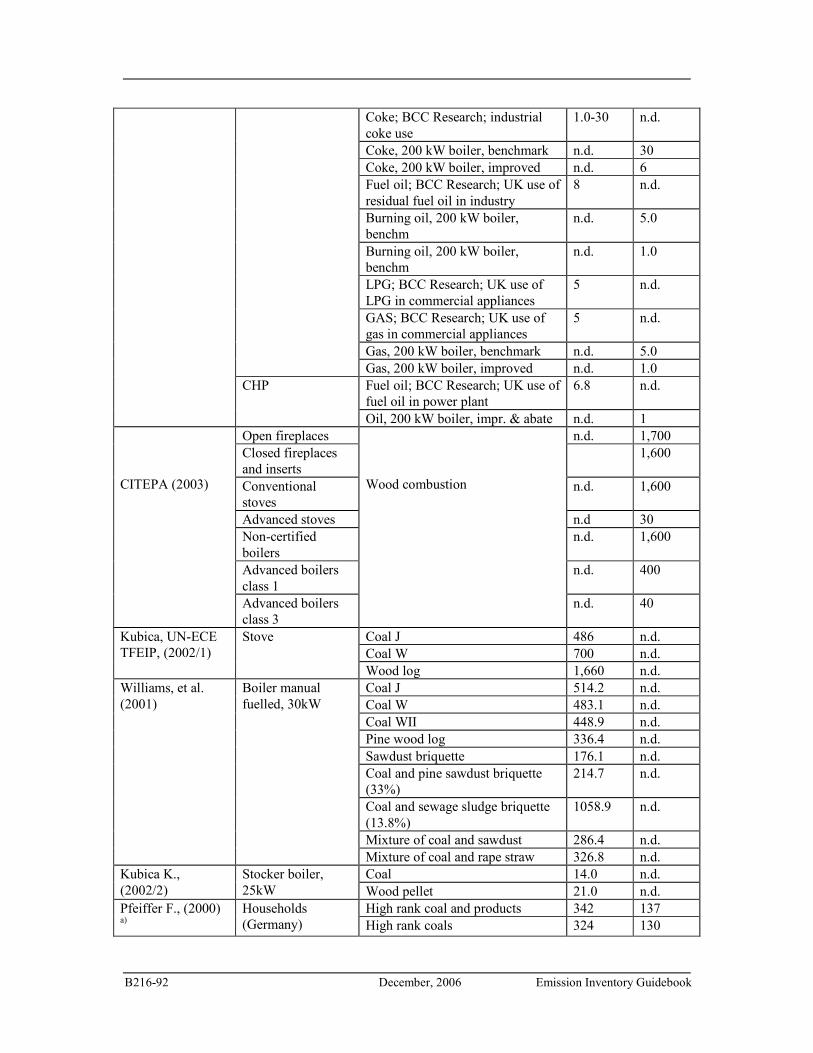
B216-92 December, 2006 Emission Inventory Guidebook
Coke; BCC Research; industrial coke use
1.0-30 n.d.
Coke, 200 kW boiler, benchmark n.d. 30 Coke, 200 kW boiler, improved n.d. 6 Fuel oil; BCC Research; UK use of residual fuel oil in industry
8 n.d.
Burning oil, 200 kW boiler, benchm
n.d. 5.0
Burning oil, 200 kW boiler, benchm
n.d. 1.0
LPG; BCC Research; UK use of LPG in commercial appliances
5 n.d.
GAS; BCC Research; UK use of gas in commercial appliances
5 n.d.
Gas, 200 kW boiler, benchmark n.d. 5.0
Gas, 200 kW boiler, improved n.d. 1.0 Fuel oil; BCC Research; UK use of fuel oil in power plant
6.8 n.d.
CHP
Oil, 200 kW boiler, impr. & abate n.d. 1 Open fireplaces n.d. 1,700 Closed fireplaces and inserts
1,600
Conventional stoves
n.d. 1,600
Advanced stoves n.d 30 Non-certified boilers
n.d. 1,600
Advanced boilers class 1
n.d. 400
CITEPA (2003)
Advanced boilers class 3
Wood combustion
n.d. 40
Coal J 486 n.d. Coal W 700 n.d.
Kubica, UN-ECE TFEIP, (2002/1)
Stove
Wood log 1,660 n.d. Coal J 514.2 n.d. Coal W 483.1 n.d. Coal WII 448.9 n.d. Pine wood log 336.4 n.d. Sawdust briquette 176.1 n.d. Coal and pine sawdust briquette (33%)
214.7 n.d.
Coal and sewage sludge briquette (13.8%)
1058.9 n.d.
Mixture of coal and sawdust 286.4 n.d.
Williams, et al. (2001)
Boiler manual fuelled, 30kW
Mixture of coal and rape straw 326.8 n.d. Coal 14.0 n.d. Kubica K.,
(2002/2) Stocker boiler, 25kW Wood pellet 21.0 n.d.
High rank coal and products 342 137 Pfeiffer F., (2000) a)
Households (Germany) High rank coals 324 130
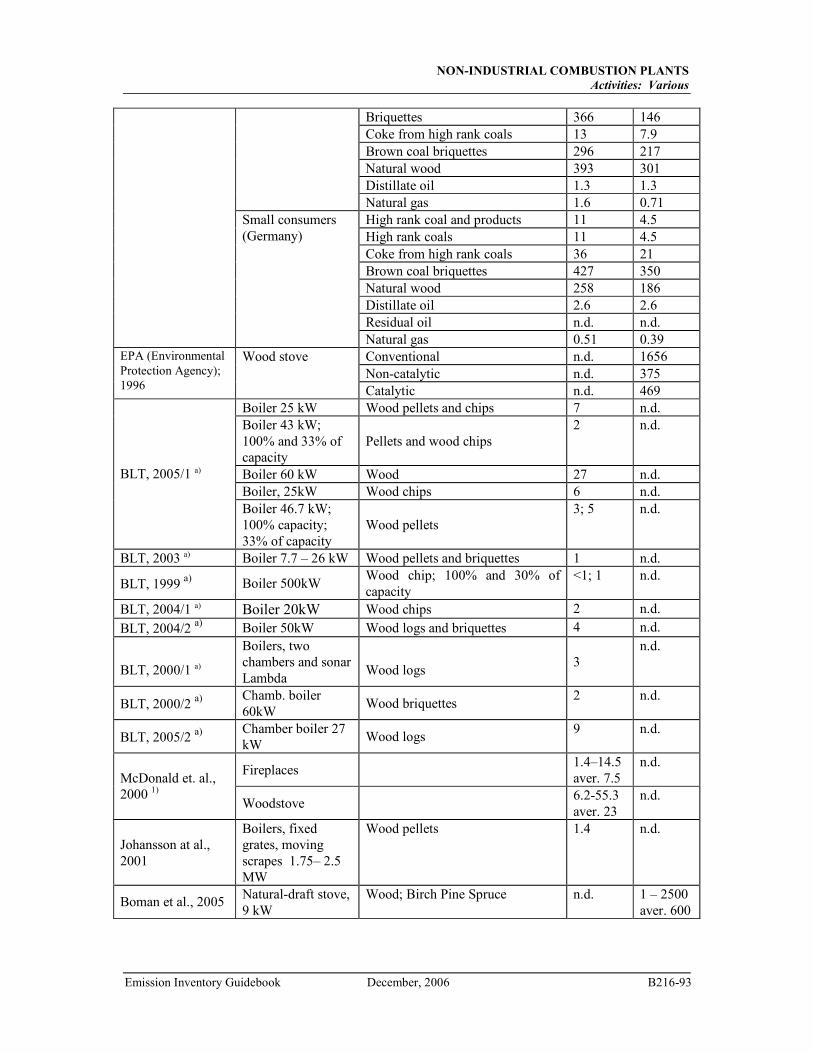
NON-INDUSTRIAL COMBUSTION PLANTS
Activities: Various
Emission Inventory Guidebook December, 2006 B216-93
Briquettes 366 146 Coke from high rank coals 13 7.9 Brown coal briquettes 296 217 Natural wood 393 301 Distillate oil 1.3 1.3
Natural gas 1.6 0.71 High rank coal and products 11 4.5 High rank coals 11 4.5 Coke from high rank coals 36 21 Brown coal briquettes 427 350 Natural wood 258 186 Distillate oil 2.6 2.6 Residual oil n.d. n.d.
Small consumers (Germany)
Natural gas 0.51 0.39 Conventional n.d. 1656 Non-catalytic n.d. 375
EPA (Environmental Protection Agency); 1996
Wood stove
Catalytic n.d. 469 Boiler 25 kW Wood pellets and chips 7 n.d. Boiler 43 kW; 100% and 33% of capacity
Pellets and wood chips 2 n.d.
Boiler 60 kW Wood 27 n.d. Boiler, 25kW Wood chips 6 n.d.
BLT, 2005/1 a)
Boiler 46.7 kW; 100% capacity; 33% of capacity
Wood pellets 3; 5 n.d.
BLT, 2003 a) Boiler 7.7 – 26 kW Wood pellets and briquettes 1 n.d.
BLT, 1999 a) Boiler 500kW Wood chip; 100% and 30% of capacity
<1; 1 n.d.
BLT, 2004/1 a) Boiler 20kW Wood chips 2 n.d. BLT, 2004/2 a) Boiler 50kW Wood logs and briquettes 4 n.d.
BLT, 2000/1 a)
Boilers, two chambers and sonar Lambda
Wood logs
3 n.d.
BLT, 2000/2 a) Chamb. boiler 60kW
Wood briquettes 2 n.d.
BLT, 2005/2 a) Chamber boiler 27 kW
Wood logs 9 n.d.
Fireplaces 1.4–14.5
aver. 7.5 n.d.
McDonald et. al., 2000 1)
Woodstove 6.2-55.3
aver. 23 n.d.
Johansson at al., 2001
Boilers, fixed grates, moving scrapes 1.75– 2.5 MW
Wood pellets 1.4 n.d.
Boman et al., 2005 Natural-draft stove, 9 kW
Wood; Birch Pine Spruce n.d. 1 – 2500 aver. 600
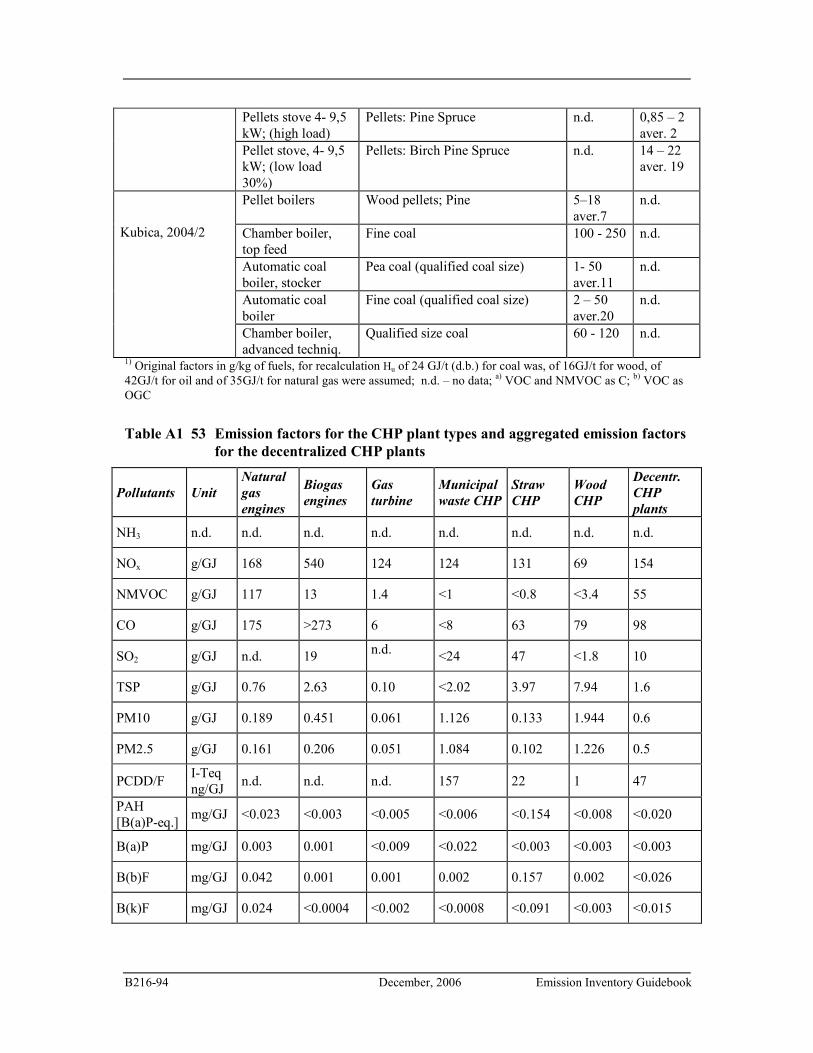
B216-94 December, 2006 Emission Inventory Guidebook
Pellets stove 4- 9,5 kW; (high load)
Pellets: Pine Spruce n.d. 0,85 – 2 aver. 2
Pellet stove, 4- 9,5 kW; (low load 30%)
Pellets: Birch Pine Spruce n.d. 14 – 22 aver. 19
Pellet boilers Wood pellets; Pine 5–18 aver.7
n.d.
Chamber boiler, top feed
Fine coal 100 - 250 n.d.
Automatic coal boiler, stocker
Pea coal (qualified coal size) 1- 50 aver.11
n.d.
Automatic coal boiler
Fine coal (qualified coal size) 2 – 50 aver.20
n.d.
Kubica, 2004/2
Chamber boiler, advanced techniq.
Qualified size coal 60 - 120 n.d.
1) Original factors in g/kg of fuels, for recalculation Hu of 24 GJ/t (d.b.) for coal was, of 16GJ/t for wood, of 42GJ/t for oil and of 35GJ/t for natural gas were assumed; n.d. – no data; a) VOC and NMVOC as C; b) VOC as OGC
Table A1 53 Emission factors for the CHP plant types and aggregated emission factors
for the decentralized CHP plants
Pollutants Unit
Natural
gas
engines
Biogas
engines
Gas
turbine
Municipal
waste CHP
Straw
CHP
Wood
CHP
Decentr.
CHP
plants
NH3 n.d. n.d. n.d. n.d. n.d. n.d. n.d. n.d.
NOx g/GJ 168 540 124 124 131 69 154
NMVOC g/GJ 117 13 1.4 <1 <0.8 <3.4 55
CO g/GJ 175 >273 6 <8 63 79 98
SO2 g/GJ n.d. 19 n.d. <24 47 <1.8 10
TSP g/GJ 0.76 2.63 0.10 <2.02 3.97 7.94 1.6
PM10 g/GJ 0.189 0.451 0.061 1.126 0.133 1.944 0.6
PM2.5 g/GJ 0.161 0.206 0.051 1.084 0.102 1.226 0.5
PCDD/F I-Teq ng/GJ
n.d. n.d. n.d. 157 22 1 47
PAH [B(a)P-eq.] mg/GJ <0.023 <0.003 <0.005 <0.006 <0.154 <0.008 <0.020
B(a)P mg/GJ 0.003 0.001 <0.009 <0.022 <0.003 <0.003 <0.003
B(b)F mg/GJ 0.042 0.001 0.001 0.002 0.157 0.002 <0.026
B(k)F mg/GJ 0.024 <0.0004 <0.002 <0.0008 <0.091 <0.003 <0.015
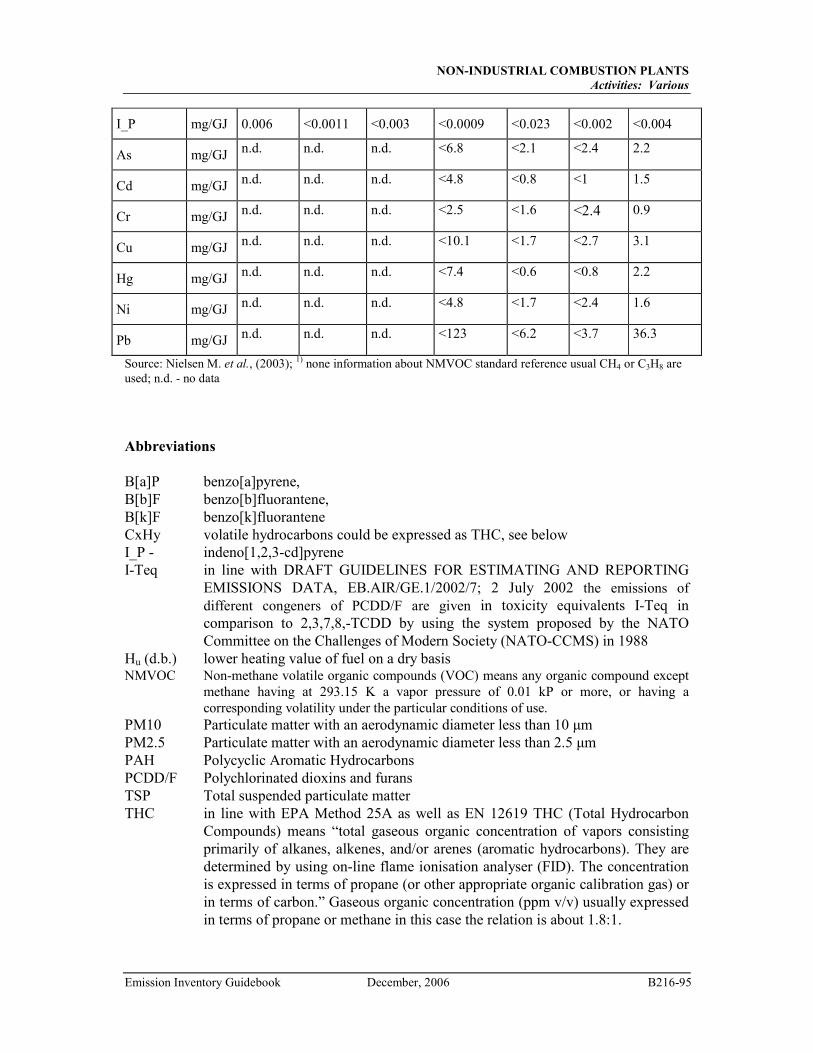
NON-INDUSTRIAL COMBUSTION PLANTS
Activities: Various
Emission Inventory Guidebook December, 2006 B216-95
I_P mg/GJ 0.006 <0.0011 <0.003 <0.0009 <0.023 <0.002 <0.004
As mg/GJ n.d. n.d. n.d. <6.8 <2.1 <2.4 2.2
Cd mg/GJ n.d. n.d. n.d. <4.8 <0.8 <1 1.5
Cr mg/GJ n.d. n.d. n.d. <2.5 <1.6 <2.4 0.9
Cu mg/GJ n.d. n.d. n.d. <10.1 <1.7 <2.7 3.1
Hg mg/GJ n.d. n.d. n.d. <7.4 <0.6 <0.8 2.2
Ni mg/GJ n.d. n.d. n.d. <4.8 <1.7 <2.4 1.6
Pb mg/GJ n.d. n.d. n.d. <123 <6.2 <3.7 36.3
Source: Nielsen M. et al., (2003); 1) none information about NMVOC standard reference usual CH4 or C3H8 are used; n.d. - no data
Abbreviations
B[a]P benzo[a]pyrene, B[b]F benzo[b]fluorantene, B[k]F benzo[k]fluorantene CxHy volatile hydrocarbons could be expressed as THC, see below I_P - indeno[1,2,3-cd]pyrene I-Teq in line with DRAFT GUIDELINES FOR ESTIMATING AND REPORTING
EMISSIONS DATA, EB.AIR/GE.1/2002/7; 2 July 2002 the emissions of different congeners of PCDD/F are given in toxicity equivalents I-Teq in comparison to 2,3,7,8,-TCDD by using the system proposed by the NATO Committee on the Challenges of Modern Society (NATO-CCMS) in 1988
Hu (d.b.) lower heating value of fuel on a dry basis NMVOC Non-methane volatile organic compounds (VOC) means any organic compound except
methane having at 293.15 K a vapor pressure of 0.01 kP or more, or having a corresponding volatility under the particular conditions of use.
PM10 Particulate matter with an aerodynamic diameter less than 10 µm PM2.5 Particulate matter with an aerodynamic diameter less than 2.5 µm PAH Polycyclic Aromatic Hydrocarbons PCDD/F Polychlorinated dioxins and furans TSP Total suspended particulate matter THC in line with EPA Method 25A as well as EN 12619 THC (Total Hydrocarbon
Compounds) means “total gaseous organic concentration of vapors consisting primarily of alkanes, alkenes, and/or arenes (aromatic hydrocarbons). They are determined by using on-line flame ionisation analyser (FID). The concentration is expressed in terms of propane (or other appropriate organic calibration gas) or in terms of carbon.” Gaseous organic concentration (ppm v/v) usually expressed in terms of propane or methane in this case the relation is about 1.8:1.

B216-96 December, 2006 Emission Inventory Guidebook
VOC Volatile organic compounds means any organic compound except methane having at 293.15 K a vapor pressure of 0.01 kP or more, or having a corresponding volatility under the particular conditions of use.
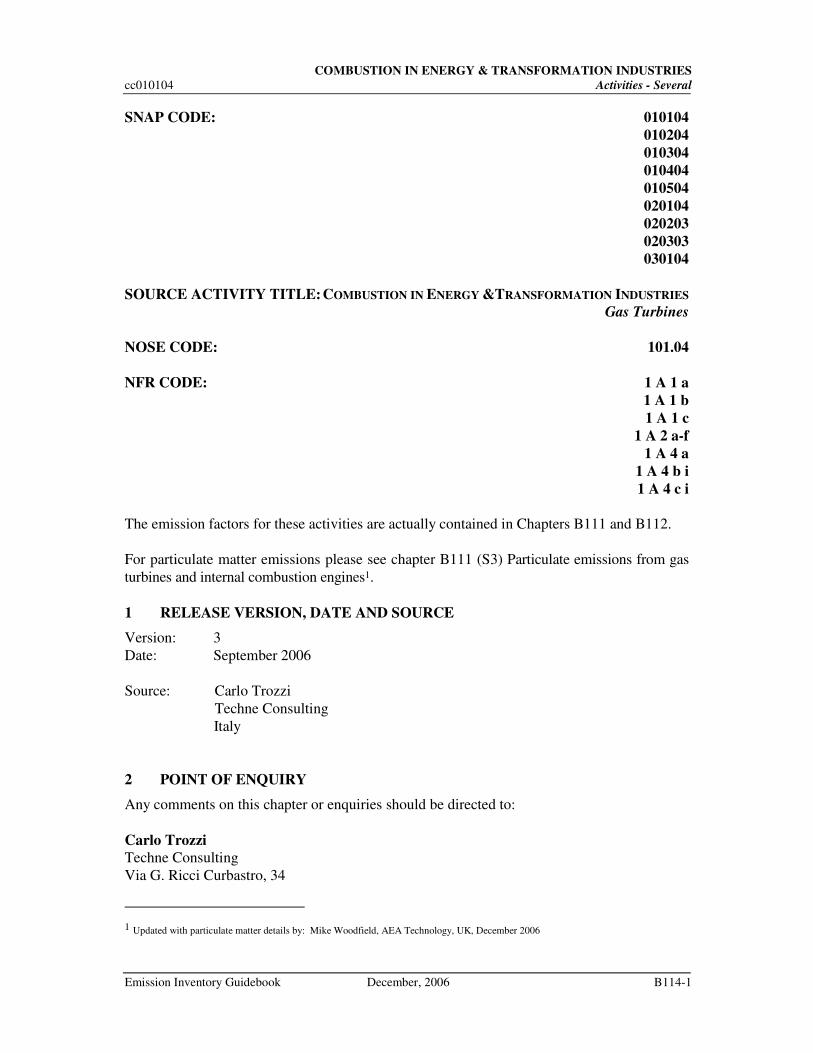
COMBUSTION IN ENERGY & TRANSFORMATION INDUSTRIES
cc010104 Activities - Several
Emission Inventory Guidebook December, 2006 B114-1
SNAP CODE: 010104
010204
010304
010404
010504
020104
020203
020303
030104
SOURCE ACTIVITY TITLE: COMBUSTION IN ENERGY &TRANSFORMATION INDUSTRIES
Gas Turbines
NOSE CODE: 101.04
NFR CODE: 1 A 1 a
1 A 1 b
1 A 1 c
1 A 2 a-f
1 A 4 a
1 A 4 b i
1 A 4 c i
The emission factors for these activities are actually contained in Chapters B111 and B112.
For particulate matter emissions please see chapter B111 (S3) Particulate emissions from gas
turbines and internal combustion engines1.
1 RELEASE VERSION, DATE AND SOURCE
Version: 3
Date: September 2006
Source: Carlo Trozzi
Techne Consulting
Italy
2 POINT OF ENQUIRY
Any comments on this chapter or enquiries should be directed to:
Carlo Trozzi
Techne Consulting
Via G. Ricci Curbastro, 34
1 Updated with particulate matter details by: Mike Woodfield, AEA Technology, UK, December 2006
COMBUSTION IN ENERGY & TRANSFORMATION INDUSTRIES
Activities - Several cc010104
B114-2 December 2006 Emission Inventory Guidebook
Roma, Italy
Tel: +39 065580993
Fax: +39 065581848
Email: [email protected]
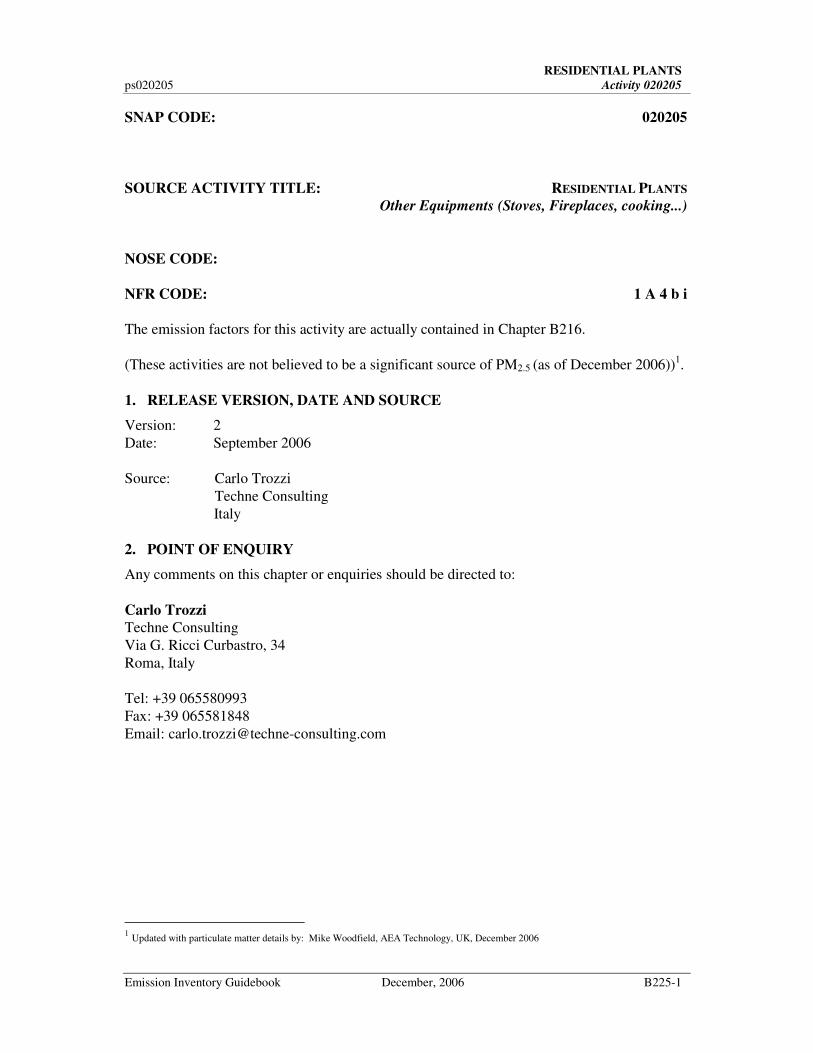
RESIDENTIAL PLANTS
ps020205 Activity 020205
Emission Inventory Guidebook December, 2006 B225-1
SNAP CODE: 020205
SOURCE ACTIVITY TITLE: RESIDENTIAL PLANTS
Other Equipments (Stoves, Fireplaces, cooking...)
NOSE CODE:
NFR CODE: 1 A 4 b i
The emission factors for this activity are actually contained in Chapter B216.
(These activities are not believed to be a significant source of PM2.5 (as of December 2006))1.
1. RELEASE VERSION, DATE AND SOURCE
Version: 2
Date: September 2006
Source: Carlo Trozzi
Techne Consulting
Italy
2. POINT OF ENQUIRY
Any comments on this chapter or enquiries should be directed to:
Carlo Trozzi
Techne Consulting
Via G. Ricci Curbastro, 34
Roma, Italy
Tel: +39 065580993
Fax: +39 065581848
Email: [email protected]
1 Updated with particulate matter details by: Mike Woodfield, AEA Technology, UK, December 2006
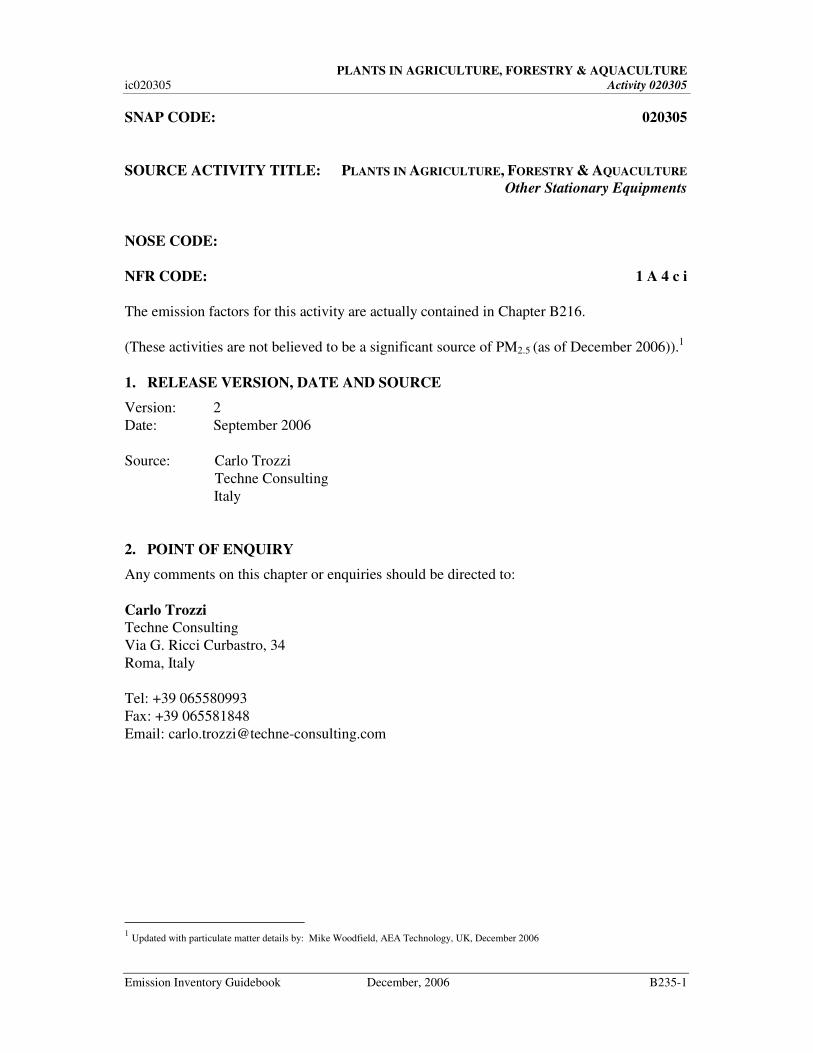
PLANTS IN AGRICULTURE, FORESTRY & AQUACULTURE
ic020305 Activity 020305
Emission Inventory Guidebook December, 2006 B235-1
SNAP CODE: 020305
SOURCE ACTIVITY TITLE: PLANTS IN AGRICULTURE, FORESTRY & AQUACULTURE
Other Stationary Equipments
NOSE CODE:
NFR CODE: 1 A 4 c i
The emission factors for this activity are actually contained in Chapter B216.
(These activities are not believed to be a significant source of PM2.5 (as of December 2006)).1
1. RELEASE VERSION, DATE AND SOURCE
Version: 2
Date: September 2006
Source: Carlo Trozzi
Techne Consulting
Italy
2. POINT OF ENQUIRY
Any comments on this chapter or enquiries should be directed to:
Carlo Trozzi
Techne Consulting
Via G. Ricci Curbastro, 34
Roma, Italy
Tel: +39 065580993
Fax: +39 065581848
Email: [email protected]
1 Updated with particulate matter details by: Mike Woodfield, AEA Technology, UK, December 2006