combustion issues in low-carbon fossil power plants for
TRANSCRIPT
Combustion issues in low-carbon fossil power
plants for the 21st Century
Robin Irons
E.ON Technologies Group, Technical Head, Zero Emission Power Plant
Combustion issues in low-carbon fossil power
plants for the 21st Century
Combustion issues in low-carbon fossil power
plants for the 21st Century
What is ‘acceptable’
combustion?
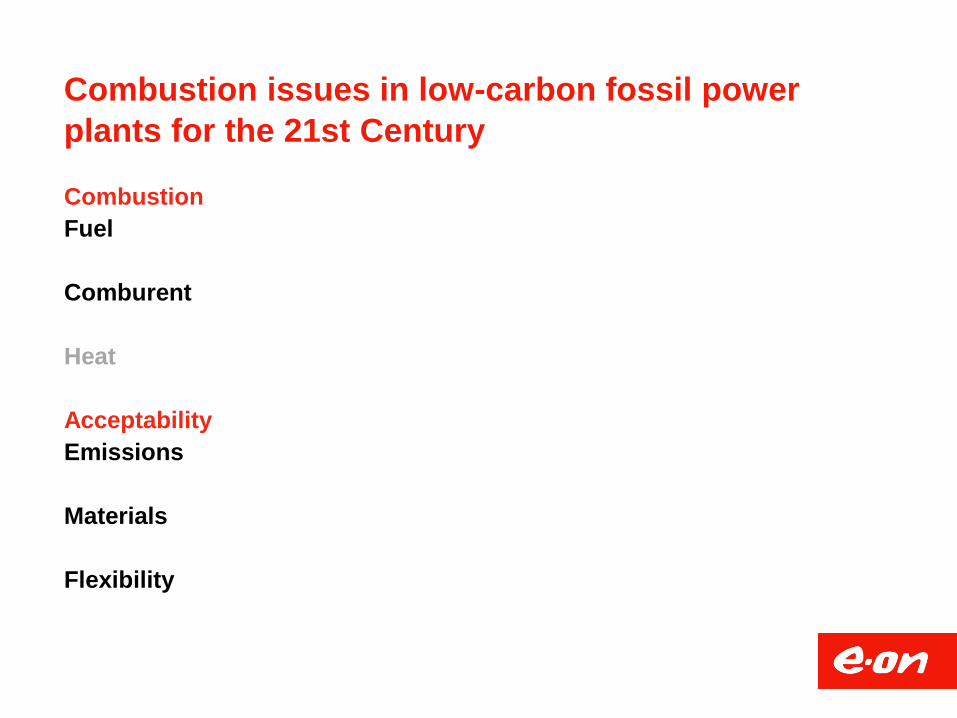
Combustion issues in low-carbon fossil power
plants for the 21st Century
Combustion
Fuel
Comburent
Heat
Acceptability
Emissions
Materials
Flexibility
The Fuel Diet

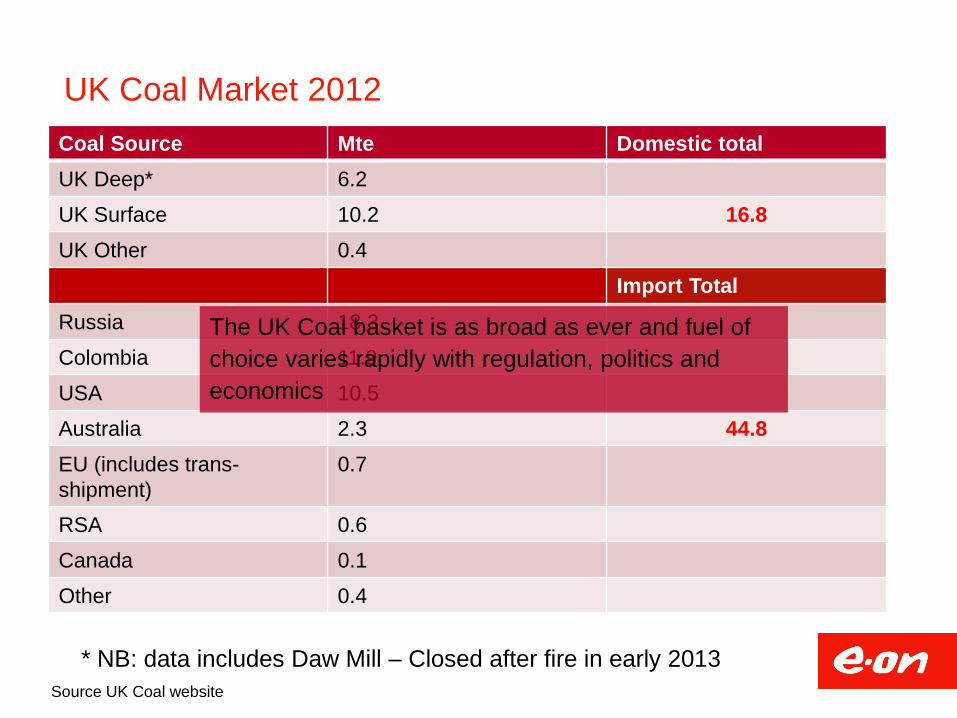
UK Coal Market 2012
Coal Source Mte Domestic total
UK Deep* 6.2
UK Surface 10.2 16.8
UK Other 0.4
Import Total
Russia 18.3
Colombia 11.9
USA 10.5
Australia 2.3 44.8
EU (includes trans-
shipment)
0.7
RSA 0.6
Canada 0.1
Other 0.4
Source UK Coal website
* NB: data includes Daw Mill – Closed after fire in early 2013
The UK Coal basket is as broad as ever and fuel of
choice varies rapidly with regulation, politics and
economics
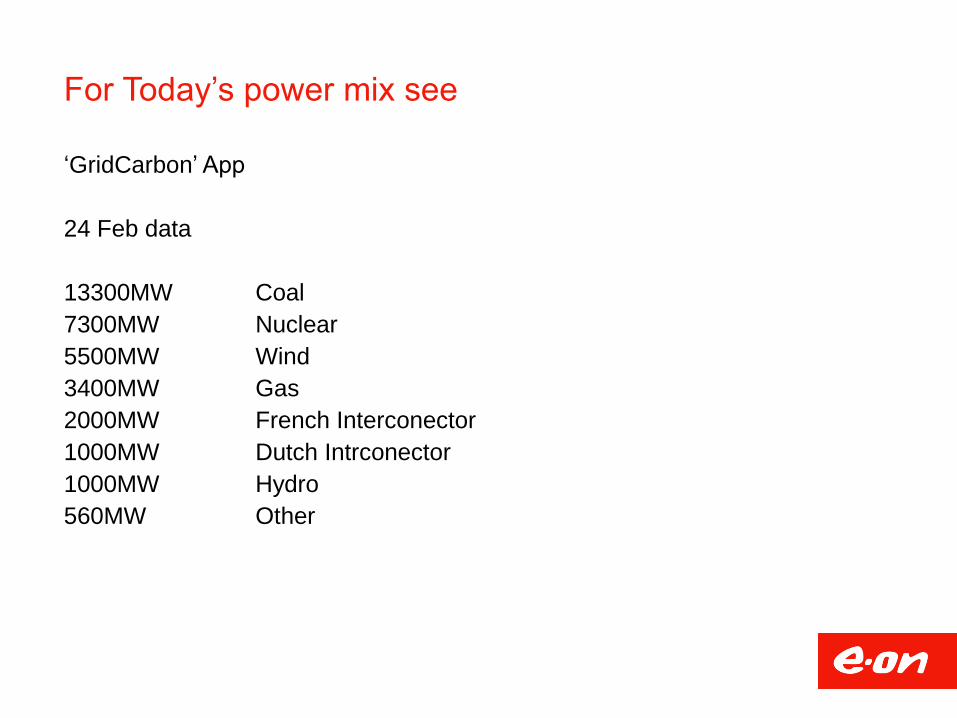
For Today’s power mix see
‘GridCarbon’ App
24 Feb data
13300MW Coal
7300MW Nuclear
5500MW Wind
3400MW Gas
2000MW French Interconector
1000MW Dutch Intrconector
1000MW Hydro
560MW Other
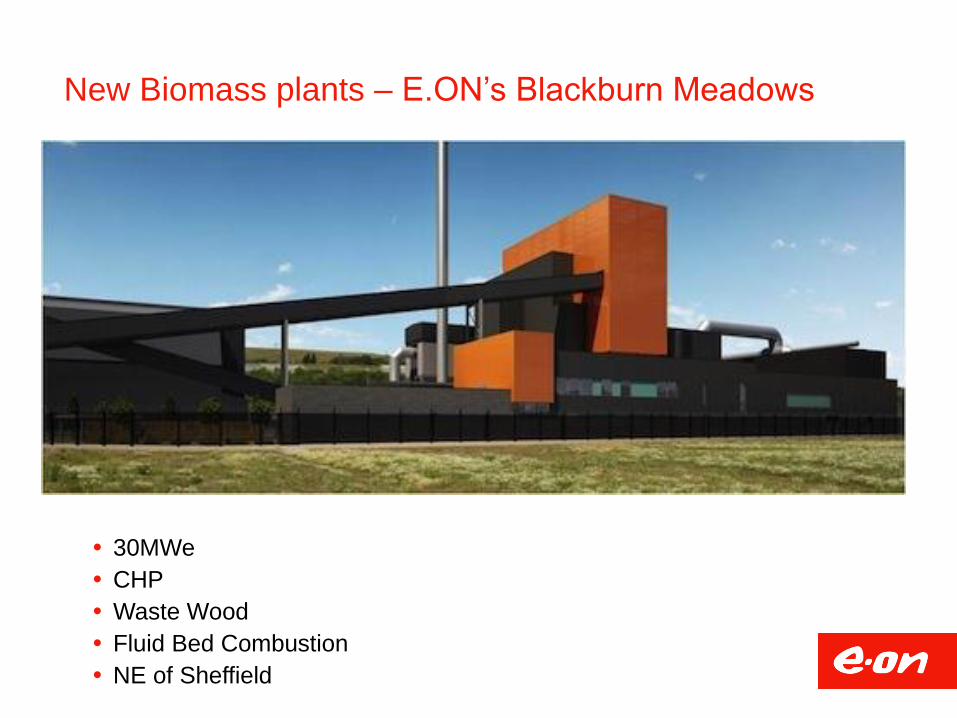
New Biomass plants – E.ON’s Blackburn Meadows
30MWe
CHP
Waste Wood
Fluid Bed Combustion
NE of Sheffield
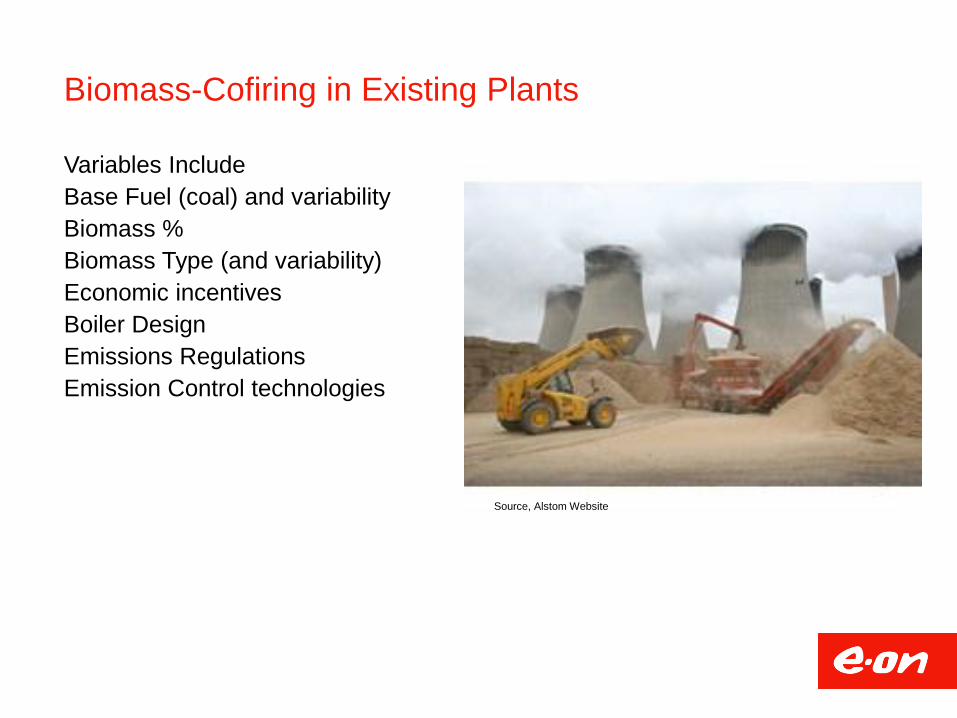
Biomass-Cofiring in Existing Plants
Variables Include
Base Fuel (coal) and variability
Biomass %
Biomass Type (and variability)
Economic incentives
Boiler Design
Emissions Regulations
Emission Control technologies
Source, Alstom Website

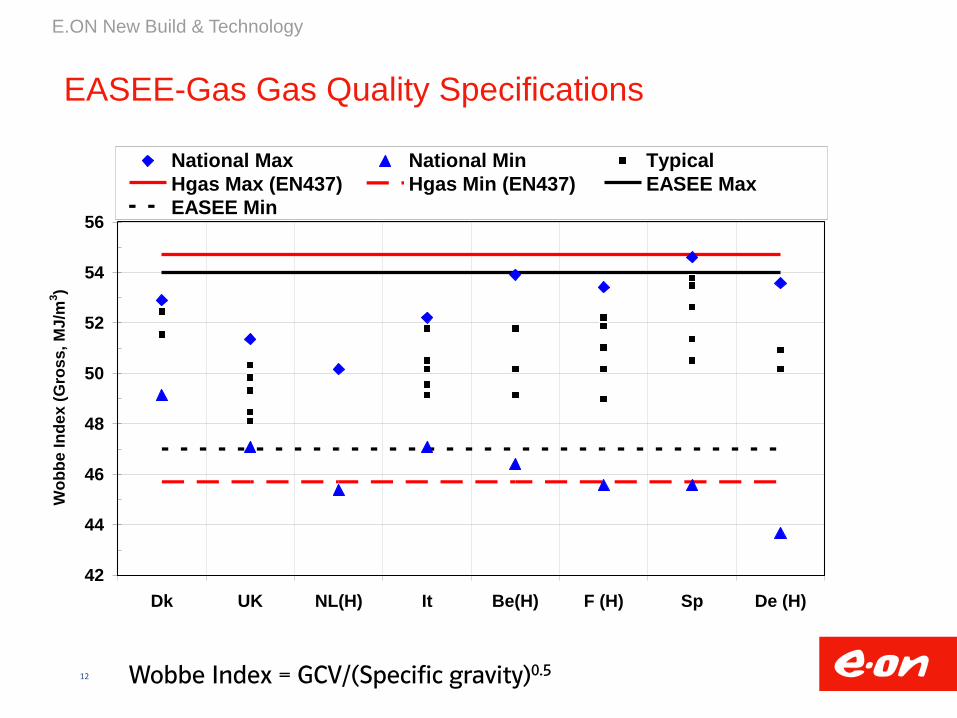
But natural gas is just natural gas, isn’t it…….?
12
E.ON New Build & Technology
EASEE-Gas Gas Quality Specifications
42
44
46
48
50
52
54
56
Dk UK NL(H) It Be(H) F (H) Sp De (H)
Wo
bb
e I
nd
ex (
Gro
ss,
MJ
/m3)
National Max National Min Typical
Hgas Max (EN437) Hgas Min (EN437) EASEE Max
EASEE Min
Wobbe Index = GCV/(Specific gravity)0.5
E.ON New Build & Technology
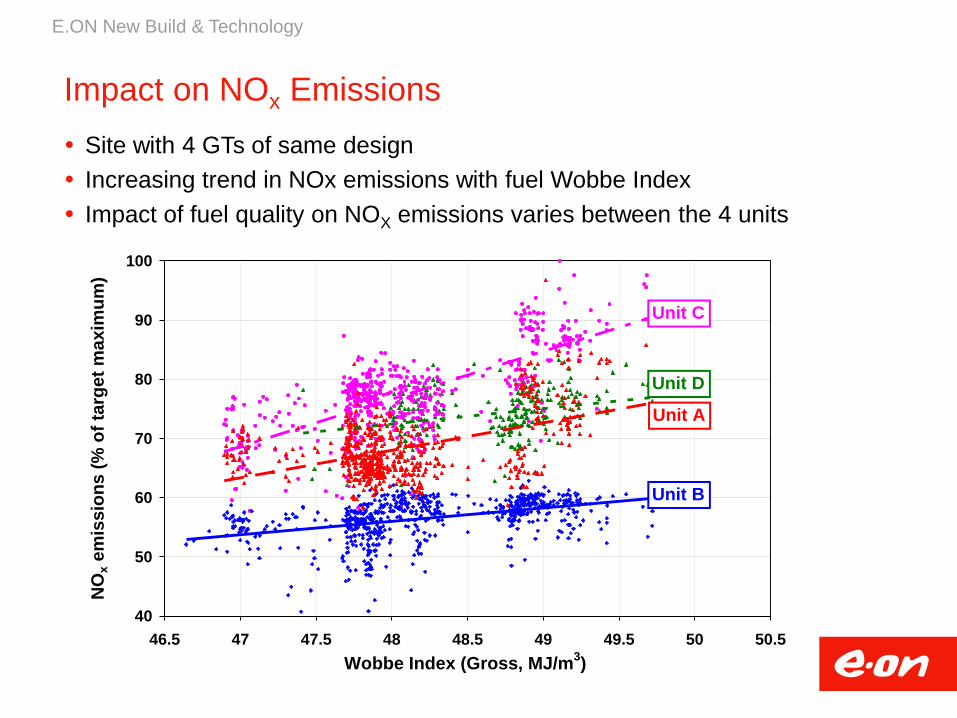
Impact on NOx Emissions
40
50
60
70
80
90
100
46.5 47 47.5 48 48.5 49 49.5 50 50.5
Wobbe Index (Gross, MJ/m3)
NO
x e
mis
sio
ns (
% o
f ta
rget
maxim
um
)
Unit C
Unit D
Unit A
Unit B
Site with 4 GTs of same design
Increasing trend in NOx emissions with fuel Wobbe Index
Impact of fuel quality on NOX emissions varies between the 4 units

14
E.ON New Build & Technology
Potential for Hydrogen
Black line represents EASEE-Gas quality specification
33
35
37
39
41
43
45
47
0.5 0.55 0.6 0.65 0.7 0.75
Relative Density (-)
Calo
rifi
c V
alu
e (
Gro
ss,
MJ/m
³)
Increasing
Inerts
Increasing non-
methane hydrocarbons
Pure Methane
WI = 54MJ/m3
WI = 47MJ/m3
Typical UK
Natural Gas
5% H2
10% H2
15% H2
20% H2
Increasing H2
10% H2 + 6%
Propane
Significant amounts of hydrogen can be accommodated within the EASEE-Gas envelope
This could cause significant issues for gas turbines
15
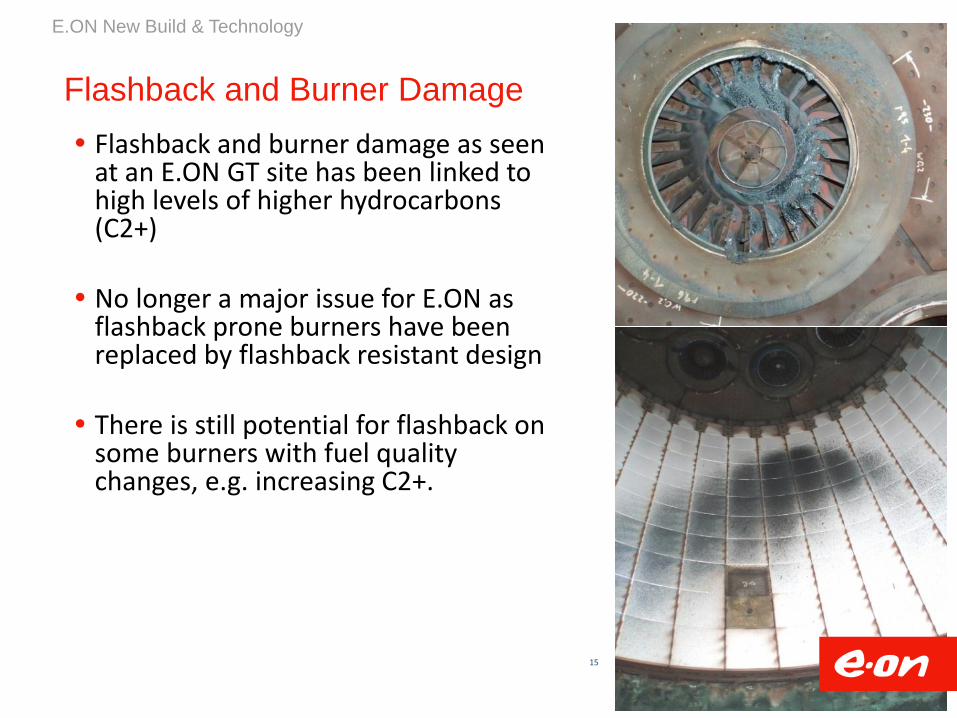
Flashback and burner damage as seen at an E.ON GT site has been linked to high levels of higher hydrocarbons (C2+)
No longer a major issue for E.ON as flashback prone burners have been replaced by flashback resistant design
There is still potential for flashback on some burners with fuel quality changes, e.g. increasing C2+.
E.ON New Build & Technology
Flashback and Burner Damage

New Areas for Power Plant
Is CCS Relevant to Combustion Issues?
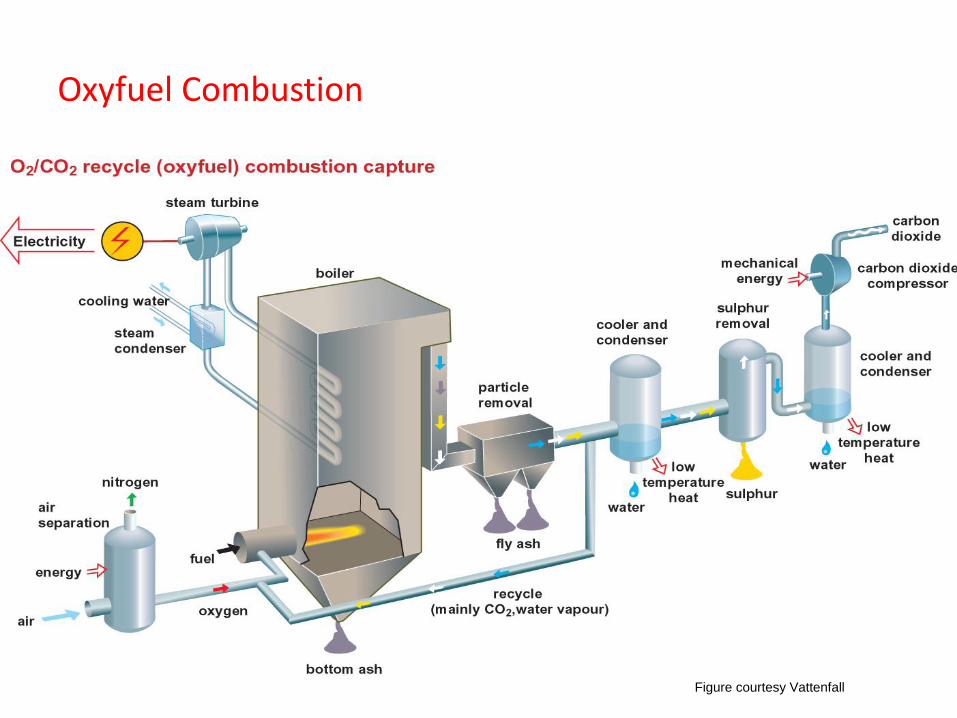
Figure courtesy Vattenfall
Oxyfuel Combustion
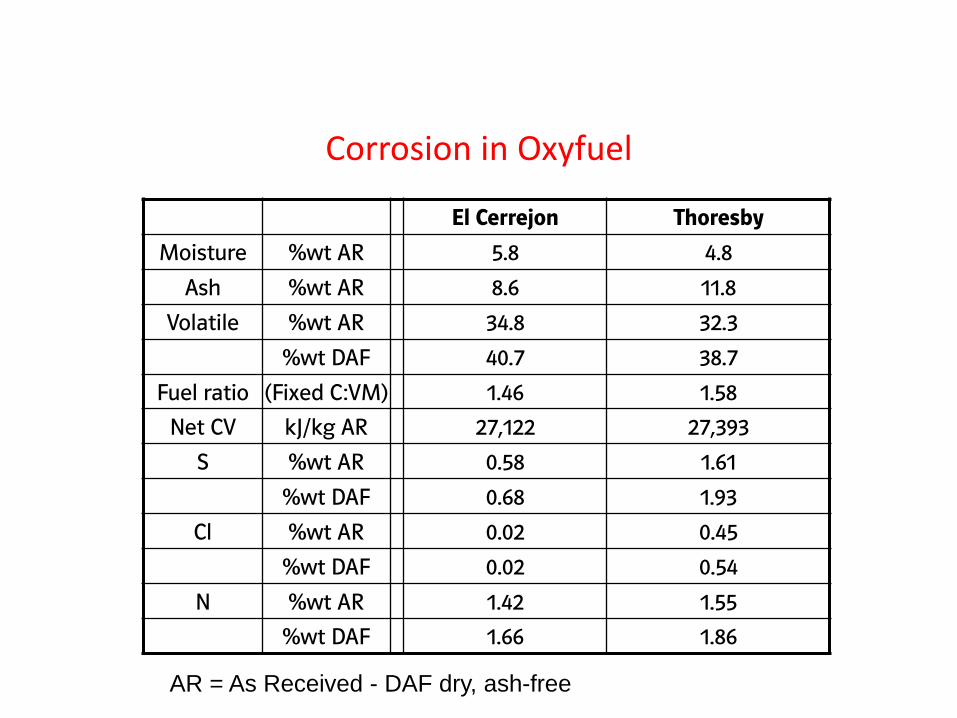
Corrosion in Oxyfuel
El Cerrejon Thoresby
Moisture %wt AR 5.8 4.8
Ash %wt AR 8.6 11.8
Volatile %wt AR 34.8 32.3
%wt DAF 40.7 38.7
Fuel ratio (Fixed C:VM) 1.46 1.58
Net CV kJ/kg AR 27,122 27,393
S %wt AR 0.58 1.61
%wt DAF 0.68 1.93
Cl %wt AR 0.02 0.45
%wt DAF 0.02 0.54
N %wt AR 1.42 1.55
%wt DAF 1.66 1.86
AR = As Received - DAF dry, ash-free

CORROSION - AIR
El Cerrejon Air-Fuel
1.00E-14
1.00E-13
1.00E-12
1.00E-11
1.00E-10
1.00E-09
400 450 500 550 600 650 700
Temperature (oC)
95%
ile P
ara
bolic
Rate
(cm
2s
-1)
T22
E1250
TP347HFG
HR3C
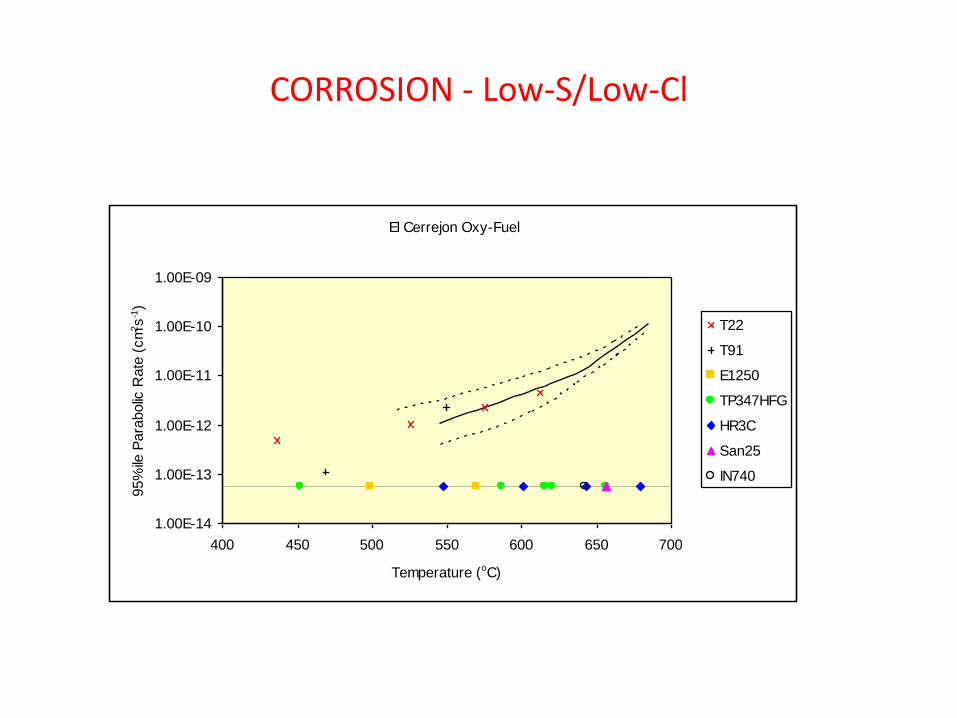
CORROSION - Low-S/Low-Cl
El Cerrejon Oxy-Fuel
1.00E-14
1.00E-13
1.00E-12
1.00E-11
1.00E-10
1.00E-09
400 450 500 550 600 650 700
Temperature (oC)
95%
ile P
ara
bolic
Rate
(cm
2s
-1)
T22
T91
E1250
TP347HFG
HR3C
San25
IN740
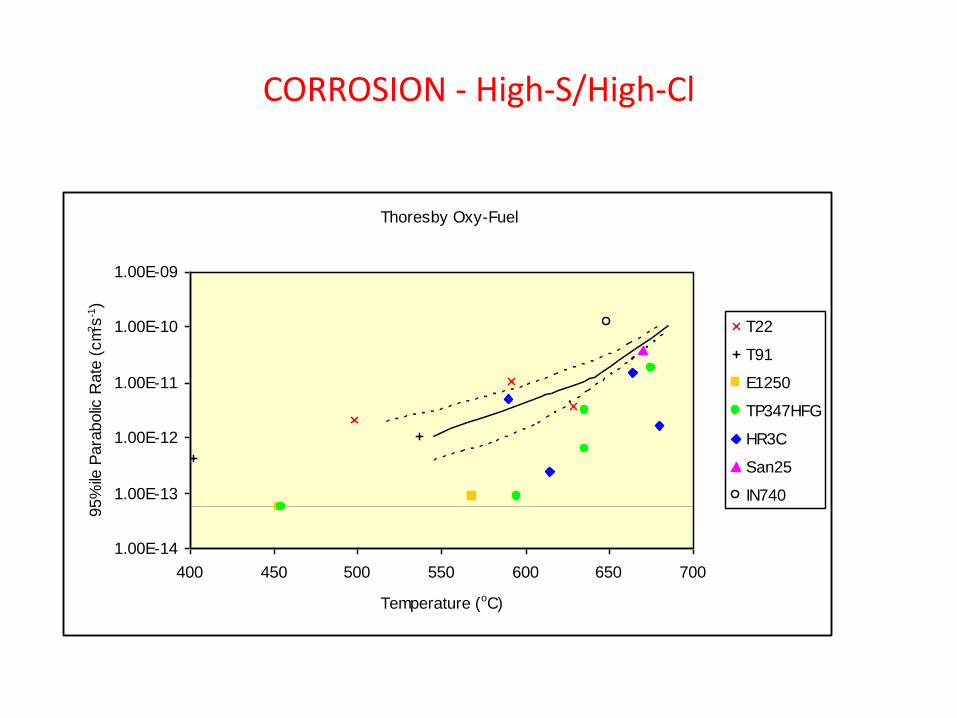
CORROSION - High-S/High-Cl
Thoresby Oxy-Fuel
1.00E-14
1.00E-13
1.00E-12
1.00E-11
1.00E-10
1.00E-09
400 450 500 550 600 650 700
Temperature (oC)
95%
ile P
ara
bolic
Rate
(cm
2s
-1)
T22
T91
E1250
TP347HFG
HR3C
San25
IN740
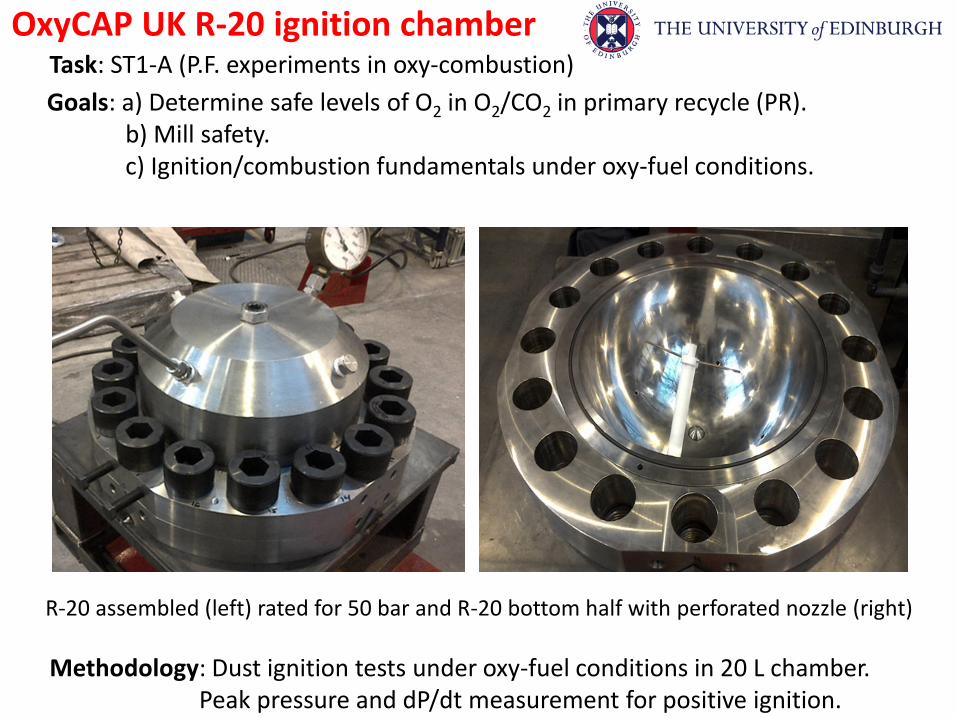
OxyCAP UK R-20 ignition chamber
Goals: a) Determine safe levels of O2 in O2/CO2 in primary recycle (PR). b) Mill safety. c) Ignition/combustion fundamentals under oxy-fuel conditions.
Task: ST1-A (P.F. experiments in oxy-combustion)
Methodology: Dust ignition tests under oxy-fuel conditions in 20 L chamber. Peak pressure and dP/dt measurement for positive ignition.
R-20 assembled (left) rated for 50 bar and R-20 bottom half with perforated nozzle (right)
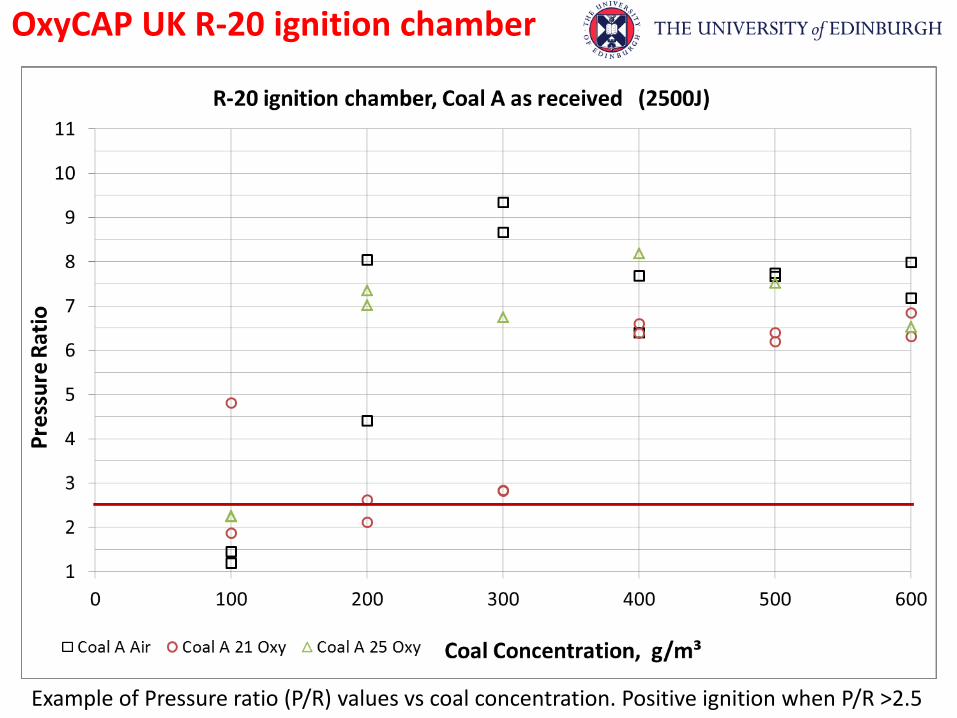
OxyCAP UK R-20 ignition chamber
Example of Pressure ratio (P/R) values vs coal concentration. Positive ignition when P/R >2.5
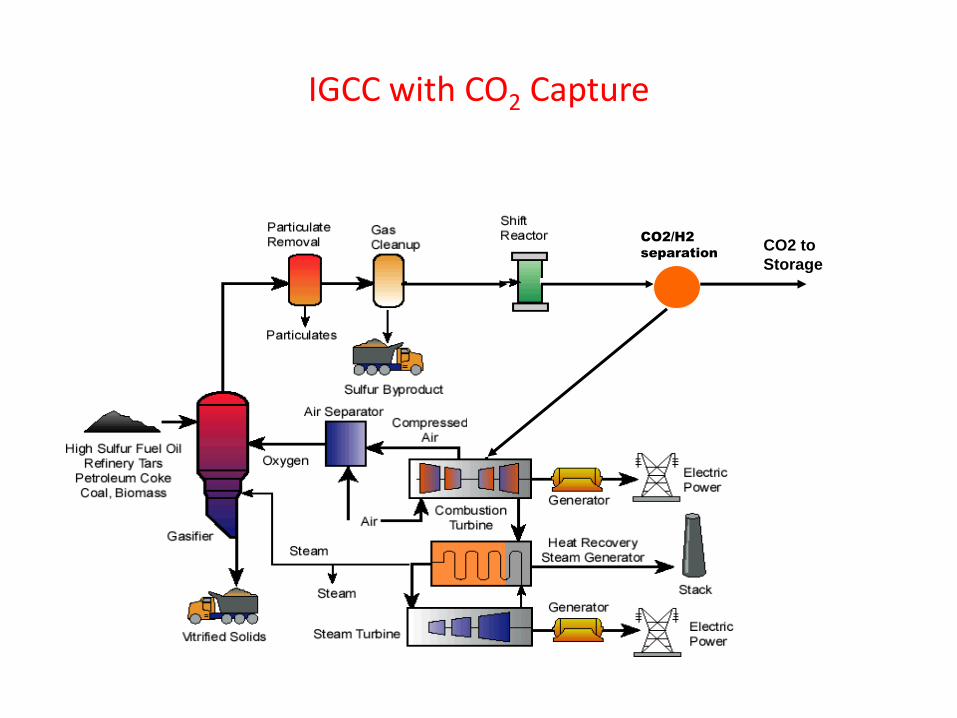
CO2/H2
separation CO2 to
Storage
IGCC with CO2 Capture
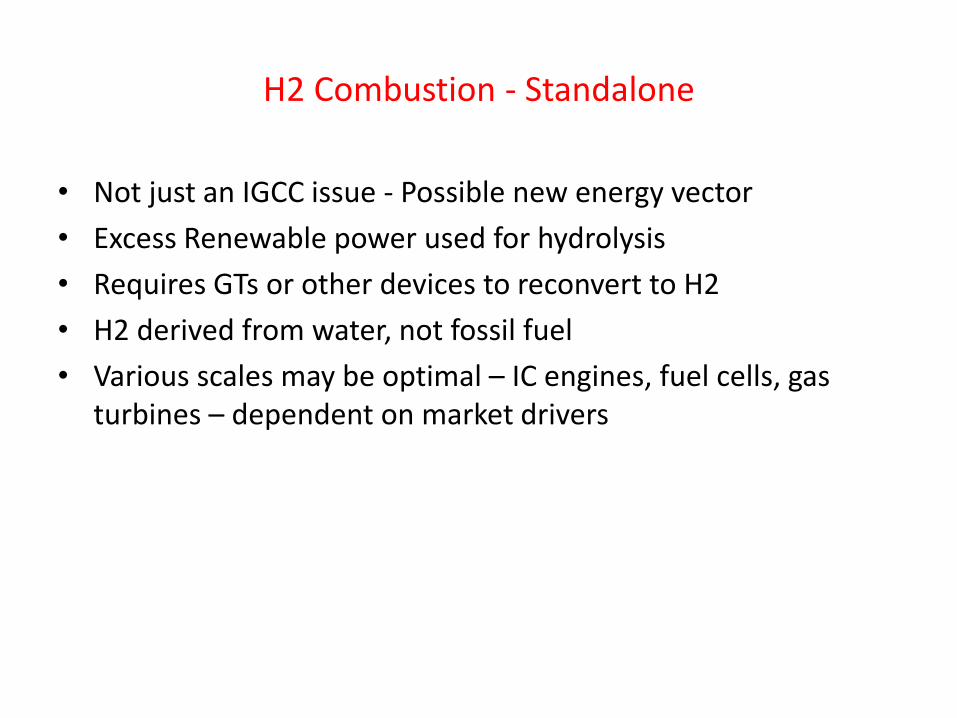
H2 Combustion - Standalone
• Not just an IGCC issue - Possible new energy vector
• Excess Renewable power used for hydrolysis
• Requires GTs or other devices to reconvert to H2
• H2 derived from water, not fossil fuel
• Various scales may be optimal – IC engines, fuel cells, gas turbines – dependent on market drivers
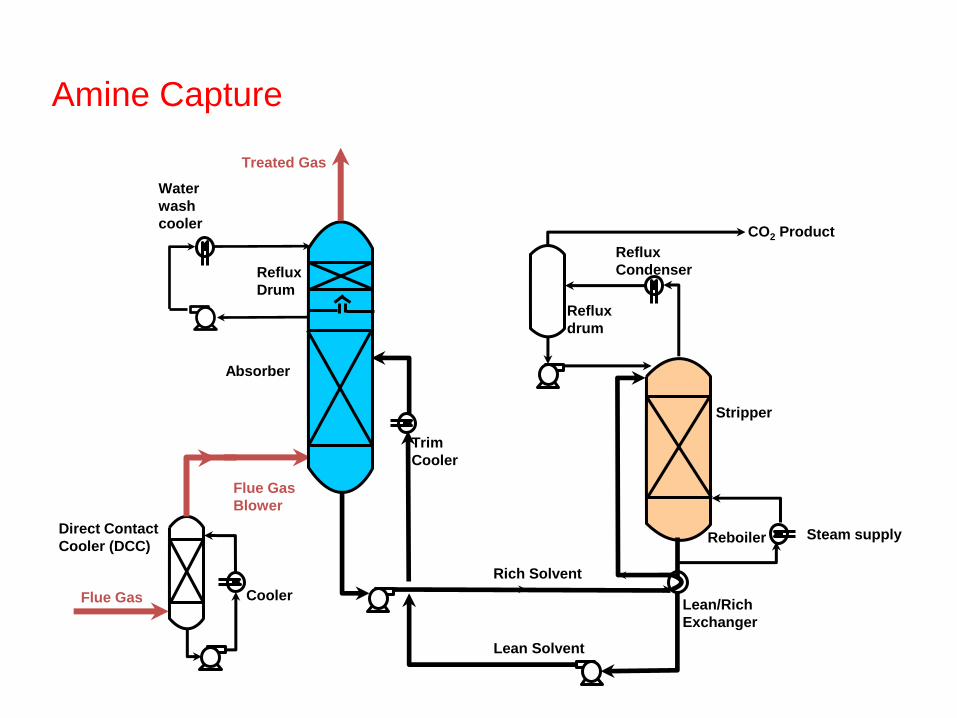
Direct Contact
Cooler (DCC)
Flue Gas
Trim
Cooler
Reflux
Drum
Treated Gas
Cooler
Flue Gas
Blower
Absorber
Reflux
Condenser
CO2 Product
Stripper
Reboiler
Lean/Rich
Exchanger
Rich Solvent
Lean Solvent
Reflux
drum
Water
wash
cooler
Steam supply
Amine Capture
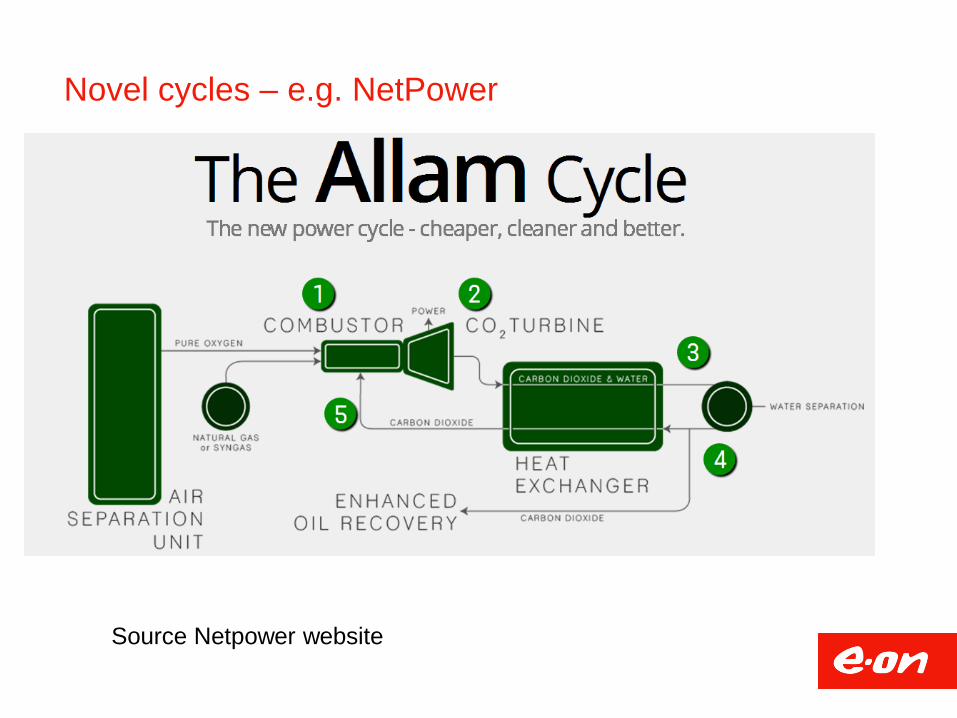
Novel cycles – e.g. NetPower
Source Netpower website
Aspects of the Allam Cycle
Pure O2 – from ASU
Gas
Bulk flow CO2
High Pressure
High Temperature
High inerts (CO2) concentration
High Efficiency
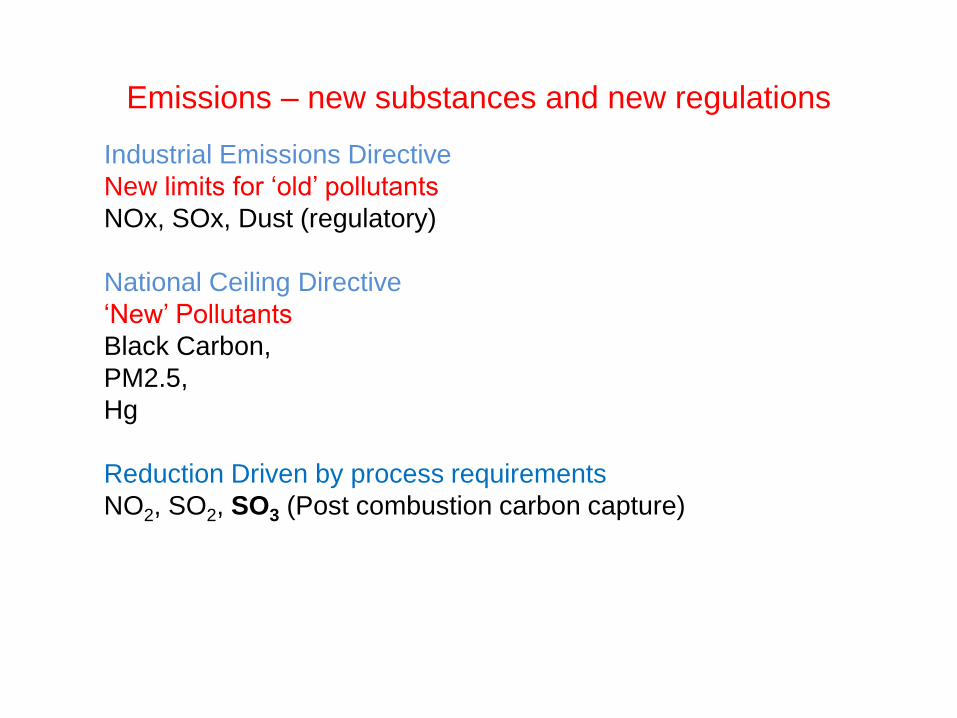
Industrial Emissions Directive
New limits for ‘old’ pollutants
NOx, SOx, Dust (regulatory)
National Ceiling Directive
‘New’ Pollutants
Black Carbon,
PM2.5,
Hg
Reduction Driven by process requirements
NO2, SO2, SO3 (Post combustion carbon capture)
Emissions – new substances and new regulations
Flexibility
Lower load
Emissions maintained across a wider range of loads
Improved control for faster pickup
Interaction with materials
Conclusions
The fundamentals of combustion haven’t changed
The market-place continues to change requiring new innovations as
Fuel composition changes – sourcing/blending/regulation/innovation
Emissions constraints tighten
Operational requirements mean old plants must operate in different ways
New Cycles/configurations come to market.
All offer new RD&D challenges in the field of combustion.