combustion turbine inlet cooling using wet...
TRANSCRIPT

Combustion Turbine Inlet Cooling using Wet CompressionpBy Don Shepherd – Caldwell Energy Company
Sponsored by:
Turbine Inlet Cooling Association (TICA)
April 17, 2013; 1 PM (U.S. Central Time)http://www.meetingzone.com/presenter/default.aspx?partCEC=4147918http://www.meetingzone.com/presenter/default.aspx?partCEC 4147918
Call-In Number: 1 877 406 7969Access Code: 4147918 #

Annette Dwyer• Munters Corporation• Munters Corporation• Chairman, TICA
Don ShepherdDon ShepherdCaldwell Energy CompanyTICA Board Member

Who is TICA?
The Turbine Inlet Cooling Association (TICA) promotes the development and exchange of knowledge related to
Who is TICA?
the development and exchange of knowledge related to gas turbine inlet cooling
The TICA website is one-stop source of TIC technical information, including Installation Database & Performance Calculator
TICA is a non-profit organization.

TICA Member Benefits
Access to full/detailed version of TIC Installation Database
TICA Member Benefits
Access to full/detailed version of the TIC Technology Performance CalculatorPerformance Calculator
GT Users get access to the TIC Forum
Suppliers have access to information space on the TICA Website and access to booths at various electric powerWebsite and access to booths at various electric power trade shows
Become a Become a MemberMemberMember Member Today!!!Today!!!

Turbine Inlet Cooling Technologies
Upcoming Webinar Schedule
December 19, 2012: Chiller Systems
February 13, 2013: Thermal Energy Storage
April 17 2013: Wet CompressionApril 17, 2013: Wet Compression
June 19, 2013: Hybrid Systems
All Webinars start at 1 PM (U.S. Central Time)

Agenda:g• Why Cool Combustion Turbines (CT)• How Wet Compression Works• How Wet Compression Works• Components of Wet Compression systems• Things to Consider before applying Wet Compression on CT’sThings to Consider before applying Wet Compression on CT s • Quick Comparison to Other Cooling Technologies• Why Apply Wet Compression on Combustion TurbinesWhy Apply Wet Compression on Combustion Turbines
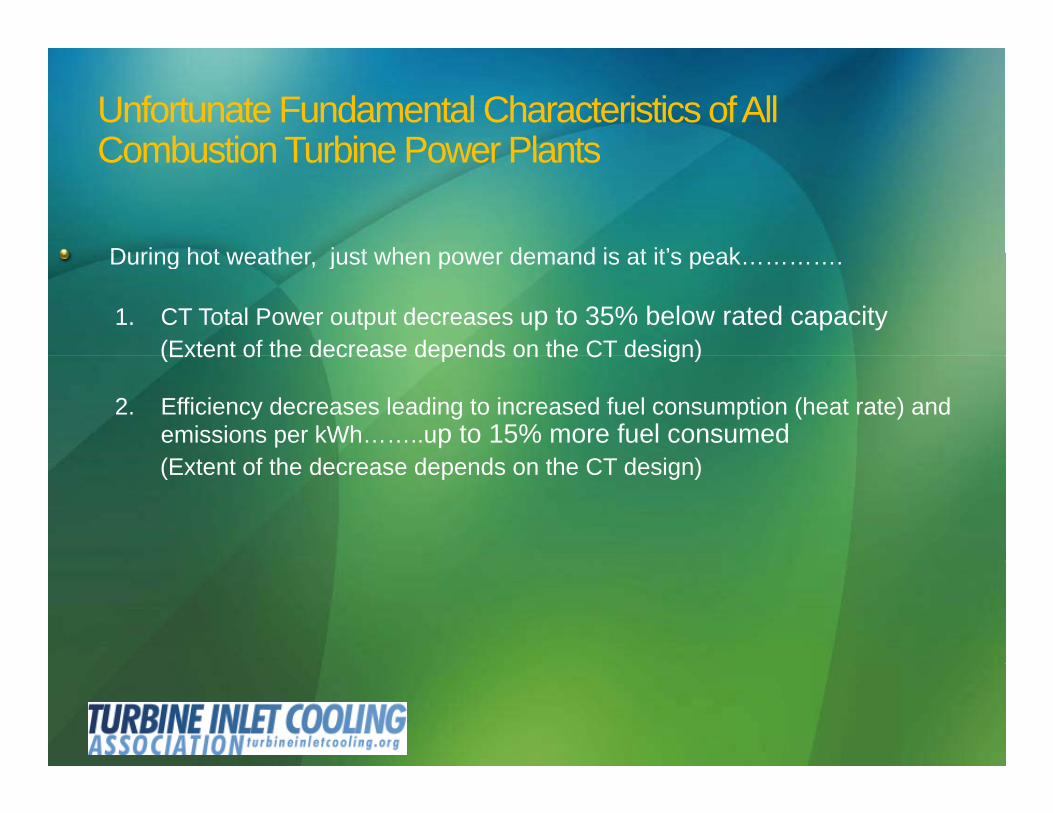
Unfortunate Fundamental Characteristics of All Combustion Turbine Power PlantsCombustion Turbine Power Plants
During hot weather just when power demand is at it’s peakDuring hot weather, just when power demand is at it s peak………….
1. CT Total Power output decreases up to 35% below rated capacity(Extent of the decrease depends on the CT design)(Extent of the decrease depends on the CT design)
2. Efficiency decreases leading to increased fuel consumption (heat rate) and emissions per kWh……..up to 15% more fuel consumed(E f h d d d h CT d i )(Extent of the decrease depends on the CT design)

Why CT Power Output Capacity Decreases with Increase in Ambient Temperature?Increase in Ambient Temperature?
• Power output of a turbine is proportional to the mass flow rate of hot f th b t th t t th t bigases from the combustor that enter the turbine
• Mass flow rate of combustor gases is proportional to the flow rate of the compressed air that enters the combustor
• Compressors provide compressed air and are volumetric machines, limited by the volumetric flow rate of inlet air they can pull or suck in
• As ambient temperature increases, the air density decreases. This results in a decrease of the mass air flow rate
• Reduced mass flow rate of inlet air reduces the mass flow rate of the• Reduced mass flow rate of inlet air reduces the mass flow rate of the combustor gases and hence reduced power out put of turbine

Why CT Efficiency Decreases with Increase in Ambient Temperature?Temperature?
• Compressor of a CT system consumes almost two-third of the turbine’s gross outputg oss output
• Compressor requirement increases with increase in air temperature
Increased power required by the compressor reduces the net electric• Increased power required by the compressor reduces the net electric power available from the CT system

Effect of Hot Weather on CT Generation Capacity Depends on CT Designon CT Design
EFFECTS OF COMPRESSOR INLET AIR TEMPERATUREON GAS TURBINE POWER OUTPUTON GAS TURBINE POWER OUTPUT
100%
105%
ER
PERIOD OF GREATEST DEMAND
Up to 19%
90%
95%
F R
ATE
D P
OW
E
OLD "FRAME"POWER OUTPUT
Compression Ratio = 10NEW AERO-DERIVATIVE
ISO DESIGN POINT
capacity loss at peak
80%
85%
% O POWER OUTPUT
Compression Ratio = 30
POINTdemand for this CT
80%50 55 60 65 70 75 80 85 90 95 100
COMPRESSOR INLET AIR TEMPERATURE, degrees F

Turbine Inlet Cooling Overcomes the Effects of the CT CharacteristicDuring Hot WeatherCharacteristicDuring Hot Weather
Rated Capacity With Wet Compression
95
100
of D
esig
n
85
90
er O
utpu
t,% o
No CoolingWith TIC
With Cooling
No Cooling
75
80
85
Net
CT
Pow
e With TIC Rated Capacity
No Cooling
7560 70 80 90 100
Ambient Dry-Bulb Temperature, F

Why Use Wet Compression for Turbines y p
Wet Compression (WC) provides a cost-effective and energy-efficient mean to increase a CT’s output during hot weather
Wet Compression is an environmentally beneficial means to enhance power generation capacity.
Wet Compression is complementary to all other inlet cooling technologiesWet Compression is complementary to all other inlet cooling technologies
Wet Compression is highly reliable, available when needed, with very low maintenance requirements

COMPRESSOR EFFICIENCY DRAMATICALLY IMPROVEDCOMPRESSOR EFFICIENCY DRAMATICALLY IMPROVED Water Inter‐cools the CT compressor
Mass flow enhancementMass flow enhancement
Lower CDT allows more fuel to be fired (at constant firing temperature)
Cools air to very near WBT @ bell‐mouthAdiabatic Cooling of inlet airU ll t d ith i ti f l hillUsually operated with an existing fogger, evap cooler, or chiller upstream
Overall net impact: 12‐15 MW on a GE 7EA, simple cyclep , p y


Air
1.75% Wet Compression:
fuel +13%
Base Case: 85% fogging @ 95 / 75°F
AirFuel
Gen Comp TurbExhaust
1.75% H2O
Gen Comp TurbExhaust
Power +18% NOx 38 ppm
Flow + 2.5%
NOx 42 ppm
Flow 2.5%Enthalpy + 10%
Most plants will not exceed 40 tons per year of “Criteria Pollutants” (NOx, SOx, CO, UHC),
therefore not triggering NSR / PSSDtherefore not triggering NSR / PSSD

silencing panels
Remove elbow for access, and line wetted f / SSTypical Fogging
nozzle locationsurfaces w/ SS
lining


Advantages WithAdvantages With Nessie High Pressure Water Pumps PAH/PAHT Nessie High Pressure Water Pumps PAH/PAHT 5050‐‐100/90100/90
• Axial piston pump:• Based upon well know principle from oil
hydraulics.
• Swash plate type with fixed displacement.
• Various displacements in same frame.
• High efficiency• Compact design• 50 ‐ 100 cc/rev
/• 68 – 145 litre/min output flow
• 160 Bar Continuous pressure• AISI 316 Stainless Steel
Housing

Duct work conditionMaterials of construction
Drain System
Obstructions
Lube Oil System Capacity
Generator Capacity

Rotor Grounding
Guide vane Guide vane
Water Source
Control System IntegrationControl System Integration
18 years of patented WC experience shows no failures
This is not “spray and pray”This is not spray and pray
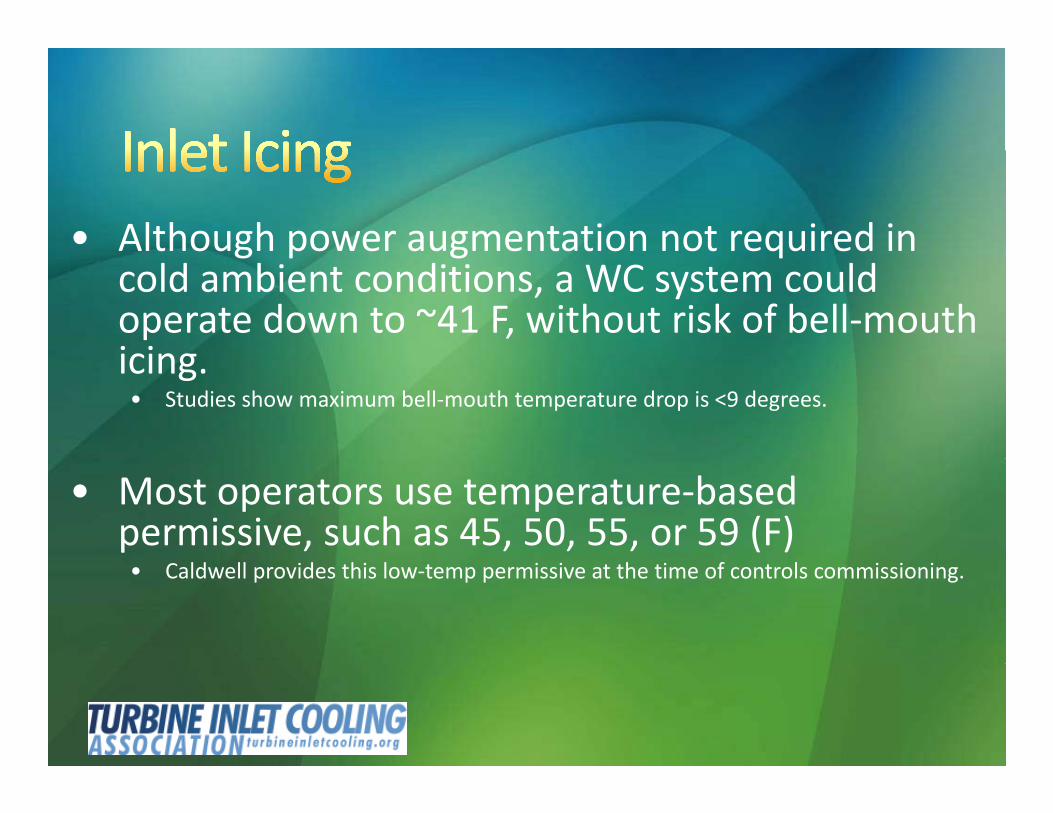
• Although power augmentation not required in g p g qcold ambient conditions, a WC system could operate down to ~41 F, without risk of bell‐mouth icingicing. • Studies show maximum bell‐mouth temperature drop is <9 degrees.
• Most operators use temperature‐based permissive, such as 45, 50, 55, or 59 (F)• Caldwell provides this low‐temp permissive at the time of controls commissioning.
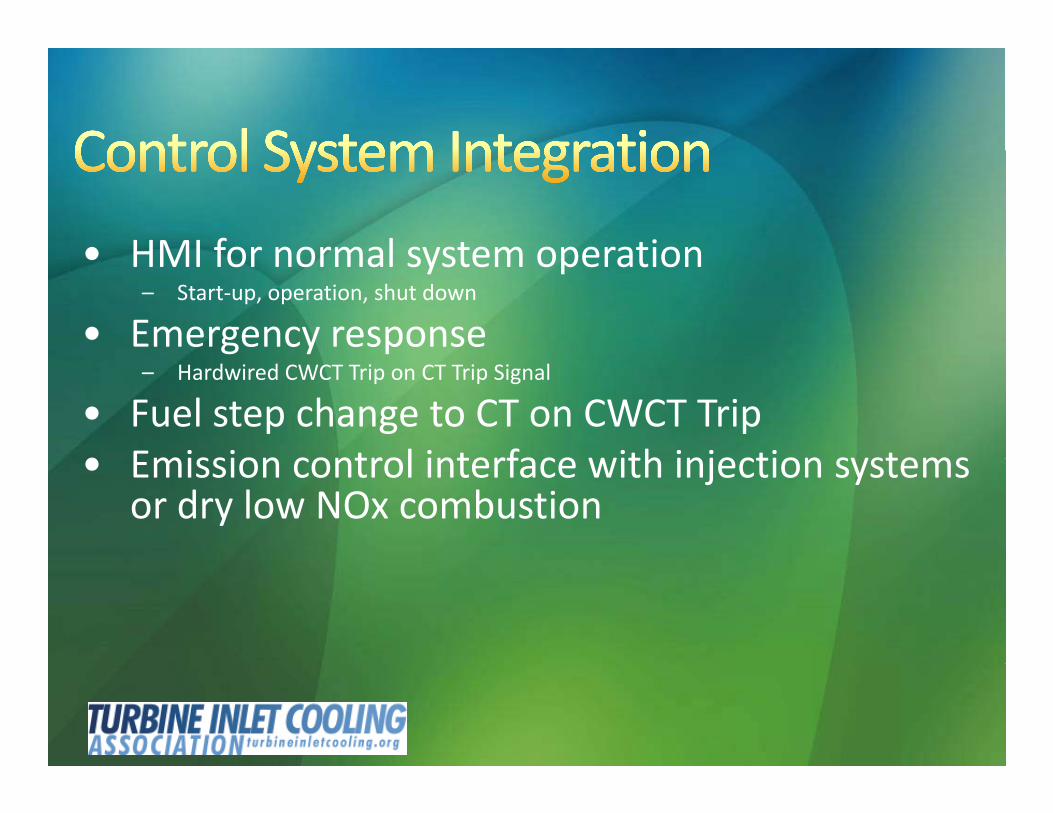
• HMI for normal system operation• HMI for normal system operation– Start‐up, operation, shut down
• Emergency response– Hardwired CWCT Trip on CT Trip Signal
• Fuel step change to CT on CWCT Trip• Emission control interface with injection systems• Emission control interface with injection systems
or dry low NOx combustion

How Wet Compression Compares
Fog Media Mechanical Chilling
Wet Compression
100 MW CT in Houston (98F/75F)
g Chilling CompressionDeg of Cooling 22 F 20 F 50 F NA
Water 95GPM (atWater Evaporated 28 GPM 25 GPM 95GPM (at
Cooling Tower) 100 GPM
Blow Down 5 GPM 10 GPM 42 GPM 15 GPM
Parasitic Power Loss 45 kW 10 kW 4250 kW 150 kW
Insertion l 0 1”wg 0 4”wg 1 2”wg 0 25 WGloss 0.1 wg 0.4 wg 1.2 wg 0.25 WG
Increased MW 5.2 4.8 12 14

Table 1: Performance Comparison of Various Combustion Turbines
Combustion Siemens Siemens GE GE Frame SWPC Alstom GE FrameTurbine W501FC V84.2 LM2500PE 6B W501D5A GT-24 7EA
Overspray, % 1.3 1.0 2 1 2 1.2 1.5%
CompressorDischarge
90 50 Data notavailable
50 100 48 90g
TemperatureReduction, °F
Fuel FlowIncrease, %
N.D. N.D. 4 8.2 13.2 5.5 11.5%
Change in No No No Change No No No No ChangeChange inBase Load FiringTemperature,
ºF
NoChange
NoChange
No Change No Change
No Change
NoChange
No Change
CT Power Increase, MW
17 5.2 1.6 3.3 15 15.5 14.9
Steam Turbine Power
SimpleCycle
SimpleCycle
-.5 0.3 (est.) 2 (est.) 1.8(est.) SimpleCycle
Power Increase, MW
CT Heat Rate Improvement, %
N.D. 2 0 1 2 2 1.05%
NOx Info -10% N.D. -14% DLN DLN NoChange -24%

Why Use Wet Compression
One of the most cost effective solutions
y p
One of the most cost effective solutionsLowest first install costLow operating costsLow maintenance costComplementary to other cooling methods10% to 20% Increase in outputBetter Heat Rate on Simple Cycle unit
SimpleTo understandTo maintain
100’s of successful installations Worldwide

Low Maintenance
D i d t t f f i ll• Drain and protect from freezing – seasonally
• Clean filters once a year
• Change nozzles 4 to 5 yrs
• Replace or service pumps – 3 to 5 yrs
• Calibrate Instruments once a year

Thank YouAnd Don’t Forget to JoinAnd Don t Forget to Join
TICATICA