comment: distinguishing cohort effects from age period effects on non-marital fertility
TRANSCRIPT

Comment: Distinguishing Cohort Effects from Age Period Effects on Non-Marital FertilityAuthor(s): Steve MartinSource: Social Forces, Vol. 87, No. 3 (Mar., 2009), pp. 1481-1489Published by: Oxford University PressStable URL: http://www.jstor.org/stable/40345168 .
Accessed: 14/06/2014 10:00
Your use of the JSTOR archive indicates your acceptance of the Terms & Conditions of Use, available at .http://www.jstor.org/page/info/about/policies/terms.jsp
.JSTOR is a not-for-profit service that helps scholars, researchers, and students discover, use, and build upon a wide range ofcontent in a trusted digital archive. We use information technology and tools to increase productivity and facilitate new formsof scholarship. For more information about JSTOR, please contact [email protected].
.
Oxford University Press is collaborating with JSTOR to digitize, preserve and extend access to Social Forces.
http://www.jstor.org
This content downloaded from 194.29.185.230 on Sat, 14 Jun 2014 10:00:14 AMAll use subject to JSTOR Terms and Conditions
Comment: Distinguishing Cohort Effects from Age*Period Effects on Non-Marital Fertility
Steve Martin, University of Maryland
In the article "Cohort Effects on Non-marital Fertility," in this issue of Social Forces, Jean Stockard employs a novel strategy for disentangling cohort, period and age effects on the non-marital fertility ratio. In a model with fixed-effect controls for age and for time period, the author documents evidence for three cohort-specific factors affecting the non-marital birth ratio of a given cohort ages 20-44. The first is the non-marital birth ratio at the time a cohort is born. The second is the cohort percent enrolled in school at ages 18-21. The third is the cohort sex ratio at ages 20-24. In models for non-hispanic whites, two of these cohort variables have statistically significant coefficients, and in models for non-Hispanic blacks, all three variables have statistically significant coefficients.
Social researchers have often debated the relative importance of period and cohort effects on demographic processes (Namboodiri 1981 ; Pullum 1980). Stockard's finding, if it holds, would clearly strengthen the overall case for cohort effects. Unfortunately, the technique Stockard uses to identify cohort effects is open to an alternative interpretation. The cohorts in this analysis are censored in a manner typical of time-series data, and as a result, age-period interactions can create the appearance of a cohort effect. If the age*period interpretation holds, the cohort variables described by the authors have only a coincidental relationship with trends in the non-marital birth ratio.
In this comment, I begin by describing the cohort effect on non-marital birth ratios as it is described by Stockard. Then I explain how the same observed pattern could arise from an age-period interaction. Finally, I offer two arguments that would favor the age-period interpretation over the cohort interpretation. I limit my analysis to the results for non-Hispanic whites; results for non-Hispanic blacks and their interpretation are generally analogous to the results and interpretation for non-Hispanic whites.
A Cohort Effect?
Stockard analyzes non-marital fertility across five-year age categories: 20-24, 25-29, 30-34,35-39 and 40-44, and across five-year intervals from 1972 to 2002. This age range and time period includes partial or complete information from 11 five-year birth cohorts beginning with the 1928-1932 birth cohort (Cohort 1 ) and ending with the 1 978-1 982 birth cohort (Cohort 1 1 ).
In regression analyses, Stockard estimates fixed effects for each five- year age category and each five-year period. Key explanatory variables
© The University of North Carolina Press Social Forces 87(3), March 2009
This content downloaded from 194.29.185.230 on Sat, 14 Jun 2014 10:00:14 AMAll use subject to JSTOR Terms and Conditions
1482 • Social Forces 87(3)
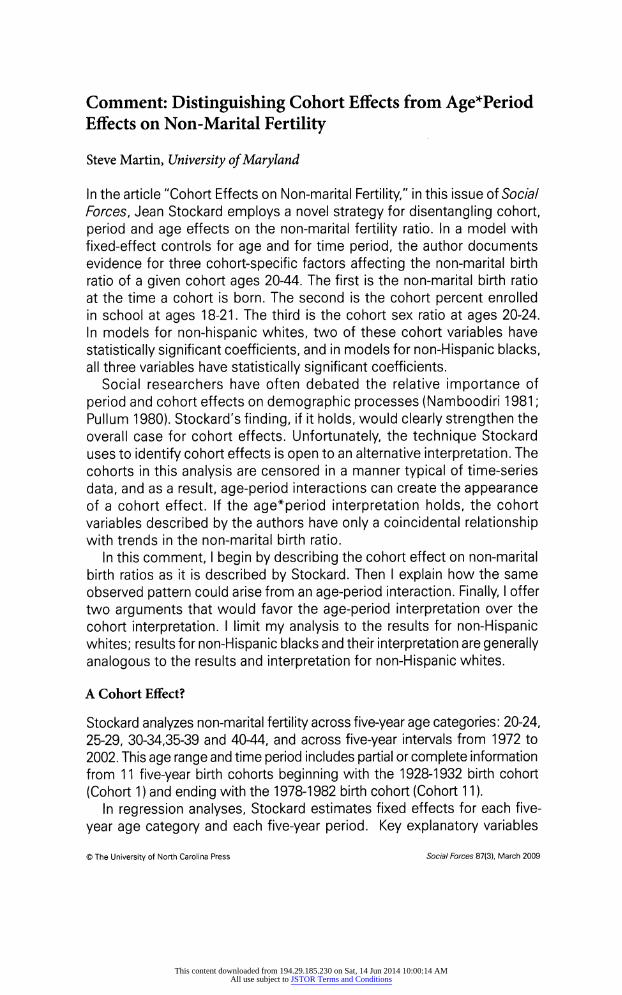
Figure 1. Distribution of Cohort-Based Explanatory Variables for the Non-Hispanic White Sample
Source: Stockard Table 3.
are each cohort's childhood non-marital birth ratio (henceforth childhood NMBR), percent enrolled at age 18-21, and sex ratio at age 20-24. All cohort variables are in log form. The outcome variable is log of the adult non-marital fertility ratio.
Figure 1 shows the distribution of the explanatory variables across cohorts. Log(percent enrolled) and log(sex ratio) increased steadily across cohorts. Log(childhood NMBR) had a non-linear pattern; it was flat until Cohort 6 (birth year 1953-1957), then rose rapidly across subsequent cohorts. With a little imagination, one can anticipate the cohort-based interpretation that can follow from Figure 1 . NFR for a given cohort should be positively correlated with childhood NMBR to the extent that children grow up to model the behavior of their parents, and negatively correlated with percent enrolled at age 18-21 to the extent that adult education is incompatible with non-marital childbearing.
In Figure 1, the nonlinearity in childhood NMBR is important. Cohorts born from the late 1 940s through the late 1 950s (cohorts 5, 6 and 7) were
This content downloaded from 194.29.185.230 on Sat, 14 Jun 2014 10:00:14 AMAll use subject to JSTOR Terms and Conditions
Comment from Martin • 1483
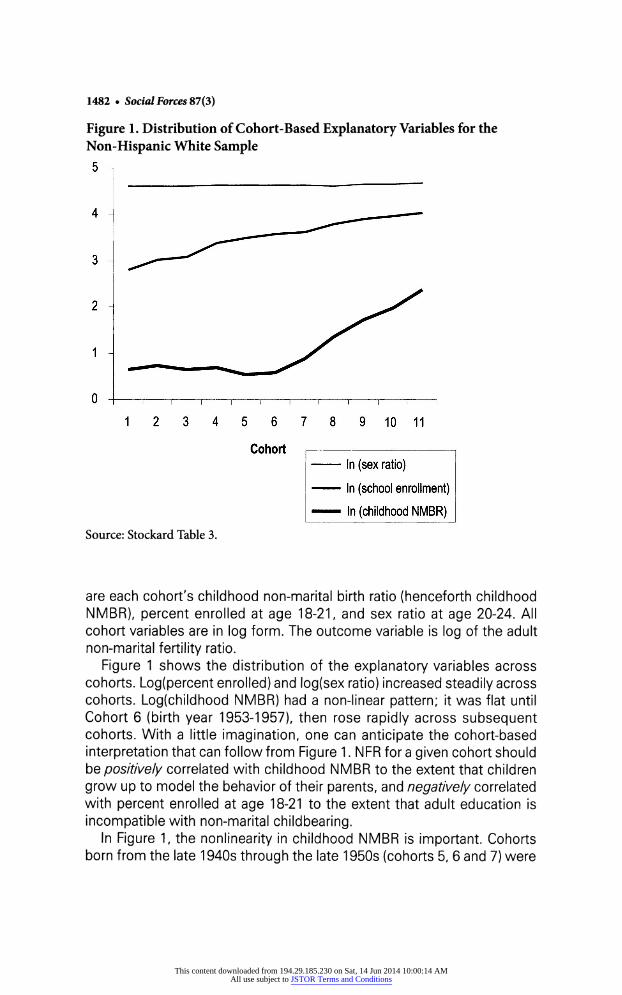
Figure 2. Cumulative Effect of Cohort-Based Explanatory Variables on the Log Non-Marital Birth Ratio, By Cohort for Non-Hispanic White Women
Source: Stockard Table 5, Model 2, with values for covariates from Table 3.
still exposed to low childhood non-marital fertility, but school enrollment was already rising for these cohorts. As a result, one might anticipate that these cohorts would have lower non-marital birth ratios as adults than would be expected based on age and period alone.
Figure 2 shows the cumulative effect of the three cohort explanatory variables, across the cohorts in the study. To produce Figure 2, 1 took the coefficients for the intercept, logfchildhood NMBR), log (sex ratio), and log(percent enrolled), all from Stockard's Table 5, Model 2. Then I plugged in the values for each cohort's childhood non-marital birth ratio, sex ratio and percent enrolled from Stockard's Table 3 Together, these coefficients indicate that net of controls for period and age, there was a substantial decrease in the cohort non-marital birth ratio around cohorts 5, 6 and 7, followed by an increase in later cohorts. This pattern could have occurred because around cohorts 5, 6 and 7, rising cohort school enrollment was depressing the cohort NFR, but childhood NMBR had not yet begun to rise to elevate the cohort NFR.
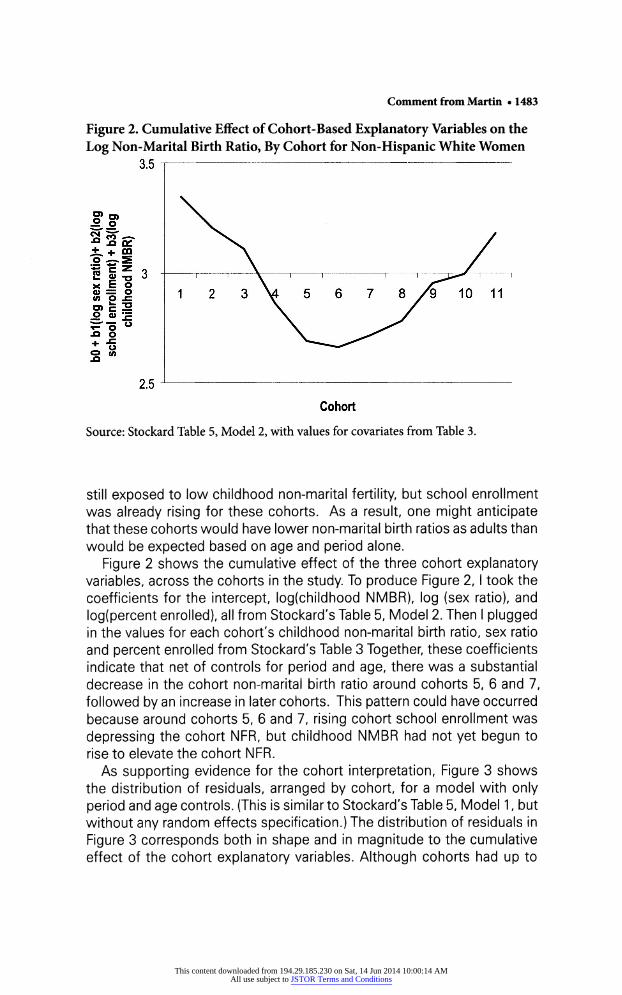
As supporting evidence for the cohort interpretation, Figure 3 shows the distribution of residuals, arranged by cohort, for a model with only period and age controls. (This is similar to Stockard's Table 5, Model 1 , but without any random effects specification.) The distribution of residuals in Figure 3 corresponds both in shape and in magnitude to the cumulative effect of the cohort explanatory variables. Although cohorts had up to
This content downloaded from 194.29.185.230 on Sat, 14 Jun 2014 10:00:14 AMAll use subject to JSTOR Terms and Conditions
1484 • Social Forces 87(3)
Figure 3. Distribution of Residuals, Arranged by Cohort, For a Model with Only Period and Age Controls
Source: Stockard Table 2.
five observations each, 71 percent of the residual variation was between cohorts, not within cohorts. From Figure 3, I conclude that the cohort "story" is one of high non-marital birth ratios for early cohorts, low for middle cohorts, then high again for later cohorts, net of age and period controls. A cohort-based explanation for this pattern is that a combination of a linear increase in one cohort variable (school enrollment) and a nonlinear increase in another cohort variable (childhood NMBR) produced a temporary depression in cohort NFR and kept it from rising as quickly as it otherwise would have done.
Age-Period Effect?
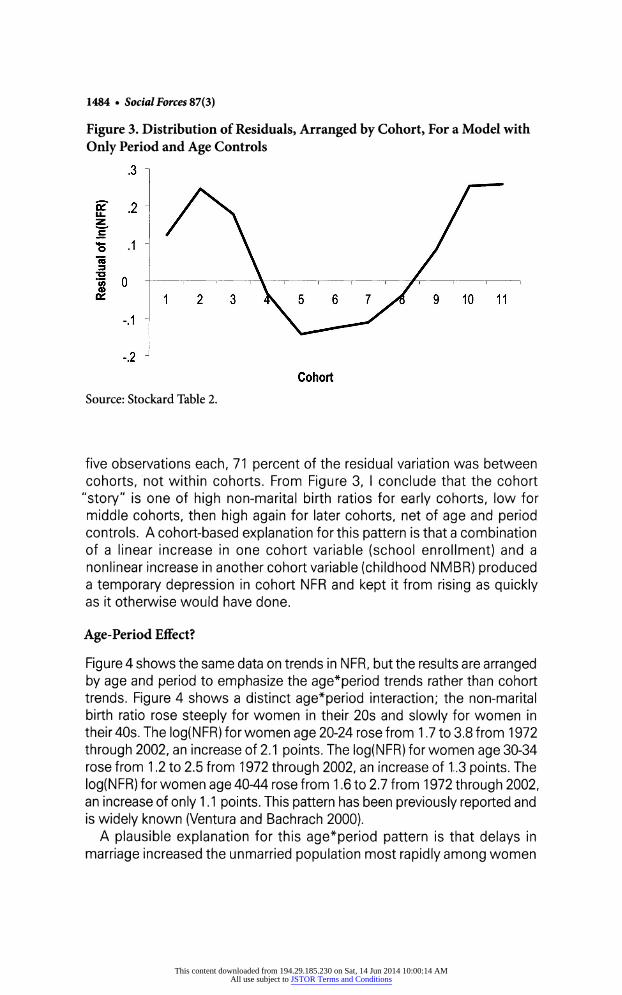
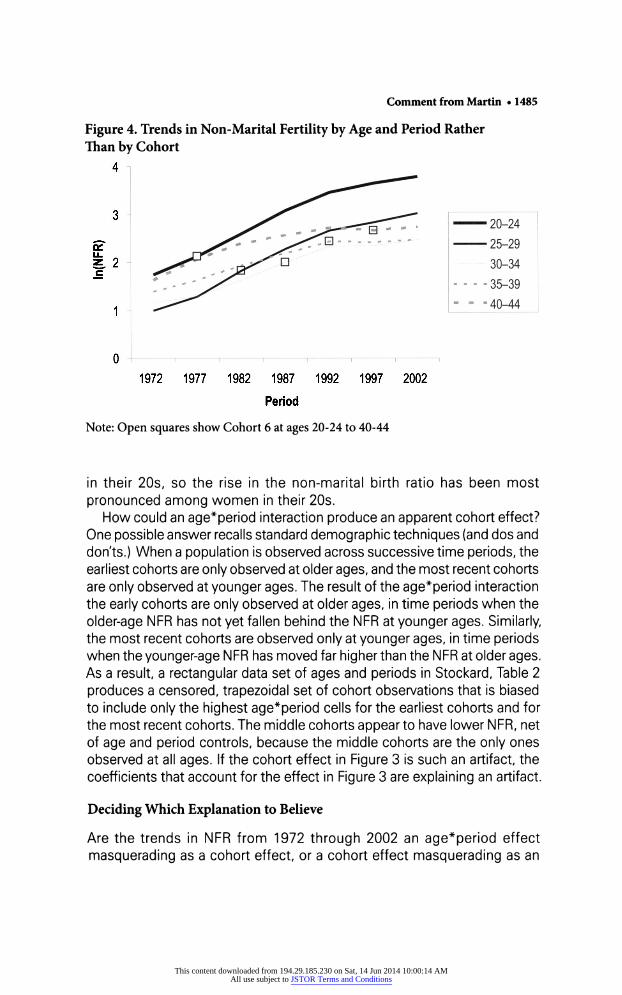
Figure 4 shows the same data on trends in NFR, but the results are arranged by age and period to emphasize the age*period trends rather than cohort trends. Figure 4 shows a distinct age*period interaction; the non-marital birth ratio rose steeply for women in their 20s and slowly for women in their 40s. The log(NFR) for women age 20-24 rose from 1 .7 to 3.8 from 1 972 through 2002, an increase of 2.1 points. The log(NFR) for women age 30-34 rose from 1 .2 to 2.5 from 1972 through 2002, an increase of 1.3 points. The log(NFR) for women age 40-44 rose from 1 .6 to 2.7 from 1 972 through 2002, an increase of only 1.1 points. This pattern has been previously reported and is widely known (Ventura and Bachrach 2000).
A plausible explanation for this age*period pattern is that delays in marriage increased the unmarried population most rapidly among women
This content downloaded from 194.29.185.230 on Sat, 14 Jun 2014 10:00:14 AMAll use subject to JSTOR Terms and Conditions
Comment from Martin • 1485
Figure 4. Trends in Non-Marital Fertility by Age and Period Rather Than by Cohort
Note: Open squares show Cohort 6 at ages 20-24 to 40-44
in their 20s, so the rise in the non-marital birth ratio has been most pronounced among women in their 20s.
How could an age*period interaction produce an apparent cohort effect? One possible answer recalls standard demographic techniques (and dos and don'ts.) When a population is observed across successive time periods, the earliest cohorts are only observed at older ages, and the most recent cohorts are only observed at younger ages. The result of the age*period interaction the early cohorts are only observed at older ages, in time periods when the older-age NFR has not yet fallen behind the NFR at younger ages. Similarly, the most recent cohorts are observed only at younger ages, in time periods when the younger-age NFR has moved far higher than the NFR at older ages. As a result, a rectangular data set of ages and periods in Stockard, Table 2 produces a censored, trapezoidal set of cohort observations that is biased to include only the highest age*period cells for the earliest cohorts and for the most recent cohorts. The middle cohorts appear to have lower NFR, net of age and period controls, because the middle cohorts are the only ones observed at all ages. If the cohort effect in Figure 3 is such an artifact, the coefficients that account for the effect in Figure 3 are explaining an artifact.
Deciding Which Explanation to Believe
Are the trends in NFR from 1972 through 2002 an age*period effect masquerading as a cohort effect, or a cohort effect masquerading as an
This content downloaded from 194.29.185.230 on Sat, 14 Jun 2014 10:00:14 AMAll use subject to JSTOR Terms and Conditions

1486 • Social Forces 87(3)
age*period effect? It is difficult to prove one explanation over the other because both have plausible social interpretations. However, there are two arguments that favor the age*period interpretation over the cohort interpretation.
(1 . The coefficients for cohort explanatory variables are improbably large.
For white non-Hispanic women, the cohort effect is described as a combination of two offsetting trends - a rise in childhood NMBR pushing the adult NFR up, and a rise in school enrollment pushing adult NFR down. One can combine the values of the covariates in Stockard Table 2 with the coefficients in Table 5, Model 2 to calculate the size of the separate covariate effects. The result is that for non-Hispanic whites, the observed rise in childhood NFR predicts a 2.4-fold increase in adult NFR, while the rise in cohort school enrollment predicts a 3.1 -fold decrease in adult NFR. The magnitude of the school enrollment effect is particularly difficult to accept because it is a "cause" measured across three years of the life course (18-21 year olds) that supposedly has enormous "effects" across 25 years of the life course (ages 20-44). It is also troubling that this coefficient that is so powerfully negative for whites is positive and statistically significant for blacks.
Coordinate geometry provides an alternative explanation for these coefficients. The pattern of cohort residuals produced by the age*period interactions (high, low, then high) is basically a parabola. It is possible to define a parabolic function as a combination of a linear and a quadratic term. All that one needs is an x-variable that is distributed linearly across cohorts (for whites, it was school enrollment) and another x-variable that is distributed nonlinearly across cohorts (for whites, childhood NMBR). The least squares estimation procedure then provides the function for the best fit of the two variables that describe the parabola. The variables for school enrollment and for childhood NMBR had the necessary trend lines and plausible social interpretations, but other cohort social trends (perhaps with much less plausible interpretations) could have fit the model just as well statistically.
(2. The cohort model has a weird cohort*age interaction.
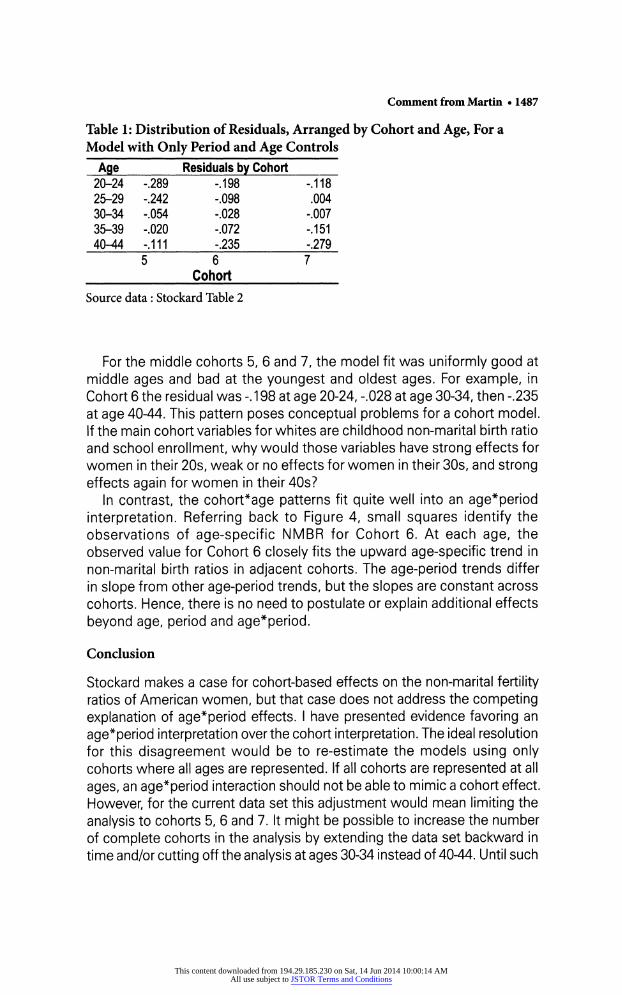
In describing Figure 3, 1 mentioned that in a simple model that estimated period and cohort effects only, 71 percent of the residual variation was between cohorts. The remaining 29 percent of variation that lies within cohorts has a distribution that is difficult to explain in terms of cohort effects. This distribution of residuals is shown in Table 1 for the middle cohorts 5, 6 and 7, born in 1948-1952, 1953-1957 and 1958-1962, respectively.
This content downloaded from 194.29.185.230 on Sat, 14 Jun 2014 10:00:14 AMAll use subject to JSTOR Terms and Conditions
Comment from Martin • 1487
Table 1: Distribution of Residuals, Arranged by Cohort and Age, For a Model with Only Period and Age Controls
Age Residuals by Cohort 20-24 -.289 -.198 -.118 25-29 -.242 -.098 .004 30-34 -.054 -.028 -.007 35-39 -.020 -.072 -.151 40-44 -.111 -J35 -.279
5 6 7 Cohort Source data : Stockard Table 2
For the middle cohorts 5, 6 and 7, the model fit was uniformly good at middle ages and bad at the youngest and oldest ages. For example, in Cohort 6 the residual was -. 1 98 at age 20-24, -.028 at age 30-34, then -.235 at age 40-44. This pattern poses conceptual problems for a cohort model. If the main cohort variables for whites are childhood non-marital birth ratio and school enrollment, why would those variables have strong effects for women in their 20s, weak or no effects for women in their 30s, and strong effects again for women in their 40s?
In contrast, the cohort*age patterns fit quite well into an age*period interpretation. Referring back to Figure 4, small squares identify the observations of age-specific NMBR for Cohort 6. At each age, the observed value for Cohort 6 closely fits the upward age-specific trend in non-marital birth ratios in adjacent cohorts. The age-period trends differ in slope from other age-period trends, but the slopes are constant across cohorts. Hence, there is no need to postulate or explain additional effects beyond age, period and age*period.
Conclusion
Stockard makes a case for cohort-based effects on the non-marital fertility ratios of American women, but that case does not address the competing explanation of age*period effects. I have presented evidence favoring an age*period interpretation over the cohort interpretation. The ideal resolution for this disagreement would be to re-estimate the models using only cohorts where all ages are represented. If all cohorts are represented at all ages, an age*period interaction should not be able to mimic a cohort effect. However, for the current data set this adjustment would mean limiting the analysis to cohorts 5, 6 and 7. It might be possible to increase the number of complete cohorts in the analysis by extending the data set backward in time and/or cutting off the analysis at ages 30-34 instead of 40-44. Until such
This content downloaded from 194.29.185.230 on Sat, 14 Jun 2014 10:00:14 AMAll use subject to JSTOR Terms and Conditions

1488 • Social Forces 87(3)
additional studies have been completed, these cohort findings and their cohort interpretations should be considered provisional at best.
References
Namboodiri, N. Krishnan. 1981 . "On Factors Affecting Fertility at Different Stages in the Reproduction History: An Exercise in Cohort Analysis." Social Forces 59(4):1114-29.
Pullum, Thomas W. 1 980. "Separation of Age, Period, and Cohort Effects in White U.S. Fertility, 1 920-1 970." Social Science Research 9(3):225-44.
Ventura S.J., and C.A. Bachrach. Nonmarital Chile/bearing in the United States, 1940-99. National Vital Statistics Reports 48(16):1-39. Hyattsville, Maryland: National Center for Health Statistics.
This content downloaded from 194.29.185.230 on Sat, 14 Jun 2014 10:00:14 AMAll use subject to JSTOR Terms and Conditions