commentary on the appellate body report in ec – bananas iii
TRANSCRIPT
THE ISOLATION AND CHARACTERIZATION OF NATURAL PRODUCTS FROM MARINE PLANTS AND MICROORGANSIMS
Amanda J. Krzysiak
A Thesis Submitted to the University of North Carolina Wilmington in Partial Fulfillment Of the Requirements for the Degree of
Master of Science
Center for Marine Science
University of North Carolina Wilmington
2006
Approved by
Advisory Committee
______________________________ ______________________________
______________________________ Chair
Accepted by
______________________________ Dean, Graduate School

ii
TABLE OF CONTENTS
ABSTRACT....................................................................................................................... iii
ACKNOWLEDGEMENTS............................................................................................... iv
DEDICATION.....................................................................................................................v
LIST OF TABLES............................................................................................................. vi
LIST OF FIGURES .......................................................................................................... vii
CHAPTER I: CHARACTERIZATION OF UV PROTECTING FLAVONOIDS FROM
HALOPHILA JOHNSONII ..................................................................................................1
INTRODUCTION ...............................................................................................................1
RESULTS AND DISCUSSION..........................................................................................3
EXPERIMENTAL.............................................................................................................15
CHAPTER II: ISOLATION OF ANTI-MICROBIAL SECONDARY METABOLITES FROM
MARINE FUNGI...............................................................................................................17
INTRODUCTION .............................................................................................................17
RESULTS AND DISCUSSION........................................................................................21
EXPERIMENTAL.............................................................................................................34
CITED LITERATURE ......................................................................................................37
APPENDIX........................................................................................................................40

iii
ABSTRACT
Many organisms, including plants, microbes and invertebrates produce compounds called
as natural products. The production of natural products often confers some advantage to the
producing organism such as chemical defense from predators. Other natural products can have a
different role in the producing organism such as preventing or limiting ultraviolet light damage
from the sun. Such sun screens are found in microalgae and vascular plants. These natural
products have been shown to display cytotoxicity, anti-bacterial, anti-fungal, anti-viral, and anti-
parasitic activity. Due to the biological activity shown by many natural products, these molecules
have been used in our pharmacopia. Compounds like penicillin, isolated from a fungus, and non-
pharmaceutical compounds such as ginseng from green tea are natural products used by humans
to benefit human health. As the investigation of natural products has resulted in a remarkable
number of compounds of benefit to humankind, the continued study of secondary metabolism
and natural products has and continues to be of great importance. This thesis describes an
investigation of the secondary metabolites of selected marine fungi to identify anti-microbial
natural products as well as the UV protecting compounds of the endangered sea grass Halophila
johnsonii. Although no novel compounds could be characterized from the marine fungi, a
collection of flavonoid derivatives was identified in Halophila johnsonii.

iv
ACKNOWLEDGEMENTS
I would like to thank my thesis committee, especially my advisor Dr. Jeffrey Wright, for
guidance, instruction, and support. I am very grateful for your patience and generosity of time in
allowing me the time I needed to complete this thesis.
Also, I would like to acknowledge Jan and Brigette Kohlmeyer for their donation of the
collection of obligate marine fungi used in this study, and to David Padgett for assistance in the
culture of the fungi used in this study. My thanks and appreciation also go to Dr. Michael
Durako and Jennifer Kunzelman for their time and efforts in the collection of the Halophila
johnsonii samples as well as a wonderful collaboration. I would also like to extend my
appreciation to GlaxoSmithKline for the financial support.

v
DEDICATION
I dedicate this thesis to my parents. You never said that I couldn’t do anything, always supported
my decisions, and had faith in my abilities. I love you.

vi
LIST OF TABLES
1. The identification and characterization of the H. johnsonii UV absorbing compounds .....................................................................................................................12
2. Antimicrobial activity of marine fungal culture extracts...............................................23

vii
LIST OF FIGURES
1. The structures of ultraviolet absorbing sunscreens......................................................4 2. Liquid chromatography and mass spectral chromatograms of H. johnsoni compounds ...........................................................................................6 3. Luteolin-7-O-glycoside displays similar spectral properties to H. johnsonii compounds ..........................................................................................7 4. Comparison of 1HNMR spectra of luteolin-7-O-glycoside standards and H. johnsonii compounds........................................................................................9 5. The ESI- mass spectral fragmentation pattern and proposed structure of the flavone tetraglycoside ............................................................................................................11 6. The general structures of the flavone glycosides in H. johnsonii ..............................13 7. The structures of biologically active marine fungal natural products........................20 8. Schematic representing bioassay-guided fractionation of natural products ..............25 9. UV (left) and mass spectral data (right) of the anti-bacterial compounds isolated from Corollospora quinqueseptata............................................................................26 10. Spectral data for antimicrobial compound isolated from Tiarosporella halmyra. ....28 11. NMR spectral data for antimicrobial compound isolated from Tiarosporella halmyra ...............................................................................................29 12. 2D COSY spectrum for T. halmyra compound ........................................................31 13. 2D HSQC spectrum for T. halmyra compound. ........................................................32

CHAPTER 1: CHARACTERIZATION OF ULTRAVIOLET PROTECTING FLAVONOIDS FROM HALOPHILA JOHNSONII
Introduction
Halophila johnsonii is a submerged marine angiosperm located only in the coastal
areas of south-eastern Florida. It has a very limited distribution within coastal lagoons and is
found between Sebastian Inlet (27°51’N, 80°27’W) and Virginia Key (25°45’ N, 80°07”W) at
depths from 3 meters and less (1). It is the least abundant seagrass species within these areas (2).
In 1998, due to its rare occurrence, H. johnsonii was listed as a threatened species on the Federal
Register, the only marine angiosperm with that classification. In contrast, it has been suggested
that H. johnsonii is a new and invading species to the lagoons of south Florida and may not, in
fact, be a threatened species (3). In either case, H. johnsonii likely has an advantage for survival
as it is the least abundant species within its area of population and has not been overgrown in the
past eight years since its listing as a threatened species. H. jonsonii’s advantage may be due to
its establishment and survival in the shallow, more demanding waters of its environment (4).
Previous work has shown that H. johnsonii has a higher ultraviolet (UV) light tolerance
compared to Halophila decipiens, a genus member co-existing at deeper depths in south Florida
lagoons (5). Furthermore, acetone extracts of the leaves of both plants revealed a strong UV
absorption at 345nm in H. johnsonii that was absent in H. decipiens (5). Additional studies
showed that H. johnsonii is capable of rapidly adjusting to high levels of UVB radiation through
changes in the production of UV protective compounds and pigments (6). It appears the
production of these UV absorbing compounds gives H. johnsonii a competitive advantage over
other species of seagrass, enabling it to survive the shallow, high UV areas of the intertidal zone.
The production of UV protecting compounds in plants and microalgae is not unusual, and
indeed the presence of natural sunscreens in various organisms has been known for decades. The
2
sun emits three forms of UV radiation: UVA, UVB, and UVC. UVC (200-280 nm) radiation is
completely absorbed by the ozone layer. However, UVA (320-400 nm) and UVB (280-320 nm)
radiation penetrate the Earth’s atmosphere and can cause damaging effects to humans and other
living organisms, including plants (7, 8). For humans, sun damage from UV radiation manifests
itself as burns and premature aging of the skin as well as increases the risk for skin cancer and
cataracts. The use of sunscreens before UV exposure from the sun has become necessary for
people of all ages and ethnicities to protect against UV damage.
In a parallel fashion to the application of sunscreens on human skin, a number of classes
of secondary metabolites provide UV protection to a variety of organisms ranging from plants to
marine invertebrates. The largest class of naturally occurring UV protecting compounds is found
in plants and is composed of a group of compounds known as the flavonoids. Although there are
more than five flavonoid structural types, the anthrocyanins and flavones represent the major
compounds associated with UV protection due to their ability to absorb light in the 280-320nm
(UVB) range (9). This ability of flavonoids to absorb UVB light can prevent the DNA damage
and photosystem damage induced by ultraviolet light (8). Anthrocyanins can serve a dual
purpose by providing not only UV protection to plants but also the pigments responsible for
flower color. Such UV protecting compounds of the flavonoid type occur mainly as O- or C-
linked glycosides and are located in the outer tissue layers (10). For instance, in the epidermal
cells of the rice Oryza sativa, a series of iso-orientin-O-glucosides were identified as UV
protecting compounds (11). In the frequently studied species Arabidopsis thaliana, kaempferol-
3-gentiobioside-7-rhamnoside, and kaempferol-3,7-dirhamnoside were found to protect the plant
from UV damage (12).

3
Carotenoid pigments have also been linked to UV protection in plants. In particular, it
has been suggested that carotenoids play a role in photosynthetic protection from UVB damage
in the Clark and Harosoy soybean (Glycine max) isolines (13). More recently, a unique group of
amino acid-based compounds known as the mycosporines (MAAs) have been identified as UV
protecting compounds in a number of marine organisms. MAAs absorb UV light in the 310-360
nm range and have been found in terrestrial fungi, marine microalgae, as well as symbiotic
invertebrates and vertebrates (14). Interestingly it seems that MAAs are predominantly found in
marine organisms and are not common in higher terrestrial plants that appear to rely on UV
protection through flavonoid and carotenoid compounds. Examples of structures from these
different classes of UV protecting compounds are shown in Figure 1.
Based on the observation that the deeper water seagrass variant H. decipiens does not
appear to contain any photoprotecting compounds, whereas the shallow-water variant H.
johnsonii can adapt to alterations in UV exposure (5), we reasoned that it may utilize natural
sunscreens as a means of UV protection. Consequently, we embarked upon a chemical
investigation of the secondary metabolites of H. johnsonii to determine if any metabolites may
act as photoprotectants. This investigation has revealed a series of flavonoid derivatives
produced by H. johnsonii, that likely play a UV protecting role.
Results and Discussion
A purified fraction of the methanol extract of H. johnsonii yielded a complex mixture of
UVB absorbing compounds. Liquid chromatography-electrospray ionsization mass spectrometry
(LC-ESIMS) analysis of the mixture resulted in the identification of five major compounds
absorbing at 340 nm, and ranging in retention time between 19 and 25 minutes and a minor
component eluting at 15.65 minutes (Figure 2a). The total ion chromatograms for each peak

4
HO
O O
OO-Glc
OH
Flavone Anthocyanin
Cartenoid: all trans-leutein
OO
NH
CO2HHOHO
Mycosporine-Glycine
Figure 1. The structures of UV absorbing compounds.

5
were generated with ESI operating in the negative ion mode (Figure 2b). The ESI-MS spectra
for peak 1 (R.T. 19.76 min) displayed ions at m/z 479 and 316. Peak 2 (R.T. 21.076 min) had
ions at m/z 463 and 301. Peak 3 (R.T. 22.386 min) displayed ions at m/z 521, 316, and 284.
Peak 4 (R.T. 23.70 min) showed ions at m/z 505, 301, and 284. Finally, peak 5 (R.T. 25.00 min)
showed ions at m/z 489 and 285. The minor component had m/z ions at 957.5, 795.3, 633.4, and
323.1. The mass spectra of these six fractions obtained in negative ESI mode showed parent ion
peaks as well as fragmentation peaks resulting from losses of 162 or 205 amu. The loss of such
fragment ions is entirely consistent with the presence of glycosyl and acylglycosyl moieties,
respectively, in these UV absorbing compounds, a common feature in many natural products
(15).
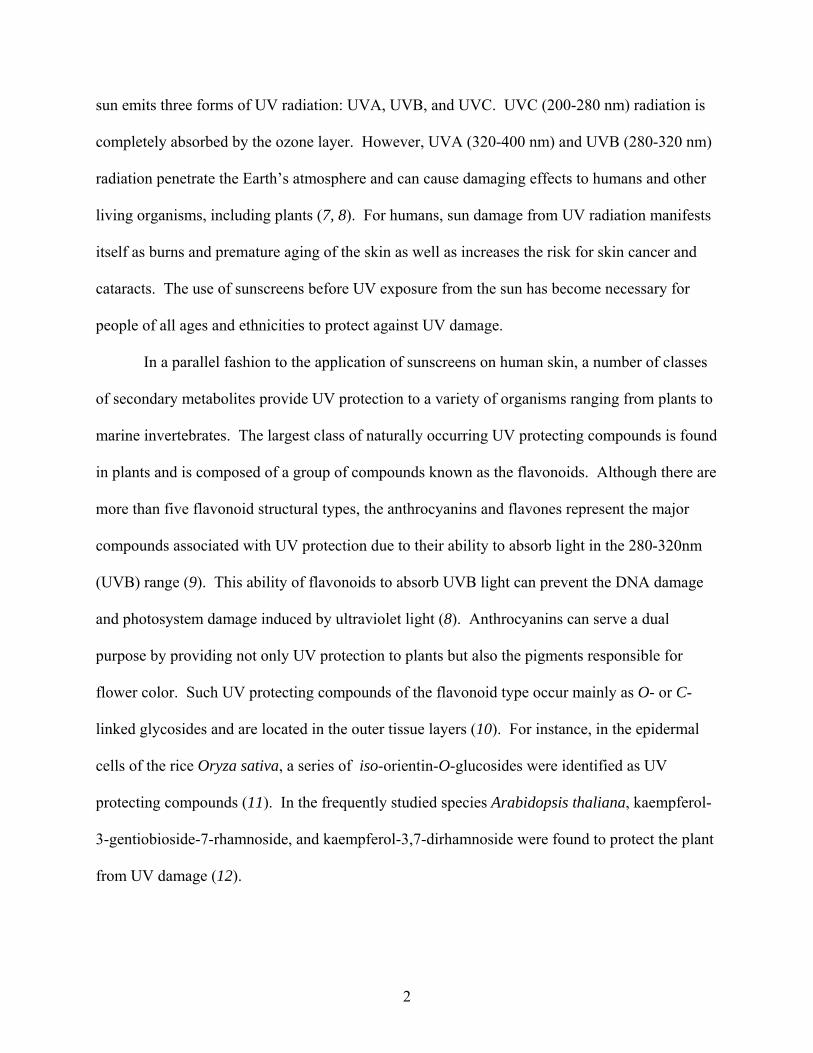
Based on the observation that flavones are frequently glycosylated and absorb light in the
UVB range, a flavone glycoside standard (leuteolin-7-glycoside) was purchased for comparison.
The UV spectra of leuteolin-7-glycoside standard showed UV maximas at 215 nm, 250 nm, and
350 nm (Figure 3a). The UV spectra for each of the compounds of the H. johnsonii extract
showed very similar maximas at 215, ~250, and 350 nm (Figure 3a). Furthermore, the leuteolin-
7-glycoside standard eluted from the LC with similar retention time and displayed similar mass
spectra and fragmentation ions as observed with the H. johnsonii compounds (Figure 3b). The
parent ion for the intact compound is represented by the [M-H]- ion at m/z 445. Furthermore, in
the electrospray ionization process, cleavage of the glycosyl bond results in a [M-162]- fragment
ion at m/z 284 corresponding to the aglycone leuteolin. These data supported the idea that the
protectant compounds found in H. johnsonii were a mixture of flavone glycosides and
acetylglycosides.

6
a.
b.
Figure 2. LC and MS chromatograms of H.johnsonii compounds a. LC chromatogram of the H. johnsonii compounds with UV absorbance at 340 nm. b. Mass spectra for the six UV active compounds in H. johnsonii. The compounds were analyzed in ESI- mode and represent [M-H]- ions.
7
a.
b.
Figure 3. Luteolin-7-glycoside displays similar spectral properties to H. johnsonii compounds . a. The UV spectra of leuteolin-7-glycoside and H. johnsonii compound. b. LC chromatogram (back) and ESIMS spectra (inset) for leutolin-7 glycoside standard.
nm220 240 260 280 300 320 340 360 380
mAU
0
500
1000
1500
2000
*DAD1, 14.930 (2419 mAU,Apx) Ref=14.523 & 15.810 of FLA
nm220 240 260 280 300 320 340 360 380
mAU
0
100
200
300
400
500
*DAD1, 26.739 (536 mAU, - ) Ref=23.945 & 27.305 of AK210
Luteolin-7-O-glycoside H. Johnsonii flavones
nm220 240 260 280 300 320 340 360 380
mAU
0
500
1000
1500
2000
*DAD1, 14.930 (2419 mAU,Apx) Ref=14.523 & 15.810 of FLA
nm220 240 260 280 300 320 340 360 380
mAU
0
100
200
300
400
500
*DAD1, 26.739 (536 mAU, - ) Ref=23.945 & 27.305 of AK210
Luteolin-7-O-glycoside H. Johnsonii flavones
O
O
OHOH
OH
12
345
6
78 9
10
2'
1'
3'
4'
5'6'
OO
HOHOHO
HO
[M-H]-=447.4
O
O
OHOH
OH
12
345
6
78 9
10
2'
1'
3'
4'
5'6'
OO
HOHOHO
HO
[M-H]-=447.4

8
Comparision of the 1H NMR spectra of the mixture and standard further supported the
identification of the components as a series of glycosylated flavonoids. The 1H NMR spectra of
the mixture from H. johnsonii mixture displayed aromatic and hydroxyl resonances consistent
with luteolin-7-glycoside. As further support, the 1H NMR spectra also contained resonances
around 5.0 ppm (Figure 4), consistent with a proton attached to an anomeric carbon of a sugar
moiety such as glucose.
Identification of individual flavone components was made based on the mass spectral
data obtained for each compound, and by comparison with literature information. The 5 major
components of the H.johnsonii mixture retained the common flavone core and varied in the
number on hydroxyl substituents attached to the core. Each was also modified either a glycoside
or acetyl glycoside moiety. Using this analytical information, two flavone glycosides were
identified. Peak 1 (19.73 min) was identified as a hexahydroxyflavone-glycoside (M.W. 480) as
evidenced by the aglycone fragment peak at m/z 317.1 corresponding to the [M-162]- fragment
ion and the parent [M-H]- ion at m/z 479.2. Peak 2 (21.05) was characterized as a
pentahyroxyflavone-glycoside (M.W. 464) as suggested by the parent [M-H]- peak at m/z 463.2
and a fragment ion at m/z 301.1 corresponding to the aglycone and the loss of a sugar moiety.
The final three components of the mixture contained the tetra-, penta-, and hexahydroxylated
flavones modified with an acetylated glucose. Peak 3 (22.41 min) represented the
hexahydroxylated-acetylglycoside (M.W. 522) and was identified by the molecular ion [M-H]- at
m/z 521.2. The mass fragment ion at m/z 317.1 corresponds to the loss of the acetyl-glycoside of
204 amu. The pentahydroxyflavone acetylglycoside (M.W. 506), peak 4 (23.74 min), gave an
[M-H]- ion peak at m/z 505.2 with a subsequent fragment ion at m/z 301.1 corresponding to the
loss of the acetylglycoside moiety. Finally, the most nonpolar constituent of the mixture, peak 5

9
a.
b.
Figure 4. Comparision of 1H NMR spectra of luteolin-7-O-glycoside standards and H. johnsonii compounds.
a. 1HNMR spectra of luteolin-7-O-glycoside b. 1HNMR spectra of H. johnsonii compounds

10
(25.05 min) was identified as a tetrahydroxylated-monoacetylglycoside (M.W. 490) by the [M-
H]- molecular ion at m/z 489.3. A fragment ion at m/z 447.3 corresponding to the loss of an
acetyl group as well as a [M-204]- fragment peak at m/z 285.1 corresponding to the loss of the
acetylglycoside from the parent ion also supported the identification. Through LC-MS analysis
we identified two flavone glycosides and three flavone acetylglycosides in the Halophila
johnsonii extract.
One of the minor components of the mixtures with a retention time of 15.81 minutes
(Figure 2a) displayed an interesting mass spectral fragmentation pattern (Figure 5). Although we
were unable to identify the flavone core of this molecule, we identified this constituent as a
flavone tetraglycoside derivative. The parent ion at [M-H]- m/z 957.6 sequentially lost two
glycoside units yielding fragment ions at [M-162]- and [M-324]-m/z 795.5 and 633.2
respectively. Further fragmentation of 310 amu corresponding to the loss of another two sugars
units resulted in an [M-H]- peak of the aglycone at m/z 323.2. Table 1 summarizes the spectral
data, type of flavone, and identification of the H. johnsonii compounds.
LC-ESI MS was used to identify the UV absorbing constituents of H. johnsonii as a
series of flavone glycosides. The general structures of these compounds are shown in Figure 6.
These compounds are widely distributed among plants, and their biosyntheses and functions are
well-studied (10). The extensive information and databases dealing with known flavonoid
compounds assisted in the identification of these flavones by LC-MS methods, and these
methods are now widely used as an analytical tool for this class of compound (15-17). In fact,
electrospray mass spectrometry, has become the most prominent method for flavonoid
identification (18), particularly in combination with known standards when it can be used to
identify flavonoid compounds. However, NMR analysis is often still required for full structural

11
Figure 5. The ESI- mass spectral fragmentation pattern and proposed structure of the flavone-tetraglycoside

12
Table 1. The identification and spectral propteries of the H.johnsonii UV absorbing compounds. Peak tr (min) UV lmax (nm) [M-H]- (m/z) [M-H]- fractions (m/z) flavone
1 19.73 220,280,350 479 316 hexahydroxyflavone-O -glycoside2 21.05 220,280,350 463 301 pentahydroxyflavone-O -glycoside3 22.41 215,250sh,350 521 316 hexahydroxyflavone-O -acetylglycoside4 23.74 220,280,350 505 301 pentahydroxyflavone-O -acetylglycoside5 25.05 215,250sh,350 489 284 tetrahydroxyflavone-O -glycoside

13
Figure 6. The general structures of the flavone glycosides in H. johnsonii
O
O
OOO
O
OHOHOH
O
O
OOOH
OHOHOH
O
O
OOOH
OHOHOH
O
O OHOH
O
HO
OO
O
OHOHOH
O
O
OOO
O
OHOHOH
HO
HO
OH
OH
HO
HO
OH
OH
HO
HOOH
OH
OH
HO
HO
OH
OH
OH
hexahydroxyflavone-O-glycoside pentahydroxyflavone-O-glycoside
hexahydroxyflavone-O-acetylglycoside pentahydroxyflavone-O-acetylglycoside
tetrahydroxyflavone-O-acetylglycoside

14
characterization and substitution pattern assignment. Tandem mass spectrometry (MS/MS), can
provide even more detailed fragmentation data, and hence valuable structural information of
flavonoids, than can be obtained using a single mass spectrometer alone (18). Regardless of the
techniques used, the identification of flavonoids by mass spectrometry is frequently reported in
the literature. Through the use of standards and MS, five flavone glycosides were identified
from the extract of Halophila johnsonii.
The flavone compounds identified in the Halophila johnsonii extract may possess many
biological properties, but most likely serve as UV photoprotectants for the seagrass, which
survives in highly light exposed shallow areas of Biscayne Bay. Thus these secondary
metabolites are used to filter UV light and protect the plant from UVB damage to DNA. It has
been shown that the production of these compounds is upregulated with increased exposure to
UV light (6). Two of the flavone compounds occur as glycosides, and three are modified with an
acetylated glucose moiety making all of the flavone constituents hydrophilic. Such glycoside
derivatives may be useful in the transportation of these compounds in the plant and may favor
their location in the vacuoles of epidermal cells in the leaves (9). A further study of various
plant components such as the leaf, rhizome, stem, etc., might provide additional information as
to the production and storage centers for these compounds.
The production of flavones by angiosperms is not unusual. In fact, flavones are abundant
in the plant kingdom, but the largest flavone containing taxon is the angiosperms (10).
Futhermore, the presence of flavone compounds within the Halophila genus has previously been
observed. Sulphated flavones have been noted in H. ballonis, H. engelmanni, H. stipulacea, and
H. ovalis (19). In addition to H. johnsonii, glycosylated flavones have been observed in smaller
leaved members of Halophila (20). Interestingly, and in support of their photoprotectant role,

15
the production of flavanoids appears to diminish in H. johnsonii when it is transplanted in deeper
waters (5). A further striking feature is the apparent absence of flavones in the related species H.
decipiens that grows in adjacent deep water areas, and thus may not require such
photoprotectants. However, it is also possible that H. decipiens may produce different
photoprotectant compounds. Regardless, a detailed investigation of the chemical constituents of
H. decipiens seems warranted.
This study identified six flavone glycosides in Halophila johnsonii that we believe help
protect this shallow dwelling seagrass from UV damage. This is the first characterization of
secondary metabolites from this endangered species and sheds light on how this seagrass found
its niche in the shallow waters of Biscayne Bay, FL. Our findings are consistent with the
presence of flavones among most of the Halophila sp., and the class and type of flavone may
serve as a distinguishing characteristic between species and their geographic location. In addition
to their biological functions, the distribution and type of flavones found among Halophila sp.
May provide a useful chemotaxonomic tool in the classification of Halophila seagrasses.
Experimental
Plant material
Plant material was collected by Jennifer Kunzelman and provided courtesy of Dr.
Michael Durako.
Isolation and Purification
The methanol extract from Halophilia johnsonii was initially fractionated by RP-C18
(ENVI Sep-Pak) chromatography using a 20-100% H2O-MeOH gradient. The Sep-Pak column
was first flushed with 100% MeOH to activate the column packing and flush any column bleed
through. The column was then eluted with the methanol-water gradient. The 20 % H2O-MeOH

16
fraction was then applied to a reversed-phase C18 column (Bakerbond 10 x 100 mm) and eluted
with a methanol-water gradient. Combination of fractions yielded two samples, 2.0 mg and
0.5mg that absorbed light in the UVB range. These compounds were further purified with high
performance liquid chromatography (HPLC) using a reversed-phase C18 column (Phenomenex
Luna, 10 x 250 mm, 5μm) with a 5-80% H2O-MeOH gradient containing 0.02% acetic acid (0.5
mL/min flow rate, 20 min) over 30 minutes. Both compounds were subjected to LC-ESIMS
analysis (Waters Micromass ZQ) equipped with a reversed-phase C18 column (Phenomenex
Luna, 2.5 x 150 mm, 5μm) and eluted with 5-80% H2O-MeOH gradient containing 0.02% acetic
acid (0.2 mL/min, 20 min) over 30 minutes.
Spectroscopy
1H NMR and 13C NMR were recorded using a 500MHz Brüker instrument at room
temperature. All spectra were recorded in CDCl3. Chemical shifts are presented as ppm (δ) with
respect to the chemical shift of the solvent used. UV spectra were recorded with an Agilient
1100 UV detector in line with the HPLC system. ESI mass spectral data were obtained with a
Waters Micromass ZQ linked to the Agilent HPLC instrument.

CHAPTER 2: ISOLATION OF ANTIMICROBIAL SECONDARY METABOLITES FROM
MARINE FUNGI
Introduction
Infectious diseases were once considered curable illnesses, and if one antibiotic in the
arsenal of drugs did not clear the infection, another would. However, that is no longer the case.
Microbes resistant to not one but multiple therapies are common and represent a global problem
(21). Ironically, hospitals are large reservoirs for breeding resistant bacterial strains. In fact,
approximately 50% of hospital-acquired infections are methicillin resistant Staphyloccocus
aureus (MRSA) and most are also resistant to other antibiotics (22). M. tuberculosis, responsible
for TB infections, has numerous multi-drug resistant (MDR) strains for which six to seven drugs
are needed for effective treatment (23). With drug resistance on the rise and the number of
reported MDR infections increasing, there is a great need for new antibiotic therapies.
Clinically used antibiotics are compounds that selectively target a bacterial protein that is
unlike a human protein in either function or structure. There are five main modes of action for
antibacterial compounds: inhibition of cell wall biosynthesis, inhibition of protein synthesis,
inhibition of RNA synthesis, inhibition of DNA synthesis, and inhibition of folic acid
biosynthesis. The penicillins, cephalosporins, and glycopeptides (e.g. vancomycin) all inhibit
cell wall biosynthesis. The beta-lactam antiobiotics (i.e. the penicillins and cephalosporins)
inhibit of the cross-linking of the peptidoglycan layer of the bacterial cell wall. These
compounds are generally selective for gram positive bacteria because gram positive bacteria
have a largeer peptidoglycan layer than gram negative bacteria that have a very small
peptdioglycan membrane layer. There are a number of antibacterial drug classes that inhibit the
synthesis of bacterial proteins. The bacterial ribosome that is responsible for protein synthesis is

18
distinctly different in structure compared to the human or eukaryotic ribosome. Taking
advantage of this, the aminoglycosides, macrolides, tetracyclines, and chloramphenical all bind
to different portions of the bacterial ribosome halting protein synthesis. Because these drug
classes inhibit protein synthesis they are largely bactericidal (causing cell death) agents rather
than bacteriostatic agents (slowing cell gowth) like the drugs that inhibit cell wall biosynthesis.
The quinolone antiobiotics inhibit the synthesis of bacterial DNA through the inhibition of DNA
gyrase, an enzyme only contained in bacteria that is responsible for relaxing DNA before
replication can occur. Finally, the trimethoprim and sulfonamide antibiotics inhibit bacterial
synthesis of folic acid through inhibition of dihydrofolate reductase. There are a limited number
of known selective targets for anti-bacterial agents and the number of novel drug targets has been
declining (24). With antibiotic resistance posing one of the worlds most important public health
issues, the discovery of novel antibacterial compounds is of utmost importance.
Natural products have been the greatest source of successful antibiotic compounds
throughout history. The penicillins, cephalosporins, macrolides, tetracyclines are all antibacterial
classes that were derived from natural product origins. Over the years, 80 % of the bioactive,
natural products isolated have been antibiotic compounds, and this trend is continuing (25, 26).
Bacteria and fungi, in particular, have been a reliable source for the discovery of useful antibiotic
compounds. For example, the penicillins and cephalosporins are both clinically used drug
classes derived from fungal natural product structures. However, most of these leads have been
derived from land-based or terrestrial organisms, and in recent times the discovery of totally new
biologically active chemical compounds has diminished. In this respect, the oceans, which cover
over 70% of the planet and are home to an enormous biodiversity of species, offer vast
opportunities in the discovery of new bioactive natural products (27). Furthermore, there is

19
growing interest in exploring marine microbes such as fungi and bacteria as sources of new and
unique secondary metabolites (28-30). Marine fungi are predicted to be a valuable resource in
the search and discovery of novel natural products. It has been estimated that 90% of marine
microorganisms, including fungi, have yet to be identified (31). For microorganisms, survival in
the marine environment is highly competitive and comes with a number of environmental
stresses that can stimulate the production of secondary metabolites (32). The isolation and
chemical exploration of a number of marine fungal species have resulted in new structurally
diverse natural products (32, 33), often displaying a variety of biological activities, such as anti-
bacterial, anti-viral, and anti-protozoal activities.
Some examples of obligate marine fungal products are shown in Figure 7. Cephalosporin
C is the only marine fungal metabolite to have FDA approval as an antibiotic and falls into the
beta-lactam class of drugs (34). Melinacidine III, one of the first marine fungal metabolites
reported, is an antimicrobial compound isolated from Corollospora puchella (33). Pestalone, a
novel antimicrobial benzophenone, has been discovered in extracts of the marine fungus
Pestalotia sp. and has shown activity against vancomycin resistant enterococci and MRSA (35).
In addition to these examples of antibiotic marine fungal metabolites, other compounds have
been identified with additional biological activities. Sansalvamide A is a depsipeptide compound
with activity against the DNA topoisomerase of Molluscam contagiosum virus (MCV), a virus
implicated in the effects of HIV (36). The macrolide aigialomycin D has been shown to be
active against the malarial parasite Plasmodiun falciparum (37). Communesin A is an alkaloid
isolated from a Penicillin sp. found to be associated with a marine alga (38). This compound and
a derivative, communesin B, have shown activity against the P-388 human leukemia cell line.
These are just a few examples of the novel, biologically active compounds discovered from

20
Figure 7. The structures of biologically active marine fungal natural products.
N
SHN
HO
O
O
O
H2N
HO O
O
O
H
cephalosporin c
N NHN
O
O
SS
NNNH
O
O
SS
HO
HO
H
HO
Melinacidine III
NH
NHH
N
O
N
OH
Communesin A
O
HO
O
Aigialomycin D
HO
OH O
HO
OH
Cl
Cl
O
Pestalone
NH
NH
NH
O
NHO O
O
O
O
Sansalvamide a

21
marine fungi that provide support for the investigation of marine fungi as sources of novel
antibiotic compounds.
Although marine fungi appear to be an excellent biological source for the discovery of
natural products, there are a number of challenges associated with the successful laboratory
culture of these organisms. To begin with, not all fungi isolated in the field can be brought into
culture in the laboratory. Even when culture is possible, marine fungi can be naturally slow
growing, and many factors of the culturing process can alter the growth rate of the organism.
Culture temperature, pO2, pCO2, pH, and nutrient variations have all been shown to affect the
rate of fungal growth in culture (39, 40). Furthermore, even when laboratory cultures can be
maintained, the production levels of secondary metabolites may be very low, necessitating large
culture volumes in order to provide sufficient material for the complete structural
characterization of a new compound. Many of these factors have been cited as problems in the
development of marine pharmaceuticals (41). Even with the many challenges associated with
the exploration of marine fungal natural products, these organisms still represent a source of
natural product diversity with biological activity worth investigating. We have examined a
number of obligate marine fungi for the production of antimicrobial compounds and identified
organisms producing interesting natural products.
Results and Discussion
From organisms originally isolated and identified by the Kohlmeyers (42), a subset of 30
obligate marine fungi, maintained in culture at the Center for Marine Science, formed the basis
for this study. Organic extracts of these fungi were screened for the presence of anti-microbial
compounds using disc diffusion assays against two gram positive and two gram negative bacteria
Bacillus subtilis, Staphalococcus epidermis, Pseudomonas aeruginosa, and E. coli, as well as for

22
the production of antifungal compounds using Candida albicans. Five of the marine fungal
strains were found to produce anti-bacterial compounds in culture, but none of the fungi yielded
extracts that displayed growth inhibition of Candida albicans (Table 2). Of those fungal extracts
with detectable levels of anti-microbial activity, the extract of Camarosporium I show activity
against gram-positive bacteria only. This suggests that the antimicrobial compound produced by
Camarosporium I is likely to target the cell-wall biosynthesis of gram-positive bacteria in a
manner such as the penicillins and cephalosporins. The extract from Humicola alpallonella
showed biological activity against gram-negative bacteria only. Small ribosomal and non-
ribosomal peptides have shown to be gram-negative selective agents, and the natural product
produced by H. alpallonella could potentially act in that manner. Three extracts from Sarcodella
rhizophorae, Corollospora quinqueseptata, and Tiarosporella halymra showed anti-bacterial
activity against both gram-positive and gram-negative bacteria. The natural products being
produced by these organisms are likely to target bacterial protein synthesis or one of the enzymes
involving the replication and transcription of DNA as both of these mechanisms effect gram
positive and gram negative organisms equally. These fungi could also be producing multiple
anti-bacterial compounds with different bacterial targets.
The five fungi displaying anti-bacterial activity were grown in 6 L batches with the aim
of producing enough biomass to yield sufficient material to permit the isolation and purification
of the active agents. Unfortunately, these fungi grew very slowly in liquid culture, and provided
only small amounts of a crude organic extract. Consequently, cycles of growth and extraction
were repeated many times in order to obtain sufficient amounts of material with which to
progress forward with chemical purification and analysis (Appendix A). This slowed progress
and prevented the accumulation of sufficient material for chemical analysis. However, the

23
F u n g i Gra
m-p
ositi
ve In
hibi
tio
Gra
m-n
egat
ive
Inhi
bitio
C. a
lbic
ans I
nhib
ition
A n te n n o sp o ra sa lin a n d n d n dA q u a m a r in a sp e c io sa n d n d n dC a m a ro sp o r iu m I x n d n dC e r io sp o ro p s is h a lim a n d n d n dC o ro llo sp o ra c a l i f o rn ic a n d n d n dC o ro llo sp o ra c a l i f o rn iu m f i l i f o r n d n d n dC o r l lo sp o ra c a l i f o rn iu m m a r i t im n d n d n dC o ro llo sp o ra c o lo s sa n d n d n dC o ro llo sp o ra n o v o fu sc a n d n d n dC o ro llo sp o ra p u lc h e l la n d n d n dC o ro llo sp o ra q u in q u e se p ta ta x x n dG a e u m a n n o m y c e s m e d u lla r is n d n d n dH a lo sp h a e r io p s is m e d io se tig e ra n d n d n dH u m ic o la a lo p a llo n e lla n d x n dJ u n c ig e n a a d a rc a n d n d n dL e p to sp h a e r ia ty p h ic o la n d n d n dL ig n ic o la la e v is n d n d n dL in e o la ta rh izo p h o ra e n d n d n dL u lw o r th ia sp . n d n d n dL u lw o r th ia c f r .g ra n d isp o ra n d n d n dM a ssa r in a r ic i f e ra n d n d n dM a ssa r io sp h a e r ia e ru c a c e a n d n d n dP a p u lo sp o ra a m e ro sp o ra n d n d n dP a ssa s in ie l la o b io n e s n d n d n dP e r ic o n ia p ro l i f ic a n d n d n dP e r ic o n ia c f r . P ro l i f ic a n d n d n dP h a e o sp h a e r ia h a l im a n d n d n dP h o m a to sp o ra b e lla m in u ta n d n d n dS a rc o d o e l la rh izo p h o ra e x x n dS c ir rh ia a n n u la ta n d n d n dT ia ro sp o re l la h a lm y ra x x n d
Table 2. Antimicrobial activity of marine fungal culture extracts. X indicates biological activity. nd indicates no activity detected.

24
ultimate reason for the lack of success was that the fungal cultures were withdrawn before
completion of this project.
As the project progressed, and before the cultures became unavailable, the number of
fungi in large-scale culture was reduced to two, Corollospora quinqueseptata and Tiarosporella
halmyra. This selection was based on the biological activity displayed by extracts of these
organisms, and that this activity was reliably and consistently found. By focusing on only two
cultures, more culture volume could be devoted to only these two species. By adopting this
strategy, an increased amount of crude extract (~200mg) was obtained compared to prior cultures
(~30mg) when all five were in larger scale culture. Using bioassay-guided fractionation (Figure
8) it was found that Corollospora quinqueseptata produced three anti-microbial compounds.
The ESI mass spectral data (Figure 9) suggested the [M+H]+ or [M+Na]+ ions for these
antimicrobial compounds were m/z 537, 625, and 713 respectively. Interestingly, the spectra of
each compound contained a fragment peak corresponding to a loss of 44 amu from the parent
ion, suggesting the loss of a carboxylic acid moiety. The UV spectra for the compounds also
suggested the compounds contained interesting functionality, and displayed strong primary
absorption at 220 nm and an additional absorption at 300 nm (Figure 9). However, as previously
mentioned, the fungal cultures became unavailable to us before sufficient material was obtained
for further structural characterization.
Tiarosporella halmyra was also cultured in four growth cycles from October 2002 to
June 2003 and 72 L of culture material was generated for this fungi. Biologically active
compounds were found in the ethyl acetate extract from the broth only. Although full structural
characterization was not made, structural information for this compound was obtained by mass
spectrometry and NMR. The ultraviolet spectrum of the T. halmyra compound showed an UV

25
Figure 8. Schematic representing bioassay-guided fractionation of natural products.
Biologically active fungal extract from broth or mycelia
Chromatographic separatione.g.-Reversed Phase, Size-exclusion
Disc diffusion assayRed-positive result, Black-negatice result Combine active fractions
Chromatographic separatione.g.-Reversed Phase, Size-exclusion
Disc diffusion assayRed-positive result, Black-negatice result
Combine active fractionsHPLC
Disc diffusion assayRed-positive result, Black-negatice result Pure biologically active compounds

26
Figure 9. UV (left) and mass spectral data (right) of the anti-bacterial compounds isolated from Corollospora quinqueseptata.

27
maxima at 244 nm (Figure 10). This suggests the compound is composed of a simple conjugated
diene system that would absorb around 215 nm and a few small modifications possibly an
additional double bond or carbonyl that would extend that absorbance out to 244 nm. The most
abundant ion from the mass spectral data suggested an [M+H]+ at m/z 369 and an [M+Na]+ at
m/z 391 (Figure10). Two smaller peaks at m/z 337.2 and 305 are fragments ions with
subsequent losses of 32 from the most abundant ion at m/z 369. An additional peak atm/z 441.3
was also present. The mass spectral data suggested a molecular weight of 368 Da or 440 Da for
the T. halmyra metabolite. This datum suggested the compound cannot be an alkaloid because
the molecular weight as determined by mass spectrometry appeared to be an even number. All
alkaloids contain a nitrogen atom within a heterocyclic ring and possess an odd numbered
molecular weight.
NMR data for the T. halymra compound was obtained and included 1H, 13C, DEPT135,
HSQC and COSY. 13C spectroscopy requires a greater sample volume than proton NMR
spectroscopy due the lower abundance of 13C in the environment. In order to obtain 13C data, a
small sample of <1 mg was used. The 13C spectra suggested the sample was a mixture of two
compounds, a major component with tall resonances containing ~12 carbons and a minor
component containing ~ 30 resonances (Figure 11). The 1H NMR spectrum for that sample (data
not shown) also suggested the sample was composed of a major component and minor
component. The chemical shift data in the 13C spectrum suggested the mixture contained two
natural products due to the interesting functionality of the compounds in the sample. The13C
spectrum contained resonances primarily in the aliphatic region from 10-30 ppm, but the
spectrum also contained resonances indicative of carbons under oxygen or otherwise deshielded
from an electronegative environment (40-80ppm), olefinic carbons between 100-150 ppm, and

28
a.
b.
Figure 10. Spectral data for antimicrobial compound isolated from T. halmyra.
a. UV spectrum b. ESI + Mass spectrum
nm200 225 250 275 300 325 350 375
mAU
0
50
100
150
200
250
300
350
DAD1, 12.639 (376 mAU,Apx) of K7072903.D
UV maxima: 244 nm

29
a.
b.
Figure 11. NMR spectral data for antimicrobial compound isolated from
Tiarosporella halmyra. a. 13C NMR (top) and DEPT135 (bottom) spectra b. 1H NMR spectra
2030405060708090100110120130140150160170180190 ppm
190 180 170 160 150 140 130 120 110 100 90 80 70 60 50 40 30 20 10 ppm

30
two carbonyl carbons around 170-200 ppm. DEPT 135 analysis of the sample revealed that the
mixture contained approximately 13 quaternary centers (Figure 11). Because the resonances for
quaternary centers are low in peak intensity, it was not possible to determine which compound in
the mixture was associated with those quaternary resonances, or indeed how many quaternary
centers the major component possessed.
1H NMR and 2D spectroscopy of a more purified sample provided more structural
information for the bioactive T. halmyra compound. The 1H NMR spectrum displayed
resonances in the aliphatic region (1-2 ppm), a deshielded resonance at 2.8 ppm, and olefinic
resonances between 5-6 ppm (Figure 11). There were no aromatic resonances in the spectrum
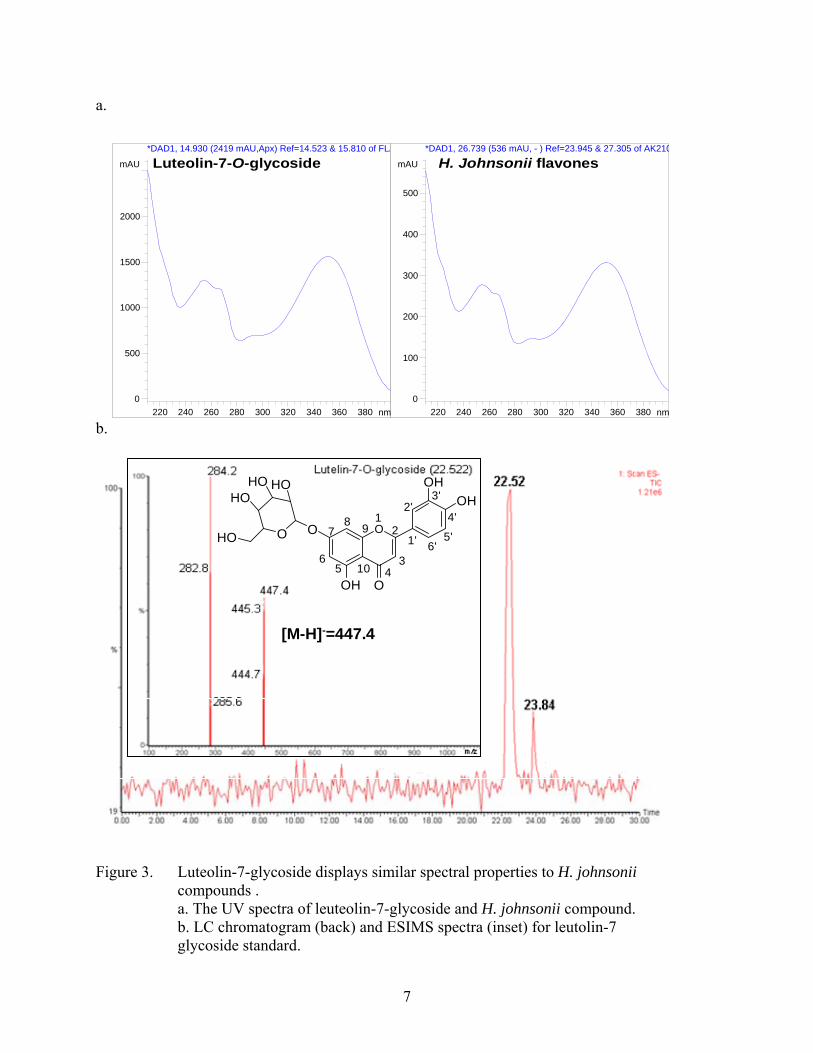
(7-8 ppm) or aldehyde resonances near 10 ppm. The 2D COSY (Figure 12) analysis for proton
interactions of the sample revealed the olefinic doublet of doublets at 5.8 ppm interacts with a
doublet 5.1 ppm. This suggested these two proton signals share a common double bond in the
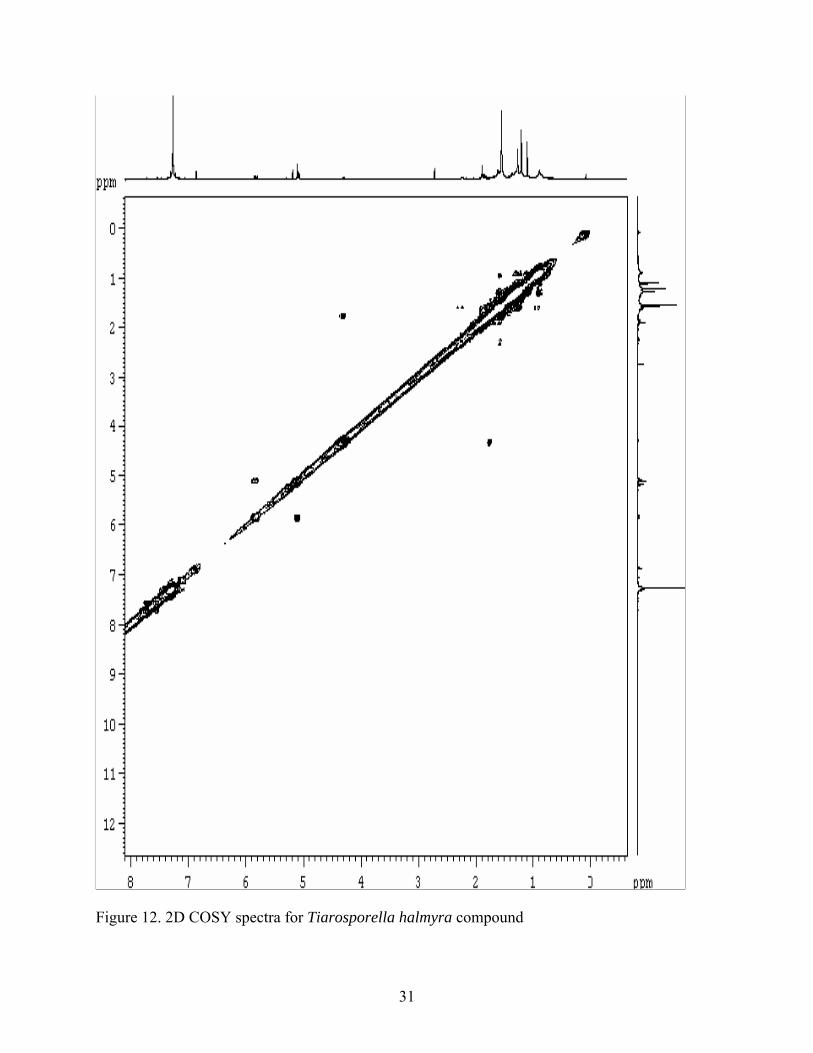
molecule. 2D HSQC spectroscopy for carbon-proton interactions showed that 1H doublet at 5.1
ppm is attached to a carbon that resonates at 113 ppm (Figure 13). The carbon at 113 ppm was
found to be a carbon bearing two hydrogen atoms from the DEPT 135 analysis (Figure 11). This
suggested that the olefin bond between the two protons at 5.1 and 5.8 ppm is a terminal alkene.
The splitting pattern on the 1H spectrum for the doublet of doublets at 5.8 ppm had coupling
constants with J= 7 Hz, and 12 Hz that are also consistent with a terminal alkene (43). Further
analysis of the COSY data revealed that another olefinic proton at 6.8 ppm is not coupled with
another olefinic proton suggesting this olefinic bond must contain a quaternary carbon. An
olefinic bond containing a quaternary center is further supported by the presence of a quaternary
carbon in the olefinic region of 100-150 ppm in the DEPT135 (Figure 11). The HSQC spectrum
also revealed that 1H signals at 5.15 and 5.3 ppm are not linked to any carbons in the molecule.
31
Figure 12. 2D COSY spectra for Tiarosporella halmyra compound

32
Figure 13. 2D HSQC spectrum for T. halmyra compound.

33
These singlet proton signals are hydroxyl proton signals in the molecule. The 13C NMR and
DEPT135 spectra revealed that there are two carbonyl carbons in the compound mixture that was
analyzed. The proton singlet at 2.8 ppm that integrates to one proton in a deshielded signal that
is consistent with a proton signal near an oxygen in the molecule. These data suggest that the T.
halymra compounds contains at least one ketone moiety. The HSQC spectrum showed that the
2.8 ppm proton is linked to a carbon resonance at 51.4 ppm. DEPT135 analysis confirmed the
50.1 ppm carbon to be a CH bearing carbon. Together, the NMR data suggested that the T.
halymra compound contains two olefinic bonds, a terminal bond as well as one involving a
quaternary center, two hydroxyl substituents, a ketone carbonyl group, and a carbon bearing a
single proton likely located next to the ketone moiety.
More structural detail of the T. halymra metabolite was mined from the aliphatic region
of the spectroscopic data. The 1H NMR spectrum contains two singlet resonances at 1.1 ppm
and 1.2 ppm that integrated to 3H and 7H respectively. These resonances suggested the presence
of three methyl group on the compound. The HSQC and DEPT135 spectra confirmed that the
1.1 ppm singlet was linked to a CH/CH3 carbon at 24.6 ppm. The 7H singlet at 1.2 ppm was
found to be linked to two CH/CH3 carbons at 22.5 and 32.8 ppm. Because these three methyl
groups were all singlets and not split by any other proton signals they all appeared to be attached
to quaternary centers. Furthermore, the deshielded aliphatic carbon resonance at 32.8 ppm
linked to a non-deshielded resonance at 1.2 ppm is characteristic. These resonances are
consistent with reported values for gem-dimethyl groups attached to a quaternary center (43).
The 1H NMR spectrum also showed a number of signals with CH2 splitting patterns between 1-2
ppm. Analyzing the HSQC spectrum, it revealed that in addition to the three methyl carbons on
the major component of T. halymra, there were five additional carbons bearing hydrogens. All of

34
these carbons (18.1, 23.0, 26.9, 29.6, and 40.5 ppm) showed multiple 1H interaction suggesting
these carbons had at least two attached protons. The DEPT135 confirmed that these five carbon
signals were CH2 signals for the T. halmyra compound. The rigid and sharp shapes of the CH2
peaks suggested that they were involved in a ring system. All of the structural information for
the T. halmyra metabolite suggested that the compound has a ring system and is composed of at
least 14 carbons: 3 -CH3, 5 -CH2, -CH, -C=CH, -HC=CH2, and -C=O.
The many structural details for the T. halmyra compound obtained suggested that the
metabolite was likely to be a terpenoid. This reasoning was based on the aliphatic nature of the
compound, the non-aromatic ring system, the olefinic bonds, terminal methyl groups, as well as
the carbonyl and hydroxyl moieties that are all common components of terpenoid compounds.
Based on the number of identified carbons (14 carbons) in the major component it is likely that
the compounds is a sesquiterpene composed of 15 carbons, the fourteen we identified and an
additional quaternary center. It is also probable that the minor component of the T. halymra
mixed sample is either a sester- or tri-terpene composed of 25 or 30 carbons respectively.
Terpenoid antibiotics are not unusual and have been reported in the literature. In fact, in 2006,
Rojas et al reported the characterization of aegicerin, a triterpene antibiotic showing biologically
activity against resistant strains of Mycobacterium tuberculosis (44). Sesquiterpene antibiotics
such as the series of lactones identified in C. spinosa are also found in the literature (45).
Sesterterpene antibiotics have even been reported in marine fungi (32). Although full structural
characterization of the Tiarosporella halmyra metabolite was not accomplished, it is likely that
the metabolite is terpenoid in origin and appears to contain interesting functionality.
Experimental
Fungal material

35
The fungal samples were collected by Jan and Brigitte Kohlmeyer from a variety of
marine environments. A subset of these fungal isolates were maintained in culture on agar plates
at the mycology lab of the Center for Marine Science. Large-scale cultures, typically 6 L in
volume, were grown in a liquid medium containing 38 ppt Instant Ocean, 0.5 g peptone, 1.0 g
glucose, and 0.1 g yeast extract per liter of deionized water.
Fungal harvest and extraction
Sterile 1.5 L culture flasks containing growth medium were inoculated with a portion of
fungal culture taken from stock cultures. The flasks were allowed to grow for a period of
approximately eight weeks or until the top of the broth was covered with biomass. Fungi were
harvested by separation of broth and mycelia. The spent culture broth was shaken against an
equal volume of ethyl acetate (x 3) in a separatory funnel. The combined organic extract was
dried (MgSO4 anhydrous), filtered, and then concentrated in vacuo using a Buchi rotovap to
yield the crude, organic broth extract.
The combined mycelia were frozen with liquid nitrogen then crushed in a mortar and
pestle. The powdered cells were extracted with 80% aqueous methanol (100 mL/g cells), then
filtered, and concentrated to dryness in vacuo. The extraction procedure was repeated twice, and
the combined cell extracts were dried and weighed.
Biological Assay
Bacterial assay plates, culture slants, and broth culture media were prepared with Nutrient
Agar (Bacto) and Luria Broth (Bacto). Candida albicans cultures and assay plates were
prepared with potato dextrose agar (Bacto). Cultures of E. coli and Pseudomonas aeruginosa
(gram negative) as well as Staphylococcus epidermis, Bacillus subtilis (gram positive), and
Candida albicans were cultured for use in antimicrobial assays. Stock culture transfers were

36
performed regularly every two to four weeks. The slant cultures were transferred to broth for use
in the antimicrobial assays.
Sterile assay plates were streaked with the test microorgamism. A 20 μL aliquot of each
1 mg/mL methanol-dissolved sample was placed on a disc (Schleicher and Schull Grade 740E-
1/4in.). Erythromycin (15μg), Rifampin (25μg), Vancomycin (30μg), and methanol (20μL) were
used for positive and negative controls. Plates were incubated at 37˚ C overnight and the results
were taken the following day. A positive result was indicated by a zone of growth inhibition
(mm) around the sample disc.
Isolation
Generally, the fungal broth and mycelia organic extracts were first fractionated by
reversed-phase C18 chromatography using either a SepPak or open column and elution with H2O-
MeOH gradient. Each fraction was tested for biological activity using the suite of bioassays
described above. After analysis, bioactive fractions were pooled and further separated by either
size-exclusion (Sephadex LH-20: MeOH elution) or reversed-phase C18 open column
chromatography (Bakerbond: elution with H2O-MeOH mixtures). The resulting fractions were
further tested for biological activity, and if still impure were further purified by C18 reversed-
phase HPLC.
Spectroscopy
Mass spectral data were obtained on a Waters Micromass ZQ2000 instrument.
Electrospray either in the positive and negative ionization mode was used with capillary 3.5V,
variable cone voltage, extractor 5V, and RF lens 0.5V. 1H and 13C NMR data were obtained
using a Brüker 500 MHz instrument. Spectra were recorded in CDCl3 or d4-methanol.

37
Literature Cited
1. Eiseman, N. J., and McMillan, C. (1980) A new species of seagrass, Halophila johnsonii, from the atlantic coast of Florida. Aquatic Botany 9, 15-19.
2. Virnstein, R., Morris, L., Miller, J., and Miller-Myers, R. (1997) in Technical Memorandum 24, St. Johns River Water Management District, Patalka, Florida.
3. Jewett-Smith, J., McMillan, C., Kenworthy, W. J., and Bird, K. (1997) Flowering and genetic banding patterns of Halophila johnsonii and conspecifics. Aquatic Botany 59, 323-331.
4. Dawes, C., Lobban, C., and Tomasko, D. (1989) A comparison of the physiological ecology of the seagrasses Halophila decipiens Ostenfield and Halophila johnsonii Eiseman from Florida. Aquatic Botany 33, 149-154.
5. Durako, M. J., Kunzelman, J. I., Kenworthy, W. J., and Hammerstrom, K. K. (2003) Depth-related variability in the photobiology of two populations of Halophila johnsonii and Halophila decipiens. Marine Biology 142, 1219-1228.
6. Kunzelman, J., Durako, M., Kenworthy, W., Stapleton, A., and Wright, J. (2005) Irradiance-induced changes in the photobiology of Halophila johnsonii. Marine Biology 148, 241-250.
7. Matsumura, Y., and Ananthaswamy, H. N. (2004) Toxic effects of ultraviolet radiation on the skin. Toxicology and Applied Pharmacology & Toxicology of the Skin 195, 298-308.
8. Hollosy, F. (2002) Effects of Ultraviolet radiation on plant cells. Micron 33, 179-197. 9. Harborne, J. B., and Williams, C. A. (2000) Advances in flavonoid research since 1992.
Phytochemistry 55, 481-504. 10. Martens, S., and Mithofer, A. (2005) Flavones and flavone synthases. Phytochemistry 66,
2399-2407. 11. Markham, K. R., Tanner, G. J., Caasi-Lit, M., Whitecross, M. I., Nayudu, M., and
Mitchell, K. A. (1998) Possible protective role for 3',4'-dihydroxyflavones induced by enhanced UV-B in a UV-tolerant rice cultivar. Phytochemistry 49, 1913-1919.
12. Ormrod, D. P., Landry, L. G., and Conklin, P. L. (1995) Short-term UV-B radiation and ozone exposure effects on aromatic secondary metabolite accumulation and shoot growth of flavonoid-deficient Arabidopsis mutants. Physiologia Plantarum 93, 602-610.
13. Middleton, E. M., and Teramura, A. H. (1993) The Role of Flavonol Glycosides and Carotenoids in Protecting Soybean from Ultraviolet-B Damage. Plant Physiol. 103, 741-752.
14. Shick, J. M., and Dunlap, W. C. (2002) Mycosporine-like amino acids and related Gadusols: biosynthesis, acumulation, and UV-protective functions in aquatic organisms. Annu Rev Physiol 64, 223-62.
15. Boue, S. M., Carter-Wientjes, C. H., Shih, B. Y., and Cleveland, T. E. (2003) Identification of flavone aglycones and glycosides in soybean pods by liquid chromatography-tandem mass spectrometry. Journal of Chromatography A 991, 61-68.
16. Wolfender, J.-L., Rodriguez, S., and Hostettmann, K. (1998) Liquid chromatography coupled to mass spectrometry and nuclear magnetic resonance spectroscopy for the screening of plant constituents. Journal of Chromatography A 794, 299-316.
17. Justesen, U., Knuthsen, P., and Leth, T. (1998) Quantitative analysis of flavonols, flavones, and flavanones in fruits, vegetables and beverages by high-performance liquid

38
chromatography with photo-diode array and mass spectrometric detection. J Chromatogr A 799, 101-10.
18. Stobiecki, M. (2000) Application of mass spectrometry for identification and structural studies of flavonoid glycosides. Phytochemistry 54, 237-256.
19. McMillan, C., Zapata, O., and Escobar, L. (1980) Sulphonated phenolic compounds in seagrasses. Aquatic Botany 8, 267-278.
20. McMillan, C., Williams, S., Escobar, L., and Zapata, O. (1981) Isozymes, Secondary Compounds and Experimental Cultures of Australian Seagrasses in Halophila, Halodule, Zostera, Amphibolis and Posidonia. Australian Journal of Botany 29, 247-260.
21. Larsen, T. O., Smedsgaard, J., Nielsen, K. F., Hansen, M. E., and Frisvad, J. C. (2005) Phenotypic taxonomy and metabolite profiling in microbial drug discovery. Nat Prod Rep 22, 672-95.
22. Levy, S. (2004) The challenge of antiobiotic resistance. Scientific American, 46-58. 23. Iseman, M. D. (1993) Treatment of Multidrug-Resistant Tuberculosis. N Engl J Med 329,
784-791. 24. Bax, R., Mullan, N., and Verhoef, J. (2000) The millennium bugs--the need for and
development of new antibacterials. Int J Antimicrob Agents 16, 51-9. 25. Fenical, W. (1997) New pharmaceuticals from marine organisms. Trends in
Biotechnology 15, 339-341. 26. Newman, D. J., Cragg, G. M., and Snader, K. M. (2003) Natural Products as Sources of
New Drugs over the Period 1981-2002. J. Nat. Prod. 66, 1022-1037. 27. Newman, D. J., and Cragg, G. M. (2004) Marine natural products and related compounds
in clinical and advanced preclinical trials. J Nat Prod 67, 1216-38. 28. Sponga, F., Cavaletti, L., Lazzarini, A., Borghi, A., Ciciliato, I., Losi, D., and Marinelli,
F. (1999) Biodiversity and potentials of marine-derived microorganisms. Journal of Biotechnology & Biotechnological Aspects of Marine Sponges 70, 65-69.
29. Newman, D., and Hill, R. (2006) New drugs from marine microbes: the tide is turning. Journal of Industrial Microbiology and Biotechnology 33, 539-544.
30. Jenson, P. R., and Fenical, W. (2002) in Fungi in Marine Environments (Hyde, K. D., Ed.) pp 293-315.
31. Colwell, R. R. (2002) Fulfilling the promise of Biotechnology. Biotechnological Advances 20, 215-228.
32. Bhadury, P., Mohammad, B., and Wright, P. (2006) The current status of natural products from marine fungi and their potential as anti-infective agents. Journal of Industrial Microbiology and Biotechnology, 1-13.
33. Liberra, K., and Lindequist, U. (1995) Marine fungi- a prolific resource of biologically active natural products. Pharmazie 50, 583-587.
34. Biabani, M. A. F., and Laatsch, H. (1998) Advances in chemical studies on low-molecular weight metabolites of marine fungi. J. prakt chem 340, 589-607.
35. Cueto, M., Jensen, P. R., Kauffman, C., Fenical, W., Lobkovsky, E., and Clardy, J. (2001) Pestalone, a new antibiotic produced by a marine fungus in response to bacterial challenge. J Nat Prod 64, 1444-6.
36. Hwang, Y., Rowley, D., Rhodes, D., Gertsch, J., Fenical, W., and Bushman, F. (1999) Mechanism of Inhibition of a Poxvirus Topoisomerase by the Marine Natural Product Sansalvamide A. Mol Pharmacol 55, 1049-1053.

39
37. Isaka, M., Suyarnsestakorn, C., Tanticharoen, M., Kongsaeree, P., and Thebtaranonth, Y. (2002) Aigialomycins A-E, New Resorcylic Macrolides from the Marine Mangrove Fungus Aigialus arvus. J. Org. Chem. 67, 1561-1566.
38. Numata, Atsushi, Takahashi, C., Ito, Y., Takada, T., Kawai, K., Usami, Y., Matsumura, E., Imachi, M., Ito, T., and Hasegawa, T. (1993) Communesins, cytotoxic metabolites of a fungus isolated from a marine alga. Tetrahedron Letters 34, 2355-2358.
39. Papagianni, M. (2004) Fungal morphology and metabolite production in submerged mycelial processes. Biotechnol Adv 22, 189-259.
40. Gibbs, P. A., Seviour, R. J., and Schmid, F. (2000) Growth of filamentous fungi in submerged culture: problems and possible solutions. Crit Rev Biotechnol 20, 17-48.
41. Colwell, R. R. (1985) in Biotechnology of marine polysaccharides. Procedding of the 3rd annual MIT seer grant college program lecture and seminar. (Colwell, R. R., Pariser, E. R., and Sinskey, A. J., Eds.) pp 364-376, Hemisphere Publishing, Washington.
42. Kohlmeyer, J. (1979) Marine Mycology: the higher fungi, Academic Press, New York. 43. Pretsch, E., Buhlmann, P., and Affolter, C. (2000) Structure Determination of Organic
Compounds, 3rd ed., Springer-Verlag, Berlin. 44. Rojas, R., Caviedes, L., Aponte, J. C., Vaisberg, A. J., Lewis, W. H., Lamas, G.,
Sarasara, C., Gilman, R. H., and Hammond, G. B. (2006) Aegicerin, the first oleanane triterpene with wide-ranging antimycobacterial activity, isolated from Clavija procera. J Nat Prod 69, 845-6.
45. Saroglou, V., Karioti, A., Demetzos, C., Dimas, K., and Skaltsa, H. (2005) Sesquiterpene lactones from Centaurea spinosa and their antibacterial and cytotoxic activities. J Nat Prod 68, 1404-7.

APPENDIX A
Appendix A: Detailed description of bioassay-guided fractionations of marine fungi.
Bioassay-guided fractionation of Camarosporium I
Approximately six liters of biomass of Camarosporium I (Fig. 1) was extracted (ethyl
acetate) resulting in a crude, organic extract (32mg) and mycelia extract (190mg). The broth
extract was applied to a reversed-phase C18 column (Bakerbond, 10 x 150 mm) and eluted with
an aqueous methanol gradient (20, 30, 40, 50, 60, 70, 80, 100%) yielded twenty-seven fractions.
The bioactive fractions were combined (2 mg). The mycelia extract was applied to a reversed-
phase C18 (Bakerbond, 15 x 200 mm) column and eluted with a methanol-water gradient (20,30,
40, 50, 60, 70, 80, 100% meOH) resulting in twenty-six fractions. The bioactive fractions were
combined (5mg) then added to the bioactive broth fractions. The bioactive material (7 mg) was
applied to a LH-20 column (Sephadex, 10 x 150 mm). Elution with two column volumes of
methanol gave thirty-nine fractions. The bioactive fractions were combined (<1 mg) and lack of
sufficient material prevented further separation or spectral analysis.

41
Figure 1. Bioassay guided fractionation of Camarosporium I.
Camarosporium I
broth myceliasolvent extraction solvent extraction
(32mg) (150mg)[-,-] [-,-]
RP C18 RP C18
AK2-44-1 AK2-44-2 AK2-44-3 AK2-43-1 AK2-43-2 AK2-43-3 AK2-43-4[+,+] [-,-] [-,-] [+,+] [-,-] [-,-] [-,-](0mg) (0mg)
LH-20
AK2-50- 1-->13 AK2-50- 14-->17 AK2-50- 18-->25 AK2-50- 26-->39[-,-] [+,+] [-,-] [-,-]
(0mg)
*[Indicates gram-positive assay result, gram-negative assay result]

42
Bioassay-guided fractionation of Corollospora quinqeseptata
In April 2002, 6 L of Corollospora quinqeseptata (Fig. 2) culture was harvested
and a crude, organic broth extract (40 mg) and cellular extract (500 mg) was obtained. The broth
extract was applied to reversed-phase C18 (Analtech 10 x 150 mm) column chromatography and
eluted with a methanol-water gradient (20, 30, 40, 50, 60, 70, 80, 100%). The bioactive broth
fractions (30 mg) were combined and applied to a reversed-phase C18 (Bakerbond, 10 x 100 mm)
column. The column was eluted with 20, 30, 40, 50, 60, 70, 80, 100% methanol-water. The
bioactive material was combined (5.8 mg) and subjected to further purification by HPLC on a
Zorbax RP-C18 column (250 mm x 10 mm). Separation was achieved by a 20 minute gradient
from 55-95 % meOH-water (2 mL/min). Four bioactive fractions were found: AK2-21-3 (0.3
mg), AK2-21-4 (0.0 mg), AK2-21-5 (0.0 mg), and AK2-21-7 (0.6 mg). The bioactive material
was stored at -20˚ C.
The mycelia extract (April 2002) (Fig. 3) was applied to a reversed-phase C18 column
(Analtech, 15 x 200 mm) and eluted with a methanol-water gradient (20, 30, 40, 50, 60, 70, 80,
100%). The bioactive mycelia fractions (7 mg) were combined and applied to another reversed-
phase C18 (Bakerbond, 10 x 100 mm) column. The column was eluted with 20, 30, 40, 50, 60,
70, 80, 100% methanol-water. The bioactive fractions were combined (2.2 mg) and held for
more biomass.
In October 2002 (Fig. 4), 6L of culture was harvested. The organic extraction (ethyl
acetate) of the 6 L of broth resulted in a crude, organic extract (52 mg). The extract was applied
to a reversed- phase C18 (Analtech, 10 x 150 mm) column and eluted

43
Figure 2. Bioassay guided fractionation of Corollospora quinqueseptata broth in April 2002.
Corollospora quinqueseptatabroth
Apr. 2002
solvent extraction [+,+]* (40mg)
RP C18 Analtech
AK1-88-1 -->2 AK1-88-3 -->4 AK1-88-5 -->6 [+,+] [-,-] [-,-]
(30 mg)
RP C18 Bakerbond
AK1-93-2 -->26 AK1-93-27 -->38[+,+] [-,-]
(16 mg)
HPLC
AK2-21-1 AK2-21-2 AK2-21-3 AK2-21-4 AK2-21-5 AK2-21-6[-,-] [-,-] [+,+] [+,+] [+,+] [+,+]
(0.3 mg) (0.0 mg) (0.0 mg) (0.6 mg)
*[Indicates gram-positive assay result, gram-negative assay result]

44
Figure 3. Bioassay guided fractionation of Corollospora quinqueseptata mycelia in April 2002.
Corollospora quinqueseptatamycelia
Apr. 2002
solvent extraction[+,+]*
(500mg)
RP C18 Analtech
AK1-88-1 -->2 AK1-88-3 -->4 AK1-88-5 -->6 [+,+] [-,-] [-,-]
(7 mg)
RP C18 Bakerbond
AK1-91-1 -->25 AK1-91-25-54 AK1-91-55 -->58 AK1-91-59-->72[-,-] [-,-] [+,+] [-,-]
(2.2 mg)
*[Indicates gram-positive assay result, gram-negative assay result]

45
Figure 4. Bioassay guided fractionation of Corollospora quinqueseptata broth in October 2002
Corollospora quinqueseptataOct 2002 broth
solvent extraction[+,+]*
(52 mg)
RP C18
AK2-45-1 -->3 AK2-45-4 -->20 AK2-45-21 -->23 [-,-] [+,+] [-,-]
(29 mg)
LH-20
AK2-49-1 -->13 AK2-49-14 -->20 AK2-49-21 -->35[-,-] [-,-] [+,+]
(23 mg)
RP C18
AK2-55-4 AK2-55-5 AK2-55-6[-,-] [-,-] [+,+]
(0.8 mg)
*[Indicates gram-positive assay result, gram-negative assay result]

46
with 20, 30, 40, 50, 60, 70, 80, 100% methanol-water. The bioactive fractions eluted in the latter
part of the column and were combined (29 mg) and applied to a LH-20 column
(Sephadex, 10 x 100 mm). The column was eluted with two column volumes of methanol. The
bioactive fractions were combined (23 mg), applied to a reversed-phase C18 column (Bakerbond,
10 x 100 mm), and eluted with 20, 30, 40, 50, 60, 70, 80, 100% methanol-water. The bioactive
fractions were combined as AK2-55-6 (0.8 mg) and used for LC-MS method development.
In December 2002, 16 L of Corollospora quinqeseptata (Fig. 5) was harvested. The
organic extraction (ethyl acetate) of the 16 L of broth gave a crude, broth extract (430mg). The
organic broth extract was applied to a reversed-phase ENVI-C18 Sep-Pak cartridge (Supelco, 5g)
and eluted with 20, 30, 40, 50, 60, 70, 80, 100% methanol-water. The bioactive broth fractions
were combined (40 mg), applied to a LH-20 column (Sephadex, 10 x 100 mm), and eluted with
two column volumes of methanol. Based on differences in bioactivity, two bioactive fractions
were formed (18 mg and 20mg). The 20 mg fraction was applied to a reversed-phase C18
(Bakerbond 10 x 75 mm) column and eluted with 20, 30, 40, 50, 60, 70, 80, 100% methanol-
water. The bioactive fractions were combined (1 mg). The two bioactive fractions (18 mg and 1
mg) were subjected to further separation by HPLC on a Zorbax RP-C18 column (250mm x
10mm). Separation was achieved by a 20 minute gradient from 55-95 % meOH-water
(2mL/min). Four bioactive fractions were found: AK2-66-2 (1 mg), AK2-76-4 (0.5 mg), AK2-
76-6 (0.5 mg), AK2-76-7 (0.5 mg)
The mycelia (December 2002) (Fig. 6) was extracted (80% methanol-water) and gave a
crude, organic extract (250mg). The crude extract was applied to a reversed-phase

47
Figure 5. Bioassay guided fractionation of Corollospora quinqueseptata broth in December 2002.
Corollospora quinqueseptatabrothDec-02
solvent extraction[+,+]*
(430 mg)
RP C18 Sep pak
AK2-64-1 -->5 AK2-64-6 -->10 [-,-] [+,+]
(40mg)
LH-20
AK2-66-1 -->24 AK2-66-25 -->43 AK2-66-44 -->80 [-,-] [+,+] [+,+]
(18mg) (20mg)
RP C18 Bakerbond
AK2-69-1 -->40 AK2-69-41 -->49 AK2-69-50 --> 53 [-,-] [+,+] [-,-]
(1mg)
AK2-66- HPLC
1 2 3 4[-,-] [+,+] [-,-] [-,-]
(1mg) AK2-76- HPLC
1 2 3 4 5 6 7[-,-] [-,-] [-,-] [+,+] [-,-] [+,+] [+,+]
(0.5mg) (0.5mg)(0.5mg)
*[Indicates gram-positive assay result, gram-negative assay result]

48
Corollospora quinqueseptatamyceliaDec-02
solvent extraction [+,+]*
(250 mg)
RP C18 Sep pak
AK2-65-1 -->5 AK2-65-6 -->8 [-,-] [+,+]
(20 mg)
LH20
AK2-67-1 -->30 AK2-67-31-->35 AK2-67-36 -->51 AK2-67-51 -->79 AK2-67-80 -->82 [-,-] [-,-] [+,+] [+,+] [-,-]
(3 mg) (1 mg)
HPLCAK2-73
1 2[-,-] [-,-]
HPLCAK2-74
1 2 3 4 5 6 7[-,-] [-,-] [-,-] [+,+] [-,-] [+,+] [-,-]
(<1 mg) (<1 mg)
*[Indicates gram-positive assay result, gram-negative assay result]
Figure 6. Bioassay guided fractionation of Corollospora quinqueseptata mycelia in December 2002.

49
ENVI-C18 Sep-Pak cartridge (Supelco, 10g) and eluted with 20, 30, 40, 50, 60, 70, 80, 100%
methanol-water. The bioactive fractions were combined (20 mg), applied to a LH-20 column
(Sephadex, 10 x 100 mm), and eluted with two column volumes of methanol. Based on
differences in bioactivity, two bioactive fractions were formed (1 mg and 3 mg). The two
bioactive fractions were subjected further separation by HPLC on a Zorbax RP-C18 column
(250mm x 10mm). Separation was achieved by a 20 minute gradient from 55-95 % meOH-water
(2mL/min). Two bioactive fractions were formed: AK2-74-4 (0 mg) and AK2-74-6 (0 mg). All
bioactive fractions were stored at -20˚C.
In April 2003, twenty-five liters of Corollospora quinqueseptata (Fig. 7) culture was
harvested. Organic extraction (ethyl acetate) of the broth gave a crude, organic extract (196 mg).
The crude broth extract was applied to an ENVI-C18 Sep-Pak (Supelco, 5 g, 20 mL) column and
was eluted with 20, 30, 40, 50, 60, 70, 80, 100 % methanol-water. The bioactive fractions were
combined (76 mg) and applied to a LH-20 (Sephadex, 10 x 150 mm) and eluted with two column
volumes of methanol. The bioactive fractions were combined (28 mg) and purified by HPLC on
a Zorbax RP-C18 column (250mm x 10mm). Separation was achieved by a 20 minute gradient
from 55-95 % meOH-water (2mL/min). Four bioactive fractions were found: AK2-86-3 (1.5
mg), AK2-86-5 (1.0 mg), AK2-86-6 (1.0 mg).
The harvested mycelia (April 2003) (Fig. 8) was extracted (80% methanol-water) and
gave a crude, organic extract (210 mg). The crude mycelia extract was applied to an ENVI-C18
Sep-Pak column (Supelco, 5 g, 20 mL) and eluted with 20, 30, 40, 50, 60, 70, 80, 100 %
methanol-water. The bioactive fractions were combined (22 mg), applied to a LH-20 column
(Sephadex, 10 x 100 mm), and eluted with two column volumes of

50
Figure 7. Bioassay guided fractionation of Corollospora quinqueseptata broth in April 2003.
Corollospora quinqueseptataBroth April 2003
solvent extraction[+,+]*
(196 mg)
Sep-Pak RP-C18
AK2-82-1 -->2 AK2-82-3 -->4 AK2-82-5 -->9 [-,-] [-,-] [+,+]
(76 mg)
LH-20
AK2-84-1 -->15 AK2-84-15 -->57 AK2-84-58 -->80[-,-] [+,+] [-,-]
(28 mg)
HPLC
AK2-86-1 AK2-86-2 AK2-86-3 AK2-86-4 AK2-86-5 AK2-86-6[-,-] [-,-] [+,+] [-,-] [+,+] [+,+]
(1.5 mg) (1.0 mg) (1.0 mg)
*[Indicates gram-positive assay result, gram-negative assay result]

51
Corollospora quinqueseptatamycelia
April 2003
solvent extraction[+,+]*
(210 mg)
Sep-Pak RP-C18
AK2-87-1 -->3 AK2-87-4-->5 AK2-87-6 -->8 [-,-] [-,-] [+,+]
(22 mg)
LH-20
AK2-88-1 -->15 AK2-88-15 -->57 AK2-88-58 -->80[-,-] [+,+] [-,-]
(7mg)
HPLC
AK2-90-1 AK2-90-2 AK2-90-3 AK2-90-4 AK2-90-5 AK2-90-6[-,-] [-,-] [+,+] [-,-] [+,+] [+,+]
(0.5 mg) (0.5 mg) (0.3mg)
*[Indicates gram-positive assay result, gram-negative assay result]
Figure 8. Bioassay guided fractionation of Corollospora quinqueseptata mycelia in April 2003.
52
methanol. The bioactive fractions were combined (7 mg) and subjected to HPLC on a Zorbax
SB-C18 column (55-95 % methanol-water, 2 mL/min, 20 min). Three bioactive fractions were
identified: AK2-90-3 (0.5 mg), AK2-90-5 (0.5 mg), and AK2-90-6 (0.3 mg).
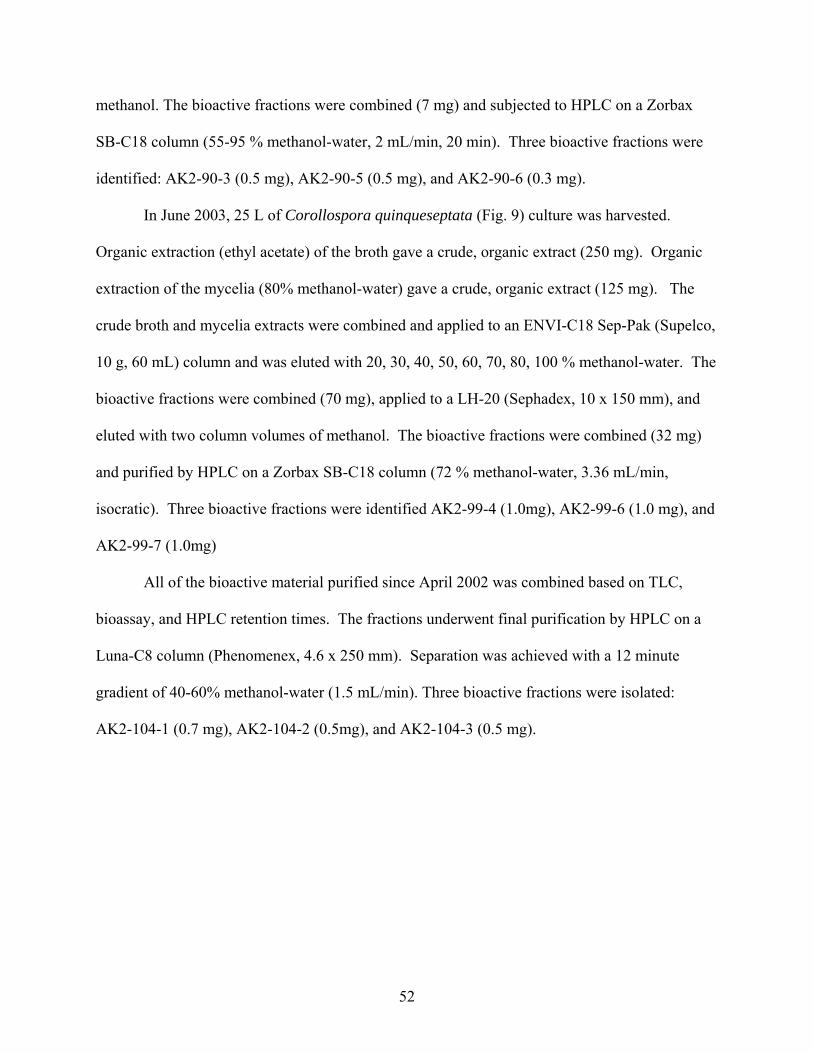
In June 2003, 25 L of Corollospora quinqueseptata (Fig. 9) culture was harvested.
Organic extraction (ethyl acetate) of the broth gave a crude, organic extract (250 mg). Organic
extraction of the mycelia (80% methanol-water) gave a crude, organic extract (125 mg). The
crude broth and mycelia extracts were combined and applied to an ENVI-C18 Sep-Pak (Supelco,
10 g, 60 mL) column and was eluted with 20, 30, 40, 50, 60, 70, 80, 100 % methanol-water. The
bioactive fractions were combined (70 mg), applied to a LH-20 (Sephadex, 10 x 150 mm), and
eluted with two column volumes of methanol. The bioactive fractions were combined (32 mg)
and purified by HPLC on a Zorbax SB-C18 column (72 % methanol-water, 3.36 mL/min,
isocratic). Three bioactive fractions were identified AK2-99-4 (1.0mg), AK2-99-6 (1.0 mg), and
AK2-99-7 (1.0mg)
All of the bioactive material purified since April 2002 was combined based on TLC,
bioassay, and HPLC retention times. The fractions underwent final purification by HPLC on a
Luna-C8 column (Phenomenex, 4.6 x 250 mm). Separation was achieved with a 12 minute
gradient of 40-60% methanol-water (1.5 mL/min). Three bioactive fractions were isolated:
AK2-104-1 (0.7 mg), AK2-104-2 (0.5mg), and AK2-104-3 (0.5 mg).
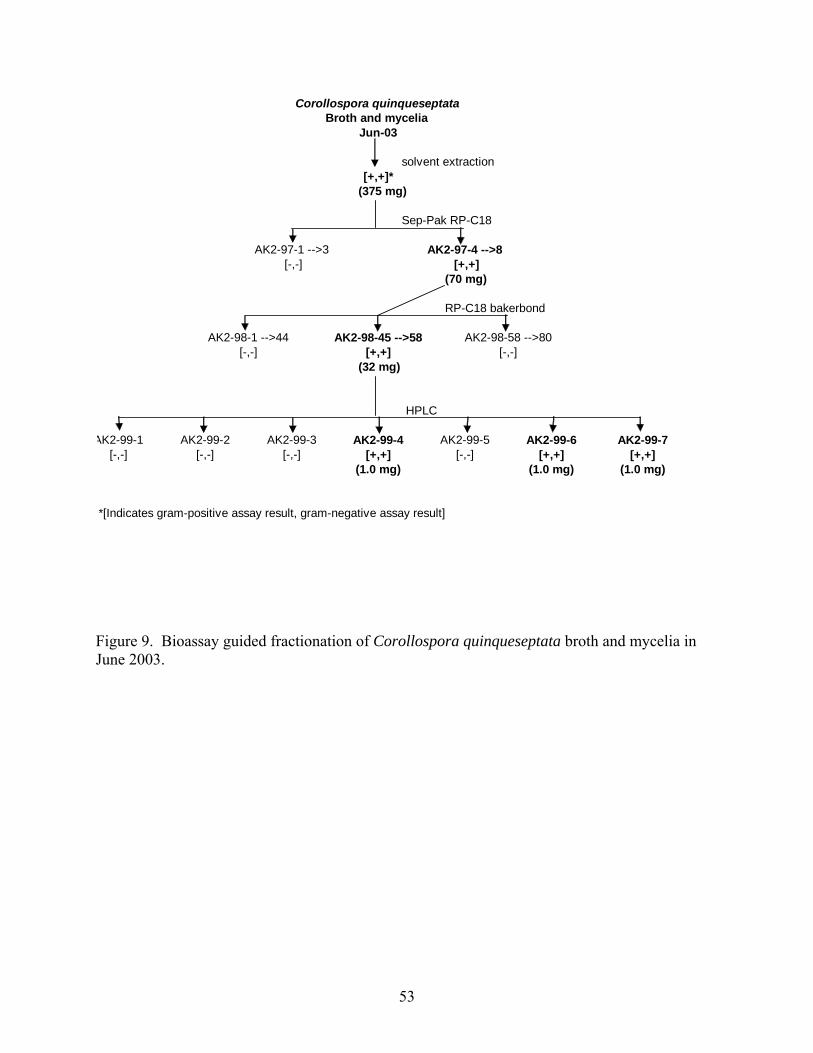
53
Figure 9. Bioassay guided fractionation of Corollospora quinqueseptata broth and mycelia in June 2003.
Corollospora quinqueseptataBroth and mycelia
Jun-03
solvent extraction[+,+]*
(375 mg)
Sep-Pak RP-C18
AK2-97-1 -->3 AK2-97-4 -->8 [-,-] [+,+]
(70 mg)
RP-C18 bakerbond
AK2-98-1 -->44 AK2-98-45 -->58 AK2-98-58 -->80[-,-] [+,+] [-,-]
(32 mg)
HPLC
AK2-99-1 AK2-99-2 AK2-99-3 AK2-99-4 AK2-99-5 AK2-99-6 AK2-99-7[-,-] [-,-] [-,-] [+,+] [-,-] [+,+] [+,+]
(1.0 mg) (1.0 mg) (1.0 mg)
*[Indicates gram-positive assay result, gram-negative assay result]

54
Bioassay-guided fractionation of Saccardoella rhizophorae
Organic extraction (ethyl acetate) of 5 L of Saccardoella rhizophorae (Fig. 10) culture
was obtained in October 2002 gave a crude, organic extract (28mg). The extract was applied to a
reversed-phase C18 (Analtech, 10 x 150 mm) column and eluted with 20, 30, 40, 50, 60, 70, 80,
100% methanol-water. After TLC and bioassay, the bioactive fractions were combined (8.9 mg).
The bioactive fraction was applied to a LH-20 (Sephadex, 10 x 75 mm) and eluted with two
column volumes of methanol, which were characterized by TLC and bioassay. The bioactive
fractions were combined (0.3mg) and stored at -20°C.
Bioassay-guided fractionation of Tiarosporella halmyra
In October 2002 (Fig. 11), 6.2 L of broth culture was harvested and extracted to yield a
brown, oily crude extract (31.4 mg). The cellular material was held in a -20ºC freezer until the
next harvest. The crude, organic, broth extract was subjected to a Reversed-phase C18 column
(Bakerbond, 10 x 75 mm) and eluted with 20, 30, 40, 50, 60, 70, 80, 100 % methanol-water. The
bioactive fractions (14 mg) were combined and applied to a LH-20 column (Sephadex, 10 x 75
mm). The column was eluted with two column volumes of methanol. The resulting bioactive
fractions were combined (6 mg) and purified by HPLC on a Zorbax SB-C18 column (10 x 250
mm). Separation was

55
Figure 10. Bioassay-guided fractionation of Saccardoella rhizophorae.
Saccardoella rhizophorae
solvent extraction[+,-]*
(28mg)LH-20
AK2-53-1--> 13 AK2-53-14-->23 AK2-53-24-40[-,-] [+,-] [-,-]
(8.9mg)bakerbond
AK2-60-1--> 35 AK2-60-35-->37 [-,-] (0.3mg)
[+, -}
*[Indicates gram-positive result, gram-negative result]

56
Tiarosporella halmyrabroth
Oct 2002
solvent extraction[+,+]
(31.4mg)
RP C18
AK2-42-2 -->9 AK2-42-10 -->16 AK2-42-17 -->31 [+,+] [-,-] [-,-](14mg)
LH-20
AK2-48-1 -->14 AK2-48-15 -->22 AK2-48-23 -->27 AK2-48-28 -->33 [-,-] [+,+] [-,-] [-,-]
(6mg)
AK2-56 HPLC
1 2 3 4 5 6 7 8 9 10 11[-,-] [-,-] [-,-] [-,-] [-,-] [-,-] [-,-] [-,-] [-,-] [-,-] [-,-]
[+,+](0.2 mg)
*[Indicates gram-positive assay result, gram-negative assay result] Figure 11. Bioassay guided fractionation of Tiarosporella halmyra broth in October 2002.

57
achieved by an isocratic method of 21 % acetonitrile-water for twenty minutes (2 mL/min).
AK2-56-11 (0.2 mg) was found to be bioactive.
In December 2002 (Fig. 12), 16 L of broth and mycelia was harvested. Organic
extraction (ethyl acetate) of the broth gave an oily, brown crude extract (200 mg). Organic
extraction (80 % methanol-water) of the mycelia gave a crude organic extract (500 mg). The
mycelia extract showed no bioactivity. The bioactive broth extract was applied to an ENVI-C18
Sep-Pak cartridge (Supelco, 5 g, 20 mL) and eluted with 20, 30, 40, 50, 60, 70, 80, 100 %
methanol-water. The bioactive fractions were combined (28mg), applied to a LH-20 column
(Sephadex, 10 x 150mm), and eluted with two column volumes of methanol. The resulting
bioactive fractions were combined (17mg) and subjected to further separation by HPLC on a
luna- C18 column (Phenomenex, 10 x 250 mm). Separation was achieved with 51% acetonitrile-
water (20 min, isocratic 3mL/min) followed by 95 % acetonitrile –water (isocratic, 20 min,
3mL/min). A single bioactive fraction was found: AK2-79-6 (0.5 mg)
In April 2003 (Fig. 13), 25 L of culture was harvested. Organic extraction (ethyl acetate)
of the broth gave an oily, brown crude extract (280 mg). Organic extraction (80 % methanol-
water) gave a crude organic extract (550 mg). Again, the mycelia extract showed no bioactivity
and was stored at -20°C. The bioactive broth extract was applied to an ENVI-C18 Sep-Pak
cartridge (Supelco, 5 g, 20 mL) and was eluted with 20, 30, 40, 50, 60, 70, 80, 100 % methanol-
water. The bioactive fractions were combined (76 mg), applied to a LH-20 column (Sephadex,
10 x 150 mm), and eluted with two column volumes of methanol. The resulting bioactive
fractions were combined (28 mg) and subjected to further separation by HPLC on a luna- C18
column (Phenomenex, 10 x 250

58
Tiarosporella halmyrabrothDec-03
solvent extraction [+,+]*
(200mg)
RP C18 Sep pak
AK2-59-1 -->3 AK2-59-4-->8 [-,-] [+,+]
(28 mg)
LH-20
AK2-75-1-->14 AK2-75-15-->32 Ak2-75-33-->41 AK2-75-42 -->48[-,-] [+,+] [-,-] [-,-]
(17 mg)
HPLC
AK2-79-1 AK2-79-2 AK2-79-3 AK2-79-4 AK2-79-5 AK2-79-6[-,-] [-,-] [-,-] [-,-] [-,-] [+,+]
(0.5 mg)
*[Indicates gram-positive assay result, gram-negative assay result]
Figure 12. Bioassay guided fractionation of Tiarosporella halmyra broth in December 2002.

59
Tiarosporella halmyra
brothApr-03
solvent extraction [+,+]*
(280mg)
RP C18 Sep pak
AK2-81-1 -->6 AK2-81-6-->8 [-,-] [+,+]
(76 mg)
LH-20
AK2-83-1-->24 AK2-83-24-->37 Ak2-83-40-->70 AK2-75-42 -->48[-,-] [+,+] [-,-] [-,-]
(28 mg)
HPLCAK2-79-
AK2-89-1 AK2-89-2 AK2-89-3 AK2-89-4 AK2-89-5[-,-] [-,-] [-,-] [+,+] [-,-]
(1.0 mg)
*[Indicates gram-positive assay result, gram-negative assay result]
Figure 13. Bioassay guided fractionation of Tiarosporella halmyra broth in April 2003.

60
mm). Separation was achieved with 51% acetonitrile-water (20 min, isocratic 3mL/min)
followed by 95 % acetonitrile –water (isocratic, 20 min, 3mL/min). A single bioactive fraction
was found: AK2-89-4 (1.0 mg)
In June 2003 (Fig. 14), 25 L of culture was harvested. Organic extraction (ethyl acetate)
of the broth gave an oily, brown crude extract (179 mg). Organic extraction (80 % methanol-
water) gave a crude organic extract (350 mg). The mycelia extract showed no bioactivity. The
bioactive broth extract was applied to an ENVI-C18 Sep-Pak cartridge (Supelco, 5 g, 20 mL) and
was eluted with 20, 30, 40, 50, 60, 70, 80, 100 % methanol-water. The bioactive fractions were
combined (41 mg), applied to a LH-20 column (Sephadex, 10 x 150mm), and eluted with two
column volumes of methanol. The resulting bioactive fractions were combined (18 mg) and
subjected to further separation by HPLC on a luna- C18 column (Phenomenex, 10 x 250 mm).
Separation was achieved with 51% acetonitrile-water (20 min, isocratic 3mL/min) followed by
95 % acetonitrile –water (isocratic, 20 min, 3mL/min). A single bioactive fraction was found:
AK2-96-3 (1.0 mg).
The bioactive material from Tiarosporella halmyra was combined and applied to a Si-gel
column (EM Science, 10 x 100 mm). The column was eluted with two volumes of 9:1
Chloroform:Methanol. The bioactive fractions were combined as AK2-101-1 (1.5 mg).

61
Tiarosporella halmyrabrothJun-03
solvent extraction [+,+]*
(179mg)
RP C18 Sep pak
AK2-93-1 -->6 AK2-93-6-->8 [-,-] [+,+]
(41 mg)
LH-20
AK2-95-1-->24 AK2-95-24-->32 Ak2-95-32-->50 AK2-95-51 -->70[-,-] [+,+] [-,-] [-,-]
(18 mg)
AK2-79- HPLC
AK2-96-1 AK2-96-2 AK2-96-3 AK2-96-4 AK2-96-5[-,-] [-,-] [-,-] [+,+] [-,-]
(1.0 mg)
*[Indicates gram-positive assay result, gram-negative assay result]
Figure 14. Bioassay guided fractionation of Tiarosporella halmyra broth in April 2003.