comments on discussion paper - australian … ccc comment accc ulls...comments on discussion paper...
TRANSCRIPT

Comments on Discussion PaperTelstra’s Undertaking in relation to the
Unconditioned Local Loop Service
A report prepared by Marsden Jacob Associates in association with Europe Economics
for the Competitive Carriers Coalition
PUBLIC VERSION
3 May 2006

Marsden Jacob Associates Financial & Economic Consultants ABN 66 663 324 657 ACN 072 233 204 Internet: http://www.marsdenjacob.com.au E-mail: [email protected] Postal address Melbourne Office: Level 3, 683 Burke Road, Camberwell Victoria 3124 AUSTRALIA Telephone: (03) 9882 1600 International: +61 3 9882 1600 Facsimile: (03) 9882 1300 International: +61 3 9882 1300 Author(s): Jasper Boe Mikkelsen (MJA), Stefano D'Ambrosio (EE) This report may be cited as: Comments on Discussion Paper, Marsden Jacob Associates, Melbourne, 2006. Copyright © Marsden Jacob Associates Pty Ltd 2006
This report has been prepared in accordance with the scope of services described in the contract or agreement between Marsden Jacob Associates Pty Ltd ACN 072 233 204 (MJA) and the Client. Any findings, conclusions or recommendations only apply to the aforementioned circumstances and no greater reliance should be assumed or drawn by the Client. Furthermore, the report has been prepared solely for use by the Client and Marsden Jacob Associates accepts no responsibility for its use by other parties.
Financial & Economic Consultants

TABLE OF CONTENTS
Page PREFACE ............................................................................................................................. 1
1. INTRODUCTION AND SUMMARY............................................................................... 3 1.1. SUMMARY OF FINDINGS ...................................................................................... 4
1.1.1. Overall model considerations .......................................................................... 4 1.1.2. Bridger Mitchell’s comments............................................................................ 4 1.1.3. Technology choices......................................................................................... 6 1.1.4. Rolling forward................................................................................................. 7 1.1.5. Historic costs ................................................................................................... 7 1.1.6. Current costs ................................................................................................... 8 1.1.7. NERA model.................................................................................................... 8
2. MODELLING PARAMETERS AND ASSUMPTIONS ................................................... 9 2.1. REASONABLENESS OF TSLRIC ESTIMATES.......................................................... 9 2.2. BRIDGER MITCHELL’S 2005 ADVICE................................................................... 12
2.2.1. Efficient costs and pricing (s 3) ...................................................................... 12 2.2.2. Estimating efficient costs of UT services using a cost model (s 4) ................. 12 2.2.3. Provisioning of the PSTN (s 5) ...................................................................... 19 2.2.4. The PIE II model satisfies the requirements for TELRIC models (s 6) ........... 31 2.2.5. Calculating TSLRIC for subsequent years (s7).............................................. 43
3. COST ALLOCATIONS ............................................................................................... 45 3.1. ALLOCATION OF COMMON COSTS ...................................................................... 45 3.2. ALLOCATION OF NETWORK COSTS ..................................................................... 46
4. TECHNOLOGICAL CHOICES.................................................................................... 51
5. BAND 4....................................................................................................................... 57
6. ROLLING FORWARD ................................................................................................ 58 6.1. OPTION 1 – PIE II 2002/3 – 2005/6 .................................................................. 59 6.2. OPTION 2 ........................................................................................................ 61 6.3. CONCLUSION................................................................................................... 62
7. HISTORIC COSTS...................................................................................................... 64
8. CURRENT COSTS ..................................................................................................... 71
9. NERA MODEL............................................................................................................ 72

LIST OF TABLES
Page
TABLE 1: DEMAND TYPE CODE TABLE FROM THE DEMAND CUBE DATABASE............................... 17 TABLE 2: TOTAL REQUIRED CAPACITY (MBIT/S)........................................................................ 18 TABLE 3: FILL FACTORS USED IN OTHER BOTTOM-UP MODELS .................................................... 22 TABLE 4: NOMINAL PRICE TRENDS (ANNUALPERCENTAGE CHANGE IN COSTS) ............................. 25 TABLE 5: ASSET LIVES – PART I .............................................................................................. 29 TABLE 6: ASSET LIVES – PART II ............................................................................................. 30 TABLE 7: GROWTH IN THE ACCESS NETWORK ........................................................................... 43 TABLE 8: DIFFERENT CHARACTERISTICS OF ROLLOWING FORWARD OPTIONS .............................. 62
LIST OF FIGURES
Page
FIGURE 1: EXTRACT OF SOURCE CODE IN PROVISIONDAS, CAN-AF ......................................... 21 FIGURE 2: THE DEVELOPMENT IN COPPER PRICES..................................................................... 27 FIGURE 3: OPTIMISATION OF PILLAR PLACEMENT ..................................................................... 33 FIGURE 4: CLUSTERING.......................................................................................................... 34 FIGURE 5: EXTRACT OF PROVISIONRAUS, CAN-AF................................................................. 54
LIST OF BOXES
Page
BOX 1: BT AND NGN ............................................................................................................. 11 BOX 2: ESTIMATING TRENCH KM FROM ROAD KM....................................................................... 37 BOX 3: THE SWEDISH FUNCTIONAL AREA APPROACH................................................................ 42

GLOSSARY OF TERMS
21CN 21ST CENTURY NETWORK
ABUM ADAPTABLE BOTTOM-UP MODEL
ACCC AUSTRALIAN COMPETITION AND CONSUMER COMMISSION
ADSL ASYMMETRICAL DIGITAL SUBSCRIBER LINE
AGH ABOVE GROUND HOUSING
ARMCANZ AGRICULTURAL AND RESOURCE MANAGEMENT COUNCIL OF AUSTRALIA AND NEW ZEALAND
BM DR. BRIDGER MITCHELL
BT BRITISH TELECOM
BU BOTTOM-UP
CAN CUSTOMER ACCESS NETWORK
CBD COMMON BUSINESS DISTRICT
CC CURRENT COST
CCA CURRENT COST ACCOUNTING
CCC COMPETITIVE CARRIERS COALITION
CMUX CUSTOMER MULTIPLEXER
COAG COUNCIL OF AUSTRALIAN GOVERNMENTS
DA DISTRIBUTION AREA
DCAR DUAL CHANNEL ACCESS RADIO
DEA DATA ENVELOPMENT ANALYSIS
DHC DEPRECIATED HISTORIC COST
DORC DEPRECIATED OPTIMISED REPLACEMENT COST
DSLAM DIGITAL SUBSCRIBER LINE ACCESS MULTIPLEXER
EAR ENGINE ACCESS RAMP
EE EUROPE ECONOMICS
EIN ENGINE INTEGRAL SYSTEM
EPMU EQUAL PROPORTIONATE MARK UP
ESA EXCHANGE SERVING AREA
EV ECONOMIC VALUE
FDC FULLY DISTRIBUTED COSTS
GBV GROSS BOOK VALUE
GIS GEOGRAPHICAL INFORMATION SYSTEMS

HAI HATFIELD ASSOCIATES, INC.
HCA HISTORIC COST ACCOUNTING
HCRC HIGH CAPACITY RADIO CONCENTRATOR
HDSL HIGH SPEED DIGITAL SUBSCRIBER LINE
IP INTERNET PROTOCOL
IRG INDEPENDENT REGULATORY GROUP
ISDN INTEGRATED SERVICES DIGITAL NETWORK
ITST IT – OG TELESTYRELSEN (DENMARK)
LAS LOCAL ACCESS SWITCH
LCS LOCAL CARRIAGE SERVICE
LRIC LONG RUN INCREMENTAL COSTS
LTIE LONG TERM INTEREST OF END-USERS
MDF MAIN DISTRIBUTION FRAME
MEA MODERN EQUIVALENT ASSET
MGW MEDIA GATEWAY
MJA MARSDEN JACOB ASSOCIATES
MPLS MULTI PROTOCOL LABEL SWITCHING
MSAN MULTI SERVICE ACCESS NODE
MST MINIMUM SPANNING TREE
NBV NET BOOK VALUE
NERA NATIONAL ECONOMIC RESEARCH ASSOCIATES
NGN NEXT GENERATION NETWORK
NPV NET PRESENT VALUE
NRC NET REPLACEMENT COST
NRV NET REALISABLE VALUE
NTA NATIONAL TELECOM AGENCY
NTP NETWORK TERMINATION POINT
NTT NIPPON TELEGRAPH AND TELEPHONE
NU NETWORK UNIT
ODV OPTIMISED DEPRIVAL VALUE
OTA ORIGINATING AND TERMINATING ACCESS
PIE PSTN INGRESS/EGRESS
POTS PLAIN OLD TELEPHONY

PRA PRIMARY RATE ACCESS (30B+D)
PSTN PUBLIC SWITCHED TELEPHONY NETWORK
PTS POST OCH TELESTYRELSEN (SWEDEN)
RAU REMOTE ACCESS UNIT
RPI RETAIL PRICE INDEX
RPMU RAMSEY PRICING MARK-UP
RSS REMOTE SWITCHING SYSTEM
SCADS SMALL CAPACITY DISTRIBUTED SYSTEM
SCAR SINGLE CHANNEL ACCESS RADIO
SDH SYNCHRONOUS DIGITAL HIERARCHY
SDSL SYMMETRIC DIGITAL SUBSCRIBER LINE
SFA STOCHASTIC FRONTIER ANALYSIS
SIO SERVICE IN OPERATION
SMT STEINER MINIMUM TREE
STP SIGNAL TRANSFERS POINTS
TELRIC TOTAL ELEMENT LONG RUN INCREMENTAL COST
TeS TELEPHONY SERVER
TSLRIC TOTAL SERVICE LONG RUN INCREMENTAL COSTS
UGH UNDER GROUND HOUSING
ULL UNCONDITIONED LOCAL LOOP
ULLS UNCONDITIONED LOCAL LOOP SERVICE
USO UNIVERSAL SERVICE OBLIGATION
UT THE COLLECTIVE OF LCS, PSTN OTA AND ULL SERVICES, ABBREVIATION USED BY BRITCHER MITCHELL
VDSL VERY HIGH SPEED DIGITAL SUBSCRIBER LINE
VoIP VOICE OVER IP
WIK WISSENSCHAFTLICHES INSTITUT FÜR INFRASTRUKTUR UND KOMMUNIKATIONSDIENSTE
xDSL X DIGITAL SUBSCRIBER LINE

Competitive Carriers Coalition Comments on the ACCC Discussion paper – review of PIE II
MJA Comments on Discussion Paper FINAL PUBLIC2 / 6 July 2006
1
Preface
For the purpose of this report, we have not validated or formally audited the source code or internal workings of the PIE model. We have however, consulted the source code and query design when necessary to understand the workings of the model.
One reoccurring critique of the PIE II model has been its lack of transparency. The authors of this report have worked with numerous other cost models1 and by comparison the PIE II model is one of the least accessible. Although the model has a reasonable (but not ideal) user interface, the documentation is poor and manipulation of the model is practically impossible (at least for a new user). Much of model’s key workings are hidden in Visual Basic code making it difficult and time consuming to audit. Although there is some commentary in the code, it is far from satisfactory. In our view, transparency could be greatly improved by providing a detailed user manual or training manual, that also sets out (in a comprehensive manner) the way the different modules and code scripts work together. In our experience such manuals could easily amount to a thousand pages of explanation and commentary.
Further, it may be appropriate to use a combination of MS Excel and MS Access to make some of the calculations more transparent. Although this may slow down some of the key workings of the model, transparency in a cost model for regulatory purposes is paramount. Without transparency, it is difficult to gain faith in the workings of the model. In this respect, we note that complexity does not necessarily entail lack of transparency. Complex calculations can be made in transparent manner.
As with most models, there is also a risk of error. In the PIE II model in particular, there would appear to be more than a thousand pages of source code. This greatly increases the risk of error. Hence, even if we did agree with every dimensioning and costing decision made in the model, we would still be reluctant to rely on the results without a more formal audit of the source code.
We acknowledge that much effort has been put into the design and workings of the PIE II model. And while we do not agree with all the modelling decisions that have been taken (as explained in the following), the model is comparably a fairly advanced cost model of the access network that has the potential to become an important tool for regulatory purposes. In this respect, it is unfortunate that Telstra has not been more forthcoming in increasing transparency.
1 For example, HCPM and CostPro in New Zealand, the Danish Hybrid models, the Swedish Hybrid models,
the Swedish COMPIS model, EE Adaptable Bottom-Up model, NERA cost model and various Analysys bottom-up mobile models.

Competitive Carriers Coalition Comments on the ACCC Discussion paper – review of PIE II
MJA Comments on Discussion Paper FINAL PUBLIC2 / 6 July 2006
2
Our review of the PIE II has uncovered what we believe to major problems with the methodology and approach. In particular:
the PIE II cannot be regarded as a forward-looking cost model based on best practice network technology;
the rolling forward methodology is inappropriate;
there would appear to be inconsistencies between the allocation and dimensioning in the access network leading to overestimated ULLS unit costs;
key parameters used to annualise costs (price trends and asset lives) used for the access network deviate from international practice and would, when adjusted, result in lower unit costs of the ULLS;
trench sharing should be set to a long-term ‘equilibrium’ new estate trench amount (proxied by historical developments) that is held constant over the regulatory period. This would increase sharing in the model and lower ULLS unit costs;
efficient O&M costs are overestimated; and
the model fails to optimise based on annualised cost (incl. O&M), but bases it technology choice on investment cost only.
In this report, we also consider the appropriateness of applying a Total Service Long Run Incremental Cost (TSLRIC) concept for the ULLS in the outer bands, i.e. rural Australia. Rural communities and areas suffer limited economies of density and limited prospects of competition. When this is the case, we question whether the TSLRIC principle and the desire to promote the uptake of broadband in these areas are compatible or another approach may be taken that better serves the long-term interest of end-users. One alternative could be to accept that there are areas in Australia that will never be subject to competition and to set a ULLS price that more strongly promotes allocative efficiency, i.e. set lower prices without jeopardising financial viability.
Finally, we urge the ACCC to commence modelling of a new core and access model. The access model is required because of the modelling and transparency concerns raised in relation to the PIE II model, lack of flexibility by Telstra and because the NERA model would appear to be inferior. As a basis for the new access network model much of the data from PIE II may be used to speed up this process. The core model is required because core networks have evolved significantly since the NERA model and PIE II were developed and both models are not reflective of forward-looking efficient costs.
In the interim we suggest that the ULLS costs be fixed at existing levels subject to clarifications of the inclusion of ULLS specific costs that are modelled outside the PIE II model.

Competitive Carriers Coalition Comments on the ACCC Discussion paper – review of PIE II
MJA Comments on Discussion Paper FINAL PUBLIC2 / 6 July 2006
3
1. Introduction and summary
Marsden Jacob Associates (MJA) has been requested by the Competitive Carriers Coalition (CCC) to address certain questions related to the Australian Competition and Consumer Commission’s (ACCC) discussion paper related to the Telstra undertakings in relation to the Unconditioned Local Loop Service. MJA has engaged Europe Economics (EE) to assist with certain issues contained in the questions raised by the Commission.
The comments and opinions expressed in this paper are those of MJA and do not necessarily reflect those of the CCC.
The eight questions/issues addressed in this report are:
(a) Question 9: Are the modelling parameters and economic assumptions underlying the PIE II model capable of producing reasonable TSLRIC estimates? Should the ACCC accept Bridger Mitchell’s 2005 advice to Telstra with regards to the appropriateness of these assumptions? Interested parties responding to this question are requested to provide specific and detailed answers.
(b) Question 10: Are allocations of common costs and network costs to ULLS, contained in PIE II, appropriate?
(c) Question 11: Are the technological choices (particularly with respect to alternative access technologies) built into the PIE II model still relevant for the purposes of constructing a hypothetical forward-looking network?
(d) Question 12: Given Telstra’s proposed approach to the averaging of network costs – where the costs of high cost regions are recovered in low cost regions – how accurate is the PIE II model in estimating costs in Band 4? How reasonable are the model’s assumptions with respect to the choice of technology in these areas (are the employed CAN technologies the best available) and network design parameters? Interested parties responding to this question are requested to provide specific and detailed answers.
(e) Question 13: Is Telstra’s methodology with respect to rolling forward the PIE II model to years beyond its original scope appropriate and capable of producing reasonable estimates? Interested parties responding to this question are requested to provide specific and detailed answers.
(f) Question 14: Should the ACCC consider the use of historic costs to estimate network costs for the ULLS? Are Telstra’s historic cost estimates for the ULLS reasonable? Can the historic cost regulatory accounts prepared by Telstra be used for the purposes of access price determinations? In discussing this issue, interested parties are asked to address their comments to the relevant statutory criteria.

Competitive Carriers Coalition Comments on the ACCC Discussion paper – review of PIE II
MJA Comments on Discussion Paper FINAL PUBLIC2 / 6 July 2006
4
(g) Question 15: Should the ACCC consider the use of current costs to estimate network costs for the ULLS? Are Telstra’s current cost estimates for the ULLS reasonable? Can the current cost regulatory accounts prepared by Telstra be used for the purposes of access price determinations? Interested parties responding to this question are requested to provide specific and detailed answers.
(h) Question 16: Telstra has claimed that if the ACCC cannot accept PIE II, it should revert to its NERA model to calculate network costs. Would this be an appropriate solution to the ACCC’s ongoing concerns regarding PIE II?
We consider each question/issue in turn in the following. For convenience, we have summarised our findings below.
1.1. Summary of findings
1.1.1. Overall model considerations
The PIE II model uses circuit switching technology which cannot to regarded as reflective of a forward-looking technology. As a result, we do not believe that PIE II model, as a matter of principle, produces reasonable results. Best practice network design and TSLRIC modelling would incorporate Next Generation Networks (NGN) elements.
The access network has not been subject to the same technological leaps as has the core network. Despite this, we would expect it to contain a mix of copper, fibre and radio. In addition, any changes in the specification of the core network may have effects on the access network.
In our view, the PIE II model likely overestimates the forward-looking efficient cost of ULLS. With regard to the cost of core services, we have not undertaken a detailed review, but note that technical solutions adopted in the PIE II model are far from being forward-looking (see above) which leads us to dismiss the PIE II model as appropriate for assessing the efficient costs of core-related services.
1.1.2. Bridger Mitchell’s comments
While regulatory models in numerous countries adopt a bottom-up approach (often using a top-down model for verification), we know of no other jurisdiction that relies solely on the incumbent’s bottom-up model (like PIE II). Such an approach can limit transparency and confidence in the independence of the estimates.
Good modelling practice should include the capacity to examine different technological solutions. The PIE II model does this for the access increment, but fails to consider different scenarios in the core increment.

Competitive Carriers Coalition Comments on the ACCC Discussion paper – review of PIE II
MJA Comments on Discussion Paper FINAL PUBLIC2 / 6 July 2006
5
While the line card may be the appropriate point of demarcation between access and core for most of the network, it is inappropriate for leased lines and other “advanced” systems. It is unclear if adequate account has been taken of leased lines or other services that use the access network.
It is unclear whether the current provisioning rules reflect efficient practices and would appear to result in inefficient over provisioning when account is taken of modularity, i.e. the model would appear to allow for a minimum of two copper pairs for each SIO on average. This level of provisioning is excessive. However, if this practice is not changed we suggest it would be reasonable to allocate some of these provision costs to the moves, changes, and future demand growth that the additional wires are installed to serve (i.e. not allocated between existing customers).
In terms of provisioning of spare capacity, it is unclear how a Year 1 rolling forward approach, as the one adopted in PIE II, would cater for a correct recovery of investment costs. A rolling forward approach would not explicitly take into account the evolution of traffic volumes over the years, especially if the annualisation formula used includes a “tilt” that takes into account only equipment price changes (and not evolution of traffic).
In the case of trenching, we consider that the price trend should be 2% rather than [c-i-c]%, and that for copper cable prices should be expected to rise by 6% pa (as used in other recent regulatory analysis overseas) [c-i-c ]. In the case of fibre, [c-i-c ] would appear to be appropriate. In these cases, depreciation would be [c-i-c ] in the PIE II model.2
An asset life of [c-i-c] years for distribution conduit in the PIE II model is [c-i-c too e ]. An appropriate estimate would be 40 years. This is also in line with recent developments in the UK, where the asset life for trench is 40 years. Likewise, the asset life for main cable in the PIE II model seems [c-i-ctoo s ]. These changes would result in a reduction in the cost of ULLS. On the other hand, the asset lives for certain transmission equipment, and to a lesser degree, fibre cable are slightly long compared with international data. Downward adjustments (a shortening of the asset life) in these categories would result in a slight increase in core services costs.
The aggregation level for asset lives and price trends is too broad. If the model makes no attempt to accurately model the economic characteristics of the specific assets by applying economic asset lives and price trends at a sufficiently detailed level, the value of the original detailed modelling of the underlying equipment numbers is discounted.
2 The exact effect will depend on how the annualisation methodology used and how equipment prices are
rolled forward in the model.

Competitive Carriers Coalition Comments on the ACCC Discussion paper – review of PIE II
MJA Comments on Discussion Paper FINAL PUBLIC2 / 6 July 2006
6
We infer from Bridger Mitchell’s comments that a pillar is located near the centre of the distribution area (DA) and served by a 100-pair distribution cable. In our view, it is unclear that such a placement strategy is optimal. More generally, if the pillar is placed close to customers, then total cable-km is minimised. Alternatively, if the pillar is placed close to the access switch then the total pair-km is minimised. In practice, a strategy between these two options is probably optimal.
The PIE II model has adopted a CMUX technology. However, it is unclear to us whether the dimensioning rules of the CAN in the PIE II model reflect a more progressed or optimal solution compared with the current Telstra access network.
Regarding trench length, we would expect the accuracy of the unadjusted rectilinear distance to decline the further one moves towards rural areas, where a grid-shaped layout is less common. In particular, the rectilinear measure could be improved by conducting studies of representative areas and developing correction factors for these areas. We suggest that Telstra conduct such analysis for some of the less dense ESAs. The output would likely be a correction factor resulting in shorter distances (on average) in less dense areas and hence to result in a decrease in overall (access) trench length in the network and lower costs.
Trench sharing should be more appropriately set to a long-term ‘equilibrium’ new estate trench amount (proxied by historical developments), that is held constant over the regulatory period and subject to review after each period.
We consider that the O&M costs used in the PIE model overestimate efficient O&M costs for two main reasons. First the model uses historic costs which are assumed and not demonstrated to be efficient; and second, newly laid copper lines are unlikely to require as much maintenance as older wire.
While unable to comment on the details of the allocation of indirect costs in the PIE model, we note that building and land costs are based on a direct input derived from Telstra’s estimates. These may need adjustment, reflecting, for example, where land and building have a bigger footprint than needed for efficient equipment placement. Inefficient vacant space should not be part of a TSLRIC (or TELRIC) estimate. A more appropriate estimate would be derived from the efficient land and building requirements from the dimensioned network.
1.1.3. Technology choices
A TSLRIC charge based on the costs of reproducing a copper network is useful only to calculate the costs of a ULLS based on copper. It is not necessarily capable of providing any useful signals to encourage efficient entry into the access network. To do so, the model must make appropriate technological choices.
In assessing alternative technologies, we consider that wherever possible sensitivity analysis should be used. For example, in the PIE model all DAs that are less than 6km

Competitive Carriers Coalition Comments on the ACCC Discussion paper – review of PIE II
MJA Comments on Discussion Paper FINAL PUBLIC2 / 6 July 2006
7
from the nearest RAU are dimensioned using copper. There may be benefit in examining the robustness of this rule.
Current evaluations use the capital cost of alternative technologies to determine efficient provisioning. We consider that the PIE II model should use the LRIC cost, i.e. the annualised cost (incl. O&M).
In terms of the generic costing alternatives, PIE II appears to encompass the majority of technology options. However, in our opinion, there would room to incorporate some of the newer radio technologies in the PIE model. Inclusion of these technologies is likely to result in less copper and fibre in DAs in rural areas and lower costs.
1.1.4. Rolling forward
In our opinion, a rolling forward option which generates results for years 1 to 4 as a consistent whole and in principle generates the basis for a coherent multi-year tariff schedule, should be preferred. This will enable the calculation of a smooth and transparent three-year price path for the undertaking which presents efficient incentives to all market participants. However, no matter which rolling forward methodology is chosen it is only as good as the base year from which it starts.
1.1.5. Historic costs
Historical prices also do not satisfy the competitive standard of efficiency. Only prices based on current cost data (or forward-looking costs) provide for efficient use of resources as operators and consumers are encouraged to take account of the actual resource costs in their purchasing decisions.
However, a particular issue arises with regard to assets that have been substantially or fully depreciated but are still fully operational. Many of these assets may have been partly paid off by end-users in the past. The existence of fully depreciated assets will create a gap between the outputs of bottom-up models like PIE II and top-down models.
With a view to economic efficiency alone in a competitive market, fully depreciated assets should be valued according to their full current costs. However, if value is attributed to fully depreciated assets the incumbent may be allowed to ‘double dip’, i.e. to levy an annualisation charge on assets where the full costs of depreciation may already have been passed on to end-users. Hence, it could be argued that the incumbent was being unfairly overcompensated at the expense of end-users.
These considerations are particularly relevant as regards the access network in rural areas, where the prospects of a competitive outcome even in the long run may be slim.
Setting a competitive benchmark such as TSLRIC may not be appropriate. Instead, it may be socially optimal to set ULLS prices at the lowest possible price that still

Competitive Carriers Coalition Comments on the ACCC Discussion paper – review of PIE II
MJA Comments on Discussion Paper FINAL PUBLIC2 / 6 July 2006
8
allows the incumbent to finance its activities. In other words, that the long-term interest of end-users may best be served by setting prices that reflect financial viability and allocative efficiency.
Where the incumbent is effectively providing a monopoly service and the cost of efficient entry is increasing over time, there would appear to be little demand or supply efficiency in encouraging entry to the market, since the incumbent would remain the efficient provider over time. Even if we are not certain that the cost of efficient entry is increasing over time but speculate that there might be a technology in the future that would result in a decrease in costs, time preference means that the long-term interests of end-users will be better served by benefits which accrue quickly, compared with equivalent benefits which are much delayed.
When there are no immediate prospects of competition or superior cost efficient technologies on the horizon, interests of end-users may be better served with an approach other than TSLRIC where focus is on allocative efficiency.
1.1.6. Current costs
We do not believe current cost accounts are appropriate for calculating the cost of ULLS. They may only be used to provide an indicative cost estimate.
1.1.7. NERA model
Without access to the NERA model, we have been unable to comment in detail on its appropriateness. However, based on our review of the 1999 model documentation we believe it to be inferior and suggest that an alternative model be created.

Competitive Carriers Coalition Comments on the ACCC Discussion paper – review of PIE II
MJA Comments on Discussion Paper FINAL PUBLIC2 / 6 July 2006
9
2. Modelling parameters and assumptions
Question 9: Are the modelling parameters and economic assumptions underlying the PIE II model capable of producing reasonable TSLRIC estimates? Should the ACCC accept Bridger Mitchell’s 2005 advice to Telstra with regards to the appropriateness of these assumptions? Interested parties responding to this question are requested to provide specific and detailed answers.
In the following section, we initially discuss issues related to principle when considering whether the PIE II model can produce reasonable TSLRIC estimates. More detailed commentary of specific parameters, assumptions and design rules are found in section 2.2 when we discuss the advice provided by Bridger Mitchell.
2.1. Reasonableness of TSLRIC estimates
TSLRIC is a forward-looking concept and TSLRIC models should include forward-looking technologies. In terms of switching technologies, there are two types - the conventional circuit switches and the newer packet switching technologies. In practice, both technologies are likely to operate together in Telstra’s network with circuit switches mainly used to carry PSTN traffic and packet switches used to carry broadband and other data services.
Circuit switches assign a dedicated line for the duration of the call. Historically, these types of switches have been seen as the optimum method for handling voice telephony, but are today actively being replaced by packet switching technologies. Packet switching technologies are more efficient at carrying data services and internet traffic.3
3 If we accept that circuit switched technology is optimal, the key optimisation driver must be the
minimisation of the switching costs, i.e. to optimise the type and size of switches. The factors to consider in this optimisation process would include:
* voice switches can be made with very large capacity. Larger switches have lower unit costs due to economies of scale. If one large switch replaces several smaller ones it:
– reduces operational costs,
– needs less space, and
– requires less duplication of common equipment.
* ‘access switches’ (those that connect to customers) can either be “simple concentrators” or else fully functional switches. If the cost differences between the two are relatively minor, ease of operations and reduced network capacity are likely by using fully functional switches at each node. However, where concentrators or multiplexers are less costly it may be more optimal to centralise some of the intelligence in the network.
Based on these considerations alone the design in the PIE II model is likely to be reasonably optimal. However, if we relax the requirement to model circuit switched technology we do not believe PIE II is optimal.

Competitive Carriers Coalition Comments on the ACCC Discussion paper – review of PIE II
MJA Comments on Discussion Paper FINAL PUBLIC2 / 6 July 2006
10
In terms of transmission, these costs have fallen since the PIE II model in its current form was created.4 Although it is a major investment to dig and install cables into the ground, new technology makes it possible to carry capacities over a few optical fibres that would not have been possible only five years ago. The cost of this extra capacity-producing equipment is also falling.5 As a result of these two factors, the net cost per Mbit/s of capacity has fallen and continues to fall. This trend has a number of impacts on network design:
only a few optical fibre cables are needed to produce a vast capacity – and a low cost per unit (per Mbit/s and per Mbit/s.km);
lower transmission costs makes the option of using more transmission to reduce switching costs more attractive (switch systems costs have not fallen as rapidly as transmission costs); and
optical technology enables long distances to be covered. A network design therefore can have intelligent switching centres remotely placed, as the cost of getting there is not prohibitive.
The transmission structure used in PIE II model appears to be fairly conservative, but fits well within the overall costing framework and technology choices. However, if the nature of the switching technology were changed there would likely be knock-on implications for the transmission design.
The norm, were an operator to build a network today, would be a Next Generation Network (NGN). This is clearly evidenced by the Telstra Technology Briefing 16 November 2005 and other Operators actively rolling out NGNs. An NGN is characterised by the subscriber line terminating on an access gateway, often called a Multi-Service Access Node (MSAN). An MSAN can function like a simple concentrator, switch or media gateway. All service functions are controlled by a telephony server that can be placed anywhere within the geographical boundaries of the network. The only requirement is that there must be physical and logical connectivity between server and gateway for signalling and data transport.
Below we have provided an example of the NGN strategy followed by BT in the UK.
4 Recent price trend analysis suggests that transmission prices may currently be levelling off; see section 2.2.3
and “Annualisation of capital costs”. 5 Note that termination equipment numbers (and costs) depend on the capacity of the link (more Mbit/s means
more optics and SDH multiplexing equipment). However, there are economies of scale. The cost is not strongly driven by distance, since optical technology means that systems are required only at the end points. Only if the link were very long would optical regenerator systems or optical amplifiers be required.

Competitive Carriers Coalition Comments on the ACCC Discussion paper – review of PIE II
MJA Comments on Discussion Paper FINAL PUBLIC2 / 6 July 2006
11
BOX 1: BT AND NGN
“Our 21CN [21st century network] programme will lead to the simplification of BT’s complex multiple networks, making it easier for us, and other operators who interconnect with BT’s network, to deliver compelling converged services.” The 21CN programme has three broad goals: - to enhance the service experience, flexibility and value we provide to all our customers; - to accelerate the delivery of innovative new products and services to market; and - to reduce costs radically. Technical trials began in the 2005 financial year. BT Wholesale chief executive Paul Reynolds said: "The 21CN programme will deliver our vision of a converged, multimedia world where our customers can access any communications service from any device, anywhere - and at broadband speed.” "21CN will drive a radical simplification of BT's operations including significantly lower costs and the capability to launch new services to market faster than we can today. It will empower all our customers, giving them control, choice and flexibility like never before." The major elements of BT Group's overall strategy including ICT, mobility, broadband, netcentricity and portfolio transformation are underpinned by the 21CN initiative. Over the next five years 21CN will transform BT's business and its cost base, removing duplication across the current multiple service specific networks and creating a single multi-service network.
Source: MJA analysis of selected excerpts from BT public statements in Annual reports and presentations
It is clear from the above that a transition to NGN is seen as a necessary step to reduce costs. BT expects that 50% of its customer base will be migrated to NGN by 2007.
Some may attempt to argue that implementation of NGN in cost models may still be too early and inappropriate.6 However, we note that the Danish regulator IT – og Telestyrelsen (ITST) recently published an update of its LRIC cost models. For the core network, the regulator has chosen to model the Ericsson Engine concept which may be regarded as an NGN concept (see section 2.2.4 for more detail). In this respect ITST follows earlier LRIC modeling (2003) by the Swedish regulator Post och Telestyrelsen (PTS) which also adopted the Engine concept in its modelling.
These developments clearly suggest that the core network in the PIE II model cannot, as a matter of principle, be regarded as reflective of efficient forward-looking costs. Hence the PIE II model fails the forward-looking “test” and should not be relied on to calculate costs of core related services, such as PSTN Originating and Terminating Access.
6 One potential problem is quality of service. Traditional circuit-switched voice networks have proved to be
highly reliable and have offered very good quality of service. The main advantage of packet-switched networks is that they are very efficient in transporting information and historically have had a disadvantage with real time services. However, technologies exist today that provide solutions in the respect. One of these is Multi Protocol Label Switching (MPLS). The use of MPLS allows dedicated paths to be created in an IP network. We note that IP/MPLS appears to play a crucial role in Telstra’s NGN upgrade as “a robust, scalable backbone for all services” (presentation by Greg Winn, Chief Operations Officer, slide 3, 16 November 2005)

Competitive Carriers Coalition Comments on the ACCC Discussion paper – review of PIE II
MJA Comments on Discussion Paper FINAL PUBLIC2 / 6 July 2006
12
In terms of the access network, we discuss this in more detail in the following sections. The appropriate benchmark by which to evaluate the access network design in the PIE II is whether it represents the network that would be rolled out today by an entrant who would roll-out an access network using a mix of technologies to meet forward-looking demand in different areas at lowest cost.
Compared with the core network, the access network has not undergone similar technological progress and we cannot conclude that the access network fails an initial test of being forward-looking. However, because the design of the core network should be changed there are likely to be knock-on implications for the access network.
For example, many operators are deploying small concentrator or multiplexing equipment, closer to the customer as the assumptions in the PIE II model illustrate. This enables higher speed broadband (shorter copper loops) and the same equipment may concentrate the voice traffic.7 Hence if access is demarcated by the normal termination point of the access lines, it could be argued that costs of the access would fall because the core network effectively is moving closer to the customer (conversely core network costs will rise).
2.2. Bridger Mitchell’s 2005 advice
In the following, we comment on sections 3 – 7 in the Bridger Mitchell report, focussing on issues that are relevant for the access network.
2.2.1. Efficient costs and pricing (s 3)
We are in broad agreement with the majority of Bridger Mitchell’s (BM) comments in his section 3.
2.2.2. Estimating efficient costs of UT services using a cost model (s 4)
In section 4, BM sets out the principles that apply when constructing a bottom-up model. In the following, we comment on the following areas:
Other regulatory proceedings;
Efficient production of services;
Best-in-use technology;
Forward-looking perspective;
Scorched node;
The modelled services; 7 Say using v5.2 or putting the traffic over IP and ATM.

Competitive Carriers Coalition Comments on the ACCC Discussion paper – review of PIE II
MJA Comments on Discussion Paper FINAL PUBLIC2 / 6 July 2006
13
Forecasts; and
Customer locations.
Other regulatory proceedings
BM mentions bottom-up models in the US, UK, Germany and New Zealand. In addition, he refers to the Adaptable Bottom-Up Model (ABUM) prepared for the European Commission and to Malaysia in subsequent sections. This is arguably a fairly narrow selection of countries. Numerous European countries have developed cost models to set the prices of ULLS and interconnections services, including Denmark, Sweden, The Netherlands and Italy among others. However, we agree that the approaches adopted in these jurisdictions have broadly followed the same methodological approach. Notably, it has been common to use both top-down and bottom-up models and to attempt to reconcile the two efforts.8 As a result, some jurisdictions make use of hybrid models that are structured as bottom-up models.
In very few jurisdictions are prices or costs set (or estimated) with reference the incumbent’s cost models as Telstra is suggesting by using PIE II.9 The obvious reason for this is that cost models must be subject to thorough industry scrutiny before any confidence can be had in the results. Due to the complexity and non-transparency in incumbent cost models, the regulator has therefore typically elected to produce their own models creating a common ground for evaluating costs. Although it may be common to use bottom-up models for the purpose of calculating costs, it is not normal practice to use a bottom-up model developed by the incumbent.
Efficient provision of services
We agree with BM that any network should be designed to serve forecast demand, the distribution of customers, quality of services standards etc. This is an important element of any bottom-up model, in particular because the starting point is not the incumbent’s network (as it would be in top-down approach), but only certain modelling constraints such as scorched node, technology etc.
8 The objective of reconciliation is not to replace the costs and quantities in a bottom-up model with those of
a top-down model. It is to seek to identify and explain the differences between the two approaches. Reconciliation should therefore reveal important information on the two approaches, for example, where the bottom-up model has neglected essential cost components and/or where an operator’s data reflects over-investment and inefficiencies.
On the basis of a reconciliation exercise, the regulator should be in a better position to make informed decisions about the design and input parameters of the model used (typically bottom-up model) in the final cost calculations.
9 When this is the case a top-down model methodology is typically used.

Competitive Carriers Coalition Comments on the ACCC Discussion paper – review of PIE II
MJA Comments on Discussion Paper FINAL PUBLIC2 / 6 July 2006
14
Best-in-use technology
TSLRIC is a forward-looking concept and TSLRIC (and TELRIC) models should include forward-looking technologies. For example, as noted above (section 2.1) newer packet switching technologies are likely to be more efficient than more conventional circuit switching.
BM notes that most models have yet to include explicitly a range of technology solutions. We see no problems in expanding the PIE II model with different technologies; indeed the PIE II can run different scenarios for the access part of the network, choosing between cable-based and radio-based access technologies.
Apart from being reflective of good modelling practice, the modelling of different costing scenarios also provides a number of important benefits. Examples of different scenarios are applicable in not just the access part of the network, but also the core network part which could include the Telstra network as it is today and a number of scenarios that reflect different technological solutions. The benefits of scenario analysis include:
it is easier to optimise once you have a thorough understanding of the costs of the existing network architecture;
it can provide confidence to the ACCC that the model is robust and reflective of efficient forward-looking costs within the constraints set out for the modelling work; and
it could be used as a cross-check that the optimal network is one that can evolve from the existing network.
Different scenarios could be made a standard part of a bottom-up model as a way of conducting sensitivity analysis. There may also be trade-offs between cost reduction and certain aspects of network performance. Building in the capacity to run alternative scenarios would also allow Telstra (and the ACCC) to estimate the trade-off between the different options.
While such scenario analysis requires additional resource requirements to implement, we do not believe they are onerous. This is because a large amount of information that will be required to run the different scenarios is already used in the existing model.10 In terms of the options available in PIE II, we refer to our discussion in section 4.
10 For example, data would have already been collected on: user demand; adjustments to estimate dimensioned
demand; replacement cost of equipment; estimates for indirect network costs and overheads; assumptions about annualisation, utilisation etc; and cost allocation rules.

Competitive Carriers Coalition Comments on the ACCC Discussion paper – review of PIE II
MJA Comments on Discussion Paper FINAL PUBLIC2 / 6 July 2006
15
Forward-looking perspective
We broadly agree with the comments provided by BM.
Scorched node design
BM notes that PIE II goes beyond a strict implementation of the scorched node assumption by optimising the number and type of switch required at each scorched node and thus achieving a more cost-efficient design than if current node functionality had been retained. We agree, but do not regard this as something exceptional, but more as common practice in cost modelling. It is true that the first European bottom-up cost model developed by Oftel in 1997 used the scorched node assumption and treated the number and location of BT’s switches as given.11
However, in many, if not all, of the costing exercises in Europe, a modified scorched node assumption has been used. As an example, in Sweden the bottom-up model should comply with the modified scorched node assumption where:12
…nodes are defined as exchanges (including concentrators), the existing number and locations of sites are fixed, no empty sites are allowed and it is possible to change the number and mix of exchanges.
Hence, the scorched node approach normally implies that an operator’s existing number and location of its nodes are taken as given. To ensure that an operator has incentives to migrate to a more efficient architecture, the scorched node assumption is modified to allow for certain optimisations, the most common being changes to the nodal hierarchy, for example replacing a local exchange with a remote concentrator.
The modelled services
In BM’s opinion, the services included in the increment should include the total volume of services that are close substitutes in demand or services that use the same network elements and thus have a similar cost structure. In terms of the core increment, he notes that it should include all of the PSTN, UT and ISDN services and also the traffic from other services that use the PSTN. For the access increment he specifies that it should include all services which use copper-based lines.
According to page 3 of the Description of the PIE II model the following copper based services are included:
[c-i-c];
11 Oftel seemed to allow for but ultimately did not optimise the mix of switches. 12 PTS Model Reference Paper Criterion BU I.

Competitive Carriers Coalition Comments on the ACCC Discussion paper – review of PIE II
MJA Comments on Discussion Paper FINAL PUBLIC2 / 6 July 2006
16
[c-i-c];
[c-i-c];
[c-i-c]13;
[c-i-c];
[c-i-c];
[c-i-c];
[c-i-c];
[c-i-c];
[c-i-c];
[c-i-c];
[c-i-c];
[c-i-c];
[c-i-c];
[c-i-c];
[c-i-c];
[c-i-c];
[c-i-c];
[c-i-c];
[c-i-c];
[c-i-c];
[c-i-c];
[c-i-c];
[c-i-c];
[c-i-c];
[c-i-c];
In our review of the PIE II model we have been unable to identify this level of detail in access services. We have consulted tables in the following databases:
ULLS Analysis;
Demand Scenario;
13 A leased line has one of two ends (typically two).

Competitive Carriers Coalition Comments on the ACCC Discussion paper – review of PIE II
MJA Comments on Discussion Paper FINAL PUBLIC2 / 6 July 2006
17
Demand Cube; and
SIO Demand.
In none of these have we been able to find a complete list of services equivalent to that above.
In the Demand Cube database there are a number of tables containing demand data. The table ‘Demand Type Code’ appears to be used to aggregate service demand that is input into the model, but only contains a subset of the services shown above. This table is replicated below.
TABLE 1: DEMAND TYPE CODE TABLE FROM THE DEMAND CUBE DATABASE
Source: Telstra PIE II model
The table above also contains a ‘Tie Lines’ product which does not appear to form part of the list in the model description.
In table ‘PTP’ in the Demand Cube database we find additional services such as Argent, Centel, Spectrum Access and HSDL link, but not what would appear to be a complete list. Although the services, we have not been able to identify, are unlikely to correspond to a large amount of demand it is important that the model include all demand as we discus below.
We broadly agree that copper-based services may be an appropriate starting point for modelling the access increment. However, to the extent Telstra utilises radio technologies or fibre to provide access services, these should also be included. Likewise for the core increment where Telstra provides leased lines, data services and other services, these should also be included in the core increment.
A TSLRIC model needs to account for all services related to a particular increment. To exclude some would result in an under-dimensioned network and increased costs for the
[
c-i-c
]

Competitive Carriers Coalition Comments on the ACCC Discussion paper – review of PIE II
MJA Comments on Discussion Paper FINAL PUBLIC2 / 6 July 2006
18
remaining services as costs would be allocated to fewer services. Therefore more services need to be modelled than the actual number of services that should be costed on the basis of TSLRIC.
For example in the core network, non-PSTN services typically account for a very large proportion of capacity in the transmission network.14 There may be a tendency for this percentage to increase due, for example, to the impact of broadband and the need for transmission capacity to transport this non-PSTN service across the transmission network.
A good and transparent example is the Danish Hybrid model. Here a range of different PSTN allocations are assumed depending on the type of transmission link under consideration. The calculated traffic intensity in busy hour for PSTN traffic defines the required number of Busy Hour Erlang for each site category. This is converted into Mbit/s. The required capacity for leased lines and other services is then added to the PSTN requirements, to give the total transmission capacity for each site link category. The capacity is corrected (uplifted) for logical path diversity.
Based on total required capacity for each major service type in the Danish Hybrid model we can calculate the PSTN share of total capacity, see table below.
TABLE 2: TOTAL REQUIRED CAPACITY (MBIT/S)
RCU-LE LE-LE LE-TE TE-TE PSTN 12,576 4,262 8,844 2,354 Leased Lines 7,212 14,146 12,837 2,114 Mobile 3,092 298 7,379 3,890 WIN - 64 12,778 22,363 Cable TV - 69,057 50,506 1,563 Interconnect 1,017 6,818 3,217 364 DXX/DKM 3,028 1,580 3,097 1,004 Data 27,024 20,600 25,057 18,172 Total 53,949 116,824 123,714 51,823 PSTN share of total 23% 4% 7% 5% PSTN share of total excl. cable TV. 23% 9% 12% 5%
RCU = Remote Concentrator Unit, LE = Local Exchange, TE = Tandem Exchange Source: MJA analysis of Danish Hybrid Model public version 1.3 (2005).
14 A telecommunications operator typically provides a mix of high capacity and lower capacity non-PSTN
links. These may use the network in somewhat different ways, for example high capacity transport may not necessitate the use of cross-connects (or certain types of cross-connects) which are needed by low capacity transport. The model needs to correctly determine and dimension PSTN and non-PSTN capacity for each logical transmission link within the network and take account of possible ‘bunching’ of non-PSTN services on certain key routes.

Competitive Carriers Coalition Comments on the ACCC Discussion paper – review of PIE II
MJA Comments on Discussion Paper FINAL PUBLIC2 / 6 July 2006
19
We also note that even though dimensioning of the core network may not have direct influence on the cost of services in the access increment, there may be knock-on implications depending on how sharing is treated between the two networks (increments).
We note that the PIE II model uses the conventional approach to set the boundary between access and core, i.e. at the line card. However, the “line card” distinction breaks down for leased lines services, which are generally dedicated capacity right the way through the network. Similar considerations may also apply to other “advanced” services, particularly in the data / broadband and IP areas. Such services use elements of the access network that are shared with other (access) services, elements of the core network that are shared with other services, as well as costs and assets that may be more specific to leased lines. The question is therefore, how are these services included in the access and core network increments?
For services which use the copper access network, this may not be difficult since it would be relatively easy to say that all leased lines and other services that are offered over copper access loops should be included in the access network. However, where such services are offered over fibre, the access / network boundary may be less clear. This is because it is possible that SDH rings may have been deployed serving a number of customers, hence an individual fibre could theoretically be shared among a number of users (rather than being dedicated to one user). We have been unable (within the timeframe) to understand how these issues might have been dealt within the PIE II model.
Forecasts
We agree that a forward-looking model needs to take account of forecasts in demand.
Customer locations
We agree that customer location data are relevant for dimensioning of the Customer Access Network (CAN).
2.2.3. Provisioning of the PSTN (s 5)
In this section, BM sets out the principles that apply to network provisioning. In the following, we comment on the following areas:
the need for spare capacity;
provisioning of spare capacity and recovery of costs; and
annualisation of capital costs.

Competitive Carriers Coalition Comments on the ACCC Discussion paper – review of PIE II
MJA Comments on Discussion Paper FINAL PUBLIC2 / 6 July 2006
20
The need for spare capacity
BM spends considerable time on the investment in spare capacity to provision for future demand. While we agree that modelling of spare capacity is common practice in cost models, its cost implications seem to be exaggerated.
It is important that a model consider all the issues related to spare capacity carefully. For example, as BM notes equipment items come in standard sizes. In some cases the modularity of certain elements may be sufficient to cope with future demand. This could be both more advanced electronics and simply cable sizes.
In particular, we note that PIE II uses a 900 pair pillar. However, a maximum of 300 main cable pairs can run from the pillar to the Remote Access Unit (RAU) and a maximum of 500 distribution pairs run from the pillar into the Distribution Area (DA). That leaves 100 pairs spare. Further, an urban DA contains between 65 and 250 SIOs. This seems to imply that every SIO, as a minimum, will be allocated (dimensioned with) 2 pairs (assuming no allowance for growth). In our view, investment in 2 pair copper on average for each network termination point is the absolute maximum that could be expected for each residential SIO. Indeed, we suggest that it should be less. However, if it was sensible, then it seems reasonable to allocate some of these provision costs to the moves, changes, and future demand growth that the additional wires are installed to serve (i.e. not allocated between existing customers).
Our investigation of the model, however, has not been conclusive in this area. The PIE II dimensioning in this part of the model is highly non-transparent. However, it would appear to dimension each geographic/demographic part of the model in a different way.
The PIE II model uses information on the average number of SIOs per lead-in for different areas as indicated in the table below:
TABLE 3: EXTRACT FROM CANRUN DATABASE, ‘VARIABLE – CAN’ TABLE15 Description Desc Notes Value SIOs per Lead-In - CBD ESAs Pairs_Per_Address_CBD The numbers of SIOs that each
Lead-In serves in CBD ESAs
SIOs per Lead-In - Metro ESAs Pairs_Per_Address_Metro The numbers of SIOs that each Lead-In serves in Metro ESAs
SIOs per Lead-In - Prov ESAs Pairs_Per_Address_Prov The numbers of SIOs that each Lead-In serves in Provincial ESAs
SIOs per Lead-In - Rural ESAs Pairs_Per_Address_Rural The numbers of SIOs that each Lead-In serves in Rural ESAs
15 Note that this table suggests that if the number of lead-in is equal to the number of addresses, then the value
indicated to the right (in the table) is the number of pairs (or SIOs) catered for in each area. In other words in the CBD, the model assumes 2 pairs for each lead-in and less in all other areas.
[
c-i-c
]

Competitive Carriers Coalition Comments on the ACCC Discussion paper – review of PIE II
MJA Comments on Discussion Paper FINAL PUBLIC2 / 6 July 2006
21
This information is used to derive different element volumes for lead-ins when dimensioning the network – an extract of which is shown below.
FIGURE 1: EXTRACT OF SOURCE CODE IN PROVISIONDAS, CAN-AF
In addition, information from Fixed Information Cube database is used and combined to produce element volumes in each DA or ESA depending on the particular geographical or demographical categorisation. The immediate output of these calculation would not appear to result in inefficient over-provisioning, but coupled with modularity the fill factors used in the PIE II model would appear to be too low. Fill factors are defined as the number of active, i.e. in-demand, copper pairs divided by the total number of installed copper pairs (by definition fill factors are between zero and one).
Fill factors tend to increase as you move from the customer site to the exchange. Fill factors for in-line (drop cable) are typically smaller than the fill factors for distribution cable (cables running from the pillar to the SIO) and main or feeder cable (cables running from the pillar to the RAU) and the fill factor for distribution cable is usually smaller than the fill factor for main or feeder cable. The logic behind this is that the higher the level of the network, the easier to accommodate additional requirements of copper pairs over different routes. Fill factors are also likely to increase with line density. The higher the line density, the less uncertain and heterogeneous is usually demand.16
16 While issues related to heterogeneous demand are important they may be dealt with by modelling certain
elements in the network in more detail. In particular, BM makes the important point that demand for some services (in particular more traditional PSTN) may be declining, but increasing for other services resulting in little change in overall growth.
[
c-i-c
]

Competitive Carriers Coalition Comments on the ACCC Discussion paper – review of PIE II
MJA Comments on Discussion Paper FINAL PUBLIC2 / 6 July 2006
22
Below we have summarised fill factors implied in other bottom-up models.
TABLE 4: FILL FACTORS USED IN OTHER BOTTOM-UP MODELS
Fill factors (%) Danish hybrid model Swedish hybrid model Bottom-up model for European regulator
(confidential) Drop cable 50 50 60 Distribution side cable 75 60 65 Feeder side cable 75 80 75 Source: MJA and EE
As stated above it is unclear to us if the average fill factors which would be result of the PIE II methodology are appropriate. We suggest Telstra provide a detailed step-by-step explanation of the methodology and provide a table with averages in different parts of the access network. Such information may also be used as a sense check of some of the outputs – checks which, currently, cannot not be made.
In terms of the resource requirements in the access network, we believe it is useful to distinguish between demand, required capacity, installed capacity and consumed resources.
Demand - resources required to meet the demand for lines. This would include a list of services that form the increment in question, that are clearly defined along with their corresponding means of transport, be this copper or fibre cable, and, in the case of copper, the average number of copper pairs each service would require (technical feature of each service).
Required Capacity - what we would ask a contractor/vendor to install. As for Demand, plus additions for covering future growth in demand and provision for resilience, for example to avoid re-laying a whole cable or trench if one circuit is faulty.
Installed Capacity - Required Capacity, uplifted for
o modularity – e.g. if required capacity is 90 circuits, it is likely that 2x50 pair cables would be installed; and
o any other installation above required capacity.
Consumed Resources - installed capacity plus wastage consumed in the installation process, e.g. through trimming, cable roll ends, damage during installation, or any defective components not used.
Provisioning of spare capacity and recovery of costs
BM states (paragraph 94 – 96):
The preceding discussion establishes that an efficient network operator will incur costs of provisioning spare capacity in order to account for both supply

Competitive Carriers Coalition Comments on the ACCC Discussion paper – review of PIE II
MJA Comments on Discussion Paper FINAL PUBLIC2 / 6 July 2006
23
factors (modular component sizes and economies of scale) and demand factors (maintenance and repair, growth, uncertainty, and heterogeneity). How, then, should the costs of efficient provisioning of spare capacity be recovered in prices?
First, should some of the costs of spare capacity – those incurred this year to provide for future or uncertain demand – be recovered in the prices of services sold this year, or should those costs be recovered at a later time when the capacity is fully used?
Costs of spare capacity installed now but provisioned to serve future needs can be recovered in current period charges as well as future period charges. This forward looking approach is employed in the PIE II model: the investment in spare capacity is recovered over the expected life of the asset, starting from the date of installation.
All the considerations above are, in our opinion, relevant and important especially in the context of a fast-moving environment like telecommunications. We agree that current prices should recover a proportion of the cost required to cater for future demand. In other words the network in the cost model should be costed using dimensioned demand and unit costs should be calculated as the (annual) capital costs required to meet future demand divided by existing demand.
However, it is unclear how a Year 1 rolling forward approach, as the one adopted in the PIE II model (see section 6), would cater for a correct (i.e. operated according to the principles of economic depreciation) recovery of the investment costs. A rolling forward approach would not explicitly take into account the evolution of traffic volumes over the years, especially if the annualisation formula used includes a “tilt” that takes into account only equipment price changes (and not evolution of traffic).
Annualisation of capital costs
The PIE II model basically uses tilted annuities to annualise costs.17 We agree that this is a reasonable approach for a bottom-up fixed network model. However, one consequence of this approach is that it relies critically on the appropriate specification of asset lives and price trends.
17 A standard annuity calculates the charge that, after discounting, recovers the asset’s purchase price and
financing costs in equal annual sums. In the beginning of an asset’s lifetime the annualisation charge will consist more of capital charges and less of depreciation charges; this reverses over time resulting in an upward sloping depreciation schedule. The increase in the depreciation charge over time exactly counterbalances the decrease in the capital charge with the result that the annualisation charge is constant over time.
A tilted annuity takes account of price changes. This results in front-loading if prices are expected to fall and back-loading if they are expected to increase.

Competitive Carriers Coalition Comments on the ACCC Discussion paper – review of PIE II
MJA Comments on Discussion Paper FINAL PUBLIC2 / 6 July 2006
24
BM provides no comment on the reasonableness of these parameters.
In their main submission, Telstra provides commentary on the derivation of these price trends. Generally, we find the information sources used and methodology followed are a good starting point. In particular, we acknowledge the importance of separating out price changes that reflect changes to equipment prices and those that reflect installation and labour. While prices for equipment are generally falling, this is not true of labour costs. To improve transparency we recommend that equipment installation costs be showed separately from those of equipment costs and separate price trends be used for each category.
Nevertheless, we still have a number of concerns with the values used in the PIE II model. In our view:
the price trends used are at too aggregate a level, i.e. they are applied to cost categories that are too broad; and
a number of the price trends seem to be too negative (or are not positive enough).
In order to cross-check the price trends used in the model, we have reviewed recent publicly available information (no more than six years old) on the magnitude of price trends primarily used in regulatory proceedings.
We have summarised our findings overleaf (price trends from the PIE II model have been added to facilitate a comparison). Note that due to the different categorisation of cost elements, comparison are difficult and in some cases required judgement. The most important cost categories have been included.

Competitive Carriers Coalition Comments on the ACCC Discussion paper – review of PIE II
MJA Comments on Discussion Paper FINAL PUBLIC2 / 6 July 2006
25
TABLE 5: NOMINAL PRICE TRENDS (ANNUALPERCENTAGE CHANGE IN COSTS)
Source: IRG
Europe Economics
ABUM Hybrid model
Analysys Municipal Duct
model v1 Hybrid model
PIE II model
Country / Region:
Year: France 2001
Europe 2000
Denmark 2005
Na 2002
Sweden 2004
Australia 2005
Major grouping Cost category Trench Trench in the access network 0% 3% 2% 2% [c-i-c]% Trench Trench in the core network 0% 1% 3% 2% 2% [c-i-c]% Duct Duct in access network 0% 3% 2% 2% [c-i-c]% Duct Duct in the core network 0% 1% 3% 2% 2% [c-i-c]% Copper cable Copper 0% 6% 1% [c-i-c]% Tie cable Tie cables 0% -2% Fibre cable Fibre cable (in the access network) -5% 1% [c-i-c]% Fibre cable Fibre cable (in the core network) -5% -5% -5% 0% [c-i-c]% Cabinet/DP Cabinets (including cabinet equipment) 0% 1% 2% MDF MDF 0% -2% 0% NTP NTP 0% 1% [c-i-c]% Switching Remote/local Switchblock unit -5% -8% -6% -4% [c-i-c]% Switching Remote/local Processor unit -8% -6% -5% [c-i-c]% Switching Remote/local Software (unit) -8% -6% -4% [c-i-c]% Switching Remote/local Port unit -8% -6% -3% [c-i-c]% Switching Tandem Switch Switchblock unit -5% -6% -6% -4% [c-i-c]% Switching Tandem Switch Processor unit -6% -6% -5% [c-i-c]% Switching Tandem Switch Software (unit) -6% -6% -4% [c-i-c]% Switching Tandem Switch Port unit -6% -6% -3% [c-i-c]% Transmission STM Multiplexers -5% -10% 0% -5% [c-i-c]% Transmission STM Cards -10% 0% -5% [c-i-c]% Transmission Cross-connects -5% -10% 0% -4% [c-i-c]% Transmission Signalling points -5% -6% -4% [c-i-c]% Buildings Buildings -1% 2% 1% [c-i-c]%

Competitive Carriers Coalition Comments on the ACCC Discussion paper – review of PIE II
MJA Comments on Discussion Paper FINAL PUBLIC2 / 6 July 2006
26
Sources are MJA analysis of:
IRG – France – information received by ITST from the French regulator ART in the relation to data request sent out to members of the Independent Regulators Group (IRG) in connection with the Danish LRAIC process.
Europe Economics ABUM – Adaptable Bottom-Up Model, Europe Economics, available at the EU website.
The Danish Hybrid model – version 2.1 of the LRAIC model used by the ITST to set the prices of access services, switched interconnection services and co-location services.
Analysys Municipal Duct model – Available at the Analysys website.
The Swedish Hybrid model – LRIC model used by the Swedish Regulator PTS to set the prices of access services, interconnection and co-location services.
While the table indicates that there is some dispute on the price trend for fibre cable there is general agreement on a positive price trend in the benchmarked data for duct (conduit) and trench and negative price trends for transmission and switching equipment.
Another observation from the table above is that asset categories that should be expected to contain a large labour component tend to have a more positive price trend. For example, trench and duct categories would be expected to have a large labour component.
In a comparison of the price trends in the PIE II model with the international data we suggest most weight be placed on the more recent data, i.e. Denmark and Sweden. For trenching the price trends are reasonably well aligned, [c-i-c x x x x x x x x x x x x x x x x x x x x x xx x x x x x x x x x x x x x x x x x x x x x x x xx x x x x x x x x x x x x x x x x x x x x x x x x x x x x x x x x x x x x xx x x x ]
For copper cable, PIE II assumes [c-i-c x xx x x x x x x x x x x x x x x x x x x x xx x x x x x x x x x x xxxxx x x] There is a large discrepancy between the Danish and Swedish models. This may be explained by substantial increases in copper prices since the Swedish model was originally published (and failure to update the parameter accordingly).
Copper prices have generally increased in recent years as indicated in the figure below.

Competitive Carriers Coalition Comments on the ACCC Discussion paper – review of PIE II
MJA Comments on Discussion Paper FINAL PUBLIC2 / 6 July 2006
27
FIGURE 2: THE DEVELOPMENT IN COPPER PRICES
Source: London Metal Exchange (http://www.lme.co.uk/copper_graphs.asp)
More recently copper prices have spiked at record levels.18 If we disregard this recent development, the price of copper has increased on average by more than 20% annually over the five year period and much more in recent years. Hence a price trend of 6% may be regarded as a conservative assumption [c-i-c x x x x x x x x x x x x x x x x x x x x x x x x x x xx x x x xx x ]
The price trend for fibre is [c-i-c x x x x x x x x x x x x x x x x x x x x x x x x x x xx x x x xx x x x x x x x x x x x x x x x x x x x x x x x x x x x xx x x x xx x x x x x x x x x x x x x x x x x x x x x x x x x x x xx x x x xx x ]
[c-i-c x x x x x x x x x x x x x x x x x x x x x x x x x x xx x x x xx xx x x x x x x x x x x x x xx x x x x x x x xx .] However, the most recent price trends in the data (the Danish Hybrid model) for transmission are zero. This could suggest that prices for transmission equipment are no longer falling.
All in all, a comparison with the international benchmarks suggests that trends in the PIE II model are [c-i-c x x x x x x x x x x x x x x x x x x x x x x x x x x xx x x x xx x x x x x x x x x x x x x x x x x x x x x x x x x x x x xx x x] 19
With regard to the asset lives, we note that these should correspond to the economic lifetime of the assets. Book asset lives are likely to be shorter than economic asset lives, due to
18 For recent commentary on this development, see http://theaustralian.news.com.au/story/0,20867,18774314-
36375,00.html 19 Where the value of equipment rises (falls), the provider incurs a holding gain (loss) from holding the asset.
By applying a tilt to the annualisation formula this holding gain (loss) is taken into account as a decreased (increased) depreciation charge.

Competitive Carriers Coalition Comments on the ACCC Discussion paper – review of PIE II
MJA Comments on Discussion Paper FINAL PUBLIC2 / 6 July 2006
28
conservative accounting practices. We have reviewed the values used and have number of concerns with the figures adopted:
[c-i-c
Xxxx x x x x x x x x x x x x x x x x x x x x x x x x x x x x xx x x x x x ]
asset lives are used at too aggregate a level.
With regard to the last comment, it is similar to that observed for price trends. While the issue is less pronounced for asset lives, it is nevertheless of concern. A TSLRIC model may be very accurate at estimating equipment numbers and hence gross replacement costs. However, this is only one step in the modelling process. These costs have to be converted into annual costs. If the model makes no attempt to accurately model the economic characterises of the specific assets by applying economic asset lives and price trends at a sufficiently detailed level, the original detailed modelling of the underlying equipment numbers is discounted. The same argument applies to the operating cost mark-up approach currently in the PIE II model which also in our opinion is too aggregate (for more on O&M see commentary in section 2.2.4).
Regarding the apparent differences between the conduit and cable categories, it is unclear to us why these large differences should arise.
In the following, we present publicly available information on the magnitude of economic asset lives used in regulatory proceedings. The asset lives are compared with those used in PIE II. We have summarised our findings overleaf:

Competitive Carriers Coalition Comments on the ACCC Discussion paper – review of PIE II
MJA Comments on Discussion Paper FINAL PUBLIC2 / 6 July 2006
29
TABLE 6: ASSET LIVES – PART I
Source IRG IRG IRG IRG IRG IRG
Europe Economics
ABUM
Country / Region
Year France 2001
Switzerland 2001
Spain 2001
Austria 2001
UK 2001
Germany 2001
Europe 1999
Major grouping Cost category Trench Access Trench 20.0 30.0 30.0 30.0 35.0 Duct Access Duct 30.0 30.0 30.0 35.0 Trench Core trench 30.0 27.0 30.0 30.0 35.0 38.0 Duct Core duct 30.0 27.0 30.0 30.0 42.0 35.0 38.0 Poles Poles Copper cable Copper cable 20.0 20.0 9.6 20.0 20.0 Line card Line cards 11.5 Tie cable Tie cables Fibre cable Fibre cable (in the access network) 20.0 Fibre cable Fibre cable (in the core network) 20.0 16.0 20.0 24.0 20.0 23.0 Cabinet/DP Cabinets/distribution points 20.0 7.0 8.0 MDF MDF 20.0 NTP NTPs Switching Switchblock unit 12.0 14.0 5.7 10.0 14.0 10.0 13.0 Switching Processor unit 12.0 11.5 5.7 10.0 14.0 10.0 11.0 Switching Software 5.0 10.0 4.0 12.0 Switching Port unit 12.0 11.5 5.7 10.0 14.0 10.0 11,5 Transmission STM Multiplexers 10.0 9.4 8.0 13.0 10.0 10.0 Transmission STM Cards 10.0 13.0 10.0 10.0 Transmission Synchronization 10.0 8.0 13.0 10.0 16.0 Transmission Cross-connects 10.0 9.5 8.0 13.0 10.0 10.0 Transmission Signalling points 10.0 13.0 10.0 16.0 Switching other Power supply unit 10.0 15.0 5.0 Switching other Air conditioning unit 10.0 15.0 5.0 Buildings Buildings 30.0 30.0 24.2 40.0 42.0 35.0 37.0

Competitive Carriers Coalition Comments on the ACCC Discussion paper – review of PIE II
MJA Comments on Discussion Paper FINAL PUBLIC2 / 6 July 2006
30
TABLE 7: ASSET LIVES – PART II
Source HAI Model NERA NTT TD model
LRIC Study Group Model
Hybrid model
Hybrid model PIE II
Country / Region Year
USA 1998
Australia 1999
Japan 1998
Japan 1998
Denmark 2005
Sweden 2005 2005
Major grouping Cost category Trench Access Trench 51.1 29.0 27.0 27.0 40.0 40.0 [c-i-c] Duct Access Duct 51.1 29.0 27.0 27.0 40.0 40.0 [c-i-c] Trench Core trench 51.1 34.0 27.0 27.0 40.0 40.0 [c-i-c] Duct Core duct 51.1 34.0 27.0 27.0 40.0 40.0 [c-i-c] Poles Poles 30.3 20.0 Copper cable Copper cable 20.5 22.0 13.0 13.0 20.0 25.0 [c-i-c] Line card Line cards 10.0 10.0 10.0 Tie cable Tie cables 15.7 15.0 15.0 Fibre cable Fibre cable (in the access network) 23.7 10.0 11.2 20.0 20.0 [c-i-c] Fibre cable Fibre cable (in the core network) 23.7 24.0 10.0 11.2 20.0 20.0 [c-i-c] Cabinet/DP Cabinets/distribution points 19.0 17.0 15.0 15.0 MDF MDF 12.0 15.0 15.0 NTP NTPs 19.0 17.0 20.0 [c-i-c] Switching Switchblock unit 16.4 10.0 6.0 11.9 10.0 10.0 [c-i-c] Switching Processor unit 16.4 10.0 6.0 11.9 10.0 10.0 [c-i-c] Switching Software 6.3 10.0 6.0 11.9 10.0 10.0 [c-i-c] Switching Port unit 16.4 10.0 6.0 11.9 10.0 10.0 [c-i-c] Transmission STM Multiplexers 10.2 10.0 10.0 10.0 [c-i-c] Transmission STM Cards 10.2 9.0 10.0 10.0 [c-i-c] Transmission Synchronization 10.2 9.0 15.0 10.0 [c-i-c] Transmission Cross-connects 10.2 10.0 10.0 10.0 Transmission Signalling points 10.2 9.0 10.0 10.0 [c-i-c] Switching other Power supply unit 15.0 10.0 [c-i-c] Switching other Air conditioning unit 15.0 10.0 Buildings Buildings 47.7 20.0 22.1 33.0 30.0 30.0 [c-i-c]

Competitive Carriers Coalition Comments on the ACCC Discussion paper – review of PIE II
MJA Comments on Discussion Paper FINAL PUBLIC2 / 6 July 2006
31
Sources are MJA analysis of:
IRG – different European countries– information received by ITST from a number of European regulators in the relation to data request sent out to members of the IRG in connection with the Danish LRAIC process.
Europe Economics ABUM – Adaptable Bottom-Up Model, Europe
HAI model - Appendix B – HAI Model Release 5.0a Inputs, Assumptions and Default Values, February 16, 1998
ACCC / NERA - Estimating LRIC of PSTN Access, Final Report for ACCC, NERA, January 1999, table B1 and B2
NTT TD model - Summary of Final Report of LRIC Study Group, 1998
LRIC Study group model - Summary of Final Report of LRIC Study Group, 1998
The Danish Hybrid model – version 2.1 of LRAIC model used by the ITST to set the prices of raw copper, switched interconnection services and co-location services.
The Swedish Hybrid model – LRIC model used by the Swedish Regulator PTS to set the prices of access, interconnection and co-location services.
The table indicates that the asset life for trench (and duct) generally is regarded as the same in different parts of the network. [c-i-c x x x x x x x x x x x x x x x x x x x x x x x x x x xx x x x xx x x x x x x x x x x x x x x x x x xx .] An appropriate estimate would be 40 years. This is also in line with recent developments in the UK, where the asset life for trench is 40 years.20 Likewise, the asset life for main cable in the PIE II model [c-i-c x x x x x x x x x x x .] We would recommend an increase to at least 20 years. These changes will result in a reduction in the cost of ULLS.
On the other hand, the asset lives for certain transmission equipment, and to a lesser degree fibre cable, are slightly long compared with international data. Downward adjustments in these categories will result in a slight increase in core services costs.
2.2.4. The PIE II model satisfies the requirements for TELRIC models (s 6)
Initially in this section, BM to a large extent repeats commentary in earlier sections and goes on to comment on the requirements for TELRIC models. In the following, we comment on the following areas:
20 See Valuing copper access - Final statement, Ofcom 19 August 2005:
http://www.ofcom.org.uk/consult/condocs/copper/value2/statement/statement.pdf

Competitive Carriers Coalition Comments on the ACCC Discussion paper – review of PIE II
MJA Comments on Discussion Paper FINAL PUBLIC2 / 6 July 2006
32
Overall methodology;
Network planning;
Subscriber locations;
Dimensioning major network elements;
Estimating trench length;
Trench sharing and new estates;
Price trends;
Operating and maintenance expenses and common support expenses; and
Indirect capital costs and indirect O&M costs.
Overall methodology
We refer to commentary in section 2.1.
Network planning
We agree with BM that network planning costs are a legitimate cost item on an ongoing basis. We refer to the section “Operating and maintenance expenses and common support expenses” below for additional comments on this issue.
Subscriber locations
In principle, we agree that use of existing address information is appropriate when dimensioning and costing assets in the access increment. However, we have some concerns over the way this information is used in the PIE II model. We return to these issues below.
Dimensioning major network elements
In terms of distribution cable, the PIE II model partitions each ESA (in urban areas) into Distributions Areas (DA). According to BM, a pillar is located near the centre of the DA and served by a 100-pair distribution cable. In our view, it is unclear that such a placement strategy is optimal. More generally, if the pillar is placed close to customers, then total cable-km is minimised. Alternatively, if the pillar is placed close to the access switch then the total pair-km is minimised. In practice, a strategy between these two options is probably optimal.
Figure 1 shows the two different alternatives.
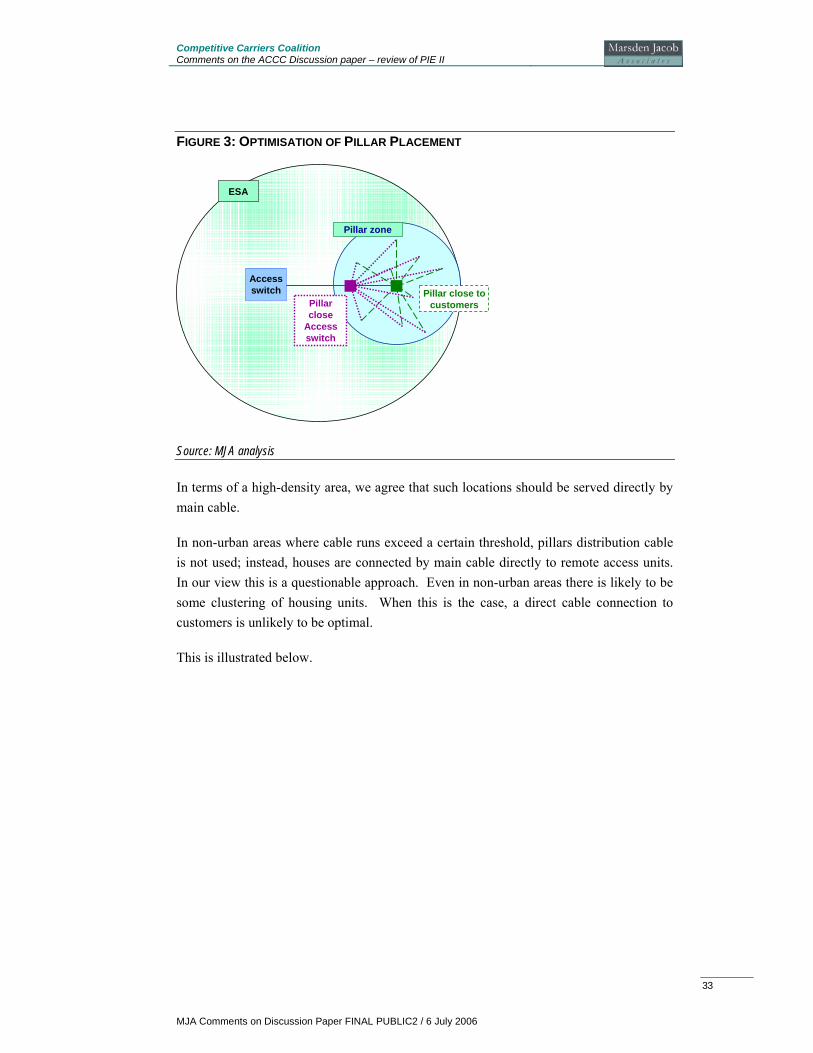
Competitive Carriers Coalition Comments on the ACCC Discussion paper – review of PIE II
MJA Comments on Discussion Paper FINAL PUBLIC2 / 6 July 2006
33
FIGURE 3: OPTIMISATION OF PILLAR PLACEMENT
Pillar zone
ESA
Access switch Pillar close to
customersPillar close
Access switch
Source: MJA analysis
In terms of a high-density area, we agree that such locations should be served directly by main cable.
In non-urban areas where cable runs exceed a certain threshold, pillars distribution cable is not used; instead, houses are connected by main cable directly to remote access units. In our view this is a questionable approach. Even in non-urban areas there is likely to be some clustering of housing units. When this is the case, a direct cable connection to customers is unlikely to be optimal.
This is illustrated below.

Competitive Carriers Coalition Comments on the ACCC Discussion paper – review of PIE II
MJA Comments on Discussion Paper FINAL PUBLIC2 / 6 July 2006
34
FIGURE 4: CLUSTERING
ESA
No clustering
Remote unit
ESA
Remote unit
Clustering
Source: MJA analysis
While pillar catchment areas in urban areas are likely to be reasonably square because of a fairly dense network of streets, there will be much larger variability in rural areas. Here it may be fairly linear (1-6 street village), lumpy (several small settlements) and/or rounder (larger village). It is therefore important that the PIE II model consider additional options. More generally, the gains in network design efficiency through optimisation are greater for low-density areas and clusters than in densely populated areas. In essence, optimisation will result in fewer changes in network design for densely populated areas or clusters.
The PIE II model has adopted a CMUX (Customer Mux) as the best-in-use technology. We agree that CMUX equipment is likely to be an efficient solution to adopt in some areas. CMUXes are (typically) linked back to the exchange via fibre optics and hence mark the termination point for the copper line running from the customer’s network termination point (NTP).21 A CMUX needs to have its own battery back-up for providing service in the event of a power failure.
The use of CMUX with active electronics is a natural migration path for Telstra to take. However, it is unclear to us whether the dimensioning rules of the CAN in the PIE II model reflect a more progressed or optimal solution compared with the current Telstra access network. For example, CMUXes may in some instances be deployed instead of pillars. The advantages of such a deployment strategy would be:
21 We understand a CMUX as a unit that multiplexes signals – it does not have call-switching capabilities
(as in the exchange). The CMUX digitises the signal and multiplexes it to the exchange, where the signal may be extracted (‘demuxed’).

Competitive Carriers Coalition Comments on the ACCC Discussion paper – review of PIE II
MJA Comments on Discussion Paper FINAL PUBLIC2 / 6 July 2006
35
shorter copper loop distances allow operators to offer higher speed DSL services;
cost savings from servicing one fibre cable than a bundle of copper cables; and
it may increase the number of users that can be reached by DSL services (by reducing the distance to the DSLAM).22
However, the deployment of an ‘active’ component also requires power and more maintenance. This is likely to make large-scale replacement of smaller distribution points with active cabinets, uneconomical. In particular, the provision of power to these remote points may be difficult.
Although a review of the dimensioning of the core network is outside the scope of this report, we note the design used in PIE II cannot be regarded as best-in-use technology, with the use of conventional circuit switching. The Local Access Switches (LAS) and Signal Transfer Points (STP) use the Ericsson AXE solution. To our knowledge, Ericsson no longer provides the AXE solution. Today Ericsson offers their Engine Integral Network (EIN) concept.
EIN can be regarded as a conservative starting point compared with building an NGN. It is a flexible system designed to give operators a natural migration path from the traditional telephone technology to today’s multi-service networks and a full IP based network in the future. This flexibility would appear to be the reason that the Swedish incumbent TeliaSonera uses EIN as the basis for its network. The EIN system has also been implemented in the Danish and Swedish regulatory cost models of the core network.
An EIN consists of three main components:
Telephony Server (TeS);
Multi-Service Access Node (MSAN)23; and
Engine Access Ramp (EAR).
The TeS controls the media gateway (MGW) applications in the MSAN. In other words the TeS deals with calls processing and controls the switching resources that are implemented in the MGW. The call processing technology in the TeS is based on an AXE-platform.
Connections between MGWs can either be standard SDH or ATM. In practice, the choice of transmission equipment is likely to be driven by previous investment decisions.
22 Digital Subscriber Line Access Multiplexer (DSLAM) - A platform for DSL modems that provides
high-speed transmission and optional voice service simultaneously over copper pair wiring. 23 MSANs cost considerably less than either local or tandem exchanges.
Competitive Carriers Coalition Comments on the ACCC Discussion paper – review of PIE II
MJA Comments on Discussion Paper FINAL PUBLIC2 / 6 July 2006
36
An EAR may be regarded as the replacement for a Remote Switching System (RSS). An EAR is connected to a MGW either over a standard 2 Mbit/s interface or over STM-1 via add-drop multiplexing.
Estimating trench length
To estimate trench lengths, two issues need consideration:
The length measure used to connect nodes in the network; and
The algorithm used to connect the nodes.
BM discusses Cartesian (direct) distance and rectilinear distance. The two-dimensional Cartesian distance (or Radial distance) is often, in cost modelling, called the crow flight or dog walk distance and is by definition the shortest possible distance between two points.24 The rectilinear distance (or Manhattan distance) between two points is measured along axes at right angles.25
The PIE II model uses a rectilinear distance with no correction factor. When the geographical characterisation of an area resembles a grid-like structure, we agree that a rectilinear distance with no corrections is appropriate. However, when this is not the case the accuracy of unadjusted rectilinear distance is clearly reduced. Hence, we would expect the accuracy of the unadjusted rectilinear distance to decline the further one moves towards rural areas, where a grid-shaped layout is less common. We agree with BM when he states that the rectilinear measure could be improved by conducting studies of representative areas and developing correction factors for these areas and suggest that Telstra conduct such analysis for some of the less dense ESAs. We would expect the correction factor to result in shorter distances (on average) in less dense areas and hence to result in a decrease in overall trench length in the network.
We do not find it appropriate to use a Cartesian measure within any part of the network unless in extreme circumstances. Such a measure would need to be adjusted upwards to reflect intervening obstacles and consider rights of way and accessibility.
BM compares the trench distances in the PIE II model with actual road distances. While we acknowledge that road distances and trench distances are correlated, such comparison should be viewed with care. Although the network of trench and duct will generally follow the road network, trenches and ducts may generally be classified as follows:
those requiring two access network trenches (one each side, usually in densely populated areas);
24 In a plane with p1 at (x1, y1) and p2 at (x2, y2), it is √((x1 - x2)² + (y1 - y2)²). 25 In a plane with p1 at (x1, y1) and p2 at (x2, y2), it is |x1 - x2| + |y1 - y2|.

Competitive Carriers Coalition Comments on the ACCC Discussion paper – review of PIE II
MJA Comments on Discussion Paper FINAL PUBLIC2 / 6 July 2006
37
those requiring one trench; and
those not requiring any trench (edges of catchment areas, boundaries between adjacent tree and branch structures).
Therefore it is not clear that road distances are a good proxy for the overall length of minimum cost trench as asserted by BM.
BOX 2: ESTIMATING TRENCH KM FROM ROAD KM
In the Danish Hybrid model the network of trench and duct is assumed to follow the road network. The trench mix is input separately for sixteen categories of road, which are defined according to the number of addresses there are on each side of the road, per kilometre of road distance, as follows: A: 40+ sites on one side of the road, per km (typical figure: 75 sites per km / average of 13m per site) B: 10 to 40 sites on one side of the road, per km C: 0.1 to 10 sites on one side of the road, per km D: 0 sites on one side of the road. Combining the classifications for the two sides of the road segment enables it to be placed in one of the sixteen categories, labelled "AA" to "DD". In practice six of these categories are mirror images of each other e.g. AC = CA, so there are in effect only ten such categories. IT- og Telestyrelsen (ITST) then uses factors to convert road lengths to trench and duct lengths through an analysis of TDC “INCA” maps. Through these maps, ITST looked at the amount of trench in place in TDC’s network for a sample of roads that would try to mirror the different road classes previously identified (i.e. AA, AB etc). In many cases, the actual network was used to set the conversion factor. However, in some areas — particularly those where there were very few sites — an adjustment was made to reduce the amount of trench in the network where trench was considered to be excessive for the area served. See table below. Conversion factors used in original bu model and hybrid model
Forum (conversion factors) ITST (conversion factors) AA 1.90 1.51
AB/BA 1.30 1.61 AC/CA 1.10 1.10* AD/DA 1.00 1.00*
BB 1.20 1.63 BC/CB 1.05 1.55 BD/DB 1.00 1.00*
CC 0.90 1.06 CD/DC 0.80 0.80*
DD 0.10 0.10*
*Insufficient data to derive conversion factors. Original Forum estimate used instead
Source: MJA analysis of Danish Hybrid model and documentation
The table in the box above illustrates the correction factors used to convert road distance to trench distance. It illustrates that these conversion factors can vary significantly by road type. In addition, the table indicates that very different conversion factors can be achieved with different methodologies, i.e. the Forum and ITST factors differ considerably.
In terms of the algorithm used to connect points in the network, the PIE II model uses a Minimum Spanning Tree (MST) algorithm. BM notes the Steiner Minimum Tree (SMT)
Competitive Carriers Coalition Comments on the ACCC Discussion paper – review of PIE II
MJA Comments on Discussion Paper FINAL PUBLIC2 / 6 July 2006
38
is superior to the MST, but also incurs additional costs for supporting infrastructure. In addition, BM notes that as the SMT requires additional computation, it must be evaluated for feasibility.
While we agree that Steiner nodes will introduce additional costs, these additional costs need to be compared with the reduction in trench and conduit length and other savings in support structures e.g., manholes, distribution points and maintenance costs. Trenching costs in particular are far larger in comparison with any minor distribution points that are needed to satisfy the Steiner node solution.
In terms of the feasibility of the Steiner nodes, we agree that there may be certain constraints to deploying them in certain areas. However, this may be solved by putting certain constraints on the placement of these nodes in the optimisation algorithm.
Nevertheless, calculations will increase considerably in complexity with Steiner nodes. It may therefore be appropriate to run Steiner node optimisations on a stratified sample of the dimensioned areas. This analysis will demonstrate whether the approach will result in shorter trench lengths and give an indication of the number of additional nodes or distribution points. Should these results show considerable cost savings, as we would expect, the analysis would also enable informed corrections to the results of the MST algorithm to make costs more optimal. In other words, the PIE II model could retain the current MST methodology and apply a number of correction factors to the results of this approach to reach a more optimal solution.
Trench sharing and new estates
The PIE II model calculates the amount of sharing in each ESA. For sharing between Telstra and third parties, PIE II uses the distance of actual sharing and assumes an absolute cost that can be recovered from the other operators. For trench sharing between the access and core networks, costs are shared equally. However, it is not clear whether sharing has been applied to other relevant structure costs such as manholes.
BM spends considerable effort considering the issue of new estates and how the forward-looking concept should be applied. BM concludes that it is appropriate for the PIE II model to exclude trenching costs for new estates over the regulatory period, but to include the costs of additional cable to provide service in those areas. In other words, if the regulatory period is 2 years and 1% of trenches provided is provided by developers in year 1 and 1% in year 2, then approximately 2% of trenches in the PIE model should be attributed no cost in year 2. When the regulatory period is reset trench provision by new developers is reset.

Competitive Carriers Coalition Comments on the ACCC Discussion paper – review of PIE II
MJA Comments on Discussion Paper FINAL PUBLIC2 / 6 July 2006
39
The key to analysing this argument lies in the interpretation of “time” in the forward-looking concept. The forward-looking perspective can be interpreted as the costs of today looking forward, i.e. the cost of building the network today taking account of future demand. This suggests that the network is built over a very short period (some may even argue overnight). This is of course not practically possible and would for example give rise to problems in the choice of equipment price and labour costs and effectively result in zero trench-sharing with third parties.
For the purpose of modelling, it is therefore often assumed that the network from a technical perspective is built overnight (or instantaneously), but all input parameters (trench sharing, equipment prices, etc.) are verifiable and reflect the costs of actual networks built over time. This means that equipment prices may follow from normal operator purchases and sharing may reflect normal planning and construction activity where co-ordination of trench sharing and co-diggings may be planned years ahead with other operators and utilities. Indeed PIE II uses as a proxy for trench sharing, the degree of sharing based on existing (historical) levels in their network. This also means that trench sharing in new estates should reflect a cumulative (or historical) trench sharing measure.
Notwithstanding the above, sharing between core and access increments in a scorched node environment should clearly occur more often in a forward-looking network than can be historically measured. Both the core network and the access network are assumed to be rebuilt in the same timeframe and hence could occur when there are coincident routes.
An implication of the BM approach is that prices will fluctuate each time a new regulatory period is started. All other things being equal, the trench costs per SIO will increase at the start of the regulatory period and subsequently decrease as demand is added. In our view, such movements are inappropriate. Instead it is more appropriate to assume a long-term ‘equilibrium’ new estate trench amount (proxied by historical developments) that is held constant over the regulatory period and may be subject to review after each period.
Price trends
We refer to commentary in section “Annualisation of capital costs”
Operating and maintenance expenses and common support expenses
Telstra’s PIE II model splits O&M costs by asset category.
BM suggests that the O&M factors used in the PIE II model are broadly consistent with models in the US and appropriate for the calculation of the efficient costs of the UT

Competitive Carriers Coalition Comments on the ACCC Discussion paper – review of PIE II
MJA Comments on Discussion Paper FINAL PUBLIC2 / 6 July 2006
40
service. His analysis is based on a comparison of the O&M costs from the US and other international experience.
We have several concerns with BM’s comments. First, there are other ways of accounting for O&M costs in a bottom-up model that have not been explored by BM. Second, BM’s commentary suggests that efficiency adjustments to O&M costs that are sourced from an incumbent are not normally considered and hence should not be considered for Telstra. Third, BM explains that the PIE II model uses composite O&M factors. We discuss each of these points in the following.
The use of mark-ups for O&M costs is practical but not ideal. First, as noted above the mark-ups used in the PIE II model are aggregate (are composites). O&M costs in the access network can vary by trench, conduit, copper cable in different segments (and by size and area), copper cabinets, fibre cable, jointing boards etc. The PIE model only includes Lead In, Conduit, Cable and Pair Gains systems related to the copper access network. Second, the use of O&M mark-ups in PIE II implies that the O&M costs in some rural areas will be more than ten times those in urban areas. While we acknowledge that costs of maintaining lines in remote areas will exceed the costs in urban areas, the difference using mark-ups is unrealistic and too great.
In terms of O&M mark-ups based on the existing accounts of Telstra for those assets that are largely depreciated, we agree that dividing by capital costs in the PIE model is a pragmatic solution. Clearly, setting these costs in relation to depreciated capital expenditure in the accounts and subsequently applying them to the capital costs in the PIE II model would result in an overstatement of costs. The current approach results in the PIE II model using the historical O&M costs incurred by Telstra. There are two problems with this approach.
First, relying on the historical O&M costs of Telstra in a forward-looking model assumes that these costs are efficient. No documentation has been presented by Telstra to suggest that its O&M costs are efficient. We note for example that a detailed efficiency study26 was carried out by the Danish regulator ITST of TDC’s operating costs before setting O&M mark-ups. This study suggested that TDC was 90% efficient and the O&M mark-ups were adjusted accordingly.
26 There are different methodologies that can be used to conduct an efficiency assessment exercise. The
two most common are Stochastic Frontier Analysis (SFA) and Data Envelopment Analysis (DEA). Both have strengths and weaknesses (see, for instance, Coelli et al, 1998, for an introductory analysis of both DEA and SFA). ITST used both methods.

Competitive Carriers Coalition Comments on the ACCC Discussion paper – review of PIE II
MJA Comments on Discussion Paper FINAL PUBLIC2 / 6 July 2006
41
In November, last year Telstra chief executive Sol Trujillo announced that the company plans to shed up to 12,000 jobs over the next five years.27 This suggests that there may be room for substantial efficiency improvements in Telstra’s network operation.
Second, although copper as a technology has not changed substantially over time, the copper lines in the existing Telstra network are unlikely to be of similar quality to that which would be laid today and hence we would expect fewer faults and repairs. Factors based on recent or historical levels of operating expenses typically overstate operating expenses. 28
The result is that the O&M in the PIE II model is likely overstated. Where this is the case, indirect O&M will also be exaggerated, since these costs are calculated as a percentage of direct O&M (see below).
The calculation of O&M costs in a bottom-up framework is not easy and has historically, been an area of controversy in any cost modelling exercise. Ideally, O&M costs should be calculated from first principles and reconciled with operator practices and costs. This requires a detailed understanding of network operations – knowledge that Telstra should have.
Another approach Telstra could use is to calculate O&M costs as driven by the number of events per major cost component. Events could include:
new line(s) in existing area / new development on a green or brown field site;
fault detection, monitoring and diagnosis;
fault repair (different costs for different types of repair); and/or
any routine maintenance / renewal of equipment.
The operating cost per event would take into account the total time spent dealing with the “event” and an average wage for the engineering or other personnel in charge of the “event”. As an example of this approach, we note version 1.3 of the Danish hybrid model.
Yet another approach that has been used in other jurisdictions29 is the so-called Functional Area (FA) approach. This methodology was developed as an attempt to overcome some of the shortcomings of relying on mark-ups over equipment costs as an estimate of direct network O&M costs. It is described briefly in the box below.
27 See: http://www.theage.com.au/news/national/pm-under-fire-for-telstra-job-
remarks/2005/11/16/1132016861389.html 28 Another critical issue is that the O&M mark-ups used are consistent with the investment costs. 29 Sweden and the most recent version of the Danish hybrid model (version 2.1).

Competitive Carriers Coalition Comments on the ACCC Discussion paper – review of PIE II
MJA Comments on Discussion Paper FINAL PUBLIC2 / 6 July 2006
42
BOX 3: THE SWEDISH FUNCTIONAL AREA APPROACH
This approach relies on the identification of a number of functional (or operational) areas (FA) of the telecommunications business. Each of these areas is then dimensioned. For example in terms of staffing costs: X number of staff type Y in area Z needed for every N local exchanges or for the entire company. The number of staff type Y is then multiplied by the average annual cost of that staff type to yield the annual pay costs for staff Y in area Z. Summing the annual cost of different staff types within that particular area yields the total pay costs within that area. To this is added an estimate of annual non-pay costs of that area to yield the total annual cost of area Z. The annual cost of each is then allocated to final services using either a routing factor technique (where FA costs are allocated to a network element and thence to services using a routing table) or a simple mark-up approach. More generally, the process of implementing an FA approach may be described as a three stage approach: 1. define the operational areas to consider; 2. define the size of each area in terms of staffing and estimate the cost of each area using inputs on
annual salary and non-pay costs; and 3. allocate the cost of each area related to direct network costs to network elements, such that the total is
equal to the sum of those functional areas and allocate remaining non-network (or unallocated) costs as mark-ups.
Source: MJA analysis of Swedish Hybrid model and documentation
Finally, we note that the PIE II model includes a mark-up related to network planning. It is unclear why network planning has achieved special treatment in the PIE II model.
It is common practice to include any network planning within O&M since it is usually considered an integrated part of the ongoing maintenance of the network.
Sometimes some network planning costs are captured in an indirect network costs category. For example, computers may be divided into PCs, equipment for network planning, network management and billing systems.
Further, the use of a forward-looking TSLRIC concept means that a model should cost the optimised network as if it were already in place and hence would exclude any major network planning costs related to building the network.
Indirect capital costs and indirect O&M costs
Like operating costs, indirect costs are difficult to estimate in a ‘pure’ bottom-up manner. It is therefore not uncommon to use mark-ups sourced from operator accounts to estimate these costs.
Within the timeframe for this review, we have not been able to establish whether the costs applied in the PIE II model reflect efficient costs. In terms of efficiency, the same comments apply as in the previous section.
We note, however, that network building and land costs are based on a direct input based on Telstra’s estimate of the current market value of these assets and an O&M factor. We

Competitive Carriers Coalition Comments on the ACCC Discussion paper – review of PIE II
MJA Comments on Discussion Paper FINAL PUBLIC2 / 6 July 2006
43
agree that buildings and land should be valued at their market value. This approach is consistent with TSLRIC principles. However, these values may need to be adjusted. This is especially the case where the value used is sourced directly from Telstra’s accounts. For example, there will be vacant space in many exchange buildings, often reflecting the fact that they were built to accommodate older switching equipment, which has a larger footprint than new equipment.
Not withstanding the above, account should also be taken of the need for some spare capacity (in terms of space), where the provision of additional space represents an economically sensible contingency, e.g. due to future demand for say co-location space. However, inefficient vacant space is not part of TSLRIC and should be excluded.
Taking costs directly from Telstra is likely to result in exaggerated costs related to network land and buildings. A true and detailed bottom-up approach would seek to estimate the space associated with the equipment modelled. The space requirements and the market value per square metre could then be used to calculate the value of building and land.30
2.2.5. Calculating TSLRIC for subsequent years (s7)
For a detailed discussion of rolling forward and updating the PIE II model, we refer to discussions in section 6.
In our view, it is imperative that the PIE II model consider changes to (forecast) demand, price trends, cost of capital and capital costs. Growth in the access network will affect costs in different ways as illustrated in the table below.
TABLE 8: GROWTH IN THE ACCESS NETWORK Type of growth New town or
suburb, new site Infill building Existing sites,
additional lines More cables between exchange and distribution points
Yes Larger cables, same cable km
Larger cables, same cable km
More cables, final drop Yes Yes Yes (or larger cables) More street trench and duct Yes No No
Source: MJA analysis
Failure to adequately update demand data over time will result in erroneous results.
Regarding the O&M costs, a proportional adjustment each year in relation to changes in capital costs through mark-ups is largely a pragmatic solution and with appropriately
30 Care should be taken to take proper account of common building-related costs (or site costs), i.e. site
security, power supply units and air conditioning and how they are allocated between different network element. It is currently unclear to us how these common building costs are treated in the PIE II model.

Competitive Carriers Coalition Comments on the ACCC Discussion paper – review of PIE II
MJA Comments on Discussion Paper FINAL PUBLIC2 / 6 July 2006
44
specified mark-ups may yield sensible results. However, developments in Telstra’s actual operating costs and wage costs may be quantified and used to cross-check the figures.
In addition to the updates mentioned above the following schedule for other parameters may be considered:
technical design parameters - these figures may change from year to year, but they should be fairly stable. We would suggest it is sufficient to review these parameters every third year;
asset lives - could be reviewed every third year and kept unchanged unless there is a strong indication that they have changed; and
network design – the number of nodes and demarcation between access and core should be reviewed every third year.
In our view, a TSLRIC should ideally be subject to a fundamental review every three years and should not be allowed to rolled forward more than 5 years.
Competitive Carriers Coalition Comments on the ACCC Discussion paper – review of PIE II
MJA Comments on Discussion Paper FINAL PUBLIC2 / 6 July 2006
45
3. Cost allocations
(b) Question 10: Are allocations of common costs and network costs to ULLS, contained in PIE II, appropriate?
3.1. Allocation of common costs
The underlying concept of TSLRIC is explained in the ACCC’s 1997 paper, Access Pricing Principles Telecommunications – A Guide. This concept is understood to include a contribution to organisational-level costs and the ACCC adds a ‘+’ to TSLRIC to denote this. That is the ACCC defines common costs as costs that are organisational-level costs. More generally, we may define common costs as the costs of those inputs necessary to produce one or more services in two or more increments, where it is not possible to identify the extent to which a specific increment causes the cost.
The allocation of such common costs will therefore always be somewhat arbitrary. Otherwise, the common costs would not really be common and should instead be allocated directly to the increment. Common costs are therefore typically allocated using some sort of mark-up. Two main allocation bases are typically considered, Ramsey Pricing Mark-Ups (RPMU) and Equi-Proportionate Mark-ups (EPMU).
An EPMU essentially allocates common costs pro-rata to incremental costs. EPMUs have no strict theoretical basis in economics (although where they may be regarded as proportional to output they would be justified)31 but can be supported on the grounds of tractability and objectivity.
An EPMU is a variant of a multiplicative mark-up. A multiplicative mark-up implies that common costs are allocated in relation to the relative level of incremental costs of each service. For example, if there are two services and the Incremental Cost (IC) of service one is 75% of total incremental costs and the IC of the other is 25%, then service one would be allocated 75% of common costs and the other 25%. In other words, if the IC for service one is 15,000 and the IC for service two is 5,000 and common are 2,000, the mark-up will be 10% (2,000/(15,000+5,000)). Thereby 1,500 (0.1x15,000) of the common costs are allocated to service one and 500 to service two.
An alternative is to allocate common costs using an additive mark-up. Using an additive mark-up, the common costs are divided by measurement of usage (number of minutes or lines) and simply added to the IC for the service. Hence, an additive mark-up implies that
31 See WIK-consult (2005), Mobile Terminating Access Service: Network Externality and Ramsey Pricing
Issues, A Consultancy Report to the ACCC in relation to Optus's and Vodafone's Undertakings in relation to the Domestic Digital Mobile Terminating Access Service, p. 39.

Competitive Carriers Coalition Comments on the ACCC Discussion paper – review of PIE II
MJA Comments on Discussion Paper FINAL PUBLIC2 / 6 July 2006
46
the allocation of common costs is independent of the costs of the various services. An additive mark-up is normally not used to allocate pure common costs, i.e. costs that cannot be separated between increments. The additive approach requires a common metric to be defined, i.e. lines in terms of the ULLS or minutes or calls for termination services. However, common costs may initially be split between increments by way of, for example, a multiplicative approach (where the common metric is cost) and thence allocated using an additive mark-up.
From an economic point of view, RPMU is the theoretically correct way to efficiently recover common costs. However, Ramsey pricing, has a number of weaknesses when implemented in practice and has to our knowledge not been used by any regulator to allocate common costs related to the provision of fixed line telecommunications service.
The PIE II model appears to use an EPMU approach through the different indirect mark-ups used. These would appear to be appropriate. However, we caution that any consistent evaluation of costs that cannot be directly attributed to network elements of specific activities is particularly difficult. In our experience these costs may differ considerably from cost model to cost model making any direct international comparisons difficult. Detailed information on the sources of the underlying mark-ups is necessary to make any meaningful conclusions in this area.
3.2. Allocation of network costs
The allocation of network costs related to the ULLS follows several steps in the PIE II model.32 Different network elements (distribution cable, distribution ducts and conduits, pillars, main cable and main cable ducts etc.) are allocated to different cost pools and divided by the number of SIOs within the cost pool to yield a unit cost estimate.
These steps occur in the ULLS Analysis database. We have traced these steps and provide a summary of them below:33
[c-i-c
32 See queries in the ULLS Analysis database. 33 The PIE II model comprises 65 steps using 65 different queries.

Competitive Carriers Coalition Comments on the ACCC Discussion paper – review of PIE II
MJA Comments on Discussion Paper FINAL PUBLIC2 / 6 July 2006
47
It excludes non ULL costs and creates a total ULLS cost pool consisting of direct, indirect and building & land costs. The excluded non-ULL costs include:

Competitive Carriers Coalition Comments on the ACCC Discussion paper – review of PIE II
MJA Comments on Discussion Paper FINAL PUBLIC2 / 6 July 2006
48
monthly charge by dividing by 12. ] .
We have number of concerns with this approach:
The approach simply aggregates costs and demand of different services and calculates the unit costs on the basis of these totals. The result is therefore an average cost across all services using the copper assets in question. Clearly each service using the assets may use the asset differently. The best analogue in this respect is probably the core network where the PIE II model uses a routing table approach to allocated costs between different services. A similar allocation/routing table approach could be adopted for the access increment and the services within it. Failure to do so results in a ULLS cost that is unlikely to accurately reflect (efficient) cost.
There would appear to be an inconsistency between costs and demand, i.e. inconsistencies between numerator and denominator in the unit cost calculation:
o In terms of costs, these are calculated in step 3 and adjusted in steps 7-9 above. A ‘ULLS cost table’ is created with total ULLS costs excluding non ULLS costs, i.e. access costs in the access increment without those elements that should not be allocated to the ULLS. [c-i-c x x x x x x x x x x x x x x x x x x x x x x x x x x xx x x x xx x x x x x x x x x x.] No information is provided to allow us to understand or assess these costs. Many of the element codes that

Competitive Carriers Coalition Comments on the ACCC Discussion paper – review of PIE II
MJA Comments on Discussion Paper FINAL PUBLIC2 / 6 July 2006
49
are excluded appear to be different types of line cards, wireless and pair gain systems and the above ground housings (“AGHs”).34 In terms of the line card costs we agree that exclusion of these is suitable and given that wireless and AGH costs are subtracted from demand (see below) excluding them from the cost pool is also appropriate. The NU is also excluded from the cost pool. This is potentially over conservative. The cost of the Main Distribution Frame (MDF) in the NU should, in our opinion, be allocated to the access increment and a share of it allocated to the ULLS.
o Demand used in the denominator is the sum of:
[c-i-c
xxxxx.] .
In terms of the last point, exclusion of this demand is appropriate given that costs related to these elements are also excluded. [c-i-cH x x x x x x x x x x x x x x x x x x x x x x x x x x xx x x x xx x x x x x x x x x x x x x x x x x x x x x x x x x x x xx x x x xx x x x x x x x x x x x x x x x x x x x x x x x x x x x xx x x x xx x x x x x x x x x x x x x x x x x x x x x x x x x x x xx x x x xx x x x x x x x x x x x x x x x x x x x x x x x x x x x xx x x x xx x \
xxxx.] These inconsistencies will lead to overestimated ULLS unit costs.
The PIE II model calculates the unit cost of the ULLS (in each Band) based on services connected to an NU.35 Costs that are not related (or connected) to an NU are excluded (see steps 6-8 above) using demand figures. As explained above different services will use different network elements or cost categories more or less intensely. It is therefore unclear to us whether demand is the appropriate allocation key.
Different services may use a different number of pairs and hence it would be appropriate to adjust the SIO metric accordingly. For example, will ‘On Ramp Primary Rate’ use the same number of pairs as the Basic Access service? If not then the SIO metric will not be appropriate. Further, the number of SIO and EIO are simply added together. It is not clear that this is appropriate. Some leased lines
34 The model also contains an element code HUG. It is unclear to us what this code is, but we suspect it
might be underground housings (“UGHs”). It does not seem to be used in the model and therefore has no influence on results.
35 Although Telstra provide no explanation for this approach we assume that this has been done because the ULLS can only be provided by co-locating at the CMUX as this marks the end of the copper pair (connection to the exchange is provided through a fibre optic cable).

Competitive Carriers Coalition Comments on the ACCC Discussion paper – review of PIE II
MJA Comments on Discussion Paper FINAL PUBLIC2 / 6 July 2006
50
in the access network may be provided over more than 1 pair on average and this is not reflected in the EIO metric.
Competitive Carriers Coalition Comments on the ACCC Discussion paper – review of PIE II
MJA Comments on Discussion Paper FINAL PUBLIC2 / 6 July 2006
51
4. Technological choices
Question 11: Are the technological choices (particularly with respect to alternative access technologies) built into the PIE II model still relevant for the purposes of constructing a hypothetical forward-looking network?
New entrants are unlikely to reproduce a copper based network similar to the one that has already been rolled out by Telstra. Instead, they will roll out the technology that is most appropriate to the areas they serve (for example, using fibre in urban areas and radio in rural areas). It is against this benchmark (that is, the cost of designing an efficient new access network using a mix of technologies to meet demand in different areas at lowest cost) that new entrants will make their build or buy decision.
In other words, a TSLRIC charge based on the costs of reproducing a copper network is useful only to calculate the costs of a ULLS based on copper. It is not necessarily capable of providing any useful signals to encourage efficient entry into the access network. To do so, the model must make appropriate technological choices.
Notwithstanding the above, some regulators have been reluctant to allow too much optimisation in terms of alternative access technologies.
In terms of replacing copper with fibre for example, arguments have been presented that the copper network has yet to be subject to a large-scale upgrade and therefore it is inappropriate to implement fibre as the forward-looking solution. Most customers today will not demand broadband speeds of more than can be provided using xDSL and hence operators may have limited incentives to upgrade their networks at least in the short to medium term.36
Another argument for modelling copper where fibre or wireless might be expected to be optimal is based on a wish by the regulator to ensure service equivalence. By modelling a different network, it may not always be possible to fully align the costed services with the actual services provided by the incumbent. Service equivalence means that the modelled services should be equivalent to services provided by the incumbent and no “external” costs should be incurred enabling a similar service to be offered.37 This means, for example, that the model should model copper where a copper service is currently provided so the ULLS is copper based as opposed to being based on alternative technologies.
36 Widespread xDSL and user demand for greater speed would currently seem to be driving fibre
deployment in Japan. 37 “External costs” is understood as additional costs that would have to be incurred by end-users or
alternative operators should the technology change.

Competitive Carriers Coalition Comments on the ACCC Discussion paper – review of PIE II
MJA Comments on Discussion Paper FINAL PUBLIC2 / 6 July 2006
52
The PIE II model contains the following technological solutions:
Copper;
Satellite;
Small Capacity Distributed System (SCADS) – fibre / copper pair gain system;
Single/Dual Channel Access Radio (SCAR/DCAR); and
High Capacity Radio Concentrators (HCRC).
Based on these technologies the optimisation routine in the PIE II model does the following:
all DAs that are less than 6km from the nearest RAU are dimensioned using copper
all that are more than 6km from the nearest RAU are serviced by one of SCADS, SCAR/DCAR or HCRC. For DAs with less than or equal to 10 SIOs, the lowest cost solution is restricted to choice between SCADS and SCAR/DCAR. For DAs with more than 10 SIOs, the choice is made between SCADS and HCRC. Further, if an ESA has at least one DA serviced by HCRC, then all DAs in that ESA serviced by radio are serviced by HCRC.
all ESAs with less than or equal to 15 SIOs are served by satellite
There are two issues that arise as a result of this optimisation approach: i) are the technological choices appropriate; and ii) do the design parameters used to simplify the optimisation process result in an efficient outcome.
In terms of the latter we acknowledge that some simplification of the optimisation procedure is warranted. Clearly, it would it would make little sense to calculate the least cost solution by making use of all the technological solutions available given that it is possible a priori to exclude some.

Competitive Carriers Coalition Comments on the ACCC Discussion paper – review of PIE II
MJA Comments on Discussion Paper FINAL PUBLIC2 / 6 July 2006
53
A key choice, however, in the PIE II modelling is the 6 km on copper runs. Although we agree that a 6-km limit is likely to be a reasonable cut-off point38 we suggest that it is appropriate to run different modelling scenarios to analyse how increasing and decreasing this cut-off point would change costs. Likewise, the choice of 15 SIOs as the cut-off point for satellite is important. It is unclear to us why this is appropriate and suggest Telstra provide documentation to support this choice.
The PIE II model should determine which technological choice is the most economically attractive, using the full TSLRIC cost of each solution, i.e. the lowest LRIC cost solution that meets the design constraints.
The Description of the PIE II model document states that the technology chosen will be the one that provides the lowest estimated cost of servicing the DA.
The relevant section of the PIE II model is in the database(s) CAN AF, CAN GM and CAN NZ reproduced in part below.
38 From a reliability point of view, the longer the line length, the more joints in the cable are required and
therefore the greater likelihood of faults. Line lengths also affect transmission bandwidth and where cable runs are very long, problems of signal attenuation will occur. The table below shows maximum reach for different xDSL services.
xDSL Modulation Method
Symmetric or Asymmetric
POTS Support
# of Twisted Pairs
Maximum Reach (km)
Maximum Bitrate Downstream
Maximum Bitrate Upstream
ADSL QAM/CAP or DMT
Asymmetric Yes 1 5.5 6 Mbit/s 640 kbit/s
ADSL light
QAM/CAP or DMT
Asymmetric Yes 1 5.5 1.5 Mbit/s 512 kbit/s
HDSL 2B1Q Symmetric No 1, 2, 3 3.6 2 Mbit/s 2 Mbit/s SDSL 2B1Q Symmetric No 1 6.5 2.3 Mbit/s 2.3 Mbit/s SHDSL PAM Symmetric No 1, 2 6.5 4 Mbit/s 4 Mbit/s IDSL 2B1Q Symmetric No 1 5.5 144 kbit/s 144 kbit/s VDSL QAM/CAP or
DMT Asymmetric or
Symmetric Yes 1 1 52 Mbit/s 6 Mbit/s
Source: APT/ACA Workshop January 2004

Competitive Carriers Coalition Comments on the ACCC Discussion paper – review of PIE II
MJA Comments on Discussion Paper FINAL PUBLIC2 / 6 July 2006
54
FIGURE 5: EXTRACT OF PROVISIONRAUS, CAN-AF
c-i-c
[c-i-c
Xx x x x x x x x x x x x x x x x x x x x x x x x x x x x x x .]
In the cases above, the costs used are the capital costs of the infrastructure, i.e., there is no comparison including relative ongoing costs of the technologies (the annualised cost incl. O&M), i.e. the PIE II model does not necessarily select the lowest LRIC cost solution.
In areas where radio or satellite is deployed, the amount of trench that (potentially) can be shared between core and access increments is reduced. Hence, in principle, the optimisation should also include the knock-on effects on the core increment. It may be the case that the final amount of shared trench, after allowing for cost minimisation due to
1
2
3
[
c-i-c
]

Competitive Carriers Coalition Comments on the ACCC Discussion paper – review of PIE II
MJA Comments on Discussion Paper FINAL PUBLIC2 / 6 July 2006
55
the deployment of radio or satellite, is less than the amount offered for sharing by the core network. For example even if radio only serves 3% of customers, it may cover 30% of an ESA or rural area, and hence may eliminate sharing of route for some 20% of the core network routes.
In terms of the technological choices, four major access technologies are included in the model: copper, fibre, radio and satellite.
Fibre is excluded except when used for SCDA. It is our understanding that SCDA is a pair gain system using fibre and it is currently in use by Telstra. As a starting point we believe it is appropriate to include it within the cost minimisation problem. One potential problem with SCDA, however, is that it would appear to limit the utilisation of broadband and therefore may not be regarded as a forward-looking option.
In terms of wireless technology we may distinguish between point to point (PTP) solutions and point to multipoint (PTM).39.
Within PTP it is common to subdivide into:
small capacity (e.g. n x E1: Longreach, Alcatel);
medium capacity (e.g. 34 Mbit/s: NEC, Alcatel, Ceragon); and
high capacity (e.g. 155 Mbit/s: Ceragon, NEC, Siemens, Marconi AXR).
PMP radio comprises two significant groups, the so called multi-access radio type (MAR) and the wireless local loop (WLL) type. MAR technologies such as IRT2000, SR500 and NEC HCRCS are suitable for very sparsely distributed customers. These typically operate on a time division multiple access basis and have a narrower bandwidth and lower customer numbers per system. WLL such as iBurst, Marconi MDMS and Airspan 4020 are typically more suited to higher customer concentrations, within a radius of 25 km of a base station.
A variant of PMP is the Local Multipoint Distribution Service (LMDS). LMDS is a flexible platform that can support TDM, ATM, and IP traffic on a variety of CPE and network interfaces. Rather than building separate application-specific access networks, a single LMDS platform can serve multiple applications, thereby reducing the total cost of the access network. For example, AIReach® Broadband AB9000 provides a PMT
39 PTP is when two points need to be connected: microwave transmission equipment is installed at both
ends, creating a “microwave hop or link.” One set of equipment is installed at each point so that two sets of equipment are needed for each hop. PMP architecture is such that a central base station or “hub” is used to communicate with multiple points. A single set of equipment is installed at the base station, which is then shared by many other points. The PMP advantage is that for n locations, only n + 1 sets of equipment are needed, whereas PTP requires 2 x n sets of equipment.

Competitive Carriers Coalition Comments on the ACCC Discussion paper – review of PIE II
MJA Comments on Discussion Paper FINAL PUBLIC2 / 6 July 2006
56
solution for backhaul and broadband wireless access applications and provides solutions that that encompass voice, video, data, multimedia, and Internet services.
Multichannel multipoint distribution service (MMDS) is yet another alternative that may be used for general-purpose broadband networking.
WiMax may be placed in the same group as the former two.
As we understand the PIE II model, SCAR/DCAR is a PTP technology and HCRC is PTM (hence the costing rule that all DAs in an ESA are served by one HCRC). In all cases, these systems are used as a radio link to the exchange.
In terms of the generic costing alternatives, PIE II would therefore appear to encompass the majority of technology options. However, in our opinion there would room to incorporate some of the newer radio technologies in the PIE model. Inclusion of these technologies may result in less copper and fibre in DAs in rural areas and hence lower costs.

Competitive Carriers Coalition Comments on the ACCC Discussion paper – review of PIE II
MJA Comments on Discussion Paper FINAL PUBLIC2 / 6 July 2006
57
5. Band 4
Question 12: Given Telstra’s proposed approach to the averaging of network costs – where the costs of high cost regions are recovered in low cost regions – how accurate is the PIE II model in estimating costs in Band 4? How reasonable are the model’s assumptions with respect to the choice of technology in these areas (are the employed CAN technologies the best available) and network design parameters? Interested parties responding to this question are requested to provide specific and detailed answers.
We refer to our answer to the previous question. In our view, there is scope to include additional radio technologies in the PIE model. Further, for Band 4 areas in particular, the PIE II assumption that satellite only is deployed when there are 15 SIO or less in an ESA is important. As stated previously it is unclear how Telstra has derived this figure and we suggest that cut-off points above 15 be examined. Based on an initial examination of the PIE model we believe it is likely that costs can be further minimised in these areas by the use of satellite.
We have been unable to evaluate whether the input costs used for satellite are accurate.

Competitive Carriers Coalition Comments on the ACCC Discussion paper – review of PIE II
MJA Comments on Discussion Paper FINAL PUBLIC2 / 6 July 2006
58
6. Rolling forward
Question 13: Is Telstra’s methodology with respect to rolling forward the PIE II model to years beyond its original scope appropriate and capable of producing reasonable estimates? Interested parties responding to this question are requested to provide specific and detailed answers.
In the following discussion the term “base year” refers to 2005; and the term “updating years” refers to all the subsequent years for which the cost model produces results on the basis of the “base year” results (i.e. before another structural updating of the model takes place). We assume that “updating years” are the years 2006, 2007 and 2008.
In bottom-up models, like PIE II, volumes are generally used for three purposes:
to dimension the network (which we will refer to here as purpose A);
to allocate costs (purpose B); and
to divide total costs to get a per unit measure (purpose C).
Let us assume that the model has to produce results for four years running, i.e. 2005 (the “base year”), 2006, 2007 and 2008 (the “updating years”). We believe that there are fundamentally two options for the model to achieve this:
Option 1: the bottom-up model produces “Year 1 results” for both the “base year” and for each of the “updating years”.
Option 2: the bottom-up model produces “Year 1 results” for the “base year” and “Year 2, 3 and 4” results for the “updating years”.
The PIE II model currently uses a variant of Option 1 for years 2005/6 – 2007/08. Each year capital prices are rolled forward using price trends in the annualisation formula and the cost of capital is updated.40 Demand is not updated for the period of the Undertaking. The model then calculates the Year 1 results. This rolling forward calculation is not part of PIE II functionality but can be implemented by manipulation of the model.
For years 2002/3 – 2005/6, however, Option 1 is used where demand is updated each year and a re-dimensioning of the network is implemented as an integrated part of the model. In this respect, PIE II may be called a multi-year model for years 2002/3 – 2005/6.
In terms of the undertaking prices proposed by Telstra, these are a uniform A$30 per month for years 2006 to 2008. That is, although the PIE II model produces different cost results for each year (a monthly ULL cost that is increasing over time) Telstra proposes a 40 Since the model calculates O&M costs as a proportion of capital costs, these are adjusted proportionally
each year in relation to changes in capital.

Competitive Carriers Coalition Comments on the ACCC Discussion paper – review of PIE II
MJA Comments on Discussion Paper FINAL PUBLIC2 / 6 July 2006
59
stable price path for the period of the undertaking. It is unclear to us on what basis Telstra has derived this price schedule. Further, as noted above, the actual rolling forward of the model to 2007/8 is not immediately possible with the version of the PIE II model supplied by Telstra. The version supplied is only able to calculate the costs of ULLS for the period 2002/3 to 2005/6.
In the following, we discuss the two different options for rolling forward set out above for updating the PIE II model. In order to do so and facilitate an understanding of how the two options work in practice and the pros and cons of each we discuss them with reference to the following set of questions:
Question 1: which set of volumes should be used for purpose A (i.e. to dimension the network), for purpose B (i.e. to allocate costs) and for purpose C (i.e. to divide total costs in order to get a per unit measure) for both the “base” and the “updating years”?
Question 2: should the depreciation profile be affected by the application of the model to a number of upcoming years?
Question 3: how should the forecast evolution of the prices of equipment and other relevant inputs (for example, the WACC) be taken into account?
Question 4: what evolution of O&M costs should be assumed, including possible improvements in efficiency?
Question 5: how should we ensure that the cost of capital allowed is consistent with the treatment of depreciation and other assumptions?
These questions are given particular focus by the possibility that Telstra may face significantly falling volumes of PSTN traffic in the period before the next review period.
6.1. Option 1 – PIE II 2002/3 – 2005/6
Option 1 assumes that the bottom-up model is a “Year 1” model for all the years under consideration, be they “base” or “updating years” (this corresponds to running the model for each of the years as if it were a Year 1 model all the time). This is the approach that traditionally underlines bottom-up models, insofar as they have explicitly addressed this issue. However, as explained below, its practical justification may depend on the presence of increasing volumes.
With regard to Question 1, given that the model is to be run for each year as if it were the base year, the relevant volumes for all the indicated purposes are the volumes of the year under consideration, recognising that for purpose A (i.e. dimensioning the network), it is necessary to allow for growth and to use the larger of current demand (i.e. at the time of dimensioning) and future demand.

Competitive Carriers Coalition Comments on the ACCC Discussion paper – review of PIE II
MJA Comments on Discussion Paper FINAL PUBLIC2 / 6 July 2006
60
As to Question 2, if demand is expected to fall significantly, depreciation in the first year may need to be increased (“incorporate an additional tilt”) so as to take into account falling levels of output. This is because the volumes to be used for network dimensioning (purpose A) will decrease from year to year (the dimensioned network would be shrinking) and, under these circumstances, economic depreciation would indicate that the operator should recover a larger share of the investment in the first year of the asset. This issue does not arise when volumes are growing, since if the network is expanding from year to year there should be no risk of stranded assets.41
With regard to Questions 3, this option would foresee an annual updating of equipment unit prices and any other relevant input. This could be done through the use of updated inputs or assumptions on the evolution of these variables, like rolling forward equipment unit costs using price trends as is currently the case in the PIE II model.
With regard to Question 4, given that the cost model is set to produce “Year 1” results each year, an efficient level of O&M costs would theoretically need to be estimated every year. As noted above the PIE model makes a proportional adjustment to O&M costs each year in response to changes in capital costs. However, developments in Telstra’s actual O&M costs and wage costs could be quantified and used to cross-check the figures.
With regard to Question 5, the cost of capital, like other major inputs, should be re-estimated each year as is currently the case in the Telstra Undertaking.
The main advantage of this approach is that it is consistent, year by year, with the regulatory objective of providing “build/buy signals” to the industry. Every year the model produces charges that are based on estimates of the charges that an alternative operator would have to face, should it decide to build an efficient network to serve the relevant level of demand over the relevant planning period.42 However, as noted above the prices suggested by Telstra have been subject to some averaging over time (in addition to being averaged over the four bands which raises concern over the ability to send appropriate build/buy signals).
On the negative side, the results at the service level might differ quite significantly form year to year, since different services use different network elements and different network elements can shrink/expand in a different way depending on the dynamics of overall volumes. This is illustrated by the results calculated by the PIE II model, where costs increase by 15% from 2005/06 to 2007/08. Further, if volumes fall significantly (which
41 Assets may always be “stranded” for other reasons, including technological advance and mistakes in the
investment decisions. 42 Another possible positive aspect of this approach is that it is the traditional approach generally adopted
in bottom-up models.

Competitive Carriers Coalition Comments on the ACCC Discussion paper – review of PIE II
MJA Comments on Discussion Paper FINAL PUBLIC2 / 6 July 2006
61
should be expected in the core network), the year to year changes in charges could be significant and unwelcome to both industry and consumers.43
6.2. Option 2
A possible alternative approach is that the model produces results for Year 1 (2005), Year 2 (2006), Year 3 (2007) and Year 4 (2008) as a consistent whole, in principle generating the basis for a coherent multi-year tariff schedule. The model will be based on a view on how much it would cost an efficient operator in 2005 to provide for a network able to serve demand for a four year period, and would then calculate annual costs as the basis for charges for Year 1, 2, 3 and 4 of this network.
In other words, the model calculates the results at the network level, on the basis of volume prediction in the base year. These results are then spread over the years on the basis of a depreciation profile which would take into account the expected evolution of volumes, and equipment prices, over the years.
As to Question 1, volumes to dimension the network (purpose A) will be the larger of volumes in 2005 and the relevant growth assumptions over the relevant planning period (under this option, we are not considering “maximum” volumes for each year, as in the previous option, but maximum volumes in 2005 for all years).
Results at the service level require allocations of costs, and this raises some additional issues. The model might be using forecast volumes (in each year) for purpose B and C; however, this might lead to large variations in the results at the service level over the years, and so some smoothing might be appropriate.
Clearly, an important aspect of this approach would be the depreciation profile (Question 2). This would have to take into account falling volumes (if any), price evolution and any other factor that might be taken into account as part of the economic depreciation; the results for each year will be dependent on these assumptions.
Evolution of equipment price trends (Question 3) will be relevant in calculating the correct depreciation profile but would not enter the year-by-year results directly.
With regard to Question 4, a view will need to be taken on how efficiency improvements and the age of the assets will affect operating and non-network costs over the years. 43 What are the most likely results of applying this approach in a market where volumes are falling? This
is not easy to predict because since volumes are falling (and a significant share of costs in telecoms networks are fixed), unit costs will tend to increase; on the other hand, the cost of capital might increase or decrease, volumes of other unregulated services might go up (taking a larger part of shared costs) and equipment prices (especially in the core network) are likely to fall in real terms. However, unit costs at the service level are likely to follow different patterns, resulting in a lack of smooth transition and, consequently, of clear signals to customers or to the industry.

Competitive Carriers Coalition Comments on the ACCC Discussion paper – review of PIE II
MJA Comments on Discussion Paper FINAL PUBLIC2 / 6 July 2006
62
Question 5, relating to the cost of capital, involves considering how to accommodate expected changes in market yields and interest rates, and ensuring that there is consistency between the different components of the approach. In particular, if Telstra is allowed to accelerate its depreciation, and as a result its charges, any effective reduction in the risks it faces should be offset by a reduction in the rate of return it is allowed.
A main positive aspect of this approach would be the clarity of the signal to customers and the industry: the results of the model could be disclosed in advance for four years. This could provide improved incentives to the incumbent, as in RPI-X systems of incentive regulation. Moreover, results at the service level are likely to follow a reasonably smooth path without spikes.
A negative of this approach is the fact that the “build/buy” signal will be set over a four year period, starting with 2005 and therefore might not be considered relevant as “Year 1” signals after the first year.
The results of this approach will depend to a significant extent on the depreciation profile to be used.
6.3. Conclusion
The following table summarises the key points about the two options:
TABLE 9: DIFFERENT CHARACTERISTICS OF ROLLOWING FORWARD OPTIONS
Option 1 - PIE II Option 2 Requires estimate of accelerated depreciation in face of falling volumes
Yes Yes
Requires estimate of consequential adjustment to cost of capital
Yes Yes
Requires estimate every year of cost of capital
Yes No
Requires estimate every year of equipment input prices
Yes No
Requires forecast of operating efficiency attainable
No Yes
Allows smooth path of prices over three year control period
No Yes
Provides incentives to incumbent to operate more efficiently
Limited Yes
Assures internal consistency over the four year period
No Yes
Source: EE
In our opinion Option 2 should be preferred. This will enable the calculation of a smooth and transparent three-year price path for the undertaking which presents efficient

Competitive Carriers Coalition Comments on the ACCC Discussion paper – review of PIE II
MJA Comments on Discussion Paper FINAL PUBLIC2 / 6 July 2006
63
incentives to all market participants. Although Telstra has suggested a uniform price schedule in their undertaking, it is unclear how this has been derived. The rolling forward methodology used by Telstra for the undertaking period 2005/06 to 2007/08 is inferior to Option 1 in that it fails to update demand.
Finally, we note that no matter which rolling forward methodology is chosen it is only as good as the base year from which it starts. As noted in section 8, we are concerned (in particular with the core network design) that the PIE II model is not truly forward-looking. When this is the case it is not sufficient to simply roll forward the model no matter how complex a rolling forward methodology is used; what is required is a fundamental review of the model.

Competitive Carriers Coalition Comments on the ACCC Discussion paper – review of PIE II
MJA Comments on Discussion Paper FINAL PUBLIC2 / 6 July 2006
64
7. Historic costs
Question 14: Should the ACCC consider the use of historic costs to estimate network costs for the ULLS? Are Telstra’s historic cost estimates for the ULLS reasonable? Can the historic cost regulatory accounts prepared by Telstra be used for the purposes of access price determinations? In discussing this issue, interested parties are asked to address their comments to the relevant statutory criteria.
The choice of historical costs is a choice between the use of costs actually incurred by the incumbent or the costs that the incumbents (or new entrants) would incur if they were to build the network today.
Calculating access charges based on historical costs, one can draw directly on the existing accounting systems of the incumbent. Hence historical cost valuations represent an objective benchmark of costs that tie back to the actual values in the company’s report and accounts. Using current costs, on the other hand, requires a revaluation of the incumbent’s assets. Hence, in principle it would be more simple to establish access charges based on historical costs than on current costs. Moreover, this would also have the advantage that the historical accounts are subject to a comprehensive audit.
In a competitive environment, however, an operator would not set his prices on the basis of historical costs. Suppose a new entrant provided the same services as the incumbent using modern equipment with much lower costs than the historical costs of the incumbent. The incumbent would then be forced to set prices also on the basis of these current costs in order to maintain his competitive position.
It is therefore desirable to set prices based on forward-looking costs. This will ensure the right incentives are created for operators to make efficient build/buy decisions, i.e.:
Incentive to buy: Encourage the use of existing facilities of the incumbent operator where this is economically desirable, avoiding inefficient duplication of infrastructure costs by new entrants;
incentive to build: Encourage investment in new facilities where this is economically justified by:
new entrants investing in competing infrastructure; and
the incumbent upgrading and expanding its network.
When access charges are based on forward-looking economic costs (such as the Total Service Long Run Incremental Cost – TSLRIC) they do not distort the build/buy decision of entrants. Entrants will be encouraged to use existing facilities if, and only if, it is economically desirable to do so. Further, cost-based access charges will also retain

Competitive Carriers Coalition Comments on the ACCC Discussion paper – review of PIE II
MJA Comments on Discussion Paper FINAL PUBLIC2 / 6 July 2006
65
investment incentives for incumbents to upgrade or extend the existing network when new technology is available.
Historical prices also do not satisfy the competitive standard of efficiency. Only prices based on current cost data (or forward-looking costs) provide for efficient use of resources as operators and consumers are encouraged to take account of the actual resource costs in their purchasing decisions.
In general, historical costs will tend to be higher than current costs owing to technological improvement and lower equipment prices. This will be particularly true in the core network where the cost of equipment plays a main role. In the access network, however, current costs are likely to be higher than historical costs (as indicated by Telstra’s own estimates). This is for example due to the large proportion of the asset base consisting of trenching where there has been little technological development and where real costs (labour) tend to rise over time.
A particular issue arises with regard to assets that have been substantially or fully depreciated but are still fully operational. Operators tend to use relatively short asset book lives with the implication that many assets are still being used after the end of their book lives. Such assets will have a positive Gross Book Value (GBV) and Gross Replacement Cost (GRC) but will have a zero Net Book Value (NBV) and Net Replacement Cost (NRC). Many of these assets may have been partly paid off by end-users in the past.44
The existence of fully depreciated assets will create a gap between the outputs of bottom-up models like PIE II and top-down models or operator accounts (be they based on historical or current costs). In a bottom-up model an annualised cost will be assigned to all assets since the underlying assumption is that assets are new. In a top-down model or in operator accounts no value should be attributed to fully depreciated assets. In terms of access network assets this could comprise a significant proportion of the asset base.
With a view to economic efficiency alone in a competitive market, fully depreciated assets should be valued according to their full current costs, not historical costs. According to the TSLRIC benchmark the costs of all long-lived assets such as trench and copper cables should be re-estimated and re-optimised and charged to ULLS users. However, if value is attributed to fully depreciated assets the incumbent may be allowed to ‘double dip’, i.e. to levy an annualisation charge on assets where the full costs of depreciation may already have been passed on to end-users. Hence it could be argued that the incumbent was unfairly overcompensated at the expense of end-users.
44 It can also be noted that some operators have reduced asset lives as a result of increasing uncertainty
about technological advances and perhaps about their future position in the marketplace.

Competitive Carriers Coalition Comments on the ACCC Discussion paper – review of PIE II
MJA Comments on Discussion Paper FINAL PUBLIC2 / 6 July 2006
66
These considerations are particularly relevant as regards the access network in rural areas, where the prospects of a competitive outcome even in the long run may be slim. This is partly because of the high proportion of fixed and sunk costs and, in particular, because the nature of these costs typically mean that it will be more inefficient for more than one operator (usually an incumbent who was the “first mover”) to serve the market.
Setting a competitive benchmark such as TSLRIC may therefore not be appropriate. Instead it may be socially optimal to set ULLS prices at the lowest possible price that still allows the incumbent to finance its activities, i.e. to efficiently operate and maintain the network and upgrade its investment where necessary. In other words that the long-term interest of end-users may best be served by setting prices that reflect financial viability and allocative efficiency.
In order to determine whether declaration will promote the long-term interests of end-users (LTIE), s. 152AB of the Act provides that the ACCC must consider the extent to which declaration is likely to result in the achievement of the following objectives:
the objective of promoting competition in markets for carriage services and services supplied by means of carriage services;
for carriage services involving communication between end users, the objective of achieving any-to-any connectivity; and
the objective of encouraging the economically efficient use of, and economically efficient investment in, the infrastructure by which carriage services and services provided by means of carriage services are supplied.
These objectives are essentially ‘secondary objectives’. They are not ends in themselves but are the means by which the primary objective (of promoting the LTIE) is to be realised. The key question to ask is therefore will the LTIE be promoted or served through the use of TSLRIC.
Where the incumbent is effectively providing a monopoly service and the costs of efficient entry is increasing over time, there would appear to be little demand or supply efficiency in encouraging entry to the market, since the incumbent would remain the efficient provider over time. A price based on TSLRIC would in these circumstances be substantially above the price necessary to maintain the service – a difference that will be even more pronounced when the historical network to large extent has been written down and costs have been recovered for these assets.
By lowering the ULLS price, we could lower the cost to consumers of usage and promote uptake of the ULLS setting the scene for increased innovation. Indeed given we are maximising the LTIE it is important to consider the time aspect and hence time preferences.

Competitive Carriers Coalition Comments on the ACCC Discussion paper – review of PIE II
MJA Comments on Discussion Paper FINAL PUBLIC2 / 6 July 2006
67
Even if we are not certain that the cost of efficient entry is increasing over time but speculate that there might be a technology in the future that would result in a decrease in costs, time preference means that the long-term interests of end-users will be better served by benefits which accrue quickly, compared with equivalent benefits which are much delayed. Similarly, time preference means that a dollar’s worth of immediate benefits is worth far more than a dollar’s worth of costs incurred in a decade’s time. Recognition of time preference would therefore give greater weighting to immediate benefits flowing from competition or efficiency of use of existing infrastructure, and less weighting to any costs that might be incurred in terms of efficiency of investment that might have occurred at some later date. Hence, when there are no immediate prospects of competition or superior cost efficient technologies on the horizon, interests of end-users may be better served with an alternative approach to the current TSLRIC price with more focus on allocative efficiency. Specifically a ULLS charge based on TSLRIC in outer bands is unlikely to translate into a price for customers that will meet the objective of maximising consumer benefits or more specifically, of reducing the costs of using the Internet and other broadband services.
If we are to depart from the TSLRIC benchmark, another one approach is needed. In sectors such as water, gas and electricity there is no statutory criteria to encourage efficient competition, rather to have regard to the need to promote competitive and fair market conduct. 45 Asset valuation and pricing in these sectors typically stipulates that the utility should be able to finance its activities and should have an incentive to do so efficiently (including an appropriate structure of charges). This approach would have several consequences for ULLS:
Telstra should be allowed to recover the projected necessary operating, maintenance and renewal expenditure requirements of the access network;
for any investment that is required to enhance or expand the access network, Telstra must be allowed an opportunity to earn a competitive return on that investment; and
Telstra should be able to earn a reasonable return on past investments that are appropriately valued (if they needed renewing that would be covered under the second point above).
The last point in particular, i.e. the valuation of assets, would be important for the final price.
45 For example the Economic Regulation Authority in WA is required to have regard to “the need to
promote competitive and fair market conduct” (ERA Act s.26).

Competitive Carriers Coalition Comments on the ACCC Discussion paper – review of PIE II
MJA Comments on Discussion Paper FINAL PUBLIC2 / 6 July 2006
68
In terms of valuing assets, there are a variety of methodologies available. In the context of regulatory valuations and asset valuation methods, two main approaches may be identified – cost and value-based approaches.
Cost-based approaches relate the value of an asset to the cost of purchasing the asset or the service potential embodied in the asset, either at historic cost or current replacement cost. The most common cost-based approaches include:
depreciated historical cost (DHC) - which uses the historical cost of acquiring the asset, adjusted by the proportion of the service potential which has expired;46 and
depreciated optimised replacement cost (DORC) - which measures the current cost of replacing existing assets with a set of assets that are adjusted for the proportion of the service potential that has expired and optimised to provide the required service potential in the most efficient way possible, i.e. a forward-looking TSLRIC type approach. Asset values are adjusted for any excess capacity, over-engineering, sub-optimal design etc.47
Value-based approaches determine the economic value of an asset from its net income earning capacity. Value-based approaches include:48
net present value (NPV) – which values an asset as the present value of the cash flows generated by the asset; and
net realisable value (NRV) – which is the price that the asset would achieve in an open market.
A hybrid approach, referred to as the optimised deprival value (ODV) method defined as:
ODV = min(DORC, max[NPV,NRV]).
The maximum of the asset’s NPV or NRV is referred to as the Economic Value (EV) of an asset.
ODV has been endorsed by Council of Australian Governments (COAG)49 as the preferred approach for valuing network assets for public reporting processes 46 A variant of DHC is depreciated inflated historical cost (DIHC) which adjusts the asset value for
inflation. 47 DORC is similar to TSLRIC, but steps down over time rather than having a smoothed annuity. The
problems with DORC are similar to those for TSLRIC, but it has the additional problem of higher charges in early years and lower charges in later years. Introducing this method part way through an asset’s life represents a benefit to customers (the net return will be less than TSLRIC).
48 Both of these approaches reflect expected future revenue streams, which in turn are based on prices. Using this value to set prices is therefore circular. The approach is generally only appropriate to develop a once-off “line in the sand” value based on existing pricing arrangements. From this point forward other methods can then be employed.
49 The principles of pricing for water services follow the National Water Initiative of the Council of Australian Governments. A key objective of the National Water Initiative is the establishment of best

Competitive Carriers Coalition Comments on the ACCC Discussion paper – review of PIE II
MJA Comments on Discussion Paper FINAL PUBLIC2 / 6 July 2006
69
(performance monitoring) and by the Agricultural and Resource Management Council of Australia and New Zealand (ARMCANZ) as a basis for water pricing.
In practice, water businesses use a variety of the valuation methods stated above. In rural Victoria, water prices are typically set by the ‘lower bound’ principle, i.e., they focus on commercial viability and the minimum level of price/revenue which is prudent in the light of the risks faced by the particular business.50 For major urban water utilities, economic regulation has focussed on the NPV methodology, with DORC as the ‘upper bound’.
Common for all (or most) water businesses, however, is the use of Long Run Marginal Cost (LRMC) and a two-part tariff, i.e.:
Revenue from annual charges = )(1∑=
×+N
iii QLRMCA
The first part of the tariff recovers the fixed portions (i.e., the connection and the access charges, denoted A) of the utility’s annual costs. The second part recovers the variable, or marginal, costs of the operation by way of a volumetric charge (the LRMC) multiplied by the quantity demanded (Q). This is essentially Coase’s solution51 to the competing needs of demand side efficiency and supply side efficiency. Incremental consumption (e.g., per kL of water delivered) is priced at marginal cost but the fixed charge is set so to ensure total revenue covers total costs (as reflected by the asset valuation and operating costs).
The water industry therefore prices between an upper bound set by DORC and a lower bound set by commercial viability and debt repayment and encourages demand (allocative) efficiency in the consumption of water.
In terms of efficiency, each valuation methodology has pros and cons and serves different purposes. However, a common objective for the sector would seem to be to encourage allocative efficiency, through pricing at LRMC and in some case by using an asset
practice water pricing. Best practice water pricing involves the principles of user pays and full cost recovery and includes, where appropriate, the cost of delivery, planning, and environmental impact. The principles also place emphasis on the reduction or elimination of cross-subsidies and making subsidies transparent. These principles align with the requirements of National Competition Policy, which require that public monopolies are subject to prices oversight and that their prices should be shown to reflect costs and to promote efficient resource allocation.
50 This approach looks only at forward-looking costs, but includes past debt burdens. It requires sufficient repayment of debt to keep the business afloat. The chief point of contention is how much return should be allowed for shareholders. Under “strong” efficiency, the price should be set at the bare minimum to continue efficient operation (i.e. just debt repayments, with some mechanism to encourage operational efficiency). The approach may allow some return so that both carrot and stick incentives can be used to ensure ongoing operational efficiency (“stick” mechanisms could not be employed in a company that is only barely viable).
51 Coase R. (1946), The Marginal Cost Controversy, Economica, 13 (8), 169-89.

Competitive Carriers Coalition Comments on the ACCC Discussion paper – review of PIE II
MJA Comments on Discussion Paper FINAL PUBLIC2 / 6 July 2006
70
valuation methodology that is below DORC (as stated above DORC is similar to TSLRIC).

Competitive Carriers Coalition Comments on the ACCC Discussion paper – review of PIE II
MJA Comments on Discussion Paper FINAL PUBLIC2 / 6 July 2006
71
8. Current costs
Question 15: Should the ACCC consider the use of current costs to estimate network costs for the ULLS? Are Telstra’s current cost estimates for the ULLS reasonable? Can the current cost regulatory accounts prepared by Telstra be used for the purposes of access price determinations? Interested parties responding to this question are requested to provide specific and detailed answers.
As we have discussed in the previous section the conventional approach to encourage efficient investment in infrastructure is by setting prices capable of providing the appropriate “build or buy” decisions. The appropriate benchmark is in this case TSLRIC.
Current cost accounts do not pass this test. Further as noted in the previous section there may be other approaches to asset valuation in outer bands that are more appropriate.
Further, we note that revaluation of assets in current cost accounts is still to be finalised. In addition, the lack of material technical change for many of the assets in the access network will mean that it is unlikely optimisation adjustments will be made when revaluing assets. Instead, existing historical values will simply be converted to current costs. Such an approach, while possibly consistent with a very narrow interpretation of current costs, cannot be said to produce an outcome that is consistent with a competitive market.

Competitive Carriers Coalition Comments on the ACCC Discussion paper – review of PIE II
MJA Comments on Discussion Paper FINAL PUBLIC2 / 6 July 2006
72
9. NERA model
(h) Question 16: Telstra has claimed that if the ACCC cannot accept PIE II, it should revert to its NERA model to calculate network costs. Would this be an appropriate solution to the ACCC’s ongoing concerns regarding PIE II?
Without access to the NERA model, it is difficult to comment on its appropriateness. Based on our review of the 1999 model documentation52 we believe it to be an inferior model. In our opinion, a model of the access network should, as a minimum, be based on the following indicative principles:53
equipment quantities for the access network should be estimated using detailed maps and other information for a statistically valid sample of ESAs. Geographical Information Systems (GIS) data and maps could be used;
account should be taken of different terrains and costing bands when costing trench. For example, different terrain types may be specified and the percentage of digging in each terrain type as an input per ESA and/or costing band;
a clear specification of the amount of conduit and trench that is common to the core and the access increments and any other utility;
a clear specification of the amount of internal sharing within the access increment, e.g. sharing between fibre and copper services;
consideration of modularity of cables to work out the optimal combination of cables of different sizes; and
a technology optimisation option for each ESA based on the total annual cost;
In terms of operating costs and indirect costs, operating to capital cost ratios and indirect operating to direct operating ratios may be used, although we suggest alternative approaches be investigated.
Regarding the core network, we do not believe the NERA model to be optimal for the same reasons as the PIE II model (see section 2.1).
In our view the way forward for the ACCC would be to create new core and access models. A new access model would be able to rely on much of the information already in the PIE II model, in particular geographical and demographical data when dimensioning the network and should be based on the principles as indicated above. In addition, it
52 NERA (1999), Estimating the Long Run Incremental Cost of PSTN Access, Final Report for ACCC,
January 1999, London 53 These are by no means complete. They are only intended to indicate a number of key principles we
believe should be followed in access network modelling. A full set of criteria or specification should be developed before modelling commences.

Competitive Carriers Coalition Comments on the ACCC Discussion paper – review of PIE II
MJA Comments on Discussion Paper FINAL PUBLIC2 / 6 July 2006
73
would be possible to include ULLS specific costs in the model and hence a more transparent treatment of these costs.
The core network model would adopt a forward-looking design incorporating NGN elements.
Ideally, both core and access network models should be together, to ensure that any overlaps in terms of sharing and costs are treated consistently. As stated in section 2.2.2 there is also the issue of how the boundary between access and core network evolves as the network is upgraded to a more forward-looking design. However, it would be possible to model each increment separately and coordinate the modelling at a later date.