commercial building electricity ... - economics...
TRANSCRIPT

Commercial Building Electricity Price Sensitivity: Pricing as a Tool for Consumption Efficiency Management
Erin Toothaker
April, 2013

2
I. Introduction
The United States accounts for 20% of world energy consumption, with a total energy consumption of 95 Quadrillion Btu in 2009. The commercial sector, including consumers such as schools, office buildings, and shopping malls, accounts for a total of 1.0 billion metric tons of energy-related CO2 emissions, with about 77% of it coming from the power plants providing the electricity used in the buildings. Commercial CO2 emissions have experienced the fastest growth of any sector since 1990, with an average annual rate of 1.1% (compared to .4% total national emissions growth). The commercial sector accounted for 19% of total U.S. energy use in 2011.1 Despite the large impact of commercial sector energy consumption and its rapid growth, existing economic research on energy consumption in the commercial sector is minimal, especially when compared with the bodies of research focused on energy consumption in the residential and transportation sectors.
A. Commercial Building Energy Consumption
Kahn, et. al. (2012), note the deficiency of this body of research in their recent paper, which seeks to evaluate factors in commercial building energy consumption. Hirst and Jackson (1977) explore broad trends in energy use in the residential and commercial sectors between 1950 and 1975, while Jafee et al. (2011) find that energy forward price curves and weather metrics are statistically significant determinants of commercial building sale prices. It has been shown in residential electricity consumption research that electricity consumption varies more directly with household demographics, in particular income and family composition, than natural gas consumption (Brounen et al., 2012). However, the determinants of commercial electricity consumption had not been evaluated prior to Kahn et al.(2012). Kahn et. al (2012) study the electricity consumption of a large sample of commercial buildings located in an urban California county, using monthly consumption data. The paper presents four main findings:
1) Larger buildings experience some economies of scale in electricity use. However, very large buildings, or those over 50,000 square feet, consume about 30 percent more electricity on average than other commercial buildings. This could be due to additional equipment requirements for heating, cooling, and lighting larger spaces with higher ceilings, or requirements to “bridge large vertical distances.”
2) Newer, high-quality buildings consume relatively more electricity on hotter days, a finding consistent with the “rebound effect” hypothesis of more efficient technology (Small and Van Dender, 2007; Davis, 2008; Greening et al., 2000). Kahn notes that because the “price” of summer temperature comfort is lower in buildings with newer, more efficient HVAC systems, tenants in new buildings may set their thermostat lower than tenants who know their building has a less efficient HVAC system. Simply put, with a more efficient HVAC system, there is a lower marginal cost of increasing comfort, so tenants facing this lower marginal cost are more likely to increase electricity use to increase comfort. Therefore,
1 EIA

3
technological progress in building quality and efficiency is partly offset by the lower marginal price of a comfortable temperature.
3) Buildings with government tenants consume more energy than buildings without government tenants. The paper finds that if a building is fully occupied by a government tenant, the energy consumption is about 38 percent higher as compared to a building with commercial tenants. They hypothesize that this is due to the “softer budget constraints” (Kornai et al, 2003) experienced by government tenants.
4) On-site building managers have a positive effect on commercial building energy efficiency, reducing consumption by 7-8%. This is explained as the positive influence on “human capital,” reflecting better building management in energy efficiency optimization.
These are very significant findings, with substantial implications for commercial building energy policy and efficiency optimization in electricity use. However, as Kahn et. al note, California has long stood out upon comparison to national electricity consumption patterns, due to its relatively modest increases in electricity consumption. Its deviation is attributed to stricter building codes, a milder climate, demographics trends and higher prices of land and resources (Charles, 2009). Thus, findings based on data from a single county of a state with somewhat anomalous electricity consumption behavior cannot be immediately applied to national policy or consumption habits. This paper evaluates these findings using a representative national sample of commercial buildings. Findings consistent with those of the analysis of this California county would imply that a broader application is appropriate, and would have national policy and consumption management implications.
B. Price Elasticity of Commercial Energy Consumption
Existing research on price elasticity of electricity demand has focused almost exclusively on household-level data (Alberini et al., 2011; Brounen et al., 2012; Costa and Kahn, 2011; Lucas, 2008; Hirst and Jackson, 1977; Koichiro, 2011; Nakajima et al., 2010). Alberini et. al. (2011) found most recently, working with nationwide household-level data, that household response to energy prices was strong, both in the short and long term. Specifically, the price elasticity of electricity demand was in the -.860 to -.667 range. Contrary to the findings of earlier literature (Metcalf and Hassett, 1999; Reiss and White, 2002), Alberini et al. (2011) found no evidence of significantly different elasticities across households, implying even greater potential for government policies for electricity pricing than were previously calculated. Nakajima and Hamori (2010) found a decrease in price elasticity of residential electricity consumers over the period between 2001 and 2008 but, even with this reduction, energy pricing has been shown to have a significant impact on energy consumption. While estimates for specific elasticities have been variable, the findings consistently support the presence of price sensitivity of electricity demand on the household level, which has significant implications for the potential use of electricity pricing as a tool for electricity demand management in the residential sector.

4
In contrast, little if any economic research has been done to evaluate the applicability of these price elasticity findings in the commercial sector. Commercial building electricity consumption, while likely determined in part by many of the same factors as household electricity consumption such as square footage and climate, is very distinct in a number of ways. For example, in an individual household, occupants may be more easily able to organize within a family or small living group to reduce electricity consumption than a commercial building housing multiple (often hundreds or thousands) of employees with varying levels of interaction. Given the rapid growth of electricity consumption in the commercial sector and the already large portion of total national electricity consumption it accounts for, further research into the potential for demand management through electricity pricing in the commercial sector is needed.
Although the data set used in Kahn et. al (2012) had very detailed, building level consumption data, provided by the utility, the paper did not evaluate price sensitivity in commercial buildings. As the consumption information was provided by a single utility, and was strictly from commercial buildings within one county of California, the electricity rates faced by each tenant would have demonstrated relatively low price variability as compared to the variability in a national sample. This research will evaluate the price sensitivity of electricity consumption in the commercial sector using a nationally distributed data set with greater price variability in order to evaluate the price sensitivity of commercial building energy consumption.
In sum, this paper seeks to further the body of literature on commercial building energy consumption in two ways. First, it seeks to evaluate the applicability of the findings of Kahn (from commercial buildings in a single county of California) to a nationally representative sample of commercial buildings. Second, it furthers this research by evaluating the role of electricity pricing in commercial building electricity consumption as it relates to the findings of Kahn and to past findings in residential electricity consumption.
II. Data
The data for this analysis were sourced from the U.S. Energy Information Association (EIA) Commercial Building Energy Consumption Survey (CBECS) in the years 2003 and 1999. In each of the two years, a sample of 5000 commercial buildings was selected as a representative national sample that could be used to estimate characteristics of the entire commercial building stock nationwide. A new sample of 5000 buildings was selected for each survey, in order to maintain a representative sample. Commercial buildings are defined as totally enclosed structure containing over 1,000 square feet of floor space and intended for human occupancy that house commercial activity. Building types surveyed include: education, food sales, food service, health care (inpatient), health care (outpatient), lodging, mercantile, office, public assembly, public order and safety, religious worship, service, warehouse and storage.
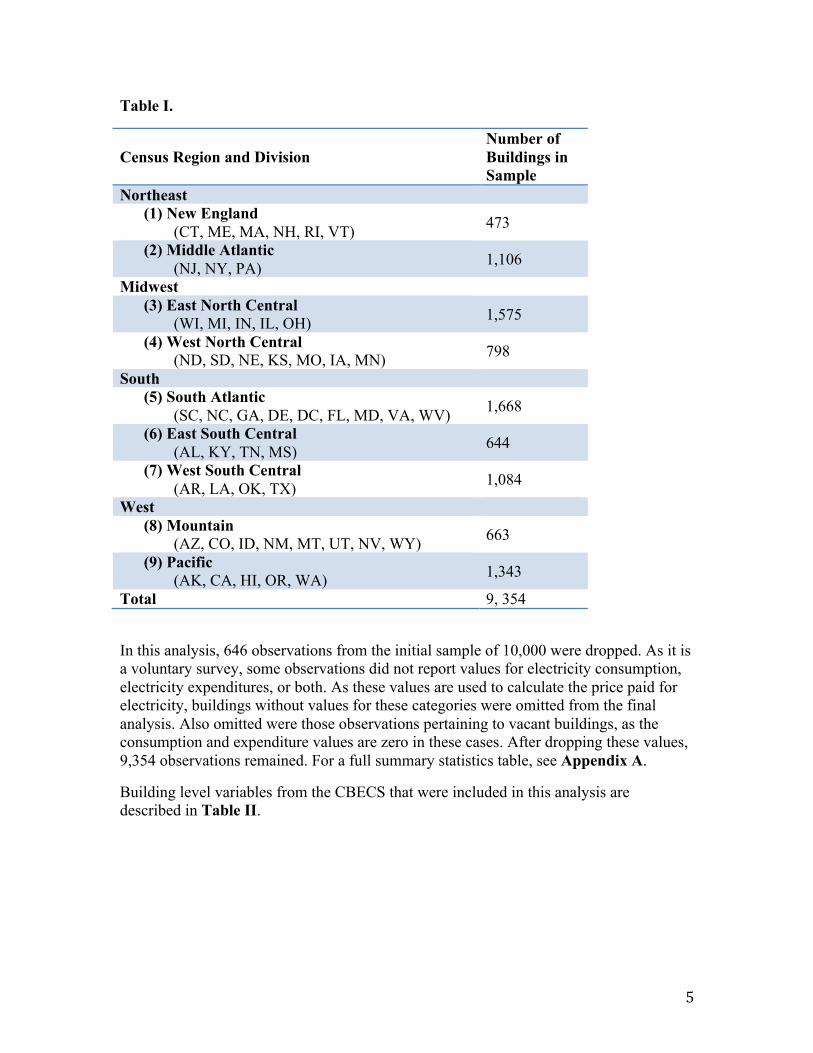
Buildings are divided into four Census Regions and subdivided into nine Census Divisions as seen in Table I.
5
Table I.
Census Region and Division Number of Buildings in Sample
Northeast (1) New England
(CT, ME, MA, NH, RI, VT) 473
(2) Middle Atlantic (NJ, NY, PA) 1,106
Midwest (3) East North Central
(WI, MI, IN, IL, OH) 1,575
(4) West North Central (ND, SD, NE, KS, MO, IA, MN) 798
South (5) South Atlantic
(SC, NC, GA, DE, DC, FL, MD, VA, WV) 1,668
(6) East South Central (AL, KY, TN, MS) 644
(7) West South Central (AR, LA, OK, TX) 1,084
West (8) Mountain
(AZ, CO, ID, NM, MT, UT, NV, WY) 663
(9) Pacific (AK, CA, HI, OR, WA) 1,343
Total 9, 354
In this analysis, 646 observations from the initial sample of 10,000 were dropped. As it is a voluntary survey, some observations did not report values for electricity consumption, electricity expenditures, or both. As these values are used to calculate the price paid for electricity, buildings without values for these categories were omitted from the final analysis. Also omitted were those observations pertaining to vacant buildings, as the consumption and expenditure values are zero in these cases. After dropping these values, 9,354 observations remained. For a full summary statistics table, see Appendix A.
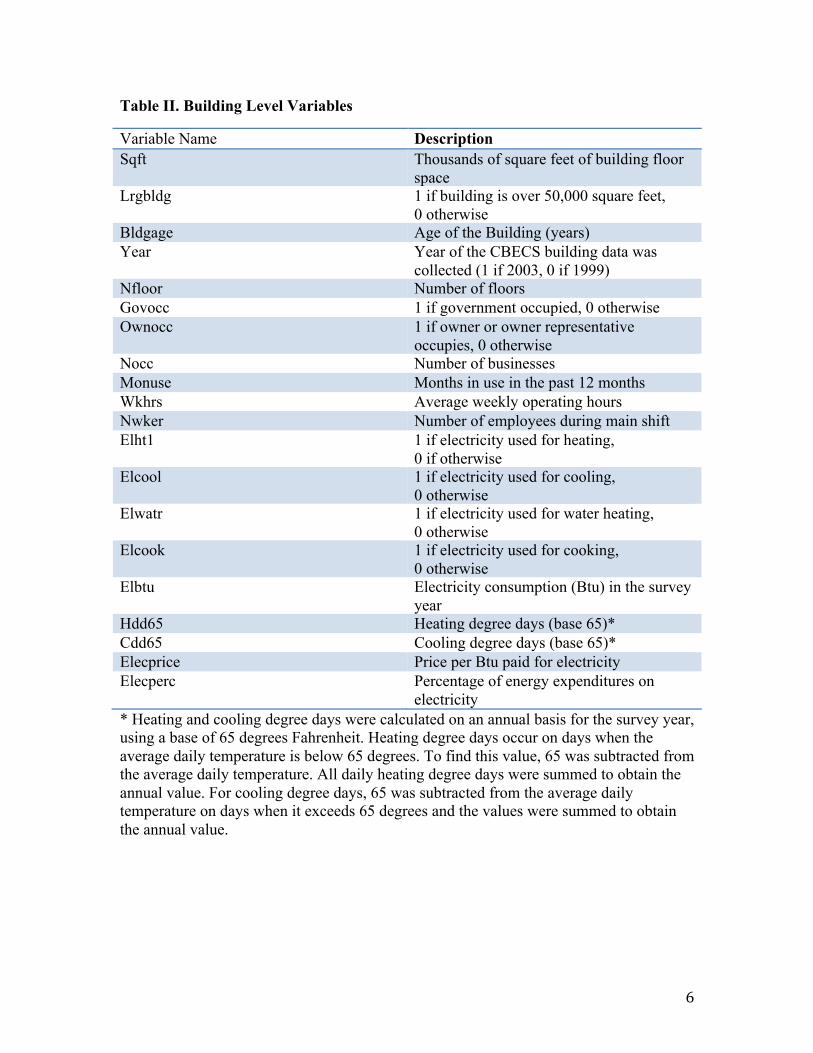
Building level variables from the CBECS that were included in this analysis are described in Table II.
6
Table II. Building Level Variables
Variable Name Description Sqft Thousands of square feet of building floor
space Lrgbldg 1 if building is over 50,000 square feet,
0 otherwise Bldgage Age of the Building (years) Year Year of the CBECS building data was
collected (1 if 2003, 0 if 1999) Nfloor Number of floors Govocc 1 if government occupied, 0 otherwise Ownocc 1 if owner or owner representative
occupies, 0 otherwise Nocc Number of businesses Monuse Months in use in the past 12 months Wkhrs Average weekly operating hours Nwker Number of employees during main shift Elht1 1 if electricity used for heating,
0 if otherwise Elcool 1 if electricity used for cooling,
0 otherwise Elwatr 1 if electricity used for water heating,
0 otherwise Elcook 1 if electricity used for cooking,
0 otherwise Elbtu Electricity consumption (Btu) in the survey
year Hdd65 Heating degree days (base 65)* Cdd65 Cooling degree days (base 65)* Elecprice Price per Btu paid for electricity Elecperc Percentage of energy expenditures on
electricity * Heating and cooling degree days were calculated on an annual basis for the survey year, using a base of 65 degrees Fahrenheit. Heating degree days occur on days when the average daily temperature is below 65 degrees. To find this value, 65 was subtracted from the average daily temperature. All daily heating degree days were summed to obtain the annual value. For cooling degree days, 65 was subtracted from the average daily temperature on days when it exceeds 65 degrees and the values were summed to obtain the annual value.

7
III. Methodology
A. Commercial Building Electricity Consumption
As is outlined in Kahn, commercial building energy consumption is determined by a number of factors. In general, larger buildings consume more energy, as increasingly large buildings will require more electricity for core building energy consumption factors such as heating, cooling, ventilation, and lighting than smaller buildings. Past research has found that larger buildings do experience some economies of scale, with the exception of “large buildings” (here defined, as in Kahn, as buildings over 50,000 square feet), which have been found to consume more energy than their smaller counterparts. Heating and cooling degree days, as well as census division dummies, were added in order to account for climate variability and regional differences. Weekly operating hours, months in use, number of workers present during the main shift, and the use of electricity for heating, cooling, cooking, and water heating were also included as explanatory variables for electricity consumption. These are grouped as “controls” in equation (1) below.
Based on the findings of Kahn, the presence of an owner or owner representative, or “human capital,” contributes to increased energy efficiency in commercial building electricity consumption. Government occupancy, according to the theory of “softer budget constraints,” has been found to increase electricity consumption. These explanatory variables are both included in the analysis.
The logarithm of electricity price was used to account for the effect of electricity price on consumption. The logarithm of the percentage of energy expenditures that are allocated to electricity was also included in order to account for higher levels of electricity consumption in buildings where electricity is used for an increased portion of energy needs (as opposed to natural gas or other energy sources). As in Kahn, the logarithm of consumption (in Btu) was used as the dependent variable.
(1) log(elbtu) = ß0 + ß1 ownocc + ß2 govocc+ ß3 log(elecprice)+
ß4 elecperc + ß5 controls + ε
Equation (1) was used to evaluate the consistency of the findings of Kahn in a nationally representative data sample. In this model, electricity price was included as an explanatory variable, although it was not directly included in the model used by Kahn due to its low variability within the California sample. In this case, the buildings surveyed were nationally distributed and purchased their electricity from many different electric utility service providers. The buildings in the dataset used in Kahn are all serviced by a single electricity provider (the source of their consumption data) and are within one urban county of California. Thus, price variation was much less dramatic than in the CBECS data used here. To account for this, log(price) was included as an explanatory variable. The coefficient on this variable describes the price elasticity of electricity demand for commercial buildings.

8
B. Price Elasticity of Commercial Energy Consumption
In order to evaluate the relative price elasticity of different sub-groups of commercial buildings, interaction terms were included between log(price) and government occupancy, owner occupancy, and the percentage of energy expenditures accounted for by electricity.
Increases in electricity price have been found to negatively impact the electricity consumption of residential electricity consumption. According to the findings of Kahn, the “soft budget constraint” of government tenants would result in government tenants demonstrating less price sensitivity than non-governmental tenants.
In buildings where electricity expenditures are a larger portion of energy costs, an increase in electricity price could be more impactful in consumption decisions, due to the increased value of reducing consumption. This implies greater price sensitivity in such buildings than in buildings in which electricity accounted for a smaller portion of energy expenditures.
Further, the presence of an owner or representative on-site has been shown to make tenants more price sensitive, as an increase in electricity price makes energy efficiency more valuable. Thus, the presence of human capital amplifies price sensitivity due to increased enforcement and awareness of consumption outcomes. As described above, an individual household may be more easily able to organize within a family or small living group to reduce electricity consumption than a commercial building housing multiple (often hundreds or thousands) of employees with varying levels of interaction. In such cases, the presence of a building manager, as described in Kahn, may be a tool for electricity demand management, and may increase price sensitivity of demand in the commercial setting.
(2) log(elbtu) = ß0 + ß1 log_price*govocc + ß2 log_price*ownocc
+ ß3 log_price*elecperc + ßn (controls)
+ ßn (explanatory variables from [1]) + ε
Equation (2) includes the explanatory variables from equation (1), including the controls, and adds the three interaction terms described above, using the logarithm of electricity price in all interaction terms.

9
IV. Results
A. Commercial Building Electricity Consumption
Overall, the explanatory variables in equation (1) were able to effectively account for much of the variation in electricity consumption, as is demonstrated by the high R-squared values of .78 and .79.2
A negative relationship between electricity price and electricity consumption was found, indicating that a one percent increase in electricity price results in a 1.227% decrease in electricity consumption (see Appendix B for complete results). This finding is consistent with past research on consumer price elasticity of consumption in the residential sector, which found a negative price elasticity of electricity consumption. Although values for price elasticity of electricity consumption in previous research have varied, the most recent residential study, found an elasticity of between -.860 and -.667 in the residential sector, based on a national sample (Alberini et al., 2011). The findings of this analysis support the conclusion that electricity demand is responsive to changes in price, and indicate that the commercial sector may be more price sensitive than the residential sector. This relationship is discussed in further detail in section (B) below.
The presence of an owner or owner representative was found to have a statistically significant negative correlation with electricity consumption, which is consistent with the findings of Kahn. The presence of “human capital” in commercial buildings was found to decrease electricity consumption by about 6.7% as compared to those buildings without a manager on-site. This value is very comparable to the 7.8% reduction found in Kahn, and supports the finding that building managers result in more efficient electricity consumption in the commercial sector. Government occupancy was found to have a statistically significant positive correlation with electricity consumption, which is also consistent with the findings in Kahn. A government tenant is found to consume about 45.5% more electricity than a non-government tenant, which is again very comparable to the 38% found in the Kahn study. This supports the “soft budget constraint” hypothesis of Kornai et al. (2003).
Large buildings are found to consume more electricity, while controlling for building characteristics, than their smaller counterparts. Specifically, buildings over 50,000 square feet are found to consume 63% more electricity than their smaller counterparts, compared to 30% as found in Kahn, which could be due to the increased electricity requirements of temperature and lighting systems for buildings with higher ceilings or more open space. In this sample, the difference between these two values could be due to differences in uses for large commercial buildings in a given county of California as compared to the nation as a whole. For example, the buildings in the
2 This section focuses on an interpretation and brief discussion of the findings relevant to price elasticity and to the findings of Kahn et al. (2012), using the results from equation (1) in Appendix B. For a discussion of the findings concerning the controls used in this equation, see Appendix D, which refers to the complete results of equation (1) as presented in Appendix B.

10
California county within the “large building” size range may be more concentrated within a specific industry or type of commercial building than the national sample. Different uses, such as manufacturing, storage, and education will consume at different levels, and commercial building types within a single county can be expected to be less diverse than on a national level. Although the size of the effect is different, the electricity consumption implication is the same: very large buildings do not experience the economies of scale experienced by increases in size in more moderately sized commercial buildings.
Building age was found to be positively correlated with consumption, providing further support for the existence of a technological “rebound effect.” Specifically, a one-year increase in building age was found to increase consumption by .5 to 1.2%, which is consistent with the findings of Kahn.3
B. Price Elasticity of Commercial Energy Consumption
Equation (2) was used to evaluate the marginal effects of electricity pricing on buildings occupied by government tenants (log_price*gov) and buildings with a manager present (log_price*ownocc). It was also used to evaluate the relationship between the percentage of energy expenditures accounted for by electricity (log_price*elecperc) and elasticity. The coefficient on log_price*elecperc was found to be positive, however the large standard error does not allow for a definite determination of the sine of the coefficient. Significant coefficients are found for both log_price*govocc and for log_price*ownocc, which are discussed here in detail. Full results of equation (2) can be found in Appendix C.
Table III. Electricity Consumption (Btu)
Rather than comparing coefficient values, expected electricity consumption values were calculated at three electricity price levels. The price levels used were mean price (x̄), mean price plus one standard deviation (x̄ + s), and mean price minus one standard deviation (x̄ - s). Expected consumption values were calculated for government tenants and for non-government tenants in order to compare relative price elasticities of the two groups. The same was done for owner-occupied buildings and non-owner-occupied buildings. The results are listed in Table III.
3 Kahn et al. (2012) used dummy variables to create building age categories spanning ten-year periods, and presented the findings in the form of a graph (see Figure I) which indicated that newer buildings were more sensitive to temperature shocks (i.e. demonstrate greater increases in electricity consumption on very hot and/or cold days). Therefore, although the values from this research are not directly comparable, they do in fact support the directionality of previous findings at a statistically significant level.

11
Table III. Electricity Consumption (Btu)
Electricity Price
Govocc Non-govocc Ownocc Non-ownocc
Pelec = (x̄ - s) 3,453,493 2,563,577 2,820,570 2,886,169 Pelec = x̄ 2,401,147 1,631,742 1,714,961 1,837,075 Pelec = (x̄ + s) 1,669,471 1,038,620 1,042,729 1,169,316
Government tenants were shown to be less price sensitive than non-government tenants, with government occupancy having a negative marginal effect on consumption reduction in response to electricity price increases. Specifically, when the electricity price is increased by one standard deviation from the mean price, 2.53 cents/Btu, to 3.9 cents/Btu, expected electricity consumption of government tenants decreased by 30.5% while expected non-governmental tenant consumption decreased by 36.4%. In other words, non-government tenants reduce electricity consumption by about 6% more than government tenants in response to a one-quartile increase in electricity price. In Figure II, expected consumption is graphed for government and non-government tenants. Government consumption is higher at all price values, with a more gradual slope (reduction in consumption) in response to price increases. In terms of elasticity, government tenants demonstrated a price elasticity of electricity demand of about -.77, while non-government tenants demonstrated an elasticity of about -.92.
Figure I.
1,000,000.00
1,500,000.00
2,000,000.00
2,500,000.00
3,000,000.00
3,500,000.00
(x̄ -‐ σ) x̄ (x̄ + σ)
Electricity Consumption
(Btu)
Electricity Price
Govocc
Non-‐govocc

12
Log_price*ownocc was also found to have a statistically significant coefficient of negative .126, indicating that owner occupancy can be expected to increase price sensitivity of electricity demand in commercial buildings. A one standard deviation increase in electricity price decreased expected electricity consumption by 39.2% in buildings with on-site managers compared to a smaller 36.3% decrease in electricity consumption in buildings without an owner representative on-site. In other words, owner occupied commercial buildings demonstrated a price elasticity of -.99, while buildings without an on site manager demonstrated an elasticity of about -.91.
This difference in price elasticities can be seen as the difference in slopes between the ownocc and non-ownocc lines in Figure III, with owner-occupied buildings demonstrating more price elastic expected consumption than buildings without a manager on site. This 3% difference in consumption reduction would be equivalent to a 242,830 Btu reduction in electricity consumption for the average commercial building. When combined with the already significant impact of the presence of a building manager in consumption reduction, this marginal effect indicates that the presence of building managers increase awareness of energy prices and consumption levels, making commercial buildings more responsive to price increases commercial electricity prices.
Figure II.
1,000,000.00
1,200,000.00
1,400,000.00
1,600,000.00
1,800,000.00
2,000,000.00
2,200,000.00
2,400,000.00
2,600,000.00
2,800,000.00
3,000,000.00
(x̄ -‐ σ) x̄ (x̄ + σ)
Electricity Consumption
(Btu)
Electricity Price
Ownocc
Non-‐ownocc

13
V. Discussion
In consideration of the large (and growing) share of national energy consumption accounted for by the commercial sector, and its rapid growth in carbon emissions due in large part to electricity production, the lack of existing research directed towards this sector is remarkable. Prior to the study by Kahn, existing research had only peripherally evaluated commercial electricity consumption habits and had avoided completely the topic of price elasticity in the commercial sector. This analysis, in combination with the research of Kahn, provides very applicable information for use in policy decisions regarding electricity pricing in the commercial sector and electricity consumption efficiency optimization.
The findings of Kahn are supported and broadened in their scope of applicability by this research. The positive correlation between building age and consumption implies that commercial building electricity consumption will continue to increase with time due to the growing number of commercial buildings and to the increasing electricity demands of newly constructed buildings. This suggests, as noted by Kahn, that future energy policies must focus more explicitly on the commercial sector in order to manage this growth. The increased energy demands of very large commercial buildings are also an important consideration. They indicate that commercial buildings, although they have been found to experience some economies of scale in electricity demand due to increased building size, become less energy efficient once they reach a certain size threshold. This suggests that better consciousness, and management, of the effects of building size on energy efficiency could allow commercial buildings to achieve higher energy efficiency standards.
The findings of this analysis further suggest that electricity pricing in the commercial sector could be used as an effective tool for electricity consumption management and therefore CO2 emission management in the commercial sector. More specifically, the presence of human capital in the form of a building manager has the potential to increase the effectiveness of electricity consumption management policies, especially through price manipulation. The knowledge that government tenants typically consume more electricity, and are less price sensitive, is valuable in the context of both policy and managerial procedures. It implies that government tenants have the potential to achieve large efficiency gains in electricity use, due to their disproportionately inefficient consumption tendencies. One tool for efficiency management in this subcategory of commercial buildings could be the installation of a building manager, or the designation of an on site monitor of electricity consumption, as was demonstrated here and in Kahn. Further research is necessary in the fields of commercial building energy use and price elasticity of commercial electricity demand, but the findings presented here serve to demonstrate the potential for large efficiency gains through both electricity consumption and price management in the commercial sector.

14
V. References
Alberini, Anna, Will Gans, and Daniel Velez-Lopez. "Residential Consumption Of Gas And Electricity In The U.S.: The Role Of Prices And Income." Energy Economics 33.5 (2011): 870-881. EconLit. Web. 16 Apr. 2013.
Alberini, Anna and Massimo Filippini. “Response of Residential Electricity Demand to Price: The Effect of Measurement Error.” Center for Energy Policy and Economics, Swiss Federal Institues of Technology (2010).
Barkatullah, Nadira. “OLS and Instrumental Variable Price Elasticity Estimates for Water in Mixed-Effect Models Under a Multipart Tariff Structure.” RePEc: Research Papers in Economics, London Economics (2002).
Brounen, Dirk; Nils Kok and John M. Quigley. 2012. "Residential Energy Use and Conservation: Economics and Demographics." European Economic Review, 56(5), 931- 45.
Charles, Dan. 2009. "Leaping the Efficiency Gap." Science, 325(5942), 804-11.
Costa, Dora L. and Matthew E. Kahn. 2011. "Electricity Consumption and Durable Housing: Understanding Cohort Effects." American Economic Review, 101(3), 88-92.
Davis, Lucas W. 2008. "Durable Goods and Residential Demand for Energy and Water: Evidence from a Field Trial." RAND Journal of Economics, 39(2), 530-46.
DiPietro, Joseph. "Investigation into California's Residential Electricity Consumption." National Energy Technology Laboratory (2009).
Eichholtz, Piet M.A.; Nils Kok and John M. Quigley. 2010. "Doing Well by Doing Good? Green Office Buildings." American Economic Review, 100(5), 2494–511.
Giles, David E. “Interpreting Dummy Variables in Semi-logarithmic Regression Models: Exact Distributional Results.” Department of Economics, University of Victoria. January, 2011.
Glaeser, Edward L. and Matthew E. Kahn. 2010. "The Greenness of Cities: Carbon Dioxide Emissions and Urban Development." Journal of Urban Economics, 67(3), 404- 18.
Greening, Lorna; David L. Greene and Carmen Difiglio. 2000. "Energy Efficiency and Consumption—the Rebound Effect—a Survey." Energy Policy, 6, 389-401.
Hirst, Eric and Jerry Jackson. 1977. "Historical Patterns of Residential and Commercial Energy Uses." Energy, 2(2), 131-40.
Jacobsen, Grant D. and Matthew J. Kotchen. in press. "Do Building Energy Codes Matter? Evidence from Florida." Review of Economics and Statistics.
15
Jaffee, Dwight; Richard Stanton and Nancy Wallace. 2012. "Energy Factors, Leasing Structure and the Market Price of Office Buildings in the U.S.," AREUEA Annual Meeting. Chicago:
Koichiro, Ito. 2011. "Do Consumers Respond to Marginal or Average Price? Evidence from Nonlinear Electricity Pricing," Working Paper. Stanford,
Kornai, Janos; Eric Maskin and Gerard Roland. 2003. "Understanding the Soft Budget Constraint." Journal of Economic Literature, 41(4), 1095-136.
Nakajima, Tadahiro & Hamori, Shigeyuki, 2010. "Change in consumer sensitivity to electricity prices in response to retail deregulation: A panel empirical analysis of the residential demand for electricity in the United States," Energy Policy, Elsevier, vol. 38(5), pages 2470-2476, May.
Reiss, Peter C., and Matthew W. White. "Household Electricity Demand, Revisited." (2002): EconLit. Web. 17 Apr. 2013.
Reiss, Peter C. and Matthew W. White. 2005. "Household Electricity Demand, Revisited." Review of Economic Studies, 72(3), 853-83.
Scofield, John H. 2009. "Do Leed-Certified Buildings Save Energy? Not Really..." Energy and Buildings, 41, 1386-90.
Small, Kenneth A. and Kurt Van Dender. 2007. "Fuel Efficiency and Motor Vehicle Travel: The Declining Rebound Effect." Energy Journal, 28, 25-51.

16
Appendix A: Summary Statistics
Variable Obs Mean Std. Dev. Min Max
elbtu 9354 8,094,344 2.32e+7 116 6.63e+8 sqft (thousands) 9354 125.43 268.78 1 1,800 bldgage 9354 33.09 27.86 1 319 nfloor 9354 3.29 4.82 1 30 monuse 9354 11.72 1.20 1 12 wkhrs 9354 80.41 47.70 1 168 nwker 9354 2025 649.0 1 8250 elht1 9354 0.28 0.45 0 1 elcool 9354 0.87 0.33 0 1 elwatr 9354 0.40 0.49 0 1 elcook 9354 0.19 0.40 0 1 hdd65 9354 4,259.35 2,137.59 3 11,665 cdd65 9354 1,320.88 966.06 1 5,904 lrgbldg 9354 0.39 0.49 0 1 govown 9354 0.21 0.41 0 1 ownocc 9354 0.61 0.49 0 1 elecprice ($/Btu) 9354 0.025 0.014 0.0054 0.89 elecperc 9354 0.78 0.21 0.0037 1

17
Appendix B: Regression Results Equation (1)
(1a) (1b) logprice -1.227 -1.581 (0.032)** (0.035)** logelecperc 0.829 0.856 (0.033)** (0.032)** sqft 0.001 0.001 (0.000)** (0.000)** bldgage -0.005 -0.005 (0.000)** (0.000)** nfloor 0.054 0.049 (0.003)** (0.003)** monuse 0.077 0.074 (0.009)** (0.009)** wkhrs 0.008 0.008 (0.000)** (0.000)** nwker 0.001 0.001 (0.000)** (0.000)** elht -0.083 -0.076 (0.027)** (0.026)** elcool 0.477 0.488 (0.033)** (0.032)** elwatr -0.002 -0.013 (0.023) (0.023) elcook 0.319 0.329 (0.028)** (0.027)** hdd65 0.000 0.000 (0.000)** (0.000)** cdd65 0.000 0.000 (0.000)** (0.000) lrgbldg 1.795 1.718 (0.027)** (0.026)** govocc 0.375 0.359 (0.027)** (0.027)** ownocc -0.069 -0.073 (0.022)** (0.022)**
2.cendiv 0.055 (0.055) 3.cendiv -0.410 (0.054)** 4.cendiv -0.715 (0.061)** 5.cendiv -0.645 (0.062)** 6.cendiv -0.814

18
(0.069)** 7.cendiv -0.853 (0.068)** 8.cendiv -0.673 (0.064)** 9.cendiv -0.340
(0.066)** Constant 6.776 6.053 (0.156)** (0.177)** R2 0.78 0.79 N 9,354 9,354
* p<0.05; ** p<0.01

19
Appendix C: Commercial Building Energy Consumption (Dependent Variable: Logarithm of Electricity Consumption)
(1) (2) Log(elecprice) -1.227 -1.243 (0.032)** (0.063)** Govocc 0.375 1.297 (0.027)** (0.271)** Log_price*govocc 0.243 (0.071)** Ownocc -0.069 -0.541 (0.022)** (0.230)* Log_price*ownocc -0.126 (0.061)* Log(elecperc) 0.829 1.051 (0.033)** (0.258)** Log_price*log_elecperc 0.062 (0.069) Constant 6.776 6.712 (0.156)** (0.251)** R2 0.78 0.78 N 9,354 9,354
20
Appendix D: Control Coefficients
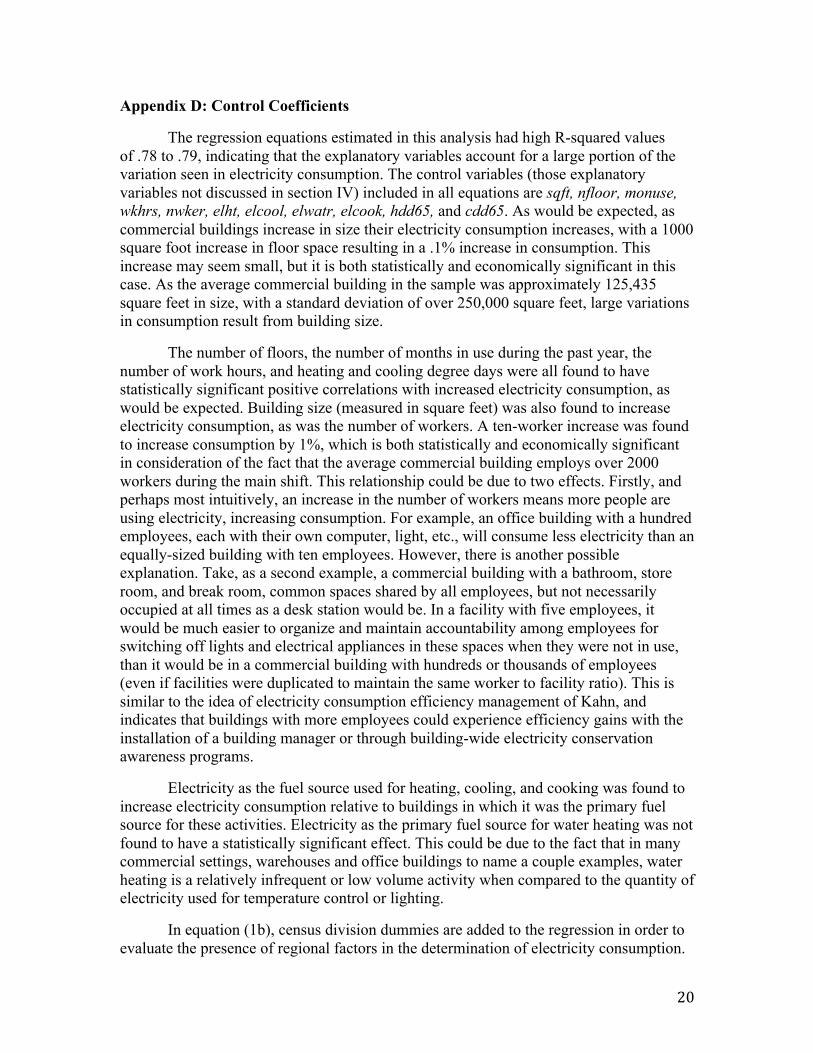
The regression equations estimated in this analysis had high R-squared values of .78 to .79, indicating that the explanatory variables account for a large portion of the variation seen in electricity consumption. The control variables (those explanatory variables not discussed in section IV) included in all equations are sqft, nfloor, monuse, wkhrs, nwker, elht, elcool, elwatr, elcook, hdd65, and cdd65. As would be expected, as commercial buildings increase in size their electricity consumption increases, with a 1000 square foot increase in floor space resulting in a .1% increase in consumption. This increase may seem small, but it is both statistically and economically significant in this case. As the average commercial building in the sample was approximately 125,435 square feet in size, with a standard deviation of over 250,000 square feet, large variations in consumption result from building size.
The number of floors, the number of months in use during the past year, the number of work hours, and heating and cooling degree days were all found to have statistically significant positive correlations with increased electricity consumption, as would be expected. Building size (measured in square feet) was also found to increase electricity consumption, as was the number of workers. A ten-worker increase was found to increase consumption by 1%, which is both statistically and economically significant in consideration of the fact that the average commercial building employs over 2000 workers during the main shift. This relationship could be due to two effects. Firstly, and perhaps most intuitively, an increase in the number of workers means more people are using electricity, increasing consumption. For example, an office building with a hundred employees, each with their own computer, light, etc., will consume less electricity than an equally-sized building with ten employees. However, there is another possible explanation. Take, as a second example, a commercial building with a bathroom, store room, and break room, common spaces shared by all employees, but not necessarily occupied at all times as a desk station would be. In a facility with five employees, it would be much easier to organize and maintain accountability among employees for switching off lights and electrical appliances in these spaces when they were not in use, than it would be in a commercial building with hundreds or thousands of employees (even if facilities were duplicated to maintain the same worker to facility ratio). This is similar to the idea of electricity consumption efficiency management of Kahn, and indicates that buildings with more employees could experience efficiency gains with the installation of a building manager or through building-wide electricity conservation awareness programs.
Electricity as the fuel source used for heating, cooling, and cooking was found to increase electricity consumption relative to buildings in which it was the primary fuel source for these activities. Electricity as the primary fuel source for water heating was not found to have a statistically significant effect. This could be due to the fact that in many commercial settings, warehouses and office buildings to name a couple examples, water heating is a relatively infrequent or low volume activity when compared to the quantity of electricity used for temperature control or lighting.
In equation (1b), census division dummies are added to the regression in order to evaluate the presence of regional factors in the determination of electricity consumption.

21
The addition of the census division values did not change the sine or significantly change the coefficients of the explanatory variables, nor did it appreciably change the R-squared value of the regression. However, the dummy variable coefficients for all census divisions except the North Atlantic were found to be statistically significant negative coefficients relative to the New England control group. This could be due to changes in factors not included or related to those in the model, or to some non-linearity in the model. As the addition of census division controls did not appreciably change the estimated results of the consumption function coefficients, their coefficients are largely unimportant within the context of this research.