commercial lighting market transformation ... - energy trust
TRANSCRIPT
Commercial Lighting Market
Transformation Model Development
and Market Research
Phase I: T12 Retrofit and Replacement
Market
Presented to
Energy Trust of Oregon
Final Report September 8, 2011
Presented by
Navigant Consulting, Inc.
1375 Walnut St., Suite 200
Boulder, CO 80302
phone 303.728.2500
fax 303.728.2501
www.navigant.com
Submitted to:
Energy Trust of Oregon
Attention: Phil Degens
851 SW Sixth Avenue, #1200
Portland, OR 97204
503.493.8888
Submitted by:
Navigant Consulting, Inc.
1375 Walnut St., Suite 200
Boulder, CO 80302
303.728.2500
Prepared by:
Robin Maslowski, Senior Consultant
303.728.2518
Kevin Cooney, Managing Director
303.728.2510
Page i Final Report – Phase I
Table of Contents
1 Executive Summary ..............................................................................................2
2 Introduction ...........................................................................................................8
2.1 Focus of Phase I Report ............................................................................................................. 8 2.2 Market Characterization ............................................................................................................ 9 2.3 Research Objectives .................................................................................................................. 13 2.4 Report Structure ....................................................................................................................... 13
3 Methods ................................................................................................................14
3.1 Secondary Data Review ........................................................................................................... 14 3.2 Baseline Data Collection .......................................................................................................... 15 3.3 Research on Federal Standard Change Savings ................................................................... 16 3.4 Research on Market Activity for High Performance T8 Fixtures....................................... 17 3.5 Research on Market Activity for Low Wattage T8 Fixtures ............................................... 17 3.6 Market Transformation Model Development ...................................................................... 18
4 Findings and Results ..........................................................................................20
4.1 Influence of Energy Trust Program on High Performance T8 Market Penetration ........ 20 4.2 Influence of Energy Trust on the Federal Standard Change .............................................. 21 4.3 High Performance T8 Energy Trust Program Units ............................................................ 24 4.4 High Performance T8 Baseline Units ..................................................................................... 26 4.5 High Performance T8 and Compliant T12 Market Units .................................................... 29 4.6 Total Retrofit/Standard-Driven Replacement Market Units .............................................. 32 4.7 Low Wattage T8 Fixtures ........................................................................................................ 36 4.8 Other Findings on the Overall Commercial Lighting Market ............................................ 40 4.9 Model Development and Model Results ............................................................................... 41
5 Summary and Recommendations ....................................................................50
Appendix A: Lists of Interviewees and Interview Guides ...................................................53
Federal Standard Change Interviewees ............................................................................................................. 53 Distributor Interviewees ...................................................................................................................................... 53 Interview Guide for Organizations – Final Version (June 28, 2010) .............................................................. 55 Interview Guide for Distributors – Final Version (June 28, 2010) .................................................................. 58
Appendix B: Baseline Data Sources Considered ....................................................................62
Page 2 Final Report – Phase I
1 Executive Summary
In 2003, the Energy Trust of Oregon (Energy Trust) began a Commercial Lighting Energy Efficiency
program for lighting retrofits with high performance T8 fixtures in existing commercial buildings.
Navigant’s Commercial Lighting Market Transformation Model Development and Market Research
found that the Energy Trust’s commercial lighting program may result in approximately 18 aMW of
energy savings through future market transformation effects. Starting in 2013, Navigant recommends that
the Energy Trust receive market transformation credit for these energy savings as a result of the
proportional1 influence of the Energy Trust’s high performance T8 program on accelerating the upcoming
federal standard change for commercial fluorescent lamps.2 Although the federal standard takes effect in
July of 2012, these savings would be claimed beginning in 2013 after the existing stock of T12s have been
depleted, and would cumulate through 2017. It is assumed the federal standard would have changed in
2017 without the influence of voluntary incentive programs, like the Energy Trust’s.
This report, herein referred to as Phase I, discusses market transformation as it relates to replacement of
T12 bulbs with high performance T8 bulbs and T8 ballasts. To date, T12 retrofits with high performance
T8s have been the most significant source of energy savings achieved by the Energy Trust’s linear
fluorescent retrofit program.3 Phase I of the commercial lighting research does not address retrofit of
standard T8 fixtures with high performance T8 lamps and ballasts due to the historically low program
activity for this activity and the market’s dependency on an upcoming ballast standard change that is
scheduled for 2014.
While the research and discussion focuses on T12s replacement with high performance T8s, the energy
savings presented in Phase I represent a conservative view of how the market will respond to the
upcoming federal lamp standard change scheduled for 2012. The federal lamp standard was designed to
ban the sale of lamps less efficient than high performance T8s; however, there are now lamps available to
consumers that comply with the standard, but do not save as much energy as retrofitting a standard T8 or
T12 fixture with a high performance T8 fixture.4 This report only attributes market transformation
savings for the least efficient T12 retrofit option available to consumers, which is to maintain an existing
electronic T12 ballast and replace the T12 lamps (standard T12s) with newly-developed T12 lamps that
comply with the federal standard change (compliant T12s).
1 These savings are proportional to the Energy Trust’s service territory, such that no savings are being claimed
outside of the Energy Trust’s market.
2 Energy Conservation Standards and Test Procedures for General Service Fluorescent Lamps and Incandescent
Reflector Lamps; Final Rule, Federal Register, 74 FR 34080, July 14, 2009.
3 Navigant and Energy Trust found that high intensity discharge (HID) lighting comprises a significant portion of the
savings for high performance T8 retrofits through the Energy Trust’s commercial lighting program; however, these
technologies, which typically serve high bay applications, represent a different set of market drivers and influences
than the low bay linear fluorescent retrofit market. This report does not address HID retrofits.
4 For existing T12 fixtures, compliant T12 lamps are available that can be installed with a customer’s existing T12
ballast for less than half of the energy savings produced by replacing the existing T12 fixture with a high
performance T8 fixture. In the case of existing T8 fixtures, customers can install a high performance T8 lamp with
their existing T8 ballast, which results in greater light output from the fixture, but no energy savings.
Page 3 Final Report – Phase I
The Energy Trust plans to revisit these savings estimates for Phase II when the Department of Energy
(DOE) releases details on the 2014 federal ballast standard change, since there may be additional market
transformation savings attributable to the Energy Trust’s commercial lighting program if the 2014 federal
ballast standard bans T12 or standard T8 ballasts. Energy Trust also intends to conduct a market tracking
study in the next two years to determine what customers actually purchase and to adjust the estimated
Phase I savings based on the actual future market size and the Energy Trust’s 2011-2012 program activity.
Research findings suggest that Energy Trust’s program had influence with the Consortium for Energy
Efficiency (CEE) and other stakeholders responsible for accelerating the timing of the upcoming linear
fluorescent federal lamp standard change. Key research questions included whether these entities
collectively influenced the standard change and if Energy Trust was instrumental in that collective
influence. Navigant found sufficient evidence that Energy Trust should receive credit for at least
proportional influence of the federal standard change, equivalent to the Energy Trust’s portion of the
Oregon market. Energy Trust’s actions that support this finding include:
working with CEE from the beginning to develop the initial specifications for high performance
T8 lighting in 2003,
having an overt goal to support high performance T8s from the time that CEE adopted the
specification,
being first in the Pacific Northwest region to support the CEE definition of high performance T8s,
and
working with regional distributors to ensure proper application of the technology.
Without voluntary incentive programs like Energy Trust’s, Navigant found that the federal standard
would likely not have changed to an equivalent efficiency level until the next scheduled DOE standard
change in 2017.
While Energy Trust has clearly influenced the Trade Allies involved in Energy Trust’s incentive program,
this research found no conclusive evidence to suggest that the commercial lighting retrofit market for
high performance T8s has been transformed in Energy Trust’s service territory prior to the impending
Federal standard. The savings are primarily occurring within Energy Trust’s program.
This analysis quantified several components of the high performance T8 market for T12 retrofits,
including:
the market activity through the Energy Trust’s program;
the total market for T12 fixtures replaced by or converted to high performance T8s, including the
Energy Trust’s program activity, high performance T8 retrofits prior to the federal standard
change that were not directly incented by the program,5 and T12 replacements driven by the
standard change (standard-driven replacements) after the Energy Trust’s program ends;
the baseline market activity, representing the high performance T8 market for T12 retrofits which
have and will occur without the influence of the Energy Trust’s program; and
5 Navigant did not find evidence that high performance T8 retrofits are occurring outside of the Energy Trust’s
program, which would indicate market transformation prior to the standard change, so this portion of the market is
reported as zero.
Thus, no market transformation savings are reported prior to the federal standard change.

Page 4 Final Report – Phase I
the total market for T12 retrofits and standard-driven T12 replacements, including the total
market for retrofits with high performance T8s and standard T8s.
Figure 1 shows the analysis results for the market components in terms of the number of fixtures sold for
retrofit projects and standard-driven T12 replacements each year.
Figure 1. Commercial Lighting Market Transformation Model Results: Number of T12 Fixtures
Retrofit with Standard T8s, Retrofit with High Performance T8s, and Replaced by Compliant T12s in
Energy Trust’s Service Territory
See Figure 13 for an enlarged image.
Source: Navigant Consulting, Inc. Commercial Lighting Market Transformation Model.
Table 1 presents the energy savings estimated for each market component, as well as the total market
transformation savings attributable to the Energy Trust’s program. The energy savings for the standard-
driven T12 replacements represent the energy savings from T12 replacements with compliant T12s, rather
than high performance T8s, to reflect the least efficient option available to customers.
Navigant estimates that high performance T8s now represent more than 70 percent of T12
retrofits, with the other portion of the T12 retrofits market captured by standard T8s.

Page 5 Final Report – Phase I
Table 1. Commercial Lighting Market Transformation Savings for Each Market Aspect
Year
Energy Savings (aMW)
HPT8
Baseline
Energy
Trust HPT8
Program
HPT8
Market
Compliant
T12 Market
Market Savings
Attributable to
Energy Trust
2002 - - - 0
2003 - 0.0 0.0 0
2004 0.0 0.4 0.4 0
2005 0.1 0.3 0.3 0
2006 0.1 0.2 0.2 0
2007 0.1 0.7 0.7 0
2008 0.2 0.7 0.7 0
2009 0.3 1.6 1.6 0
2010 0.4 1.7 1.7 0
2011 0.5 1.9 1.9 0
2012 0.6 1.9 1.9 0
2013 0.6 4.4 3.7
2014 0.7 4.4 3.7
2015 0.8 4.4 3.6
2016 0.8 4.4 3.5
2017 0.9 4.4 3.5
2018 7.5 7.5 0.0
Total 18.0
aMW = MWh / 8760 hours per year. MWh savings calculated using an average savings of 247 kWh/fixture for T12 to
high performance T8 retrofits and 144 kWh/fixture for standard T12s replaced with compliant T12s. Energy savings calculated using an assumed annual 3,765 hours of operation. See footnotes 57 and 58 for discussion
on assumptions. Numbers do not add due to rounding. Source: Navigant Consulting, Inc. Commercial Lighting
Market Transformation Model.
Navigant estimates that the Energy Trust’s program will ultimately be responsible for retrofitting about
60 percent of the T12 fixtures in the Energy Trust’s territory with high performance T8s between 2002 and
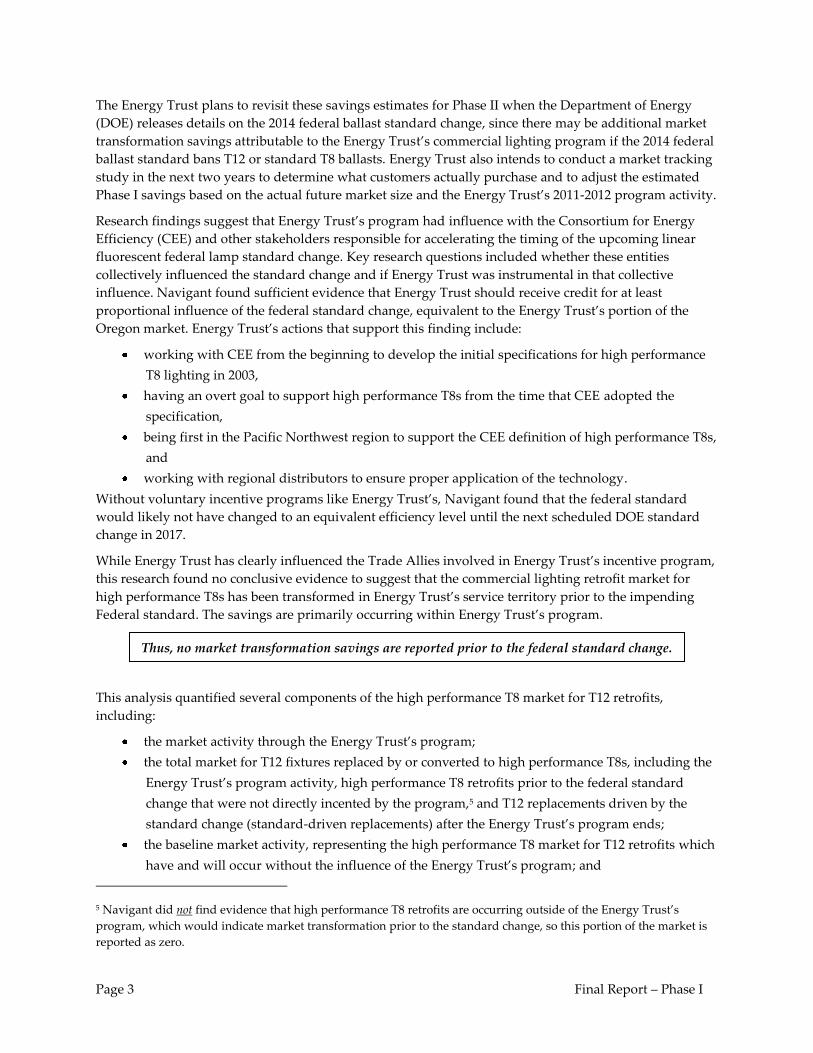
2012. The analysis results suggest that all standard T12 fixtures will be removed from the region by mid-
2018 through replacements with either standard T8, high performance T8 fixtures, or compliant T12s.
Figure 2 shows the predicted decline in installed standard T12 stock due to T12 retrofit projects through
the Energy Trust’s program until 2012 and replacements due to the federal standard change after 2012.
Page 6 Final Report – Phase I
Figure 2. Estimated Stock of Installed Standard T12s and the Number of Standard T12s Removed from
the Market Each Year
Source: Navigant Consulting, Inc. Commercial Lighting Market Transformation Model.
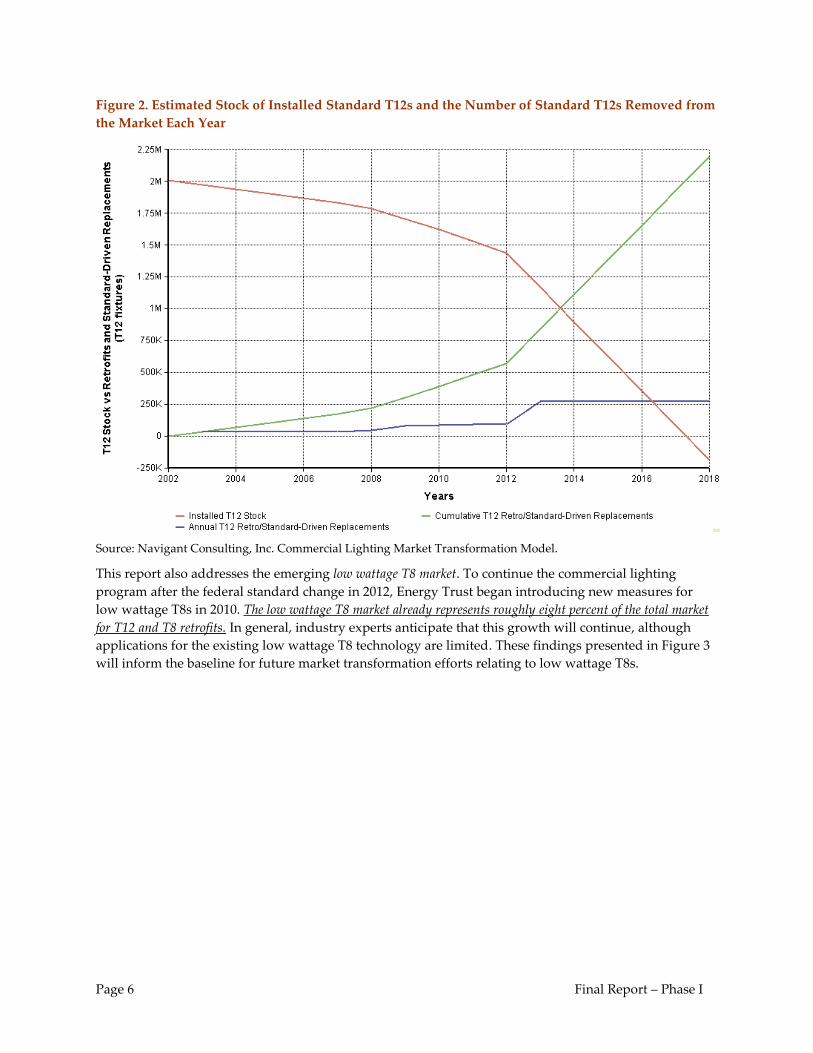
This report also addresses the emerging low wattage T8 market. To continue the commercial lighting
program after the federal standard change in 2012, Energy Trust began introducing new measures for
low wattage T8s in 2010. The low wattage T8 market already represents roughly eight percent of the total market
for T12 and T8 retrofits. In general, industry experts anticipate that this growth will continue, although
applications for the existing low wattage T8 technology are limited. These findings presented in Figure 3
will inform the baseline for future market transformation efforts relating to low wattage T8s.
Page 7 Final Report – Phase I
Figure 3. Estimated Baseline and Program Market Penetration of Low Wattage T8s
Source: Navigant Consulting, Inc. Commercial Lighting Market Transformation Model.
Page 8 Final Report – Phase I
2 Introduction
The Energy Trust of Oregon (Energy Trust) provides incentives for energy efficient lighting to
commercial customers of Portland General Electric (PGE) and Pacific Power (PAC). Energy Trust began
the commercial lighting program in 2002 with incentives for high performance T8 (HPT8) lamps. Energy
Trust will continue to support high performance T8s at least until a federal standard change in 2012 for
lamps and a federal standard change in 2014 for ballasts. To continue the commercial lighting program
after the federal standard change, Energy Trust introduced new incentives for low wattage T8s (LWT8) in
2010 and is contemplating additional measures. The Energy Trust high efficiency commercial lighting
program aims to increase the market share of efficient lighting not only through direct incentives, but also
through a transformation of the market.
Market transformation projects are typically long-term in nature with little market impact in the initial
years and the major market effects occurring many years after a program is launched. The development
and launching of new products and services can often be visualized as an “S” shaped diffusion curve.
This “S” shape can be discerned in the results of the high efficiency commercial lighting market shown in
Figure 1.
Navigant/Summit Blue Consulting, LLC completed the Gas Furnace Market Transformation Model and
Market Research in June 2009 and the Air Source Heat Pump Market Transformation Model and Market
Research in December 2009. The commercial lighting model is the third in a series of models that
Navigant is developing for the Energy Trust to estimate the market transformation effects of Energy Trust
programs that are above the impacts achieved through direct program incentives.
2.1 Focus of Phase I Report
This report represents the first phase of the commercial lighting market transformation research and
focuses on market transformation of the market for T12 retrofits with high performance T8s. To date, T12 retrofits
with high performance T8s have been the most significant source of energy savings achieved by the
Energy Trust’s linear fluorescent retrofit program.6 Phase I of the commercial lighting research does not
address the T8 retrofit market due to the historically low program activity for T8 retrofits with high
performance T8s and the market’s dependency on an upcoming ballast standard change that is scheduled
for 2014.
The original goal for this research was to investigate the influence of Energy Trust’s high performance T8
program on the commercial lighting retrofit market and the upcoming federal lamp standard change in
2012. Since research began in early 2010, a number of changes have occurred in the commercial lighting
market that altered the scope of this research. Most importantly, the federal lamp standard was intended to
ban the sale of lamps less efficient than high performance T8s; however, there are now lamps available to
6 Navigant and Energy Trust found that high intensity discharge (HID) lighting comprises a significant portion of the
savings for high performance T8 retrofits through the Energy Trust’s commercial lighting program; however, these
technologies, which typically serve high bay applications, represent a different chain of market drivers and
influences than the low bay linear fluorescent retrofit market. Thus, this report does not address HID retrofits.
Page 9 Final Report – Phase I
consumers that comply with the standard, but do not save as much energy as retrofitting a standard T8 or
T12 fixture with a high performance T8 fixture.7
Near the end of the Phase I research, Energy Trust and Navigant learned that there were new T12 lamps
on the market that would comply with the 2012 federal lamp standard change and allow the customer to
keep their existing T12 ballast. These lamps present customers with a standard-compliant and less
efficient alternative to high performance T8s for T12 retrofits; however, the cost and market acceptance of
these compliant T12s are not yet known.
While the research and discussion focuses on high performance T8s, the energy savings presented in the
report represent a conservative view of how the market will respond to the upcoming federal lamp
standard change scheduled for 2012. To be conservative and accommodate this finding, this report only
attributes market transformation savings for the least efficient option available to consumers. The least
efficient T12 replacement option currently available is to maintain an existing electronic T12 ballast and
replace the T12 lamps (standard T12s) with the newly-developed T12 lamps that comply with the federal
standard change (compliant T12s). This change to the analysis resulted in the projected energy savings
decreasing from roughly 33 aMW to 18 aMW.
The lighting technologies available in the commercial lighting market continue to evolve and there are
unanswered questions about how the market will respond to newly available technologies in light of the
upcoming federal standard. This Phase I report represents a snapshot of the current market and should
be updated when the federal ballast standard has been designed for 2014 and additional market research
is available.
Energy Trust also intends to conduct a market tracking study in the next two years to determine what
customers actually purchase and to adjust the estimated Phase I savings based on the actual future
market size and the Energy Trust’s 2011-2012 program activity.
Energy Trust’s high performance T8 program is currently scheduled to run through the end of 2012 to
allow the existing T12 stock to turnover after the federal standard changes in July 2012. Depending on
how the market starts responding to the 2012 federal standard change, the Energy Trust will likely have a
subsequent program to capture the incremental savings between the compliant T12s and high
performance T8 fixtures. This program and the Energy Trust’s existing low wattage T8 program would
also be addressed in a future phase of the commercial lighting market transformation efforts.
2.2 Market Characterization
The analysis focuses on the commercial lighting market specified through the most recent federal energy
conservation standard for general service fluorescent lamps.8 The standard will require general service
7 For existing T12 fixtures, compliant T12 lamps are available that can be installed with a customer’s existing T12
ballast for less than half of the energy savings produced by replacing the existing T12 fixture with a high
performance T8 fixture. In the case of existing T8 fixtures, customers can install a high performance T8 lamp with
their existing T8 ballast, which results in greater light output from the fixture, but no energy savings.
The Energy Trust plans to revisit these savings estimates for Phase II when the
Department of Energy (DOE) releases details on the 2014 federal ballast standard change,
since there may be additional market transformation savings attributable to the Energy
Trust’s commercial lighting program if the 2014 federal ballast standard bans T12 or
standard T8 ballasts.
Page 10 Final Report – Phase I
four-foot linear fluorescent lamps to meet a minimum efficiency of 89 lumens per watt (lm/W) after the
standard takes effect in July 2012. This will essentially limit the sales of linear fluorescents lamps to high
performance 32 watt T8s (HPT8s) or better and compliant T12s. It will prohibit sales of standard T12 and
standard T89 lamps.
Minimal savings are expected from T8 lamp installations as a result of the 2012 lamp standard. Under the
new fluorescent lamp standard, when a customer with a standard T8 fixture has the lamp burnout, they
will have to replace the lamp with a high performance T8, but will not need to replace the ballast with a
high performance T8 ballast at least until a new federal standard for fluorescent ballasts takes effect in the
beginning of 2014.10 High performance T8 lamps have the same wattage, but higher lumen output, than
standard T8 lamps. This means that a high performance T8 lamp installed with a standard T8 ballast
provides greater light output, but does not provide energy savings.
Instead, it is expected that the most significant source of energy savings from the standard will be
eliminating sales of standard T12 linear fluorescent lamps. Until recently, it was assumed that when a T12
lamp burns out after the federal standard change, the customer would have to replace the T12 lamp with
a high performance T8 lamp because T12 and standard T8 lamps would no longer be available. Because
T12 ballasts are not expected to be compatible with high performance T8 lamps, it was assumed that the
customer would also have to replace the T12 ballast with either a standard T8 or high performance T8
ballast. However, as discussed in Section 2.1, Energy Trust and Navigant recently learned that T12 lamps
will be available to customers that comply with the federal standard and can be used with the customer’s
existing T12 ballast. Thus, this report focuses on the T12 retrofit market but presents the market
transformation savings for T12s replaced as a result of the federal standard change (standard-driven
replacements) in terms of these compliant T12s.
To capture the important relationship between the lamp and ballast, this report looks at lighting in terms
of “fixtures,” or the combination of the lamp and ballast. The effects of the federal standard are
summarized here:
8 Energy Conservation Standards and Test Procedures for General Service Fluorescent Lamps and Incandescent
Reflector Lamps; Final Rule, Federal Register, 74 FR 34080, July 14, 2009.
9 Throughout this report, “standard” T8 lamps refer to “First Generation” 700-series and “Extended Life” 800-series
(88 lm/W) T8 lamps.
10 Not all high performance T8 lamps will be compatible with standard T8 ballasts; however, manufacturers are
already offering some high performance T8 lamps that are compatible with standard ballasts for four-foot lamps.
The exact efficiency level for the federal ballast standard is not yet known.
Page 11 Final Report – Phase I
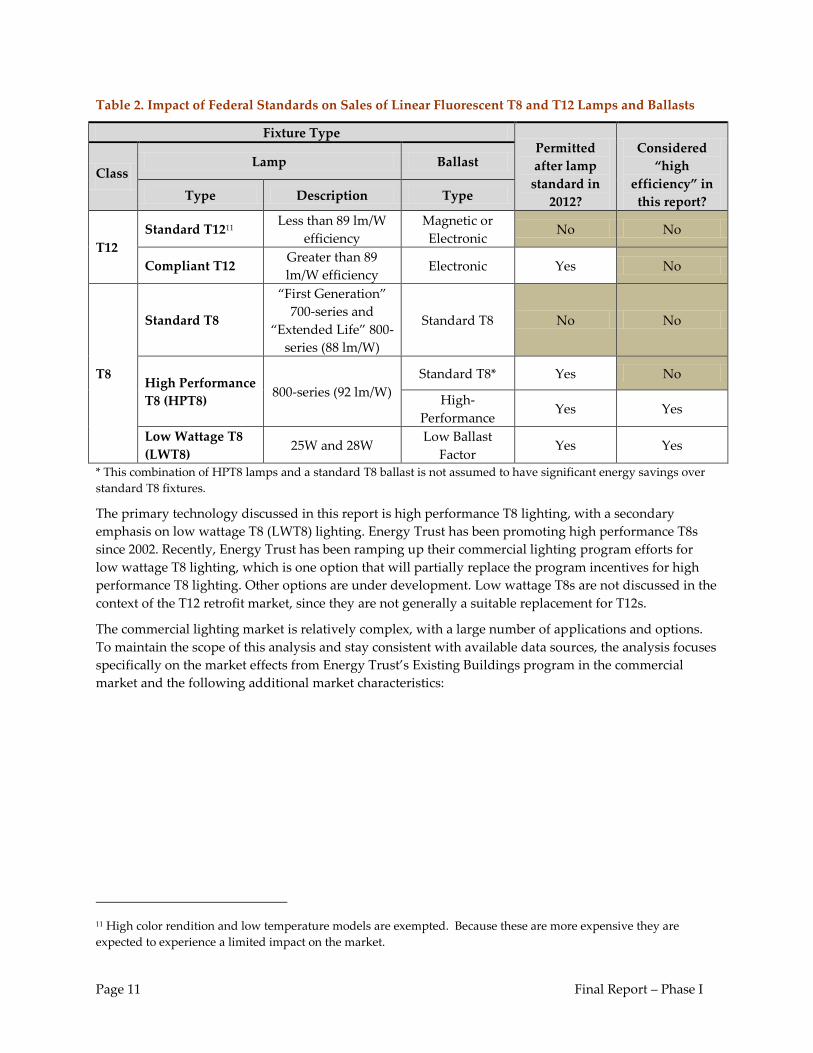
Table 2. Impact of Federal Standards on Sales of Linear Fluorescent T8 and T12 Lamps and Ballasts
Fixture Type Permitted
after lamp
standard in
2012?
Considered
“high
efficiency” in
this report?
Class Lamp Ballast
Type Description Type
T12
Standard T1211 Less than 89 lm/W
efficiency
Magnetic or
Electronic No No
Compliant T12 Greater than 89
lm/W efficiency Electronic Yes No
T8
Standard T8
“First Generation”
700-series and
“Extended Life” 800-
series (88 lm/W)
Standard T8 No No
High Performance
T8 (HPT8) 800-series (92 lm/W)
Standard T8* Yes No
High-
Performance Yes Yes
Low Wattage T8
(LWT8) 25W and 28W
Low Ballast
Factor Yes Yes
* This combination of HPT8 lamps and a standard T8 ballast is not assumed to have significant energy savings over
standard T8 fixtures.
The primary technology discussed in this report is high performance T8 lighting, with a secondary
emphasis on low wattage T8 (LWT8) lighting. Energy Trust has been promoting high performance T8s
since 2002. Recently, Energy Trust has been ramping up their commercial lighting program efforts for
low wattage T8 lighting, which is one option that will partially replace the program incentives for high
performance T8 lighting. Other options are under development. Low wattage T8s are not discussed in the
context of the T12 retrofit market, since they are not generally a suitable replacement for T12s.
The commercial lighting market is relatively complex, with a large number of applications and options.
To maintain the scope of this analysis and stay consistent with available data sources, the analysis focuses
specifically on the market effects from Energy Trust’s Existing Buildings program in the commercial
market and the following additional market characteristics:
11 High color rendition and low temperature models are exempted. Because these are more expensive they are
expected to experience a limited impact on the market.

Page 12 Final Report – Phase I
Table 3. Characterization of Market Addressed in the Market Transformation Model
Market Characteristic Addressed Market Characteristic NOT Addressed
Lighting fixtures or systems (i.e., includes lamp
and ballast) Lamps or bulbs
Sales or shipments Stock or units installed
4-foot (4’) and 8-foot (8’) T8s and T12s 2’ lamps, T5s, high-bay, non-fluorescents
Retrofits and standard-driven replacements of T12
fixtures
New construction, replacement, or renovation
Retrofits of T8 fixtures
Retrofits of high-intensity discharge (HID) fixtures
Energy Trust’s Existing Buildings program (BE) Energy Trust’s Production Efficiency, Home
Energy Solutions, Self-Direct, etc. programs
These efforts were focused on low bay commercial lighting, so the analysis did not consider T5 High
Outputs or T5s, which are more common in high bay space, as a competitive technology with T8s.
Furthermore, in 2009, the Oregon Lighting Market Assessment estimated that only 3% of retrofit projects
completed that year were T5s that compete with T8s.12
Accordingly, the analysis did not include savings from high-intensity discharge (HID) fixtures retrofit
with high performance T8s, although these projects make up a significant share of the Energy Trust’s
high performance T8 program savings. HIDs are excluded from the analysis because these technologies,
which typically serve high bay applications, represent a different chain of market drivers and influences
than the low bay linear fluorescent retrofit market.
Energy Trust chose to focus on the retrofit market, in particular, to avoid overlapping claims of savings
with the NEEA studies, since the market evaluation efforts for new buildings and renovations are being
addressed by the Northwest Energy Efficiency Alliance (NEEA). These markets are influenced both by
Energy Trust and NEEA programs.
As noted above, ballast type is a critical consideration in high performance T8 lighting design. A high
performance T8 lamp without the proper ballast, such as many of the ballasts used in standard T8
systems, will provide greater lumen output than a standard T8 but will not achieve significant energy
savings. To qualify as a high performance T8 fixture or system, the lamp and the ballast must both
qualify for the Consortium of Energy Efficiency’s (CEE) High Performance T8 Specification.13 Energy
Trust played a role in the development of this specification, which is now well-known within the
industry, and for many years has required Trade Allies to meet this specification in order to qualify for
incentives for retrofit T8 lighting. This model assumes that all high performance T8 fixtures projected by
this analysis meet the CEE specifications.
12 Heschong Mahone Group, Inc. Oregon Lighting Market Assessment. “Energy Trust of Oregon Lighting Market
Assessment Project.” Prepared for Energy Trust of Oregon. December 15, 2009.
13 Consortium for Energy Efficiency, “High-Performance T8 Specification”, Accessed October 19, 2010,
http://www.cee1.org/com/com-lt/com-lt-specs.pdf.
Page 13 Final Report – Phase I
CEE has developed another specification for low wattage T8 lighting and this specification already
appears to be playing a similar role in the market by guiding the products available from manufacturers
via supply chain recognition.14
2.3 Research Objectives
The primary focus of the research and analysis conducted for this project was high-performance T8 lamps
and was structured to achieve the following objectives:
Develop a reasonable and defensible baseline estimate for the high performance T8 market in the
absence of the Energy Trust program and other voluntary incentive programs;
Estimate the market share of high performance T8 lighting in Oregon;
Estimate the remaining stock of T12 fixtures in Oregon;
Apply the current Energy Trust market transformation modeling framework to the commercial
lighting program and integrate a foundation for future commercial lighting market analysis.
Build the market transformation model using the software platform Analytica™ to increase the
transparency, usability, and flexibility of the existing Excel™ model; and
Investigate current market activity and a baseline for the low wattage T8 market as it moves
forward to set the stage for future transformation efforts.
2.4 Report Structure
The report is organized in four sections with detailed supporting information located in appendices.
• Section 3 outlines the methodology used during the project.
• Section 4 details the findings and results from the project, including the baseline and market
penetration findings, the federal standard change findings, and the model template development
and model results.
• Section 5 presents conclusions and recommendations from the study.
14 Consortium for Energy Efficiency, “Reduced-Wattage T8 Specification”, Accessed October 19, 2010,
http://www.cee1.org/com/com-lt/lw-spec.pdf.
Page 14 Final Report – Phase I
3 Methods
The Team used a variety of methods to develop the inputs to the commercial lighting market
transformation model, including developing the model, completing a secondary data review, collecting
data to establish a market baseline estimate, researching savings associated with federal standard change,
and interviewing industry experts about the current markets for high performance and low wattage T8s.
Each of these methods is described below.
3.1 Secondary Data Review
The Team reviewed existing data sources to facilitate the development of a more robust baseline and
market penetration values. Each data source is listed along with a description of the source and its use.
Energy Trust Participation and Program Data15 – Energy Trust provided the Team with the most
recent Energy Trust program participation data. Energy Trust also provided the model
assumptions for program incentives, energy savings, installed costs, avoided costs, and measure
life.
2002 and 2007 Northwest Commercial Building Stock Assessments (CBSA)16,17 – These reports,
prepared for the Northwest Energy Efficiency Alliance, summarize the penetration of different
commercial lighting types in the Northwest. By looking at the change in market penetration of
installed stock from 2002 to 2007, the CBSA data was used to estimate total number of linear
fluorescent fixtures in Energy Trust’s territory over time. The Team also used the raw data
collected for the CBSA to estimate the number of T12 fixtures installed in Oregon, rather than the
region as a whole.
Oregon Lighting Market Assessment (LMA)18 – This market assessment presents the results from
lighting Market Actor surveys conducted in 2009, which include Market Actor perception of the
market for commercial lighting and an estimated market penetration of high performance T8
lighting for retrofit projects in 2009. The LMA also includes Oregon-specific data from NEEA’s
2007 CBSA, which helped to refine the estimated total number of linear fluorescent fixtures in
Energy Trust’s territory.
Department of Energy (DOE) Technical Support Document for General Service Fluorescent Lamp Federal
Standard19 – This data was prepared by the DOE to support the federal standard for fluorescent
15 This data was provided by Matt Braman at Energy Trust from program files.
16 KEMA-XENERGY Inc. Northwest Commercial Building Stock Assessment. Prepared for Northwest Energy Efficiency
Alliance. March 8, 2004.
17 The Cadmus Group, Inc. Northwest Commercial Building Stock Assessment. Prepared for Northwest Energy Efficiency
Alliance. December 21, 2009.
18 Heschong Mahone Group, Inc. Oregon Lighting Market Assessment. “Energy Trust of Oregon Lighting Market
Assessment Project.” Prepared for Energy Trust of Oregon. December 15, 2009.
19 Department of Energy. Energy Conservation Standards and Test Procedures for General Service Fluorescent Lamps
and Incandescent Reflector Lamps; Final Rule Technical Support Document, July 2009.
Page 15 Final Report – Phase I
lighting going into effect in 2012. The Team used this documentation to establish the baseline
market penetration for high performance and low wattage T8 commercial lighting.
Additional baseline data sources – In addition to the DOE documentation, the Team also used data
from two regional evaluations to support the baseline analysis. These sources are described in
more detail below in Section 3.2.
5A’s Framework for Market Transformation Evaluation20 – The 5A’s approach looks at the
availability, awareness, accessibility, affordability, and acceptance of a technology and provides a
framework for assessing market barriers. The Team used this framework in interviews with
distributors and industry experts to evaluate the current low wattage T8 market and establish
specific benchmarks to measure market progress.
Consortium for Energy Efficiency (CEE) Specifications21,22 – To qualify as a high performance T8
system, the lamp and the ballast must both qualify for CEE’s High Performance T8 Specification.
CEE has also recently developed similar standards for low wattage T8 systems. This model
assumes that all high performance and low wattage T8 fixtures projected by this analysis meet
the CEE specifications.
High Bay Lighting Market Effects Study23 - This study looks at the market effects of California’s
energy efficiency programs on the retrofit market for high bay lighting. This study also quantifies
the savings caused by the above market effects, with particular emphasis on non-participant
spillover. The similarities in methodologies between the high bay lighting study and this market
transformation effort lends credibility to the approach being used for this report.
Sixth Northwest Conservation and Electric Power Plan24 – The Sixth Power Plan contains detailed
forecasts of regional growth. To estimate the total commercial floor space in Energy Trust’s
service territory, the growth rate for commercial building floor space in the region from 2002-
2018 was applied to the commercial building floor space provided by Energy Trust for 2010.
3.2 Baseline Data Collection
The baseline market penetration represents the percentage of commercial lighting fixtures in the retrofit
market that would be high efficiency fixtures absent the Energy Trust program. To establish this baseline,
the Team chose to focus on collecting and reviewing existing secondary data sources, rather than conduct
20 North American Program Review, Steering Committee Workshop. NRCan Workshop 74353-00. Presentation by
Arthur D. Little and Natural Resources Canada. April, 9 2002.
21 Consortium for Energy Efficiency, “High-Performance T8 Specification”, Accessed October 19, 2010,
http://www.cee1.org/com/com-lt/com-lt-specs.pdf.
22 Consortium for Energy Efficiency, “Reduced-Wattage T8 Specification”, Accessed October 19, 2010,
http://www.cee1.org/com/com-lt/lw-spec.pdf.
23 KEMA Inc. and Itron, Inc. High Bay Lighting Market Effects Study. Prepared for California Public Utilities
Commission. June 18, 2010.
24 Sixth Northwest Conservation and Electric Power Plan. “6th Power Plan_Commercial Forecast 6P.xls.” Accessed
October 1, 2010.
Page 16 Final Report – Phase I
primary research, to collect as many data points as possible within the project budget and time period.
Each data source was assessed based on the following criteria:
Has high-level, public results readily available;
Provides the market share of high performance T8s sold or installed in a given year for retrofit
projects; and
Provides data for a region not significantly influenced by an incentive program for high
performance T8s.
The Team investigated over a dozen potential data sources (see Appendix B for a complete list) and
found three sources that satisfactorily met the above criteria:
U.S. Department of Energy (DOE) documentation on federal standard for general service
fluorescent lamps and incandescent reflector lamps25
Baseline study conducted in 2010 for PECO, a Philadelphia-based utility26
Statewide potential study conducted in 2008 for the Public Utilities Commission of Texas27
The strengths and limitations of all three data sources are discussed below in Section 3.2.
3.3 Research on Federal Standard Change Savings
The Team assessed the reasonableness of the argument that successful voluntary incentive programs are
a key precedent and influence for upgrading the federal lighting manufacturing standard for general
service fluorescent lighting, and thus they contribute proportionally to the savings achieved through the
new standards in their territory. This task included eleven targeted interviews with key industry experts
at the following organizations:
American Council for an Energy-Efficient Economy
Appliance Standards Awareness Project
Consortium for Energy Efficiency
Energy Solutions
Evergreen Consulting Group
Heschong Mahone Group
Lighting Design Lab
Navigant Consulting
Northwest Power and Conservation Council
Osram Slyvania
25 Department of Energy. Energy Conservation Standards and Test Procedures for General Service Fluorescent Lamps
and Incandescent Reflector Lamps; Final Rule Technical Support Document, July 2009.
26 Navigant/Itron. Preliminary results from lighting vendor surveys. “PECO BL study Lighting T8 tables for
ETO.xlsx.” Personal communications with Jennifer Fagan. Itron, Inc. October 5, 2010.
27 Itron, Inc. “Assessment of the Feasible and Achievable Levels of Electricity Savings from Investor Owned Utilities
in Texas: 2009-2018.” Prepared for the Texas Public Utilities Commission. December 10, 2008.

Page 17 Final Report – Phase I
Pacific Gas and Electric Company
Southern California Edison
The Cadmus Group, Inc.
The Team developed interview guides that were subsequently reviewed by Energy Trust evaluation staff,
and updated to reflect their comments. The Team also developed the list of interviewees above in
consultation with Energy Trust staff in order to contact regional and national market-actors representing
a broad range of perspectives on the federal rule-making process.
3.4 Research on Market Activity for High Performance T8 Fixtures
To estimate the market activity for high performance, the Team relied primarily on distributor interviews
conducted in early 2009 by Heschong Mahone for the Oregon Lighting Market Assessment and
distributor interviews conducted by the Team in mid 2010.
The Team contacted a total of five distributors in Oregon (see Appendix A for list). These distributors
were identified by Evergreen Consulting, managers of the Northwest Trade Ally Network for commercial
lighting, as representative of 80-90 percent of the commercial lighting retrofit market. Results from these
interviews were weighted according to market share and the data obtained from them was adjusted to
represent 100 percent of the market. The Team developed the interview guides with input from the
Energy Trust.
Interviewees contacted for input on the federal standard change that are also actively involved in the
Northwest region were asked to provide their perspective on the current market for high performance
T8s in Oregon. These regional industry experts included Evergreen Consulting, Heschong Mahone
Group, the Lighting Design Lab, the Northwest Power and Conservation Council, and Osram Slyvania.
3.5 Research on Market Activity for Low Wattage T8 Fixtures
One of Energy Trust’s key objectives for this commercial lighting market research was establishing
current market activity and a baseline for the low wattage (25W and 28W) T8 market. Energy Trust
believes this market will soon undergo a market transformation in response to the program Energy Trust
launched in 2010. Thus, the distributor interviews conducted by Navigant were used to determine the
market activity in 2010 for both high performance and low wattage T8s. Navigant also conducted
secondary research to benchmark the distributor interview findings and establish an initial baseline
estimate. Navigant used the DOE documentation for the federal standard to linearly extrapolate market
share between 2012 and 2042 as a first-order approximation for the low wattage T8 baseline trajectory.
In addition to asking about low wattage T8 market share, the Team asked distributors and industry
experts to rank the current market for low wattage T8s in terms of availability, awareness, accessibility,
affordability, and acceptance of these lamps. This approach, known as the “5A’s Framework” for market
transformation evaluation,28 will provide future market transformation efforts with specific benchmarks
to measure market progress. Ideally, the 5A’s approach can be used going forward to understand what
Energy Trust has done to remove barriers to market penetration and to identify which barriers Energy
Trust has helped remove.
28 North American Program Review, Steering Committee Workshop. NRCan Workshop 74353-00. Presentation by
Arthur D. Little and Natural Resources Canada. April, 9 2002.
Page 18 Final Report – Phase I
3.6 Market Transformation Model Development
The model development for this analysis had several objectives:
To leverage the methodology and structure for the existing Excel model template created for the
Gas Furnace Market Transformation Model and Market Research;
To transfer the modeling platform from Excel to Analytica29 for enhanced model functionality;
and
To structure the model such that future market changes (e.g., the introduction of a T8 ballast
standard) can be easily incorporated.
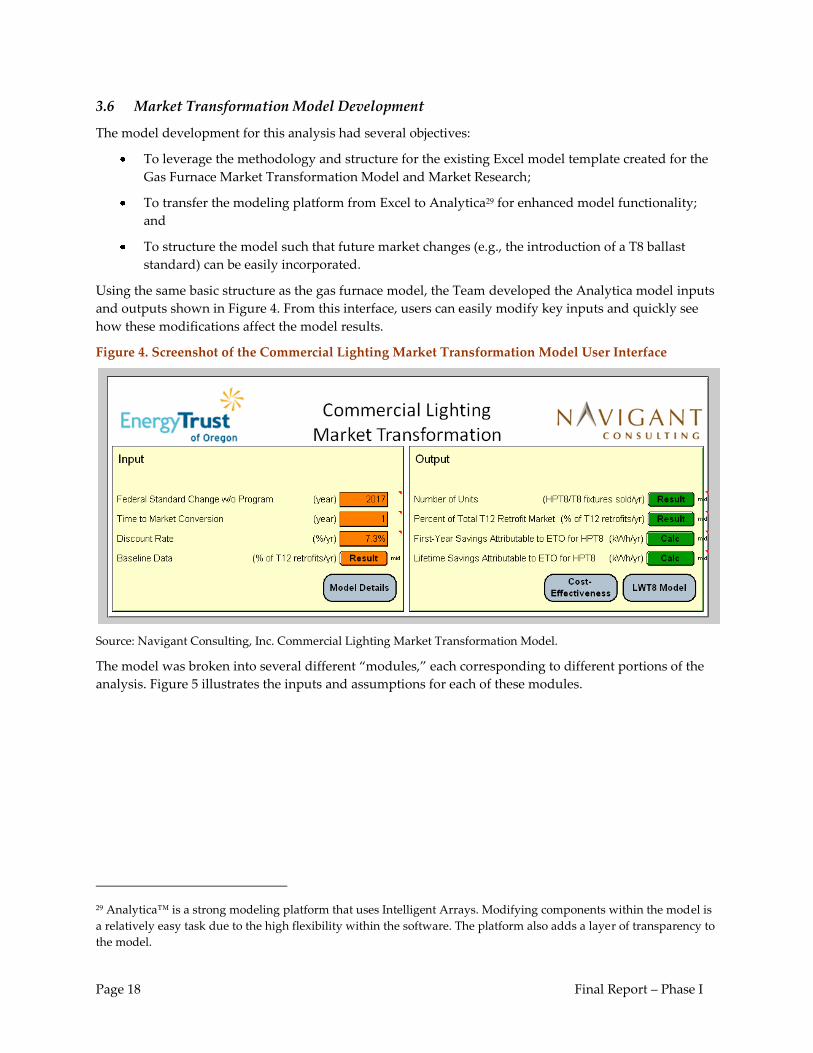
Using the same basic structure as the gas furnace model, the Team developed the Analytica model inputs
and outputs shown in Figure 4. From this interface, users can easily modify key inputs and quickly see
how these modifications affect the model results.
Figure 4. Screenshot of the Commercial Lighting Market Transformation Model User Interface
Source: Navigant Consulting, Inc. Commercial Lighting Market Transformation Model.
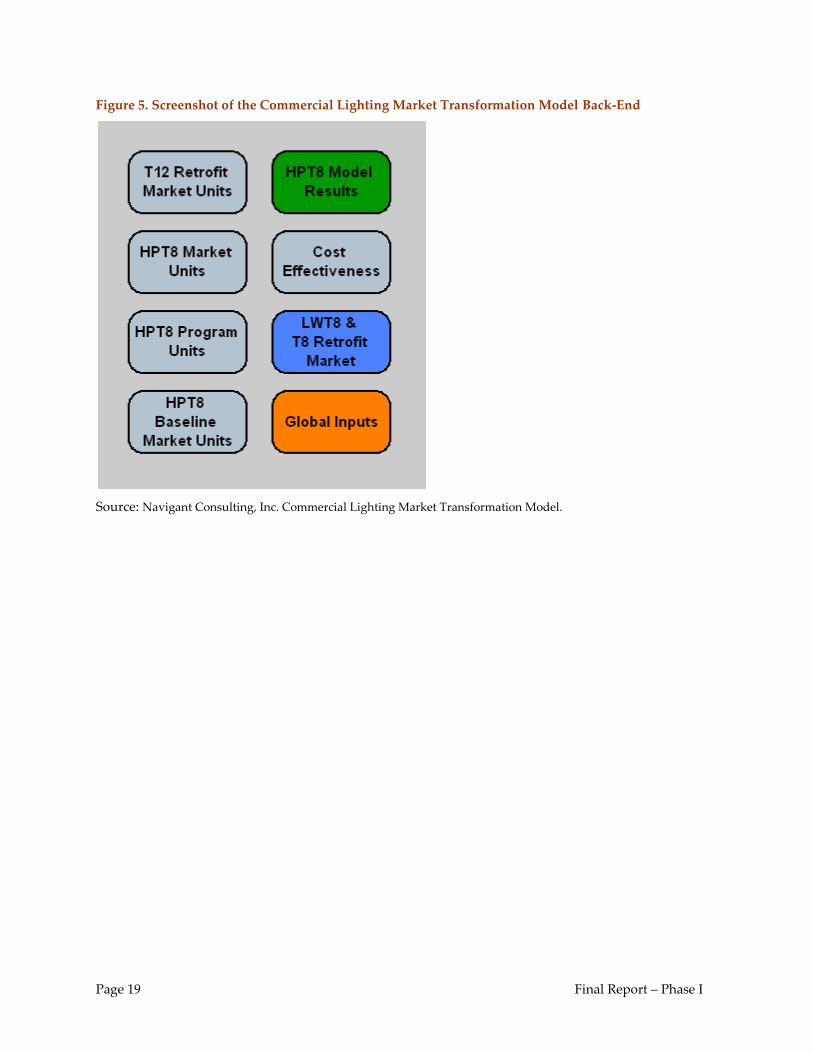
The model was broken into several different “modules,” each corresponding to different portions of the
analysis. Figure 5 illustrates the inputs and assumptions for each of these modules.
29 Analytica™ is a strong modeling platform that uses Intelligent Arrays. Modifying components within the model is
a relatively easy task due to the high flexibility within the software. The platform also adds a layer of transparency to
the model.
Page 19 Final Report – Phase I
Figure 5. Screenshot of the Commercial Lighting Market Transformation Model Back-End
Source: Navigant Consulting, Inc. Commercial Lighting Market Transformation Model.
Page 20 Final Report – Phase I
4 Findings and Results
The primary research conducted for this project sought to address the following questions:
• Were Energy Trust and its peers nationally highly influential on decisions regarding efficiency
and/or timing of the Federal standard due to their successes at making high-performance T8
equipment available and increasing sales and acceptance?
• Did Energy Trust influence the sales of high performance T8s in their region?
• Did Energy Trust’s programs influence the equipment available on the market?
• Did Energy Trust’s efforts influence supply chain promotion and/or market acceptance of the
technology?
• What is the remaining stock of T12s in Energy Trust’s service territory and when are all T12s
likely to be replaced?
The following section presents the findings for these questions and how the findings inform the market
transformation model results.
4.1 Influence of Energy Trust Program on High Performance T8 Market Penetration
A central objective of this research was to evaluate the impact of Energy Trust’s voluntary incentive
program for high performance T8 lighting beyond the direct influence of program incentives. While
Energy Trust has clearly influenced the Trade Allies involved in Energy Trust’s incentive program, this
research found 1) no conclusive evidence suggesting that the T12 retrofit market has yet been
transformed outside of Energy Trust’s program and 2) that incentives are still the primary driver for high
performance T8 sales in the region.
To perform this research, the distributors and industry experts listed in Section 3.4 were asked several
questions about the influence of Energy Trust’s program on the high performance T8 market in Oregon.
In general, the interviewees indicated that the Energy Trust has had a significant influence on the market
through incentives and training. As one respondent stated, ten years ago, no one had heard of high
performance T8s or could tell you what they were. Several respondents felt that the market changed
dramatically once the Energy Trust’s began requiring high performance T8s to qualify for incentives. In
fact, one of the interviewees closely involved in developing the Oregon Lighting Market Assessment
(LMA) stated that many of the market actors interviewed said without being prompted that Energy Trust
played a very important role in the market. The LMA findings support this with over 80 percent of Trade
Allies30 saying that Energy Trust was a “major” or the “most important” influence in the adoption of high
performance T8s, and almost 70 percent of Trade Allies naming the Energy Trust as a resource for
information on high performance T8s.31
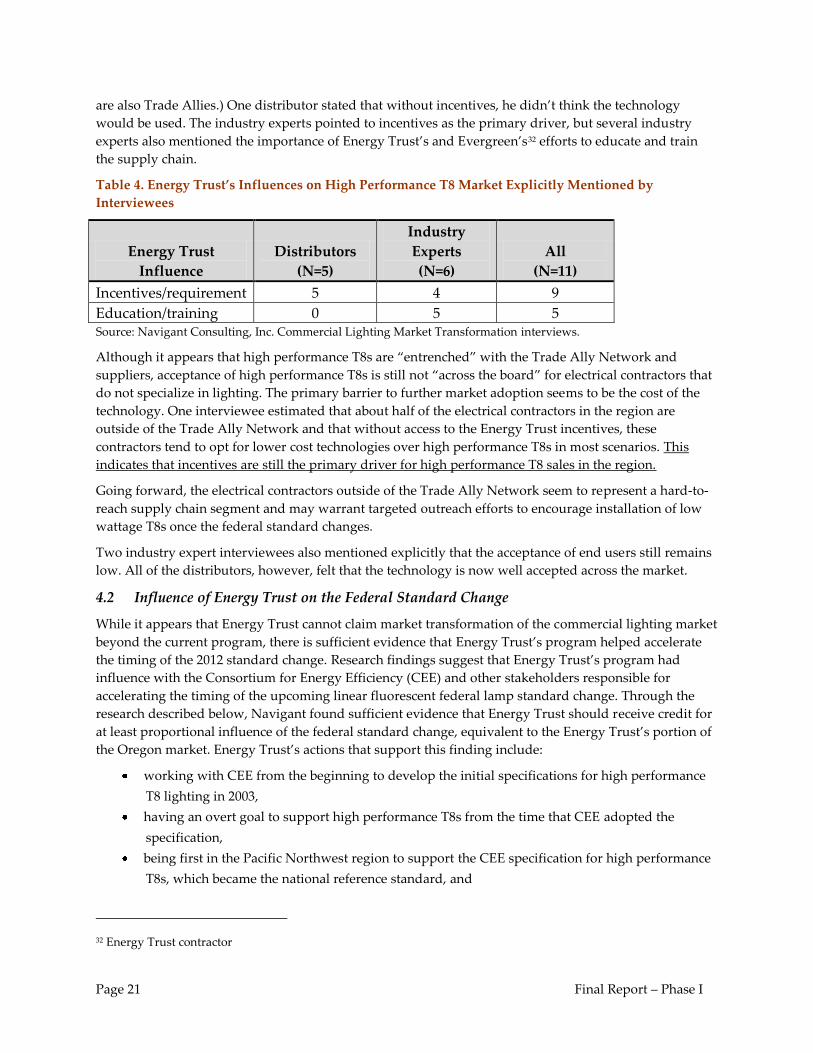
From the interview responses, it appears that the Energy Trust’s incentives have been the most influential
aspect of the high performance T8 program. All five of the distributors interviewed cited incentives as the
way in which Energy Trust has influenced the market, as shown in Table 4. (All five of the distributors
30 The Lighting Market Assessment surveyed 60 market actors: 15 contractors, 30 distributors, and 15 designers. All of
the contractors and distributors surveyed were Trade Allies.
31 Heschong Mahone Group, Inc. Oregon Lighting Market Assessment. “Energy Trust of Oregon Lighting Market
Assessment Project.” Prepared for Energy Trust of Oregon. December 15, 2009.
Page 21 Final Report – Phase I
are also Trade Allies.) One distributor stated that without incentives, he didn’t think the technology
would be used. The industry experts pointed to incentives as the primary driver, but several industry
experts also mentioned the importance of Energy Trust’s and Evergreen’s32 efforts to educate and train
the supply chain.
Table 4. Energy Trust’s Influences on High Performance T8 Market Explicitly Mentioned by
Interviewees
Energy Trust
Influence
Distributors
(N=5)
Industry
Experts
(N=6)
All
(N=11)
Incentives/requirement 5 4 9
Education/training 0 5 5 Source: Navigant Consulting, Inc. Commercial Lighting Market Transformation interviews.
Although it appears that high performance T8s are “entrenched” with the Trade Ally Network and
suppliers, acceptance of high performance T8s is still not “across the board” for electrical contractors that
do not specialize in lighting. The primary barrier to further market adoption seems to be the cost of the
technology. One interviewee estimated that about half of the electrical contractors in the region are
outside of the Trade Ally Network and that without access to the Energy Trust incentives, these
contractors tend to opt for lower cost technologies over high performance T8s in most scenarios. This
indicates that incentives are still the primary driver for high performance T8 sales in the region.
Going forward, the electrical contractors outside of the Trade Ally Network seem to represent a hard-to-
reach supply chain segment and may warrant targeted outreach efforts to encourage installation of low
wattage T8s once the federal standard changes.
Two industry expert interviewees also mentioned explicitly that the acceptance of end users still remains
low. All of the distributors, however, felt that the technology is now well accepted across the market.
4.2 Influence of Energy Trust on the Federal Standard Change
While it appears that Energy Trust cannot claim market transformation of the commercial lighting market
beyond the current program, there is sufficient evidence that Energy Trust’s program helped accelerate
the timing of the 2012 standard change. Research findings suggest that Energy Trust’s program had
influence with the Consortium for Energy Efficiency (CEE) and other stakeholders responsible for
accelerating the timing of the upcoming linear fluorescent federal lamp standard change. Through the
research described below, Navigant found sufficient evidence that Energy Trust should receive credit for
at least proportional influence of the federal standard change, equivalent to the Energy Trust’s portion of
the Oregon market. Energy Trust’s actions that support this finding include:
working with CEE from the beginning to develop the initial specifications for high performance
T8 lighting in 2003,
having an overt goal to support high performance T8s from the time that CEE adopted the
specification,
being first in the Pacific Northwest region to support the CEE specification for high performance
T8s, which became the national reference standard, and
32 Energy Trust contractor
Page 22 Final Report – Phase I
working with regional distributors to ensure proper application of the technology.
Without voluntary incentive programs like Energy Trust’s, Navigant found that the federal standard
would not have changed to an equivalent efficiency level until the next DOE standard change in 2017.
Influence through Program Activity
The Team spoke to a number of organizations involved in the federal rule-making process about the role
of voluntary incentive programs, like the Energy Trust’s, in bringing about the federal standard in 2012.
As part of the DOE’s market assessment in the federal rule-making process, the DOE reviewed several
national, regional, and local voluntary programs that promote the use of energy-efficient lighting,
including CEE’s High Performance Commercial Lighting Initiative.33 One of the key interview questions
asked of these organizations was the following:
By actively endorsing and promoting the CEE’s specifications for high performance T8s, do you think Energy
Trust and its peers nationally were influential on decisions regarding the Federal standard?
Out of the nine interviewees asked to provide input on this topic, one interviewee was unable to
comment, and the remaining interviewees felt that voluntary incentive programs were influential on
decisions regarding the federal standard and when it would be implemented. Each standard or code
change can be influenced by a number of different factors, depending on the technology being addressed.
Thus, market transformation savings from standard and code changes tends to be highly technology-
specific. Interviewees specifically mentioned that the voluntary incentive programs collectively affected
this federal standard by demonstrating the following:
Technical feasibility (e.g., ease of installation)
Equipment availability and affordability
Supply chain readiness (e.g., awareness and acceptance)
Ability to satisfy customers’ needs
Lifecycle cost-effectiveness
Demonstration of cost-effectiveness, in particular, is one of the DOE’s key requirements for a new
standard. Several respondents felt that voluntary incentive programs help make technologies more cost-
effective by increasing the volume of sales through incentives and increasing familiarity with the
technology, which helps to reduce costs.
It is a key premise that the increased sales volume (i.e., increased market penetration) due to voluntary
programs also helps drive standard changes, in general, because standards tend to “follow the market.”
To test this premise, interviewees were asked to provide their opinion on the importance of market
penetration for bringing about the federal standard. Five respondents were asked to rank the importance
of market penetration on a scale from one to five, where one was not an important factor and five was the
most important factor. The average response to this question was a four, which indicates that market
penetration has an impact on standard development, but in conjunction with other factors.
This finding was corroborated through a discussion with some of the California utilities that had been
integrally involved in the federal rule-making. The general consensus of this discussion, which involved
33 The DOE also mentions FEMP’s program for energy-efficient lighting, the Energy Efficient Commercial Buildings
Deduction, and the Northeast Energy Efficiency Partnership (NEEP) and states that this is not an exhaustive list of
the programs considered. Department of Energy. Energy Conservation Standards and Test Procedures for General Service
Fluorescent Lamps and Incandescent Reflector Lamps; Final Rule Technical Support Document, Ch.3, July 2009.
Page 23 Final Report – Phase I
representatives from five different organizations, was that market penetration is not the only criteria for
code or standard readiness. To support this, one participant noted that a number of technologies have
become code or standard without significant market share. Instead, the discussion identified at least three
different indicators for code or standard readiness:
Market penetration
Time in the marketplace
Level of complexity
The participants in the discussion largely felt that the relative importance of each indicator depends on
the technology. For example, technologies with more complex installation or impact tend to require
greater market preparation to achieve code/standard readiness.
In the case of high performance T8s, the relatively complex design requirements for achieving energy
savings (i.e., the impact is more complex to realize than with a simple lamp-for-lamp replacement)
suggest that additional support was needed for the technology to be proven and shown cost-effective.
The point was also made that incentives and programs were particularly important for building the T8
market because of a lack of customer education on the savings potential between first, second, and third
generation T8s. As discussed in Section 4.1, the Energy Trust played a leading role in encouraging and
educating Trade Allies on high performance T8s, particularly on the importance of system efficiency,
rather than just lamp efficiency.
Additional Influence beyond Program Activity
Beyond the Energy Trust’s program, the Energy Trust itself played a role in bringing about the federal
standard change by working with CEE from the beginning to develop the initial specifications for high
performance T8 lighting in 2003. CEE’s specifications are widely recognized throughout the lighting
industry supply chain and frequently provide the basis for the standard levels considered by the DOE.
Additionally, the Energy Trust impacted the regional market by being the first in the region to require
high performance T8s, rather than standard T8s, made a strong commitment that compelled the utilities
to change their incentives and the Trade Allies to begin promoting high performance T8s, and worked
with regional distributors to ensure proper application of the technology.
It should also be noted that existing programs can provide valuable support to standard and code
changes through program data documenting information like cost-effectiveness and market penetration.
For instance, one interviewee felt confident that the 2002-2004 CBSA data prepared by NEEA, which is
funded in part by the Energy Trust, helped not just the development, but the actual adoption of the
standard by showing the market share of high performance T8s in new construction.
Accelerated Timing of the Federal Standard Change
Interviewees were also asked when they thought the federal standard change would have occurred
without the influence of these voluntary incentive programs. Out of the seven interviewees asked this
question, two had no comment, four felt the standard would have been updated during the next rule-
making process in 2017, and one interviewee felt the standard may not have occurred at all without these
programs to demonstrate the technology in the marketplace.
Based on these interview responses, the Team estimates that Energy Trust’s program had an influence on
the timing of the 2012 standard change and that the federal standard would not have changed to an
equivalent efficiency level until the next DOE standard change in 2017.
Page 24 Final Report – Phase I
4.3 High Performance T8 Energy Trust Program Units
The data and assumptions provided by the Energy Trust on historical and projected high performance T8
program activity is a central driver of the model. Energy Trust provided the number of fixtures installed,
annual working energy savings, incentives paid to customers, and incremental installed costs for each
linear fluorescent retrofit project in the Existing Buildings commercial retrofit program from 2002-2010.
The Energy Trust also provided assumptions on expected program activity for 2011 and 2012.34 Table 10
shows the actual and expected number of high performance T8 units given incentives through the Energy
Trust’s program each year.
Since the overwhelming majority of the high performance T8 retrofit projects for linear fluorescent
fixtures in this program were T12 retrofits, the analysis assumes that the Energy Trust’s program has
primarily impacted T12s, rather than standard T8s, and focuses on those impacts.
This data was also used to determine the average energy savings and costs associated with a high
performance T8 to T12 retrofit by looking at the average annual per-unit working savings and
incremental installed per-unit costs reported through the program since 2007. The model assumes an
average savings of around 247 kWh per fixture, per year and an average cost of about $88 per unit. The
model applies these averages to the estimated high performance T8 baseline and T12 retrofit market
units, which relies on the assumption that the mix of baseline equipment among program participants
and in the remaining T12 stock are about the same. The Team’s comparison of the Energy Trust’s
program to the overall region’s 4’ versus 8’ T12 penetration and T12 fixture types, as described below,
suggests that this is a reasonable assumption. This information is used to assess overall market effects
and cost-effectiveness.
It should be noted that a federal standard change in 2010 effectively banned the sale of magnetic ballasts
for T12s. The impact of this standard change on the average savings assumed for a T12 retrofit project is
not considered in this model for two reasons: First, as of 2000, electronic ballasts made up 47 percent of
sales nationally and this number had already risen to 57 percent by 2002,35 which suggests that electronic
ballasts had already been naturally displacing a significant portion of magnetic ballasts prior to this
standard change. Second, it is assumed that the incremental savings impact for a T12 ballast upgrade
would be relatively small in comparison to other influences on the total savings.
Proportion of 4’ versus 8’ T12s through Energy Trust’s Program
The high performance T8 retrofit market covers both 4’ and 8’ T12s. Replacing an 8’ T12 fixture with a 4’
high performance T8 fixture achieves roughly 40 percent more savings than replacing a 4’ T12, since 8’
T12 fixtures in the region consume an average of 161 W per fixture, compared to 114 W per 4’ T12
fixture.36
Energy Trust and Navigant investigated whether the Energy Trust’s program activity for 4’ versus 8’
fixtures has been proportional to the regional stock of 4’ versus 8’ fixtures. By comparing the proportion
34 Halfway through 2010, the Energy Trust began offering an additional $5 incentive for T12 to high performance T8
retrofits to accelerate program activity. The estimated program activity in 2011 and 2012 is based on the assumption
that this incentive will remain in place and program activity will be consistent with the activity seen in the second
half of 2010 as a result of the additional incentive.
35 Wolfman, Howard. Illuminating Engineering Society, “Rules + Regs,” June 2006. Accessed from
http://www.iesna.org/PDF/CurrentIssues/Rules&RegsJune2006.pdf.
36 Applies regional weighting of lamp configurations for T12 fixtures. Source: Energy Trust program data and
personal communications with Nick O’Neil at Energy Trust via electronic mail, April 8, 2011.
Page 25 Final Report – Phase I
of 4’ and 8’ T12 retrofits in the Energy Trust’s program to the penetration of 4’ and 8’ T12s in the region
from the CBSA, the Team found that Energy Trust’s program is reasonably representative of the 4’ versus
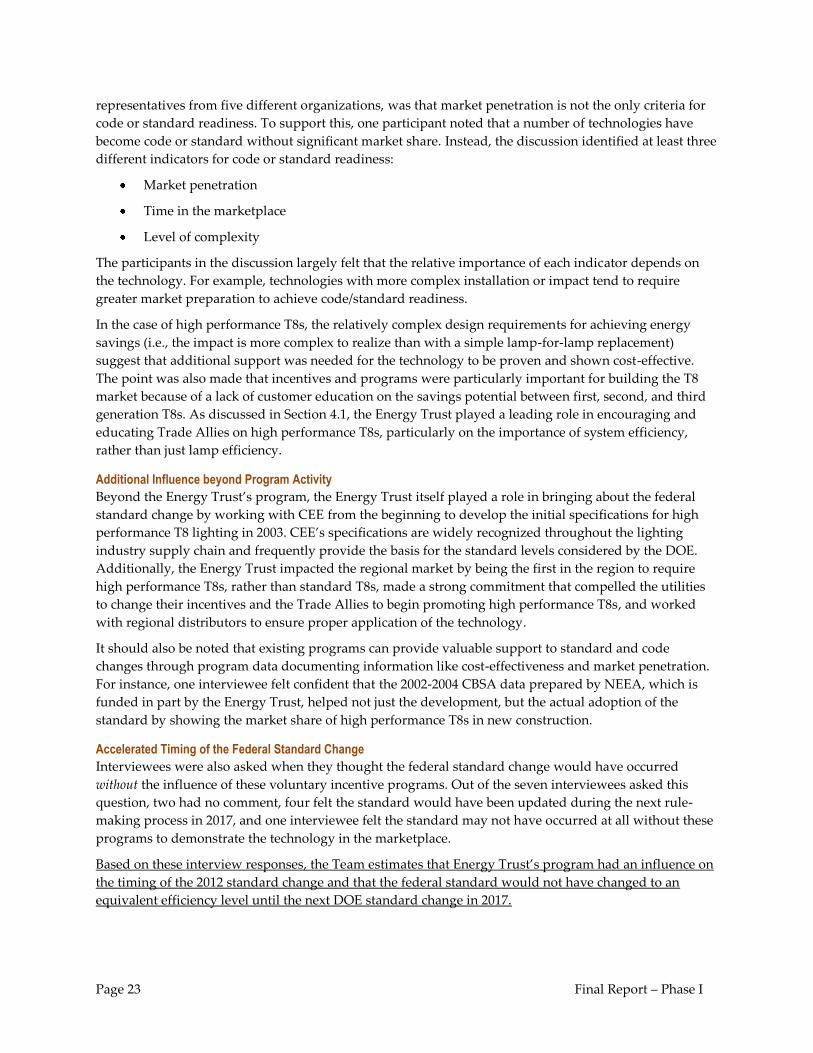
8’ split in the region. As shown in Figure 6, 4’ T12s make up about 61 percent of the Energy Trust’s
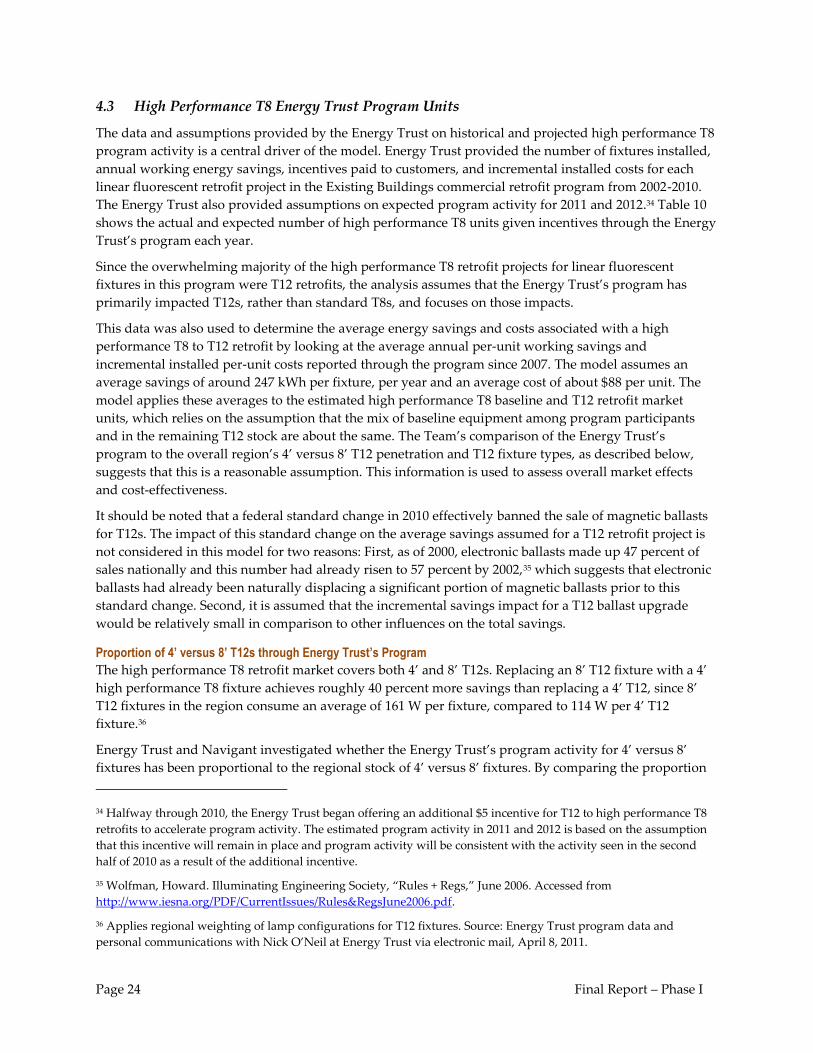
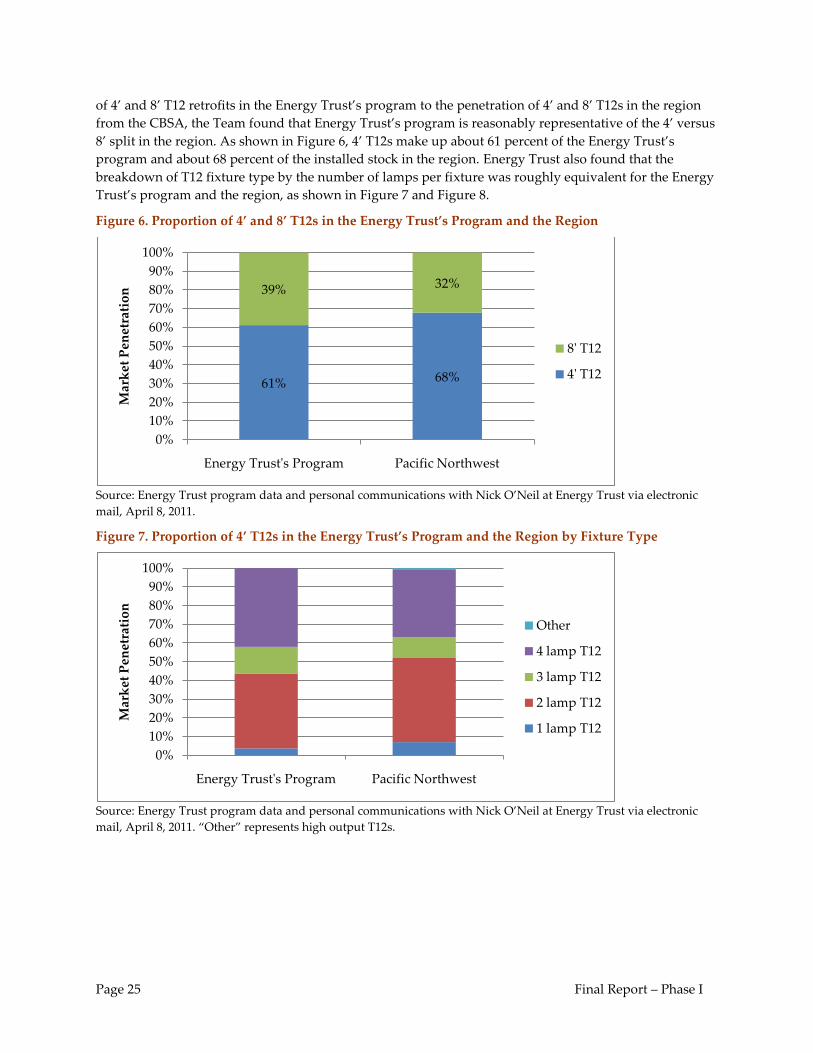
program and about 68 percent of the installed stock in the region. Energy Trust also found that the
breakdown of T12 fixture type by the number of lamps per fixture was roughly equivalent for the Energy
Trust’s program and the region, as shown in Figure 7 and Figure 8.
Figure 6. Proportion of 4’ and 8’ T12s in the Energy Trust’s Program and the Region
Source: Energy Trust program data and personal communications with Nick O’Neil at Energy Trust via electronic
mail, April 8, 2011.
Figure 7. Proportion of 4’ T12s in the Energy Trust’s Program and the Region by Fixture Type
Source: Energy Trust program data and personal communications with Nick O’Neil at Energy Trust via electronic
mail, April 8, 2011. “Other” represents high output T12s.
61% 68%
39% 32%
0%
10%
20%
30%
40%
50%
60%
70%
80%
90%
100%
Energy Trust's Program Pacific Northwest
Mar
ket
Pen
etra
tio
n
8' T12
4' T12
0%
10%
20%
30%
40%
50%
60%
70%
80%
90%
100%
Energy Trust's Program Pacific Northwest
Mar
ket
Pen
etra
tio
n
Other
4 lamp T12
3 lamp T12
2 lamp T12
1 lamp T12
Page 26 Final Report – Phase I
Figure 8. Proportion of 8’ T12s in the Energy Trust’s Program and the Region by Fixture Type
Source: Energy Trust program data and personal communications with Nick O’Neil at Energy Trust via electronic
mail, April 8, 2011. “Other” represents high output T12s.
HID Retrofits through Energy Trust’s Program
The program data in the model does not include the projects through the Energy Trust’s program that
retrofit HID fixtures with high performance T8s. Analysis of Energy Trust project data indicates that HID
retrofits provide roughly half of the high performance T8 program savings, although linear fluorescent
retrofits comprise around 92 percent of the projects. As discussed in Section 2, the analysis excludes HID
fixtures because they represent a separate chain of market influence from linear fluorescents. The market
transformation savings associated with HIDs will be addressed in a separate study.
4.4 High Performance T8 Baseline Units
The baseline market penetration represents the percentage of commercial lighting fixtures in the T12
retrofit market that would be high performance T8 fixtures absent the Energy Trust program. The
baseline continues to represent T12 fixtures retrofit with high performance T8 fixtures after 2012 to reflect
1) what would have happened in the market without the federal standard change acceleration and 2) a
conservative estimate of the T12 retrofits that will likely still occur with high performance T8s despite the
availability of compliant T12s.
It is important to note that the baseline described here is the Team’s best estimate for the baseline in
Oregon and represents the sales each year of both high performance lamps and ballasts for T12 retrofits.
The baseline is based on the three data sources and assumptions discussed below.
U.S. Department of Energy Baseline Data
Through discussions with Navigant staff involved in the DOE’s analysis of the upcoming general service
fluorescent lighting standard change and secondary review of the analysis, the Team adjusted and
calculated the DOE’s assumed market share for 32.5 watt fixtures with 92 lumens per watt or better
before and after the standard change.37 The results for these calculations are presented here:
37 Shipments of commercial 4-foot T8 MBP lamps in DOE Base Case (for systems purchased in 2012 and earlier) and
Standards Case that exceed 92 lm/W and are 32.5W. Source: Department of Energy. Energy Conservation Standards and
Test Procedures for General Service Fluorescent Lamps and Incandescent Reflector Lamps; Final Rule Technical Support
Document, "Table 10.4 Base Case Market-Share Matrix for Four-Foot T8 Medium Bipin Systems in the Commercial
0%
20%
40%
60%
80%
100%
Energy Trust's Program Pacific Northwest
Mar
ket
Pen
etra
tio
n
Other
4 lamp T12
3 lamp T12
2 lamp T12
1 lamp T12
Page 27 Final Report – Phase I
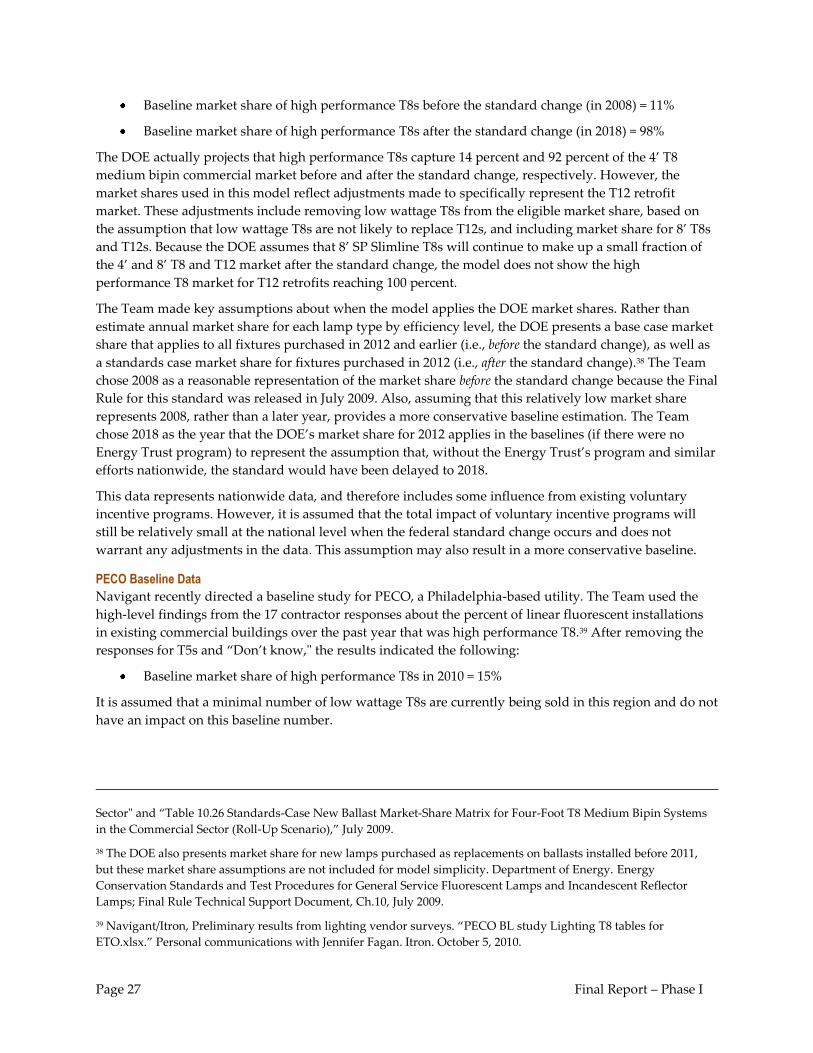
Baseline market share of high performance T8s before the standard change (in 2008) = 11%
Baseline market share of high performance T8s after the standard change (in 2018) = 98%
The DOE actually projects that high performance T8s capture 14 percent and 92 percent of the 4’ T8
medium bipin commercial market before and after the standard change, respectively. However, the
market shares used in this model reflect adjustments made to specifically represent the T12 retrofit
market. These adjustments include removing low wattage T8s from the eligible market share, based on
the assumption that low wattage T8s are not likely to replace T12s, and including market share for 8’ T8s
and T12s. Because the DOE assumes that 8’ SP Slimline T8s will continue to make up a small fraction of
the 4’ and 8’ T8 and T12 market after the standard change, the model does not show the high
performance T8 market for T12 retrofits reaching 100 percent.
The Team made key assumptions about when the model applies the DOE market shares. Rather than
estimate annual market share for each lamp type by efficiency level, the DOE presents a base case market
share that applies to all fixtures purchased in 2012 and earlier (i.e., before the standard change), as well as
a standards case market share for fixtures purchased in 2012 (i.e., after the standard change).38 The Team
chose 2008 as a reasonable representation of the market share before the standard change because the Final
Rule for this standard was released in July 2009. Also, assuming that this relatively low market share
represents 2008, rather than a later year, provides a more conservative baseline estimation. The Team
chose 2018 as the year that the DOE’s market share for 2012 applies in the baselines (if there were no
Energy Trust program) to represent the assumption that, without the Energy Trust’s program and similar
efforts nationwide, the standard would have been delayed to 2018.
This data represents nationwide data, and therefore includes some influence from existing voluntary
incentive programs. However, it is assumed that the total impact of voluntary incentive programs will
still be relatively small at the national level when the federal standard change occurs and does not
warrant any adjustments in the data. This assumption may also result in a more conservative baseline.
PECO Baseline Data
Navigant recently directed a baseline study for PECO, a Philadelphia-based utility. The Team used the
high-level findings from the 17 contractor responses about the percent of linear fluorescent installations
in existing commercial buildings over the past year that was high performance T8.39 After removing the
responses for T5s and “Don’t know," the results indicated the following:
Baseline market share of high performance T8s in 2010 = 15%
It is assumed that a minimal number of low wattage T8s are currently being sold in this region and do not
have an impact on this baseline number.
Sector" and “Table 10.26 Standards-Case New Ballast Market-Share Matrix for Four-Foot T8 Medium Bipin Systems
in the Commercial Sector (Roll-Up Scenario),” July 2009.
38 The DOE also presents market share for new lamps purchased as replacements on ballasts installed before 2011,
but these market share assumptions are not included for model simplicity. Department of Energy. Energy
Conservation Standards and Test Procedures for General Service Fluorescent Lamps and Incandescent Reflector
Lamps; Final Rule Technical Support Document, Ch.10, July 2009.
39 Navigant/Itron, Preliminary results from lighting vendor surveys. “PECO BL study Lighting T8 tables for
ETO.xlsx.” Personal communications with Jennifer Fagan. Itron. October 5, 2010.

Page 28 Final Report – Phase I
Texas Baseline Data
The Team also looked at the summary results from a 2008 statewide potential study done for the Public
Utilities Commission of Texas.40 As part of this study, non-residential customers reporting a retrofit of a
linear fluorescent system were asked to report the type of lamps installed during the retrofit. After
removing the responses for T5s and “Don’t know," the results indicated the following:
Baseline market share of high performance T8s in 2008 = 18%
It is assumed that a minimal number of low wattage T8s were being sold in this region at the time of the
study and do not have an impact on this baseline number.
Estimated Baseline Market Penetration
Figure 9 shows the estimated baseline, which has been extrapolated based on the three sources described
above and the assumption that there were no significant sales of high performance T8s before 2003. The
jump in market share in 2018 represents the federal standard change, based on the following timing:
2012 Actual Year for Federal Standard Change
+ 5 Years Federal Standard Change Delayed without Energy Trust Program (see Section 4.2)
+ 1 Year for Full Market Conversion of Sales (see Section 4.5)
= 2018 Assumed Year for Baseline Market Conversion Due to Federal Standard Change
40 Itron, Inc. “Assessment of the Feasible and Achievable Levels of Electricity Savings from Investor Owned Utilities
in Texas: 2009-2018.” Prepared for the Texas Public Utilities Commission. December 10, 2008.
Page 29 Final Report – Phase I
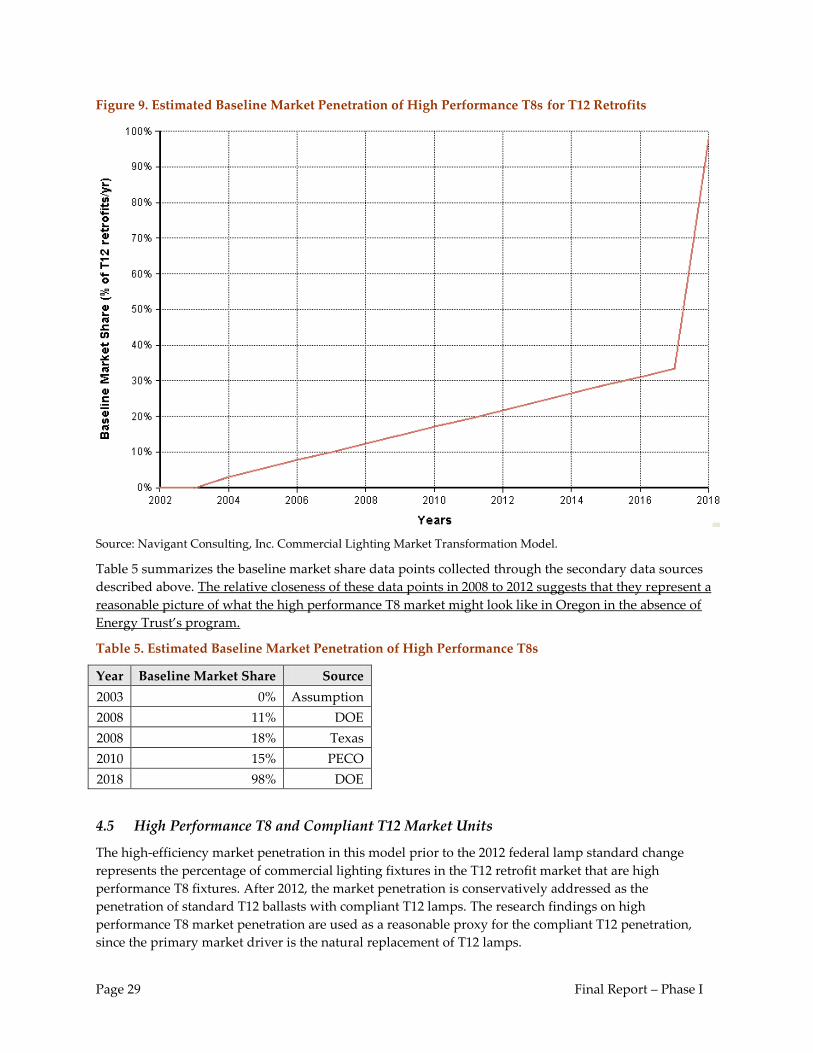
Figure 9. Estimated Baseline Market Penetration of High Performance T8s for T12 Retrofits
Source: Navigant Consulting, Inc. Commercial Lighting Market Transformation Model.
Table 5 summarizes the baseline market share data points collected through the secondary data sources
described above. The relative closeness of these data points in 2008 to 2012 suggests that they represent a
reasonable picture of what the high performance T8 market might look like in Oregon in the absence of
Energy Trust’s program.
Table 5. Estimated Baseline Market Penetration of High Performance T8s
Year Baseline Market Share Source
2003 0% Assumption
2008 11% DOE
2008 18% Texas
2010 15% PECO
2018 98% DOE
4.5 High Performance T8 and Compliant T12 Market Units
The high-efficiency market penetration in this model prior to the 2012 federal lamp standard change
represents the percentage of commercial lighting fixtures in the T12 retrofit market that are high
performance T8 fixtures. After 2012, the market penetration is conservatively addressed as the
penetration of standard T12 ballasts with compliant T12 lamps. The research findings on high
performance T8 market penetration are used as a reasonable proxy for the compliant T12 penetration,
since the primary market driver is the natural replacement of T12 lamps.
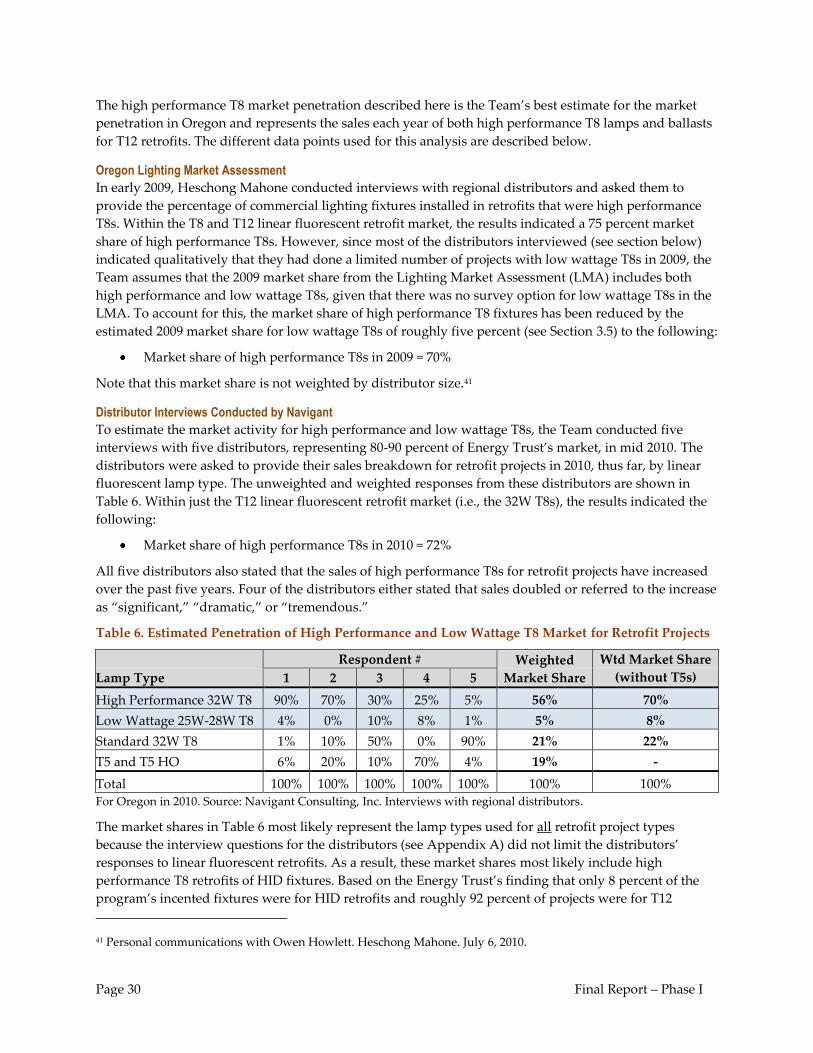
Page 30 Final Report – Phase I
The high performance T8 market penetration described here is the Team’s best estimate for the market
penetration in Oregon and represents the sales each year of both high performance T8 lamps and ballasts
for T12 retrofits. The different data points used for this analysis are described below.
Oregon Lighting Market Assessment
In early 2009, Heschong Mahone conducted interviews with regional distributors and asked them to
provide the percentage of commercial lighting fixtures installed in retrofits that were high performance
T8s. Within the T8 and T12 linear fluorescent retrofit market, the results indicated a 75 percent market
share of high performance T8s. However, since most of the distributors interviewed (see section below)
indicated qualitatively that they had done a limited number of projects with low wattage T8s in 2009, the
Team assumes that the 2009 market share from the Lighting Market Assessment (LMA) includes both
high performance and low wattage T8s, given that there was no survey option for low wattage T8s in the
LMA. To account for this, the market share of high performance T8 fixtures has been reduced by the
estimated 2009 market share for low wattage T8s of roughly five percent (see Section 3.5) to the following:
Market share of high performance T8s in 2009 = 70%
Note that this market share is not weighted by distributor size.41
Distributor Interviews Conducted by Navigant
To estimate the market activity for high performance and low wattage T8s, the Team conducted five
interviews with five distributors, representing 80-90 percent of Energy Trust’s market, in mid 2010. The
distributors were asked to provide their sales breakdown for retrofit projects in 2010, thus far, by linear
fluorescent lamp type. The unweighted and weighted responses from these distributors are shown in
Table 6. Within just the T12 linear fluorescent retrofit market (i.e., the 32W T8s), the results indicated the
following:
Market share of high performance T8s in 2010 = 72%
All five distributors also stated that the sales of high performance T8s for retrofit projects have increased
over the past five years. Four of the distributors either stated that sales doubled or referred to the increase
as “significant,” “dramatic,” or “tremendous.”
Table 6. Estimated Penetration of High Performance and Low Wattage T8 Market for Retrofit Projects
Lamp Type
Respondent # Weighted
Market Share
Wtd Market Share
(without T5s) 1 2 3 4 5
High Performance 32W T8 90% 70% 30% 25% 5% 56% 70%
Low Wattage 25W-28W T8 4% 0% 10% 8% 1% 5% 8%
Standard 32W T8 1% 10% 50% 0% 90% 21% 22%
T5 and T5 HO 6% 20% 10% 70% 4% 19% -
Total 100% 100% 100% 100% 100% 100% 100%
For Oregon in 2010. Source: Navigant Consulting, Inc. Interviews with regional distributors.
The market shares in Table 6 most likely represent the lamp types used for all retrofit project types
because the interview questions for the distributors (see Appendix A) did not limit the distributors’
responses to linear fluorescent retrofits. As a result, these market shares most likely include high
performance T8 retrofits of HID fixtures. Based on the Energy Trust’s finding that only 8 percent of the
program’s incented fixtures were for HID retrofits and roughly 92 percent of projects were for T12
41 Personal communications with Owen Howlett. Heschong Mahone. July 6, 2010.
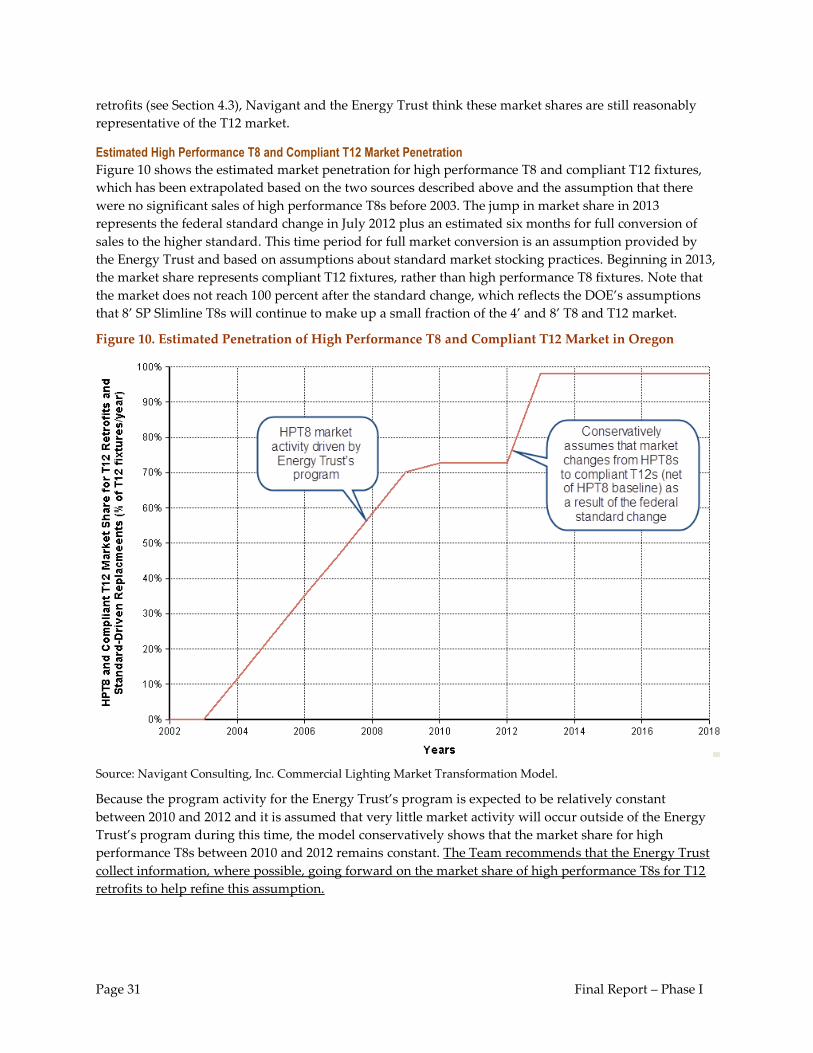
Page 31 Final Report – Phase I
retrofits (see Section 4.3), Navigant and the Energy Trust think these market shares are still reasonably
representative of the T12 market.
Estimated High Performance T8 and Compliant T12 Market Penetration
Figure 10 shows the estimated market penetration for high performance T8 and compliant T12 fixtures,
which has been extrapolated based on the two sources described above and the assumption that there
were no significant sales of high performance T8s before 2003. The jump in market share in 2013
represents the federal standard change in July 2012 plus an estimated six months for full conversion of
sales to the higher standard. This time period for full market conversion is an assumption provided by
the Energy Trust and based on assumptions about standard market stocking practices. Beginning in 2013,
the market share represents compliant T12 fixtures, rather than high performance T8 fixtures. Note that
the market does not reach 100 percent after the standard change, which reflects the DOE’s assumptions
that 8’ SP Slimline T8s will continue to make up a small fraction of the 4’ and 8’ T8 and T12 market.
Figure 10. Estimated Penetration of High Performance T8 and Compliant T12 Market in Oregon
Source: Navigant Consulting, Inc. Commercial Lighting Market Transformation Model.
Because the program activity for the Energy Trust’s program is expected to be relatively constant
between 2010 and 2012 and it is assumed that very little market activity will occur outside of the Energy
Trust’s program during this time, the model conservatively shows that the market share for high
performance T8s between 2010 and 2012 remains constant. The Team recommends that the Energy Trust
collect information, where possible, going forward on the market share of high performance T8s for T12
retrofits to help refine this assumption.
Page 32 Final Report – Phase I
4.6 Total Retrofit/Standard-Driven Replacement Market Units
The total market for this analysis is defined as the retrofit and standard-driven replacement market for 4’
and 8’ T12 fixtures. Thus, this encompasses all of the linear fluorescent fixtures sold each year to retrofit 4’
and 8’ T12 fixtures, including standard T8 lamps with standard ballasts, high performance T8s with
standard ballasts, and high performance T8s with high performance ballasts. Of these, only high
performance T8s with high performance ballasts are considered “high efficiency” for the purposes of this
analysis. The total market also looks at the natural replacement market for T12 fixtures, once the 2012
federal standard change has taken effect and the Energy Trust’s incentive program for high performance
T8s has ended. This analysis refers to the natural replacement market as the “standard-driven
replacement market” and assumes that standard T12 lamps are replaced with compliant T12 lamps in a
standard T12 ballast as a result of the standard change.
To capture the full T12 retrofit market over time using available data sources, the Team estimated the
market using three primary drivers: CBSA data (2002-2007), Energy Trust program data and high
performance T8 market share (2007-2013), and assumptions about the natural replacement rate of T12s
(2013-2018). These three drivers are discussed more below.
Total Market Units: CBSA Data (2002-2007)
The Team used regional and Oregon-specific data available through NEEA’s 2002 and 2007 Commercial
Building Stock Assessments (CBSA) to calculate the total market units in 2002-2007. Specifically, the Team
used the CBSA data for the percent of existing lamps by lamp type and square footage to calculate
installed capacity. This approach is consistent with California’s recent market effects study for high-bay
lighting42 and was applied according to the equation below.
Input Parameter Source
% of Oregon’s square footage represented by linear fluorescent type (% of sqft) 2002 and 2007
CBSA
x Commercial square footage in Energy Trust’s service territory (sqft) Energy Trust,
6th Power Plan
x Average lighting power density in Oregon (W/sqft) Oregon LMA
÷ Average fixture wattages for T12s (W/fixture) Energy Trust
Number of existing T12 fixtures (fixtures) Calculated
This approach provided the total number of fixtures installed in the years the commercial building stock
was assessed in the Northwest (i.e., 2002 and 2007). Between 2002 and 2007, it is estimated that T12 stock
decreased from 31 percent to 28 percent in Oregon,43,44 or by roughly 175 thousand fixtures. Considering
42 KEMA Inc. and Itron, Inc. High Bay Lighting Market Effects Study. Prepared for California Public Utilities
Commission. June 18, 2010.
43 Navigant analysis and raw dataset for KEMA-XENERGY Inc. Northwest Commercial Building Stock Assessment.
Prepared for Northwest Energy Efficiency Alliance. March 8, 2004.
Page 33 Final Report – Phase I
that the Energy Trust’s program retrofit about 57 thousand T12s with high performance T8s during this
time, it appears that the Energy Trust’s program was responsible for about 33 percent of this decrease,
with the remaining T12s being retrofit by standard T8s. This model assumes that the decrease in T12
stock occurred linearly between 2002 and 2007.
Total Market Units: Energy Trust Program Data and High Performance T8 Market Share (2007-2013)
To estimate the activity in the T12 retrofit market that has occurred since the most recent CBSA, the total
market units for the years between the 2007 CBSA and full conversion of the market after the federal
lamp standard (i.e., 2013) are calculated using the Energy Trust’s program data and the portion of the
total T12 retrofit market that Energy Trust’s program represents, according to the following relationship:
Input Parameter Source
Energy Trust’s program units (fixtures for T12 retrofits) Energy Trust
÷ Portion of market represented by Energy Trust’s program
(% of fixtures for T12 retrofits) Oregon LMA, distributor interviews
Total market units (fixtures for T12 retrofits) Calculated
Because the number of program units each year and the high-efficiency market penetration in 2009 and
2010 are known (as discussed in Section 4.3), the size of the high-efficiency market for 2009-2010 is also
known. This approach leverages the finding in Section 4.1that very few high performance T8 fixtures
have been sold for T12 retrofits outside of the Energy Trust’s program. The total market units in 2007-
2008 and 2011-2013 are based on the estimated market share of high performance T8s, presented in Figure
10.
Total Market Units: Standard-Driven T12 Replacement Market (2013-2018)
Once standard T12 lamps are no longer being sold in Oregon as a result of the federal standard change
and the Energy Trust’s current incentive ends, assumed to be around the end of 2012, the removal of the
standard T12 lamps installed stock will be driven by the rate of T12 lamp retirements. Since customers
will no longer be able to purchase replacement standardT12 lamps or standard T8 lamps under the new
federal standard, the customer will have to purchase a compliant T12 lamp for their T12 ballast.
The rate of T12 lamp replacement is assumed to be driven by the number of T12 fixtures installed as of
2012 and the average lifetime of a T12 lamp. In 2012, the Team estimates that around 1.44 million T12
fixtures will still be installed in Energy Trust’s service territory (see Table 7). Using input from the Energy
Trust, the Team assumes an average lifetime of about 5.3 years for a T12 lamp.45 If it is conservatively
assumed that the T12 retrofit market has been removing T12s from the market independently of the
lamp’s age, not just targeting the oldest T12 lamps, then it can be assumed that the installed stock of T12s
in 2012 has an equal distribution of lamp lifetimes (e.g., there is roughly the same number of lamps in the
first year of life as in the fifth year of life).
44 Navigant analysis and raw dataset for The Cadmus Group, Inc. Northwest Commercial Building Stock Assessment.
Prepared for Northwest Energy Efficiency Alliance. December 21, 2009.
45 Based on a 20,000 hour lamp life for T12s and average operating hours of 3,765 hours per year for commercial
applications. Personal communications with Nick O’Neil and Matt Braman at Energy Trust, January 13, 2011.
Page 34 Final Report – Phase I
This approach suggests that around 270 thousand46 standard T12 lamps will burn out each year for 5.3
years after 2012 and that the installed stock of standard T12s will disappear by mid-2018. The 270
thousand T12s being removed from the market each year would be equivalent to the number of high
performance T8s being sold for T12 replacements each year during that time period. However, in light of
recent changes to the market, it seems possible that these standard T12 lamps will be replaced by
compliant T12 lamps instead, depending on the design of the 2014 federal ballast standard change and
the market acceptance of the compliant T12 lamps.
Because the Team found evidence that the Energy Trust’s program had a proportional influence in
accelerating the federal standard change, it is recommended that the Energy Trust can reasonably claim
the incremental savings above the baseline for the T12 replacements after 2012 and before the assumed
year that the standard would have changed without the Energy Trust’s program (i.e., 2017 plus one year
for market conversion). These savings are reported as standard T12 replacements with compliant T12s.
It should be noted that the model conservatively assumes that all of the lamps in a fixture burnout at the
same time (as opposed to the burnout of one lamp in a three-lamp fixture causing early retirement for the
entire fixture).
Total Market Units Findings
The Team used the three approaches described above to estimate the total number of T12 fixtures
replaced by either standard T8 or high performance T8 fixtures between 2002 and 2018. With these
approaches, the Team estimates that the Energy Trust’s program will ultimately be responsible for about
60 percent of the T12 retrofits between 2002 and 2012. Since the retrofit projects between 2002 and 2012
are directly driven by program incentives, it is assumed that Energy Trust can only claim market
transformation savings attributed as a result of the accelerated federal standard change (i.e., the
difference between the baseline and the high-efficiency market between 2013 and 2018). The Team also
estimates that all standard T12 lamps will be removed from Energy Trust’s territory by mid-2018.
The findings for installed standard T12 stock and T12s retrofit with standard and high performance T8s
are shown below in Figure 11 and Table 7.
46 This is based on around 1.44 million lamps divided by 5.3 years, which equals about 270 thousand lamps per year.
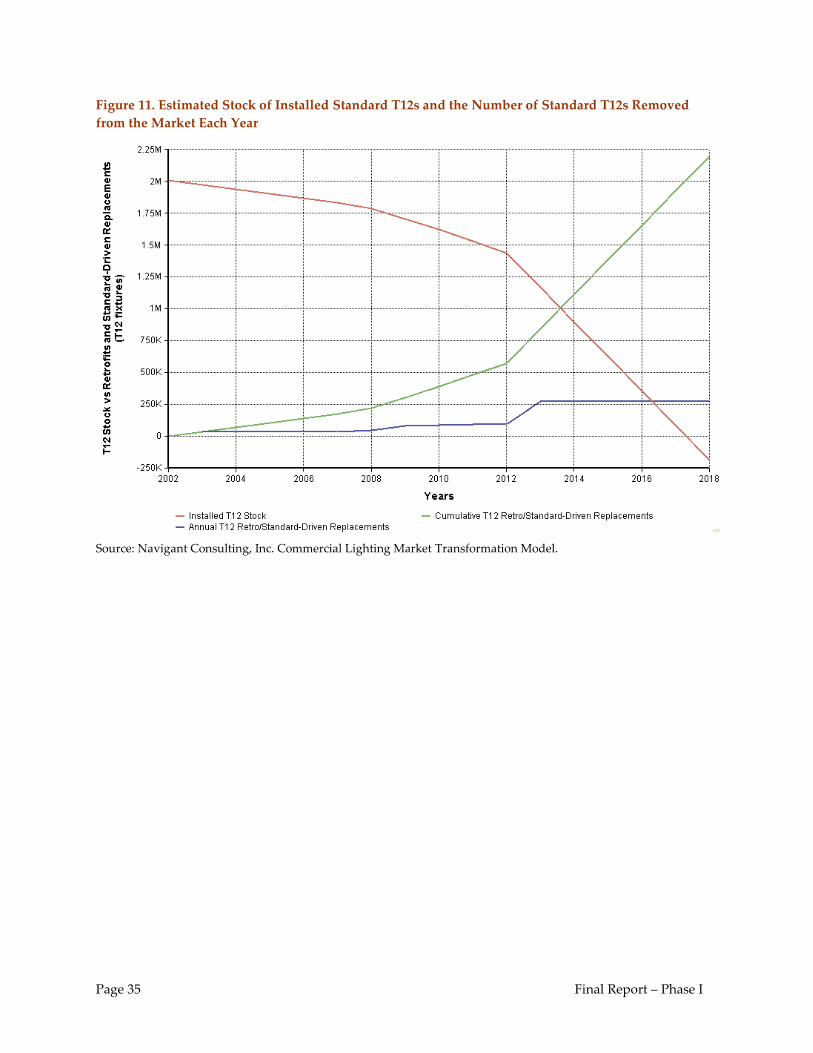
Page 35 Final Report – Phase I
Figure 11. Estimated Stock of Installed Standard T12s and the Number of Standard T12s Removed
from the Market Each Year
Source: Navigant Consulting, Inc. Commercial Lighting Market Transformation Model.
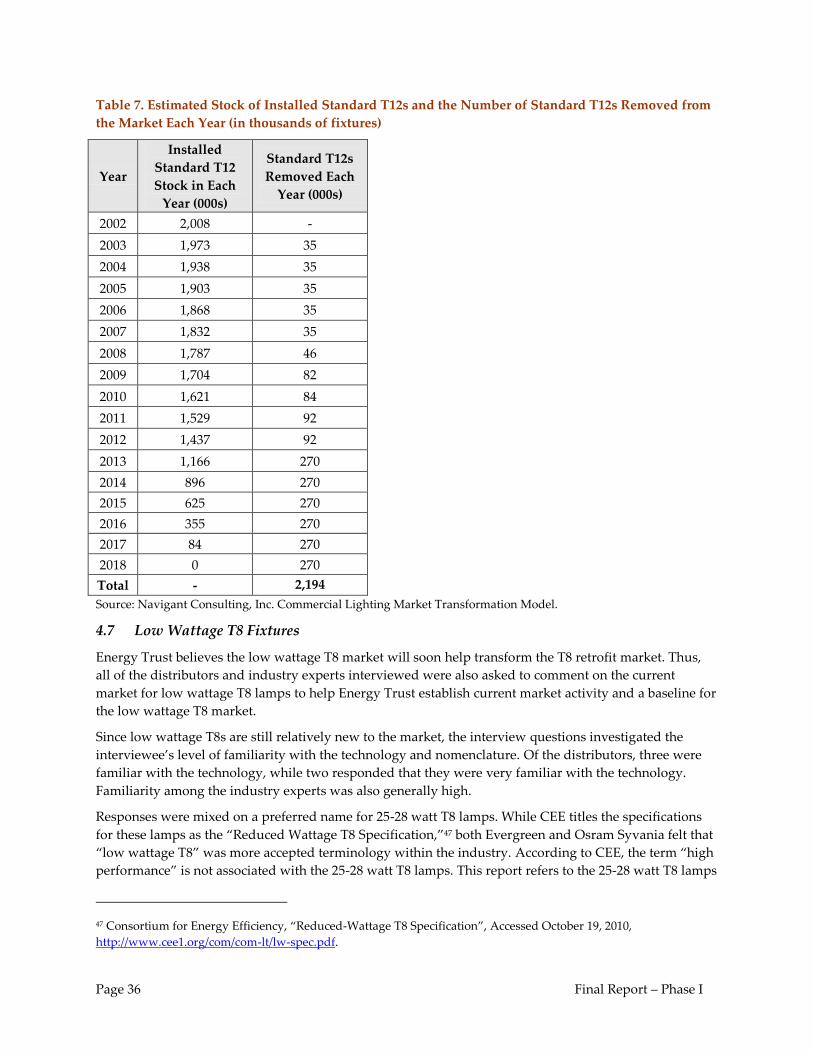
Page 36 Final Report – Phase I
Table 7. Estimated Stock of Installed Standard T12s and the Number of Standard T12s Removed from
the Market Each Year (in thousands of fixtures)
Year
Installed
Standard T12
Stock in Each
Year (000s)
Standard T12s
Removed Each
Year (000s)
2002 2,008 -
2003 1,973 35
2004 1,938 35
2005 1,903 35
2006 1,868 35
2007 1,832 35
2008 1,787 46
2009 1,704 82
2010 1,621 84
2011 1,529 92
2012 1,437 92
2013 1,166 270
2014 896 270
2015 625 270
2016 355 270
2017 84 270
2018 0 270
Total - 2,194
Source: Navigant Consulting, Inc. Commercial Lighting Market Transformation Model.
4.7 Low Wattage T8 Fixtures
Energy Trust believes the low wattage T8 market will soon help transform the T8 retrofit market. Thus,
all of the distributors and industry experts interviewed were also asked to comment on the current
market for low wattage T8 lamps to help Energy Trust establish current market activity and a baseline for
the low wattage T8 market.
Since low wattage T8s are still relatively new to the market, the interview questions investigated the
interviewee’s level of familiarity with the technology and nomenclature. Of the distributors, three were
familiar with the technology, while two responded that they were very familiar with the technology.
Familiarity among the industry experts was also generally high.
Responses were mixed on a preferred name for 25-28 watt T8 lamps. While CEE titles the specifications
for these lamps as the “Reduced Wattage T8 Specification,”47 both Evergreen and Osram Syvania felt that
“low wattage T8” was more accepted terminology within the industry. According to CEE, the term “high
performance” is not associated with the 25-28 watt T8 lamps. This report refers to the 25-28 watt T8 lamps
47 Consortium for Energy Efficiency, “Reduced-Wattage T8 Specification”, Accessed October 19, 2010,
http://www.cee1.org/com/com-lt/lw-spec.pdf.
Page 37 Final Report – Phase I
that meet CEE’s specifications as “low wattage” T8s to maintain consistency with the more common
regional usage.
Interviewees were also asked to speculate on where the market share for low wattage T8s will be in five
years. There was no clear consensus among the responses, although a few key themes are apparent:
28 watt T8 lamps are likely to be more widely accepted than 25 watt T8 lamps, due to ballast
compatibility issues and reduced lighting output with the 25 watt T8 lamps. Of the four
distributors currently selling low wattage T8 lamps, three are focusing on 28 watt over 25 watt
T8s, and the fourth didn’t know. Only one of the industry experts felt that 25 watt T8s would
dominate the market, although it is worth noting that Evergreen intends to put significant effort
into the promotion of 25 watt T8s.
Replacement of first generation T8s will likely drive the low wattage T8 retrofit market.
Responses were mixed on the potential for low wattage T8s to replace high performance T8s in
low-bay applications. Three distributors thought that they could be a replacement, at least in
some applications, while two thought it was not likely.
The market for low wattage T8s is expected to grow, but the amount of growth is uncertain. The
primary drivers are likely to be a continued emphasis on energy efficiency, changes to standards
and codes, and the potential for low-cost/no-cost upgrades that don’t require renovation.
Distributors were asked about their current and planned low wattage T8 activities. The distributor
responses below are consistent with the finding that the low wattage T8 market will grow, with the
exception of Respondent #2:
Respondent #1: Proposes 25 and 28 watt T8s to customers with first generation T8s.
Respondent #2: Not currently working with low wattage T8 lamps, and does not plan to in the
future, because he feels that high performance T8s are a good value, he does not want to confuse
maintenance personnel with multiple options for lamps, and there are other ways to achieve
energy savings (e.g., lighting controls).
Respondent #3: Has installed a few low wattage T8s and currently displays 28 watt T8s in the
showroom.
Respondent #4: Uses 28 watt T8s and intends to increase 28 watt T8 usage, particularly in
commercial retrofits of office buildings.
Respondent #5: Has installed low wattage T8s in a couple of cases and is using this technology
instead of high performance T8s.
To help assess whether distributor and the industry expert responses are already being driven by
anticipated support from incentives, interviewees were also asked where they thought the market for low
wattage T8s would be in five years without incentive programs. As noted above, one distributor stated that
he won’t be promoting them, even with the incentive program. The other four distributors felt that
Energy Trust’s incentives and tax credits were key drivers of growth, although one distributor noted that
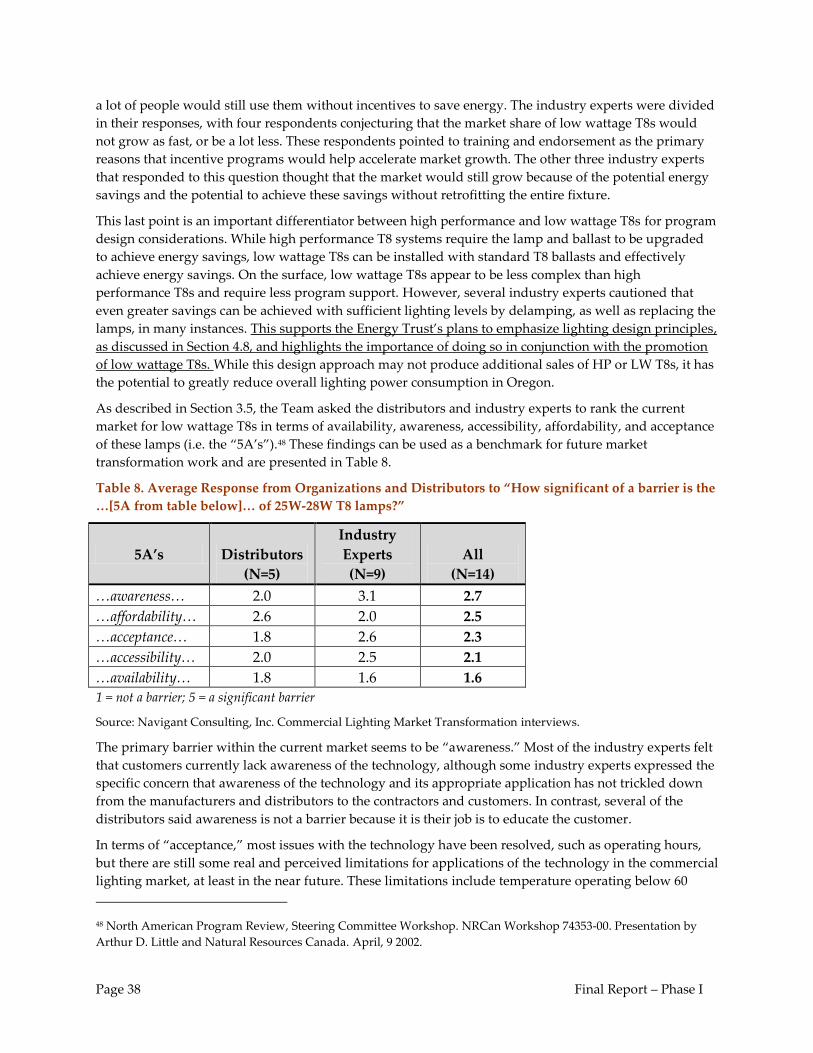
Page 38 Final Report – Phase I
a lot of people would still use them without incentives to save energy. The industry experts were divided
in their responses, with four respondents conjecturing that the market share of low wattage T8s would
not grow as fast, or be a lot less. These respondents pointed to training and endorsement as the primary
reasons that incentive programs would help accelerate market growth. The other three industry experts
that responded to this question thought that the market would still grow because of the potential energy
savings and the potential to achieve these savings without retrofitting the entire fixture.
This last point is an important differentiator between high performance and low wattage T8s for program
design considerations. While high performance T8 systems require the lamp and ballast to be upgraded
to achieve energy savings, low wattage T8s can be installed with standard T8 ballasts and effectively
achieve energy savings. On the surface, low wattage T8s appear to be less complex than high
performance T8s and require less program support. However, several industry experts cautioned that
even greater savings can be achieved with sufficient lighting levels by delamping, as well as replacing the
lamps, in many instances. This supports the Energy Trust’s plans to emphasize lighting design principles,
as discussed in Section 4.8, and highlights the importance of doing so in conjunction with the promotion
of low wattage T8s. While this design approach may not produce additional sales of HP or LW T8s, it has
the potential to greatly reduce overall lighting power consumption in Oregon.
As described in Section 3.5, the Team asked the distributors and industry experts to rank the current
market for low wattage T8s in terms of availability, awareness, accessibility, affordability, and acceptance
of these lamps (i.e. the “5A’s”).48 These findings can be used as a benchmark for future market
transformation work and are presented in Table 8.
Table 8. Average Response from Organizations and Distributors to “How significant of a barrier is the
…[5A from table below]… of 25W-28W T8 lamps?”
5A’s Distributors
(N=5)
Industry
Experts
(N=9)
All
(N=14)
…awareness… 2.0 3.1 2.7
…affordability… 2.6 2.0 2.5
…acceptance… 1.8 2.6 2.3
…accessibility… 2.0 2.5 2.1
…availability… 1.8 1.6 1.6
1 = not a barrier; 5 = a significant barrier
Source: Navigant Consulting, Inc. Commercial Lighting Market Transformation interviews.
The primary barrier within the current market seems to be “awareness.” Most of the industry experts felt
that customers currently lack awareness of the technology, although some industry experts expressed the
specific concern that awareness of the technology and its appropriate application has not trickled down
from the manufacturers and distributors to the contractors and customers. In contrast, several of the
distributors said awareness is not a barrier because it is their job is to educate the customer.
In terms of “acceptance,” most issues with the technology have been resolved, such as operating hours,
but there are still some real and perceived limitations for applications of the technology in the commercial
lighting market, at least in the near future. These limitations include temperature operating below 60
48 North American Program Review, Steering Committee Workshop. NRCan Workshop 74353-00. Presentation by
Arthur D. Little and Natural Resources Canada. April, 9 2002.
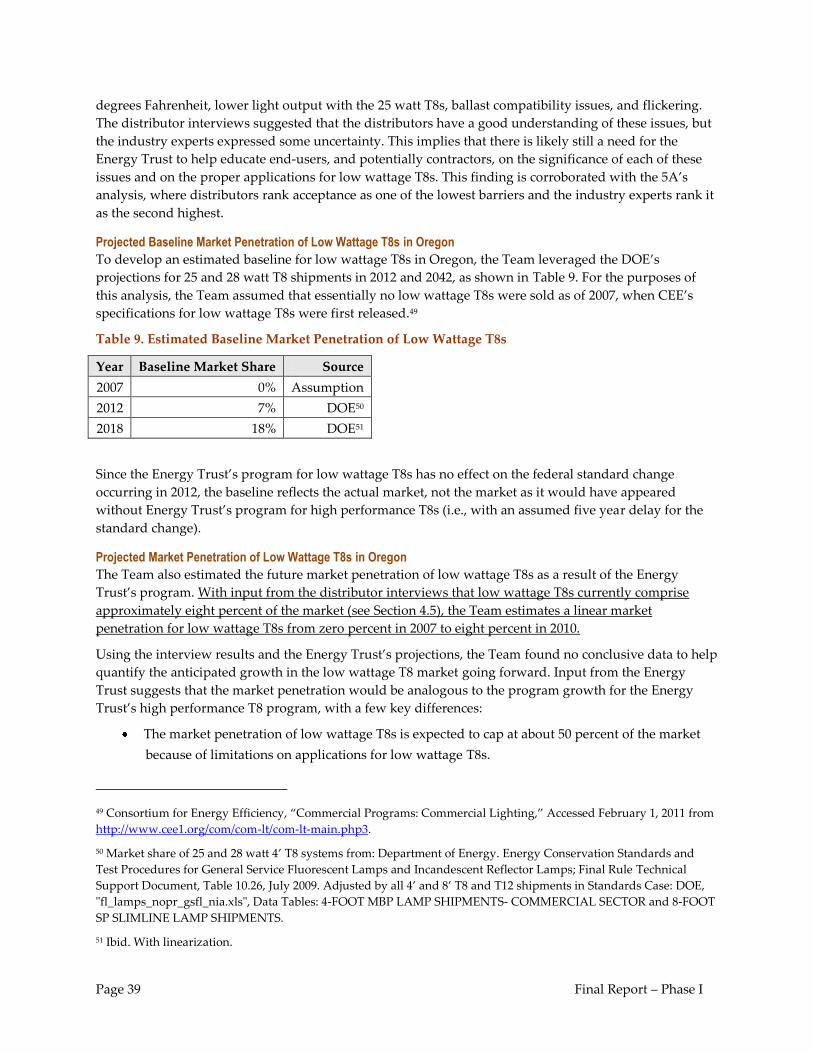
Page 39 Final Report – Phase I
degrees Fahrenheit, lower light output with the 25 watt T8s, ballast compatibility issues, and flickering.
The distributor interviews suggested that the distributors have a good understanding of these issues, but
the industry experts expressed some uncertainty. This implies that there is likely still a need for the
Energy Trust to help educate end-users, and potentially contractors, on the significance of each of these
issues and on the proper applications for low wattage T8s. This finding is corroborated with the 5A’s
analysis, where distributors rank acceptance as one of the lowest barriers and the industry experts rank it
as the second highest.
Projected Baseline Market Penetration of Low Wattage T8s in Oregon
To develop an estimated baseline for low wattage T8s in Oregon, the Team leveraged the DOE’s
projections for 25 and 28 watt T8 shipments in 2012 and 2042, as shown in Table 9. For the purposes of
this analysis, the Team assumed that essentially no low wattage T8s were sold as of 2007, when CEE’s
specifications for low wattage T8s were first released.49
Table 9. Estimated Baseline Market Penetration of Low Wattage T8s
Year Baseline Market Share Source
2007 0% Assumption
2012 7% DOE50
2018 18% DOE51
Since the Energy Trust’s program for low wattage T8s has no effect on the federal standard change
occurring in 2012, the baseline reflects the actual market, not the market as it would have appeared
without Energy Trust’s program for high performance T8s (i.e., with an assumed five year delay for the
standard change).
Projected Market Penetration of Low Wattage T8s in Oregon
The Team also estimated the future market penetration of low wattage T8s as a result of the Energy
Trust’s program. With input from the distributor interviews that low wattage T8s currently comprise
approximately eight percent of the market (see Section 4.5), the Team estimates a linear market
penetration for low wattage T8s from zero percent in 2007 to eight percent in 2010.
Using the interview results and the Energy Trust’s projections, the Team found no conclusive data to help
quantify the anticipated growth in the low wattage T8 market going forward. Input from the Energy
Trust suggests that the market penetration would be analogous to the program growth for the Energy
Trust’s high performance T8 program, with a few key differences:
The market penetration of low wattage T8s is expected to cap at about 50 percent of the market
because of limitations on applications for low wattage T8s.
49 Consortium for Energy Efficiency, “Commercial Programs: Commercial Lighting,” Accessed February 1, 2011 from
http://www.cee1.org/com/com-lt/com-lt-main.php3.
50 Market share of 25 and 28 watt 4’ T8 systems from: Department of Energy. Energy Conservation Standards and
Test Procedures for General Service Fluorescent Lamps and Incandescent Reflector Lamps; Final Rule Technical
Support Document, Table 10.26, July 2009. Adjusted by all 4’ and 8’ T8 and T12 shipments in Standards Case: DOE,
"fl_lamps_nopr_gsfl_nia.xls", Data Tables: 4-FOOT MBP LAMP SHIPMENTS- COMMERCIAL SECTOR and 8-FOOT
SP SLIMLINE LAMP SHIPMENTS.
51 Ibid. With linearization.
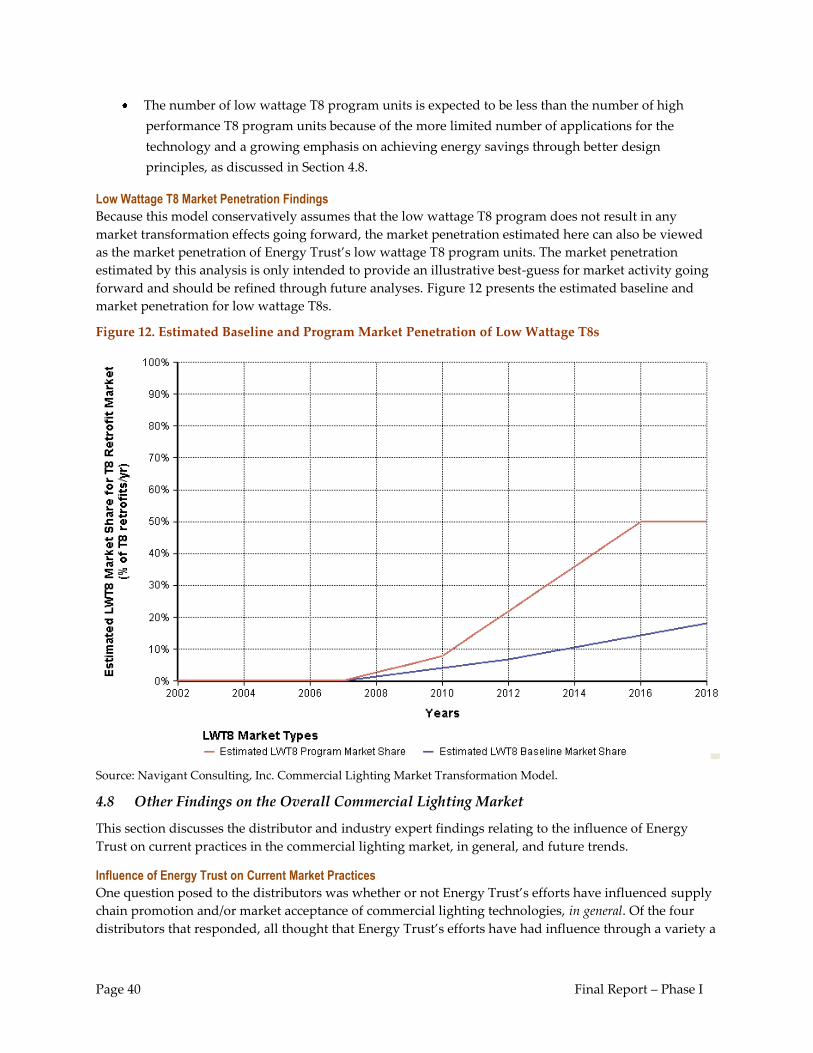
Page 40 Final Report – Phase I
The number of low wattage T8 program units is expected to be less than the number of high
performance T8 program units because of the more limited number of applications for the
technology and a growing emphasis on achieving energy savings through better design
principles, as discussed in Section 4.8.
Low Wattage T8 Market Penetration Findings
Because this model conservatively assumes that the low wattage T8 program does not result in any
market transformation effects going forward, the market penetration estimated here can also be viewed
as the market penetration of Energy Trust’s low wattage T8 program units. The market penetration
estimated by this analysis is only intended to provide an illustrative best-guess for market activity going
forward and should be refined through future analyses. Figure 12 presents the estimated baseline and
market penetration for low wattage T8s.
Figure 12. Estimated Baseline and Program Market Penetration of Low Wattage T8s
Source: Navigant Consulting, Inc. Commercial Lighting Market Transformation Model.
4.8 Other Findings on the Overall Commercial Lighting Market
This section discusses the distributor and industry expert findings relating to the influence of Energy
Trust on current practices in the commercial lighting market, in general, and future trends.
Influence of Energy Trust on Current Market Practices
One question posed to the distributors was whether or not Energy Trust’s efforts have influenced supply
chain promotion and/or market acceptance of commercial lighting technologies, in general. Of the four
distributors that responded, all thought that Energy Trust’s efforts have had influence through a variety a
Page 41 Final Report – Phase I
mechanisms, including Energy Trust’s incentives, product endorsements, reputation, and program
assistance.
The Team also asked distributors whether or not Energy Trust’s programs influence the availability of
commercial lighting equipment on the market, in general. Again, all four of the respondents indicated that
they thought Energy Trust’s efforts have had influence on the high efficiency market. Specifically,
distributors mentioned that Energy Trust enables customers to consider technologies they wouldn’t
otherwise through incentives; ensures that technologies and projects meet a certain level of quality; and
pushes vendors to have their products on the “approved list.”
Influence of Energy Trust on Future Market Trends
From the industry expert surveys, there seems to be a relatively high degree of uncertainty in the
trajectory of the commercial lighting market, in terms of which products will take prominence (e.g., low
wattage 25-28 watt lamps, Osram’s 23 watt lamp, LEDs, lighting “kits” to emphasize system design
principles, etc.). In the near-term, Energy Trust will likely pursue the incremental savings between a
compliant T12 and a high performance T8. Once T12s have been removed from the market, Energy Trust
sees no single technical approach as the next step in the commercial lighting retrofit market: low wattage
lamps will fill some market niches, while other technologies and concepts like “retrofit by design” will fill
other niches.
The “retrofit by design” idea would go beyond traditional one-for-one lamp replacements and encourage
designers and contractors to think about lighting levels and system tuning. At least three regional and
one national interviewee explicitly mentioned moving the market towards these lighting design
principles to achieve energy savings in the future. This suggests that there is already some regional and
national buy-in with this concept and lays the groundwork for future Energy Trust and NEEA work in
this area.
4.9 Model Development and Model Results
As described in Section 3.6, this model assesses the market transformation impacts of Energy Trust’s high
performance T8 program, which began in 2003, and lays the groundwork for Energy Trust’s low wattage
T8 program, which began in 2010. This model also reflects the decreasing stock of installed T12s in
Energy Trust’s territory and the federal standard change that will take place in 2012 and drive a natural
replacement market for T12 lamps. Because the efforts conducted for this analysis attribute Energy Trust
with proportionate influence on accelerating this federal standard change from 2017 to 2012, the baseline
reflects the federal standard changing in 2017 (plus time to market conversion).
Commercial Lighting Market Transformation Model Results
The market transformation model produces results on the total high efficiency market,52 the baseline,53 the
market resulting from the federal standard change,54 and the impact of the program.55 The market
transformation piece indicates additional savings that may be claimed by the program in addition to the
formal program savings.
52 The total high efficiency market in this is analysis is estimated by the number of high performance T8 fixtures sold
to retrofit T12 fixtures.
53 The baseline is an estimate of what the market would look like in absence of the program. The baseline is estimated
by the number of units that would be high efficiency in absence of the program.
54 The standard-driven replacement market represents standard T12 lamps replaced with compliant T12 lamps.
55 The impact of the program is the impact from direct dollar incentives.
Page 42 Final Report – Phase I
Figure 13, Figure 14, and Table 10 show the results from the commercial lighting market transformation
model in terms of market share and number of T12 fixtures retrofit and replaced as a result of the
standard change. These charts begin in 2002 because Energy Trust began its initial commercial lighting
program efforts in 2002, although the first program incentives were not given until 2003. In Figure 13, the
difference between the high efficiency market (navy line) and the baseline (red area) after the federal
standard change provides the additional units and savings that can be claimed by Energy Trust through
market transformation. This green shaded area represents the influence that Energy Trust and other
voluntary incentive programs had on accelerating the federal standard change for fluorescent lamps by
about five years.
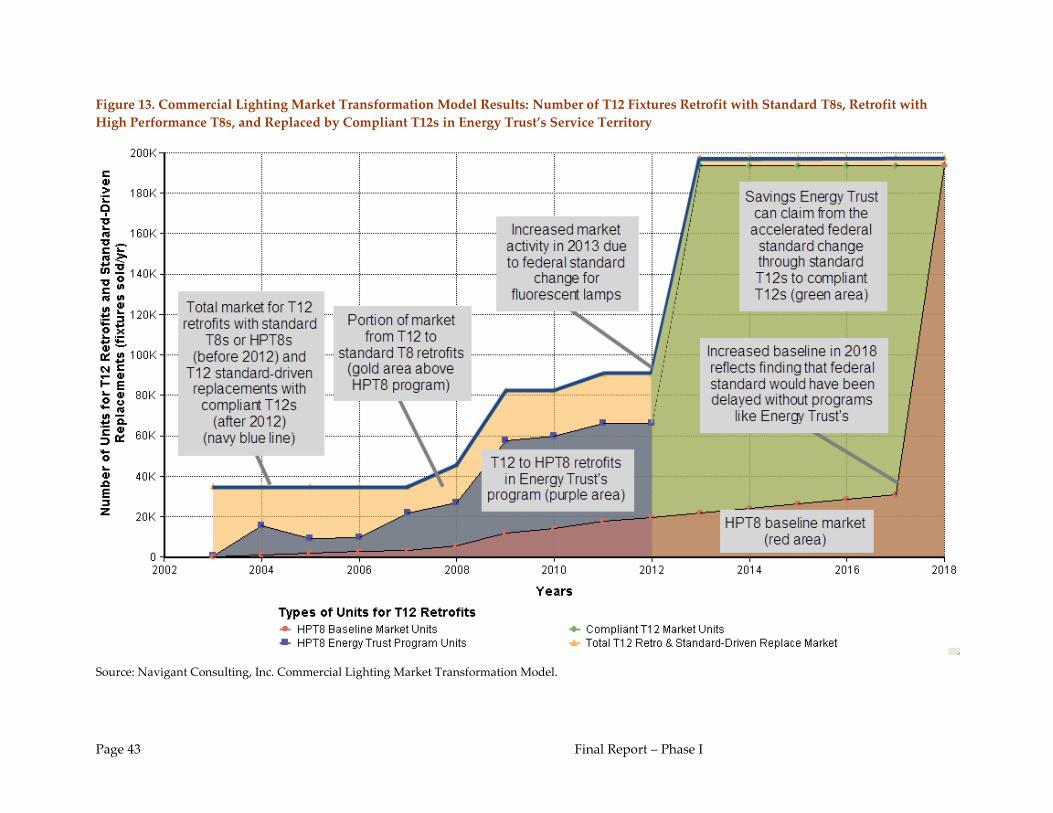
Page 43 Final Report – Phase I
Figure 13. Commercial Lighting Market Transformation Model Results: Number of T12 Fixtures Retrofit with Standard T8s, Retrofit with
High Performance T8s, and Replaced by Compliant T12s in Energy Trust’s Service Territory
Source: Navigant Consulting, Inc. Commercial Lighting Market Transformation Model.
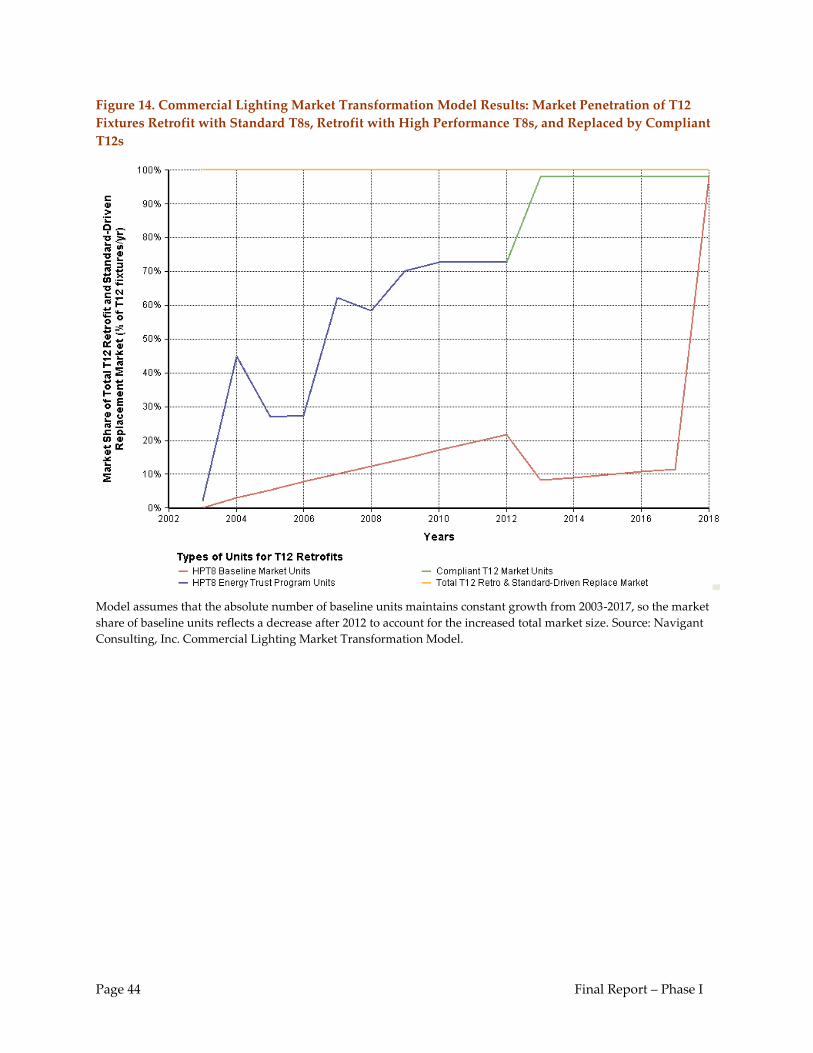
Page 44 Final Report – Phase I
Figure 14. Commercial Lighting Market Transformation Model Results: Market Penetration of T12
Fixtures Retrofit with Standard T8s, Retrofit with High Performance T8s, and Replaced by Compliant
T12s
Model assumes that the absolute number of baseline units maintains constant growth from 2003-2017, so the market
share of baseline units reflects a decrease after 2012 to account for the increased total market size. Source: Navigant
Consulting, Inc. Commercial Lighting Market Transformation Model.
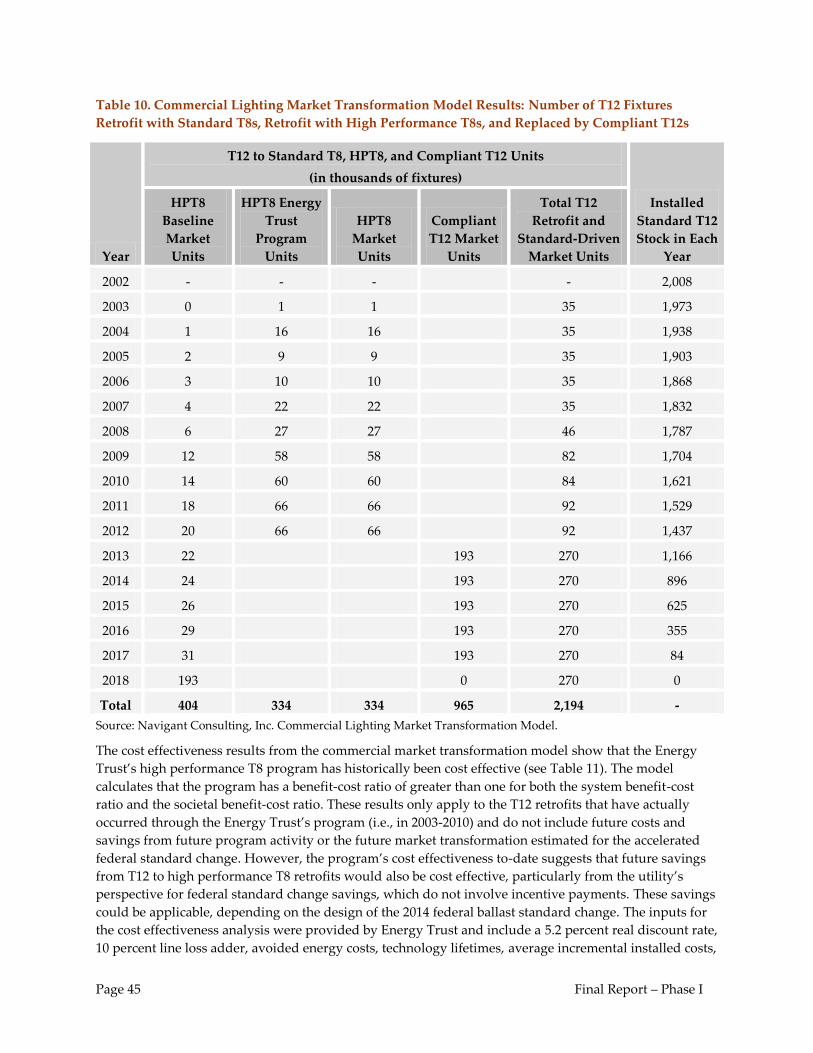
Page 45 Final Report – Phase I
Table 10. Commercial Lighting Market Transformation Model Results: Number of T12 Fixtures
Retrofit with Standard T8s, Retrofit with High Performance T8s, and Replaced by Compliant T12s
Year
T12 to Standard T8, HPT8, and Compliant T12 Units
(in thousands of fixtures)
Installed
Standard T12
Stock in Each
Year
HPT8
Baseline
Market
Units
HPT8 Energy
Trust
Program
Units
HPT8
Market
Units
Compliant
T12 Market
Units
Total T12
Retrofit and
Standard-Driven
Market Units
2002 - - - - 2,008
2003 0 1 1 35 1,973
2004 1 16 16 35 1,938
2005 2 9 9 35 1,903
2006 3 10 10 35 1,868
2007 4 22 22 35 1,832
2008 6 27 27 46 1,787
2009 12 58 58 82 1,704
2010 14 60 60 84 1,621
2011 18 66 66 92 1,529
2012 20 66 66 92 1,437
2013 22 193 270 1,166
2014 24 193 270 896
2015 26 193 270 625
2016 29 193 270 355
2017 31 193 270 84
2018 193 0 270 0
Total 404 334 334 965 2,194 -
Source: Navigant Consulting, Inc. Commercial Lighting Market Transformation Model.
The cost effectiveness results from the commercial market transformation model show that the Energy
Trust’s high performance T8 program has historically been cost effective (see Table 11). The model
calculates that the program has a benefit-cost ratio of greater than one for both the system benefit-cost
ratio and the societal benefit-cost ratio. These results only apply to the T12 retrofits that have actually
occurred through the Energy Trust’s program (i.e., in 2003-2010) and do not include future costs and
savings from future program activity or the future market transformation estimated for the accelerated
federal standard change. However, the program’s cost effectiveness to-date suggests that future savings
from T12 to high performance T8 retrofits would also be cost effective, particularly from the utility’s
perspective for federal standard change savings, which do not involve incentive payments. These savings
could be applicable, depending on the design of the 2014 federal ballast standard change. The inputs for
the cost effectiveness analysis were provided by Energy Trust and include a 5.2 percent real discount rate,
10 percent line loss adder, avoided energy costs, technology lifetimes, average incremental installed costs,
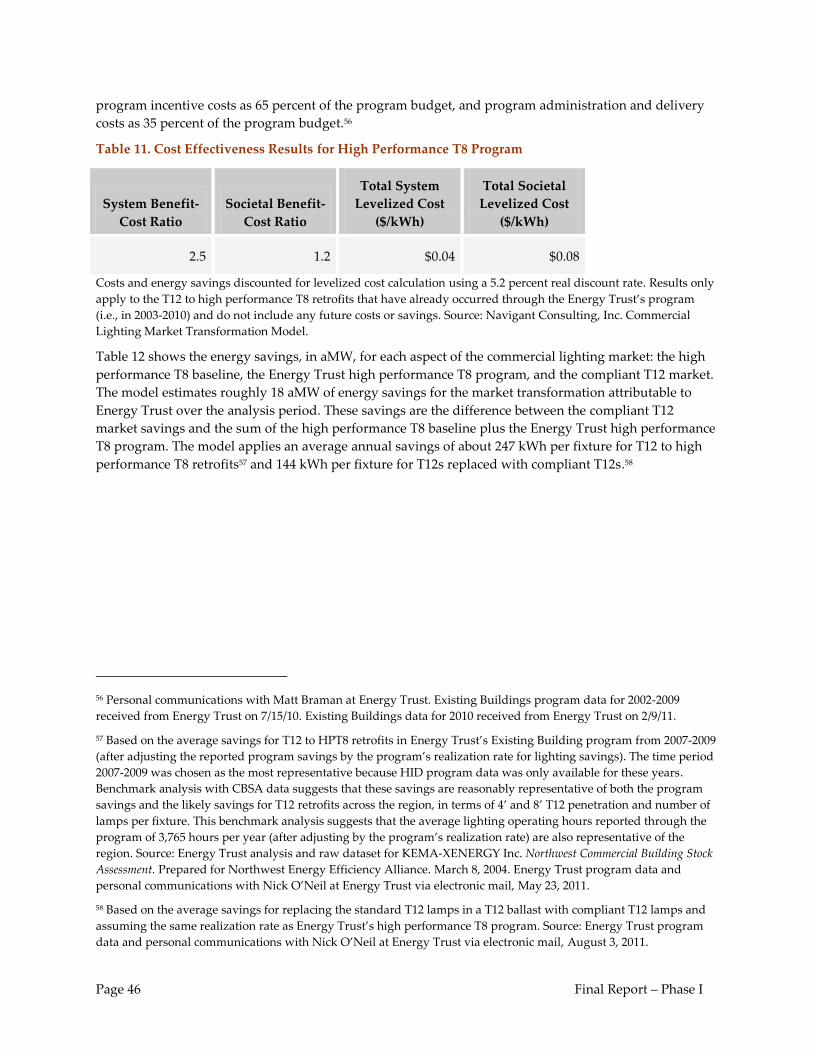
Page 46 Final Report – Phase I
program incentive costs as 65 percent of the program budget, and program administration and delivery
costs as 35 percent of the program budget.56
Table 11. Cost Effectiveness Results for High Performance T8 Program
System Benefit-
Cost Ratio
Societal Benefit-
Cost Ratio
Total System
Levelized Cost
($/kWh)
Total Societal
Levelized Cost
($/kWh)
2.5 1.2 $0.04 $0.08
Costs and energy savings discounted for levelized cost calculation using a 5.2 percent real discount rate. Results only
apply to the T12 to high performance T8 retrofits that have already occurred through the Energy Trust’s program
(i.e., in 2003-2010) and do not include any future costs or savings. Source: Navigant Consulting, Inc. Commercial
Lighting Market Transformation Model.
Table 12 shows the energy savings, in aMW, for each aspect of the commercial lighting market: the high
performance T8 baseline, the Energy Trust high performance T8 program, and the compliant T12 market.
The model estimates roughly 18 aMW of energy savings for the market transformation attributable to
Energy Trust over the analysis period. These savings are the difference between the compliant T12
market savings and the sum of the high performance T8 baseline plus the Energy Trust high performance
T8 program. The model applies an average annual savings of about 247 kWh per fixture for T12 to high
performance T8 retrofits57 and 144 kWh per fixture for T12s replaced with compliant T12s.58
56 Personal communications with Matt Braman at Energy Trust. Existing Buildings program data for 2002-2009
received from Energy Trust on 7/15/10. Existing Buildings data for 2010 received from Energy Trust on 2/9/11.
57 Based on the average savings for T12 to HPT8 retrofits in Energy Trust’s Existing Building program from 2007-2009
(after adjusting the reported program savings by the program’s realization rate for lighting savings). The time period
2007-2009 was chosen as the most representative because HID program data was only available for these years.
Benchmark analysis with CBSA data suggests that these savings are reasonably representative of both the program
savings and the likely savings for T12 retrofits across the region, in terms of 4’ and 8’ T12 penetration and number of
lamps per fixture. This benchmark analysis suggests that the average lighting operating hours reported through the
program of 3,765 hours per year (after adjusting by the program’s realization rate) are also representative of the
region. Source: Energy Trust analysis and raw dataset for KEMA-XENERGY Inc. Northwest Commercial Building Stock
Assessment. Prepared for Northwest Energy Efficiency Alliance. March 8, 2004. Energy Trust program data and
personal communications with Nick O’Neil at Energy Trust via electronic mail, May 23, 2011.
58 Based on the average savings for replacing the standard T12 lamps in a T12 ballast with compliant T12 lamps and
assuming the same realization rate as Energy Trust’s high performance T8 program. Source: Energy Trust program
data and personal communications with Nick O’Neil at Energy Trust via electronic mail, August 3, 2011.
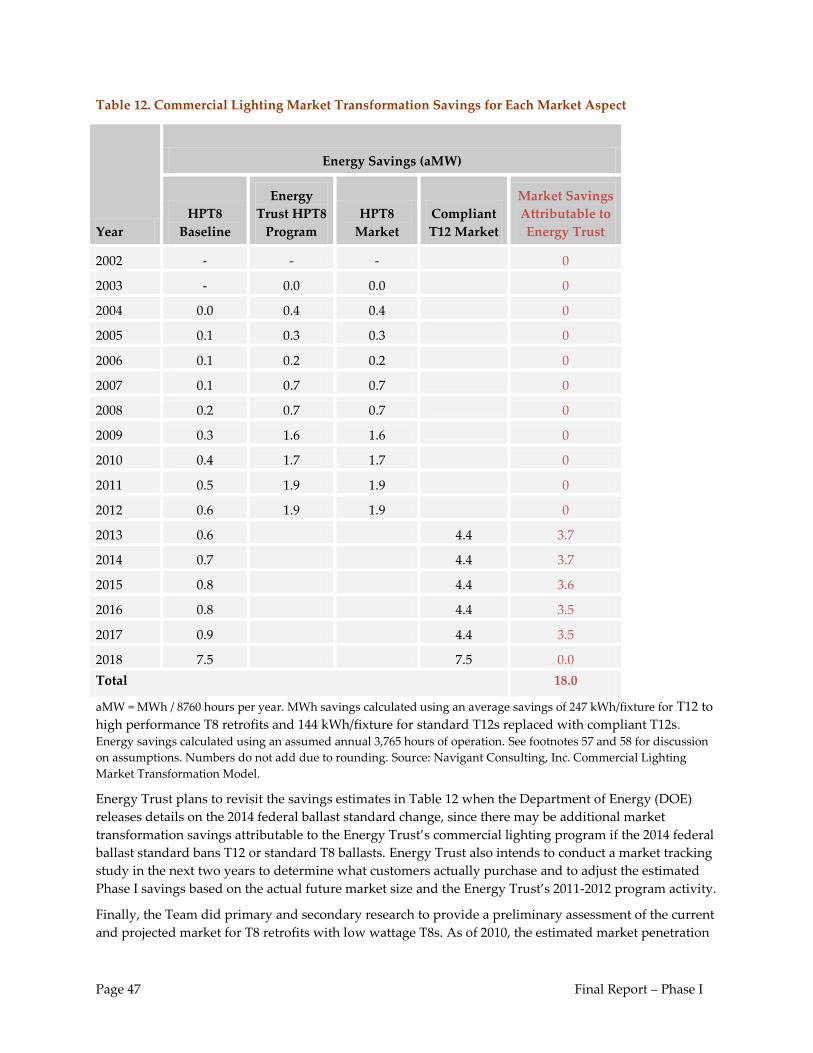
Page 47 Final Report – Phase I
Table 12. Commercial Lighting Market Transformation Savings for Each Market Aspect
Year
Energy Savings (aMW)
HPT8
Baseline
Energy
Trust HPT8
Program
HPT8
Market
Compliant
T12 Market
Market Savings
Attributable to
Energy Trust
2002 - - - 0
2003 - 0.0 0.0 0
2004 0.0 0.4 0.4 0
2005 0.1 0.3 0.3 0
2006 0.1 0.2 0.2 0
2007 0.1 0.7 0.7 0
2008 0.2 0.7 0.7 0
2009 0.3 1.6 1.6 0
2010 0.4 1.7 1.7 0
2011 0.5 1.9 1.9 0
2012 0.6 1.9 1.9 0
2013 0.6 4.4 3.7
2014 0.7 4.4 3.7
2015 0.8 4.4 3.6
2016 0.8 4.4 3.5
2017 0.9 4.4 3.5
2018 7.5 7.5 0.0
Total 18.0
aMW = MWh / 8760 hours per year. MWh savings calculated using an average savings of 247 kWh/fixture for T12 to
high performance T8 retrofits and 144 kWh/fixture for standard T12s replaced with compliant T12s.
Energy savings calculated using an assumed annual 3,765 hours of operation. See footnotes 57 and 58 for discussion
on assumptions. Numbers do not add due to rounding. Source: Navigant Consulting, Inc. Commercial Lighting
Market Transformation Model.
Energy Trust plans to revisit the savings estimates in Table 12 when the Department of Energy (DOE)
releases details on the 2014 federal ballast standard change, since there may be additional market
transformation savings attributable to the Energy Trust’s commercial lighting program if the 2014 federal
ballast standard bans T12 or standard T8 ballasts. Energy Trust also intends to conduct a market tracking
study in the next two years to determine what customers actually purchase and to adjust the estimated
Phase I savings based on the actual future market size and the Energy Trust’s 2011-2012 program activity.
Finally, the Team did primary and secondary research to provide a preliminary assessment of the current
and projected market for T8 retrofits with low wattage T8s. As of 2010, the estimated market penetration
Page 48 Final Report – Phase I
for low wattage T8s was about 8 percent and is expected to reach about 50 percent of the T8 retrofit
market after full program maturity, as shown above in Figure 12.
Model Development for Future Commercial Lighting Market Transformation Efforts
As part of the scope for this project, the Team built the commercial lighting market transformation model
to be adaptive to changes in the commercial lighting market, including pending federal standard changes
and evolving market trends, for future phases of the commercial lighting research.
To assess the initial low wattage T8 market, the Team built foundations in the model for the baseline and
overall market share of low wattage T8 fixtures. Using a similar approach to how the installed stock of
T12s is modeled for the high performance T8 portion of the model, the Team has also incorporated an
initial analysis of the installed stock of T8s in the region. The model also has ability to differentiate the
ballast types of each lighting system within the model.
Going forward, a number of data inputs should be tracked to populate the model for the market tracking
study planned to refine the Phase I future savings estimates and future phases of the commercial lighting
market transformation research. These data inputs include the following:
An updated snapshot of the high performance T8 market share (as percentages or number of
fixtures sold for retrofits in commercial buildings for T12 and T8 retrofits);
Market share of compliant T12 lamps sold to replace standard T12 lamps in existing T12 fixtures
(as a percent of number of lamps sold for to retrofit or replace T12 lamps in commercial
buildings);
Market share of high performance T8 ballasts versus standard T8 ballasts before and after the
federal standard change for fluorescent lamps (as a percent and type of ballasts sold in
commercial buildings);
An updated snapshot of the low wattage T8 market share (as a percent or number of fixtures sold
for standard T8 retrofits in commercial buildings or for the total 4’ and 8’ T8 and T12 commercial
lighting market);
Energy Trust program data, including the number of units given incentives, characteristics of the
replaced technologies (e.g., 4’ versus 8’, T12 versus standard T8 versus HID, etc.), working energy
savings, incentive costs, and incremental installed costs;
Baseline market activity for low wattage T8s in regions outside of the Energy Trust’s territory (as
a percent of number of fixtures sold for retrofits in commercial buildings for T12 and T8 retrofits);
Any available data on the total number of T8 or T12 lamps and ballasts sold in the region for
commercial retrofit projects (as number of fixtures sold for retrofits in commercial buildings);
An updated snapshot of the installed stock of linear fluorescent lighting by lamp type in Oregon
from NEEA’s next CBSA (as a percent or number of installed fixtures by lamp type); and
Page 49 Final Report – Phase I
Additional influences on the market and potential savings through trends like delamping,
enhanced design principles, increased penetration of controls, and the emergence of competing
technologies like LEDs.
A combination of the data inputs listed above and the flexible structure of the commercial lighting market
transformation model should significantly facilitate future market transformation efforts in the
commercial lighting market.
Page 50 Final Report – Phase I
5 Summary and Recommendations
The Team’s research and analysis during the course of this effort led to the following key findings:
The Energy Trust’s high performance T8 program energy savings for linear fluorescent retrofits
in existing commercial buildings have been almost entirely driven by retrofit of fixtures with T12
lamps and ballasts. While Energy Trust’s high performance T8 program has clearly influenced
the Trade Allies involved in the program, this research found no conclusive evidence to suggest
that the commercial lighting retrofit market for high performance T8s has been transformed
outside of the program.
o Distributor interviews indicated that all of the high performance T8s sold in Energy
Trust’s service territory have gone through Energy Trust’s incentive program.
o The Team estimates that the Energy Trust’s program will ultimately be responsible for
retrofitting about 60 percent of the T12 fixtures in their service territory with high
performance T8s between 2002 and 2012. The estimated market share of high
performance T8s sold for T12 retrofits was roughly 70 percent in 2009 and 72 percent in
2010, with the other portion of the T12 retrofit market captured by standard T8s.
o Trade Allies reported that, in general, the Energy Trust enables customers to consider
technologies they wouldn’t otherwise through incentives; ensures that technologies and
projects meet a certain level of quality; and pushes vendors to have their products on
“approved lists” like the CEE’s list for high performance commercial lighting.
While Energy Trust’s program has not transformed the current market, the Team recommends
that the Energy Trust receives credit for 18.0 aMW of market transformation energy savings to
reflect the proportional influence of the Energy Trust’s high performance T8 program on
accelerating the 2012 federal standard change for commercial fluorescent lamps. These savings
are proportional to the Energy Trust’s service territory, such that no savings are being claimed
outside of the Energy Trust’s market. Energy Trust’s actions that support this finding include:
o working with CEE from the beginning to develop the initial specifications for high
performance T8 lighting in 2003,
o having an overt goal to support high performance T8s from the time that CEE adopted
the specification,
o being first in the Pacific Northwest region to support the CEE definition of high
performance T8s, and
o working with regional distributors to ensure proper application of the technology.
The federal standard change in 2012 for fluorescent lamps will ban the sale of standard T12 and
standard T8 lamps, leaving compliant T12, high performance T8, and low wattage T8 lamps as
viable alternatives. The federal standard is primarily expected to result in energy savings through
T12 retrofits and replacements, rather than standard T8 retrofits, due to the following:
o The 2012 lamp standard does not require high performance T8 ballasts, and installing
high performance T8s lamps with a standard T8 ballast results in minimal energy
savings. This report assumes that most customers will not replace an existing standard
Page 51 Final Report – Phase I
T8 ballast when installing high performance T8 lamps, unless required to by a ballast
standard change.
o For T12s, a customer may replace their existing T12 fixture with a high performance T8
fixture, but this report conservatively assumes that customers will instead purchase the
least-efficient option available that complies with the standard, which is to replace their
standard T12 lamps with compliant T12 lamps and keep their existing ballast. This type
of replacement provides savings of about 144 kWh per fixture, compared to savings of
about 247 kWh per fixture when T12s are replaced with high performance T8s.
Without voluntary incentive programs like Energy Trust’s, the Team found evidence that the
federal standard would not have changed to an equivalent efficiency level until the next DOE
standard change in 2017.
Although the federal standard takes effect in July of 2012, these savings would be claimed
beginning in 2013 after the existing stock of T12s have been depleted, and would cumulate
through 2017.
A federal standard change for ballasts is expected to take place in 2014, which may redirect the
market towards retrofitting standard T8s and T12s with both high performance T8 lamps and
ballasts. If this occurs, there may be additional market transformation savings attributable to the
Energy Trust’s commercial lighting program.The Team estimates that all standard T12 lamps will
be removed from Energy Trust’s territory by mid-2018 through replacements with either
standard T8, high performance T8, or compliant T12 lamps.
The T12s being replaced through the Energy Trust’s program reasonably reflect the mix of
existing technologies in the Pacific Northwest region, in terms of the number of lamps per fixture
and the proportion of 4’ to 8’ T12 fixtures.
HIDs comprise almost half of the savings for high performance T8 retrofits through the Energy
Trust’s Existing Buildings program; however, HIDs only represent eight percent of the replaced
fixtures in the program. This analysis does not consider the impacts of HID retrofits because
these technologies, which typically serve high bay applications, represent a different chain of
market drivers and influences than the low bay linear fluorescent retrofit market. The market
transformation savings associated with HIDs will be addressed in a separate study.
The low wattage T8 market already represents roughly eight percent of the total market for 4’
and 8’ T12 and T8 retrofits. In general, industry experts anticipate that this growth will continue,
although applications for low wattage T8s are limited without improvements to the technology’s
lumen output.
The Team has compiled a list of preliminary recommendations for Energy Trust based on the study
findings:
After the federal standard changes in 2012, if commercial lighting customers perceive compliant
T12 lamps as a cost-effective alternative to high performance T8s, pursue the incremental savings
between a compliant T12 and a high performance T8 fixture.
Conduct a market tracking study in the next two years to determine what customers actually
purchase and to adjust the estimated Phase I savings based on the actual future market size and
the Energy Trust’s 2011-2012 program activity.
Page 52 Final Report – Phase I
Refine and adjust the program units projected in this model to match actual high performance
and low wattage T8 program activity in future years.
Work with the supply chain to make low wattage T8s readily available, train the Trade Allies on
how to properly install and design low wattage T8 systems, help the Trade Allies educate their
customers and increase end-user awareness and acceptance, and provide targeted incentives to
maximize cost effectiveness. The electrical contractors outside of the Trade Ally Network seem to
represent a hard-to-reach supply chain segment and may also warrant targeted outreach efforts
to encourage installation of low wattage T8s. Finally, encourage manufacturers to continue
enhancing the lumen output of low wattage T8s, such that the technology may be more widely
applicable and suitable for future efficiency standards.
As outlined in Section 4.9, begin exploring potential data sources for the number of total market
units in the commercial lighting retrofit market and collecting data on a regular basis for high
performance T8, low wattage T8, and compliant T12 lamp and ballast market share to assist with
future market transformation efforts in the commercial lighting market.
Continue pushing the concept of “retrofit by design,” and expand on Energy Trust’s focus on
reducing total power consumption to achieve lighting needs. Watch other market trends that
may play a role in the commercial lighting market, such as delamping, LEDs, lighting controls,
and even lower wattage linear fluorescents, and consider including the impacts of these trends in
the next market transformation model.
Energy Trust can use the market transformation model developed for this study with minor
changes for many different lighting markets, including the standard T8 retrofit market and the
high bay lighting market for both the commercial and industrial sector.
Proceed to Phase II of the commercial lighting market transformation research and consider
updating Phase I once the DOE has begun designing the 2014 federal standard for linear
fluorescent ballasts, since there may be additional market transformation savings attributable to
the Energy Trust’s commercial lighting program if the 2014 federal ballast standard bans T12 or
standard T8 ballasts.
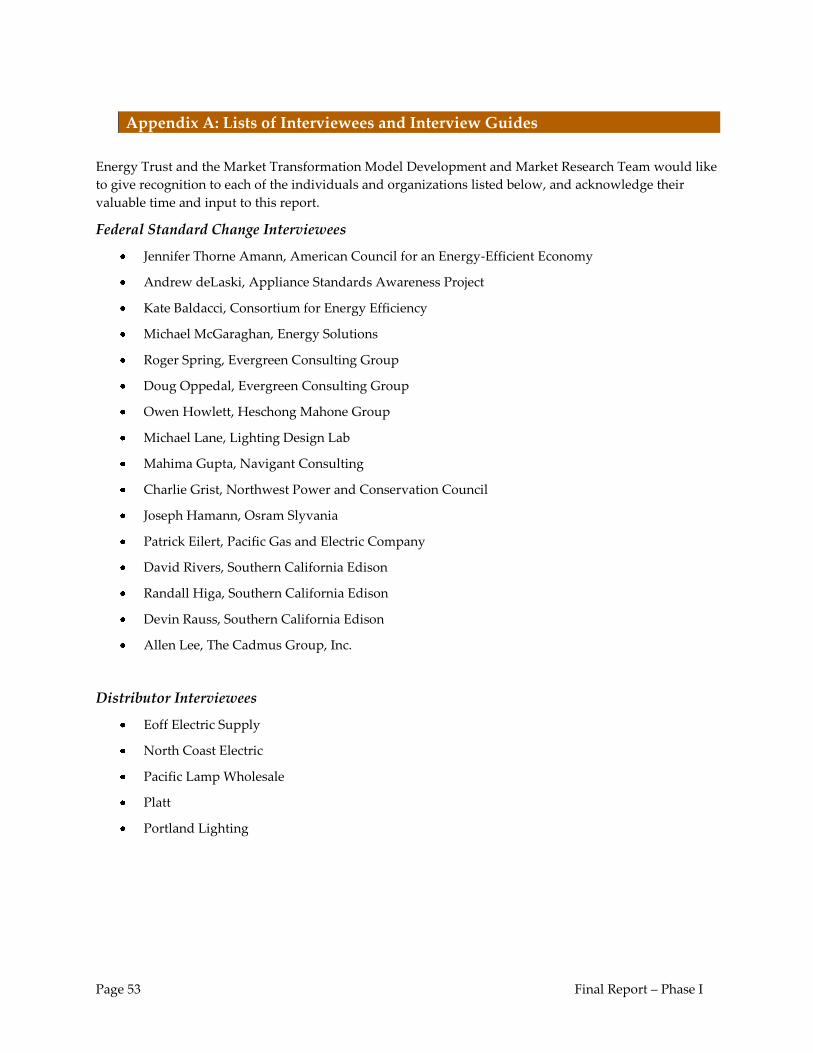
Page 53 Final Report – Phase I
Appendix A: Lists of Interviewees and Interview Guides
Energy Trust and the Market Transformation Model Development and Market Research Team would like
to give recognition to each of the individuals and organizations listed below, and acknowledge their
valuable time and input to this report.
Federal Standard Change Interviewees
Jennifer Thorne Amann, American Council for an Energy-Efficient Economy
Andrew deLaski, Appliance Standards Awareness Project
Kate Baldacci, Consortium for Energy Efficiency
Michael McGaraghan, Energy Solutions
Roger Spring, Evergreen Consulting Group
Doug Oppedal, Evergreen Consulting Group
Owen Howlett, Heschong Mahone Group
Michael Lane, Lighting Design Lab
Mahima Gupta, Navigant Consulting
Charlie Grist, Northwest Power and Conservation Council
Joseph Hamann, Osram Slyvania
Patrick Eilert, Pacific Gas and Electric Company
David Rivers, Southern California Edison
Randall Higa, Southern California Edison
Devin Rauss, Southern California Edison
Allen Lee, The Cadmus Group, Inc.
Distributor Interviewees
Eoff Electric Supply
North Coast Electric
Pacific Lamp Wholesale
Platt
Portland Lighting
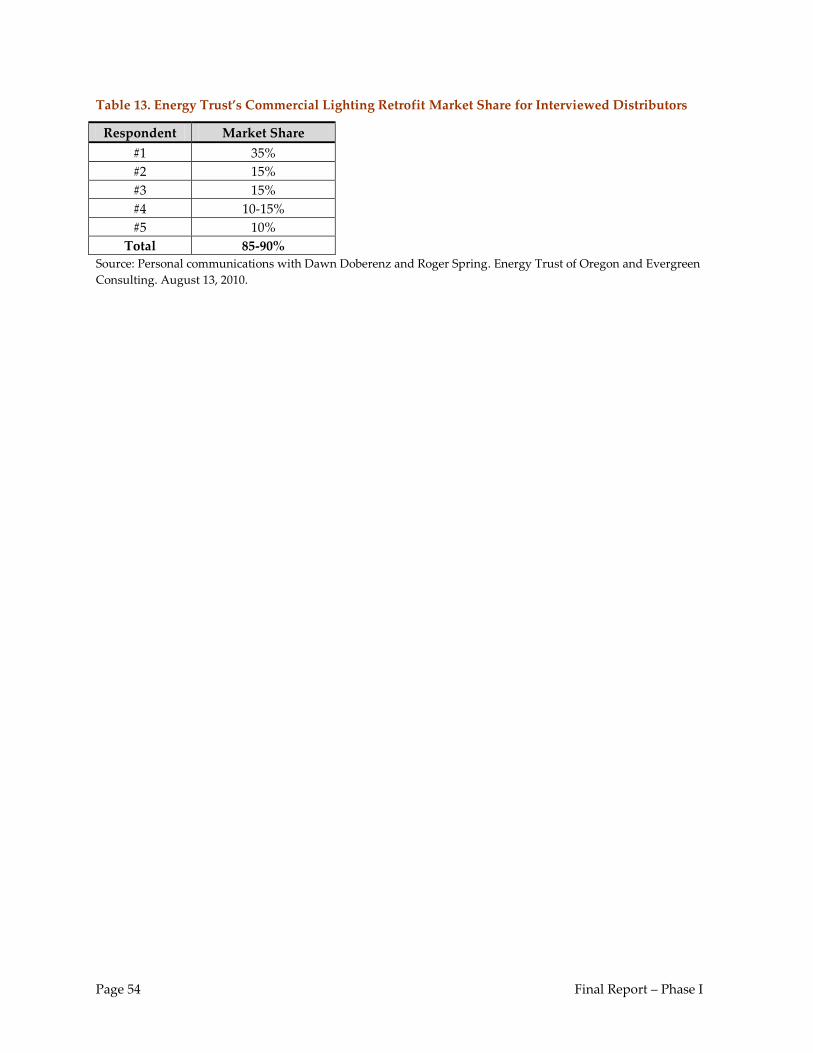
Page 54 Final Report – Phase I
Table 13. Energy Trust’s Commercial Lighting Retrofit Market Share for Interviewed Distributors
Respondent Market Share
#1 35%
#2 15%
#3 15%
#4 10-15%
#5 10%
Total 85-90%
Source: Personal communications with Dawn Doberenz and Roger Spring. Energy Trust of Oregon and Evergreen
Consulting. August 13, 2010.
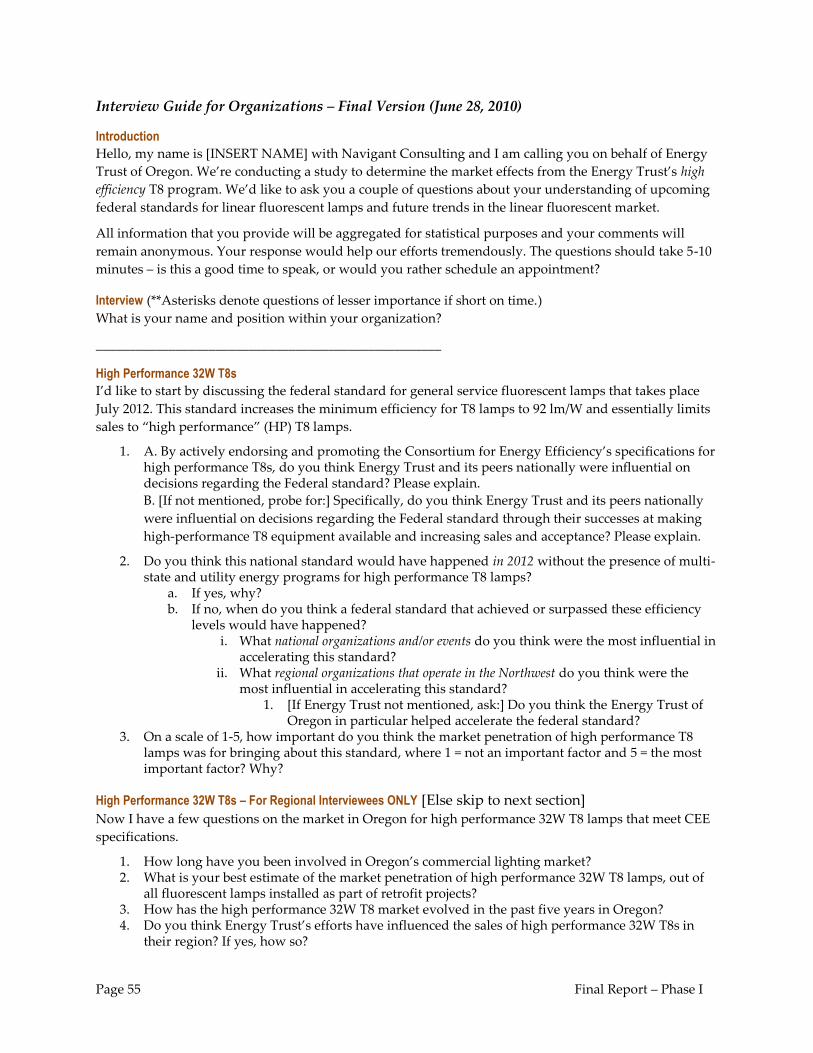
Page 55 Final Report – Phase I
Interview Guide for Organizations – Final Version (June 28, 2010)
Introduction
Hello, my name is [INSERT NAME] with Navigant Consulting and I am calling you on behalf of Energy
Trust of Oregon. We’re conducting a study to determine the market effects from the Energy Trust’s high
efficiency T8 program. We’d like to ask you a couple of questions about your understanding of upcoming
federal standards for linear fluorescent lamps and future trends in the linear fluorescent market.
All information that you provide will be aggregated for statistical purposes and your comments will
remain anonymous. Your response would help our efforts tremendously. The questions should take 5-10
minutes – is this a good time to speak, or would you rather schedule an appointment?
Interview (**Asterisks denote questions of lesser importance if short on time.)
What is your name and position within your organization?
____________________________________________________
High Performance 32W T8s
I’d like to start by discussing the federal standard for general service fluorescent lamps that takes place
July 2012. This standard increases the minimum efficiency for T8 lamps to 92 lm/W and essentially limits
sales to “high performance” (HP) T8 lamps.
1. A. By actively endorsing and promoting the Consortium for Energy Efficiency’s specifications for high performance T8s, do you think Energy Trust and its peers nationally were influential on decisions regarding the Federal standard? Please explain.
B. [If not mentioned, probe for:] Specifically, do you think Energy Trust and its peers nationally
were influential on decisions regarding the Federal standard through their successes at making
high-performance T8 equipment available and increasing sales and acceptance? Please explain.
2. Do you think this national standard would have happened in 2012 without the presence of multi-state and utility energy programs for high performance T8 lamps?
a. If yes, why? b. If no, when do you think a federal standard that achieved or surpassed these efficiency
levels would have happened? i. What national organizations and/or events do you think were the most influential in
accelerating this standard? ii. What regional organizations that operate in the Northwest do you think were the
most influential in accelerating this standard? 1. [If Energy Trust not mentioned, ask:] Do you think the Energy Trust of
Oregon in particular helped accelerate the federal standard? 3. On a scale of 1-5, how important do you think the market penetration of high performance T8
lamps was for bringing about this standard, where 1 = not an important factor and 5 = the most important factor? Why?
High Performance 32W T8s – For Regional Interviewees ONLY [Else skip to next section] Now I have a few questions on the market in Oregon for high performance 32W T8 lamps that meet CEE
specifications.
1. How long have you been involved in Oregon’s commercial lighting market? 2. What is your best estimate of the market penetration of high performance 32W T8 lamps, out of
all fluorescent lamps installed as part of retrofit projects? 3. How has the high performance 32W T8 market evolved in the past five years in Oregon? 4. Do you think Energy Trust’s efforts have influenced the sales of high performance 32W T8s in
their region? If yes, how so?
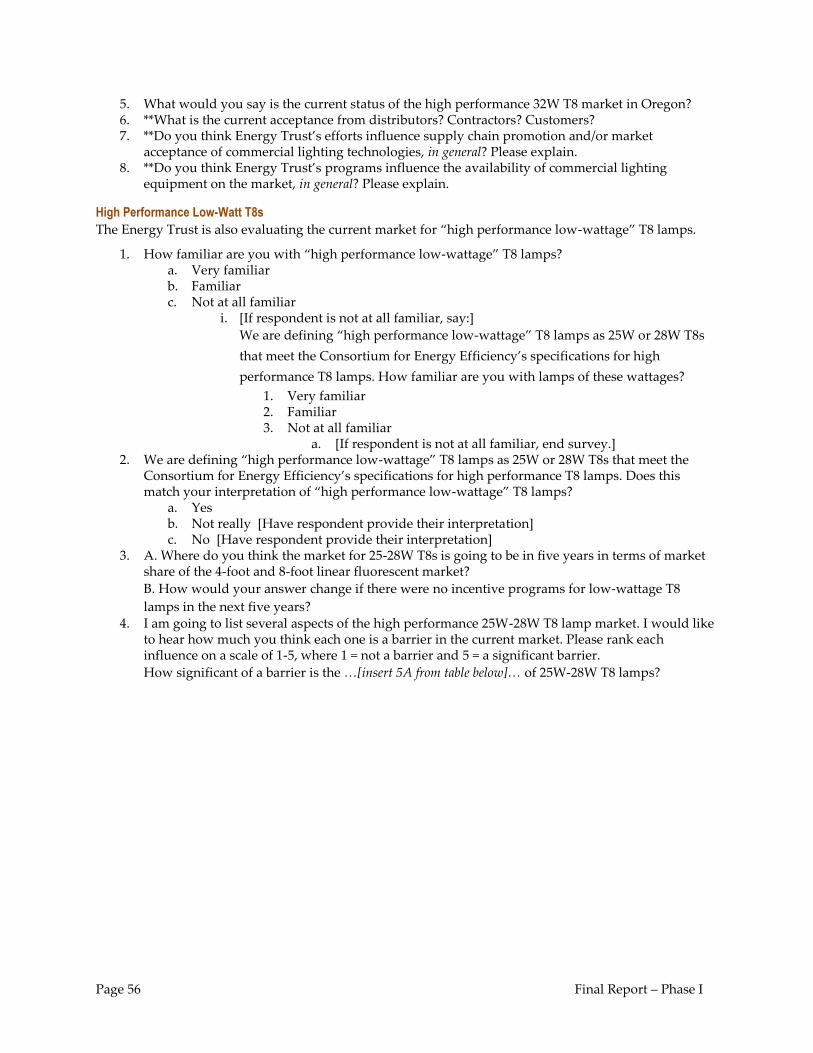
Page 56 Final Report – Phase I
5. What would you say is the current status of the high performance 32W T8 market in Oregon? 6. **What is the current acceptance from distributors? Contractors? Customers? 7. **Do you think Energy Trust’s efforts influence supply chain promotion and/or market
acceptance of commercial lighting technologies, in general? Please explain. 8. **Do you think Energy Trust’s programs influence the availability of commercial lighting
equipment on the market, in general? Please explain.
High Performance Low-Watt T8s
The Energy Trust is also evaluating the current market for “high performance low-wattage” T8 lamps.
1. How familiar are you with “high performance low-wattage” T8 lamps? a. Very familiar b. Familiar c. Not at all familiar
i. [If respondent is not at all familiar, say:]
We are defining “high performance low-wattage” T8 lamps as 25W or 28W T8s
that meet the Consortium for Energy Efficiency’s specifications for high
performance T8 lamps. How familiar are you with lamps of these wattages?
1. Very familiar 2. Familiar 3. Not at all familiar
a. [If respondent is not at all familiar, end survey.] 2. We are defining “high performance low-wattage” T8 lamps as 25W or 28W T8s that meet the
Consortium for Energy Efficiency’s specifications for high performance T8 lamps. Does this match your interpretation of “high performance low-wattage” T8 lamps?
a. Yes b. Not really [Have respondent provide their interpretation] c. No [Have respondent provide their interpretation]
3. A. Where do you think the market for 25-28W T8s is going to be in five years in terms of market share of the 4-foot and 8-foot linear fluorescent market?
B. How would your answer change if there were no incentive programs for low-wattage T8
lamps in the next five years? 4. I am going to list several aspects of the high performance 25W-28W T8 lamp market. I would like
to hear how much you think each one is a barrier in the current market. Please rank each influence on a scale of 1-5, where 1 = not a barrier and 5 = a significant barrier.
How significant of a barrier is the …[insert 5A from table below]… of 25W-28W T8 lamps?
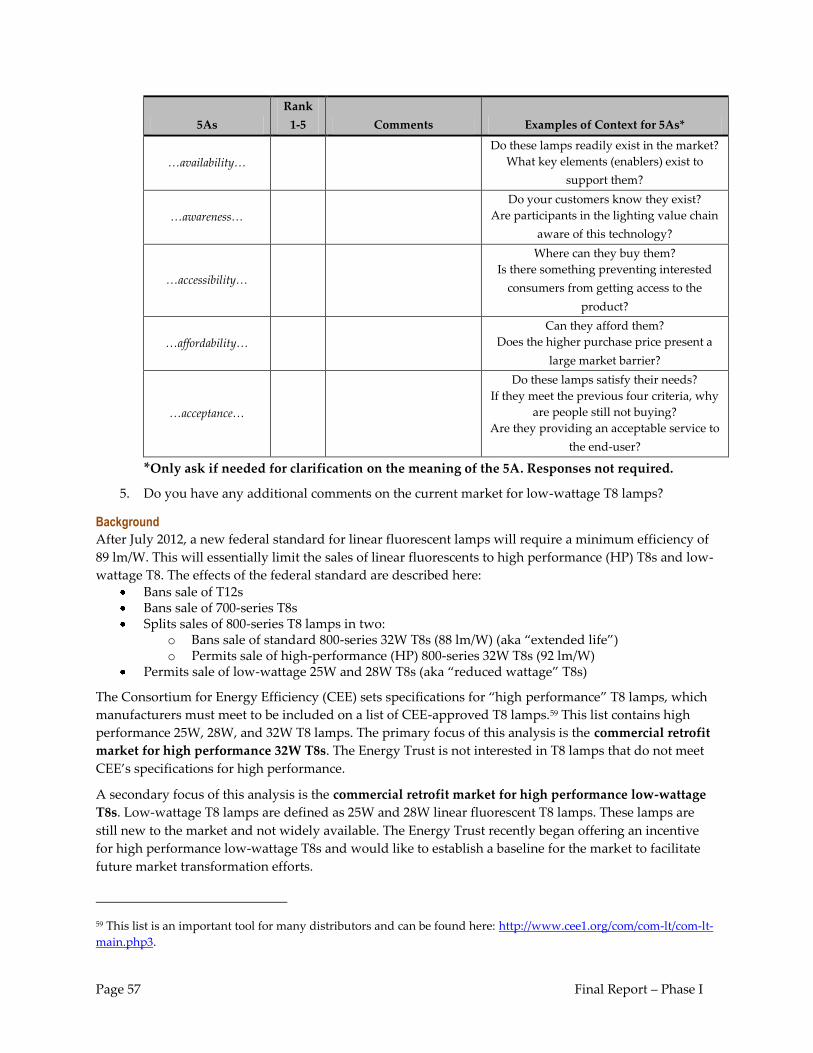
Page 57 Final Report – Phase I
5As
Rank
1-5 Comments Examples of Context for 5As*
…availability…
Do these lamps readily exist in the market?
What key elements (enablers) exist to
support them?
…awareness…
Do your customers know they exist?
Are participants in the lighting value chain
aware of this technology?
…accessibility…
Where can they buy them?
Is there something preventing interested
consumers from getting access to the
product?
…affordability…
Can they afford them?
Does the higher purchase price present a
large market barrier?
…acceptance…
Do these lamps satisfy their needs?
If they meet the previous four criteria, why
are people still not buying?
Are they providing an acceptable service to
the end-user?
*Only ask if needed for clarification on the meaning of the 5A. Responses not required.
5. Do you have any additional comments on the current market for low-wattage T8 lamps?
Background
After July 2012, a new federal standard for linear fluorescent lamps will require a minimum efficiency of
89 lm/W. This will essentially limit the sales of linear fluorescents to high performance (HP) T8s and low-
wattage T8. The effects of the federal standard are described here: Bans sale of T12s Bans sale of 700-series T8s Splits sales of 800-series T8 lamps in two:
o Bans sale of standard 800-series 32W T8s (88 lm/W) (aka “extended life”) o Permits sale of high-performance (HP) 800-series 32W T8s (92 lm/W)
Permits sale of low-wattage 25W and 28W T8s (aka “reduced wattage” T8s)
The Consortium for Energy Efficiency (CEE) sets specifications for “high performance” T8 lamps, which
manufacturers must meet to be included on a list of CEE-approved T8 lamps.59 This list contains high
performance 25W, 28W, and 32W T8 lamps. The primary focus of this analysis is the commercial retrofit
market for high performance 32W T8s. The Energy Trust is not interested in T8 lamps that do not meet
CEE’s specifications for high performance.
A secondary focus of this analysis is the commercial retrofit market for high performance low-wattage
T8s. Low-wattage T8 lamps are defined as 25W and 28W linear fluorescent T8 lamps. These lamps are
still new to the market and not widely available. The Energy Trust recently began offering an incentive
for high performance low-wattage T8s and would like to establish a baseline for the market to facilitate
future market transformation efforts.
59 This list is an important tool for many distributors and can be found here: http://www.cee1.org/com/com-lt/com-lt-
main.php3.
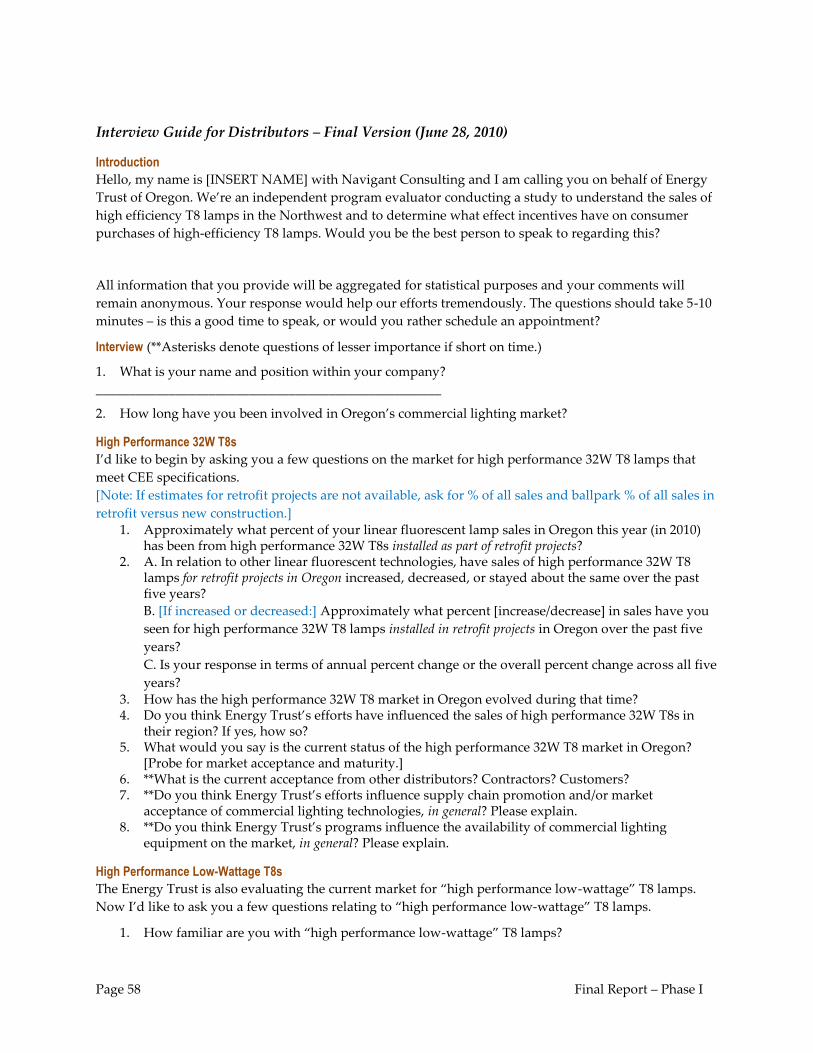
Page 58 Final Report – Phase I
Interview Guide for Distributors – Final Version (June 28, 2010)
Introduction
Hello, my name is [INSERT NAME] with Navigant Consulting and I am calling you on behalf of Energy
Trust of Oregon. We’re an independent program evaluator conducting a study to understand the sales of
high efficiency T8 lamps in the Northwest and to determine what effect incentives have on consumer
purchases of high-efficiency T8 lamps. Would you be the best person to speak to regarding this?
All information that you provide will be aggregated for statistical purposes and your comments will
remain anonymous. Your response would help our efforts tremendously. The questions should take 5-10
minutes – is this a good time to speak, or would you rather schedule an appointment?
Interview (**Asterisks denote questions of lesser importance if short on time.)
1. What is your name and position within your company?
____________________________________________________
2. How long have you been involved in Oregon’s commercial lighting market?
High Performance 32W T8s
I’d like to begin by asking you a few questions on the market for high performance 32W T8 lamps that
meet CEE specifications.
[Note: If estimates for retrofit projects are not available, ask for % of all sales and ballpark % of all sales in
retrofit versus new construction.] 1. Approximately what percent of your linear fluorescent lamp sales in Oregon this year (in 2010)
has been from high performance 32W T8s installed as part of retrofit projects? 2. A. In relation to other linear fluorescent technologies, have sales of high performance 32W T8
lamps for retrofit projects in Oregon increased, decreased, or stayed about the same over the past five years?
B. [If increased or decreased:] Approximately what percent [increase/decrease] in sales have you
seen for high performance 32W T8 lamps installed in retrofit projects in Oregon over the past five
years?
C. Is your response in terms of annual percent change or the overall percent change across all five
years? 3. How has the high performance 32W T8 market in Oregon evolved during that time? 4. Do you think Energy Trust’s efforts have influenced the sales of high performance 32W T8s in
their region? If yes, how so? 5. What would you say is the current status of the high performance 32W T8 market in Oregon?
[Probe for market acceptance and maturity.] 6. **What is the current acceptance from other distributors? Contractors? Customers? 7. **Do you think Energy Trust’s efforts influence supply chain promotion and/or market
acceptance of commercial lighting technologies, in general? Please explain. 8. **Do you think Energy Trust’s programs influence the availability of commercial lighting
equipment on the market, in general? Please explain.
High Performance Low-Wattage T8s
The Energy Trust is also evaluating the current market for “high performance low-wattage” T8 lamps.
Now I’d like to ask you a few questions relating to “high performance low-wattage” T8 lamps.
1. How familiar are you with “high performance low-wattage” T8 lamps?
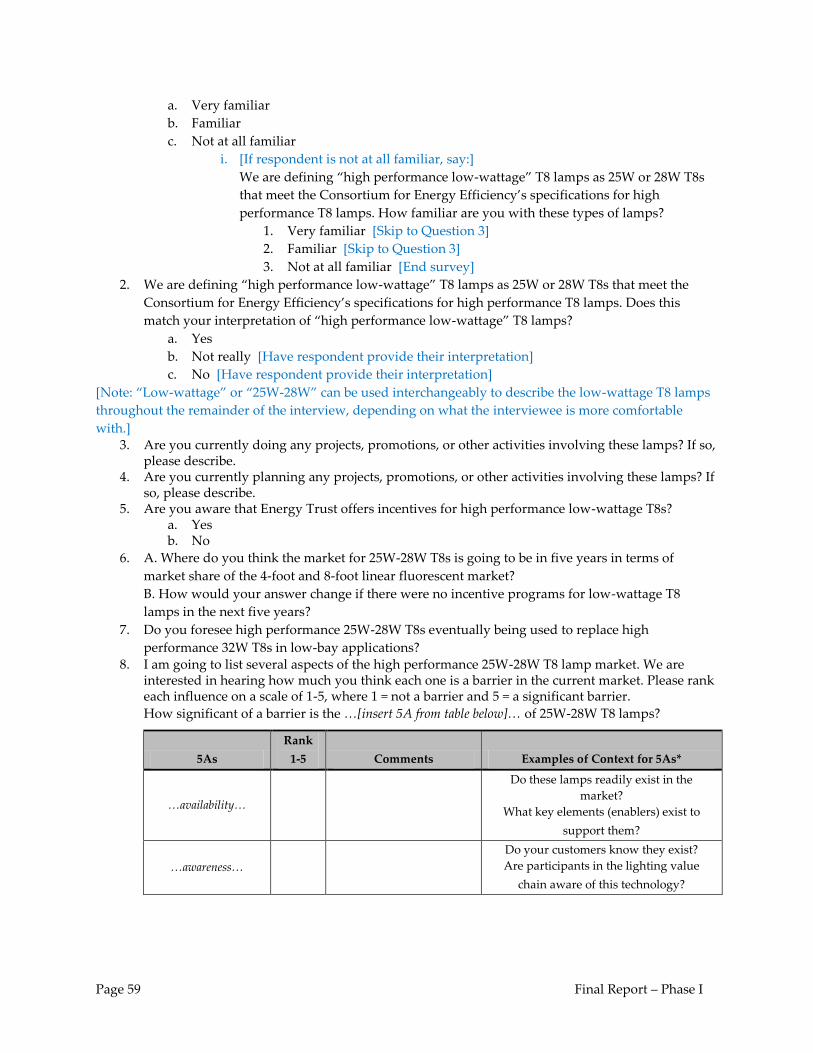
Page 59 Final Report – Phase I
a. Very familiar
b. Familiar
c. Not at all familiar
i. [If respondent is not at all familiar, say:]
We are defining “high performance low-wattage” T8 lamps as 25W or 28W T8s
that meet the Consortium for Energy Efficiency’s specifications for high
performance T8 lamps. How familiar are you with these types of lamps?
1. Very familiar [Skip to Question 3]
2. Familiar [Skip to Question 3]
3. Not at all familiar [End survey]
2. We are defining “high performance low-wattage” T8 lamps as 25W or 28W T8s that meet the
Consortium for Energy Efficiency’s specifications for high performance T8 lamps. Does this
match your interpretation of “high performance low-wattage” T8 lamps?
a. Yes
b. Not really [Have respondent provide their interpretation]
c. No [Have respondent provide their interpretation]
*Note: “Low-wattage” or “25W-28W” can be used interchangeably to describe the low-wattage T8 lamps
throughout the remainder of the interview, depending on what the interviewee is more comfortable
with.] 3. Are you currently doing any projects, promotions, or other activities involving these lamps? If so,
please describe. 4. Are you currently planning any projects, promotions, or other activities involving these lamps? If
so, please describe. 5. Are you aware that Energy Trust offers incentives for high performance low-wattage T8s?
a. Yes b. No
6. A. Where do you think the market for 25W-28W T8s is going to be in five years in terms of
market share of the 4-foot and 8-foot linear fluorescent market?
B. How would your answer change if there were no incentive programs for low-wattage T8
lamps in the next five years?
7. Do you foresee high performance 25W-28W T8s eventually being used to replace high
performance 32W T8s in low-bay applications? 8. I am going to list several aspects of the high performance 25W-28W T8 lamp market. We are
interested in hearing how much you think each one is a barrier in the current market. Please rank each influence on a scale of 1-5, where 1 = not a barrier and 5 = a significant barrier.
How significant of a barrier is the …[insert 5A from table below]… of 25W-28W T8 lamps?
5As
Rank
1-5 Comments Examples of Context for 5As*
…availability…
Do these lamps readily exist in the
market?
What key elements (enablers) exist to
support them?
…awareness…
Do your customers know they exist?
Are participants in the lighting value
chain aware of this technology?
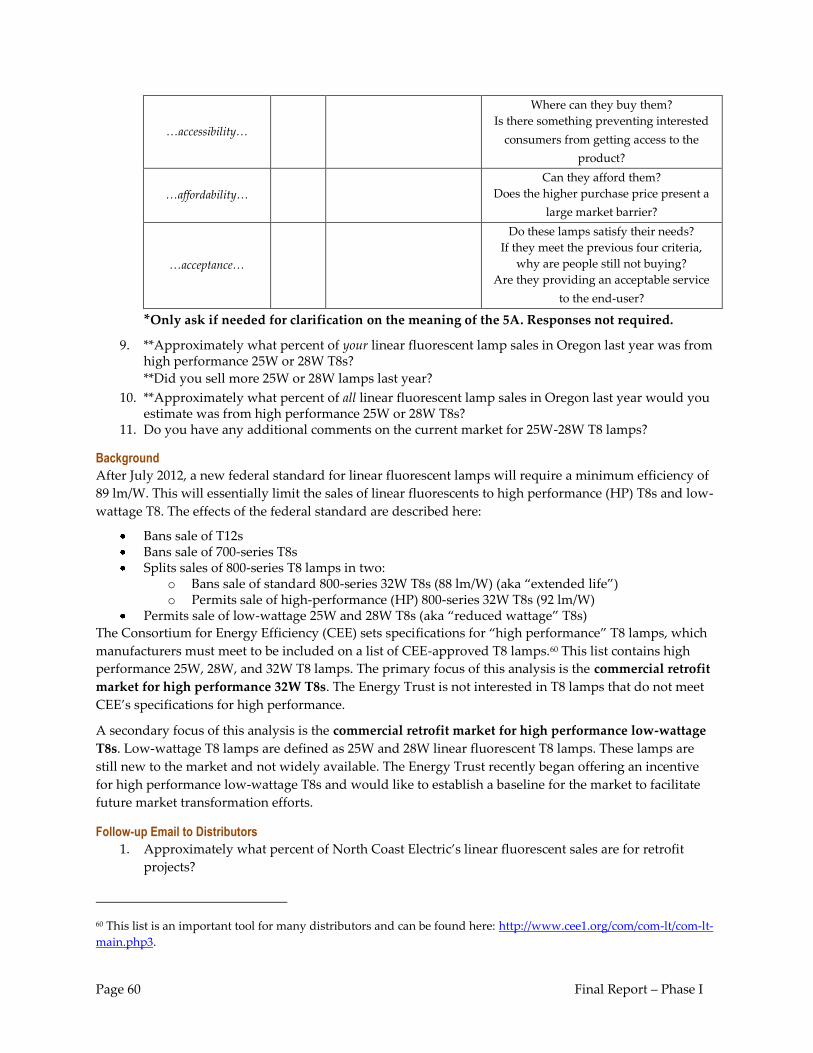
Page 60 Final Report – Phase I
…accessibility…
Where can they buy them?
Is there something preventing interested
consumers from getting access to the
product?
…affordability…
Can they afford them?
Does the higher purchase price present a
large market barrier?
…acceptance…
Do these lamps satisfy their needs?
If they meet the previous four criteria,
why are people still not buying?
Are they providing an acceptable service
to the end-user?
*Only ask if needed for clarification on the meaning of the 5A. Responses not required.
9. **Approximately what percent of your linear fluorescent lamp sales in Oregon last year was from high performance 25W or 28W T8s?
**Did you sell more 25W or 28W lamps last year?
10. **Approximately what percent of all linear fluorescent lamp sales in Oregon last year would you estimate was from high performance 25W or 28W T8s?
11. Do you have any additional comments on the current market for 25W-28W T8 lamps?
Background
After July 2012, a new federal standard for linear fluorescent lamps will require a minimum efficiency of
89 lm/W. This will essentially limit the sales of linear fluorescents to high performance (HP) T8s and low-
wattage T8. The effects of the federal standard are described here:
Bans sale of T12s Bans sale of 700-series T8s Splits sales of 800-series T8 lamps in two:
o Bans sale of standard 800-series 32W T8s (88 lm/W) (aka “extended life”) o Permits sale of high-performance (HP) 800-series 32W T8s (92 lm/W)
Permits sale of low-wattage 25W and 28W T8s (aka “reduced wattage” T8s)
The Consortium for Energy Efficiency (CEE) sets specifications for “high performance” T8 lamps, which
manufacturers must meet to be included on a list of CEE-approved T8 lamps.60 This list contains high
performance 25W, 28W, and 32W T8 lamps. The primary focus of this analysis is the commercial retrofit
market for high performance 32W T8s. The Energy Trust is not interested in T8 lamps that do not meet
CEE’s specifications for high performance.
A secondary focus of this analysis is the commercial retrofit market for high performance low-wattage
T8s. Low-wattage T8 lamps are defined as 25W and 28W linear fluorescent T8 lamps. These lamps are
still new to the market and not widely available. The Energy Trust recently began offering an incentive
for high performance low-wattage T8s and would like to establish a baseline for the market to facilitate
future market transformation efforts.
Follow-up Email to Distributors
1. Approximately what percent of North Coast Electric’s linear fluorescent sales are for retrofit
projects?
60 This list is an important tool for many distributors and can be found here: http://www.cee1.org/com/com-lt/com-lt-
main.php3.
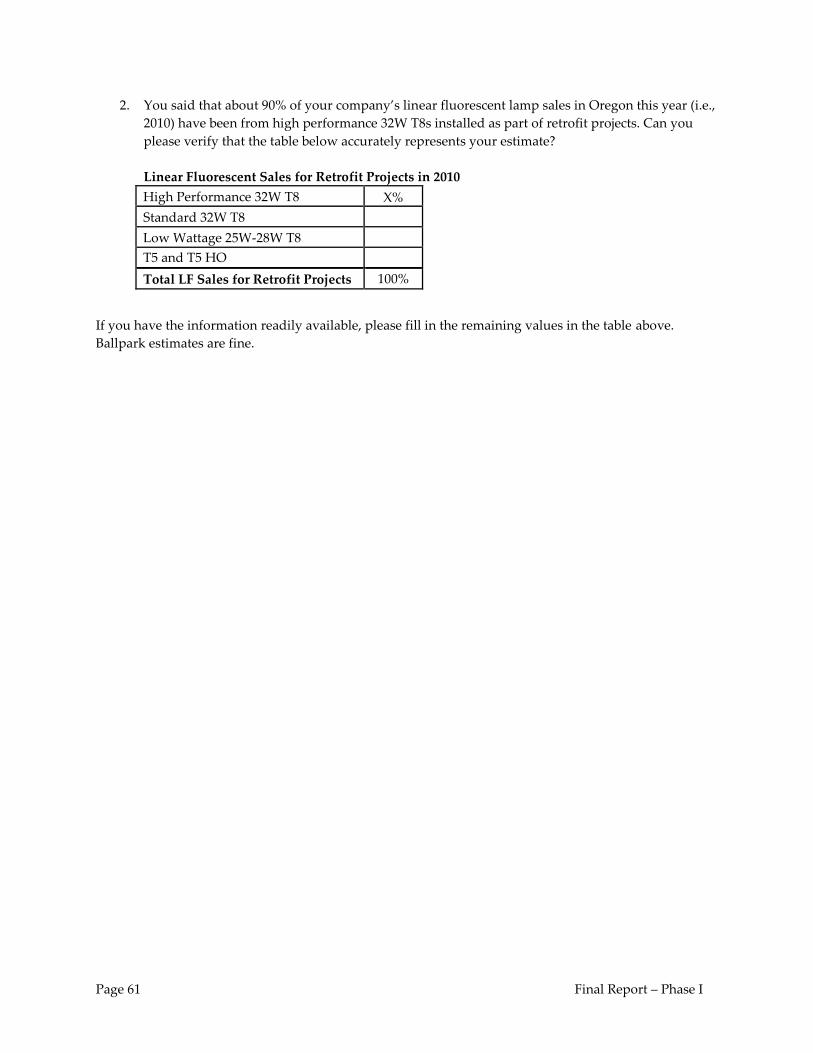
Page 61 Final Report – Phase I
2. You said that about 90% of your company’s linear fluorescent lamp sales in Oregon this year (i.e.,
2010) have been from high performance 32W T8s installed as part of retrofit projects. Can you
please verify that the table below accurately represents your estimate?
Linear Fluorescent Sales for Retrofit Projects in 2010
High Performance 32W T8 X%
Standard 32W T8
Low Wattage 25W-28W T8
T5 and T5 HO
Total LF Sales for Retrofit Projects 100%
If you have the information readily available, please fill in the remaining values in the table above.
Ballpark estimates are fine.
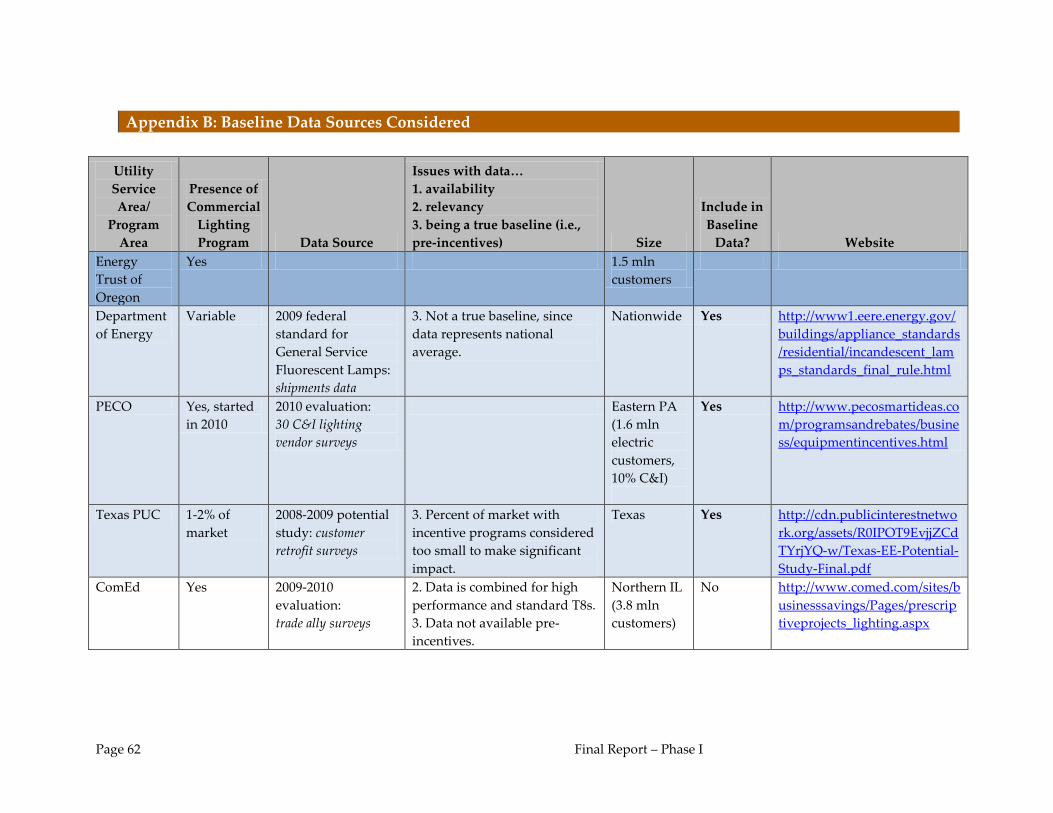
Page 62 Final Report – Phase I
Appendix B: Baseline Data Sources Considered
Utility
Service
Area/
Program
Area
Presence of
Commercial
Lighting
Program Data Source
Issues with data…
1. availability
2. relevancy
3. being a true baseline (i.e.,
pre-incentives) Size
Include in
Baseline
Data? Website
Energy
Trust of
Oregon
Yes 1.5 mln
customers
Department
of Energy
Variable 2009 federal
standard for
General Service
Fluorescent Lamps:
shipments data
3. Not a true baseline, since
data represents national
average.
Nationwide Yes http://www1.eere.energy.gov/
buildings/appliance_standards
/residential/incandescent_lam
ps_standards_final_rule.html
PECO Yes, started
in 2010
2010 evaluation:
30 C&I lighting
vendor surveys
Eastern PA
(1.6 mln
electric
customers,
10% C&I)
Yes http://www.pecosmartideas.co
m/programsandrebates/busine
ss/equipmentincentives.html
Texas PUC 1-2% of
market
2008-2009 potential
study: customer
retrofit surveys
3. Percent of market with
incentive programs considered
too small to make significant
impact.
Texas Yes http://cdn.publicinterestnetwo
rk.org/assets/R0IPOT9EvjjZCd
TYrjYQ-w/Texas-EE-Potential-
Study-Final.pdf
ComEd Yes 2009-2010
evaluation:
trade ally surveys
2. Data is combined for high
performance and standard T8s.
3. Data not available pre-
incentives.
Northern IL
(3.8 mln
customers)
No http://www.comed.com/sites/b
usinesssavings/Pages/prescrip
tiveprojects_lighting.aspx
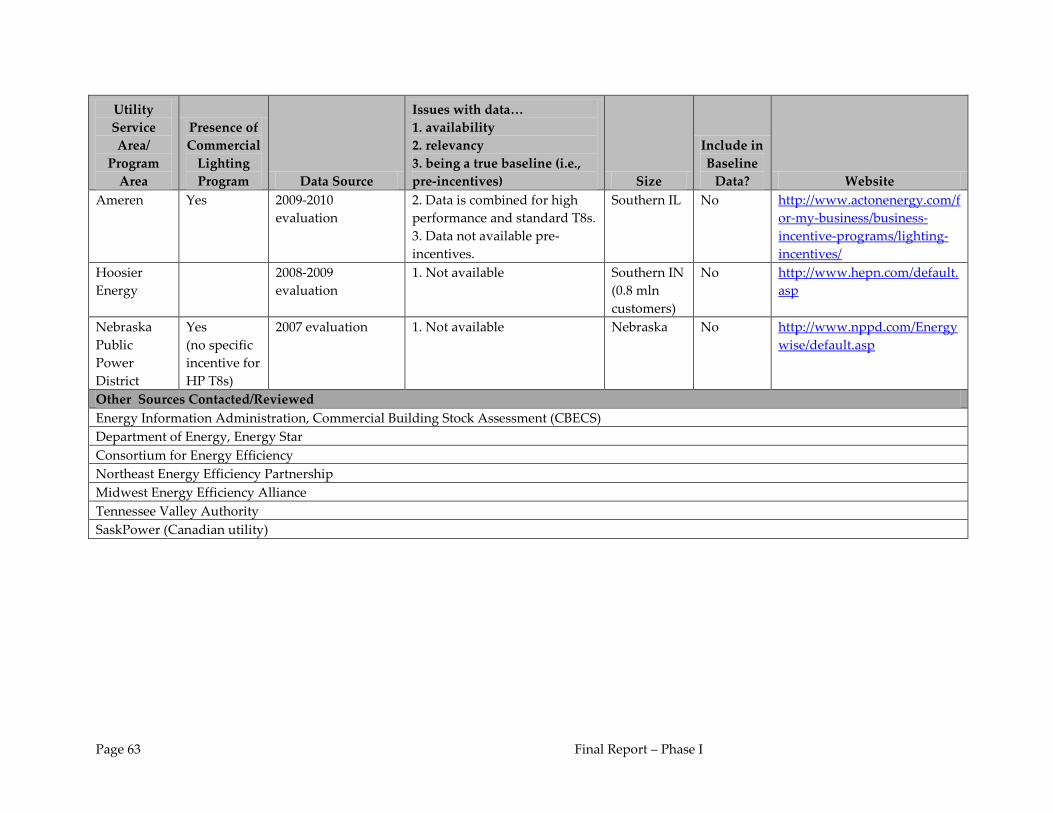
Page 63 Final Report – Phase I
Utility
Service
Area/
Program
Area
Presence of
Commercial
Lighting
Program Data Source
Issues with data…
1. availability
2. relevancy
3. being a true baseline (i.e.,
pre-incentives) Size
Include in
Baseline
Data? Website
Ameren Yes 2009-2010
evaluation
2. Data is combined for high
performance and standard T8s.
3. Data not available pre-
incentives.
Southern IL No
http://www.actonenergy.com/f
or-my-business/business-
incentive-programs/lighting-
incentives/
Hoosier
Energy
2008-2009
evaluation
1. Not available Southern IN
(0.8 mln
customers)
No http://www.hepn.com/default.
asp
Nebraska
Public
Power
District
Yes
(no specific
incentive for
HP T8s)
2007 evaluation 1. Not available Nebraska No http://www.nppd.com/Energy
wise/default.asp
Other Sources Contacted/Reviewed
Energy Information Administration, Commercial Building Stock Assessment (CBECS)
Department of Energy, Energy Star
Consortium for Energy Efficiency
Northeast Energy Efficiency Partnership
Midwest Energy Efficiency Alliance
Tennessee Valley Authority
SaskPower (Canadian utility)