commercial motor vehicle parking … motor vehicle parking trends ... abstract the major objectives...
TRANSCRIPT

FINAL REPORT
COMMERCIAL MOTOR VEHICLE PARKING TRENDS AT
REST AREAS AND WEIGH STATIONS
FDOT Contract No.: BDK80 977-14
Mehmet Emre Bayraktar, Ph.D., Associate Professor
Yimin Zhu, Ph.D., Associate Professor
Farrukh Arif, Graduate Research Assistant
OHL School of Construction
College of Engineering and Computing
Florida International University
10555 West Flagler St.
Miami, FL 33174
Submitted to:
Florida Department of Transportation
Research Center
605 Suwannee Street, MS30
Tallahassee, FL 32399
December 2012

ii
DISCLAIMER
The opinions, findings, and conclusions expressed in this publication are those of the authors and
not necessarily those of the State of Florida Department of Transportation.
iii
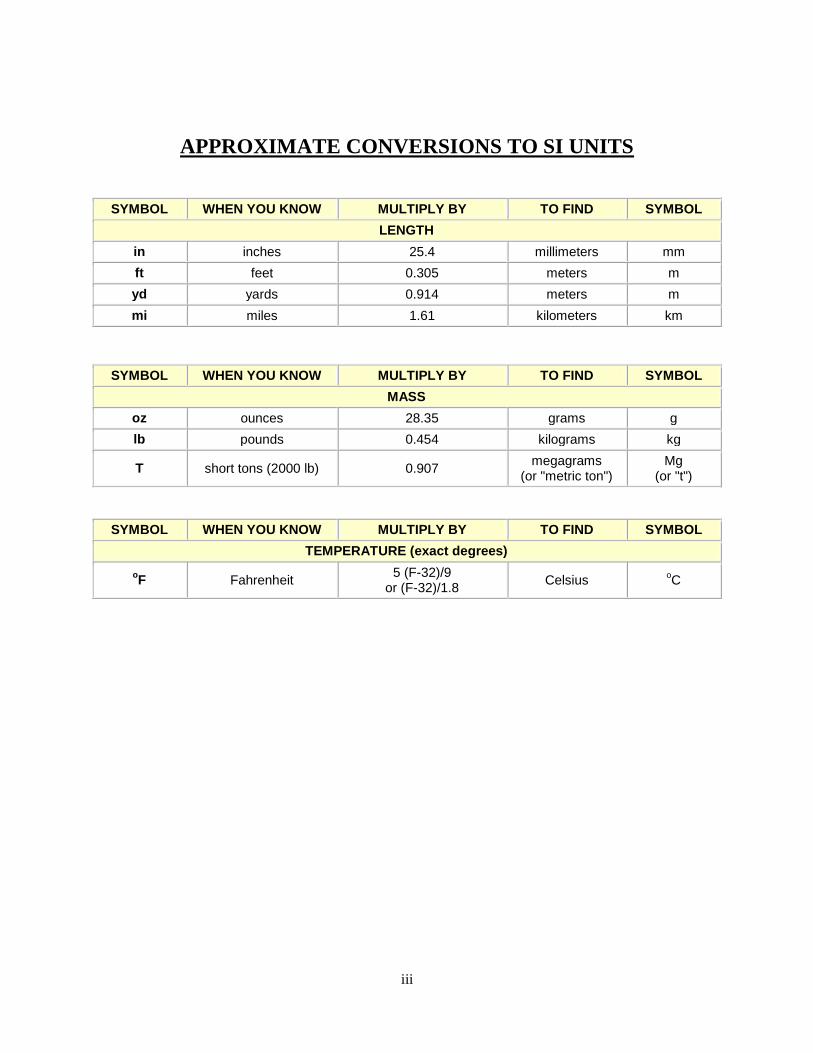
APPROXIMATE CONVERSIONS TO SI UNITS
SYMBOL WHEN YOU KNOW MULTIPLY BY TO FIND SYMBOL
LENGTH
in inches 25.4 millimeters mm
ft feet 0.305 meters m
yd yards 0.914 meters m
mi miles 1.61 kilometers km
SYMBOL WHEN YOU KNOW MULTIPLY BY TO FIND SYMBOL
MASS
oz ounces 28.35 grams g
lb pounds 0.454 kilograms kg
T short tons (2000 lb) 0.907 megagrams
(or "metric ton") Mg
(or "t")
SYMBOL WHEN YOU KNOW MULTIPLY BY TO FIND SYMBOL
TEMPERATURE (exact degrees)
oF Fahrenheit
5 (F-32)/9 or (F-32)/1.8
Celsius oC
iv
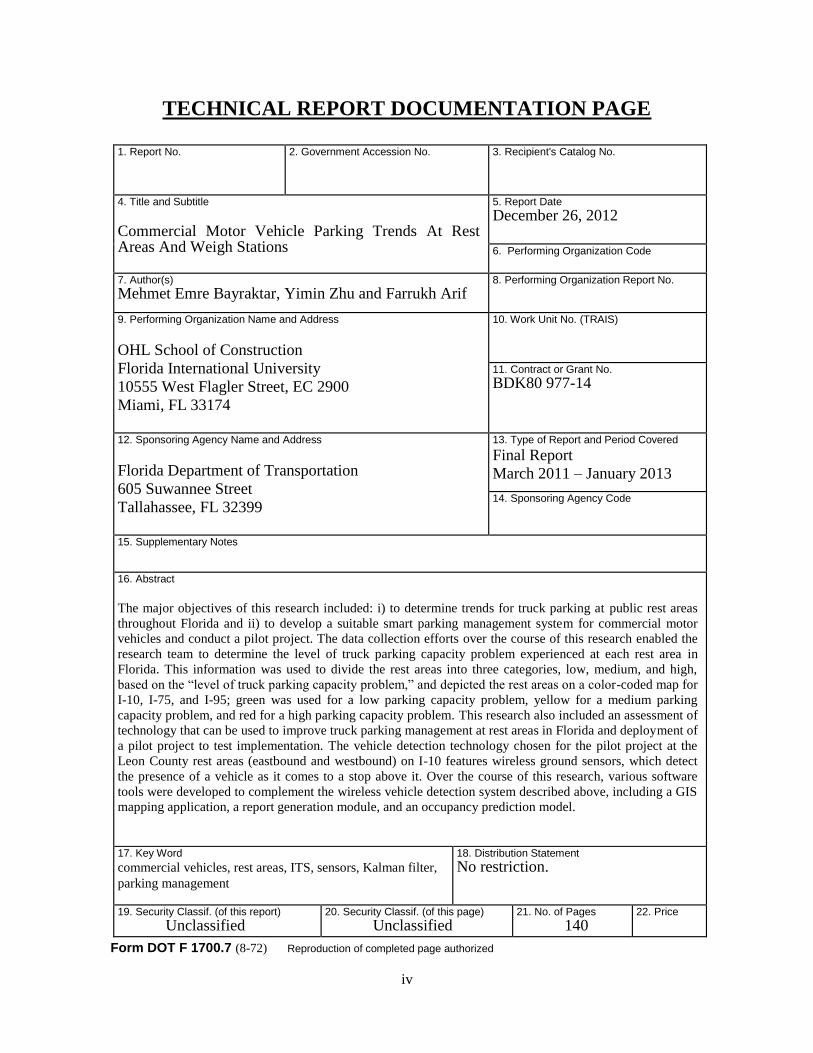
TECHNICAL REPORT DOCUMENTATION PAGE
1. Report No.
2. Government Accession No.
3. Recipient's Catalog No.
4. Title and Subtitle
Commercial Motor Vehicle Parking Trends At Rest Areas And Weigh Stations
5. Report Date
December 26, 2012
6. Performing Organization Code
7. Author(s)
Mehmet Emre Bayraktar, Yimin Zhu and Farrukh Arif 8. Performing Organization Report No.
9. Performing Organization Name and Address
OHL School of Construction
Florida International University
10555 West Flagler Street, EC 2900
Miami, FL 33174
10. Work Unit No. (TRAIS)
11. Contract or Grant No.
BDK80 977-14
12. Sponsoring Agency Name and Address
Florida Department of Transportation
605 Suwannee Street
Tallahassee, FL 32399
13. Type of Report and Period Covered
Final Report
March 2011 – January 2013
14. Sponsoring Agency Code
15. Supplementary Notes
16. Abstract
The major objectives of this research included: i) to determine trends for truck parking at public rest areas
throughout Florida and ii) to develop a suitable smart parking management system for commercial motor
vehicles and conduct a pilot project. The data collection efforts over the course of this research enabled the
research team to determine the level of truck parking capacity problem experienced at each rest area in
Florida. This information was used to divide the rest areas into three categories, low, medium, and high,
based on the “level of truck parking capacity problem,” and depicted the rest areas on a color-coded map for
I-10, I-75, and I-95; green was used for a low parking capacity problem, yellow for a medium parking
capacity problem, and red for a high parking capacity problem. This research also included an assessment of
technology that can be used to improve truck parking management at rest areas in Florida and deployment of
a pilot project to test implementation. The vehicle detection technology chosen for the pilot project at the
Leon County rest areas (eastbound and westbound) on I-10 features wireless ground sensors, which detect
the presence of a vehicle as it comes to a stop above it. Over the course of this research, various software
tools were developed to complement the wireless vehicle detection system described above, including a GIS
mapping application, a report generation module, and an occupancy prediction model.
17. Key Word
commercial vehicles, rest areas, ITS, sensors, Kalman filter,
parking management
18. Distribution Statement
No restriction.
19. Security Classif. (of this report)
Unclassified 20. Security Classif. (of this page)
Unclassified 21. No. of Pages
140 22. Price
Form DOT F 1700.7 (8-72) Reproduction of completed page authorized
v
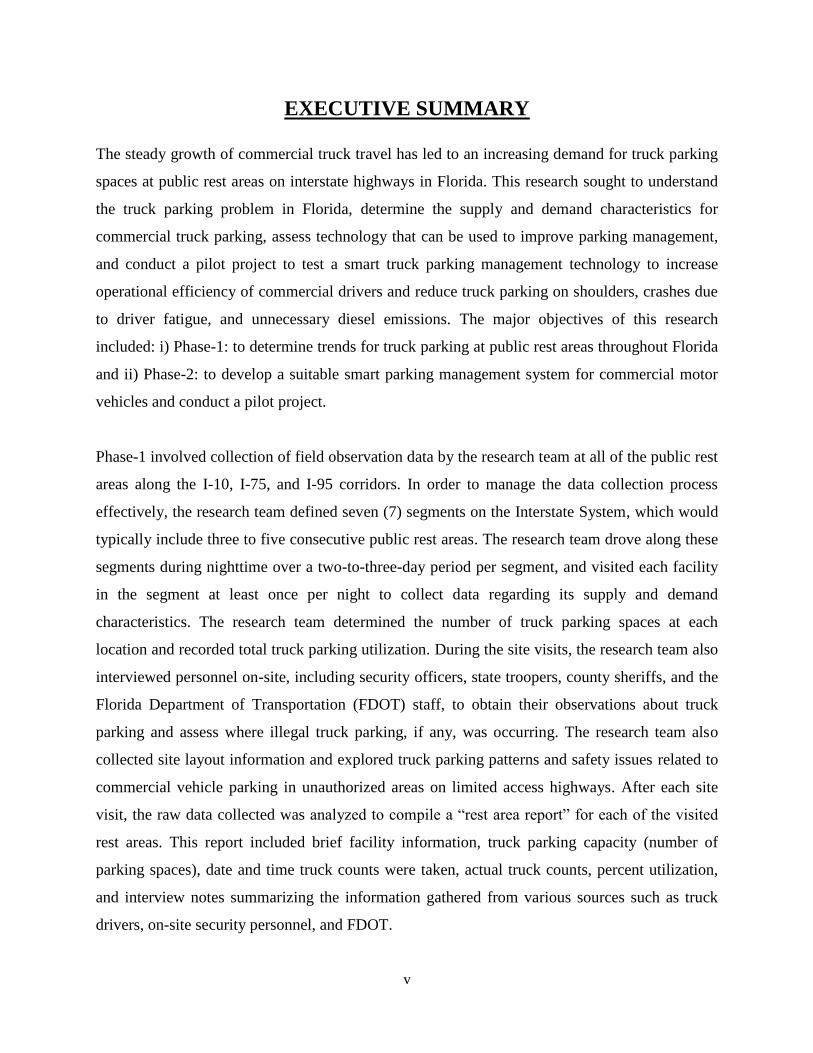
EXECUTIVE SUMMARY
The steady growth of commercial truck travel has led to an increasing demand for truck parking
spaces at public rest areas on interstate highways in Florida. This research sought to understand
the truck parking problem in Florida, determine the supply and demand characteristics for
commercial truck parking, assess technology that can be used to improve parking management,
and conduct a pilot project to test a smart truck parking management technology to increase
operational efficiency of commercial drivers and reduce truck parking on shoulders, crashes due
to driver fatigue, and unnecessary diesel emissions. The major objectives of this research
included: i) Phase-1: to determine trends for truck parking at public rest areas throughout Florida
and ii) Phase-2: to develop a suitable smart parking management system for commercial motor
vehicles and conduct a pilot project.
Phase-1 involved collection of field observation data by the research team at all of the public rest
areas along the I-10, I-75, and I-95 corridors. In order to manage the data collection process
effectively, the research team defined seven (7) segments on the Interstate System, which would
typically include three to five consecutive public rest areas. The research team drove along these
segments during nighttime over a two-to-three-day period per segment, and visited each facility
in the segment at least once per night to collect data regarding its supply and demand
characteristics. The research team determined the number of truck parking spaces at each
location and recorded total truck parking utilization. During the site visits, the research team also
interviewed personnel on-site, including security officers, state troopers, county sheriffs, and the
Florida Department of Transportation (FDOT) staff, to obtain their observations about truck
parking and assess where illegal truck parking, if any, was occurring. The research team also
collected site layout information and explored truck parking patterns and safety issues related to
commercial vehicle parking in unauthorized areas on limited access highways. After each site
visit, the raw data collected was analyzed to compile a “rest area report” for each of the visited
rest areas. This report included brief facility information, truck parking capacity (number of
parking spaces), date and time truck counts were taken, actual truck counts, percent utilization,
and interview notes summarizing the information gathered from various sources such as truck
drivers, on-site security personnel, and FDOT.

vi
The data collection efforts described above enabled the research team to determine the level of
truck parking capacity problem experienced at each rest area. This information was used to
divide the rest areas into three categories, low, medium, and high, based on the “level of truck
parking capacity issues,” and depicted the rest areas on a color-coded map for I-10, I-75, and I-
95; green was used for a low parking capacity problem, yellow for a medium parking capacity
problem, and red for a high parking capacity problem.
Phase-2 of this research project included an assessment of technology that can be used to
improve truck parking management at rest areas in Florida and deploy a pilot project to test
implementation. The guiding concept for this research was that providing better information to
truck drivers about parking availability can reduce the number of trucks parking on shoulders,
crashes due to driver fatigue, and unnecessary diesel emissions.
The vehicle detection technology chosen for the pilot project at the Leon County rest areas
(eastbound and westbound) on I-10 features wireless ground sensors, which detect the presence
of a vehicle as it comes to a stop above it. The actual occupancy determination is accomplished
using a unique combination of differential magnetic induction measurement with a built-in
infrared sensor. This combination technology allows the sensors to accurately determine the
presence of a high-clearance truck chassis without confusing it with another vehicle parked in an
adjacent space. The sensors communicate through a network of wireless mesh repeaters, which
relay information to data collectors on the premises. The data collectors in turn are connected to
a central database via the Internet. Informational maps, historical data reports, and a number of
other applications can be accessed by the user, along with other shared data platforms and
devices, such as smart phones.
Over the course of this research, various software tools were developed to complement the
wireless vehicle detection system described above, including a GIS mapping application, a report
generation module, and an occupancy prediction model. The GIS mapping application developed
for the pilot project represents an easy to read site map that offers a real-time feed of the sites’
truck parking information. The report generation module offers immediate access to historical
truck parking data collected from the truck parking facilities. The occupancy prediction model

vii
utilizes the Kalman filter to predict available parking spaces at a date and time specified by the
user.
viii
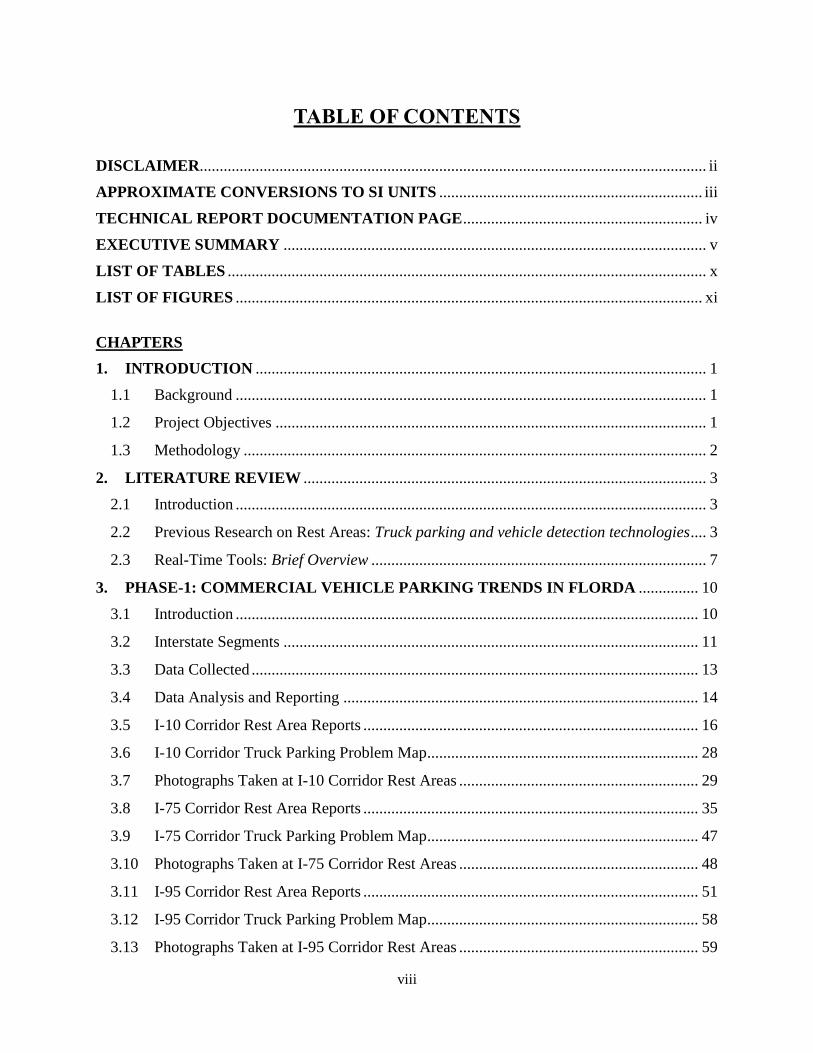
TABLE OF CONTENTS
DISCLAIMER............................................................................................................................... ii
APPROXIMATE CONVERSIONS TO SI UNITS .................................................................. iii
TECHNICAL REPORT DOCUMENTATION PAGE ............................................................ iv
EXECUTIVE SUMMARY .......................................................................................................... v
LIST OF TABLES ........................................................................................................................ x
LIST OF FIGURES ..................................................................................................................... xi
CHAPTERS
1. INTRODUCTION ................................................................................................................. 1
1.1 Background ...................................................................................................................... 1
1.2 Project Objectives ............................................................................................................ 1
1.3 Methodology .................................................................................................................... 2
2. LITERATURE REVIEW ..................................................................................................... 3
2.1 Introduction ...................................................................................................................... 3
2.2 Previous Research on Rest Areas: Truck parking and vehicle detection technologies .... 3
2.3 Real-Time Tools: Brief Overview .................................................................................... 7
3. PHASE-1: COMMERCIAL VEHICLE PARKING TRENDS IN FLORDA ............... 10
3.1 Introduction .................................................................................................................... 10
3.2 Interstate Segments ........................................................................................................ 11
3.3 Data Collected ................................................................................................................ 13
3.4 Data Analysis and Reporting ......................................................................................... 14
3.5 I-10 Corridor Rest Area Reports .................................................................................... 16
3.6 I-10 Corridor Truck Parking Problem Map.................................................................... 28
3.7 Photographs Taken at I-10 Corridor Rest Areas ............................................................ 29
3.8 I-75 Corridor Rest Area Reports .................................................................................... 35
3.9 I-75 Corridor Truck Parking Problem Map.................................................................... 47
3.10 Photographs Taken at I-75 Corridor Rest Areas ............................................................ 48
3.11 I-95 Corridor Rest Area Reports .................................................................................... 51
3.12 I-95 Corridor Truck Parking Problem Map.................................................................... 58
3.13 Photographs Taken at I-95 Corridor Rest Areas ............................................................ 59
ix
4. PHASE-2: IMPLEMENTING A SMART PARKING MANAGEMENT SYSTEM
FOR COMMERCIAL TRUCKS ....................................................................................... 63
4.1 Introduction .................................................................................................................... 63
4.2 Wireless Vehicle Detection System ............................................................................... 64
4.3 Site Selection and Site Survey ....................................................................................... 67
4.4 System Design and Layout ............................................................................................. 70
4.5 Hardware Installation ..................................................................................................... 71
5. GIS MAPPING APPLICATION AND REPORT GENERATION................................ 80
5.1 Introduction .................................................................................................................... 80
5.2 Network Administration and System Diagnostics ......................................................... 80
5.3 Online Access to Software Tools ................................................................................... 80
5.4 GIS Mapping Application .............................................................................................. 82
5.5 Report Generation .......................................................................................................... 85
5.6 Cloud Integration............................................................................................................ 90
6. OCCUPANCY PREDICTION MODEL ........................................................................... 91
6.1 Introduction to Kalman Filter ......................................................................................... 91
6.2 Applications of Kalman Filter in Intelligent Transportation Systems (ITS) .................. 92
6.3 Rest Area Occupancy Prediction Model based on Kalman Filter .................................. 92
6.4 Evaluation of Prediction Accuracy .............................................................................. 105
6.5 Web-based Occupancy Prediction Query .................................................................... 109
7. CONCLUSIONS ................................................................................................................ 111
7.1 Summary ...................................................................................................................... 111
7.2 Advantages of the Tested Wireles Vehicle Detection System ..................................... 112
7.3 Recommendations for Further Research ...................................................................... 113
REFERENCES .......................................................................................................................... 115
APPENDIX A: Technical Specifications for Mesh Network Components .............................. 118
APPENDIX B: Root Mean Squared Error Calculations ........................................................... 120

x
LIST OF TABLES
Table 1: Interstate segments ........................................................................................................................ 12
Table 2: Leon County rest area information ............................................................................................... 68
Table 3: Average hourly occupancy data for Mondays ............................................................................ 100
Table 4: Kalman filter iterations ............................................................................................................... 103
Table 5: Regression model prediction (example) ..................................................................................... 103
Table 6: The calculated RMSE values ...................................................................................................... 107
xi
LIST OF FIGURES
Figure 1: Florida's rest areas ....................................................................................................................... 10
Figure 2: Segment #7 .................................................................................................................................. 11
Figure 3: Types of data collected by the research team .............................................................................. 14
Figure 4: Data analysis and reporting ......................................................................................................... 15
Figure 5: 1-10 corridor truck parking problem map ................................................................................... 28
Figure 6: A truck parked on an on-ramp near Tallahassee ......................................................................... 29
Figure 7: Trucks parked at Holmes County rest area .................................................................................. 29
Figure 8: Two overflow trucks parked near the exit at Holmes County rest area ....................................... 30
Figure 9: Cramped design of the parking lot at Jackson West .................................................................... 30
Figure 10: Illegal parking at Baker East ..................................................................................................... 31
Figure 11: Illegal parking at Baker West .................................................................................................... 31
Figure 12: Ruined pavement due to truck parking at Suwannee-Columbia East ........................................ 32
Figure 13: Trucks parked on the access ramp at Madison East .................................................................. 33
Figure 14: Illegal parking at Madison West ................................................................................................ 33
Figure 15: Illegal parking at Jefferson West ............................................................................................... 34
Figure 16: I-75 corridor truck parking problem map .................................................................................. 47
Figure 17: Research team members interviewing a truck driver at the Lee County rest area..................... 48
Figure 18: Trucks parked on the shoulder at Columbia South .................................................................... 48
Figure 19: Truck parked on the shoulder at Columbia North ..................................................................... 49
Figure 20: Another truck parked on the shoulder at Columbia North ........................................................ 49
Figure 21: The truck parking lot of Alachua North during daytime ........................................................... 50
Figure 22: I-95 corridor truck parking problem map .................................................................................. 58
Figure 23: Trucks parked on the highway shoulder at Brevard North (MM227) ....................................... 59
Figure 24: Trucks parked on the exit ramp and highway shoulder at Brevard North (MM227) ................ 59
Figure 25: Trucks parked on the exit ramp at Brevard North (MM227) .................................................... 60
Figure 26: A truck parked on the highway shoulder at Brevard North (MM227) ...................................... 60
Figure 27: A truck parked on the exit ramp at Brevard South (MM227) ................................................... 61
Figure 28: Ruined pavement due to shoulder parking at St. Johns ............................................................. 61
Figure 29: Trucks parked on the highway shoulder at St. Johns (MM 302) ............................................... 62
Figure 30: Wireless vehicle detection system application at a rest area in Europe .................................... 64
Figure 31: System components and hardware description .......................................................................... 65
Figure 32: Top view (left) and bottom view of the ground sensor ............................................................. 66
Figure 33: Ground level section view of the sensor .................................................................................... 66
Figure 34: Leon County rest area outside of Tallahassee, FL ..................................................................... 68
Figure 35: Leon County rest area (Eastbound) ........................................................................................... 69
xii
Figure 36: Leon County rest area (Westbound) .......................................................................................... 69
Figure 37: Leon County rest area system design and layout ...................................................................... 70
Figure 38: Core drilling process.................................................................................................................. 72
Figure 39: The core before removal ............................................................................................................ 73
Figure 40: The removed core and the sensor to be installed ....................................................................... 73
Figure 41: Sensor being installed by the technician.................................................................................... 74
Figure 42: The first row of sensors after installation .................................................................................. 75
Figure 43: Relay node mounted to light pole .............................................................................................. 76
Figure 44: Relay node mounted to traffic sign pole .................................................................................... 77
Figure 45: Data collector mounted to light pole ......................................................................................... 78
Figure 46: Data collector and the camera ................................................................................................... 79
Figure 47: Login screen .............................................................................................................................. 81
Figure 48: Main menu ................................................................................................................................. 81
Figure 49: GIS interface .............................................................................................................................. 82
Figure 50: Camera view (Leon East) .......................................................................................................... 83
Figure 51: GIS interface in aerial view (Leon East) ................................................................................... 83
Figure 52: GIS interface in aerial view capturing both rest areas ............................................................... 84
Figure 53: Report generation module main menu ...................................................................................... 85
Figure 54: User input screen to generate occupancy reports ...................................................................... 86
Figure 55: Occupancy report for Leon West (example report) ................................................................... 86
Figure 56: Average number of trucks parked per day at the Leon County rest areas (example report) ..... 87
Figure 57: Average percentage occupancy at Leon West (example report) ............................................... 88
Figure 58: List of parking events at Leon East (example report) ............................................................... 89
Figure 59: Hourly truck counts at Leon East (example report) .................................................................. 89
Figure 60: Potential integration with SunGuide®
....................................................................................... 90
Figure 61: Kalman filter process ................................................................................................................. 96
Figure 62: Standard deviation of historical occupancy data ....................................................................... 99
Figure 63: Predicted occupancy versus actual occupancy ........................................................................ 104
Figure 64: Regression curve (example)……..……....................................................…………………..106
Figure 65: RMSE curves ........................................................................................................................... 108
Figure 66: Web-based occupancy prediction query .................................................................................. 109
Figure 67: Occupancy prediction report (example) .................................................................................. 110
1
1. INTRODUCTION
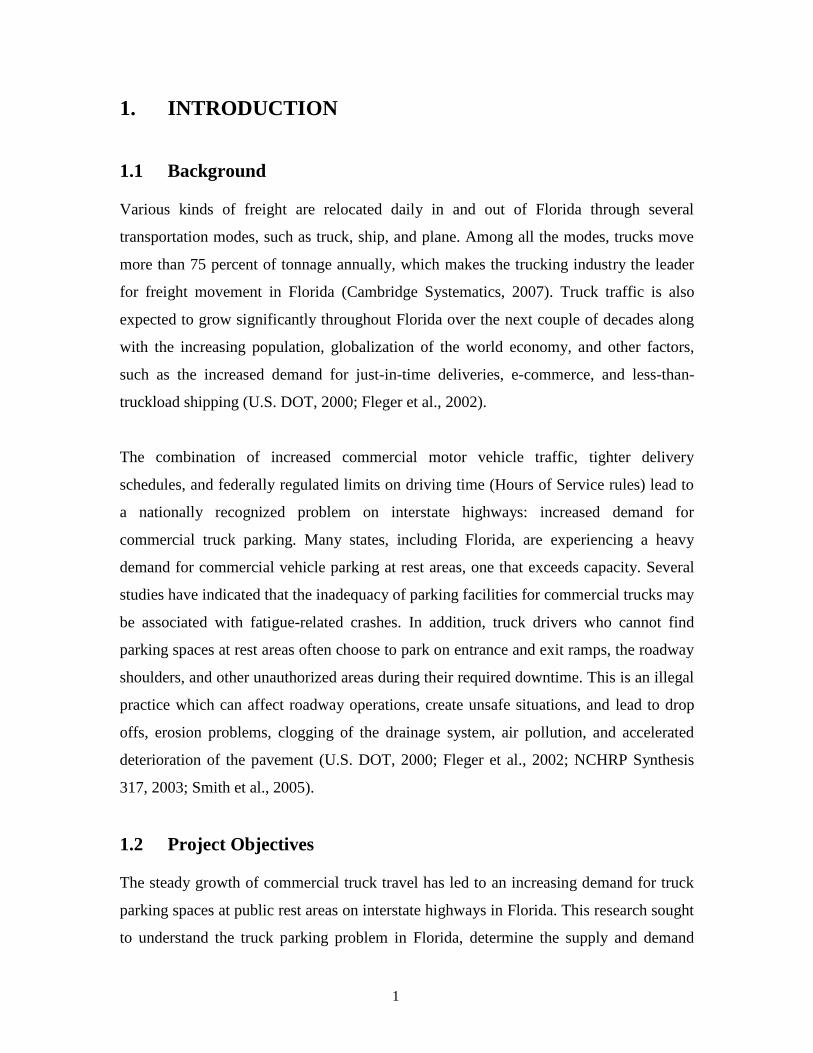
1.1 Background
Various kinds of freight are relocated daily in and out of Florida through several
transportation modes, such as truck, ship, and plane. Among all the modes, trucks move
more than 75 percent of tonnage annually, which makes the trucking industry the leader
for freight movement in Florida (Cambridge Systematics, 2007). Truck traffic is also
expected to grow significantly throughout Florida over the next couple of decades along
with the increasing population, globalization of the world economy, and other factors,
such as the increased demand for just-in-time deliveries, e-commerce, and less-than-
truckload shipping (U.S. DOT, 2000; Fleger et al., 2002).
The combination of increased commercial motor vehicle traffic, tighter delivery
schedules, and federally regulated limits on driving time (Hours of Service rules) lead to
a nationally recognized problem on interstate highways: increased demand for
commercial truck parking. Many states, including Florida, are experiencing a heavy
demand for commercial vehicle parking at rest areas, one that exceeds capacity. Several
studies have indicated that the inadequacy of parking facilities for commercial trucks may
be associated with fatigue-related crashes. In addition, truck drivers who cannot find
parking spaces at rest areas often choose to park on entrance and exit ramps, the roadway
shoulders, and other unauthorized areas during their required downtime. This is an illegal
practice which can affect roadway operations, create unsafe situations, and lead to drop
offs, erosion problems, clogging of the drainage system, air pollution, and accelerated
deterioration of the pavement (U.S. DOT, 2000; Fleger et al., 2002; NCHRP Synthesis
317, 2003; Smith et al., 2005).
1.2 Project Objectives
The steady growth of commercial truck travel has led to an increasing demand for truck
parking spaces at public rest areas on interstate highways in Florida. This research sought
to understand the truck parking problem in Florida, determine the supply and demand
2
characteristics for commercial truck parking, assess technology that can be used to
improve parking management, and conduct a pilot project to test a smart truck parking
management technology to increase operational efficiency of commercial drivers, reduce
trucks parking on shoulders, crashes due to driver fatigue, and unnecessary diesel
emissions. The specific objectives of this research included: i) Phase-1: to determine
trends for truck parking at rest areas and weigh stations throughout Florida and ii) Phase-
2: to develop a suitable smart parking management system for commercial motor vehicles
and conduct a pilot project.
1.3 Methodology
This research study was conducted in two phases: Phase-1 and Phase-2.
PHASE-1: Commercial Vehicle Parking Trends in Florida
To evaluate the adequacy of parking spaces for commercial trucks along interstate
highways in Florida and determine the extent of illegal truck parking, information on
supply and demand characteristics of commercial truck parking facilities is necessary.
Phase-1 of the proposed study inventoried Florida’s public rest areas, observed
commercial truck parking characteristics, determined current shortfalls in the supply of
commercial truck parking spaces, determined illegal parking, and surveyed relevant
stakeholders.
PHASE-2: Implementing a Smart Parking Management System for Commercial
Trucks
Two approaches to solving the truck parking shortage include: (i) increasing the supply
of parking spaces and (ii) better matching supply and demand in areas where a parking
shortage exists. Increasing supply of parking spaces is a direct but also a capital intensive
solution, whereas better matching supply and demand is more practical and cost-effective
(Smith et al., 2005). Phase-2 of this research project included assessment of technology
that can be used to improve truck parking management in Florida by better matching
supply and demand at rest areas and deploy a pilot project to test implementation.

3
2. LITERATURE REVIEW
2.1 Introduction
This chapter provides a comprehensive review of the studies published with regards to
commercial vehicle parking at rest areas. The review has been conducted through an
investigation into research reports, articles, newsletters, and web-sources. The review is
divided into two main parts, keeping in mind the two distinct phases of this research
project. The first part provides a detailed account of the research projects and studies that
have been conducted over a period of the last three decades. The second part of the
literature review discusses the different smart parking technologies currently available.
2.2 Previous Research on Rest Areas: Truck parking and vehicle
detection technologies
The review in this section is provided in chronological form so that the readers can better
understand the advancements and intensity of various research efforts conducted over the
last three decades.
A study in the State of Michigan (1985) concluded that there were seasonal differences in
occupancy times between passengers and heavy vehicles for six rest areas (Twardzik and
Haskell, 1985). The Nebraska Department of Roads (1987) also conducted a study that
reported the mean time spent in rest areas by vehicle class. King (1989) performed field
studies as part of a National Cooperative Highway Research Program (NCHRP) project
at nine sites to determine the mean time spent by vehicles at rest areas. Perfater (1989)
performed a study to determine operation and motorist usage of interstate rest areas and
Welcome Centers in Virginia, compiling limited data on the dwell time of vehicles at 11
rest areas. Other related rest area studies that were conducted include Adams and
Reierson (1981), Melton (1989), and Byrne (1991).
In 1996, the American Transportation Research Institute (ATRI) conducted research to
evaluate truck driver rest and parking needs along the National Interstate System by

4
developing analytical models to estimate the demand for truck parking spaces. The study
identified a shortfall of 28,400 truck parking spaces in public rest areas nationwide and
predicted the shortage would grow to 39,000 in ten years. The study also concluded that
the private truck stops were basically complementary facilities as opposed to a substitute
for public rest areas.
The Minnesota Department of Transportation (MnDOT, 1998) performed a commercial
truck usage nighttime parking demand analysis for the period of 1995 to 1998. The
objective of the study was to identify rest areas where there is a greater demand for
nighttime truck parking than there are available spaces and to document the frequency of
this occurrence. The study found that there were capacity issues with commercial vehicle
parking at 26 safety rest areas in Minnesota out of the 55 full service rest areas operated
by MnDOT. At these sites, the nighttime commercial vehicle parking usually was at
capacity or exceeded more than 3% of the weekdays or total days per year.
MnDOT conducted a study to determine nighttime commercial vehicle parking demand
at 15 high-use Minnesota rest areas. These rest areas were previously identified using the
data collected by MnDOT between 1995 and 1998 for oversized vehicles at 50 full-
service rest areas around the state. Data was collected each night at 10:00 PM; midnight;
1:00, 2:00, or 3:00 AM depending on the end of shift for custodians; and 6:00, 7:00, or
8:00 AM depending on the start of the new shift for the custodians. The data was used to
provide a trend analysis and to project the parking demands by year 2020, as well as to
provide some recommendations in the form of future design and data collection
considerations (MnDOT, 2001).
Garder and Bosonetto (2002) conducted a study for the New England Transportation
Consortium (NETC) focused on finding out the design and operation issues of interstate
rest areas in New England. The researchers collected data through surveys to determine
usage trends and motorists' preferences. The outcomes of the study suggested that
motorists agree to the necessity of the rest areas along the interstates; however, they
stressed the need for a well-informed system to assist in deciding the use of rest areas.

5
The researchers proposed a kiosk system to provide this information to travelers using a
GIS interface.
In 2005, the Federal Motor Carrier Safety Administration (FMCSA) began studying truck
parking issues and identified two possible solutions to the increasing problem of truck
parking capacity at rest areas. One solution is to increase the supply of spaces and better
match supply and demand in areas where a parking shortage exists; the other solution was
to use Intelligent Transportation Systems (ITS) to develop a system that can provide
commercial motor vehicle drivers with real-time parking availability information in order
to better match the demand for parking spaces with the existing supply. Since the first
solution was capital intensive, a higher degree of recommendation was associated with
the ITS solution (Smith et al., 2005). Following its recommendation, in 2007, FMSCA
began the smart parking initiative to demonstrate whether ITS applications were a better
solution for providing commercial truck drivers with real-time information. Researchers
conducted field tests to determine the feasibility of using magnetometry technology,
which detects the presence of magnetic metals, to establish parking availability.
Connecticut DOT (2008) conducted a statewide rest area and service plaza study to
address the parking issues in facilities such as rest areas and service plazas and provide a
comprehensive plan of action. The study was conducted in response to the Federal
Highway Administration’s (FHWA) initiative to encourage states to develop programs
that address the issue. The study involved extensive data collection based on the
projected future traveler demands. Furthermore, the study helped in the development of
recommendations for improvements to such facilities. One of the important conclusions
drawn by the research team was that different modes of transportation have their different
service requirements. Therefore, in specific reference to truck parking, it was suggested
that trucks and automobiles should have separate parking areas with well-defined
pedestrian routes to decrease the possibility of internal conflicts at the sites.
In 2008, the North Jersey Transportation Planning Authority (NJTPA) published a study
on truck rest stops. The assessment was done in order to identify potential locations for
6
truck rest areas in the northern New Jersey and port area. The study found out that a vast
majority of the truck drivers encounter a shortage of truck parking facilities, specifically
in the case of long overnight parking requirements. As a result, the drivers have to park
on the shoulders. The severity of the problem has been emphasized by the fact that nearly
300 trucks were observed on the shoulders of major limited-access highways in the
NJTPA region or on local roads in the port area, near rail yards, or adjacent to warehouse
and distribution centers during a weekday night (NJTPA, 2008).
Banerjee et al. (2009) undertook a study for CALTRANS to investigate accidents
involving driver fatigue near rest areas (and to evaluate methods for reducing them) by
conducting a spatial evaluation of fatigue-related collisions. The study made a
comparison of normal ramps to those of rest areas' upstream and downstream ramps, and
found that trucks were the primary vehicle-type involved in rest area ramp collisions. The
study also revealed that some rest areas had too few parking spots, which therefore
contributed to the cause of accidents. The study analyzed the collision rates due to the
shoulder parking (termed as informal rest areas) and found that such ramps had a higher
rate, or greater chance, of collision than other ramps.
Al-Kaisy et al. (2010) conducted a study collecting and analyzing dwell time data from
three rest areas in Montana. They utilized surveillance cameras attached to high-mast
mobile trailers. These cameras were powered with solar panels, and the mobile trailers
were deployed for one week at each study site. Manual processing of the field dwell time
data was utilized in this study.
Finally, Gates et al. (2012) conducted a study for the Michigan Department of
Transportation (MDOT) to determine the value of public rest areas, including Welcome
Centers, in Michigan. The researchers performed a benefit-cost analysis to determine the
economic feasibility of the rest areas in the Michigan interstate system. The B/C analysis
was performed both at the individual rest area, as well as the system, level. The results of
the economic analysis showed that nearly all MDOT rest areas currently possess B/C
ratios that exceed 1.0, while the system of rest areas in the state was also found extremely

7
feasible with a B/C ratio of 4.56. The individual values for the 81 facilities ranged from
between 0.78 to 11.66. Most of the rest area benefits came through comfort/convenience
(i.e., the “value” to users), or reduction of targeted fatigue-related crashes and tourism
benefits (Welcome Centers only). The researchers also developed a software tool to allow
for the estimation of impacts associated with the removal of rest area(s) from the system.
2.3 Real-Time Tools: Brief Overview
This section discusses technologies and approaches related to i) available vehicle
detection technologies, ii) occupancy calculation methods, and iii) forecasting space
availability.
Available Vehicle Detection Technologies
The literature review indicates that a wide range of intrusive and non-intrusive
technologies have been successfully introduced or proposed in practice to obtain the basic
input data for parking systems, such as: (1) inductive loop detector, (2) magnetic sensor,
(3) ultrasonic sensor, (4) infrared sensor, and (5) machine vision (video image processor).
Havinoviski et al. (2000) considered which specific data collection technologies were the
most practical for different scenarios:
In-garage information: infrared sensor;
Surface lot information: inductive loop detector or ultrasonic sensor; and
Wide-area parking information: video image processing.
Occupancy Calculation Methods
There are essentially two approaches in using automation to determine how many spaces
are available at a particular parking area (Smith et al. 2005).
Individual Parking Bay Detection: Either sensors are installed in each parking
space or a video pattern recognition system is used to count available spaces.
While this approach offers accuracy, it is more costly with respect to equipment
and installation (Smith et al. 2005).

8
Count In and Count Out: This method includes counting of the number of
trucks entering and exiting a parking area using a sensor and, subsequently,
calculation of the number of vehicles currently parked (Smith et al. 2005). As
quoted from Smith et al. (2005), “this usually produces less accurate results
because not all vehicles will park in a designated space, some vehicles will take
up multiple spaces, and a sensor misread may never be corrected unless the
parking area closes periodically or a manual count and correction is performed.”
Forecasting Space Availability
Smith et al. (2005) indicates: “Even a perfectly accurate parking occupancy detection
system will only indicate the number of spaces available at a particular point in time.
What the drivers need, however, is an indication of whether spaces will be available at
the time he or she arrives at the truck stop or rest area.” The study lists the following
quoted approaches to deal with this problem:
“Furnish information to the driver just before the entry to the rest area or truck
stop. With a less than 1-minute lag, the actual occupancy number is not likely to
change significantly. However, this does not help a driver to choose among rest
locations, since some of them may be many miles down the road” (Smith et al.
2005).
“Furnish information on the number of spaces occupied and the number of spaces
available, and let drivers do their own estimating as to whether spaces will be
available when they arrive. This may be sufficient for a driver who is familiar
with the corridor, but may not be helpful to an unfamiliar driver” (Smith et al.
2005).
“Provide a forecast of space availability, based on historical information.” For
example: if 20 spaces are open now at 7:00 PM, the lot will likely be full by 8:00
PM (Smith et al. 2005).

9
“Allow drivers to send an inquiry or request for parking to the parking
management system, and incorporate this request along with requests from other
drivers into the forecasts” (Smith et al. 2005).
10
3. PHASE-1: COMMERCIAL VEHICLE PARKING
TRENDS IN FLORIDA
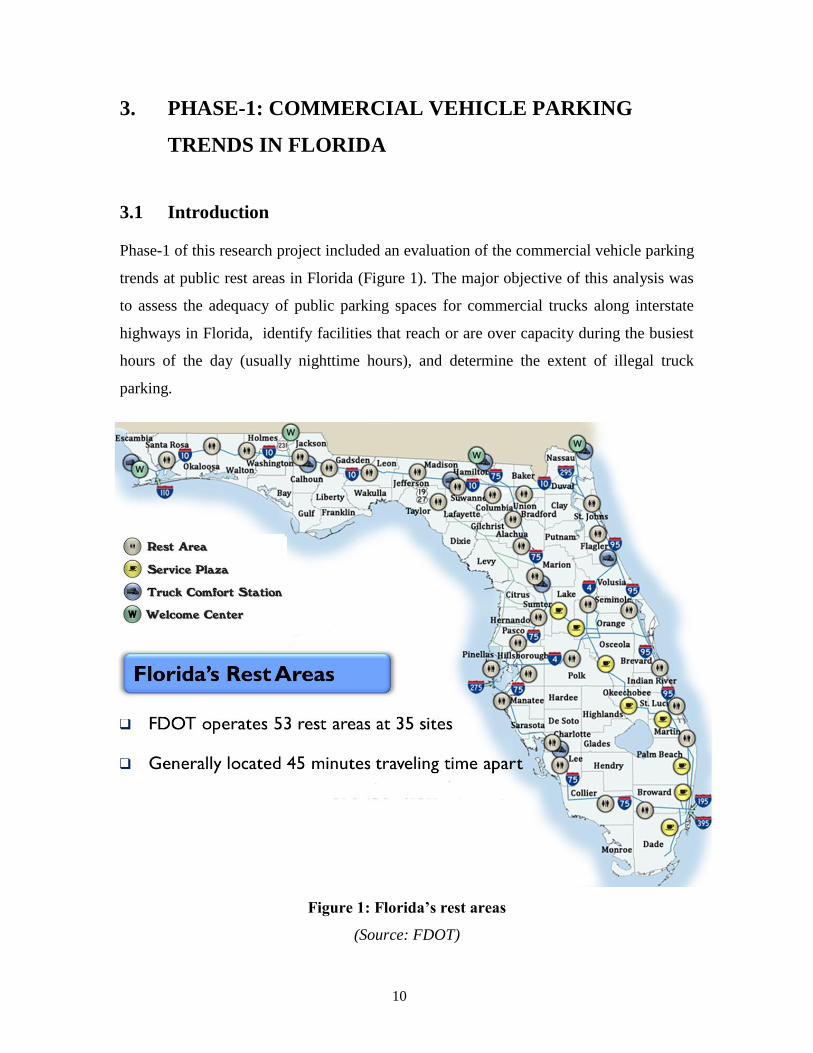
3.1 Introduction
Phase-1 of this research project included an evaluation of the commercial vehicle parking
trends at public rest areas in Florida (Figure 1). The major objective of this analysis was
to assess the adequacy of public parking spaces for commercial trucks along interstate
highways in Florida, identify facilities that reach or are over capacity during the busiest
hours of the day (usually nighttime hours), and determine the extent of illegal truck
parking.
Figure 1: Florida’s rest areas
(Source: FDOT)

11
The specific objectives of Phase-1 included: (i) to determine the supply characteristics of
public truck parking facilities along interstate highways in Florida; (ii) to determine the
demand characteristics of facilities along interstate highways in Florida; (iii) to determine
public truck parking facilities that are being used and to what capacity; and (iv) to
determine current shortfalls in the supply of commercial truck parking spaces along
interstate highways in Florida.
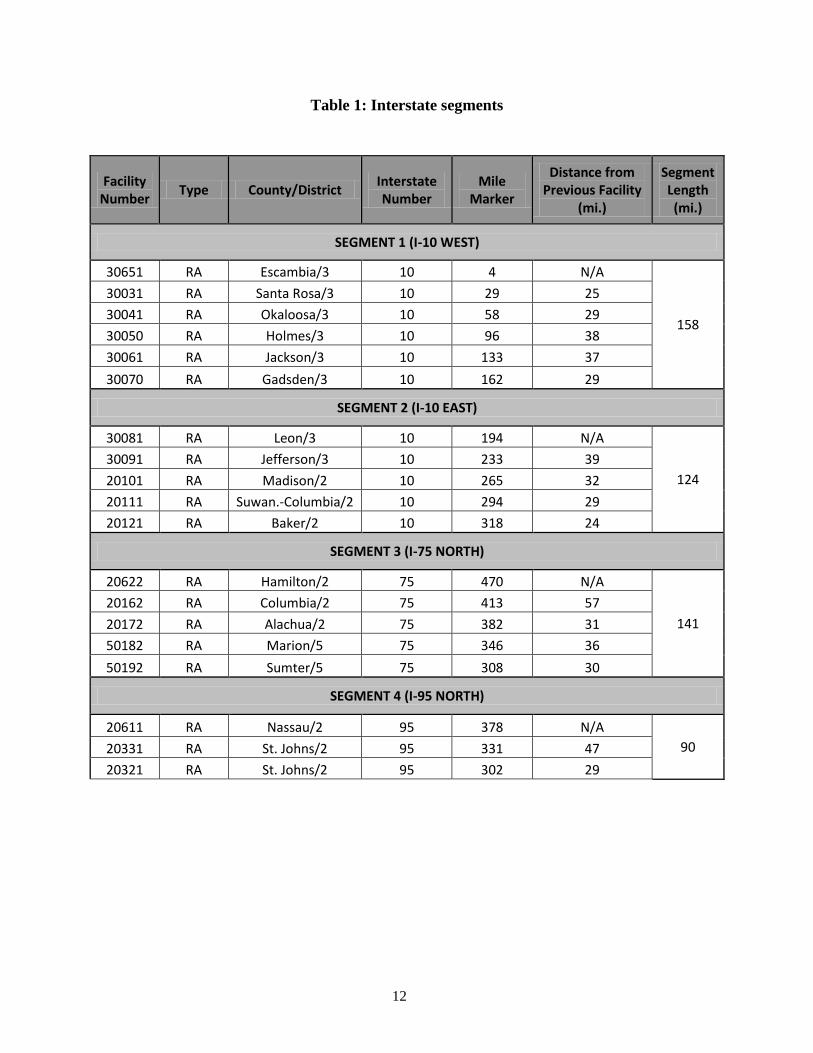
3.2 Interstate Segments
Phase-1 involved collection of field observation data by the research team at all of the
public rest areas along the I-10, I-75, and I-95 corridors. In order to manage the data
collection process effectively, the research team defined seven (7) segments on the
Interstate System which typically included three to five consecutive public rest areas
(Table 1). For example, the Broward, Collier, Lee, and Charlotte rest areas on the south
section of I-75 constitute one such segment, Segment #7, with a length of about 127
miles (Figure 2). The research team drove along these segments during nighttime over a
two-to-three-day period per segment, and visited each facility in the segment at least once
per night to collect data regarding its supply and demand characteristics.
Figure 2: Segment #7
12
Table 1: Interstate segments
Facility Number
Type County/District Interstate Number
Mile Marker
Distance from Previous Facility
(mi.)
Segment Length (mi.)
SEGMENT 1 (I-10 WEST)
30651 RA Escambia/3 10 4 N/A
158
30031 RA Santa Rosa/3 10 29 25
30041 RA Okaloosa/3 10 58 29
30050 RA Holmes/3 10 96 38
30061 RA Jackson/3 10 133 37
30070 RA Gadsden/3 10 162 29
SEGMENT 2 (I-10 EAST)
30081 RA Leon/3 10 194 N/A
124
30091 RA Jefferson/3 10 233 39
20101 RA Madison/2 10 265 32
20111 RA Suwan.-Columbia/2 10 294 29
20121 RA Baker/2 10 318 24
SEGMENT 3 (I-75 NORTH)
20622 RA Hamilton/2 75 470 N/A
141
20162 RA Columbia/2 75 413 57
20172 RA Alachua/2 75 382 31
50182 RA Marion/5 75 346 36
50192 RA Sumter/5 75 308 30
SEGMENT 4 (I-95 NORTH)
20611 RA Nassau/2 95 378 N/A
90 20331 RA St. Johns/2 95 331 47
20321 RA St. Johns/2 95 302 29

13
Table 1: Interstate segments (continued)
Facility Number
Type County/District Interstate Number
Mile Marker
Distance from Previous Facility
(mi.)
Segment Length (mi.)
SEGMENT 5 (I-95 SOUTH)
40401 RA Brevard/5 95 227 N/A
120 40391 RA Brevard/5 95 169 26
50381 RA St. Lucie/4 95 133 36
50341 RA Martin/4 95 107 58
SEGMENT 6 (I-75 CENTRAL)
70251 RA Hillsborough/7 75 238 N/A
N/A 10370 RA Manatee/1 275 7 N/A
70360 RA Pinellas/7 275 13 N/A
70241 RA Pasco/7 75 Closed N/A
SEGMENT 7 (I-75 SOUTH)
40490 RA Charlotte/1 75 161 N/A
127 10290 RA Lee/1 75 131 30
10280 RA Collier/1 75 63 68
10270 RA Broward/4 75 34 29
3.3 Data Collected
The research team determined the number of truck parking spaces at each location and
recorded total truck parking utilization. Total parking utilization is the percentage of
trucks parked both legally in the parking spaces and illegally elsewhere at the facility
with respect to the available capacity. For example, if a rest area has 18 parking spaces,
and at 1:00 AM it has 18 trucks parked legally, as well as 3 trucks parked at the entrance
and 4 trucks parked at the exit, this yields a total of 25 trucks parked at the location,
resulting in a 139% utilization ratio for the site at 1:00 AM.
During the site visits, the research team also interviewed personnel on-site, including
security officers, state troopers, county sheriffs, and the Florida Department of

14
Transportation (FDOT) staff, to obtain their observations about truck parking and assess
where illegal truck parking, if any, was occurring. The research team also collected site
layout information and explored truck parking patterns and safety issues in unauthorized
areas on limited access highways (Figure 3).
Figure 3: Types of data collected by the research team
3.4 Data Analysis and Reporting
After each site visit, the raw data collected was analyzed to compile a “rest area report”
for each of the visited rest areas. This report included brief facility information, truck
parking capacity (number of parking spaces), date and time truck counts were taken,
actual truck counts, percent utilization, and interview notes summarizing the information

15
gathered from various sources such as truck drivers, on-site security personnel, and
FDOT (Figure 4).
Figure 4: Data analysis and reporting
The data collection efforts described above enabled the research team to determine the
level of truck parking capacity problem experienced at each rest area. This information
was used to divide the rest areas into three categories, low, medium, and high, based on
the “level of truck parking capacity problem,” and depicted the rest areas on a color-
coded map for I-10, I-75, and I-95; green was used for a low parking capacity problem,
yellow for a medium parking capacity problem, and red for a high parking capacity
problem. The following three sections of this chapter present the rest area reports for each
visited facility, the resulting color-coded map for the I-10, I-75, and I-95 corridors, and
the relevant photographs taken during the visits documenting illegal parking in these
corridors.

16
3.5 I-10 Corridor Rest Area Reports
ESCAMBIA COUNTY WELCOME CENTER
Truck Counts
Interstate Number I-10
Facility Number 30010
Mile Marker 4
Capacity 31 District 3
Truck Counts
Date Time Count % Utilization
September 8, 2011 3:25 AM 29 94
September 9, 2011 2:50 AM 24 77
Notes
The security officer indicated that, although the truck parking lot operates at near
capacity about four (4) nights a week, there is no significant truck parking
problem at this facility, as it never gets packed except during Christmas time.
The security officer also indicated that no illegal parking is allowed at this
facility; thus, if there are no parking spaces available, truck drivers will simply
keep moving as most drivers know that rest areas in Santa Rosa or Okaloosa
County typically have spaces available. Nevertheless, curbside parking is
occasionally observed, and less frequently, access ramp parking.
A weigh station is located only one mile before this facility east on I-10, which
could be used (or better utilized) by truck drivers for nighttime parking. Although
a common issue in Florida, this problem (i.e., the hesitation of truck drivers to use
weigh stations for nighttime parking) requires attention if the parking capacity
problem at rest areas is to be managed more effectively.
17
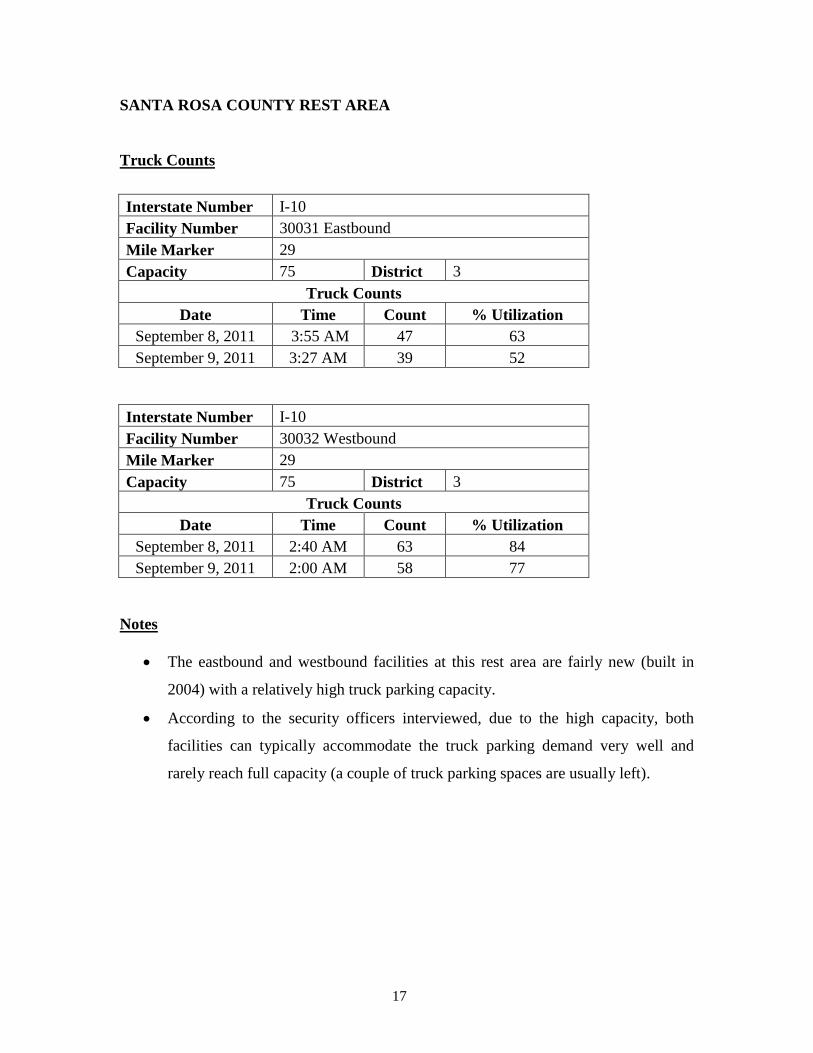
SANTA ROSA COUNTY REST AREA
Truck Counts
Interstate Number I-10
Facility Number 30031 Eastbound
Mile Marker 29
Capacity 75 District 3
Truck Counts
Date Time Count % Utilization
September 8, 2011 3:55 AM 47 63
September 9, 2011 3:27 AM 39 52
Interstate Number I-10
Facility Number 30032 Westbound
Mile Marker 29
Capacity 75 District 3
Truck Counts
Date Time Count % Utilization
September 8, 2011 2:40 AM 63 84
September 9, 2011 2:00 AM 58 77
Notes
The eastbound and westbound facilities at this rest area are fairly new (built in
2004) with a relatively high truck parking capacity.
According to the security officers interviewed, due to the high capacity, both
facilities can typically accommodate the truck parking demand very well and
rarely reach full capacity (a couple of truck parking spaces are usually left).
18
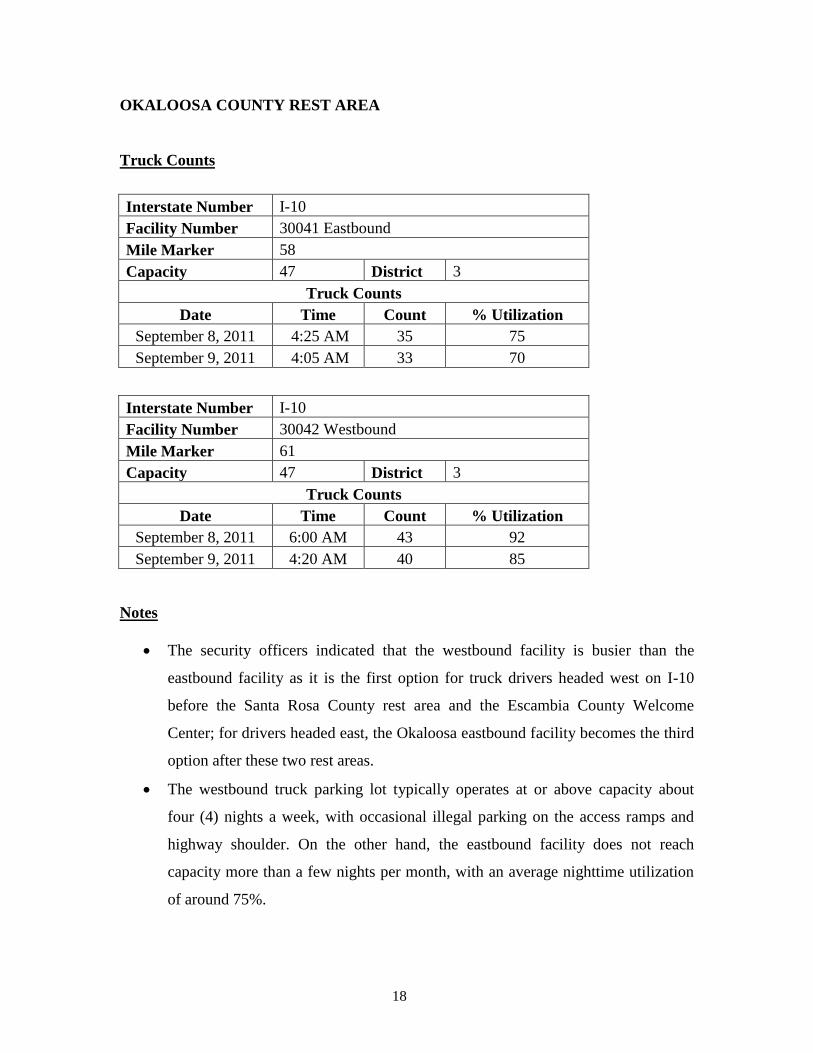
OKALOOSA COUNTY REST AREA
Truck Counts
Interstate Number I-10
Facility Number 30041 Eastbound
Mile Marker 58
Capacity 47 District 3
Truck Counts
Date Time Count % Utilization
September 8, 2011 4:25 AM 35 75
September 9, 2011 4:05 AM 33 70
Interstate Number I-10
Facility Number 30042 Westbound
Mile Marker 61
Capacity 47 District 3
Truck Counts
Date Time Count % Utilization
September 8, 2011 6:00 AM 43 92
September 9, 2011 4:20 AM 40 85
Notes
The security officers indicated that the westbound facility is busier than the
eastbound facility as it is the first option for truck drivers headed west on I-10
before the Santa Rosa County rest area and the Escambia County Welcome
Center; for drivers headed east, the Okaloosa eastbound facility becomes the third
option after these two rest areas.
The westbound truck parking lot typically operates at or above capacity about
four (4) nights a week, with occasional illegal parking on the access ramps and
highway shoulder. On the other hand, the eastbound facility does not reach
capacity more than a few nights per month, with an average nighttime utilization
of around 75%.

19
HOLMES COUNTY REST AREA
Truck Counts
Interstate Number I-10
Facility Number 30050 Eastbound/Westbound
Mile Marker 96
Capacity 12 District 3
Truck Counts
Date Time Count % Utilization
September 8, 2011 5:10 AM 14 117
September 9, 2011 4:50 AM 15 125
Notes
This rest area has a small truck parking lot with only 12 spaces available. It is also
one of the oldest rest areas on I-10. This facility experiences a high level of truck
parking capacity problem. According to the security officer interviewed, the
parking lot operates overcapacity most nights of the week.
The research team observed that various undesignated spaces within the
commercial vehicle parking lot were being used by overflow trucks. Also, a
couple of trucks were observed to enter the facility, but were forced to leave due
to the unavailability of truck parking spaces. The security officer indicated that 7
to 10 trucks on average are turned down in a typical night due to the
unavailability of parking spaces.

20
JACKSON COUNTY REST AREA
Truck Counts
Interstate Number I-10
Facility Number 30061 Eastbound
Mile Marker 133
Capacity 8 District 3
Truck Counts
Date Time Count % Utilization
September 6, 2011 2:30 AM 9 113
September 7, 2011 1:20 AM 13 163
Interstate Number I-10
Facility Number 30062 Westbound
Mile Marker 133
Capacity 11 District 3
Truck Counts
Date Time Count % Utilization
September 6, 2011 2:13 AM 11 100
September 7, 2011 1:00 AM 17 155
Notes
Both facilities have very limited space for truck parking, with eastbound and
westbound having only 8 and 11 truck parking spaces, respectively. The
westbound facility has a trailer parking lot, which is unofficially used by overflow
trucks. According to the security officers interviewed, both facilities reach
capacity at least five (5) nights a week.
The research team observed trucks parked on the entrance ramp and in various
undesignated spaces within the parking lot at the eastbound facility. The
westbound facility has truck parking stalls designed for 48-foot trailers, which
make it very difficult for truck drivers to maneuver around, especially when the
lot is at near-capacity.

21
GADSDEN COUNTY REST AREA
Truck Counts
Interstate Number I-10
Facility Number 30070 Eastbound/Westbound
Mile Marker 162
Capacity 41 District 3
Truck Counts
Date Time Count % Utilization
September 6, 2011 1:30 AM 24 59
September 7, 2011 1:57 AM 33 81
Notes
According to the security officers interviewed, although this rest area may reach
capacity one or two (1-2) times a week, it does not experience a significant truck
parking capacity problem; most nights enough parking space is available to
trucks, thus illegal parking is rarely observed.
During the two nighttime visits, the research team did not observe the facility
reaching capacity.

22
LEON COUNTY REST AREA
Truck Counts
Interstate Number I-10
Facility Number 30081 Eastbound
Mile Marker 194
Capacity 13 District 3
Truck Counts
Date Time Count % Utilization
September 6, 2011 3:47 AM 8 62
September 7, 2011 2:33 AM 10 77
Interstate Number I-10
Facility Number 30082 Westbound
Mile Marker 194
Capacity 13 District 3
Truck Counts
Date Time Count % Utilization
September 6, 2011 4:20 AM 13 100
September 7, 2011 3:18 AM 19 146
Notes
Both facilities have limited space for truck parking. These facilities also have a
small trailer parking lot with 5 parking spaces, which is used by overflow trucks.
According to the security officers interviewed, the westbound facility reaches
capacity often during weekdays, and parking on access ramps and the highway
shoulder (about 2-3 trucks) is frequently observed. This statement was also
confirmed by the observations of the research team during data collection.
On the other hand, compared to the westbound facility, the eastbound facility
experiences a lighter demand due to the two large gas stations with commercial
truck parking which are positioned before this facility and could be used by
drivers headed east. According to the security officers interviewed, while illegal
parking rarely occurs at this facility, if it happens, it will occur along the access
ramps.
23
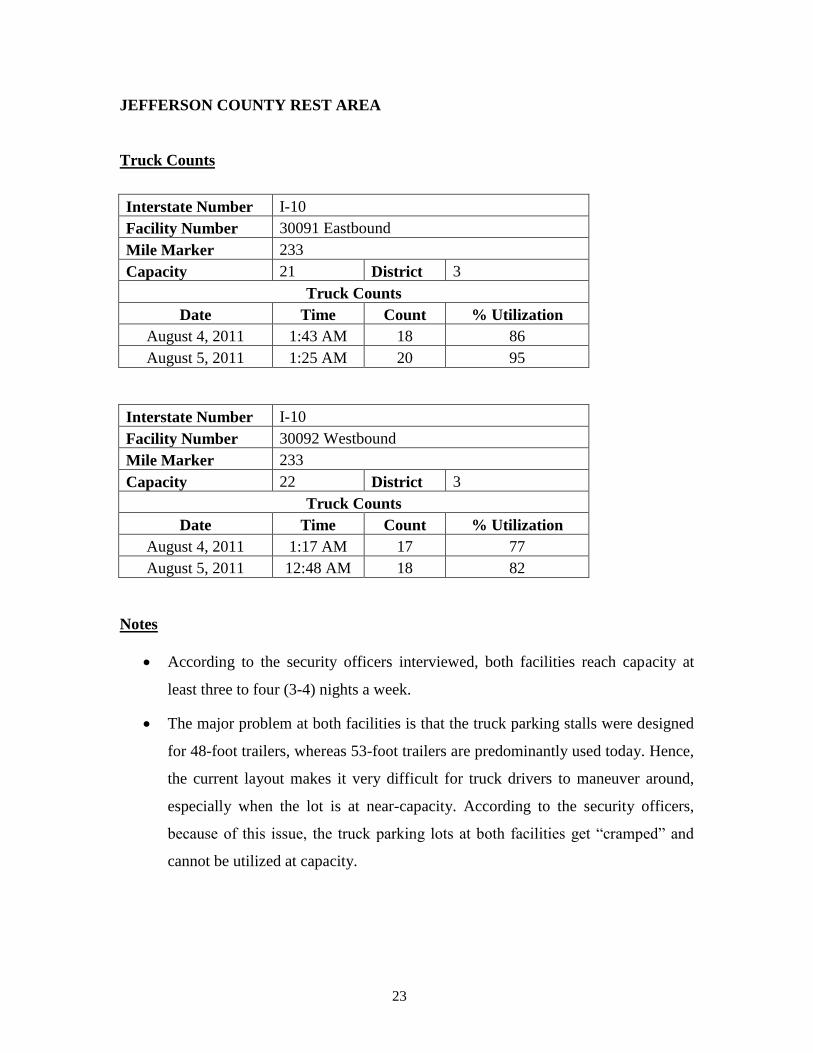
JEFFERSON COUNTY REST AREA
Truck Counts
Interstate Number I-10
Facility Number 30091 Eastbound
Mile Marker 233
Capacity 21 District 3
Truck Counts
Date Time Count % Utilization
August 4, 2011 1:43 AM 18 86
August 5, 2011 1:25 AM 20 95
Interstate Number I-10
Facility Number 30092 Westbound
Mile Marker 233
Capacity 22 District 3
Truck Counts
Date Time Count % Utilization
August 4, 2011 1:17 AM 17 77
August 5, 2011 12:48 AM 18 82
Notes
According to the security officers interviewed, both facilities reach capacity at
least three to four (3-4) nights a week.
The major problem at both facilities is that the truck parking stalls were designed
for 48-foot trailers, whereas 53-foot trailers are predominantly used today. Hence,
the current layout makes it very difficult for truck drivers to maneuver around,
especially when the lot is at near-capacity. According to the security officers,
because of this issue, the truck parking lots at both facilities get “cramped” and
cannot be utilized at capacity.

24
During the site visits, the research team observed that, due to the problem
mentioned above, some truck drivers chose to park on access ramps at both
facilities, although the truck parking lot was not at full capacity.
25
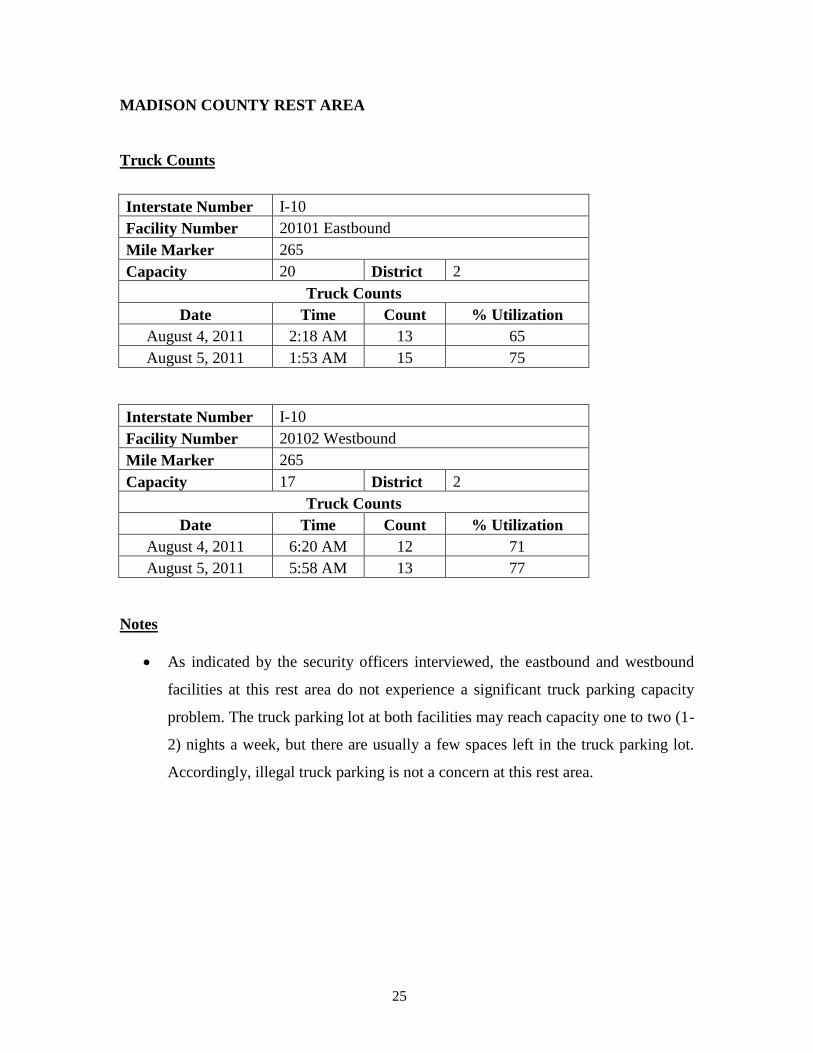
MADISON COUNTY REST AREA
Truck Counts
Interstate Number I-10
Facility Number 20101 Eastbound
Mile Marker 265
Capacity 20 District 2
Truck Counts
Date Time Count % Utilization
August 4, 2011 2:18 AM 13 65
August 5, 2011 1:53 AM 15 75
Interstate Number I-10
Facility Number 20102 Westbound
Mile Marker 265
Capacity 17 District 2
Truck Counts
Date Time Count % Utilization
August 4, 2011 6:20 AM 12 71
August 5, 2011 5:58 AM 13 77
Notes
As indicated by the security officers interviewed, the eastbound and westbound
facilities at this rest area do not experience a significant truck parking capacity
problem. The truck parking lot at both facilities may reach capacity one to two (1-
2) nights a week, but there are usually a few spaces left in the truck parking lot.
Accordingly, illegal truck parking is not a concern at this rest area.

26
SUWANNEE/COLUMBIA COUNTY REST AREA
Truck Counts
Interstate Number I-10
Facility Number 20111 Eastbound
Mile Marker 294
Capacity 14 District 2
Truck Counts
Date Time Count % Utilization
August 4, 2011 2:47 AM 12 86
August 5, 2011 2:27 AM 16 114
Interstate Number I-10
Facility Number 20112 Westbound
Mile Marker 295
Capacity 14 District 2
Truck Counts
Date Time Count % Utilization
August 4, 2011 4:53 AM 18 129
August 5, 2011 4:37 AM 15 107
Notes
The security officers interviewed indicated that both facilities at this rest area
operate at or above capacity almost every weeknight. The research team has
observed illegal parking on access ramps and highway shoulders at both facilities.
27
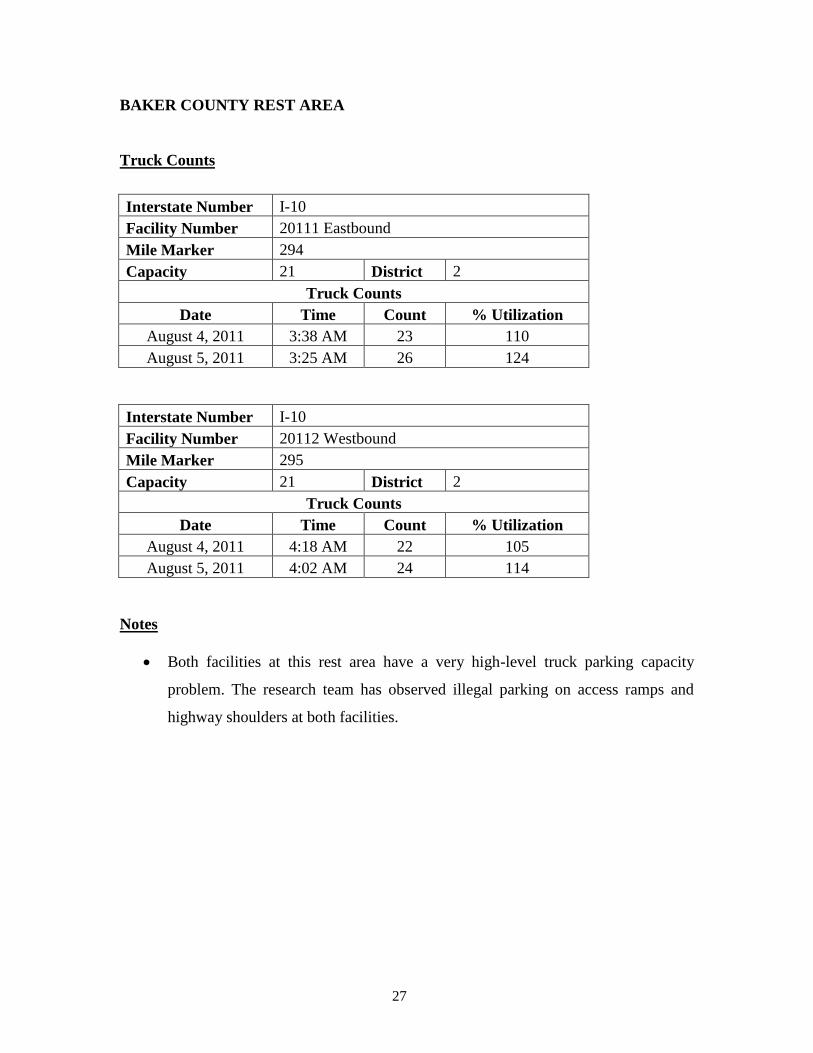
BAKER COUNTY REST AREA
Truck Counts
Interstate Number I-10
Facility Number 20111 Eastbound
Mile Marker 294
Capacity 21 District 2
Truck Counts
Date Time Count % Utilization
August 4, 2011 3:38 AM 23 110
August 5, 2011 3:25 AM 26 124
Interstate Number I-10
Facility Number 20112 Westbound
Mile Marker 295
Capacity 21 District 2
Truck Counts
Date Time Count % Utilization
August 4, 2011 4:18 AM 22 105
August 5, 2011 4:02 AM 24 114
Notes
Both facilities at this rest area have a very high-level truck parking capacity
problem. The research team has observed illegal parking on access ramps and
highway shoulders at both facilities.

28
3.6 I-10 Corridor Truck Parking Problem Map
Figure 5: I-10 corridor truck parking problem map
29
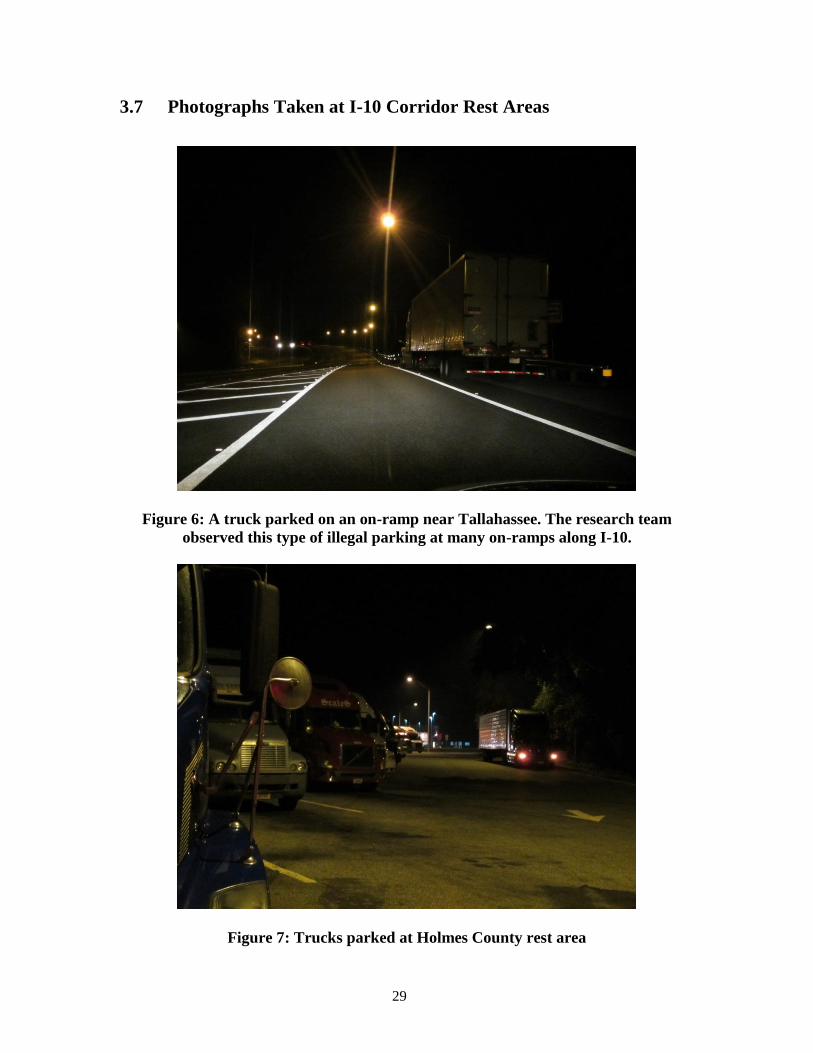
3.7 Photographs Taken at I-10 Corridor Rest Areas
Figure 6: A truck parked on an on-ramp near Tallahassee. The research team
observed this type of illegal parking at many on-ramps along I-10.
Figure 7: Trucks parked at Holmes County rest area

30
Figure 8: Two overflow trucks parked near the exit at Holmes County rest area
Figure 9: The cramped design of the parking lot at Jackson West makes it difficult
for trucks to get in and out during nighttime

31
Figure 10: Illegal parking at Baker East
Figure 11: Illegal parking at Baker West

32
Figure 12: Ruined pavement due to truck parking at Suwannee-Columbia East

33
Figure 13: Trucks parked on the access ramp at Madison East
Figure 14: Illegal parking at Madison West
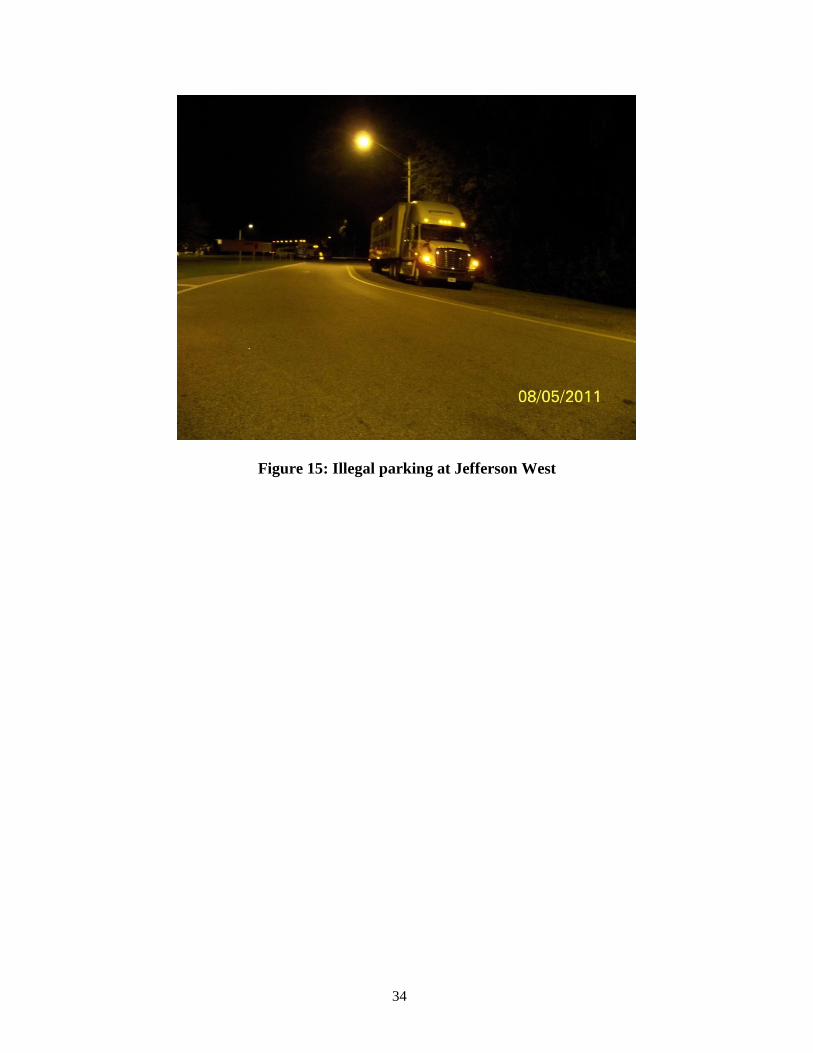
34
Figure 15: Illegal parking at Jefferson West

35
3.8 I-75 Corridor Rest Area Reports
HAMILTON COUNTY WELCOME CENTER
Truck Counts
Interstate Number I-75
Facility Number 20140
Mile Marker 470
Capacity 38 District 2
Truck Counts
Date Time Count % Utilization
August 4, 2011 5:32 AM 39 103
August 5, 2011 5:10 AM 42 111
Notes
The security officer indicated that the truck parking lot at this facility operates at
or above capacity almost every weeknight.
The research team did not observe any illegal parking on access ramps or the
highway shoulder. The overflow trucks were parked in various undesignated
spaces within the commercial vehicle parking lot.
36
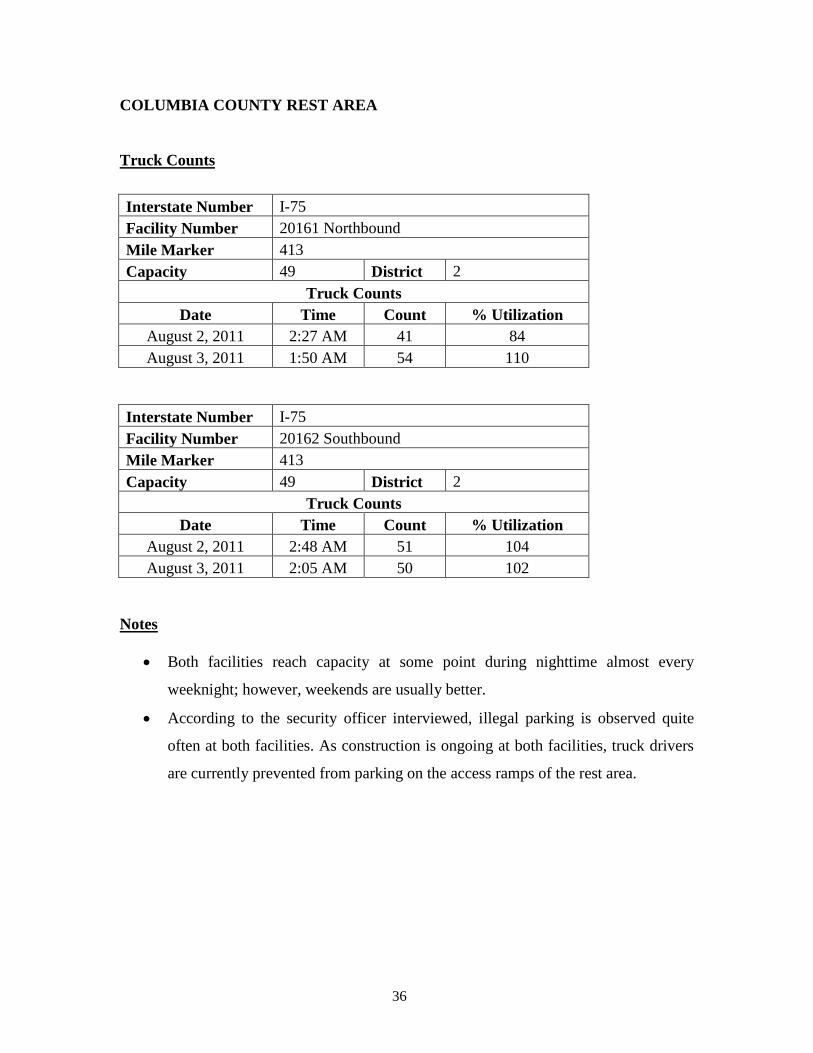
COLUMBIA COUNTY REST AREA
Truck Counts
Interstate Number I-75
Facility Number 20161 Northbound
Mile Marker 413
Capacity 49 District 2
Truck Counts
Date Time Count % Utilization
August 2, 2011 2:27 AM 41 84
August 3, 2011 1:50 AM 54 110
Interstate Number I-75
Facility Number 20162 Southbound
Mile Marker 413
Capacity 49 District 2
Truck Counts
Date Time Count % Utilization
August 2, 2011 2:48 AM 51 104
August 3, 2011 2:05 AM 50 102
Notes
Both facilities reach capacity at some point during nighttime almost every
weeknight; however, weekends are usually better.
According to the security officer interviewed, illegal parking is observed quite
often at both facilities. As construction is ongoing at both facilities, truck drivers
are currently prevented from parking on the access ramps of the rest area.

37
ALACHUA COUNTY REST AREA
Truck Counts
Interstate Number I-75
Facility Number 20171 Northbound
Mile Marker 383
Capacity 7 District 2
Truck Counts
Date Time Count % Utilization
August 2, 2011 1:50 AM 10 143
August 3, 2011 1:20 AM 8 114
Interstate Number I-75
Facility Number 20172 Southbound
Mile Marker 382
Capacity 13 District 2
Truck Counts
Date Time Count % Utilization
August 2, 2011 3:30 AM 16 123
August 3, 2011 2:37 AM 14 108
Notes
Both facilities have very limited space for truck parking, with northbound and
southbound having only 7 and 13 truck parking spaces, respectively.
During the site visits, many trucks were observed that entered the facility but had
to leave due to the unavailability of truck parking space. According to the security
officer interviewed, illegal parking on access ramps is often observed at both
facilities.

38
MARION COUNTY REST AREA
Truck Counts
Interstate Number I-75
Facility Number 50181 Northbound
Mile Marker 345
Capacity 47 Districts 5
Truck Counts
Date Time Count % Utilization
August 2, 2011 6:00 AM 28 60
August 3, 2011 12:40 AM 21 45
Interstate Number I-75
Facility Number 50182 Southbound
Mile Marker 346
Capacity 45 Districts 5
Truck Counts
Date Time Count % Utilization
August 2, 2011 4:00 AM 46 102
August 2, 2011 10:25 PM 22 49
Notes
Both facilities have a trailer parking lot to accommodate excess truck parking
demand. These lots can hold from 20 to 25 trucks.
The regular truck parking lot in the southbound facility reaches capacity during
weeknights, whereas the northbound reaches capacity only one or two (1-2) nights
a week.
The security officers in both facilities indicated that they rarely, maybe two or
three nights per month, see both the regular truck and trailer lot full. Due to the
extra capacity from the trailer lot, illegal parking is less likely to occur at these
facilities.

39
SUMTER COUNTY REST AREA
Truck Counts
Interstate Number I-75
Facility Number 50191 Northbound
Mile Marker 307 Northbound
Capacity 44 District 5
Truck Counts
Date Time Count % Utilization
August 2, 2011 5:05 AM 44 100
August 3, 2011 12:10 AM 40 91
Interstate Number I-75
Facility Number 50192 Southbound
Mile Marker 308 Southbound
Capacity 34 District 5
Truck Counts
Date Time Count % Utilization
August 2, 2011 4:45 AM 37 109
August 2, 2011 11:30 PM 30 88
Notes
The southbound facility has a trailer parking lot which is used to accommodate
excess truck parking demand. This lot is smaller than the trailer parking lots at the
Marion County facilities, holding from 10 to 12 trucks. The northbound facility,
however, does not have a trailer parking lot.
According to the security officers interviewed, both facilities get packed between
1:00 and 4:00 AM at least three to four (3-4) nights a week, including the trailer
parking lot in the southbound facility.
The security officers indicated that the current closure of the Pasco County rest
area placed extra demand on these facilities. They expect the demand to go down
once the Pasco County rest area reopens.

40
HILLSBOROUGH COUNTY REST AREA
Truck Counts
Interstate Number I-75
Facility Number 70251 Northbound
Mile Marker 238
Capacity 18 District 7
Truck Counts
Date Time Count % Utilization
May 17, 2011 11:30 PM 29 161
May 18, 2011 2:00 AM 43 239
May 19, 2011 4:00 AM 34 189
May 20, 2011 1:00 AM 30 167
Interstate Number I-75
Facility Number 70252 Southbound
Mile Marker 238
Capacity 43 District 7
Truck Counts
Date Time Count % Utilization
May 18, 2011 4:00 AM 30 70
May 19, 2011 6:00 AM 27 63
May 20, 2011 2:00 AM 28 65
Notes
According to the security officers interviewed, the northbound facility is packed
almost every weeknight between 10:00 PM and 6:00 AM, whereas the
southbound facility gets busy mostly on Sunday and Monday nights. The
northbound facility also has a trailer parking lot that can accommodate about 15
trucks. The southbound facility is newer than the northbound facility and can
accommodate more trucks in the regular truck parking lot.
The research team observed a high amount of parking activity on access ramps in
the northbound facility.
The security officers indicated that when the Pasco County rest area was open,
there was less demand for the Hillsborough County rest area.

41
PINELLAS COUNTY REST AREA
Truck Counts
Interstate Number I-275
Facility Number 70360
Mile Marker 13
Capacity 20 District 7
Truck Counts
Date Time Count % Utilization
May 19, 2011 2:00 AM 4 20
May 20, 2011 4:00 AM 6 30
May 21, 2011 12:30 AM 3 15
Notes
This rest area is located at the north end of the Skyway bridge. Its truck parking
capacity is on the low side with 20 truck parking spaces available. This rest area
mainly serves passenger cars and experiences low truck traffic.
The security officer who has experience with the Pinellas County, Hillsborough
County, and Pasco County rest areas indicated that the Pinellas County rest area
has no problem with truck parking (due to low demand) whereas the Hillsborough
County and Pasco County (currently closed) rest areas have a severe capacity
problem.

42
MANATEE COUNTY REST AREA
Truck Counts
Interstate Number I-275
Facility Number 10370
Mile Marker 7
Capacity 16 District 1
Truck Counts
Date Time Count % Utilization
May 18, 2011 11:45 PM 7 44
May 19, 2011 8:00 AM 4 25
May 20, 2011 12:30 AM 6 38
Notes
This rest area is located at the south end of the Skyway bridge. Its truck parking
capacity is on the low side with 16 truck parking spaces available. As is also the
case with the Pinellas County rest area (north end of the Skyway bridge), this rest
area mainly serves passenger cars and experiences low truck traffic.
The security officer indicated that she saw the truck parking lot crowded only on
national holidays.

43
CHARLOTTE COUNTY REST AREA
Truck Counts
Interstate Number I-75
Facility Number 10270
Mile Marker 161
Capacity 26 District 1
Truck Counts
Date Time Count % Utilization
May 1, 2011 11:36 PM 5 19
May 3, 2011 1:30 AM 16 62
May 4, 2011 1:45 AM 13 50
Notes
This rest area has a variety of nearby alternatives for truck drivers to use,
including a gas station with a large parking lot, the parking lot of a big retailer,
and a weigh plaza three miles south of the rest area. Given the extra capacity
added by these alternatives, this rest area does not experience a significant
parking capacity problem.
An important point indicated by the security officers and FDOT personnel
interviewed was the hesitation of truck drivers to use the weigh plaza which is
only three miles south of the rest area. While a common issue in Florida, this
problem requires attention if the capacity demands at rest areas are to be managed
effectively.

44
LEE COUNTY REST AREA
Truck Counts
Interstate Number I-75
Facility Number 10280
Mile Marker 131
Capacity 50 District 1
Truck Counts
Date Time Count % Utilization
May 1, 2011 10:10 PM 13 26
May 3, 2011 12:50 AM 15 30
May 4, 2011 1:00 AM 12 24
Notes
This rest area’s truck parking capacity is on the high side with 50 truck parking
spaces available. As indicated by the security officer and truck drivers
interviewed, this rest area does not experience a severe truck parking capacity
problem, although it occasionally fills up depending on the produce season.
A truck driver who uses this rest area twice every week regularly for overnight
stay said that he typically finds the truck parking lot full only two (2) out of eight
(8) times every month.
45
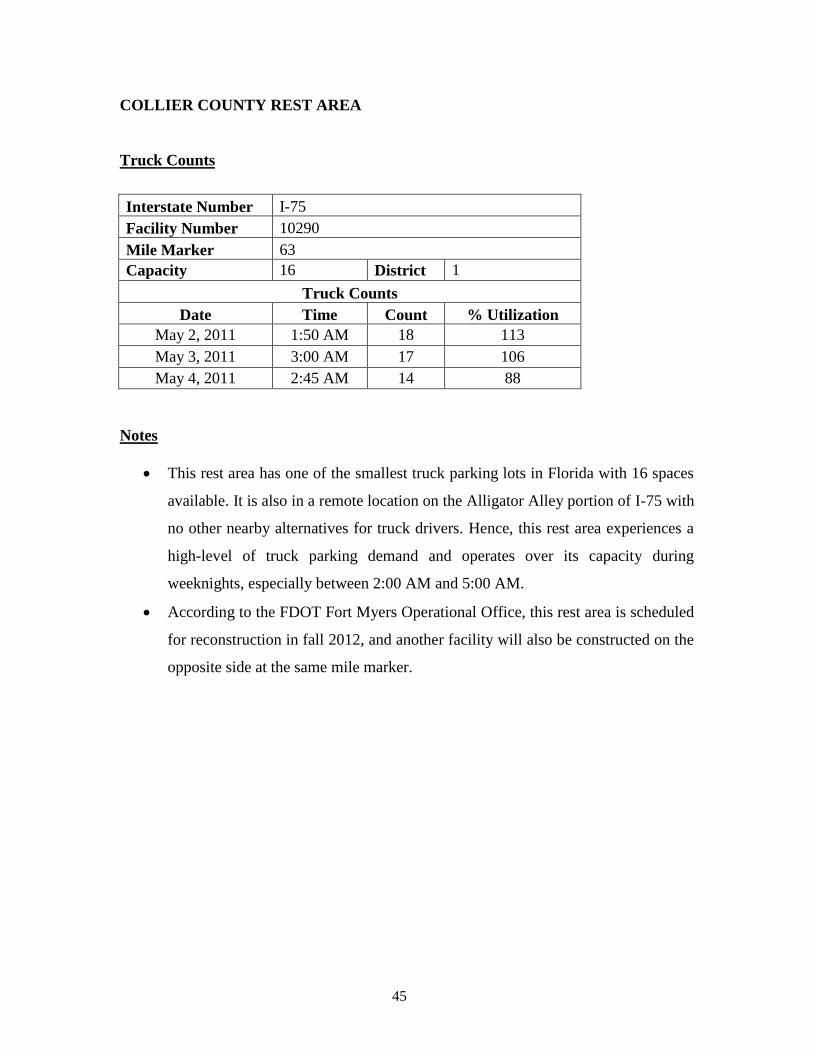
COLLIER COUNTY REST AREA
Truck Counts
Interstate Number I-75
Facility Number 10290
Mile Marker 63
Capacity 16 District 1
Truck Counts
Date Time Count % Utilization
May 2, 2011 1:50 AM 18 113
May 3, 2011 3:00 AM 17 106
May 4, 2011 2:45 AM 14 88
Notes
This rest area has one of the smallest truck parking lots in Florida with 16 spaces
available. It is also in a remote location on the Alligator Alley portion of I-75 with
no other nearby alternatives for truck drivers. Hence, this rest area experiences a
high-level of truck parking demand and operates over its capacity during
weeknights, especially between 2:00 AM and 5:00 AM.
According to the FDOT Fort Myers Operational Office, this rest area is scheduled
for reconstruction in fall 2012, and another facility will also be constructed on the
opposite side at the same mile marker.
46
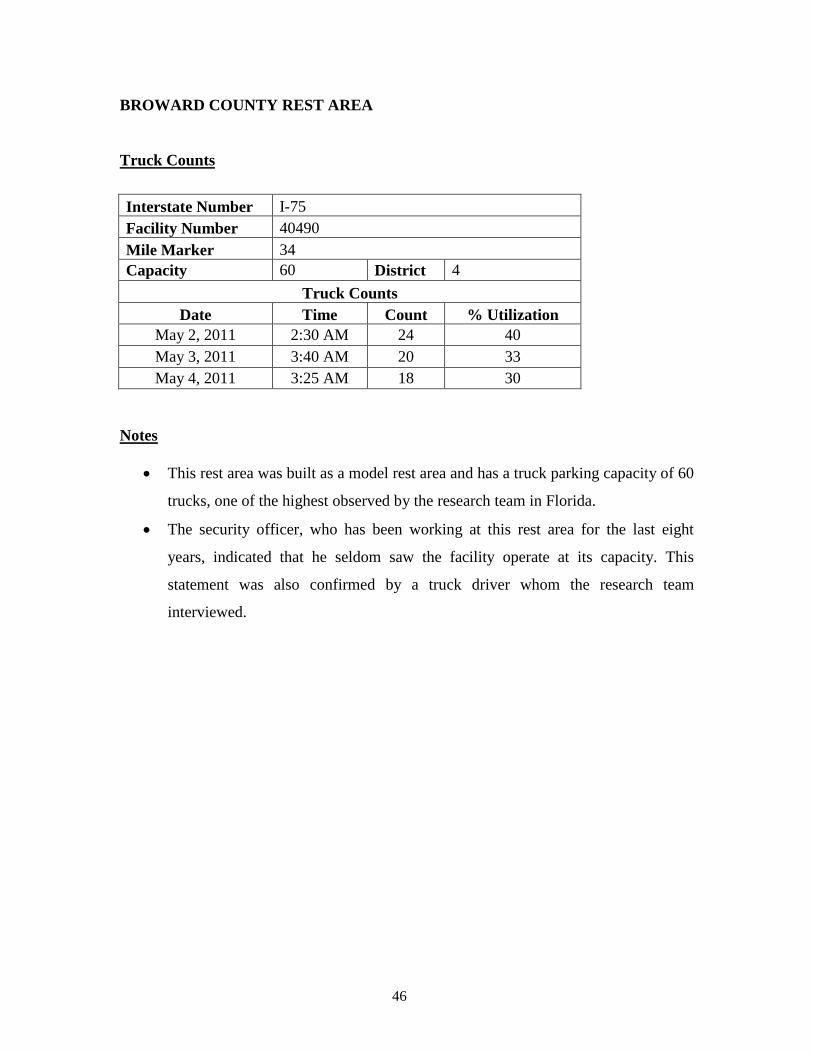
BROWARD COUNTY REST AREA
Truck Counts
Interstate Number I-75
Facility Number 40490
Mile Marker 34
Capacity 60 District 4
Truck Counts
Date Time Count % Utilization
May 2, 2011 2:30 AM 24 40
May 3, 2011 3:40 AM 20 33
May 4, 2011 3:25 AM 18 30
Notes
This rest area was built as a model rest area and has a truck parking capacity of 60
trucks, one of the highest observed by the research team in Florida.
The security officer, who has been working at this rest area for the last eight
years, indicated that he seldom saw the facility operate at its capacity. This
statement was also confirmed by a truck driver whom the research team
interviewed.
47
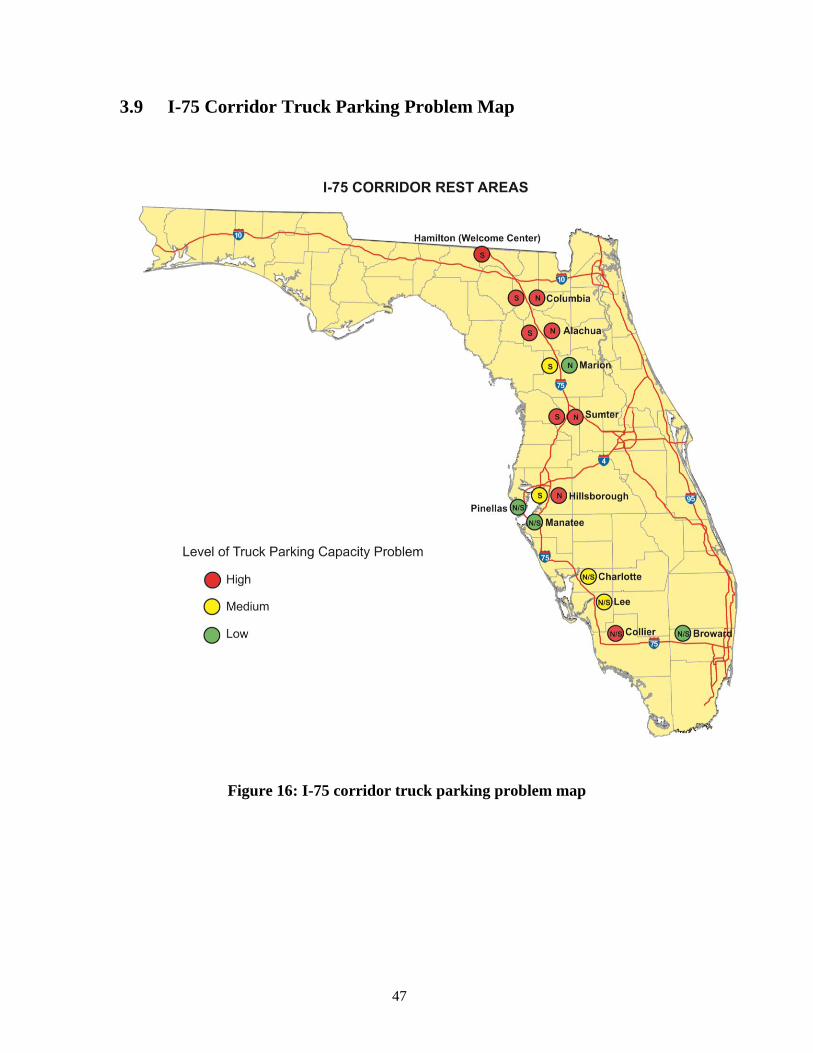
3.9 I-75 Corridor Truck Parking Problem Map
Figure 16: I-75 corridor truck parking problem map
48
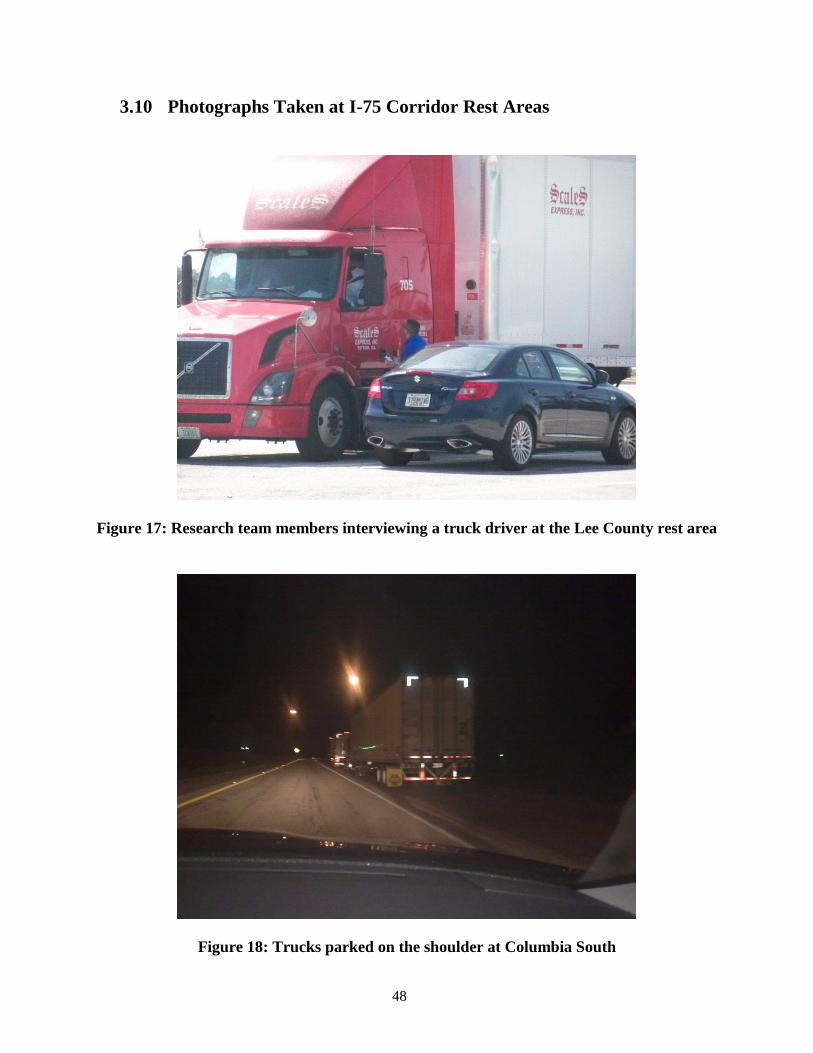
3.10 Photographs Taken at I-75 Corridor Rest Areas
Figure 17: Research team members interviewing a truck driver at the Lee County rest area
Figure 18: Trucks parked on the shoulder at Columbia South
49
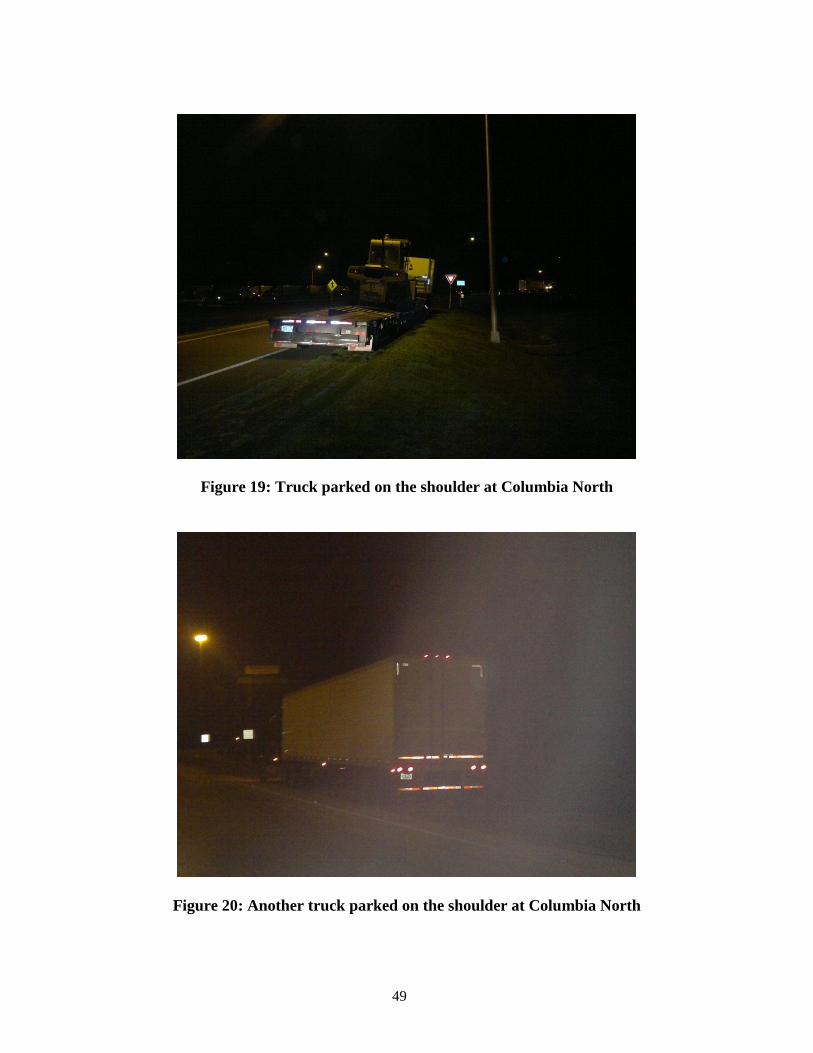
Figure 19: Truck parked on the shoulder at Columbia North
Figure 20: Another truck parked on the shoulder at Columbia North

50
Figure 21: The truck parking lot of Alachua North during daytime

51
3.11 I-95 Corridor Rest Area Reports
NASSAU COUNTY WELCOME CENTER
Truck Counts
Interstate Number I-95
Facility Number 20310
Mile Marker 378
Capacity 36 District 2
Truck Counts
Date Time Count % Utilization
June 16, 2011 1:15 AM 36 100
June 17, 2011 1:05 AM 29 81
Notes
The security officer indicated that the truck parking lot reaches capacity almost
every weeknight. He also indicated that many truck drivers related that they did
not know about the availability of truck parking at the Welcome Center.
The facility usually gets very busy at nighttime, but the research team did not
observe any illegal parking outside of the truck parking lot. If the lot is full, the
trucks simply leave. The access ramps do not have enough room for shoulder
parking.
52
ST. JOHNS COUNTY REST AREA (Mile Marker 331)
Truck Counts
Interstate Number I-95
Facility Number 20611 Northbound
Mile Marker 331
Capacity 73 District 2
Truck Counts
Date Time Count % Utilization
June 16, 2011 4:00 AM 45 62
June 17, 2011 2:00 AM 33 45
Interstate Number I-95
Facility Number 20612 Southbound
Mile Marker 331
Capacity 67 District 2
Truck Counts
Date Time Count % Utilization
June 16, 2011 2:45 AM 50 75
June 17, 2011 2:15 AM 51 76
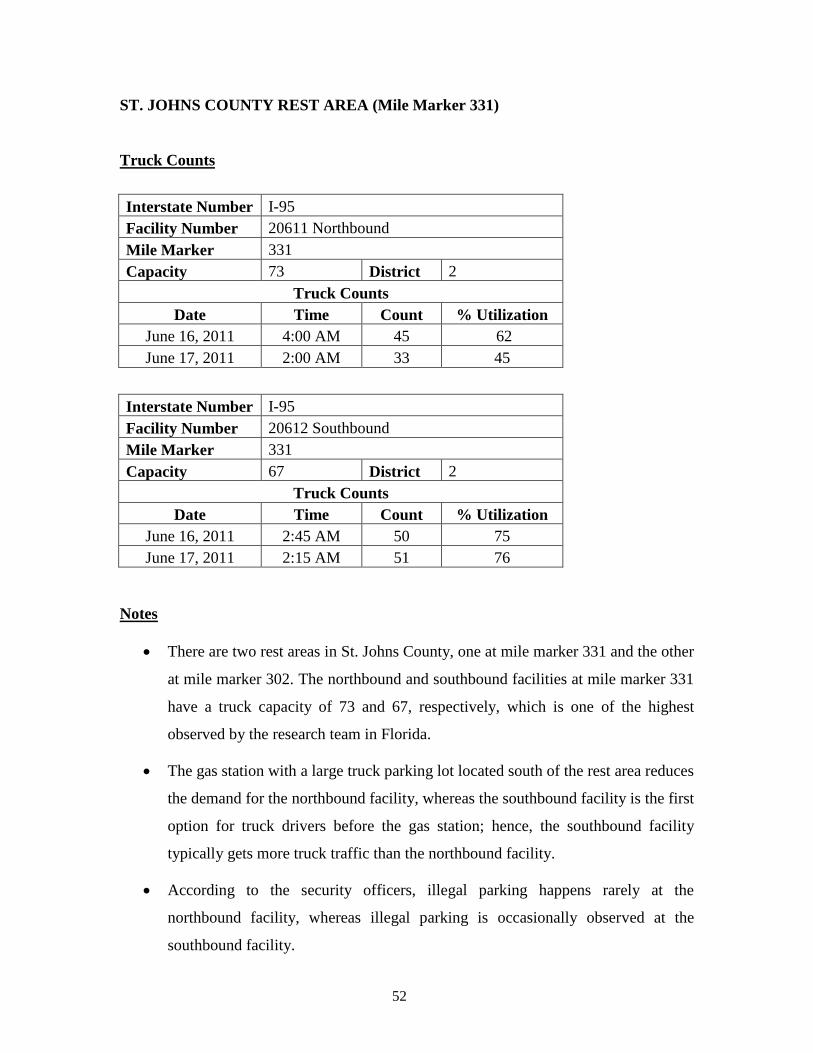
Notes
There are two rest areas in St. Johns County, one at mile marker 331 and the other
at mile marker 302. The northbound and southbound facilities at mile marker 331
have a truck capacity of 73 and 67, respectively, which is one of the highest
observed by the research team in Florida.
The gas station with a large truck parking lot located south of the rest area reduces
the demand for the northbound facility, whereas the southbound facility is the first
option for truck drivers before the gas station; hence, the southbound facility
typically gets more truck traffic than the northbound facility.
According to the security officers, illegal parking happens rarely at the
northbound facility, whereas illegal parking is occasionally observed at the
southbound facility.
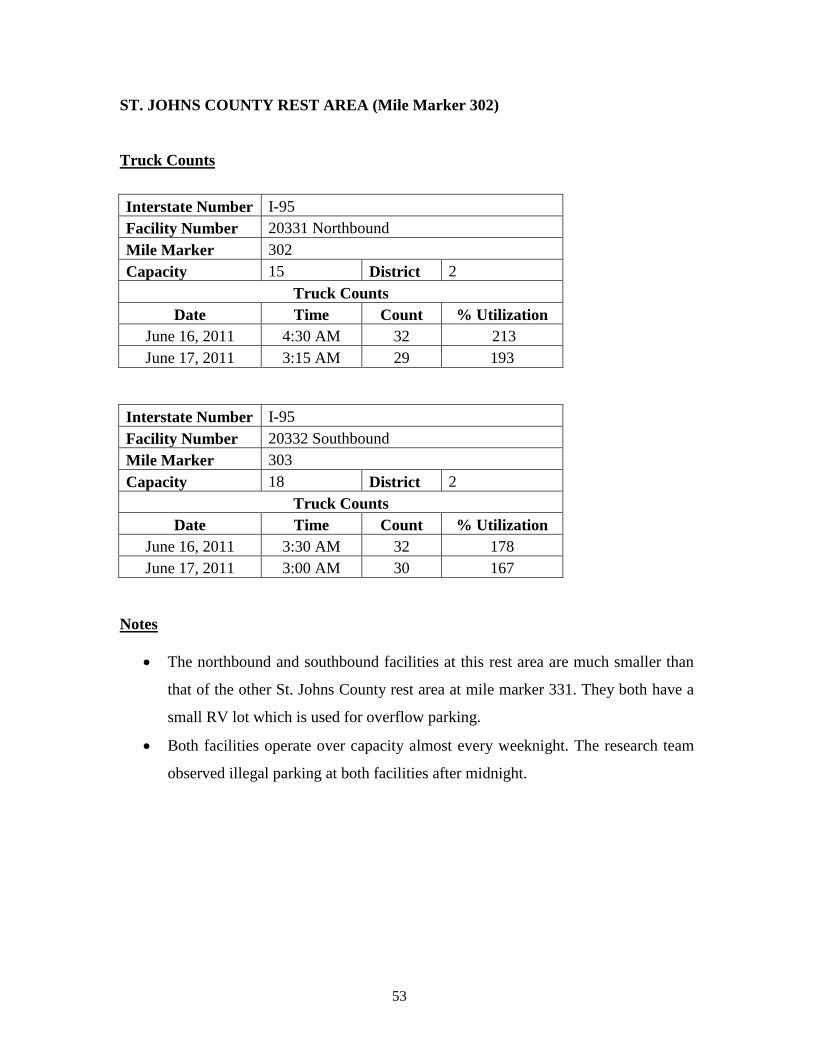
53
ST. JOHNS COUNTY REST AREA (Mile Marker 302)
Truck Counts
Interstate Number I-95
Facility Number 20331 Northbound
Mile Marker 302
Capacity 15 District 2
Truck Counts
Date Time Count % Utilization
June 16, 2011 4:30 AM 32 213
June 17, 2011 3:15 AM 29 193
Interstate Number I-95
Facility Number 20332 Southbound
Mile Marker 303
Capacity 18 District 2
Truck Counts
Date Time Count % Utilization
June 16, 2011 3:30 AM 32 178
June 17, 2011 3:00 AM 30 167
Notes
The northbound and southbound facilities at this rest area are much smaller than
that of the other St. Johns County rest area at mile marker 331. They both have a
small RV lot which is used for overflow parking.
Both facilities operate over capacity almost every weeknight. The research team
observed illegal parking at both facilities after midnight.

54
BREVARD COUNTY REST AREA (Mile Marker 227)
Truck Counts
Interstate Number I-95
Facility Number 50341 Northbound
Mile Marker 225
Capacity 26 District 5
Truck Counts
Date Time Count % Utilization
May 12, 2011 3:00 AM 46 177
May 12, 2011 5:00 AM 41 158
May 13, 2011 3:15 AM 29 193
May 14, 2011 1:30 AM 30 115
Interstate Number I-95
Facility Number 50342 Southbound
Mile Marker 227
Capacity 22 District 5
Truck Counts
Date Time Count % Utilization
May 12, 2011 12:00 AM 50 227
May 12, 2011 4:00 AM 56 255
May 13, 2011 12:00 AM 47 214
May 13, 2011 6:00 AM 46 209
Notes
There are two rest areas in Brevard County, one at mile marker 227 and the other
at mile marker 169. The northbound facility of this particular rest area is typically
busy, whereas the southbound facility is extremely busy. Both facilities have a
picnic area used for truck parking, adding an additional capacity of 10 to 15
trucks.
Both facilities in this rest area have a severe capacity problem regarding nighttime
truck parking. The research team has observed illegal parking on access ramps
and highway shoulders at both facilities.
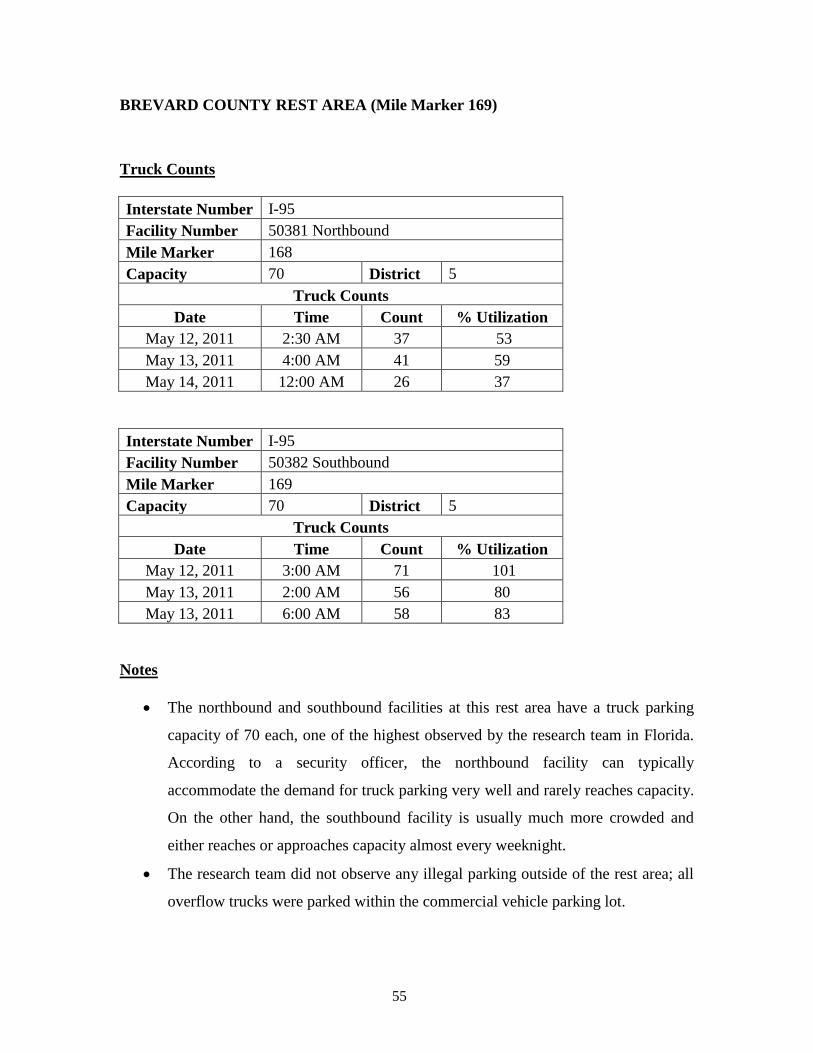
55
BREVARD COUNTY REST AREA (Mile Marker 169)
Truck Counts
Interstate Number I-95
Facility Number 50381 Northbound
Mile Marker 168
Capacity 70 District 5
Truck Counts
Date Time Count % Utilization
May 12, 2011 2:30 AM 37 53
May 13, 2011 4:00 AM 41 59
May 14, 2011 12:00 AM 26 37
Interstate Number I-95
Facility Number 50382 Southbound
Mile Marker 169
Capacity 70 District 5
Truck Counts
Date Time Count % Utilization
May 12, 2011 3:00 AM 71 101
May 13, 2011 2:00 AM 56 80
May 13, 2011 6:00 AM 58 83
Notes
The northbound and southbound facilities at this rest area have a truck parking
capacity of 70 each, one of the highest observed by the research team in Florida.
According to a security officer, the northbound facility can typically
accommodate the demand for truck parking very well and rarely reaches capacity.
On the other hand, the southbound facility is usually much more crowded and
either reaches or approaches capacity almost every weeknight.
The research team did not observe any illegal parking outside of the rest area; all
overflow trucks were parked within the commercial vehicle parking lot.
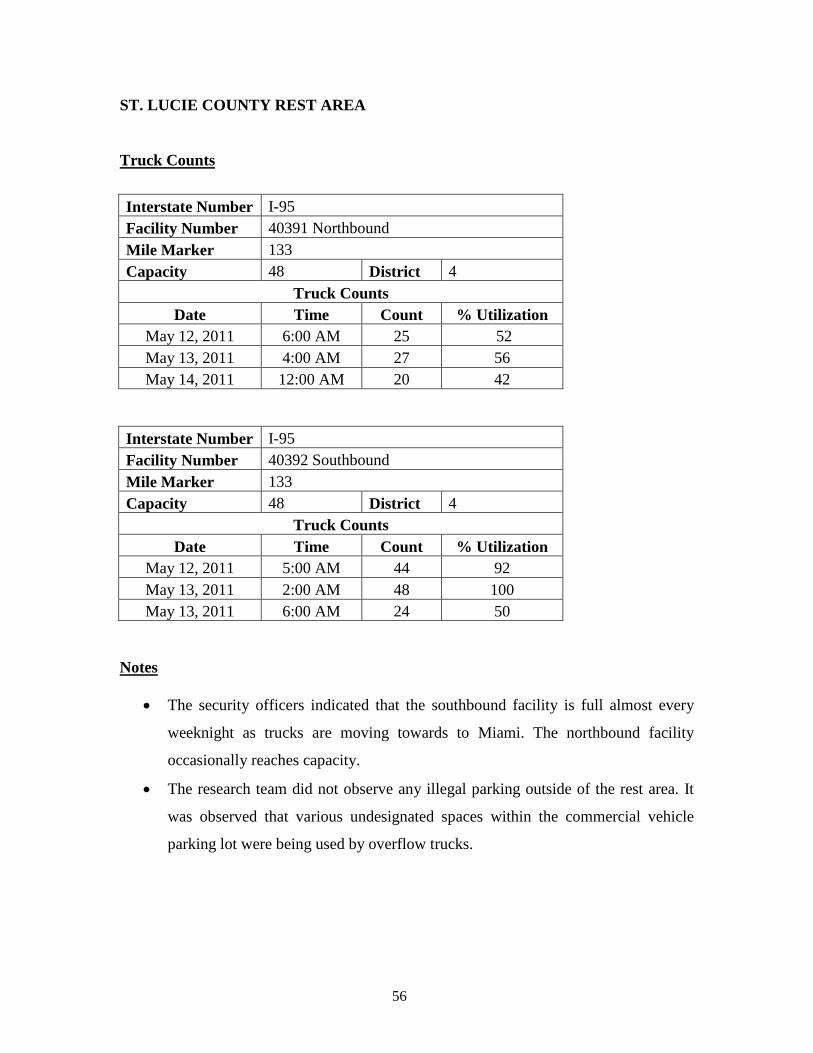
56
ST. LUCIE COUNTY REST AREA
Truck Counts
Interstate Number I-95
Facility Number 40391 Northbound
Mile Marker 133
Capacity 48 District 4
Truck Counts
Date Time Count % Utilization
May 12, 2011 6:00 AM 25 52
May 13, 2011 4:00 AM 27 56
May 14, 2011 12:00 AM 20 42
Interstate Number I-95
Facility Number 40392 Southbound
Mile Marker 133
Capacity 48 District 4
Truck Counts
Date Time Count % Utilization
May 12, 2011 5:00 AM 44 92
May 13, 2011 2:00 AM 48 100
May 13, 2011 6:00 AM 24 50
Notes
The security officers indicated that the southbound facility is full almost every
weeknight as trucks are moving towards to Miami. The northbound facility
occasionally reaches capacity.
The research team did not observe any illegal parking outside of the rest area. It
was observed that various undesignated spaces within the commercial vehicle
parking lot were being used by overflow trucks.

57
MARTIN COUNTY REST AREA
Truck Counts
Interstate Number I-95
Facility Number 40401 Northbound
Mile Marker 106
Capacity 55 District 4
Truck Counts
Date Time Count % Utilization
May 12, 2011 3:00 AM 43 78
May 13, 2011 1:00 AM 37 67
May 13, 2011 11:00 PM 20 42
Interstate Number I-95
Facility Number 40392 Southbound
Mile Marker 133
Capacity 55 District 4
Truck Counts
Date Time Count % Utilization
May 12, 2011 12:00 AM 67 122
May 13, 2011 3:00 AM 55 100
May 13, 2011 6:00 AM 35 64
Notes
The parking trends observed in this rest area were very similar to those observed
in St. Lucie County. The security officers indicated that the southbound facility is
usually more crowded than the northbound facility because it is the last stop for
truck drivers on I-95 before Miami. The southbound facility operates over
capacity almost every weeknight during nighttime, whereas the northbound
facility reaches capacity one to two (1-2) nights a week on average.
The research team did not observe any illegal parking outside of the rest area. It
was observed that various undesignated spaces within the commercial vehicle
parking lot were being used by overflow trucks.

58
3.12 I-95 Corridor Truck Parking Problem Map
Figure 22: I-95 corridor truck parking problem map
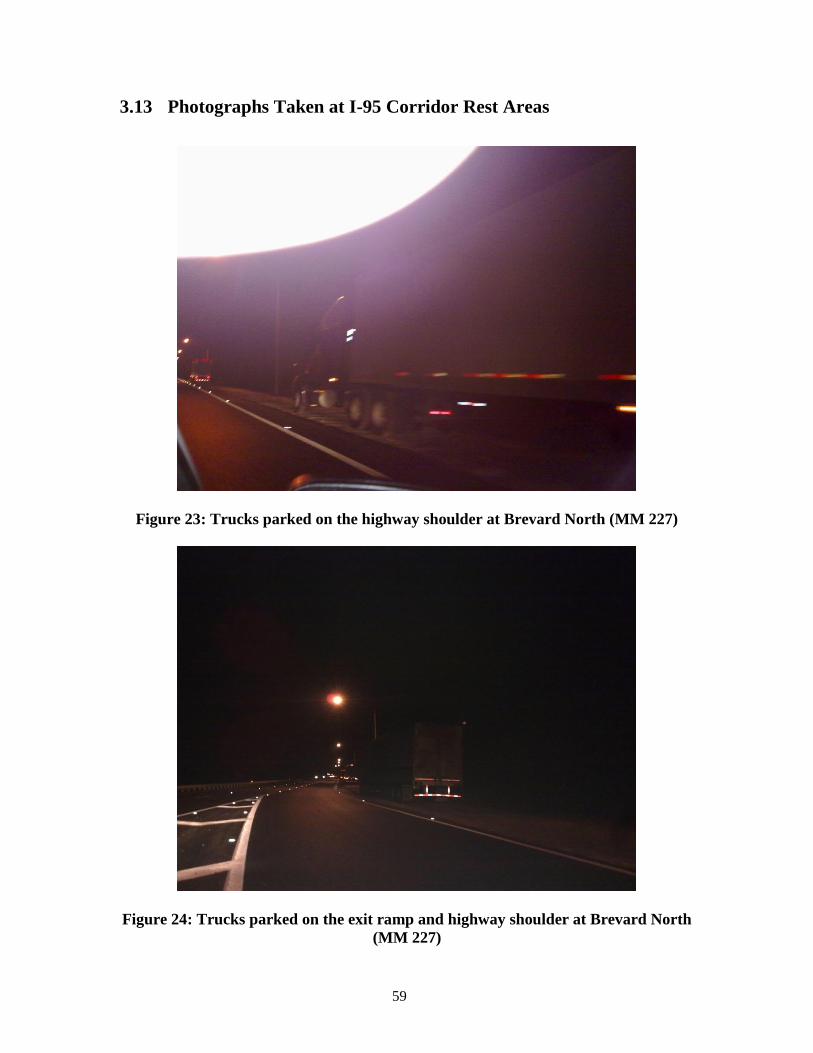
59
3.13 Photographs Taken at I-95 Corridor Rest Areas
Figure 23: Trucks parked on the highway shoulder at Brevard North (MM 227)
Figure 24: Trucks parked on the exit ramp and highway shoulder at Brevard North
(MM 227)
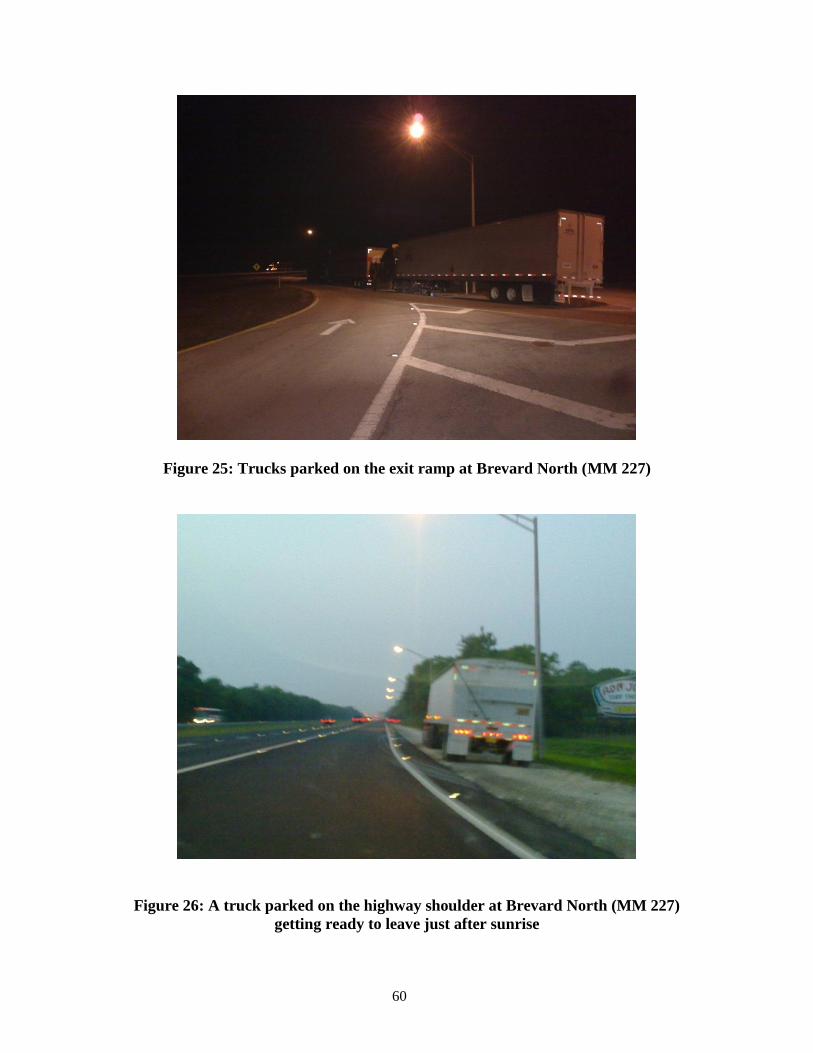
60
Figure 25: Trucks parked on the exit ramp at Brevard North (MM 227)
Figure 26: A truck parked on the highway shoulder at Brevard North (MM 227)
getting ready to leave just after sunrise
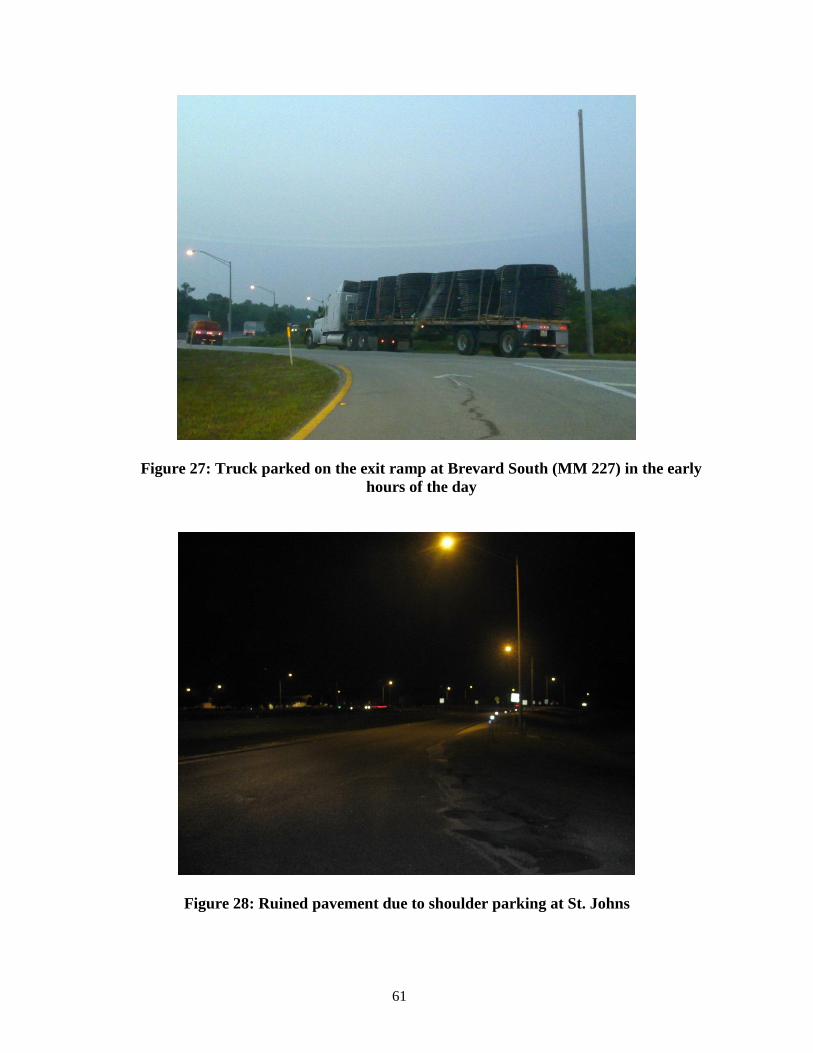
61
Figure 27: Truck parked on the exit ramp at Brevard South (MM 227) in the early
hours of the day
Figure 28: Ruined pavement due to shoulder parking at St. Johns

62
Figure 29: Trucks parked on the highway shoulder at St Johns (MM 302)

63
4. PHASE-2: IMPLEMENTING A SMART PARKING
MANAGEMENT SYSTEM FOR COMMERCIAL TRUCKS
4.1 Introduction
Phase-2 of this research project included an assessment of technology that can be used to
improve truck parking management at rest areas in Florida and deploy a pilot project to
test implementation. The overriding thesis for this research was that providing better
information to truck drivers about parking availability can reduce the number of trucks
parking on shoulders, crashes due to driver fatigue, and unnecessary diesel emissions.
The smart parking management system for commercial motor vehicles presented in this
report is based on the following tenets (Smith et al., 2005):
1. The system must accurately and reliably “know” whether a parking area is full,
and if it is not full, the number of spaces remaining (Smith et al., 2005).
2. The system must include the capability to archive data, so that historical
information on parking occupancy can be assembled and monitored (Smith et al.,
2005).
3. The system must forecast space availability for approaching drivers at a micro-
level by combining the real-time parking space occupancy information with the
historical parking trend information. Smith et al. (2005) indicates: “Even a
perfectly accurate parking occupancy detection system will only indicate the
number of spaces available at a particular point in time. What the driver needs,
however, is an indication of whether spaces will be available at the time he or she
arrives at the rest area.” Moreover, in cases where information is being broadcast
over a wide area (for example, to drivers who are still many miles away), it is not
enough to simply provide the current space availability, when that information is
likely to change by the time the driver arrives (Smith et al., 2005).
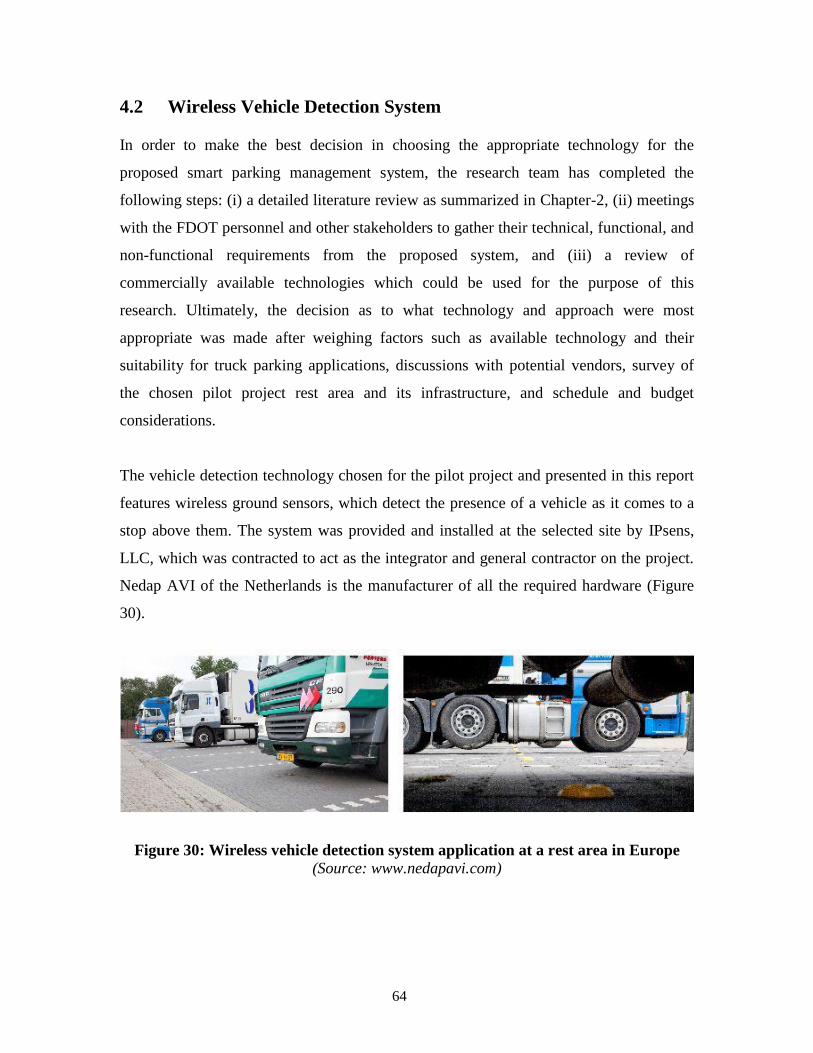
64
4.2 Wireless Vehicle Detection System
In order to make the best decision in choosing the appropriate technology for the
proposed smart parking management system, the research team has completed the
following steps: (i) a detailed literature review as summarized in Chapter-2, (ii) meetings
with the FDOT personnel and other stakeholders to gather their technical, functional, and
non-functional requirements from the proposed system, and (iii) a review of
commercially available technologies which could be used for the purpose of this
research. Ultimately, the decision as to what technology and approach were most
appropriate was made after weighing factors such as available technology and their
suitability for truck parking applications, discussions with potential vendors, survey of
the chosen pilot project rest area and its infrastructure, and schedule and budget
considerations.
The vehicle detection technology chosen for the pilot project and presented in this report
features wireless ground sensors, which detect the presence of a vehicle as it comes to a
stop above them. The system was provided and installed at the selected site by IPsens,
LLC, which was contracted to act as the integrator and general contractor on the project.
Nedap AVI of the Netherlands is the manufacturer of all the required hardware (Figure
30).
Figure 30: Wireless vehicle detection system application at a rest area in Europe
(Source: www.nedapavi.com)

65
System Components and Hardware Description
The actual occupancy determination is accomplished using a unique combination of
differential magnetic induction measurement with a built-in infrared sensor. This
combination technology allows the sensors to accurately determine the presence of a
high-clearance truck chassis without confusing it with another vehicle parked in an
adjacent space. The sensors communicate through a network of wireless mesh repeaters,
which relay information to data collectors on the premises. The data collectors in turn are
connected to a central database via the Internet. Informational maps, historical reports,
and a number of other applications can be accessed by the user, along with other shared
data platforms and devices such as smart phones (Figure 31).
Figure 31: System components and hardware description
The wireless vehicle detection system presented in this report is comprised of several
subcomponents performing specific roles in capturing and transferring data to the back-
end. Below is a description of the system hardware components. Technical specifications
for these components can be found in Appendix-A.
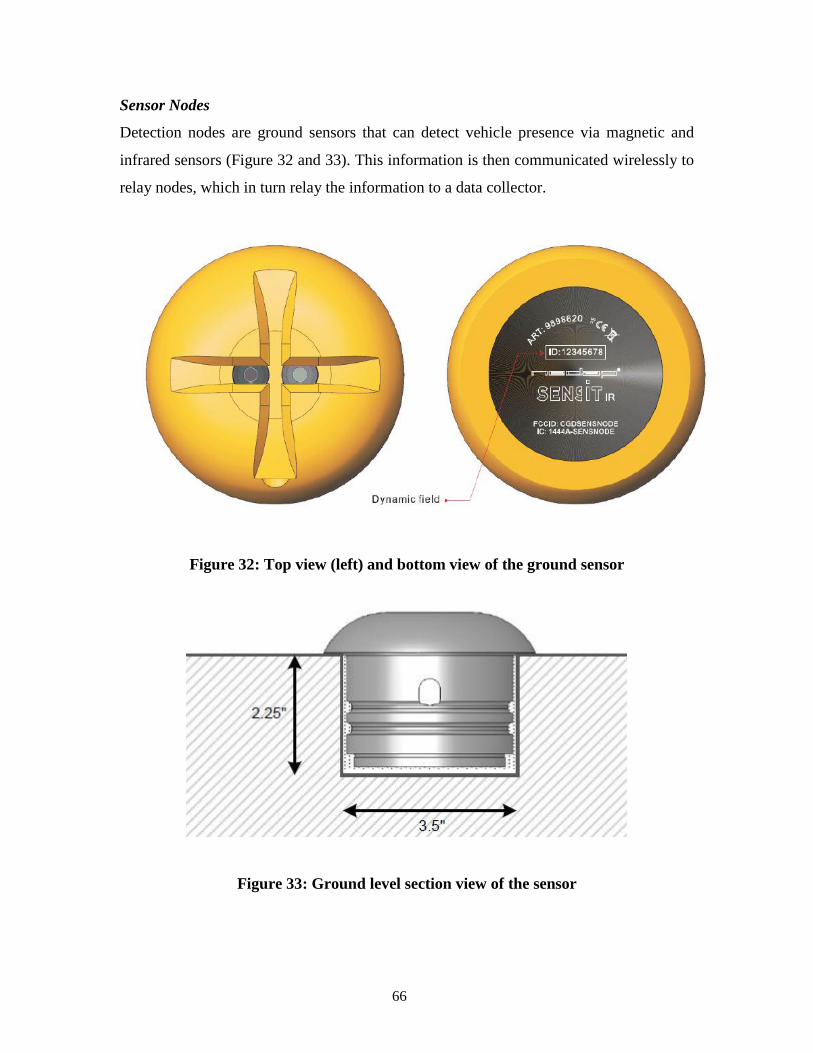
66
Sensor Nodes
Detection nodes are ground sensors that can detect vehicle presence via magnetic and
infrared sensors (Figure 32 and 33). This information is then communicated wirelessly to
relay nodes, which in turn relay the information to a data collector.
Figure 32: Top view (left) and bottom view of the ground sensor
Figure 33: Ground level section view of the sensor

67
Relay Nodes
Relay nodes are used to pass information from the ground sensors back to the data
collector. These nodes are typically mounted 10 feet or higher off the ground and require
a semi-line of sight between other system components. Relay nodes ensure faster
communication between the sensors and data collector, as well as an alternate or
redundant means of communication for delivering information to a data collector.
Data Collectors
Data collectors are communication hubs that receive information being passed along
from relay and detection nodes, and then make that raw information available via serial
or Ethernet connections. In doing this, the collector provides an interface between the
detection nodes and the host system, whether local or cloud-based.
4.3 Site Selection and Site Survey
After deciding on the vehicle detection technology to be used in this research, the next
task included selection of the site for the pilot project. Related activities included: (1)
define preliminary site-selection criteria; (2) identify candidate parking facility locations
in Florida that meet the criteria; (3) gather and assess general information on parking
conditions for candidate locations; (4) conduct physical surveys at the most promising
parking areas; and (5) select the optimal location for system deployment.
Two preliminary site-selection criteria were defined by the research team: (i) level of
truck parking capacity problem and (ii) location. Based on these two criteria and using
the information collected in the first phase of the project, the research team identified
three candidate rest areas that presented a high-level truck parking capacity problem and
illegal parking activity, as well as an easy access point (i.e., location) for travel and
procurement purposes. Site surveys and analyses at the shortlisted rest areas were
conducted in conjunction with the baseline information gathered in the first phase of the
research and included the collection of additional information, such as inventory of
current structures, trees, light poles and electrical sources on the site, availability of
power and communications, lot size and configuration, and need for work permits for
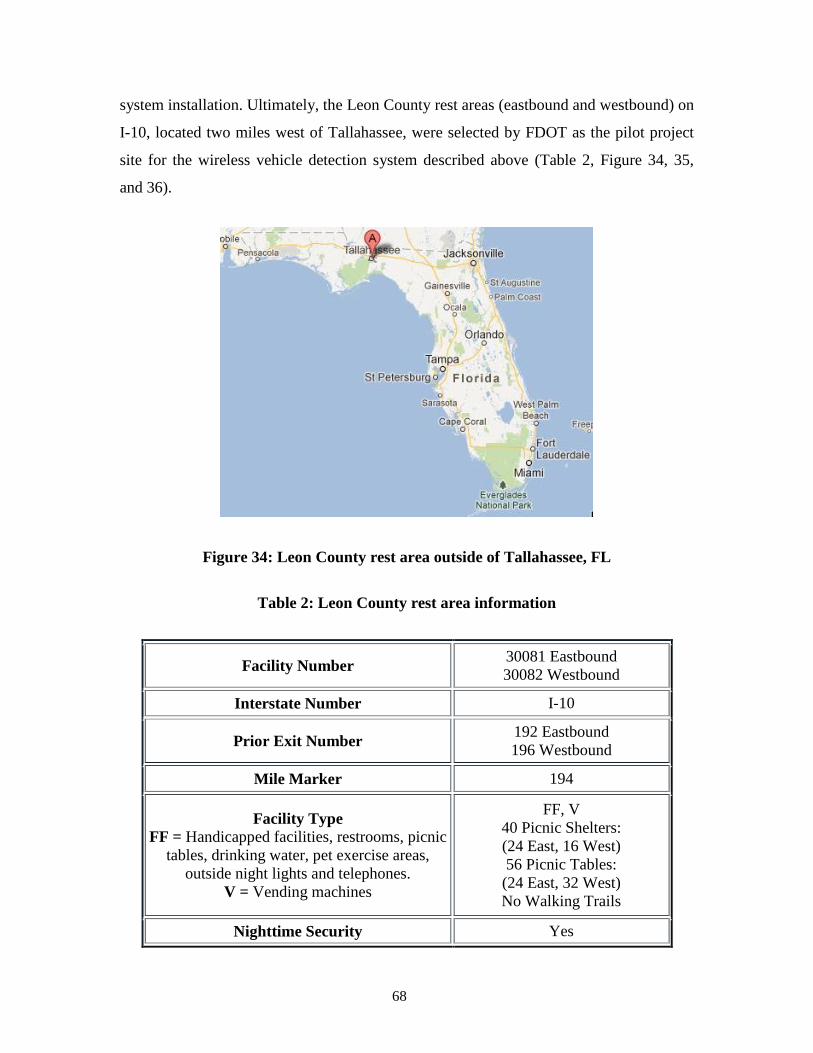
68
system installation. Ultimately, the Leon County rest areas (eastbound and westbound) on
I-10, located two miles west of Tallahassee, were selected by FDOT as the pilot project
site for the wireless vehicle detection system described above (Table 2, Figure 34, 35,
and 36).
Figure 34: Leon County rest area outside of Tallahassee, FL
Table 2: Leon County rest area information
Facility Number 30081 Eastbound
30082 Westbound
Interstate Number I-10
Prior Exit Number 192 Eastbound
196 Westbound
Mile Marker 194
Facility Type FF = Handicapped facilities, restrooms, picnic
tables, drinking water, pet exercise areas,
outside night lights and telephones.
V = Vending machines
FF, V
40 Picnic Shelters:
(24 East, 16 West)
56 Picnic Tables:
(24 East, 32 West)
No Walking Trails
Nighttime Security Yes
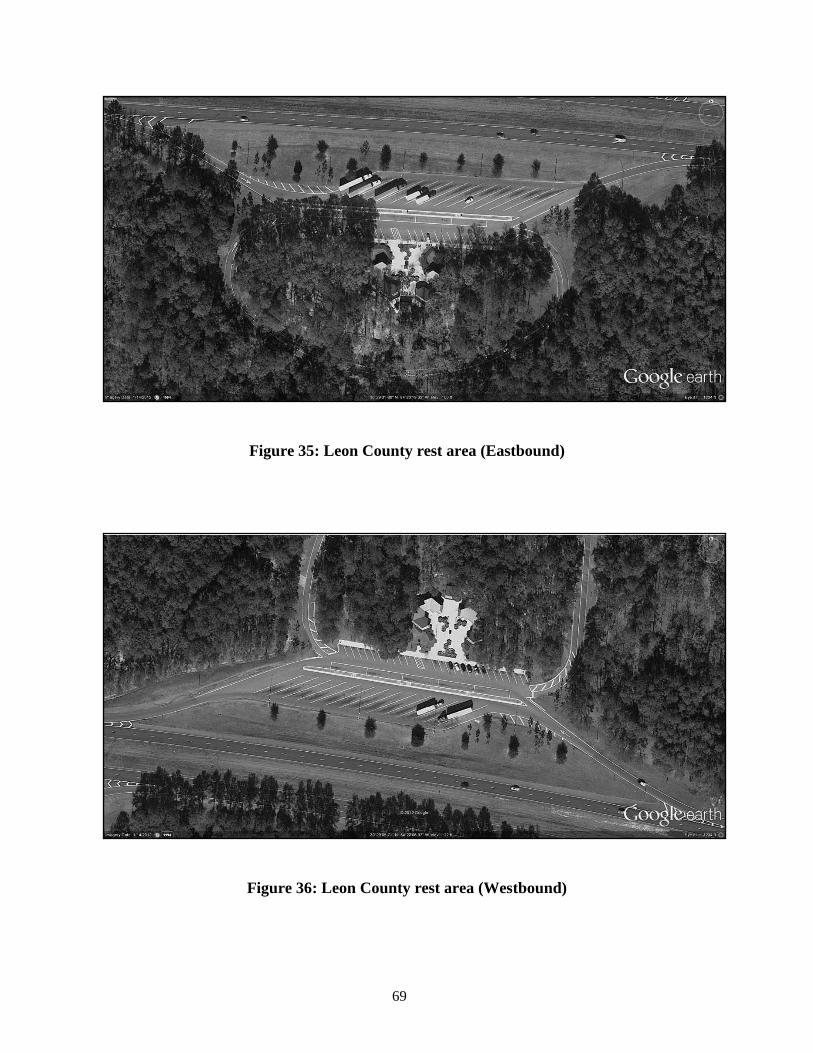
69
Figure 35: Leon County rest area (Eastbound)
Figure 36: Leon County rest area (Westbound)

70
4.4 System Design and Layout
To develop the appropriate system design and layout for the Leon County rest areas
(eastbound and westbound), the basic functions of each component within the proposed
wireless vehicle detection system were reviewed, taking into account the findings of the
site survey and the technical specifications of the system components. Optimal
communication for the wireless vehicle detection system relies on proper placement of
the system components on-site. The primary guideline is to ensure components have a
general line of sight between one another and do not exceed the documented distance
limitations for communication.
Figure 37: Leon County rest area system design and layout
The final system design and layout for the Leon County rest areas is shown in Figure-37.
The eastbound and westbound rest areas mirror each other with equipment installation.
Both rest areas contained 13 truck parking spaces each. Each parking space was elected
to have three equally spaced sensors to maximize sensing accuracy, which led to
installation of 78 ground sensor nodes in each rest area. Also, a total of eight (8) relay
nodes were installed in each rest area, including three (3) nodes attached to existing light

71
poles and three (5) nodes attached to small sign poles installed by the contractor. These
additional poles were necessary to provide optimum network coverage. Finally, a data
collector was placed 20 feet above ground level in each rest area to complete the network.
In the wireless vehicle detection system, only data collectors require main power,
whereas the sensor nodes and the relay nodes are battery powered.
4.5 Hardware Installation
Preparation for the hardware installation included a review of the scope of work, along
with the tools and labor necessary for project implementation. Sensors were to be placed
on the asphalt road surface, with relay nodes being installed overhead on light poles. This
required the use of both a core drill for the road surface and a bucket truck for the
placement of the overhead equipment. The complete list of equipment required for
installation is as follows:
- Core Drill (Water Cooled)
- Core Drill Bit (3½ -inch inner diameter)
- Water Tank or Source for drill
- Wet/Dry Vacuum
- Powered Hand Chipper
- Chisel or Flathead Screwdriver
- Quick-setting Mortar
- Mix tank or Buckets for Mortar
- Mortar Trowel
- Electrical Outlet or Generator
- Chalk or Construction Spray Paint
- Nylon String
- Detector Node Initiator Magnet
- Bucket Truck
Sensor Installation
The initial step in preparing for installation of the sensors included distribution of on-site
safety signage and the coning off of work areas. Alternate traffic routes were also
designated. Installation areas required the absence of vehicles for about eight (8) hours to
allow for proper mortar cure times.
After marking off the work zone, the process of confirming measurements and sensor
placement based on the original installation plan was started. Locations for the drilling of
the first sensors were marked using chalk. The absolute middle of the parking space was

72
marked for node placement, followed by two additional marks for nodes in the same
parking space. These markings were placed in the center of the same parking space at 25-
foot intervals on either side of the original center mark. The sensors were to be installed
in straight lines across the parking spaces, so a nylon string was used to maintain the
accuracy of the line during the initial markings. Starting with the initial markings for
sensor placement in the first parking space, subsequent markings were made in the
following parking spaces with the aid of the nylon guide line.
Once all the parking bays were marked, the core drilling process was initiated. A 3½-
inch inner diameter core bit was used to drill for sensor placement (Figure 38). The holes
were drilled to a depth of 2¼ inches (Figure 39). This allowed the mortar a small amount
of room to settle beneath the sensors themselves. After the drilling of a hole was
completed, the core was removed. Sometimes the use of a chisel or flathead screwdriver
and hammer was needed to loosen the core from its base. Any excess road base within
the hole was chipped away, and the remaining water and debris from the bottom of the
hole was vacuumed (Figure 40).
Figure 38: Core drilling process

73
Figure 39: The core before removal
Figure 40: The removed core and the sensor to be installed

74
After all the required holes were ready, a sensor was placed next to each hole in no
particular order. The sensor ID was then read from the top of each sensor and recorded on
the installation map. This was important because the sensor ID could become illegible
due to wear and tear, and knowing the exact location of each unique sensor is important
for data collection and troubleshooting in the future.
The quick drying mortar required for sensor node installation was prepared once drilling
was over, in accordance with the manufacturer’s specifications. The optimal consistency
of the mortar was found to be that of toothpaste. Previous experience of the contractor
indicated that excessive amounts of water in the mortar led to the sensor floating within
the hole and protruding.
Application of the mortar and placement of the sensors was performed one parking space
at a time from the east to west sides of the rest area. Approximately eight (8) ounces of
mortar was placed in each hole. The contractor made sure that enough mortar was used so
that when the sensor was pressed into the hole, a small amount of mortar came out of the
top. The excess mortar was removed from around the edge of the sensor and the tops of
each sensor were cleaned with a wet cloth (Figure 41).
Figure 41: Sensor being installed by the technician

75
Sensors are shipped to site from the factory in “sleep mode.” A sensor reverts to sleep
mode if it does not see a network for a long period of time. This design preserves the
battery of the sensor in the event of accidental initiation. Therefore, once a sensor was
installed, the activation magnet was waved over the sensor to initiate the sensor’s active
mode, i.e., sensor “wake up.” This process placed the sensors in a more active state,
reporting their status more frequently. If no network is in place yet, the sensors will
gradually slow down their frequency of communication again over the course of a 24-
hour period. This step can be performed at a later time, if the data collector and back-end
network are not available yet; however, regardless of when performed, it is easier to
implement when no vehicles are over the sensors.
Figure 42: The first row of sensors after installation
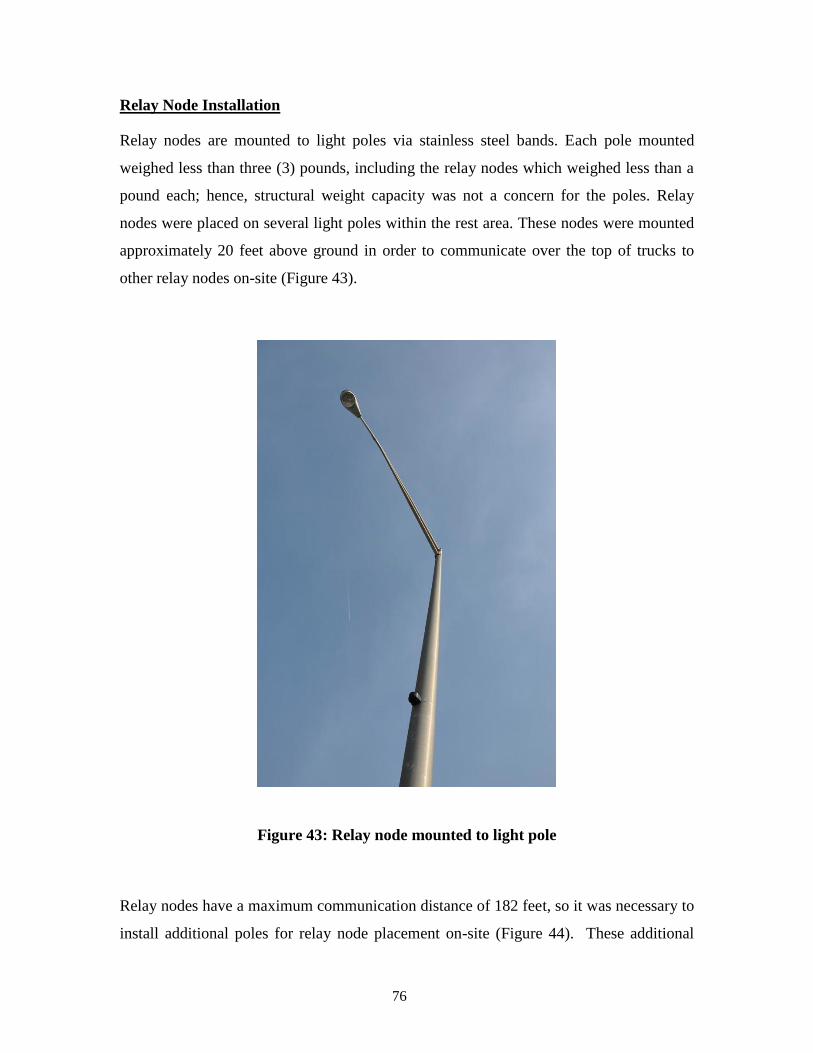
76
Relay Node Installation
Relay nodes are mounted to light poles via stainless steel bands. Each pole mounted
weighed less than three (3) pounds, including the relay nodes which weighed less than a
pound each; hence, structural weight capacity was not a concern for the poles. Relay
nodes were placed on several light poles within the rest area. These nodes were mounted
approximately 20 feet above ground in order to communicate over the top of trucks to
other relay nodes on-site (Figure 43).
Figure 43: Relay node mounted to light pole
Relay nodes have a maximum communication distance of 182 feet, so it was necessary to
install additional poles for relay node placement on-site (Figure 44). These additional

77
poles, 10 feet in height, were placed in the existing median, which separated the truck
parking area from other vehicle parking, and relay nodes were attached to the top of each
pole. This provided the proper amount of coverage and overlap for the network to
communicate effectively. The relay nodes are battery powered (similar to that of the
sensors in the ground), thus no power access on the poles was needed. The relay nodes
were also activated with the node magnet due to the same reasons previously discussed.
Figure 44: Relay node mounted to traffic sign pole
Data Collector and Camera Installation
The data collector is the main network hub for the wireless vehicle detection system,
collecting data passed to it from the relay nodes. It is the only system component that
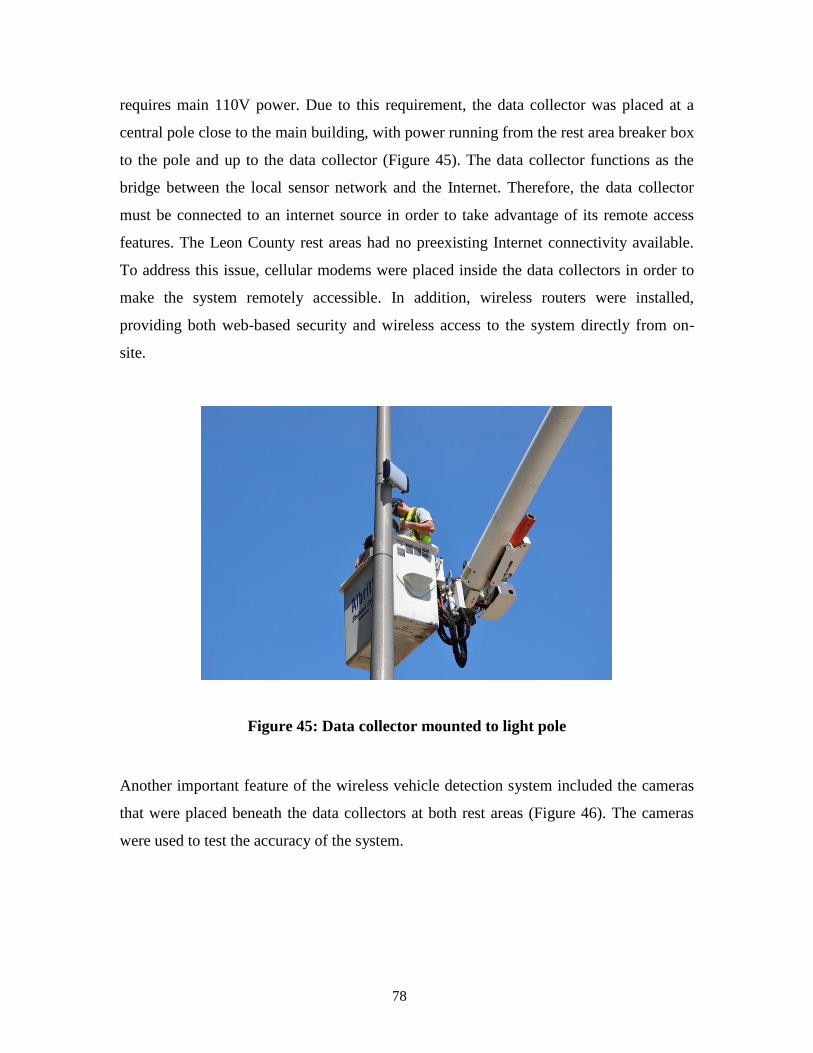
78
requires main 110V power. Due to this requirement, the data collector was placed at a
central pole close to the main building, with power running from the rest area breaker box
to the pole and up to the data collector (Figure 45). The data collector functions as the
bridge between the local sensor network and the Internet. Therefore, the data collector
must be connected to an internet source in order to take advantage of its remote access
features. The Leon County rest areas had no preexisting Internet connectivity available.
To address this issue, cellular modems were placed inside the data collectors in order to
make the system remotely accessible. In addition, wireless routers were installed,
providing both web-based security and wireless access to the system directly from on-
site.
Figure 45: Data collector mounted to light pole
Another important feature of the wireless vehicle detection system included the cameras
that were placed beneath the data collectors at both rest areas (Figure 46). The cameras
were used to test the accuracy of the system.

79
Figure 46: Data collector and the camera
80
5. GIS MAPPING APPLICATION AND REPORT
GENERATION
5.1 Introduction
This chapter describes the software tools developed to complement the wireless vehicle
detection system introduced in Chapter-4, including the GIS mapping application and the
report generation module.
5.2 Network Administration and System Diagnostics
Management of data received from the sensors at the rest area begins on a network of
servers monitored and managed by IPsens. These servers collect all incoming data from
the site via a secure VPN connection and propagate the SQL relational database used for
the generation of reports later on.
The reliability of sensor data is of major importance. Network strength tests, sensor
interrogation, data latency evaluation, and sensor calibration are all diagnostics provided
by the vendor. Coupled with built-in sensor-level diagnostic intelligence, these services
allow for increased system reliability and accuracy.
5.3 Online Access to Software Tools
The GIS mapping application as well as the report generation module developed for the
pilot project at the Leon County rest areas can be accessed over the Internet at:
http://ipspark.webhop.net/ipro_fldot_pilot. Access to the online system is currently
password protected; however, readers interested in reviewing these software tools can
contact the Principle Investigator (PI) to receive login information. The following
sections provide an overview of the GIS mapping application and the report generation
module.

81
Figure 47: Login screen
Once logged on to the system, the user can access the GIS mapping application (Actions
> GIS map) and the report generation module (Actions > Occupancy) using the “Actions”
tab.
Figure 48: Main menu
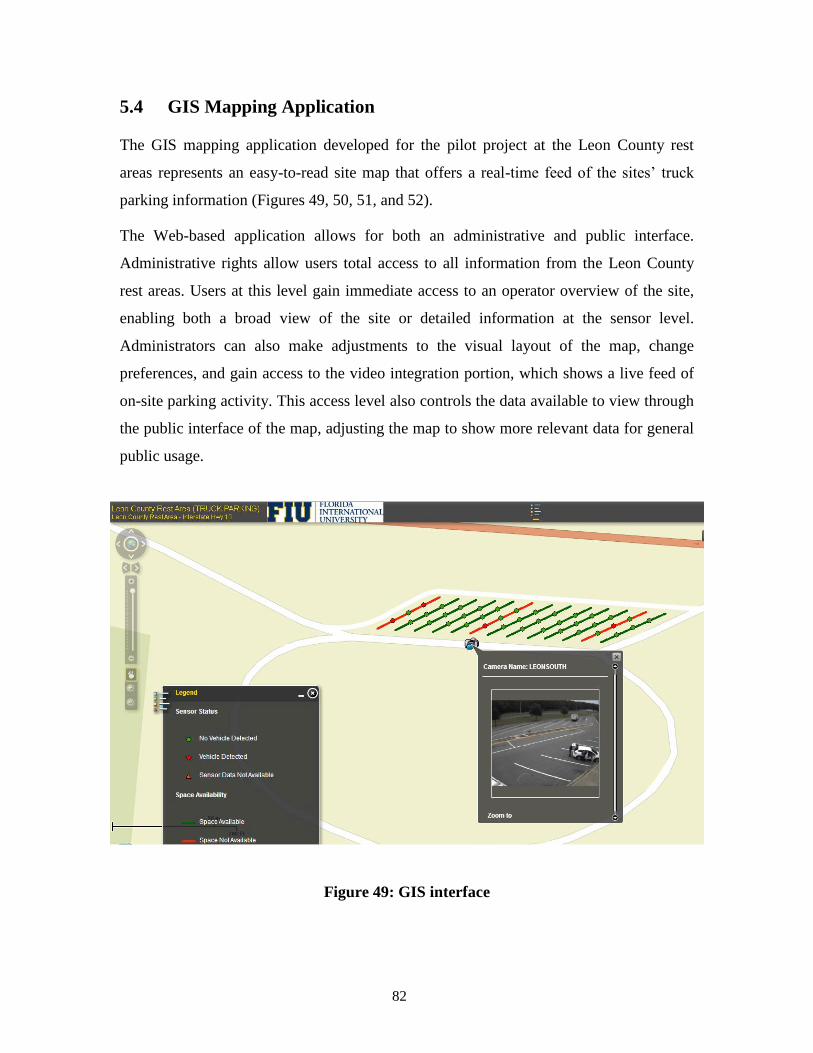
82
5.4 GIS Mapping Application
The GIS mapping application developed for the pilot project at the Leon County rest
areas represents an easy-to-read site map that offers a real-time feed of the sites’ truck
parking information (Figures 49, 50, 51, and 52).
The Web-based application allows for both an administrative and public interface.
Administrative rights allow users total access to all information from the Leon County
rest areas. Users at this level gain immediate access to an operator overview of the site,
enabling both a broad view of the site or detailed information at the sensor level.
Administrators can also make adjustments to the visual layout of the map, change
preferences, and gain access to the video integration portion, which shows a live feed of
on-site parking activity. This access level also controls the data available to view through
the public interface of the map, adjusting the map to show more relevant data for general
public usage.
Figure 49: GIS interface

83
Figure 50: Camera view (Leon East)
Figure 51: GIS interface in aerial view (Leon East)
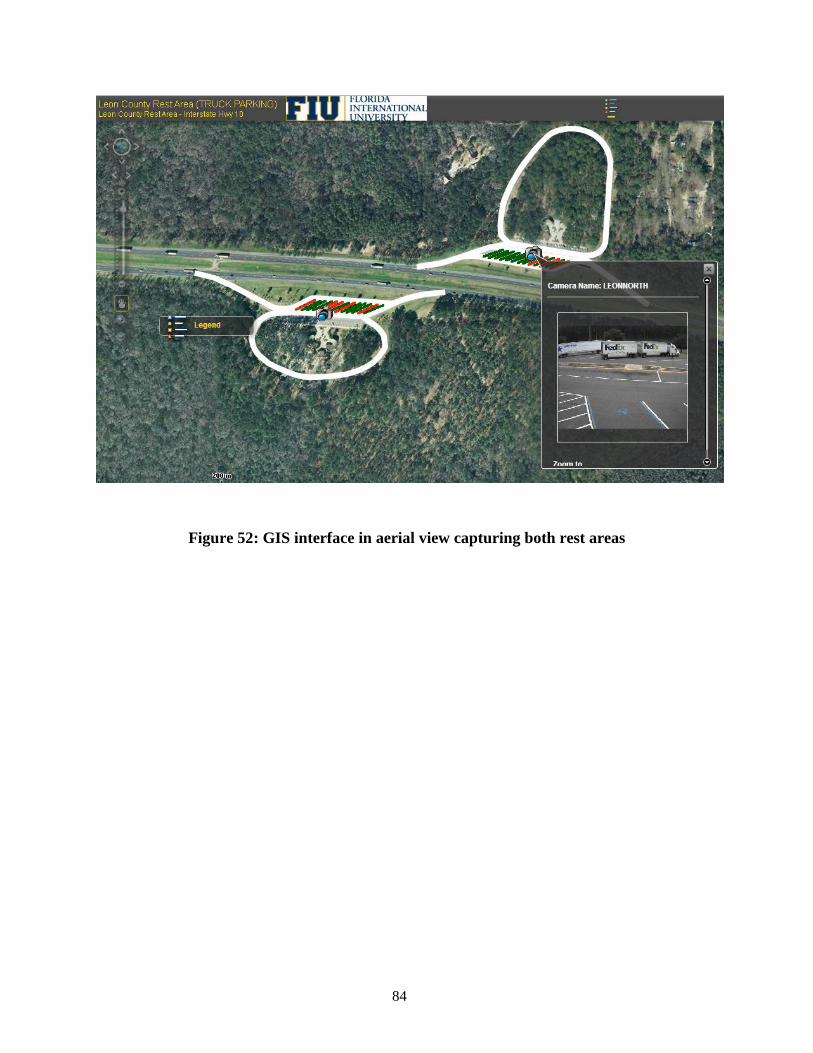
84
Figure 52: GIS interface in aerial view capturing both rest areas

85
5.5 Report Generation
The report generation module developed for the pilot project at the Leon County rest
areas offers immediate access to historical truck parking data collected from these
facilities (Figure 53).
Figure 53: Report generation module main menu
The report types currently available in the report generation module include:
Average occupancy by location; time of day; week day: This report provides
average hourly truck counts for the selected rest area, date and time range, and the
specified days of the week. The user can control all of the parameters above. For
example, the user can create an occupancy report for a specific rest area, a
specific date range, and specific days within that date range. This report is useful
for viewing the parking trends specific to different weekdays in the selected
period (Figures 54 and 55).
Average occupancy by location; time of day: This report provides average
hourly truck counts for the selected rest area and specified date range. For
example, the user can create an occupancy report for a specific rest area and a

86
specific date range. Unlike the first report, this report generates average
occupancy for the provided date range as a whole. This report is useful for
viewing overall parking trends when the daily breakdown is not important.
Figure 54: User input screen to generate occupancy reports
Figure 55: Occupancy report Leon West for 10/03/2012 (example report)
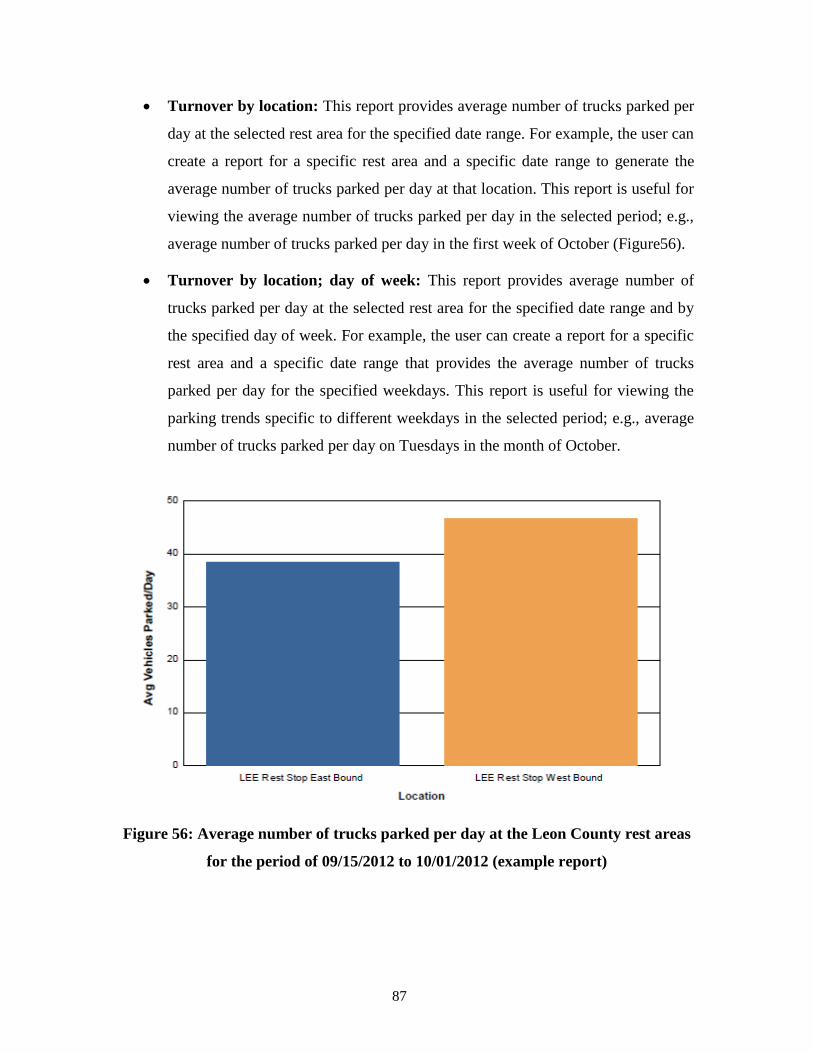
87
Turnover by location: This report provides average number of trucks parked per
day at the selected rest area for the specified date range. For example, the user can
create a report for a specific rest area and a specific date range to generate the
average number of trucks parked per day at that location. This report is useful for
viewing the average number of trucks parked per day in the selected period; e.g.,
average number of trucks parked per day in the first week of October (Figure56).
Turnover by location; day of week: This report provides average number of
trucks parked per day at the selected rest area for the specified date range and by
the specified day of week. For example, the user can create a report for a specific
rest area and a specific date range that provides the average number of trucks
parked per day for the specified weekdays. This report is useful for viewing the
parking trends specific to different weekdays in the selected period; e.g., average
number of trucks parked per day on Tuesdays in the month of October.
Figure 56: Average number of trucks parked per day at the Leon County rest areas
for the period of 09/15/2012 to 10/01/2012 (example report)
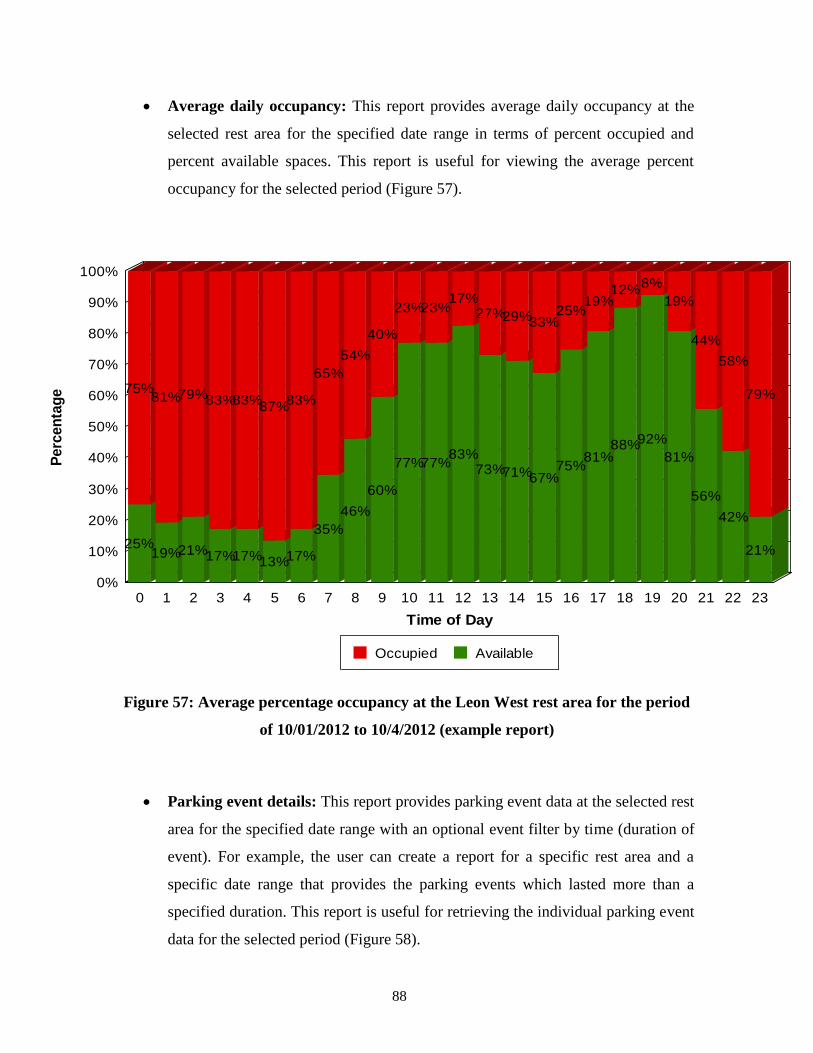
88
Average daily occupancy: This report provides average daily occupancy at the
selected rest area for the specified date range in terms of percent occupied and
percent available spaces. This report is useful for viewing the average percent
occupancy for the selected period (Figure 57).
Figure 57: Average percentage occupancy at the Leon West rest area for the period
of 10/01/2012 to 10/4/2012 (example report)
Parking event details: This report provides parking event data at the selected rest
area for the specified date range with an optional event filter by time (duration of
event). For example, the user can create a report for a specific rest area and a
specific date range that provides the parking events which lasted more than a
specified duration. This report is useful for retrieving the individual parking event
data for the selected period (Figure 58).
0%
10%
20%
30%
40%
50%
60%
70%
80%
90%
100%
0 1 2 3 4 5 6 7 8 9 10 11 12 13 14 15 16 17 18 19 20 21 22 23
25%19%21%17%17%13%17%
35%
46%
60%
77%77%83%
73%71%67%75%
81%88%92%
81%
56%
42%
21%
75%81%79%83%83%
87%83%
65%
54%
40%
23%23%17%
27%29%33%25%
19%12%
8%
19%
44%
58%
79%
Occupied Available
Time of Day
Perc
en
tag
e
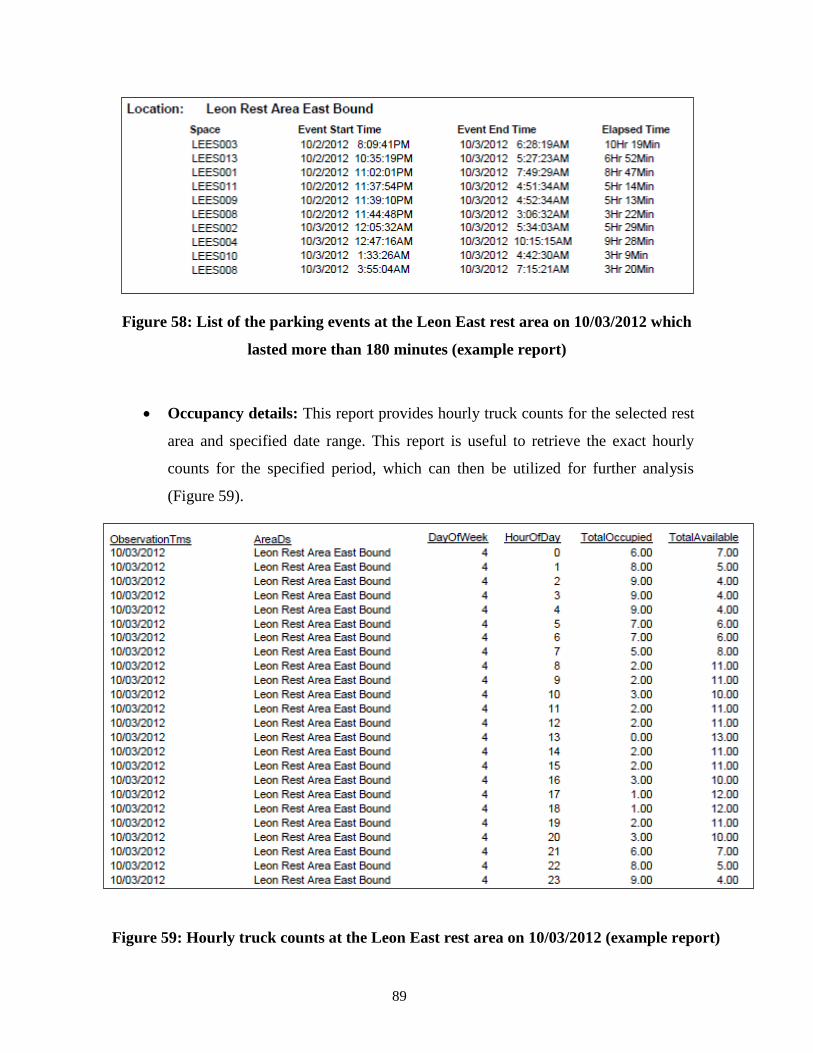
89
Figure 58: List of the parking events at the Leon East rest area on 10/03/2012 which
lasted more than 180 minutes (example report)
Occupancy details: This report provides hourly truck counts for the selected rest
area and specified date range. This report is useful to retrieve the exact hourly
counts for the specified period, which can then be utilized for further analysis
(Figure 59).
Figure 59: Hourly truck counts at the Leon East rest area on 10/03/2012 (example report)
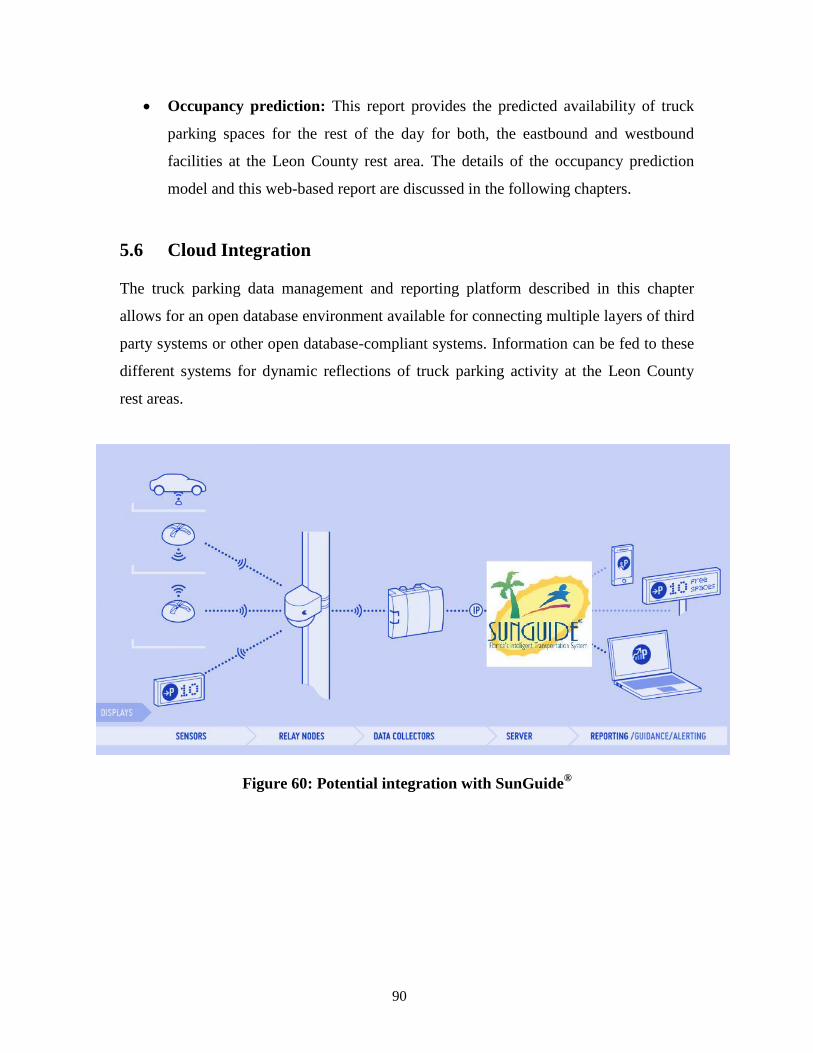
90
Occupancy prediction: This report provides the predicted availability of truck
parking spaces for the rest of the day for both, the eastbound and westbound
facilities at the Leon County rest area. The details of the occupancy prediction
model and this web-based report are discussed in the following chapters.
5.6 Cloud Integration
The truck parking data management and reporting platform described in this chapter
allows for an open database environment available for connecting multiple layers of third
party systems or other open database-compliant systems. Information can be fed to these
different systems for dynamic reflections of truck parking activity at the Leon County
rest areas.
Figure 60: Potential integration with SunGuide®

91
6. OCCUPANCY PREDICTION MODEL
6.1 Introduction to Kalman Filter
The Kalman filter is named after Rudolf Emil Kalman (born 1930, Budapest, Hungary)
who published a recursive solution to the discrete signal linear filtering problem in 1960
(Klette, 2006). The Kalman filter is an efficient recursive computational method to
predict or estimate the state of a process. It is based on a set of mathematical equations
that try to minimize the mean squared error (Welch and Bishop, 2004). A simplistic way
of understanding the Kalman filter is that it works on a “prediction-correction” approach
through two steps of time update and measurement update (Antoniou et al., 2007), the
details of which will be discussed later in the text along with development of the model
for a rest area occupancy scenario to fit the Kalman filter approach. Kalman filter is a
powerful technique due to the fact that it utilizes the historical data available to estimate
past and even future states. More interestingly, it can perform such a prediction even
when the exact nature of the modeled system is unknown (Welch and Bishop, 2004). A
description of basic concepts and further explanation of the extended Kalman filters can
be read in the work of Welch and Bishop (2001, 2004) and Maybeck (1979).
The applications of Kalman filter are numerous (Klette, 2006), including:
Tracking objects (e.g., balls, faces, heads, hands)
Fitting Bezier patches to point data
Economics
Navigation
Many computer vision applications such as:
o Stabilizing depth measurements
o Feature tracking
o Cluster tracking
o Fusing data from radar/laser scanners, and
Stereo-cameras for depth and velocity measurement

92
6.2 Applications of Kalman Filter in Intelligent Transportation
Systems (ITS)
In addition to the aforementioned applications of Kalman filter in various fields of
scientific research, it has also been utilized for certain ITS-related processes. These
applications have been mainly for traffic state estimation on a corridor or at an
intersection, based on data collected through either sensors or video feeds. For instance,
Antoniou et al. (2007) developed a non-linear Kalman filtering algorithm using
simultaneous perturbation for the computation of the gradient as a more efficient
estimation method than the usual numerical derivatives. They applied the algorithm for
traffic estimation and prediction purposes to the problem of on-line calibration for traffic
dynamics models. Tampère and Immers (2007) used an extended Kalman filter
application for traffic state estimation based on the cell transmission model (CTM).
Using the extended Kalman filter in conjunction with CTM, they were able to capture
rapid changes of important modeling parameters such as capacity. Veeraraghavan et al.
(2005) based their work on a mixture of Kalman filters (Chen and Liu, 2000) in order to
model the different motions exhibited by the target vehicles, such as slow moving or
stopping, turning, accelerating, and uniform velocity motion. They utilized a “switching
Kalman filter” for tracking and event detection at traffic intersections. In the case of
intersections, the switching Kalman filter framework provided the advantage that, at any
given time, the motion ascribed to a vehicle can be determined as a weighted
combination of the three models, thereby providing more flexibility to describe their
motion.
6.3 Rest Area Occupancy Prediction Model based on Kalman Filter
As previously mentioned, the Kalman filter is flexible enough to be useful for various
past, present, and future trend prediction estimates. The research team, considering this
dynamic nature of prediction, therefore selected a Kalman filter for modeling the rest area
occupancy. This was done because the research team’s aim was to employ a dynamic
prediction model that uses the average historical occupancy data available for a particular
time of day alongside the last hour updated occupancy count (which automatically

93
becomes part of the historical data). Although the updated data may not have a major
impact on changing the mean occupancy that will be utilized as starting point of each
prediction period, as explained later in the text, the trend of occupancy which is
represented by standard deviation (σ) will be affected accordingly to take into account the
current day’s trend. Thus, a discrete Kalman filter suited to the scenario for the rest area
occupancy prediction was utilized.
The modeling of rest area occupancy prediction using a Kalman filter occurs in three
steps:
1. Model Set-Up,
2. Iteration (Prediction-correction Mechanism), and
3. Application of the Model.
The model set-up will describe how the rest area occupancy prediction scenario fits in the
Kalman filter methodology. The iteration process will describe the time and measurement
update steps. The application of the model will describe the model considerations and
period-wise estimation methodology, as well as its reasons, while providing an example
of practical application to the real reliable data available through the sensors systems at
the Leon County eastbound rest area. At the end, the use of prediction query from the
online system will be explained.
Model Set-Up
The Kalman filter addresses the general problem of trying to estimate the state of a
discrete time- controlled process that is governed by the linear stochastic difference
equation. It means that each Xk (number of truck present/occupancy) can be evaluated by
using a linear stochastic equation. Any estimated occupancy (Xk) is a combination of its
previous value estimated plus a control signal Uk and noise. This can be represented in
terms of the following equations:

94
With a measurement of z as
Where,
xk = Current estimation (for the proposed model = predicted occupancy at time k);
A = State transition matrix;
Xk-1 = Prior estimate (for the proposed model = predicted occupancy at time k-1);
B = Relates the optional control input;
Uk = Control signal (control matrix);
w = Random representation of the process noise;
zk = Measured value (for the proposed model = historical average occupancy at time k
updated to last hour through sensor data);
H = Matrix that relates the state to the measurement zk ; and
v = Measurement noise.
A represents the state transition model (or matrix) which accounts for the change in the
estimated value within a time interval. In this case, instantaneous counts are used. This
means that Xk can be assumed similar to a constant signal. This is because occupancy is
recorded at the start of the one-hour interval and will remain fixed until the next count is
obtained at the start of the next hour. Therefore, A is assumed to be equal to 1.
It is important to note that most of the time there is no control signal (Esme, 2009). In
general, control is defined as a type of influence at time t which is not inherent to the
process itself (Klette, 2006). The estimations obtained here will be based on the average
historical occupancy, i.e., the mean and standard deviation over an eight-hour period (as
further explained later) on a similar day at the same time for which the prediction has
been made.
The matrix H in the measurement equation relates the state to the measurement zk. This
might change with each time step or measurement in practice, but can be taken as

95
constant for the purposes of this study (Welch and Bishop, 2006). Therefore, it is
assumed to be equal to 1.
The above explanation of the important parameters shows that the proposed model's
requirements fit the Kalman filter prediction system. The variables remaining to be
estimated are the noise functions Wk-1 and vk. While no real-world signal is pure
Gaussian, it can nonetheless be assumed with some approximation. This is based on the
fact that the Kalman Filtering Algorithm tries to converge correct estimations, even if the
Gaussian noise parameters are poorly estimated (Esme, 2009). They are thus assumed to
be independent of each other, with normal probability distributions; i.e.,
In practice, the process noise covariance and measurement noise covariance matrices may
change with each time step or measurement; however, it is assumed here that they are
constant (Welch and Bishop, 2006). Therefore, it can be concluded from the above
discussion that the scenario of occupancy prediction for rest areas fits in the Kalman filter
process.
Iteration (Prediction-Correction Mechanism)
It was mentioned earlier in the text that the Kalman filter basically works as a prediction-
correction mechanism. Sometimes this is also referred to as “estimation through
feedback.” The filter estimates the process state at a given time and then obtains feedback
in the form of (noisy) measurements. The research team was able to fit its occupancy
estimation scenario into the Kalman filter; i.e., having set-up the model, the next step is
iteration. Kalman filter iteration equations fall into two groups, time update equations
(predictor) and measurement update equations (corrector). The time update equations are
responsible for projecting forward (in time) the current state and error covariance
estimates to obtain the a priori estimates for the next time step. Measurement update
equations are used for integrating new measurements into a previous estimate to obtain
an improved a posteriori estimate (Welch and Bishop, 2006).

96
Figure 61 presents the completed Kalman filter process along with specific equations for
the time and measurement updates (Welch and Bishop, 2006):
Figure 61: Kalman filter process
Where,
= Prior estimate (rough estimate before the measurement update correction);
= Prior error covariance;
= The estimate of x at time k (the aim of this research);
= Which is necessary for the k=1 (future) estimate, together with ; and
= Kalman gain.
In the next step, the time and measurement updates will be made to real data collected
through the sensor occupancy detection system installed at the Leon County rest areas.
For a more comprehensive understanding of the process, the following text will describe

97
the application of the Kalman filter-based prediction model over a limited data period for
a particular day.
Application of the Model
Although the occupancy prediction at the rest area perfectly fits the Kalman filter
process, it was still necessary to customize the application of the Kalman filter, as per the
requirements of the rest area’s occupancy in its particular scenarios. It was quite evident
through the surveys of rest areas conducted in the first phase of the project that the rest
area occupancy trends are influenced by the season, different days of the week, and
periods within the day. Therefore, it was required that either the Kalman filter application
consider such influences as inherent within the process or as control signals (external
influence). The preference was given for having any such influence inherent within the
process.
The seasonal influence is already inherent in the system based on the fact that, once the
sensor system has collected enough data for all the seasons (at least one year of data is
necessary to demonstrate a certain trend), the user of the prediction system will have the
flexibility to select historical data for a specific period of the year. That data will still be
updated to the last hour in order to predict the occupancy at a future point in time.
The second aspect to consider was specific day of the week. The proposed model is
designed to retrieve a specific day of the week’s data while making its prediction; for
example, Tuesday's historical data (updated to the last hour) will be retrieved as a result
of user query in order to predict occupancy at a particular time for a future time on a
Tuesday. This will be more clearly explained during the section describing online
prediction query.
Having addressed these issues, the most challenging task was to then define a way in
which occupancy trend within a day could be utilized to keep the prediction model
dynamic, based on last-hour updated data. It was thus determined that a 24-hour day be
divided into different periods so that each period’s rate of change could be considered

98
independently. The rate of change R in this case will be defined through the standard
deviation of the average occupancy data. This required the team to find a realistic number
of hours for defining a period in which the occupancy trend (either increasing or
decreasing) remains smooth. In order to achieve this, the reliable historical data available
from the sensor system from September 17, 2012 to September 30, 2012 was analyzed to
find the most appropriate period in which the rate of occupancy change (defined by
standard deviation) remains relatively constant. Historical average occupancy data
available for weekdays Monday through Thursday was used to calculate standard
deviation based on three, four, five, six, seven, and eight-hour periods. The results were
plotted on a graph as shown in Figure 62. The plot provides two important inferences.
First, it shows that the rate of change over a 96-hour period follows a sinusoidal pattern.
This re-emphasizes that the Kalman filter can be used for modeling the prediction of
occupancy. More importantly, the second inference is that the most stable trend in rate of
change (represented by standard deviation) occurs within an eight-hour period and
remains relatively smooth as compared to the others. As can be observed from the plot, in
various periods, such as from the 8th
to 15th
hour of the week, the 64th
hour to the 71st
hour, etc., the curve for eight-hour calculation is smoother than any other curve. The
prediction model therefore makes a prediction for every hour, considering the hourly
updated data for each eight-hour standard deviation, taking the eight-hour mean as the
starting point for each period. Hence, any seasonal, day of the week, or hour of the day-
related influences are inherent in the process itself. Also, the historical data is being
updated dynamically (continuously) each hour. All of these facts imply that we do not
have any external influence in this case. As such, the control (uk) can be taken as equal to
zero.

99
Figure 62: Standard deviation of historical occupancy data based on three, four, five, six, seven, and eight-hour periods
0
0.5
1
1.5
2
2.5
3
3.5
1 3 5 7 9 11 13 15 17 19 21 23 25 27 29 31 33 35 37 39 41 43 45 47 49 51 53 55 57 59 61 63 65 67 69 71 73 75 77 79 81 83 85 87 89 91 93 95
Sta
nd
ard
Dev
iati
on
3hours 4 hours 5 hours 6 hours 7 hours 8 hours
Hours

100
Example Application
Table 3 shows the hourly average occupancy data for Mondays between the aforementioned
reliable data period obtained through the sensor system.
Table 3: Average hourly occupancy data for Mondays
Time (k) Average Occupancy (Zk)
0 8.5
1 8
2 9
3 8
4 8.5
5 7
6 9
7 9
8 8.5
9 5
10 3
11 5.5
12 2.5
13 4
14 6.5
15 5
16 4.5
17 2.5
18 6
19 5
20 1
21 2.5
22 2.5
23 6
As mentioned earlier,
• No such control signal uk is given;
• A = 1; and
• H = 1.

101
The initial state can be defined as (Ko, Xo, Po), while in this case they are taken as follows:
K = 0 (12:00 AM);
Xo = = Mean of average occupancy for the respective eight-hour period; and
Po = 1 (assuming that there was some noise/turbulence in the system).
Thus, the time update and measurement update equation can be written as shown below.
Time Update
(prediction)
Measurement Update
(correction)
Next, the value for the first group of iterations in the first eight-hour period is calculated.
For First Iteration For Second Iteration
Zk = 8.5
= 8.38
= 1
R = σ = 0.69 (for first eight-hour period)
Time Update
= = 8.38
= = 1
Zk = 8
= 9
= 1
R = σ = 0.69 (for first eight-hour period)
Time Update
= = 9
= = 0.41

102
Measurement Update
= 1/(1+0.69) = 0.59
= (1-0.59) x 1 = 0.41
= 8.38 + 0.59(8.5-8.38) = 8.45 (rounded up to
9)
Measurement Update
= 0.41/(0.41+0.69) = 0.37
= (1-0.37) x 0.41 = 0.26
= 9 + 0.37(8-9) = 8.63 (rounded up to 9)
The resulting iterations for the remaining hours are shown Table 4.

103
Table 4: Kalman filter iterations
Time
(k)
Occupancy
(Zk)
X(k-1)
Pk'
Time update
(Xk')
Measurement Update
Kk Xk Pk
0 8.50 8.38 1.00 8.38 0.59 9.0 0.4
1 8.00
0.4 9.00 0.37 9.0 0.26
2 9.00
0.26 9.00 0.27 9.0 0.19
3 8.00
0.19 9.00 0.21 9.0 0.15
4 8.50
0.15 9.00 0.18 9.0 0.12
5 7.00
0.12 9.00 0.15 9.0 0.10
6 9.00
0.10 9.00 0.13 9.0 0.09
7 9.00
0.09 9.00 0.12 9.0 0.08
μ 8.38
σ 0.69
8 8.50 5.00 0.08 5.00 0.04 6.00 0.08
9 5.00
0.08 6.00 0.04 6.00 0.07
10 3.00
0.07 6.00 0.04 6.00 0.07
11 5.50
0.07 6.00 0.04 6.00 0.07
12 2.50
0.07 6.00 0.03 6.00 0.07
13 4.00
0.07 6.00 0.03 6.00 0.06
14 6.50
0.06 6.00 0.03 7.00 0.06
15 5.00
0.06 7.00 0.03 7.00 0.06
μ 5.00
σ 1.93
16 4.50 3.75 0.06 3.75 0.03 4.00 0.06
17 2.50
0.06 4.00 0.03 4.00 0.06
18 6.00
0.06 4.00 0.03 5.00 0.05
19 5.00
0.05 5.00 0.03 5.00 0.05
20 1.00
0.05 5.00 0.03 5.00 0.05
21 2.50
0.05 5.00 0.03 5.00 0.05
22 2.50
0.05 5.00 0.03 5.00 0.05
23 6.00
0.05 5.00 0.03 6.00 0.05
μ 3.75
σ 1.87
The results of the predicted occupancy, along with the historical hourly average occupancy, are
plotted and shown in Figure 63.
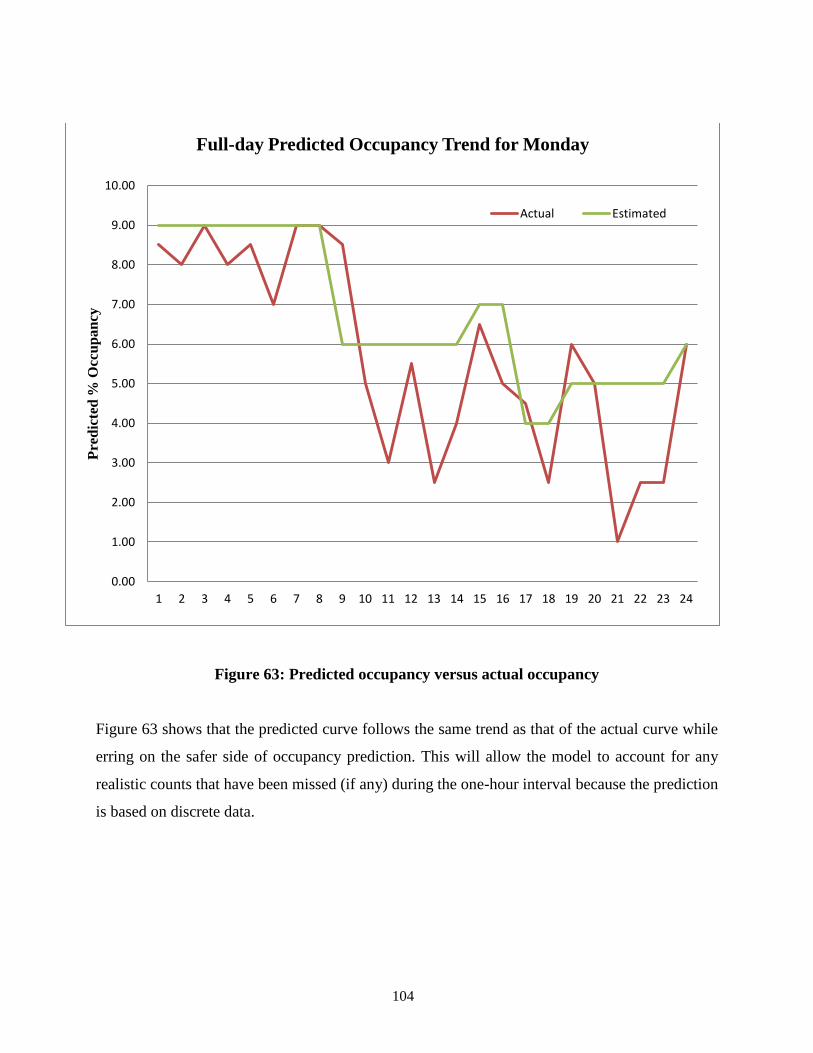
104
Figure 63: Predicted occupancy versus actual occupancy
Figure 63 shows that the predicted curve follows the same trend as that of the actual curve while
erring on the safer side of occupancy prediction. This will allow the model to account for any
realistic counts that have been missed (if any) during the one-hour interval because the prediction
is based on discrete data.
0.00
1.00
2.00
3.00
4.00
5.00
6.00
7.00
8.00
9.00
10.00
1 2 3 4 5 6 7 8 9 10 11 12 13 14 15 16 17 18 19 20 21 22 23 24
Pre
dic
ted
% O
ccu
pa
ncy
Full-day Predicted Occupancy Trend for Monday
Actual Estimated

105
6.4 Evaluation of Prediction Accuracy
The Kalman filter approach described in the previous section facilitates prediction in a dynamic
scenario (created by factors such as the season, time of the day, etc.) based on up-to-date
historical data. This section presents a comparative Root Mean Squared Error (RMSE) analysis
between the Kalman filter model and the linear regression model. First, the development of the
regression model for the purpose of accuracy evaluation is discussed followed by a comparison
between the Kalman filter model and the linear regression model based on RMSE analysis. The
data used for this comparison was acquired from the Leon County rest area (westbound).
Development of the Linear Regression Model
Historical average occupancy data from September 16, 2012 to November 23, 2012 was used to
develop a total of 12 linear regression models, one for each of the twelve 8-hour periods between
Mondays to Thursdays. The data utilized for the development of the regression model and the
related predictions for Monday between hour-0 to hour-7 is shown in Table 5. Figure 64 shows
the regression curve for the same period. The data tables and graphs showing the regression
curves for the remaining periods are included in Appendix B.
Table 5: Regression model prediction (example)
Rest Area Leon County West bound
Day Monday
Regression Model
Equation
y = 0.152x + 8.6142
y = Predicted Occupancy
x = hour of day
Hour of Day Occupancy
Average Predicted
0 7.73 9
1 8.91 9
2 9.36 9
3 9.45 9
4 9.73 9
5 9.45 9
6 9.45 10
7 9.09 10
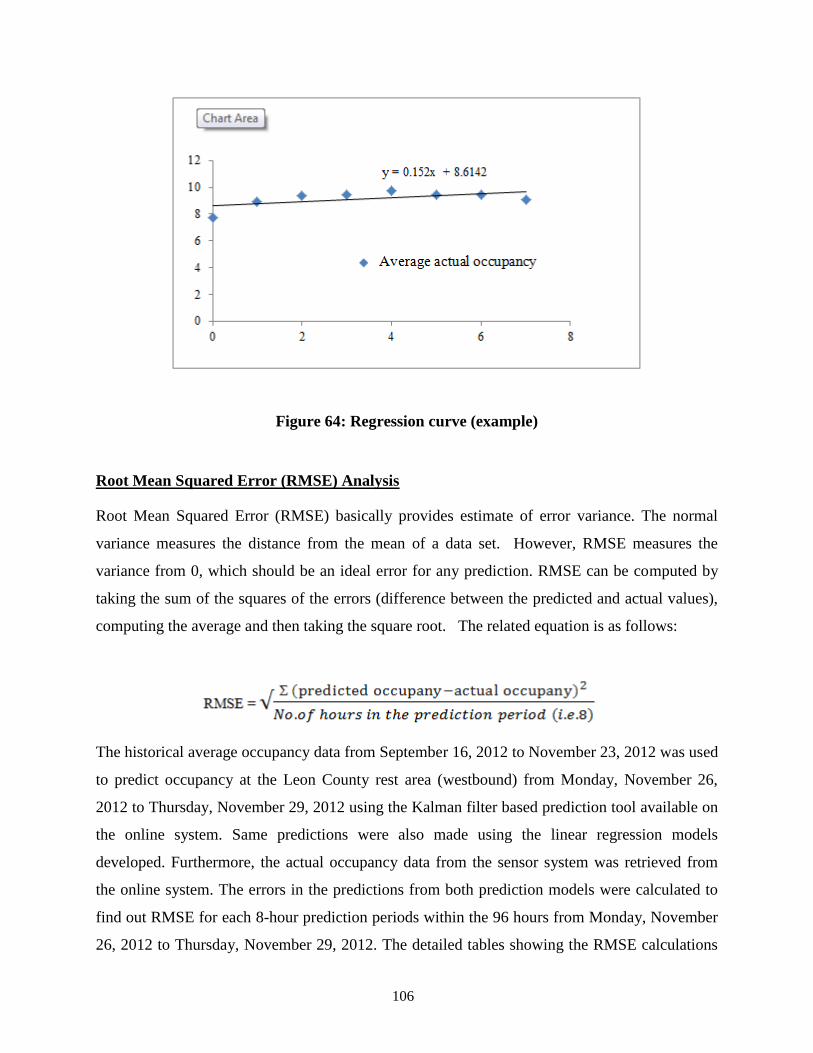
106
Figure 64: Regression curve (example)
Root Mean Squared Error (RMSE) Analysis
Root Mean Squared Error (RMSE) basically provides estimate of error variance. The normal
variance measures the distance from the mean of a data set. However, RMSE measures the
variance from 0, which should be an ideal error for any prediction. RMSE can be computed by
taking the sum of the squares of the errors (difference between the predicted and actual values),
computing the average and then taking the square root. The related equation is as follows:
The historical average occupancy data from September 16, 2012 to November 23, 2012 was used
to predict occupancy at the Leon County rest area (westbound) from Monday, November 26,
2012 to Thursday, November 29, 2012 using the Kalman filter based prediction tool available on
the online system. Same predictions were also made using the linear regression models
developed. Furthermore, the actual occupancy data from the sensor system was retrieved from
the online system. The errors in the predictions from both prediction models were calculated to
find out RMSE for each 8-hour prediction periods within the 96 hours from Monday, November
26, 2012 to Thursday, November 29, 2012. The detailed tables showing the RMSE calculations

107
are presented in Appendix C. Table 6 shows the RMSE values calculated for both the prediction
models. Figure 65 shows RMSE curves for both the prediction models in order to compare their
prediction accuracy.
Table 6: The calculated RMSE values
8-hr periods RMSE
(Regression model)
RMSE
(Kalman Filter model)
0 to 7 3.156726 2.263846
7 to 15 1.985433 3.122499
15 to 23 1.553028 1.322876
24 to 31 2.037111 1.767767
32 to 39 3.588259 3.297726
40 to 47 11.56775 2.715695
48 to 55 1.639166 0.935414
56 to 63 1.993863 1.732051
64 to 71 9.66491 1.541104
72 to 79 1.964134 2.872281
80 to 87 2.358649 1.870829
88 to 95 6.883816 1.767767

108
Figure 65: RMSE curves
The RMSE curves in Figure 65 clearly show that prediction error is significantly less for the
Kalman filter model as compared to the regression based model in almost every hour of the day
for the studied prediction period. Thus, Kalman filter based prediction model performs better
than regression model. This conclusion seconds and adds further rationale for using Kalman
filter to that presented in the model development section. It is also worth mentioning that as time
goes by and more data is added to the system, the Kalman filter based prediction model will
improve its performance further, simply because of time-measurement update mechanism.
0
2
4
6
8
10
12
14
0 2 4 6 8 10 12 14
RM
SE
Hour of Day
RMSE (Reg) RMSE (KF)
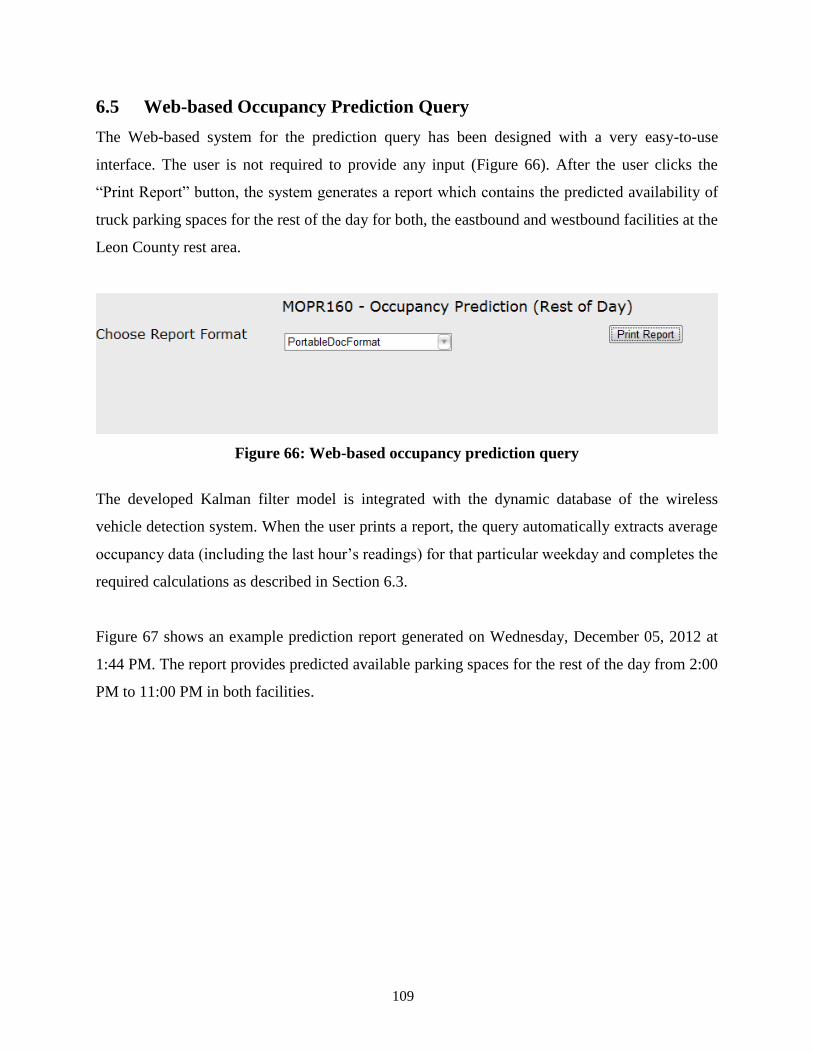
109
6.5 Web-based Occupancy Prediction Query
The Web-based system for the prediction query has been designed with a very easy-to-use
interface. The user is not required to provide any input (Figure 66). After the user clicks the
“Print Report” button, the system generates a report which contains the predicted availability of
truck parking spaces for the rest of the day for both, the eastbound and westbound facilities at the
Leon County rest area.
Figure 66: Web-based occupancy prediction query
The developed Kalman filter model is integrated with the dynamic database of the wireless
vehicle detection system. When the user prints a report, the query automatically extracts average
occupancy data (including the last hour’s readings) for that particular weekday and completes the
required calculations as described in Section 6.3.
Figure 67 shows an example prediction report generated on Wednesday, December 05, 2012 at
1:44 PM. The report provides predicted available parking spaces for the rest of the day from 2:00
PM to 11:00 PM in both facilities.

110
Figure 67: Occupancy prediction report (example)

111
CONCLUSIONS
7.1 Summary
This research sought to understand the truck parking problem in Florida, determine the supply
and demand characteristics for commercial truck parking, assess technology that can be used to
improve parking management, and conduct a pilot project for a smart truck parking management
to increase operational efficiency of commercial drivers and reduce trucks parking on shoulders,
crashes due to driver fatigue, and unnecessary diesel emissions. The major objectives of this
research included: i) Phase-1: to determine trends for truck parking at rest areas and weigh
stations throughout Florida and ii) Phase-2: to develop a suitable smart parking management
system for commercial motor vehicles and conduct a pilot project.
The specific objectives of Phase-1 included: (i) to determine the supply characteristics of
commercial truck parking facilities along interstate highways in Florida; (ii) to determine the
demand characteristics of commercial truck parking facilities along interstate highways in
Florida; (iii) to determine facilities that are being used and to what capacity; and (iv) to
determine current shortfalls in the supply of commercial truck parking spaces along interstate
highways in Florida. Phase-1 involved collection of field observation data by the research team
at all of the public rest areas along the I-10, I-75, and I-95 corridors. The data collection efforts
in Phase-1 enabled the research team to determine the level of truck parking capacity problem
experienced at each rest area. This information was used to divide the rest areas into three
categories, low, medium, and high, based on the “level of truck parking capacity problem,” and
depicted the rest areas on a color-coded map for I-10, I-75, and I-95; green was used for a low
parking capacity problem, yellow for a medium parking capacity problem, and red for a high
parking capacity problem.
Phase-2 of this research project included an assessment of technology that can be used to
improve truck parking management at rest areas in Florida and deploy a pilot project to test
implementation. The vehicle detection technology chosen for the pilot project at the Leon
County rest areas (eastbound and westbound) on I-10 features wireless ground sensors, which

112
detect the presence of a vehicle as it comes to a stop above it. The actual occupancy
determination is accomplished using a unique combination of differential magnetic induction
measuring with a built-in infrared sensor. This combination technology allows the sensors to
accurately determine the presence of a high-clearance truck chassis without confusing it with
another vehicle parked in an adjacent space. The sensors are communicating through a network
of wireless mesh repeaters, which relay information to data collectors on the premises. The data
collectors in turn are connected to a central database via the Internet. Informational maps,
historical data reports, and a number of other applications can be accessed by the user, along
with other shared data platforms and devices, such as smart phones.
Over the course of this research, various software tools were developed to complement the
wireless vehicle detection system described above, including a GIS mapping application, a report
generation module, and an occupancy prediction model. The GIS mapping application developed
for the pilot project represents an easy to read site map that offers a real-time feed of the sites’
truck parking information. The report generation module offers immediate access to historical
truck parking data collected from the truck parking facilities. The occupancy prediction model
utilizes the Kalman filter to provide the user with a prediction of available parking spaces at a
specified date and time provided by the user.
7.2 Advantages of the Tested Wireless Vehicle Detection System
The wireless vehicle detection system tested over the course of this research has a number of
benefits over other competing technologies, such as video cameras, vehicle entry/exit counters,
etc.:
Significantly lower capital and maintenance costs.
Improved accuracy.
Increased reliability.

113
7.3 Recommendations for Future Research
Better Utilization of Weigh Stations for Nighttime Truck Parking
One of the observations of the research team in Phase-1 of the project is that the truck
drivers are hesitant to use weigh stations for nighttime truck parking. Better utilization of
weigh stations for nighttime truck parking could be an immediate improvement to dealing
with truck parking demands in Florida. The objective of further research would be (i) to
determine the reasons as to why truck drivers are not willing to use weigh stations for
nighttime parking and (ii) to develop recommendations for FDOT to address this
problem.
Pilot Study to Develop a Comprehensive Truck Stop Database in Florida
Evidence shows that most of the spaces available for trucks are located in private truck
stops. In many cases, truck drivers could benefit from accurate information regarding the
location of private truck stops in addition to public rest areas. The objective of further
research would be to identify a pilot project area in Florida (e.g., one of the segments
identified in Phase-1 of the study to include rest areas with significant truck parking
capacity problems) and develop a “truckers’ map/guide” that identifies the location of
both public rest areas and private truck stops in the pilot study area. If successful, this
study could be implemented statewide to develop a comprehensive database of public and
private truck stops in Florida.
Evaluation of Public-Private Partnerships Opportunities for Florida’s Rest Areas
and Truck Stops
FDOT could potentially fund the cost of rest area maintenance and operations and/or
increase truck parking capacity by entering into a public-private partnership (PPP)
contract with the private sector. The objective of further research would be to identify
successful PPP cases in other states with respect to rest areas and truck stops. This would
be done through a thorough review of published literature (DOT reports; news article,
academic publications, etc.) as well survey of relevant DOT personnel and private
companies to gather further information regarding successful partnerships that are

114
currently underway. Also, PPP cases in states such as Utah, Virginia, California, Georgia,
and Connecticut would be studied and different forms of PPP agreements for rest areas
would be identified. The research team would then identify potential PPP opportunities
for rest areas in Florida based on the synthesis discussed above and the research team’s
own experience from Phase-1 of this research.

115
REFERENCES
Adams, D. and Reierson J. (1981). “Safety Rest Areas: Planning, Location and Design.” In
Transportation Research Record: Journal of the Transportation Research Board, No. 822, Transportation
Research Board of the National Academies, Washington, D.C., 1981, pp. 1-6.
Antoniou, C., Koutsopoulos, H.N., and Yannis, G. (2007). “An efficient non-linear Kalman filtering
algorithm using simultaneous perturbation and applications in traffic estimation and prediction.”
Proceedings of the 2007 IEEE Intelligent Transportation Systems Conference Seattle, WA, USA, Sept. 30
- Oct. 3, 2007, pp. 217-222.
Al-Kaisy A., Church B., Veneziano D., and Dorrington C. (2010). “Investigation of Parking Dwell Time
at Rest Areas on Rural Highways”, Transportation Research Board 90th Annual Meeting January 23-27,
2011.
ATRI, (1996). “Commercial Driver Rest and Parking Requirements: Making Space for Safety.” U.S.
Department of Transportation Federal Highway Administration. Report No. FHWA-MC 96-0010. May
1996.
<http://www.fhwa.dot.gov/publications/research/safety/commercial.pdf>(October 2012).
Banerjee I., Lee, J.H., Jang, K., Pande, S. and Ragland, D. (2009). “Rest Areas – Reducing Accidents
Involving Driver Fatigue.” Report No: CA 09/1092, Prepared for CALTRANS.
<http://cdm16255.contentdm.oclc.org/cdm/singleitem/collection/p266401coll4/id/4711/rec/11> (October
2012).
Byrne, B. (1991). “Usage of Three Rest Areas in Vermont.” In Transportation Research Record: Journal
of the Transportation Research Board No. 1326, Transportation Research Board of the National
Academies, Washington D.C., 1991, pp. 6-10.
Cambridge Systematics, Inc. (CS). (2007). Florida Statewide Freight and Goods Mobility Plan.
Report prepared for Florida Department of Transportation, Seaport Office, Cambridge Systematics, Inc.,
Fort Lauderdale, Florida, USA, June 2007.
Chen, R., and J.S. Liu. (2000). “Mixture Kalman Filters.” Journal of Royal Statistical Society Series-B
Statistical Methodology, 62 (Part 3): 493-508.
Connecticut DOT. (2008). “CT Statewide Rest Area and Service Plaza Study- Volume I – Administrative
Report – Recommended Improvement Program” CONN DOT Project No. 170-2533.
< http://www.ct.gov/dot/lib/dot/documents/dpolicy/restarea/master_voli.pdf> (October 2012).
Esme, B. (2009). “Kalman Filter for Dummies-A Mathematically Challenged Man's Search for Scientific
Wisdom.” <http://bilgin.esme.org/BitsBytes/KalmanFilterforDummies.aspx> (October 2012).
Fleger, S., Haas, R. Trombly, J., Cros III, R., Noltenius, J., Pecheux, K., and Chen, K. (2002). “Study of
Adequacy of Commercial Truck Parking Facilities – Technical Report.” FHWA-RD-01-158, March 2002.
FMSCA. (2007). “SmartPark Real-Time Parking Information for Truckers”
<http://www.fmcsa.dot.gov/facts-research/art-technology-SmartPark-Real-Time.htm> (September 2012).
116
Gårder P.E. and Bosonetto N. (2002). “Quantifying roadside rest area usage.” Report No: NETCR 38,
Project No. 99-4, Prepared for New England Transportation consortium (NETC)
< http://docs.trb.org/00941461.pdf> (September 2012).
Gates J.T., Savolainen P.T., Datta T.K., Ryan G., Todd R.G. and Boileau S. (2012) “Evaluating the
Appropriate Level of Service for Michigan Rest Areas and Welcome Centers Considering Safety and
Economic Factors.” Report No. RC-1570, Prepared for MDOT.
< http://www.michigan.gov/documents/mdot/MDOT_Research_Report_RC1570_387400_7.pdf>
(September 2012).
Havinoviski, G.N., Taylor, R.V., Johnston, A., and Kopp, J.C. (2000). Real-time parking management
systems for park-and-ride facilities along transit corridors. In Intelligent Transportation Systems America
Proceedings (10th Washington, D.C) 2000. pp16
King, G.F. (1989). “Evaluation of Safety Roadside Rest Areas.” National Cooperative Highway Research
Program Report 324, December 1989.
Klette, R. (2006). “The Kalman Filter.” Course notes, Subject MI37, course note
<http://www.cs.auckland.ac.nz/~rklette/TeachAuckland.html/mm/MI37slides.pdf> (October 2012).
Maybeck, P.S. (1979). Stochastic models, estimation, and control, volume 1, chapter 1, Introduction,
pp.1-16. Academic Press.
Melton, W., A. Tran and J. Leverson (1989). “Rest Area Usage Design Criteria Update.” Washington
State Department of Transportation, Olympia, Washington, January 1989.
MnDOT. (1998). “Commercial Truck Usage Nighttime Parking Demand Analysis February 1995-
October 1998”
<http://www.dot.state.mn.us/restareas/pdf/research/nightime-parking-demand.pdf> (October 2012).
MnDOT. (2001). “Nighttime Commercial Vehicle Parking Demand at 15 high-Use Minnesota Rest
Areas.” < http://www.dot.state.mn.us/restareas/pdf/research/nighttime-parking-demand-15sites.pdf>
(October 2012).
National Cooperative Highway Research Program (NCHRP) Synthesis 317. (2003). “Dealing with Truck
Parking Demands.” Transportation Research Board, Washington, D.C., 2003.
Nebraska Department of Roads. (1987). “Nebraska Safety Rest Area Study Number 4.” Nebraska
Department of Roads, Lincoln, Nebraska, 1987.
North Jersey Transportation Planning authority. (2008). “An assessment of potential locations for truck
rest areas in Northern New Jersey and the Port district.” <
http://www.njtpa.org/plan/element/freight/documents/truckstop.pdf> (September 2012).
Perfater, Michael A. (1989). “Operation and Motorist Usage of Interstate Rest Areas and Welcome
Centers in Virginia. In Transportation Research Record: Journal of the Transportation Research Board
No. 1224, Transportation Research Board of the National Academies, Washington D.C., 1989, pp. 46-53.
Smith S.B., Baron W., Gay K. and Ritter G. (2005). “Intelligent Transportation Systems and Truck
Parking” Federal Motor Carrier Safety Administration, Report no. FMCSA-RT-05-001

117
<http://www.fmcsa.dot.gov/facts-research/briefs/intelligent-transportation-truckparking.pdf> (September
2012).
Tampère, C.M.J. and Immers, L.H. (2007). “An Extended Kalman Filter Application for Traffic State
Estimation Using CTM with Implicit Mode Switching and Dynamic Parameters.” Intelligent
Transportation Systems Conference (ITSC 2007), IEEE, Sept. 30 2007-Oct. 3 2007, PP 209-216.
Twardzik, L. and Haskell, T. (1985). “Rest Area/Roadside Park Administration, Use and Operations.
Michigan State University, Lansing, Michigan, June 1985.
U.S. Department of Transportation (DOT). (2000). Federal Motor Carrier Safety Administration. 49 CFR
Parts 350,et al. Hours of Service of Drivers; Driver Rest and Sleep for Safe Operations; Proposed Rule.
Federal Register, National Archives and Records Administration, Washington, D.C., May 2,
2000.
Veeraraghavan, H., Schrater, P., and Papanikolopoulos, N. (2005). “Switching Kalman Filter-Based
Approach for Tracking and Event Detection at Traffic Intersections.” Proceedings of the 13th
Mediterranean Conference on Control and Automation Limassol, Cyprus, June 27-29, 2005, pp 1167-
1172.
Welch, G., and Bishop, G. (2006). "An introduction to the Kalman Filter.” Course notes 8, University of
North Carolina at Chapel Hill, Department of Computer Science.
<http://www.cs.unc.edu/~welch/media/pdf/kalman_intro.pdf> (October 2012).

118
APPENDIX A
Technical Specifications for Mesh Network Components
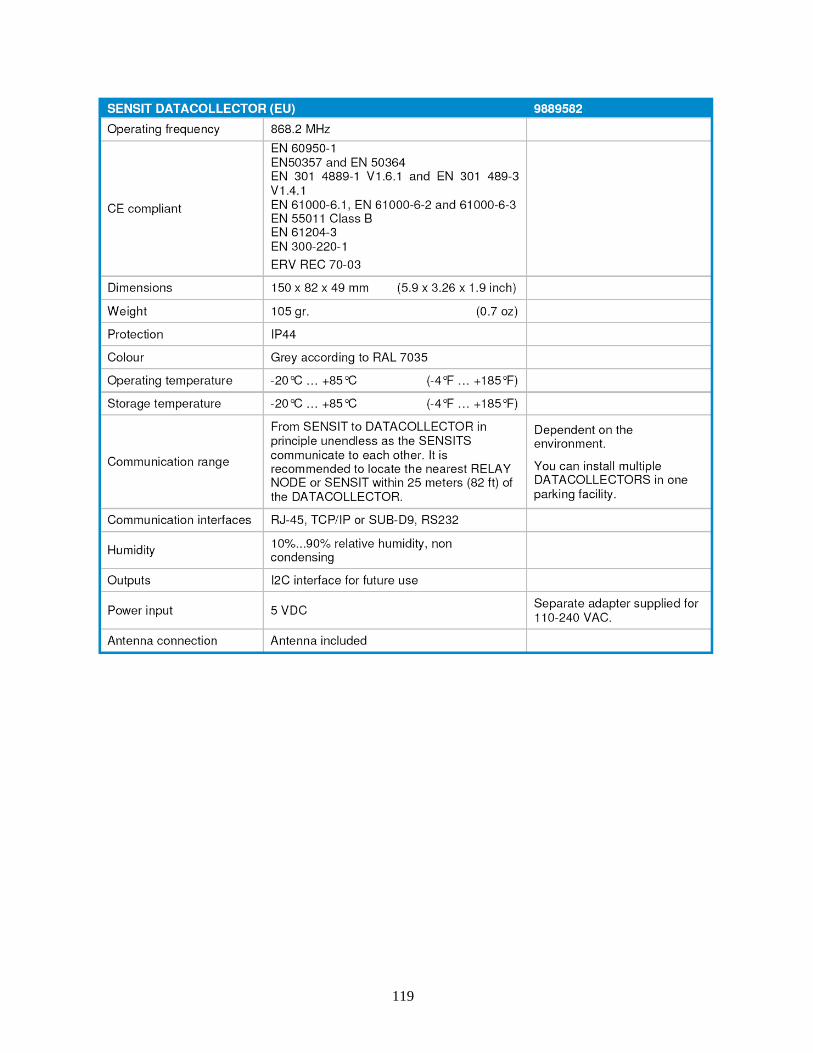
119
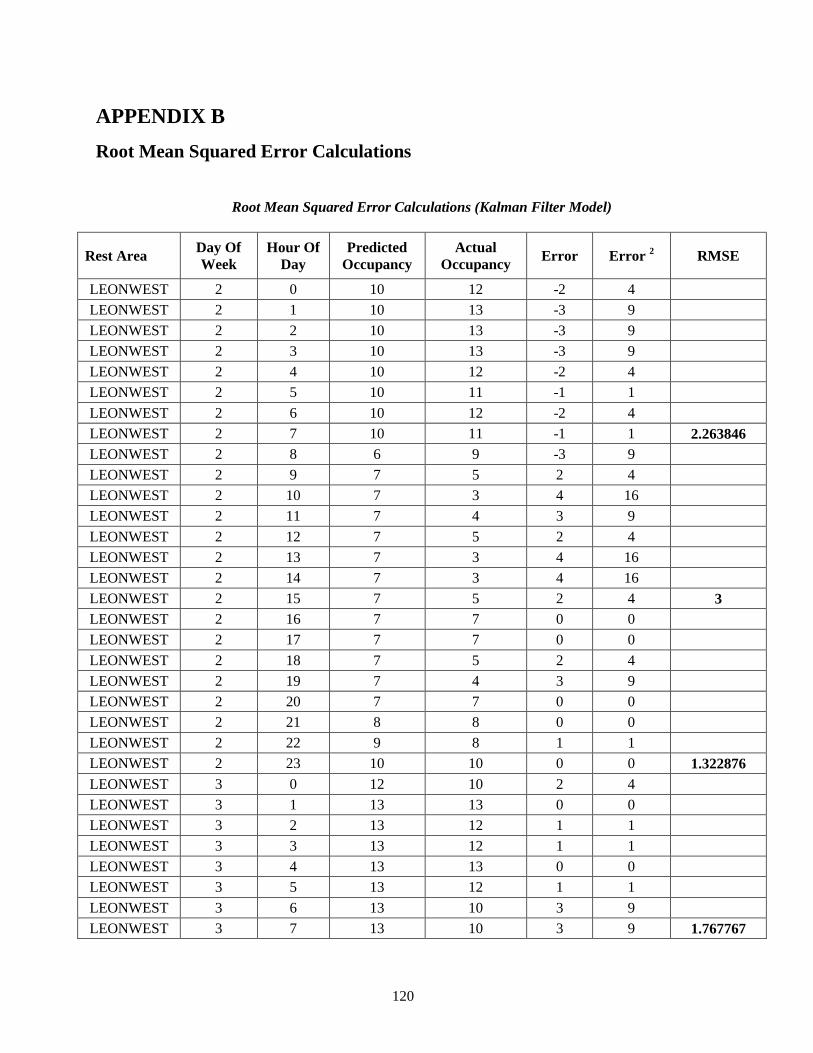
120
APPENDIX B
Root Mean Squared Error Calculations
Root Mean Squared Error Calculations (Kalman Filter Model)
Rest Area Day Of
Week
Hour Of
Day
Predicted
Occupancy
Actual
Occupancy Error Error
2 RMSE
LEONWEST 2 0 10 12 -2 4
LEONWEST 2 1 10 13 -3 9
LEONWEST 2 2 10 13 -3 9
LEONWEST 2 3 10 13 -3 9
LEONWEST 2 4 10 12 -2 4
LEONWEST 2 5 10 11 -1 1
LEONWEST 2 6 10 12 -2 4
LEONWEST 2 7 10 11 -1 1 2.263846
LEONWEST 2 8 6 9 -3 9
LEONWEST 2 9 7 5 2 4
LEONWEST 2 10 7 3 4 16
LEONWEST 2 11 7 4 3 9
LEONWEST 2 12 7 5 2 4
LEONWEST 2 13 7 3 4 16
LEONWEST 2 14 7 3 4 16
LEONWEST 2 15 7 5 2 4 3
LEONWEST 2 16 7 7 0 0
LEONWEST 2 17 7 7 0 0
LEONWEST 2 18 7 5 2 4
LEONWEST 2 19 7 4 3 9
LEONWEST 2 20 7 7 0 0
LEONWEST 2 21 8 8 0 0
LEONWEST 2 22 9 8 1 1
LEONWEST 2 23 10 10 0 0 1.322876
LEONWEST 3 0 12 10 2 4
LEONWEST 3 1 13 13 0 0
LEONWEST 3 2 13 12 1 1
LEONWEST 3 3 13 12 1 1
LEONWEST 3 4 13 13 0 0
LEONWEST 3 5 13 12 1 1
LEONWEST 3 6 13 10 3 9
LEONWEST 3 7 13 10 3 9 1.767767
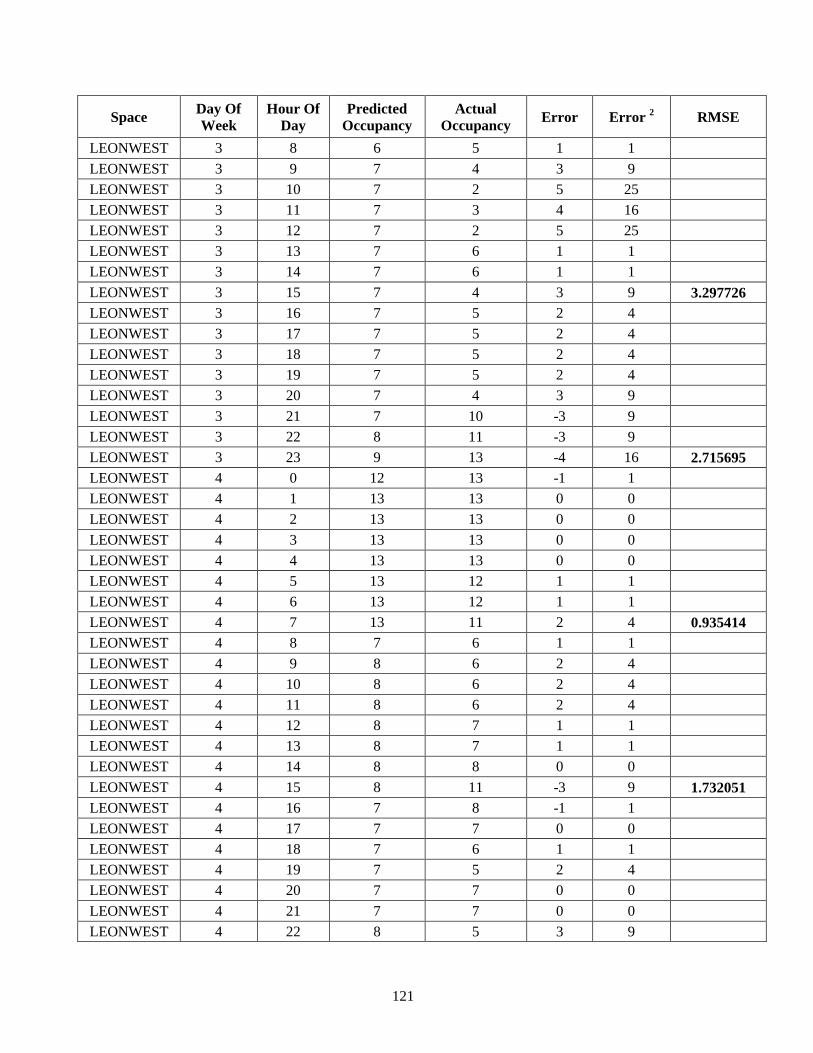
121
Space Day Of
Week
Hour Of
Day
Predicted
Occupancy
Actual
Occupancy Error Error
2 RMSE
LEONWEST 3 8 6 5 1 1
LEONWEST 3 9 7 4 3 9
LEONWEST 3 10 7 2 5 25
LEONWEST 3 11 7 3 4 16
LEONWEST 3 12 7 2 5 25
LEONWEST 3 13 7 6 1 1
LEONWEST 3 14 7 6 1 1
LEONWEST 3 15 7 4 3 9 3.297726
LEONWEST 3 16 7 5 2 4
LEONWEST 3 17 7 5 2 4
LEONWEST 3 18 7 5 2 4
LEONWEST 3 19 7 5 2 4
LEONWEST 3 20 7 4 3 9
LEONWEST 3 21 7 10 -3 9
LEONWEST 3 22 8 11 -3 9
LEONWEST 3 23 9 13 -4 16 2.715695
LEONWEST 4 0 12 13 -1 1
LEONWEST 4 1 13 13 0 0
LEONWEST 4 2 13 13 0 0
LEONWEST 4 3 13 13 0 0
LEONWEST 4 4 13 13 0 0
LEONWEST 4 5 13 12 1 1
LEONWEST 4 6 13 12 1 1
LEONWEST 4 7 13 11 2 4 0.935414
LEONWEST 4 8 7 6 1 1
LEONWEST 4 9 8 6 2 4
LEONWEST 4 10 8 6 2 4
LEONWEST 4 11 8 6 2 4
LEONWEST 4 12 8 7 1 1
LEONWEST 4 13 8 7 1 1
LEONWEST 4 14 8 8 0 0
LEONWEST 4 15 8 11 -3 9 1.732051
LEONWEST 4 16 7 8 -1 1
LEONWEST 4 17 7 7 0 0
LEONWEST 4 18 7 6 1 1
LEONWEST 4 19 7 5 2 4
LEONWEST 4 20 7 7 0 0
LEONWEST 4 21 7 7 0 0
LEONWEST 4 22 8 5 3 9
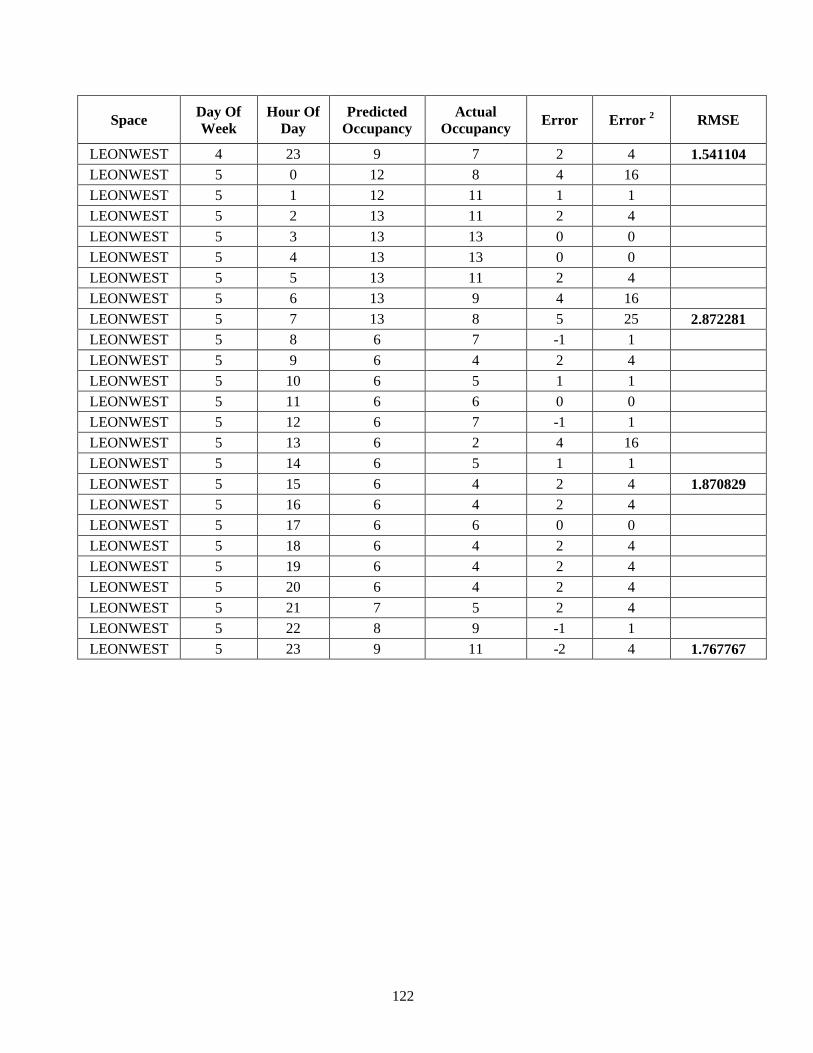
122
Space Day Of
Week
Hour Of
Day
Predicted
Occupancy
Actual
Occupancy Error Error
2 RMSE
LEONWEST 4 23 9 7 2 4 1.541104
LEONWEST 5 0 12 8 4 16
LEONWEST 5 1 12 11 1 1
LEONWEST 5 2 13 11 2 4
LEONWEST 5 3 13 13 0 0
LEONWEST 5 4 13 13 0 0
LEONWEST 5 5 13 11 2 4
LEONWEST 5 6 13 9 4 16
LEONWEST 5 7 13 8 5 25 2.872281
LEONWEST 5 8 6 7 -1 1
LEONWEST 5 9 6 4 2 4
LEONWEST 5 10 6 5 1 1
LEONWEST 5 11 6 6 0 0
LEONWEST 5 12 6 7 -1 1
LEONWEST 5 13 6 2 4 16
LEONWEST 5 14 6 5 1 1
LEONWEST 5 15 6 4 2 4 1.870829
LEONWEST 5 16 6 4 2 4
LEONWEST 5 17 6 6 0 0
LEONWEST 5 18 6 4 2 4
LEONWEST 5 19 6 4 2 4
LEONWEST 5 20 6 4 2 4
LEONWEST 5 21 7 5 2 4
LEONWEST 5 22 8 9 -1 1
LEONWEST 5 23 9 11 -2 4 1.767767
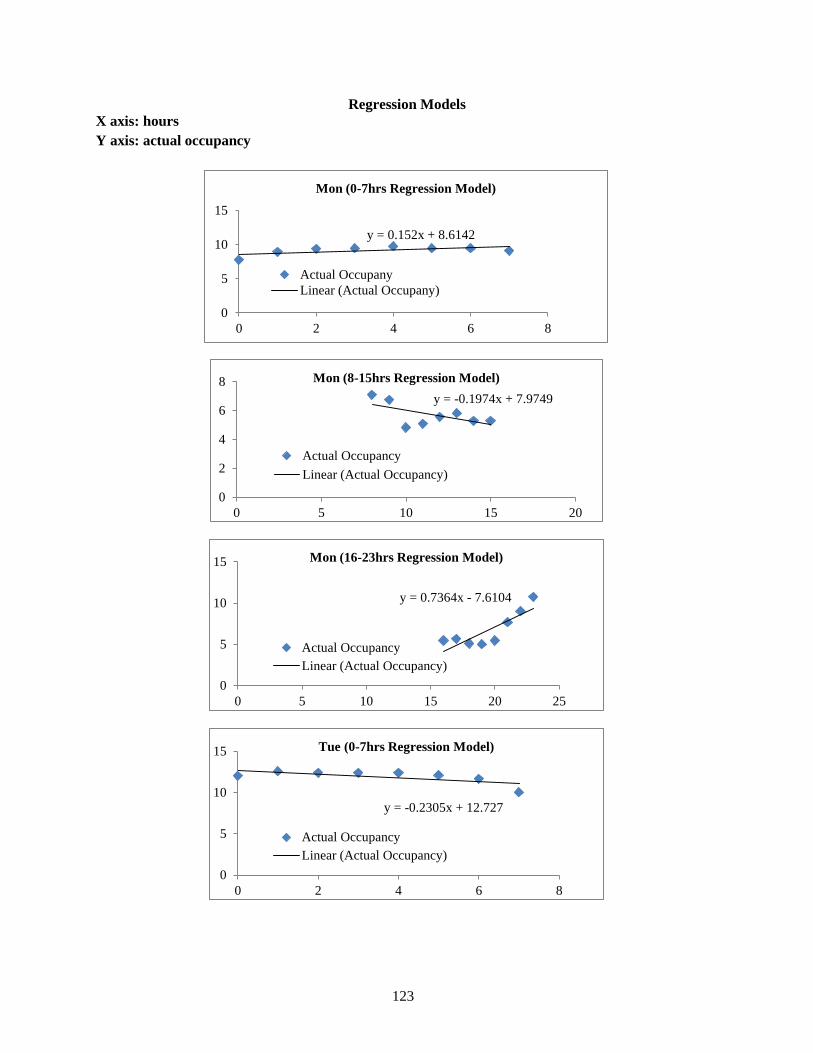
123
Regression Models
X axis: hours
Y axis: actual occupancy
y = 0.152x + 8.6142
0
5
10
15
0 2 4 6 8
Mon (0-7hrs Regression Model)
Actual Occupany
Linear (Actual Occupany)
y = -0.1974x + 7.9749
0
2
4
6
8
0 5 10 15 20
Mon (8-15hrs Regression Model)
Actual Occupancy
Linear (Actual Occupancy)
y = 0.7364x - 7.6104
0
5
10
15
0 5 10 15 20 25
Mon (16-23hrs Regression Model)
Actual Occupancy
Linear (Actual Occupancy)
y = -0.2305x + 12.727
0
5
10
15
0 2 4 6 8
Tue (0-7hrs Regression Model)
Actual Occupancy
Linear (Actual Occupancy)
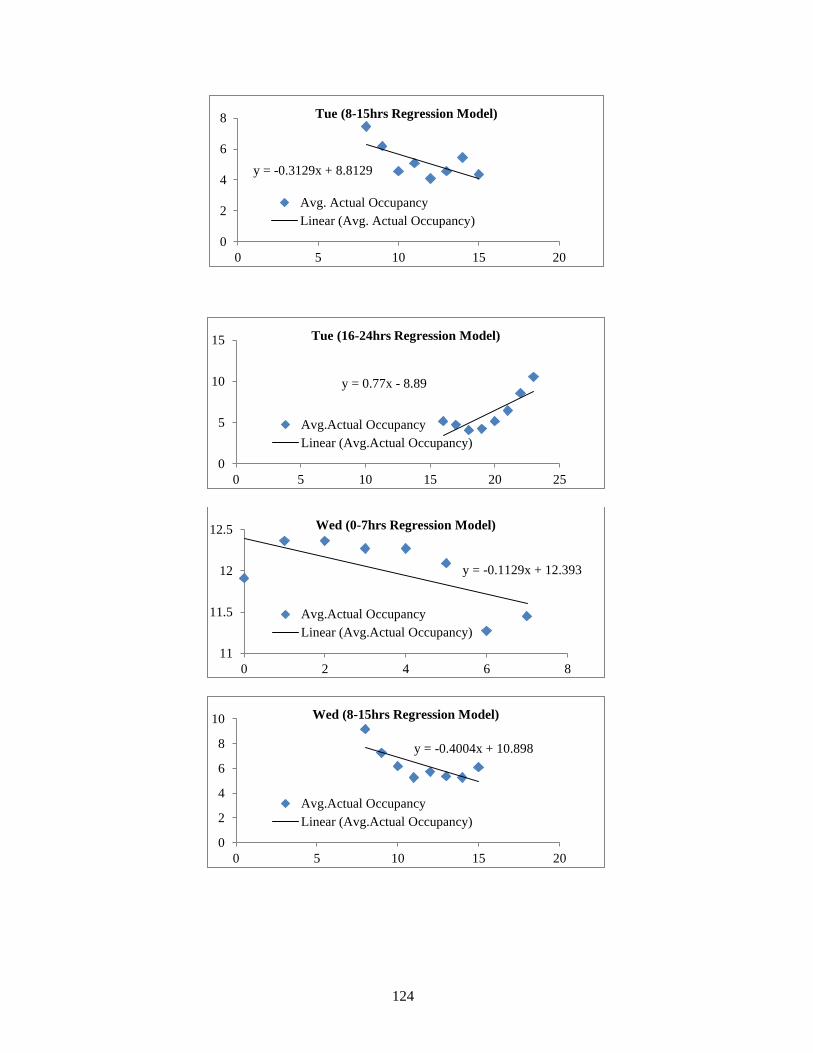
124
y = -0.3129x + 8.8129
0
2
4
6
8
0 5 10 15 20
Tue (8-15hrs Regression Model)
Avg. Actual Occupancy
Linear (Avg. Actual Occupancy)
y = 0.77x - 8.89
0
5
10
15
0 5 10 15 20 25
Tue (16-24hrs Regression Model)
Avg.Actual Occupancy
Linear (Avg.Actual Occupancy)
y = -0.1129x + 12.393
11
11.5
12
12.5
0 2 4 6 8
Wed (0-7hrs Regression Model)
Avg.Actual Occupancy
Linear (Avg.Actual Occupancy)
y = -0.4004x + 10.898
0
2
4
6
8
10
0 5 10 15 20
Wed (8-15hrs Regression Model)
Avg.Actual Occupancy
Linear (Avg.Actual Occupancy)

125
y = 0.7074x - 7.4764
0
5
10
15
0 5 10 15 20 25
Wed (16-23hrs Regression Model)
Avg.Actual Occupancy
Linear (Avg.Actual Occupancy)
y = -0.1375x + 12.198
0
5
10
15
0 2 4 6 8
Thu (0-7hrs Regression Model)
Avg.Actual Occupancy
Linear (Avg.Actual Occupancy)
y = -0.2076x + 7.7751
0
2
4
6
8
10
0 5 10 15 20
Thu (8-15hrs Regression Model)
Avg.Actual Occupancy
Linear (Avg.Actual Occupancy)
y = 0.4902x - 3.6396
0
2
4
6
8
10
0 5 10 15 20 25
Thu (16-23hrs Regression Model)
Avg.Actual Occupancy
Linear (Avg.Actual Occupancy)
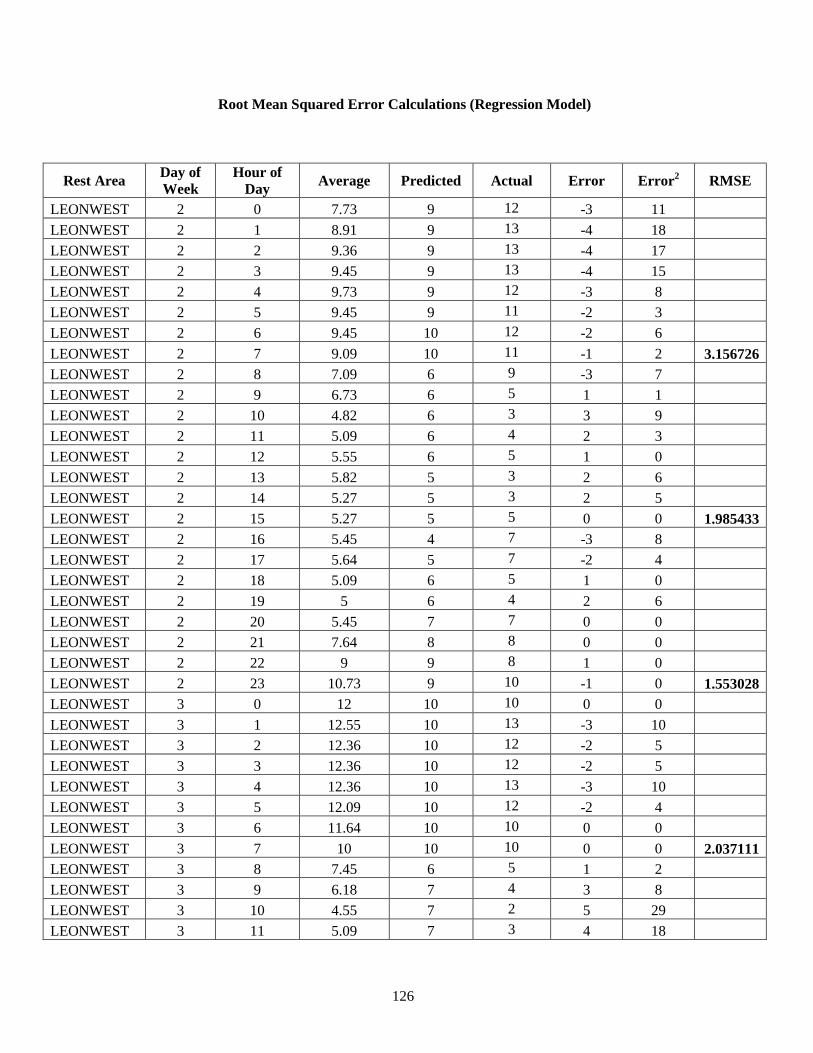
126
Root Mean Squared Error Calculations (Regression Model)
Rest Area Day of
Week
Hour of
Day Average Predicted Actual Error Error
2 RMSE
LEONWEST 2 0 7.73 9 12 -3 11
LEONWEST 2 1 8.91 9 13 -4 18
LEONWEST 2 2 9.36 9 13 -4 17
LEONWEST 2 3 9.45 9 13 -4 15
LEONWEST 2 4 9.73 9 12 -3 8
LEONWEST 2 5 9.45 9 11 -2 3
LEONWEST 2 6 9.45 10 12 -2 6
LEONWEST 2 7 9.09 10 11 -1 2 3.156726
LEONWEST 2 8 7.09 6 9 -3 7
LEONWEST 2 9 6.73 6 5 1 1
LEONWEST 2 10 4.82 6 3 3 9
LEONWEST 2 11 5.09 6 4 2 3
LEONWEST 2 12 5.55 6 5 1 0
LEONWEST 2 13 5.82 5 3 2 6
LEONWEST 2 14 5.27 5 3 2 5
LEONWEST 2 15 5.27 5 5 0 0 1.985433
LEONWEST 2 16 5.45 4 7 -3 8
LEONWEST 2 17 5.64 5 7 -2 4
LEONWEST 2 18 5.09 6 5 1 0
LEONWEST 2 19 5 6 4 2 6
LEONWEST 2 20 5.45 7 7 0 0
LEONWEST 2 21 7.64 8 8 0 0
LEONWEST 2 22 9 9 8 1 0
LEONWEST 2 23 10.73 9 10 -1 0 1.553028
LEONWEST 3 0 12 10 10 0 0
LEONWEST 3 1 12.55 10 13 -3 10
LEONWEST 3 2 12.36 10 12 -2 5
LEONWEST 3 3 12.36 10 12 -2 5
LEONWEST 3 4 12.36 10 13 -3 10
LEONWEST 3 5 12.09 10 12 -2 4
LEONWEST 3 6 11.64 10 10 0 0
LEONWEST 3 7 10 10 10 0 0 2.037111
LEONWEST 3 8 7.45 6 5 1 2
LEONWEST 3 9 6.18 7 4 3 8
LEONWEST 3 10 4.55 7 2 5 29
LEONWEST 3 11 5.09 7 3 4 18

127
Space Day of
Week
Hour of
Day Average Predicted Actual Error Error
2 RMSE
LEONWEST 3 12 4.09 8 2 6 31
LEONWEST 3 13 4.55 7 6 1 2
LEONWEST 3 14 5.45 7 6 1 1
LEONWEST 3 15 4.36 7 4 3 12 3.588259
LEONWEST 3 16 5.18 -5 5 -10 98
LEONWEST 3 17 4.73 -5 5 -10 105
LEONWEST 3 18 4.09 -6 5 -11 115
LEONWEST 3 19 4.27 -6 5 -11 112
LEONWEST 3 20 5.18 -5 4 -9 79
LEONWEST 3 21 6.45 -4 10 -14 194
LEONWEST 3 22 8.55 -2 11 -13 177
LEONWEST 3 23 10.55 -1 13 -14 190 11.56775
LEONWEST 4 0 11.91 11 13 -2 4
LEONWEST 4 1 12.36 11 13 -2 4
LEONWEST 4 2 12.36 11 13 -2 4
LEONWEST 4 3 12.27 11 13 -2 4
LEONWEST 4 4 12.27 11 13 -2 4
LEONWEST 4 5 12.09 11 12 -1 1
LEONWEST 4 6 11.27 11 12 -1 1
LEONWEST 4 7 11.45 11 11 0 0 1.639166
LEONWEST 4 8 9.18 7 6 1 1
LEONWEST 4 9 7.27 8 6 2 4
LEONWEST 4 10 6.18 8 6 2 6
LEONWEST 4 11 5.27 9 6 3 8
LEONWEST 4 12 5.73 9 7 2 3
LEONWEST 4 13 5.36 9 7 2 3
LEONWEST 4 14 5.27 9 8 1 1
LEONWEST 4 15 6.09 8 11 -3 6 1.993863
LEONWEST 4 16 5.36 -4 8 -12 137
LEONWEST 4 17 4.55 -4 7 -11 127
LEONWEST 4 18 5.18 -4 6 -10 96
LEONWEST 4 19 4.82 -4 5 -9 82
LEONWEST 4 20 5.09 -4 7 -11 118
LEONWEST 4 21 6.82 -3 7 -10 93
LEONWEST 4 22 8.27 -2 5 -7 44
LEONWEST 4 23 10.45 0 7 -7 50 9.66491
LEONWEST 5 0 11.27 11 8 3 7
LEONWEST 5 1 11.91 11 11 0 0
LEONWEST 5 2 12.18 11 11 0 0
LEONWEST 5 3 12.55 10 13 -3 6
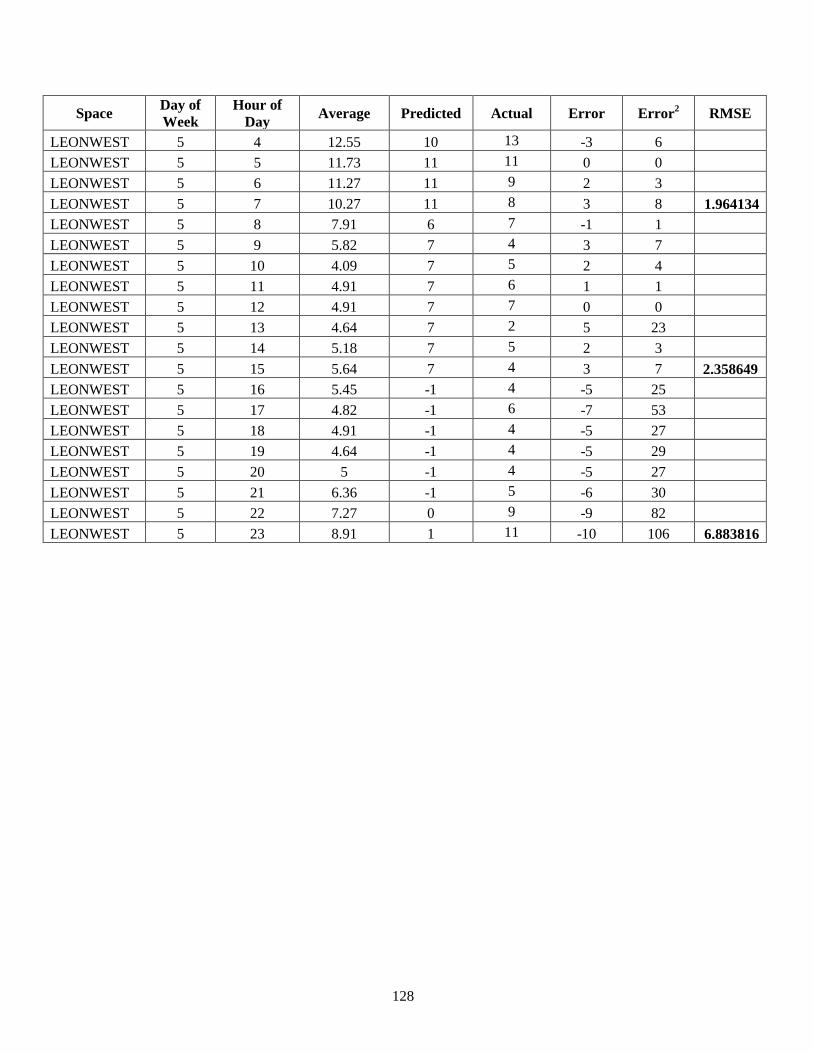
128
Space Day of
Week
Hour of
Day Average Predicted Actual Error Error
2 RMSE
LEONWEST 5 4 12.55 10 13 -3 6
LEONWEST 5 5 11.73 11 11 0 0
LEONWEST 5 6 11.27 11 9 2 3
LEONWEST 5 7 10.27 11 8 3 8 1.964134
LEONWEST 5 8 7.91 6 7 -1 1
LEONWEST 5 9 5.82 7 4 3 7
LEONWEST 5 10 4.09 7 5 2 4
LEONWEST 5 11 4.91 7 6 1 1
LEONWEST 5 12 4.91 7 7 0 0
LEONWEST 5 13 4.64 7 2 5 23
LEONWEST 5 14 5.18 7 5 2 3
LEONWEST 5 15 5.64 7 4 3 7 2.358649
LEONWEST 5 16 5.45 -1 4 -5 25
LEONWEST 5 17 4.82 -1 6 -7 53
LEONWEST 5 18 4.91 -1 4 -5 27
LEONWEST 5 19 4.64 -1 4 -5 29
LEONWEST 5 20 5 -1 4 -5 27
LEONWEST 5 21 6.36 -1 5 -6 30
LEONWEST 5 22 7.27 0 9 -9 82
LEONWEST 5 23 8.91 1 11 -10 106 6.883816