commercial real estate competitiveness study
TRANSCRIPT

Commercial Real Estate Competitiveness Study
Prepared for New York City Economic Development Corporation
December 2013

Page 1
TABLE OF CONTENTS
Executive Summary ........................................................................................................ 2
New York City Office Market ........................................................................................... 5
Introduction .................................................................................................................. 5
Key Definitions ............................................................................................................. 6
Office Space Demand ..................................................................................................... 7
Recent Trends in Office Space Demand and Usage ................................................... 7
High-Growth Industries: Overview ............................................................................... 9
High-Growth Industries: Projected Office Space Demand ......................................... 13
Office Space Preferences of HGI Tenants ................................................................. 15
Current Central Business Districts and Growing Sub-markets ................................... 18
Demand, Supply, and Gap Forecast ............................................................................. 22
High-Growth Industries Demand ................................................................................ 22
Class B and C Office Supply ...................................................................................... 24
Gap Forecast and Analysis ........................................................................................ 28
Peer City Analysis ......................................................................................................... 33
Policy Implications ......................................................................................................... 38
Appendices ................................................................................................................... 40
Methodology .............................................................................................................. 40
Survey Results ........................................................................................................... 45

Page 2
EXECUTIVE SUMMARY
Introduction
The New York City economy has evolved significantly over the last decade. This shift is a result of both
structural changes and the specific efforts of the Bloomberg Administration to diversify New York City‟s
economy. In particular, the Administration‟s investments in supporting entrepreneurship, developing a
talented workforce, and improving the quality of life for New Yorkers have translated in more and diverse
high growth firms starting and staying in New York City. These changes carry important implications for
the current and future local commercial real estate market: as the demand drivers evolve, so too must the
stock of commercial office space.
While financial institutions and professional services firms continue to comprise the largest share of the
New York City commercial office leasing market, high-tech and other high-growth industries (together,
“HGI”) have emerged as increasingly powerful drivers of office-using employment and commercial office
space demand. In 2012, information, media, and tech accounted for 25 percent of leasing activity, up
from 9 percent a decade earlier; by contrast, financial services accounted for only 16 percent, down from
25 percent a decade earlier. This sectoral shift has implications for the types of space that will
increasingly be required to attract and retain the firms that are creating jobs and advancing the city‟s
economic development.
In December 2012, New York City Economic Development Corporation (“NYCEDC”) engaged Alvarez &
Marsal (“A&M”) and JRT Realty Group (“JRT”) to study the New York City commercial office market in
connection with the changing profile of the city‟s economy. In particular, A&M and JRT considered how
the new generation of high-growth industries could impact the New York City office market through 2025,
and whether the city‟s existing and future supply of office space is likely to meet projected demand.
Ensuring New York City‟s economic competitiveness in the 21st century requires not only the right kind of
human capital but also the correlative commercial infrastructure. This study is intended to advance the
public understanding of (i) the importance of a commercial office space stock that is affordable and
attractive to the firms that will drive future job growth; and (ii) the current, and projected future, state of the
New York City commercial office infrastructure.
Methodology
The Commercial Real Estate Competitiveness Study was conducted by A&M and JRT through a series of
analyses, including performing interviews and surveys with more than 34 New York City real estate

Page 3
market participants. The participants included tenants, owners and developers, technology incubators,
architects, brokers, labor, and construction experts. The market research and data was applied to an
A&M forecast model,1 which projected New York City office space supply and demand between 2013 and
2025 and formed the basis of the Study‟s findings. A&M and JRT presented the model outputs to an
Advisory Group, which also included prominent real estate developers, owners, brokers, construction
managers, labor representatives, lawmakers and HGI tenants in the New York City market.
Key Findings
Supply: Since 2000, New York City‟s supply of B and C office stock has decreased by 1.6 msf.2 The non-
Manhattan boroughs experienced a net gain of 4.7 msf of office stock from 2000 to 2012 as a result of
decay of Class A stock and the adaptive reuse of non-office assets. However, Manhattan‟s Class B and C
office stock decreased by 6.2 msf, primarily due to the conversion of office stock to residential and
hospitality uses.
Demand: HGI firms are projected to demand approximately 17 msf of office space throughout the five
boroughs between 2013 and 2025.3 The 17 msf accounts for 60 percent of projected incremental growth
in total office space demand between 2013 and 2025. HGI tenants demand space in close proximity to
transportation, social amenities, clients, investors and residential neighborhoods and can generally afford
rents below $40/sf in 2013 dollars.This kind of office stock can be found in the city‟s current central
business districts – Midtown Manhattan, Midtown South, Lower Manhattan, Downtown Brooklyn4 and
Long Island City, Queens. HGI firms demand office space with physical attributes that reflect their culture
and contribute to their ability to attract and retain clients and talent. This combination of pricing and
physical attributes generally aligns with the characteristics of Class B and Class C buildings in New York
City. This differs from traditional office users, who generally demand Class A space and can afford rents
above $40/sf.
Gap: Class B and C office stock in New York City is projected to decrease further by 7.8 msf between
2013 and 2025.5 This reduction is due to the conversion of existing space into residential, the high cost to
develop commercial space, and incongruities between the required leasing terms of tenants and owners.
Class B and C office space is likely to continue to be converted to residential product due to the higher
1 The A&M model forecasted office space demand based on office-using employment growth between
2012 and 2025. The location of the employment growth reflects A&M‟s primary market research which was gathered through interviews and surveys with HGI firms and New York City real estate participants. 2 CoStar/C&W market fundamentals data as of 4Q2012
3 A&M forecast model dated 3Q2013
4 For purposes of this study, Downtown Brooklyn includes the Dumbo and N. Brooklyn submarkets
5 A&M forecast model dated 3Q2013

Page 4
potential financial return. New stock is unlikely to be added as rental rates achievable for Class B and C
do not justify the high costs of development. The combination of increasing demand for Class B and C
space that is affordable to HGI firms and the continuing decline of B and C office stock will create a gap
beginning in 2018, as shown in Figure 1 - NYC Class B and C Office Space Supply and Demand,
2002 to 2025. As the gap increases, office rental rates may rise and HGI firms may have fewer affordable
options for New York City office locations and may have to consider alternative office markets.
Figure 1 - NYC Class B and C Office Space Supply and Demand, 2002 to 2025
Other cities, in the US and abroad, are also facing this challenge. While a full consideration of their efforts
in response is beyond the scope of this study, a brief enumeration of some examples is included (e.g.,
regulatory and tax policy efforts). As New York City continues to consider and address this issue, some of
these may provide helpful case studies.
205
215
225
235
245
2000 2002 2004 2006 2008 2010 2012 2014 2016 2018 2020 2022 2024
Squ
are
Fe
et
(Mili
on
s)
Supply
Demand
Forecast

Page 5
NEW YORK CITY OFFICE MARKET
Introduction
New York City remains a premiere place to do business.6 It is the nation‟s largest office market,
containing over 490 msf of office space, as seen in Figure 2 - New York City Office Market by
Borough. The market is among the tightest in the nation, with a combined vacancy rate of 9 percent, far
below the nationwide metropolitan market average vacancy of 15 percent.7 The low vacancy contributes
to higher rental rates. The nationwide metropolitan market average asking rent is $26.47 per square foot.8
In New York City, asking rents range from $20 per square foot to above $100 per square foot, with a
majority of the space above $40 per square foot.9
Figure 2 - New York City Office Market by Borough
Key Definitions
Office buildings are typically grouped into one of three categories: Class A, B or C. For purposes of this
Study, office space supply and demand forecasts are organized into these building classes. Building
6 A&M Market Research: Tenant and Broker Survey and Stakeholder Interview findings, January – March
2013. 7 Costar/C&W market fundamentals data as of 4Q2013; CBRE Office Vacancy Index as of April 2, 2013
8 CBRE Office Outlook Program accessed June 19, 2013
9 CoStar, JRT, C&W and CBRE

Page 6
classifications are determined using a combination of factors including rent, age, finish, location and size,
and indicate each building‟s relative desirability in a given market.10
Classifications differ between
Manhattan and the non-Manhattan boroughs. However, the class designations follow the general
principle that Class A buildings are the most prestigious and attractive in a given market and that Class C
buildings tend to be smaller and of lower quality. The following are generally accepted industry definitions
of Class A, B and C office space:11
Class A properties represent the highest quality buildings in their market competing for
premier office users with above-average rents for the area. Buildings have high-quality
standard finishes, amenities and building services, state-of-the-art systems, and
exceptional accessibility. The typical Class A building was built after 1960 and averages
more than 500,000 sf.
Class B properties compete for a wide range of office users with average rents for the
area. Building finishes, amenities and building services are fair to good and systems are
adequate, but the buildings do not compete with Class A at the same price. Most
buildings in this class were built prior to 1960 and range between 100,000 and 500,000
sf.
Class C properties compete for tenants requiring basic, functional space at below
average rents for the area. These buildings are typically the oldest in the market, were
primarily built prior to World War II and average less than 100,000 sf.
10
The Study relies on both CoStar and Cushman & Wakefield‟s building class definitions. 11
C&W report on Manhattan‟s Class B&C Office Space dated October 2006

Page 7
OFFICE SPACE DEMAND
Recent Trends in Office Space Demand and Usage
Over the last decade, there have been shifts in office space usage and in the types of industries driving
leasing activity. A broad range of industries are moving towards more efficient office floor plans.12
Ten
years ago, the average space occupied per worker was approximately 250 square feet.13
Today, the
average space per worker has decreased and ranges from approximately 135 to 240 square feet.14
There
are a range of explanations for this trend including: economic uncertainty; advances in technology that
have reduced tenants‟ need for on-site storage and server rooms; increased opportunities for employees
to work remotely; and the growing practice of office space hoteling in which employees use workspaces
on an as-needed basis.15
Until 2009, Financial Services, Legal Services and Accounting – collectively referred to as Traditional
Office Users (“TOU”) – drove the city‟s office space demand. Today, technology and media sectors are
driving office demand in New York City. Leasing activity, summarized in Figure 3 - New York City
Leasing Activity by Square Feet, illustrates that TOU drove 53 percent of the leasing activity in 2002. In
2012, TOU accounted for only 32 percent of leasing activity, a net 40 percent decrease. By contrast,
Media and Technology industries, which accounted for 9 percent of activity in 2002, accounted for 25
percent in 2012 – a net 177 percent increase.
12
Wymer, D. M. (2011). The Metrics of Distributed Work: Financial and Performance Benefits of an Emerging Work Model. Knoll, Inc. 13
CoStar report “Changing Office Trends Hold Major Implications for Future Office Demand” by Mark Heschmeyer dated March 2013, CBRE Economic Advisors, A&M analysis 14
CoStar report “Changing Office Trends Hold Major Implications for Future Office Demand” by Mark Heschmeyer dated March 2013, CBRE Economic Advisors, A&M analysis 15
A&M Market Research: Tenant and Broker Survey and Stakeholder Interview findings, January – March 2013.

Page 8
Figure 3 - New York City Leasing Activity by Square Feet16
These shifts in office space demand and usage have significant implications for the New York City office
market.
16
C&W Leasing Data: 2002 vs. 2012
23% 28%
2%
7%
3%
6%
9%
25%
11%
3%
6%
5%
10%
1% 12%
10%
25% 16%
2002 2012
Financial Services
Legal Services
Accounting
Insurance
Bus Services
Information / Media / Tech
Educational Services
Apparel
Other
Traditional Office Users
Page 9
High-Growth Industries: Overview
A&M and JRT conducted an analysis to identify which industries are driving employment growth. Using
historical labor employment data and independent resources,17
A&M and JRT identified 17 high-growth
industries in New York City.
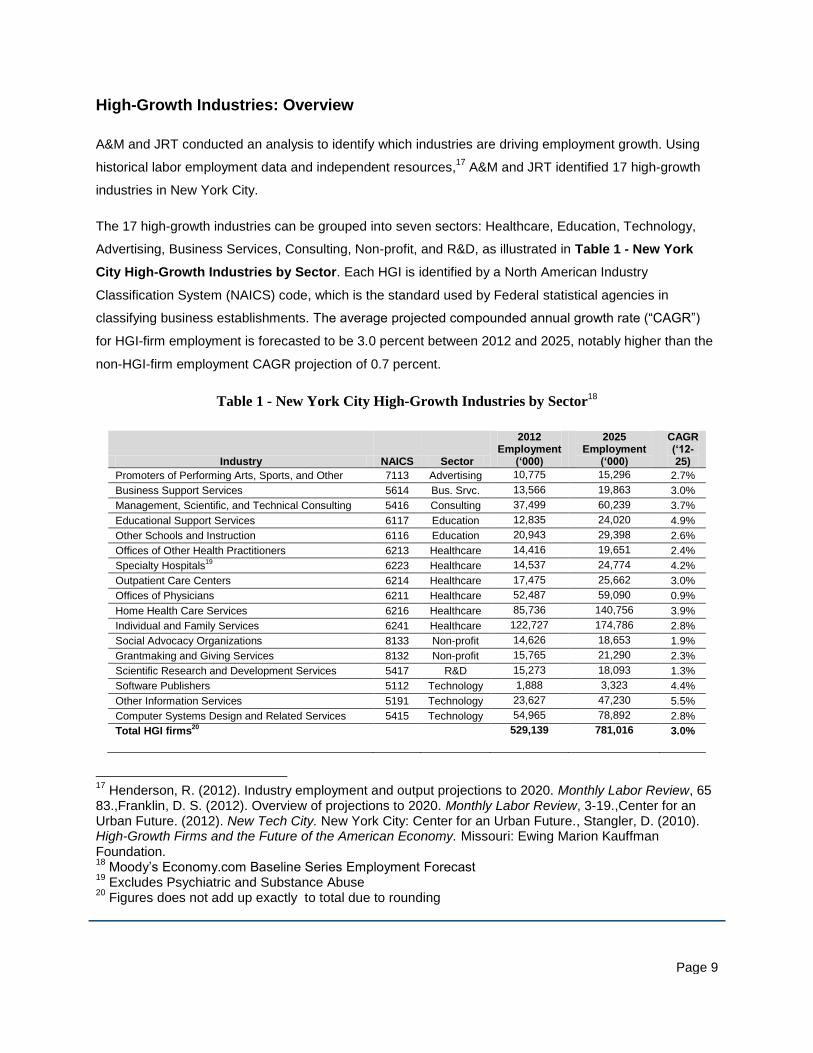
The 17 high-growth industries can be grouped into seven sectors: Healthcare, Education, Technology,
Advertising, Business Services, Consulting, Non-profit, and R&D, as illustrated in Table 1 - New York
City High-Growth Industries by Sector. Each HGI is identified by a North American Industry
Classification System (NAICS) code, which is the standard used by Federal statistical agencies in
classifying business establishments. The average projected compounded annual growth rate (“CAGR”)
for HGI-firm employment is forecasted to be 3.0 percent between 2012 and 2025, notably higher than the
non-HGI-firm employment CAGR projection of 0.7 percent.
Table 1 - New York City High-Growth Industries by Sector18
Industry NAICS Sector
2012 Employment
(‘ )
2025 Employment
(‘ )
CAGR (‘ 2-25)
Promoters of Performing Arts, Sports, and Other 7113 Advertising 10,775 15,296 2.7%
Business Support Services 5614 Bus. Srvc. 13,566 19,863 3.0%
Management, Scientific, and Technical Consulting 5416 Consulting 37,499 60,239 3.7%
Educational Support Services 6117 Education 12,835 24,020 4.9%
Other Schools and Instruction 6116 Education 20,943 29,398 2.6%
Offices of Other Health Practitioners 6213 Healthcare 14,416 19,651 2.4%
Specialty Hospitals19
6223 Healthcare 14,537 24,774 4.2%
Outpatient Care Centers 6214 Healthcare 17,475 25,662 3.0%
Offices of Physicians 6211 Healthcare 52,487 59,090 0.9%
Home Health Care Services 6216 Healthcare 85,736 140,756 3.9%
Individual and Family Services 6241 Healthcare 122,727 174,786 2.8%
Social Advocacy Organizations 8133 Non-profit 14,626 18,653 1.9%
Grantmaking and Giving Services 8132 Non-profit 15,765 21,290 2.3%
Scientific Research and Development Services 5417 R&D 15,273 18,093 1.3%
Software Publishers 5112 Technology 1,888 3,323 4.4%
Other Information Services 5191 Technology 23,627 47,230 5.5%
Computer Systems Design and Related Services 5415 Technology 54,965 78,892 2.8%
Total HGI firms20
529,139 781,016 3.0%
17
Henderson, R. (2012). Industry employment and output projections to 2020. Monthly Labor Review, 65 83.,Franklin, D. S. (2012). Overview of projections to 2020. Monthly Labor Review, 3-19.,Center for an Urban Future. (2012). New Tech City. New York City: Center for an Urban Future., Stangler, D. (2010). High-Growth Firms and the Future of the American Economy. Missouri: Ewing Marion Kauffman Foundation. 18
Moody‟s Economy.com Baseline Series Employment Forecast 19
Excludes Psychiatric and Substance Abuse 20
Figures does not add up exactly to total due to rounding
Page 10
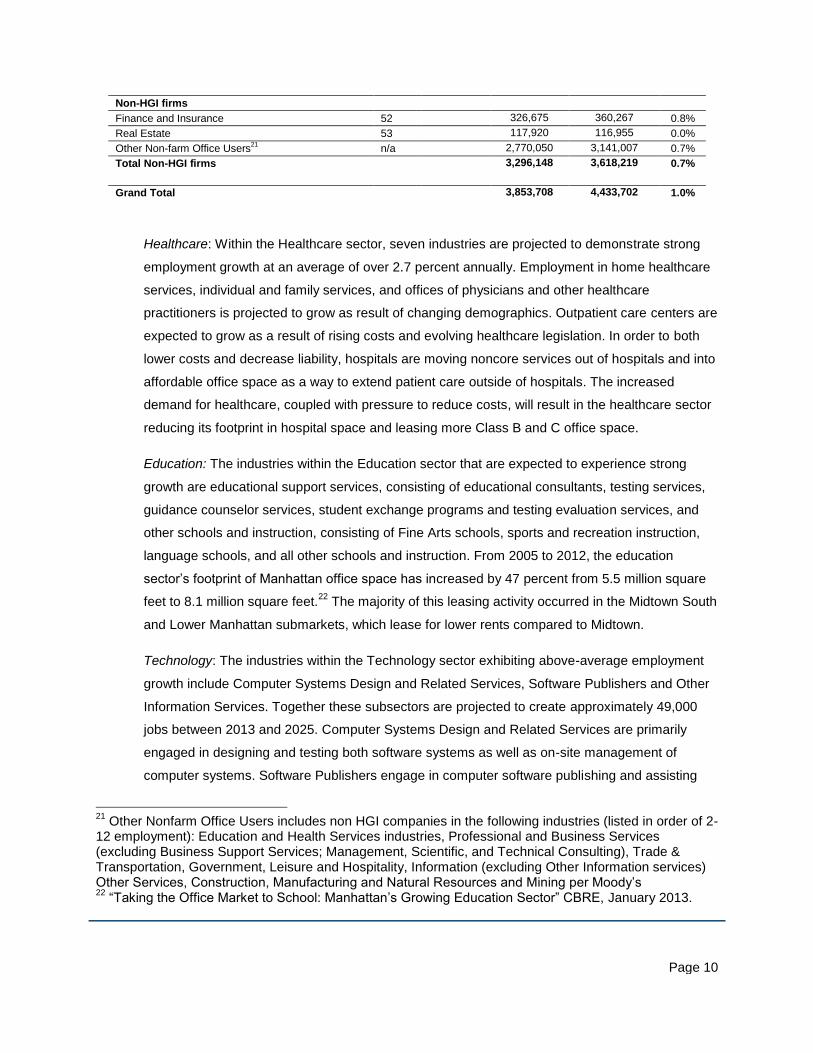
Non-HGI firms
Finance and Insurance 52 326,675 360,267 0.8%
Real Estate 53 117,920 116,955 0.0%
Other Non-farm Office Users21
n/a 2,770,050 3,141,007 0.7%
Total Non-HGI firms 3,296,148 3,618,219 0.7%
Grand Total 3,853,708 4,433,702 1.0%
Healthcare: Within the Healthcare sector, seven industries are projected to demonstrate strong
employment growth at an average of over 2.7 percent annually. Employment in home healthcare
services, individual and family services, and offices of physicians and other healthcare
practitioners is projected to grow as result of changing demographics. Outpatient care centers are
expected to grow as a result of rising costs and evolving healthcare legislation. In order to both
lower costs and decrease liability, hospitals are moving noncore services out of hospitals and into
affordable office space as a way to extend patient care outside of hospitals. The increased
demand for healthcare, coupled with pressure to reduce costs, will result in the healthcare sector
reducing its footprint in hospital space and leasing more Class B and C office space.
Education: The industries within the Education sector that are expected to experience strong
growth are educational support services, consisting of educational consultants, testing services,
guidance counselor services, student exchange programs and testing evaluation services, and
other schools and instruction, consisting of Fine Arts schools, sports and recreation instruction,
language schools, and all other schools and instruction. From 2005 to 2012, the education
sector‟s footprint of Manhattan office space has increased by 47 percent from 5.5 million square
feet to 8.1 million square feet.22
The majority of this leasing activity occurred in the Midtown South
and Lower Manhattan submarkets, which lease for lower rents compared to Midtown.
Technology: The industries within the Technology sector exhibiting above-average employment
growth include Computer Systems Design and Related Services, Software Publishers and Other
Information Services. Together these subsectors are projected to create approximately 49,000
jobs between 2013 and 2025. Computer Systems Design and Related Services are primarily
engaged in designing and testing both software systems as well as on-site management of
computer systems. Software Publishers engage in computer software publishing and assisting
21
Other Nonfarm Office Users includes non HGI companies in the following industries (listed in order of 2-12 employment): Education and Health Services industries, Professional and Business Services (excluding Business Support Services; Management, Scientific, and Technical Consulting), Trade & Transportation, Government, Leisure and Hospitality, Information (excluding Other Information services) Other Services, Construction, Manufacturing and Natural Resources and Mining per Moody‟s 22
“Taking the Office Market to School: Manhattan‟s Growing Education Sector” CBRE, January 2013.

Page 11
with installation and providing support services to software purchasers. Other Information
Services is comprised of an eclectic mix of information producers and distributors, including news
syndicates, libraries and archives, internet publishing and broadcasting and web search portals,
and all other information services. Media is represented within the Other Information subsector.
Media is shifting toward new revenue and operating models many of which consist of new digital
products, which are focused in the online and mobile space. These structural changes, fueled by
new advancements in the technology sector, will increase both the number of tech-related jobs
and demand for office space in New York City.
Advertising: Within the Advertising sector, Promoters of Performing Arts, Sports, and Similar
Events are projected to demonstrate rapid employment growth, 2.7 percent annually. As this
cohort deals primarily with promoting and advertising the events of entertainers and sporting
teams, it has benefitted from New York City‟s growth as an international venue for entertainment
and tourism. Since 2006, tourism to New York City has increased by 19% and location-based
entertainment has continued to expand accordingly.23
Business Services: The Business Support Services industry performs ongoing routine business
support functions and activities that businesses and organizations traditionally do for themselves.
For example, these services can include document preparation, account collection, fund raising,
and even telemarketing services. As they mature, many businesses outsource non-core business
functions to outside Businesses Support Services firms as a way to cut costs. As the overall New
York City economy continues to grow and develop, so too will the employment growth within the
Business Services sector.
Consulting: As businesses grow, so do their needs for independent expertise in areas such as
expansion, financial management and process improvement. The Management, Scientific, and
Technical Consulting Services industry provides advice and assistance to businesses and other
organizations on management issues, such as strategic and organizational planning, financial
planning and budgeting; environmental issues such as site remediation and sanitation; and
scientific and technical issues, including economic, energy, security, biological, physics, and
agricultural consulting. Employment in this subsector is projected to increase 3.7 percent
annually.
Non-profit: Within the Non-profit sector, Grantmaking and Giving Services and Social Advocacy
Organizations subsectors are expected to grow the most. Grantmaking and Giving Services
23
“New York City Tourism: A Model for Success” NYC & Co, June 2013.

Page 12
consist of grantmaking foundations or charitable trusts, which are primarily engaged in raising
funds for a wide range of social welfare activities, such as health, educational, scientific, and
cultural activities. Social Advocacy Organizations include organizations engaged in promoting a
particular cause or working for the realization of a specific social or political goal to benefit a
broad or specific constituency. Between 2000 and 2010, employment in the grantmaking and
giving services and social advocacy subsectors grew by 20 percent in New York City. This trend
is expected to continue, with these subsectors projected to grow in New York City by an average
of over 2.1 percent annually over the next 12 years. Given the nature of their organizations, non-
profits typically keep real estate costs to a minimum as a way to maximize their programmatic
budgets. As such, non-profit organizations tend to occupy affordable B and C office space.
Employment growth in these subsectors will therefore fuel strong demand for Class B and C
office space.
Research & Development: The Scientific Research and Development Services industry conducts
original investigation undertaken on a systematic basis to gain new knowledge (research) and/or
applies research findings or other scientific knowledge for the creation of new or significantly
improved products or processes (experimental development).24
Some examples include research
in biotechnology, the physical, engineering, and life sciences, social sciences and humanities.
Employment in the Scientific Research and Development Services industry is projected to exhibit
1.3 percent annual growth.
24
U.S. Census Bureau 2012 NAICS Definition, http://www.census.gov/eos/www/naics/. Last accessed June 19, 2013.

Page 13
High-Growth Industries: Projected Office Space Demand
A&M analyzed office space utilization trends for each HGI sector to project the incremental office space
demand for each high-growth industry through 2025. As of the fourth quarter of 2012, the New York City
office market occupied 447 msf of space, pushing the vacancy rate down to approximately 9 percent.25
Of
the 447 msf absorbed, it is estimated that HGI firms accounted for approximately 46 msf. The demand
model, shown in Table 2 - High-Growth Industries Office Demand Forecast, forecasts that HGI firms
will demand 17.3 msf of office space between 2013 and 2025, representing about 60 percent of total
growth in New York City office demand during this period.26
The analysis used empirical data, leasing
data, and other market research, and took into account the downward trend in office space utilization
across all office-using industries. Additionally, the study considered the percentage of office users within
each high-growth sector; for example, only 20 percent of Home Health Care Services workers use office
space, compared to 90 percent of Business Support Services employees.
The largest incremental office space demand is projected to come from the Advertising, Business
Services, and Consulting and Technology sectors. Together these HGI industries are estimated to
demand 9.0 msf of incremental office space between 2013 and 2025. The space preferences of this
cohort are outlined in the following section. The second largest increase in office space demand is
expected to come from the Healthcare sector, which is projected to demand 6.3 msf of incremental office
space by 2025, or 36 percent of the total incremental growth in demand from HGI firms. This sector‟s
demand is expected to be widely dispersed across the five boroughs because healthcare industries prefer
to be in close proximity to potential customers, choosing to locate near medical institutions, customers‟
residences and places of work.
25
CoStar/C&W market fundamentals data as of 4Q 2012 26
A&M and JRT Analysis, A&M forecast model dated 1Q 2013

Page 14
Table 2 - High-Growth Industries New York City Office Demand Forecast
Employment Growth ’ 2-‘25
% Office Users
Avg. Office Space
Utilization (SF/ Employee )
Incremental SF Demand 2013 - 2025
Advertising
Promoters of Performing Arts, Sports, and Other 4,521 75% 120 369,757
Business Services
Business Support Services 6,296 90% 175 893,187
Consulting
Management, Scientific, and Technical Consulting 22,740 80% 175 2,918,130
Education
Educational Support Services 11,185 50% 120 632,197
Other Schools and Instruction 8,455 25% 130 246,688
Healthcare
Home Health Care Services 55,020 20% 120 1,229,309
Individual and Family Services 52,059 50% 120 2,840,512
Offices of Other Health Practitioners 5,235 100% 175 807,803
Offices of Physicians 6,603 100% 200 964,575
Outpatient Care Centers 8,187 40% 150 449,646
Specialty Hospitals27
10,237 20% 120 229,651
Non-profit
Grantmaking and Giving Services 5,525 70% 120 415,804
Social Advocacy Organizations 4,026 75% 120 317,073
R&D
Scientific Research and Development Services 2,821 50% 175 196,975
Technology
Software Publishers 1,435 75% 120 121,072
Computer Systems Design and Related Services 23,927 75% 135 2,179,185
Other Information Services 23,603 75% 150 2,511,962
Total HGI firm demand 17,323,52928
27
Excludes Psychiatric and Substance Abuse 28
Figures does not add up exactly to total due to rounding
Page 15
Office Space Preferences of HGI Tenants
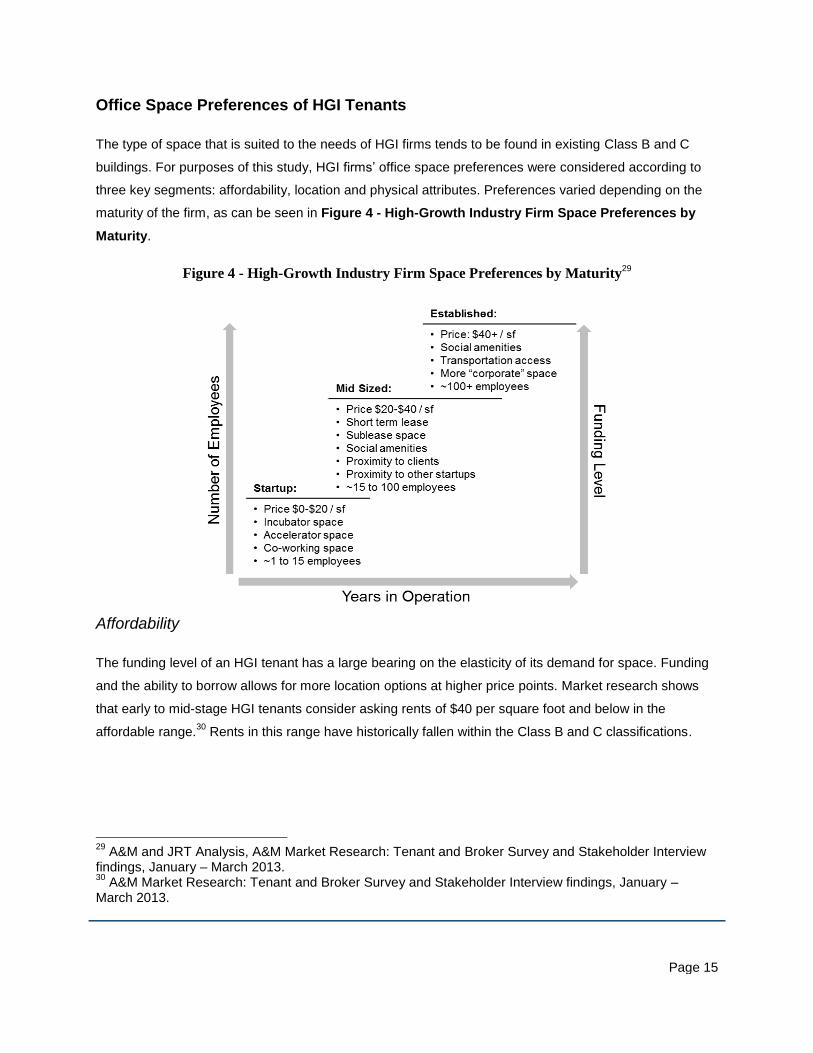
The type of space that is suited to the needs of HGI firms tends to be found in existing Class B and C
buildings. For purposes of this study, HGI firms‟ office space preferences were considered according to
three key segments: affordability, location and physical attributes. Preferences varied depending on the
maturity of the firm, as can be seen in Figure 4 - High-Growth Industry Firm Space Preferences by
Maturity.
Figure 4 - High-Growth Industry Firm Space Preferences by Maturity29
Affordability
The funding level of an HGI tenant has a large bearing on the elasticity of its demand for space. Funding
and the ability to borrow allows for more location options at higher price points. Market research shows
that early to mid-stage HGI tenants consider asking rents of $40 per square foot and below in the
affordable range.30
Rents in this range have historically fallen within the Class B and C classifications.
29
A&M and JRT Analysis, A&M Market Research: Tenant and Broker Survey and Stakeholder Interview findings, January – March 2013. 30
A&M Market Research: Tenant and Broker Survey and Stakeholder Interview findings, January – March 2013.
Page 16
Location
While office location is an important factor for both TOU and HGI firms, HGI firms are particularly sensitive
to location. Many HGI firms are looking for investors. Investors prefer their portfolio companies to be in
close proximity to them, so HGI firms seek to locate near these sources of capital. Locating near clients is
also a high priority of HGI firms as a substantial amount of HGI firms‟ work is external and entails meeting
with and doing demonstrations of their product to prospective clients.
Proximity to employees‟ residential centers is a key factor in HGI firms‟ ability to attract and retain talent.
This represents a substantial shift from the behavior of TOU firms, where location is more likely to be
determined by proximity to executive level housing. Traditionally, workforces have followed corporate
executive preferences; however, HGI firms may be more likely to follow their workforce.31
HGI firms prefer to be in live/work/play neighborhoods that have 24-hour access to social amenities such
as restaurants, bars and coffee shops. These amenities complement flexible work hours and provide
convenient and stimulating places to collaborate, which suits the social and entrepreneurial culture of HGI
firms.
Physical Space Characteristics
TOU and HGI firms tend to prefer different physical space characteristics in their offices. HGI firms tend to
prefer that their space project a less “corporate” image to prospective clients and talent. Likewise, they
are more likely to seek spaces that foster collaboration and innovation. Broadly, TOU firms are associated
with Class A space32
and HGI firms with Class B and C space.
HGI firms that have business lines focused on innovation and creativity, such as software publishers and
advertising media, prefer bench seating with minimal physical barriers between employees. This layout
fosters collaboration and communication.33
HGI firms appear to be shifting away from the traditional 60
percent private office and 40 percent cubicle arrangement, with upper level management in offices and
employees in cubicles. The new HGI firm space-use paradigm is characterized by 80 percent open,
bullpen-style workspace with low-profile cubicles, and collaboration/breakout rooms.34
31
A&M and JRT Analysis, A&M Market Research: Tenant and Broker Survey and Stakeholder Interview findings, January – March 2013. 32
Cushman & Wakefield Leasing Data: 2002 vs. 2012 33
Watner, Jonathan. “Manhattan‟s Tech Start-Ups Settle in the Flatiron District and Chelsea”. April 19, 2011. New York Times. Last accessed April 15, 2013. <www.nytimes.com> 34
A&M and JRT Analysis, A&M Market Research: Tenant and Broker Survey and Stakeholder Interview findings, January – March 2013.

Page 17
“Casual” and open meeting areas spread throughout the office have supplanted traditional enclosed office
rooms. Private offices are rare; typically any enclosed spaces within the office serve as conference
rooms. By creating open environments and utilizing bench seating, HGI firms can operate with fewer
square feet per employee. Given that many early to mid-sized HGI firms are capitally constrained, the
open layout of these spaces not only fosters collaboration but utilizes space much more efficiently.
HGI firms leverage physical attributes as a tool to attract clients. For example, an HGI tenant whose
clients are primarily artists and other creative types is likely to have space that is more rugged and edgy;
whereas an HGI firm whose clients are utility companies will desire a more corporate look. In this way,
office space is a means by which HGI tenants can non-verbally relate to prospective clients.35
Physical attributes of an office space are crucial to attracting and retaining talent. As the CEO of a
successful startup tech firm explained, “one of the main pitches [to prospective talent] is the quality of
office space.” HGI firms seek space that is both aesthetically and functionally pleasing. Preferred
attributes include large contiguous floor-plates, bright arched windows, exposed brick, bike storage, and
shower facilities.
35
A&M and JRT Analysis, A&M Market Research: Tenant and Broker Survey and Stakeholder Interview findings, January – March 2013.

Page 18
Current Central Business Districts and Growing Sub-Markets
HGI firms lease office space in all of New York City‟s major central business districts: Midtown, Midtown
South, Lower Manhattan, Downtown Brooklyn, and Long Island City.
Midtown is the largest office market in Manhattan with 242 msf comprising more than half of the
borough‟s office inventory. Midtown is defined as the area between 57th Street and 30
th Street, bound by
the Hudson and East Rivers. Grand Central Terminal and Penn Station offer tenants exceptional access
to transportation networks serving New York City and the suburbs of New Jersey, Long Island, and
Connecticut. Approximately 75%36
of Midtown is Class A space with an average asking rent of $73/sf.37
Class B and C space represent a smaller, more affordable portion of the market‟s stock. As of the fourth
quarter of 2012, Class B and C average asking rents ranged from $38 to $48/sf.38
Class A vacancy was
10.9% in the fourth quarter of 2012 and the combined Class B and C vacancy rate stood at 8.5%.39
Many large corporations are based in Midtown today. As more mature innovation economy firms move to
Midtown – like Yahoo, which announced that it was moving its headquarters to the former New York
Times Building in May 2013 – mid-sized HGI firms may choose to follow, the way many firms moved to
Chelsea after Google bought 111 Eighth Avenue in 2010. Midtown has larger floor plate options than
markets like Midtown South and Lower Manhattan, so it may be a suitable office market for HGI
companies seeking to occupy one single floor rather than being split up among multiple levels. However,
much of its stock is viewed as “traditional” from the perspective of the attributes HGI firms seek in addition
to price.
Midtown South, with 65 msf of office space, represents approximately 16% of Manhattan‟s total
inventory.40
Midtown South is defined as the area bound by 30th Street to the north, the East River to the
east, Canal Street to the south and the Hudson River to the west. As of the fourth quarter of 2012, the
Midtown South vacancy rate of 7.1% was the lowest of the Manhattan central business districts, 320
basis points lower than Midtown and 170 basis points lower than Lower Manhattan.41
In contrast to the
other Manhattan markets, Midtown South‟s office stock is predominately Class B and C space;
collectively these two classes make up almost 80% of the sub-market.
36
Cushman & Wakefield office fundamentals data as of 4Q2012 37
Cushman & Wakefield office fundamentals data as of 4Q2012 38
Cushman & Wakefield office fundamentals data as of 4Q2012 39
Cushman & Wakefield office fundamentals data as of 4Q2012 40
Cushman & Wakefield office fundamentals data as of 4Q2012 41
Cushman & Wakefield office fundamentals data as of 4Q2012

Page 19
Midtown South has a number of features that make it attractive to HGI firms. First, rents have historically
been lower than Midtown, though this relationship has been changing in recent years. In addition, many
of the buildings in Midtown South have non-institutional owners that have provided some additional
flexibility in leasing to traditional market terms. The physical attributes of the pre-war buildings – open
floor plates, high ceilings, and exposed brick walls – that make up much of the Class B and C stock have
further contributed to its appeal. Union Square, the West Village, Chelsea and SoHo are robust retailing
hubs with the restaurants, bars, coffee shops and nightlife options that are desirable to HGI firm
employees.42
Rents are increasingly rising above affordable levels for HGI firms.43
As of February 2013,
average asking rents for space in Midtown South were $67/sf for Class A, $54/sf for Class B and $44/sf
for Class C.44
Lower Manhattan has 85 msf of office space in the area south of Chambers Street. Over the last
decade, Lower Manhattan has experienced significant residential population growth and major public
investment in the World Trade Center, Fulton Center, and the PATH Station. Between 2000 and 2013,
the area‟s population increased over 250% from 24,000 to 60,000 residents.45
Retail amenities have
followed, transforming Lower Manhattan into a 24/7 community.
Lower Manhattan has increasingly become a hub for new media, tech and creative companies. The
relocations of major tenants like Harper Collins and, next year, Condé Nast should continue to attract
smaller media and creative companies to the area. Lower Manhattan rents are much less expensive than
Midtown rents. As of February 2013, asking rents for space in Lower Manhattan ranged from $45/sf for
Class A to $31-$35/sf for Class B and Class C.46
Lower Manhattan also has multi-modal transportation
access to residential centers in New Jersey, Staten Island and Brooklyn.
Downtown Brooklyn contains 25 msf of office space, or 65% of the total Brooklyn inventory.47
The
neighborhood is bordered by the East River to the west and north, Atlantic Avenue to the south, and
Washington Avenue to the east. Two-thirds of Downtown Brooklyn office space consists of Class B and C
space. Dumbo asking rents reach as high as $60/sf, but typical space ranges from the mid $20‟s to the
low $30‟s/sf.48
MetroTech asking rents are in the mid-$30‟s/sf.49
Fulton Mall and Lower Fulton Mall have
asking rents in the high-$20‟s/sf.50
42
A&M and JRT research as of 2Q 2013 43
A&M and JRT research as of 2Q 2013 44
Cushman & Wakefield and JRT analysis as of 1Q2013 45
“Lower Manhattan” Alliance for Downtown, May 2013 46
Cushman & Wakefield fundamentals data as of 4Q2012, A&M analysis 47
Cushman & Wakefield fundamentals data as of 4Q2012, A&M analysis 48
A&M and JRT research as of 2Q 2013

Page 20
Affordable rents, availability of underutilized industrial buildings for conversion, and proximity to the
residential neighborhoods and retail amenities of downtown Brooklyn have fueled the growth of this
neighborhood. Tech firms such as Etsy and Kickstarter have defined their corporate culture by locating in
Brooklyn and rely on the popularity and desirability of the borough to attract clients and talent.51
Within
Downtown Brooklyn and at the periphery of this market are a number of planned development projects
that will add new commercial office space. Kushner Companies and RFR Realty have partnered to
purchase a 1.2 msf portfolio of Watchtower Bible and Tract Society industrial properties for conversion to
residential and commercial office space. In Crown Heights, Brownstoner, BFC Partners, and Goldman
Sachs have begun leasing space at the 140,000 sf 1000 Dean Street for artistic, light industrial and
professional office tenants.
In addition to Dumbo, there is commercial office activity in North and South Brooklyn. Two Trees
Management plans to redevelop the former Domino Sugar Refinery in Williamsburg with 500,000 sf of
office space to complement the 2.3 msf of planned residential development. Kickstarter recently moved
its headquarters to a renovated former pencil factory in Greenpoint. In South Brooklyn, Jamestown
Properties acquired a stake earlier this year in the 6 msf Industry City complex on the Sunset Park
waterfront with plans to reposition the properties for new manufacturing and office uses.
Long Island City contains 9.4 msf of office space, approximately 40% of Queens‟ office inventory.52
Long
Island City is bordered by Astoria to the north, Calvary Cemetery and 39th Street to the east, Newton
Creek to the south and the East River to the west. Long Island City has excellent access to transportation
and is a 10 minute subway ride from Midtown Manhattan.
Long Island City has served as a less expensive alternative to Midtown office space. As of 4Q 2012, the
market‟s average asking rent of $35/sf was substantially less than the Manhattan average asking rent of
$58/sf.53
Long Island City‟s vacancy as of the fourth quarter of 2012 was 4.8%, well below the 10 year
average vacancy rate of 6.3%.54
The area is commonly referred to as the “next Brooklyn”55
due to its
burgeoning arts and cultural community as well as its office and residential market. It is anticipated that
the market will strongly benefit from the opening of the Cornell-Technion Applied Sciences Campus on
49
A&M and JRT research as of 2Q 2013 50
A&M and JRT research as of 2Q 2013 51
A&M and JRT research as of 2Q 2013 52
Cushman & Wakefield fundamentals data as of 4Q2012, A&M analysis 53
Cushman & Wakefield fundamentals data as of 4Q2012, A&M analysis 54
Cushman & Wakefield fundamentals data as of 4Q2012, A&M analysis 55
CREC Advisory Group Presentation, April 2013.
Page 21
Roosevelt Island, as the new academic and research center is expected to attract complimentary HGI
firms and social amenities to Long Island City.
Long Island City is home to a large inventory of industrial and warehouse buildings that are well-suited for
office conversion, as the spaces possess the raw, physical qualities that HGI firms demand. While there
are some examples of industrial buildings that have been converted to new manufacturing and office uses
– such as Jamestown Properties‟ Falchi Building and Acumen Capital Partners‟ Standard Motor Products
Building – the economics for new construction and rehab favor residential development. According to
brokers active in the market, nearly 4,500 residential units are in the pipeline.
Opportunities in Other Business Districts
Other business districts with Class B and C office space and excellent transportation access are well
positioned for growth over the long-term. Harlem‟s 125th Street, Downtown Jamaica, 161
st Street in the
South Bronx, and Downtown Staten Island have all benefited from ongoing public investments that could
make these districts more appealing to HGI firms as demand for affordable office space grows.

Page 22
DEMAND, SUPPLY, AND GAP FORECAST
High-Growth Industries Demand
The office space demand model utilized employment forecasts with adjustments for office-using
employment growth and space allocation per employee. Office-using employment growth and space
allocation were determined using leasing data, interviews, surveys and other research.
In 2012, total office space demand in New York City was 447 msf. Users of Class A space comprised 53
percent, absorbing 236 msf, whereas Class B and C building tenants comprised 211 msf. Going forward,
the A&M demand model projects that total New York City office space demand will grow by nearly 30 msf
between 2013 and 2025.56
Of this amount, 16.0 msf (55 percent of total growth in demand) is projected to
be for space in Manhattan, 5.5 msf (19 percent of total) for space in Brooklyn, 5.5 msf (19 percent of total)
for space in Queens, the Bronx and Staten Island are projected to receive the remaining 2.3 msf, or 8
percent, of total growth in demand (see Table 3 - Office Demand Growth Forecast by Borough, 2013
to 2025).
Table 3 - Office Demand Growth Forecast by Borough, 2013 to 2025
(in msf) Manhattan Brooklyn Queens Bronx Staten Island Total
Class A 8.4 0.8 3.7 0.2 0.2 13.2
Class B and C 7.6 4.7 1.8 1.3 0.6 16.0
Total 16.0 5.5 5.5 1.5 0.8 29.2
Table 4 - High-Growth Industries Office Demand Growth Forecast by Borough, 2013 to 2025
(in msf) Manhattan Brooklyn Queens Bronx Staten Island Total
Class A 3.8 0.3 1.6 0.1 0.1 5.9
Class B and C 7.0 2.6 0.7 0.6 0.5 11.4
Total 10.8 2.9 2.3 0.7 0.6 17.3
Between 2013 and 2025, the total incremental demand for commercial office space is projected to be
about 29 msf. The A&M model projects HGI firms will comprise about 17 msf, or 60 percent, of the total
incremental demand. Locations in Manhattan, Brooklyn and Queens are anticipated to account for 92
percent of the total HGI firm demand and an estimated approximately 66 percent of total HGI firm
demand will be for Class B and C office space, as illustrated below in Table 4 - High-Growth Industries
Office Demand Growth Forecast by Borough, 2013 to 2025. These projections account for the relative
56
A&M and JRT Analysis, A&M forecast model dated 1Q 2013

Page 23
desirability of each borough and market based upon the availability of the aforementioned HGI firm
demand preferences.
Manhattan is projected to absorb 10.8 msf, or 62 percent of HGI firm demand. Demand will be strongest
in the Midtown, Midtown South and Downtown markets. In Brooklyn, HGI firms are forecasted to demand
2.9 msf, or 17 percent of total HGI firm demand. Within Brooklyn, the Downtown Brooklyn submarket is
especially well positioned given its growing base of social amenities and good access to transportation to
Manhattan. Queens will receive 2.3 msf of demand, or 13 percent of the total HGI firm demand. The
Bronx is projected to absorb 0.7 msf, or 4 percent of total HGI firm demand. Staten Island is projected to
receive 0.6 msf, or 4 percent of total HGI firm demand.

Page 24
Class B and C Office Supply
Current Supply
As of the fourth quarter of 2012, the total New York City office market was 490 msf.57
Of that 490 msf total
market, a majority (53 percent) was Class A, while Class B and Class C accounted for 30 percent and 16
percent respectively.58
The distribution of office space types by borough is shown in Figure 5 - Office
Space Distribution by Borough and Class.
Figure 5 - Office Space Distribution by Borough and Class (4Q 2012)
In the fourth quarter of 2012, New York City‟s overall office vacancy was 9 percent, which is consistent
with the 4-12 percent range observed since 1996.59
Recent Trends in Commercial Office Space
Between 2000 and 2012, New York City‟s inventory of Class A office space grew by 10.9 msf, but Class
B and C office space declined by 1.6 msf.60
During this period, Manhattan‟s B and C office stock was
reduced by 6.2 msf, while non-Manhattan boroughs added 4.7 msf (See Table 5 - NYC Class A Office
Stock, 2000 to 2012 and Table 6 - NYC Class B and C Office Stock, 2000 to 2012).
57
The total stock includes medical office and government-owner occupied buildings 58
CoStar/C&W market fundamentals data as of 4Q2012 59
CoStar/C&W market fundamentals data as of 4Q2012 60
CoStar/C&W market fundamentals data as of 4Q2012
24
4 m
sf
9 m
sf
6 m
sf
2 m
sf
1 m
sf
10
7 m
sf
18
msf
17
msf
4 m
sf
2.5
msf
52
msf
13
msf
9 m
sf
4 m
sf
2.8
msf
0 msf
50 msf
100 msf
150 msf
200 msf
250 msf
300 msf
Manhattan Brooklyn Queens Bronx StatenIsland
Class A
Class B
Class C

Page 25
Table 5 - NYC Class A Office Stock, 2000 to 201261
(in msf) Manhattan Brooklyn Queens Bronx Staten Island Total
2000 237.6 6.7 4.0 1.4 0.8 250.5
2012 243.7 8.9 5.9 1.9 0.9 261.3
Change 6.1 2.2 1.9 0.5 0.2 10.9
Table 6 - NYC Class B and C Office Stock, 2000 to 201262
(in msf) Manhattan Brooklyn Queens Bronx Staten Island Total
2000 165.9 29.1 23.9 6.8 4.6 230.4
2012 159.7 31.0 25.4 7.4 5.3 228.4
Change (6.2) 1.9 1.5 0.6 0.7 (1.6)
Manhattan‟s decline in Class B and C office stock was due to conversion of office to non-office product,
such as residential and hospitality. Prior to 2006, programs such as the 421-g Tax Incentive and Liberty
Bond programs promoted residential construction in Lower Manhattan. In Manhattan, between 2000 and
2012, 6.2 msf of Class B and C office space was also repurposed to residential using the J-51 and 421-a
tax rules, which provide abatements for residential conversion.63
Between 2000 and 2012, the non-Manhattan boroughs gained 4.7 msf of Class B and C stock as a result
of decay of Class A stock and adaptive reuse of industrial and warehouse product. Examples of adaptive
reuses include the Bank Note Building in the Bronx, a former currency printing factory, and the Dumbo
Offices, formerly a Benjamin Moore & Company paint factory. Many of these buildings were converted to
office, rather than residential, due to building size and configuration.
Looking Forward
Supply of Class A office stock is expected to remain robust across the near and longer-term, while supply
of Class B and C office stock is projected to become even more constrained. The analysis shows a net
decrease of over 7 msf of Class B and C office space. While 3.9 msf of Class A stock is projected to
decay to Class B and C stock this is off-set by conversions to other uses. The A&M model projects 11.7
61
CoStar/C&W market fundamentals data as of 4Q2012 62
CoStar/C&W market fundamentals data as of 4Q2012 63
NYC.gov. J-51 Exemption. Last accessed on April 16th 2013.
http://www.nyc.gov/html/dof/html/property/property_tax_reduc_j_51.shtml

Page 26
msf of office inventory will be converted from office space to other uses, such as residential. Table 7 -
NYC Class B and C Office Stock, 2012 to 2025 illustrates the projected change in stock.
Table 7 - NYC Class B and C Office Stock, 2012 to 202564
(in msf) Manhattan Brooklyn Queens Bronx Staten Island Total
2012 Stock 159.7 31.0 25.4 7.4 5.3 228.8
Decay (A to B/C) 3.6 0.2 0.1 0.0 0.0 3.9
Conversions (8.2) (1.6) (1.3) (0.4) (0.3) (11.7)
2025 Stock 155.1 29.6 24.2 7.1 5.1 221.0
64
CoStar/C&W market fundamentals data as of 4Q2012

Page 27
Gap Forecast and Analysis
The demand and supply forecast indicates that the supply of Class B and C office space will be
insufficient to meet demand beginning in 2018. As of the fourth quarter of 2012, tenants demanded 211
msf65
of Class B and C office product while the New York City market contained 228.8 msf of inventory.66
The 2012 gap of 17.8 msf between supply and demand translates into an 8 percent vacancy rate,
consistent with the structural vacancy rates of 5-9 percent that are typical for mature markets. By 2025,
tenants are projected to demand 227.3 msf, while inventory for Class B and C space is projected to be
221 msf. The 2025 projected gap between supply and demand represents a structural deficit of 6.1 msf,
which is 3 percent of the market.
Figure 6 - NYC Class B and C Office Stock, 2002 to 2025
65
A&M and JRT Analysis, Cushman & Wakefield leasing data, CoStar market fundamentals as of 4Q 2012, A&M forecast model as of 3Q 2013 66
CoStar market fundamentals as of 4Q 2012
205
215
225
235
245
2000 2002 2004 2006 2008 2010 2012 2014 2016 2018 2020 2022 2024
Squ
are
Fe
et
(Mili
on
s)
Supply
Demand
Forecast

Page 28
Demand for Class B and C office space will exceed supply in all of the non-Manhattan boroughs. The gap
will be largest in Brooklyn, where demand for office space is projected to exceed supply by 4.2 msf.
Table 8 - Forecasted 2025 Total Class B and C Office Supply, Demand and Gap
(in msf) Manhattan Brooklyn Queens Bronx Staten Island Total
Supply 155.1 29.6 24.2 7.1 5.1 221.0
Demand 154.2 33.8 25.8 7.7 5.6 227.3
Gap 1.0 (4.2) (1.7) (0.6) (0.5) (6.3)
The Gap between supply and demand for Class B and C office space is primarily the result of four key
factors: the cost of development, economics of the New York City market favor maintaining Class A
building status, preference for credit tenants, and market inducements for residential conversion.
I. Cost of Development
The high cost of development for new ground-up development of commercial office buildings is often
most feasible for Class A product that can be leased at higher rental rents. New York City‟s development
costs are driven by both high land prices and high construction costs. High land prices in key sub-
markets are driven by a continuing decline in supply. New York City‟s construction costs are among the
highest in the nation.67
The Building Cost Index (BCI) and Construction Cost Index (CCI) are two
measures of prices for construction in the United States. New York City‟s most recent BCI and CCI are
both approximately 50% higher than the national average.68
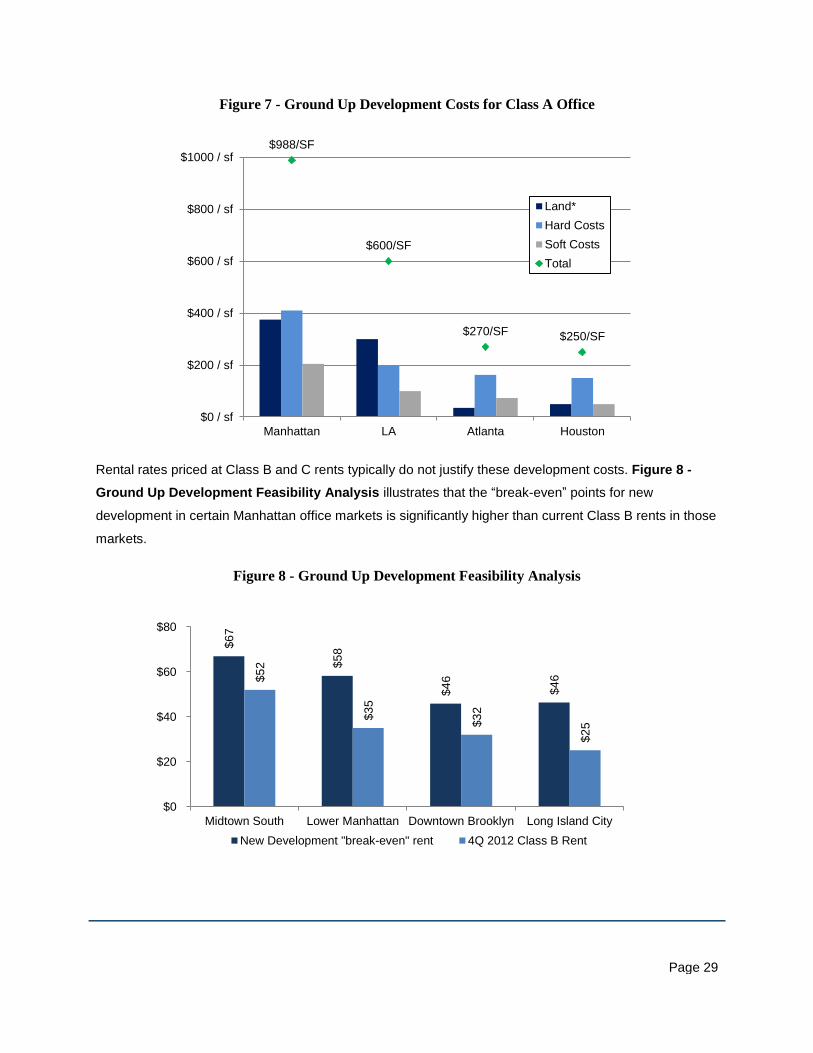
Figure 7 - Ground Up Development Costs
for Class A Office demonstrates the high cost of construction in New York City compared to that other
large American cities. Factors driving New York City‟s construction costs include tight site conditions that
require just-in-time material delivery and added transportation costs; strict local building codes that restrict
flexibility on materials and methods; insurance premiums; union work rules and specialization of labor.
67
A&M and JRT Market Research as of 1Q2013 68
McGraw Hill Engineering News Record, November 2013
Page 29
Figure 7 - Ground Up Development Costs for Class A Office
Rental rates priced at Class B and C rents typically do not justify these development costs. Figure 8 -
Ground Up Development Feasibility Analysis illustrates that the “break-even” points for new
development in certain Manhattan office markets is significantly higher than current Class B rents in those
markets.
Figure 8 - Ground Up Development Feasibility Analysis
$988/SF
$600/SF
$270/SF $250/SF
$0 / sf
$200 / sf
$400 / sf
$600 / sf
$800 / sf
$1000 / sf
Manhattan LA Atlanta Houston
Land*
Hard Costs
Soft Costs
Total
$6
7
$5
8
$4
6
$4
6
$5
2
$3
5
$3
2
$2
5
$0
$20
$40
$60
$80
Midtown South Lower Manhattan Downtown Brooklyn Long Island City
New Development "break-even" rent 4Q 2012 Class B Rent
Page 30
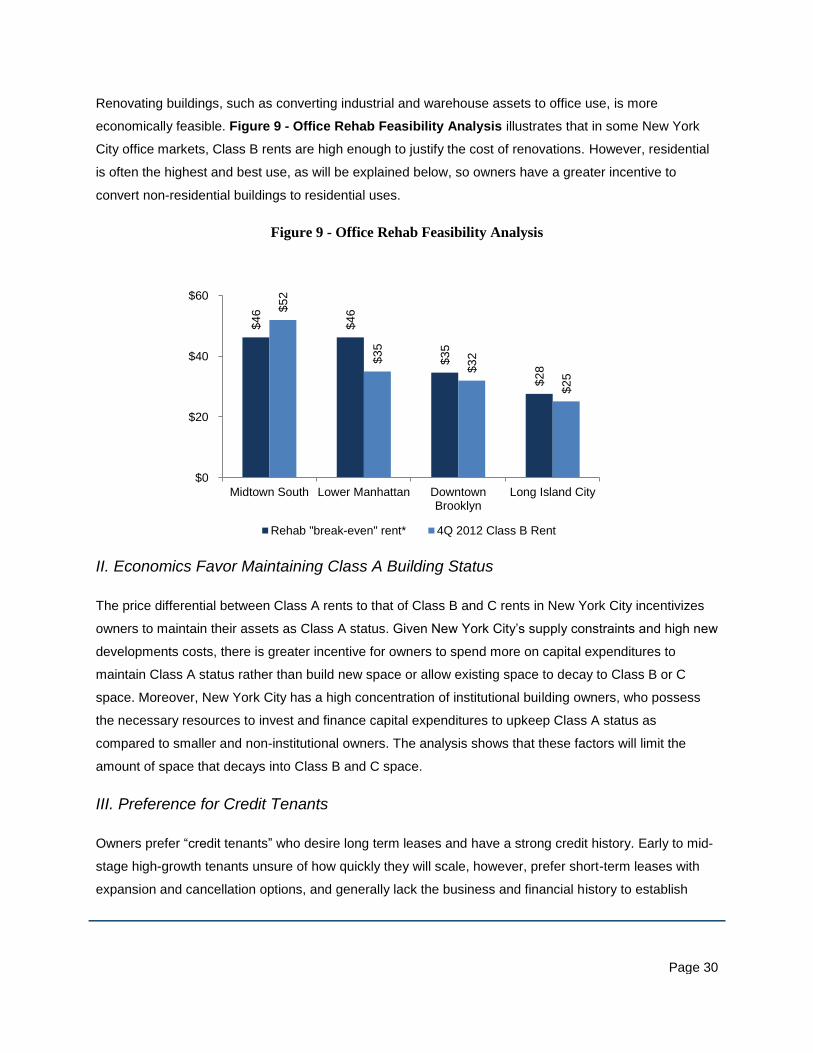
Renovating buildings, such as converting industrial and warehouse assets to office use, is more
economically feasible. Figure 9 - Office Rehab Feasibility Analysis illustrates that in some New York
City office markets, Class B rents are high enough to justify the cost of renovations. However, residential
is often the highest and best use, as will be explained below, so owners have a greater incentive to
convert non-residential buildings to residential uses.
Figure 9 - Office Rehab Feasibility Analysis
II. Economics Favor Maintaining Class A Building Status
The price differential between Class A rents to that of Class B and C rents in New York City incentivizes
owners to maintain their assets as Class A status. Given New York City‟s supply constraints and high new
developments costs, there is greater incentive for owners to spend more on capital expenditures to
maintain Class A status rather than build new space or allow existing space to decay to Class B or C
space. Moreover, New York City has a high concentration of institutional building owners, who possess
the necessary resources to invest and finance capital expenditures to upkeep Class A status as
compared to smaller and non-institutional owners. The analysis shows that these factors will limit the
amount of space that decays into Class B and C space.
III. Preference for Credit Tenants
Owners prefer “credit tenants” who desire long term leases and have a strong credit history. Early to mid-
stage high-growth tenants unsure of how quickly they will scale, however, prefer short-term leases with
expansion and cancellation options, and generally lack the business and financial history to establish
$4
6
$4
6
$3
5
$2
8
$5
2
$3
5
$3
2
$2
5
$0
$20
$40
$60
Midtown South Lower Manhattan DowntownBrooklyn
Long Island City
Rehab "break-even" rent* 4Q 2012 Class B Rent

Page 31
credit. Leasing to tenants with low credit exposes an owner to higher risk of tenant default over the lease
term. Short term leases are unattractive because owners incur significant upfront costs when signing a
new office tenant, including brokerage fees, tenant improvement allowances and free rent. For a 20,000
sf space in Midtown Manhattan, renovation expenses and brokers fees can cost $1.6 million.69
Under this
example, owners would not break even on upfront costs until 24 months after lease commencement.
IV. Market Inducements for Residential Conversion
In the New York City real estate market, the economics today favor residential development over office
development. Residential projects allow for the highest risk-adjusted return to developers and in many
instances the lowest risk of default to lenders. Every developer interviewed by A&M during the research
process confirmed this observation. One New York City developer indicated that there is “much greater
demand for residential than office. [They have] run the economics countless times, [which] always go
towards residential redevelopment rather than maintaining a B or C [office space].”70
Another said “the
highest investment use of every single piece of dirt [in New York City] is residential.” The capital markets
support this thesis, as banks are far more likely to lend for a residential project than an office project.71
Prices for Class B and C office product whose zoning allows residential use are very high because sellers
assume that investors will convert office product to residential. This can make it economically infeasible to
maintain current Class B and C office product for office use and incentivize the conversion of those
buildings to residential use. Table 19 - Rehab Land Prices by Zoning Use per Square Foot shows the
significant premium for land prices when zoning allows residential use.
Table 9 - Rehab Land Prices by Zoning Use per Square Foot72
Midtown
South Downtown Manhattan
Downtown Brooklyn
Long Island City
Office / Residential $450 - $600 $450 - $600 $450 - $500 $250-$400
Office Only $300 - $400 $300 - $400 $200 - $250 $100 - $150
Premium for residential zoning $150 - $200 $150 - $200 $250 $150 - $250
69
Assumes ten year lease, base rent of $40 in years 1-5, base rent of $45 in years 6-10, escalations for taxes and operating expenses above a base year, two months free rent, $60 in work allowance and brokers fee without referral 70
Commercial Real Estate Competitiveness Study Advisory Meeting, April 2013. 71
A&M analysis, Commercial Real Estate Competitiveness Advisory Meeting, April 2013. 72
Jones Lang LaSalle, Massey Knakal, A&M and JRT Analysis, as of 1Q 2013.
Page 32
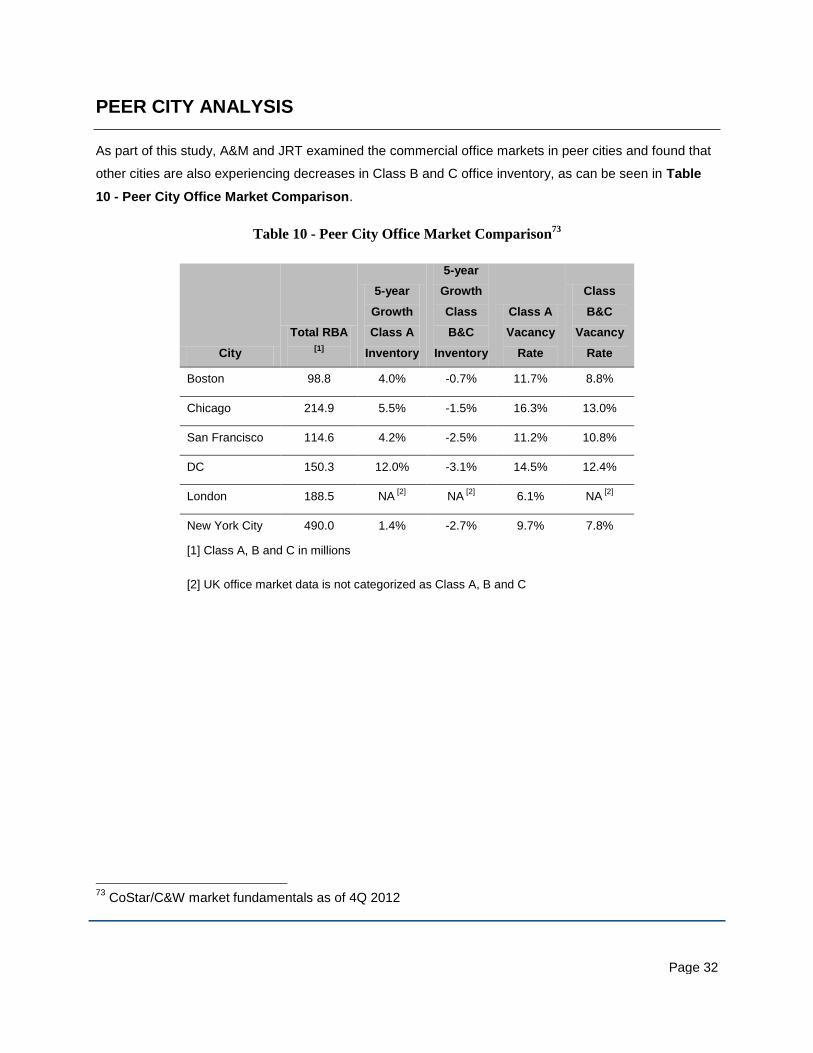
PEER CITY ANALYSIS
As part of this study, A&M and JRT examined the commercial office markets in peer cities and found that
other cities are also experiencing decreases in Class B and C office inventory, as can be seen in Table
10 - Peer City Office Market Comparison.
Table 10 - Peer City Office Market Comparison73
City
Total RBA
[1]
5-year
Growth
Class A
Inventory
5-year
Growth
Class
B&C
Inventory
Class A
Vacancy
Rate
Class
B&C
Vacancy
Rate
Boston 98.8 4.0% -0.7% 11.7% 8.8%
Chicago 214.9 5.5% -1.5% 16.3% 13.0%
San Francisco 114.6 4.2% -2.5% 11.2% 10.8%
DC 150.3 12.0% -3.1% 14.5% 12.4%
London 188.5 NA [2]
NA [2]
6.1% NA [2]
New York City 490.0 1.4% -2.7% 9.7% 7.8%
[1] Class A, B and C in millions
[2] UK office market data is not categorized as Class A, B and C
73
CoStar/C&W market fundamentals as of 4Q 2012
Page 33
Boston is the business capital of New England. Like New York City, it has access to a skilled labor force
and venture capital for emerging companies. The city has a dynamic high-tech and biomedical research
industry and further labor market stability from large healthcare and education sectors. Boston suffers
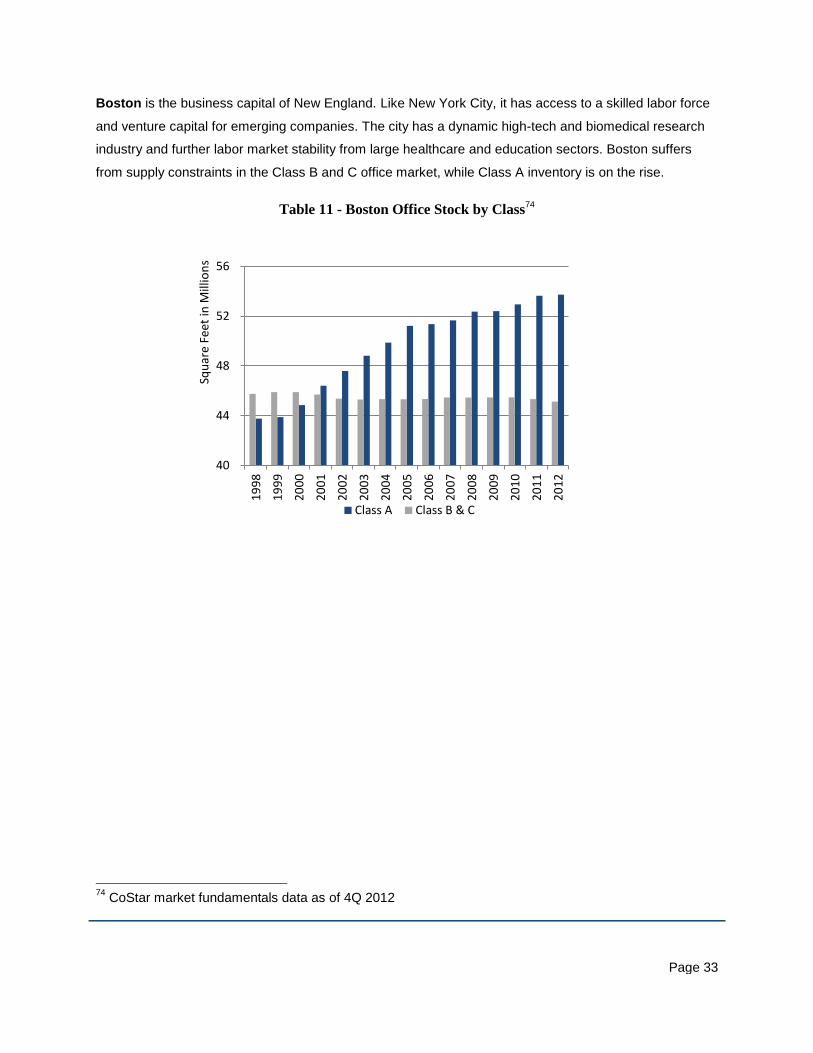
from supply constraints in the Class B and C office market, while Class A inventory is on the rise.
Table 11 - Boston Office Stock by Class74
74
CoStar market fundamentals data as of 4Q 2012
40
44
48
52
56
20
12
20
11
20
10
20
09
20
08
20
07
20
06
20
05
20
04
20
03
20
02
20
01
20
00
19
99
19
98
Squ
are
Feet
in M
illio
ns
Class A Class B & C

Page 34
40
60
80
100
120
140
20
12
20
11
20
10
20
09
20
08
20
07
20
06
20
05
20
04
20
03
20
02
20
01
20
00
19
99
19
98
Squ
are
Feet
in M
illio
ns
Class A Class B&C
Chicago is the business and tourism center of the Midwest. It has a high per capita income and well-
educated workforce. The Chicago Class B and C office inventories are declining on a lesser scale than
that of New York City.
Table 12 - Chicago Office Stock by Class75
75
CoStar/C&W market fundamentals data as of 4Q2012

Page 35
San Francisco‟s thriving economy is attributed primarily to its well-educated and skilled workforce, which
supports income growth. A growing cluster of internet and other tech service companies and workers
supports the office market. San Francisco‟s combined Class B and C inventory is still well above Class A,
but the gap is narrowing as secondary space becomes scarcer and office product is converted to
residential. Like New York, San Francisco‟s Class A office rent pricing will force high growth industries to
the ever diminishing Class B and C space, creating a similar supply/demand gap.
Table 13- San Francisco Office Stock by Class76
76
CoStar/C&W market fundamentals data as of 4Q2012
40
45
50
55
60
65
20
12
20
11
20
10
20
09
20
08
20
07
20
06
20
05
20
04
20
03
20
02
20
01
20
00
19
99
19
98
Squ
are
Feet
in M
illio
ns
Class A Class B & C
Page 36
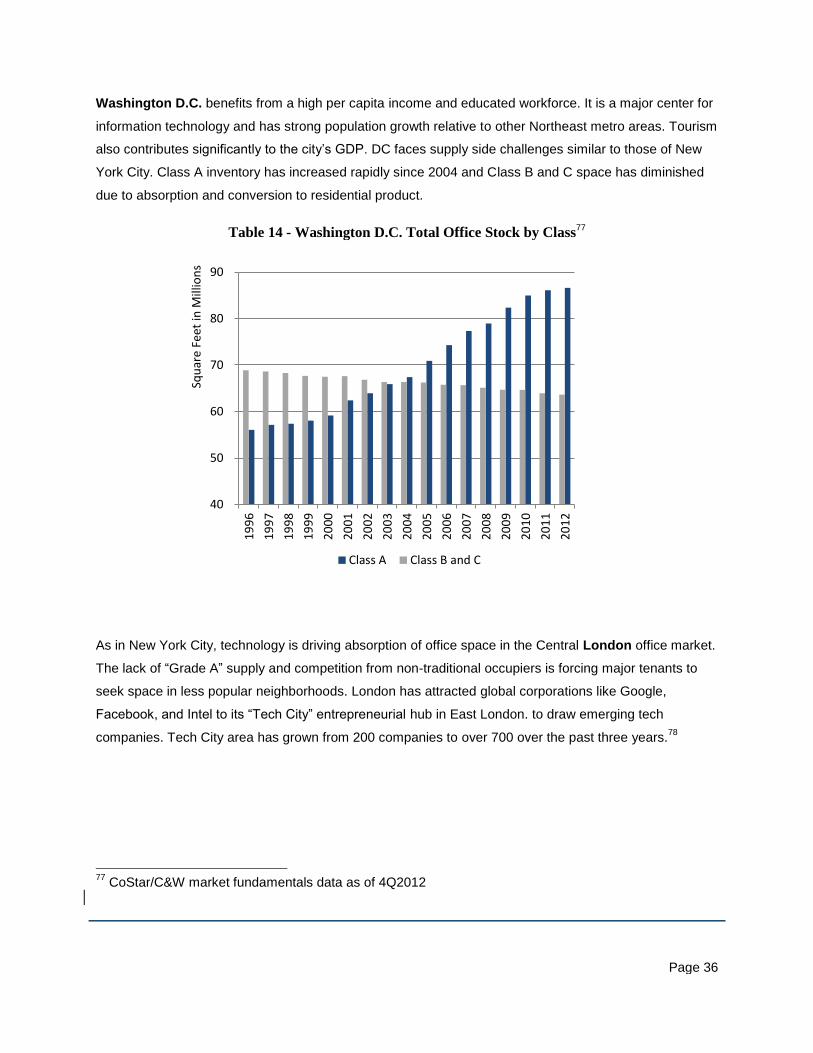
Washington D.C. benefits from a high per capita income and educated workforce. It is a major center for
information technology and has strong population growth relative to other Northeast metro areas. Tourism
also contributes significantly to the city‟s GDP. DC faces supply side challenges similar to those of New
York City. Class A inventory has increased rapidly since 2004 and Class B and C space has diminished
due to absorption and conversion to residential product.
Table 14 - Washington D.C. Total Office Stock by Class77
As in New York City, technology is driving absorption of office space in the Central London office market.
The lack of “Grade A” supply and competition from non-traditional occupiers is forcing major tenants to
seek space in less popular neighborhoods. London has attracted global corporations like Google,
Facebook, and Intel to its “Tech City” entrepreneurial hub in East London. to draw emerging tech
companies. Tech City area has grown from 200 companies to over 700 over the past three years.78
77
CoStar/C&W market fundamentals data as of 4Q2012
40
50
60
70
80
90
20
12
20
11
20
10
20
09
20
08
20
07
20
06
20
05
20
04
20
03
20
02
20
01
20
00
19
99
19
98
19
97
19
96
Squ
are
Feet
in M
illio
ns
Class A Class B and C

Page 37
POLICY IMPLICATIONS
New York City is expected to experience strong office space demand from HGI firms between 2013 and
2025, representing roughly 17.3 msf of office space. The office space preferences of HGI firms, as
described in this report, can frequently be met with existing Class B and C office space. However, New
York City Class B and C office stock (approximately 229 msf as of the fourth quarter of 2012) is projected
to decrease by 7.8 msf between 2013 and 2025. This projected increase in demand for Class B and C
office space coupled with the projected decrease in Class B and C office stock is projected to result in a
gap by 2018. As the gap between demand and supply increases, office prices may rise and businesses
may be less inclined to enter and remain in the New York City market.
In April 2013, in connection with this study, Mayor Bloomberg convened 18 key stakeholders from the
New York City real estate market to discuss the growing demand for office space from a new generation
of HGI firms and the challenges of increasing the supply of affordable office space. The Advisory Group
included some of the leading developers of commercial office space, building owners, brokers,
construction managers, labor representatives, and top executives of HGI tenants.
There was general consensus amongst the Group that:
There has been a shift in the type of firms, and their correlative needs, driving the leasing market
for commercial office space;
The supply of affordable office space is key factor in attracting and retaining higher growth firms;
It is very difficult to create new affordable office space – absent subsidy -- in most New York City
markets; and
So-called “step-out space” is a particularly challenging market segment to address.
In terms of policy implications, for both the public parties and the private market participants, there was a
range of topics discussed, including the:
Role of zoning, tax, and building code policy in shaping the growth of new commercial office
space, particularly at a range of price points;
Limited public awareness and buy-in around the importance of office space to economic
development and job growth; and
Need for continuing collaboration amongst developers/owners, lenders, and labor to address
private market frictions to the market for affordable and flexible commercial office space.

Page 38
Other cities, in contemplating this issue, have tried the following policies:
Washington D.C. Technology Sector Enhancement Act of 2012: provides five-year corporate
income tax abatements to technology firms, sales tax exemptions on certain purchases and
sales, and property tax abatements. The law is an expansion of an earlier program called the
New E-conomy Transformation Act, which authorized the Mayor to enter into master leases for
office space facilities in the District of Columbia and sublease the space to qualified companies.79
Cambridge Low-Cost Office Space Requirements: earlier this year, Cambridge, MA relaxed
zoning restrictions on a $1 billion development plan from the Massachusetts Institute of
Technology on the condition that the university will provide 10 percent of the space to small
tenants at affordable rents. Spaces from 200 sf to 5,000 sf with leases as short as 30 days will be
available. According to a Wall Street Journal article about the requirements for this project,
Cambridge officials anticipate that other developers in the popular Kendall Square area will be
required to develop low-cost office space as well.80
San Francisco Mid-Market Street Tax Exemption: in 2011, San Francisco implemented tax
incentives to encourage businesses to relocate to a blighted section of Market Street. Companies
with a payroll of more than $1 million that move into the Market Street zone could have their
payroll taxes capped for six years, and hiring more employees would not increase the tax bill. The
tax exemption is widely credited with preventing Twitter from relocating outside of San Francisco;
Twitter has since become a major corporate anchor, helping to revitalize the Mid-Market
neighborhood and attract other high-growth technology firms.81
82
The results of these efforts may be helpful case studies for New York City as it continues to consider the
challenges of maintaining an office stock appropriate for the needs of HGI firms. Any specific policies for
New York will need to be studied carefully, taking into account the unique aspects of the market, and in
consultation with key stakeholders like elected officials, the real estate industry, urban planning leaders,
the community and others.
79
Government of the District of Columbia - Office of the Chief Financial Officer 80
“City Mandates Low-Cost Office Space” Wall Street Journal, 4/10/13 81
“Prominent Start-Ups in San Francisco Resist a Payroll Tax” New York Times, 4/3/11 82
“Pay Off in San Francisco” Wall Street Journal, 8/29/12

Page 39
APPENDICES
Methodology
Overview
The future supply and demand analyses are based on real estate industry shift-share forecasting
techniques. The shift share methodology, in conjunction with regression analysis, recognizes that certain
market relationships, empirical data and community sentiments exist which influence the outcome of an
analysis. The shift share methodology is a preferred means of analysis for study horizons which extend
beyond a five year time period where future performance is less predictable and more volatile. Alternative
methodologies, including a rolling average based on historical performance as well as a straight-line
adjustment, place a greater emphasis on past market performance and less emphasis on changes in the
marketplace over time.
Figure 10 - Forecasting Methodology
The A&M analysis includes three distinct but related phases. First, the supply analysis involves an
understanding of how and why the stock of commercial office space has changed over time; this historical
perspective is necessary to explain and validate future performance. The supply analysis also factors in
activities that impact changes in supply such as the deterioration of buildings, conversion of buildings
from one use to another (i.e. office to condominiums), renovation activity to maintain or modify a building

Page 40
class designation without changing the zoned use of the building and existing or planned construction
activity. Second, the demand analysis involves an understanding of the tenant cohorts who occupy space
among the various classes of commercial office stock throughout New York City. The demand analysis
factors in rental rates, building class, location preferences and other tangible and intangible
considerations. Finally, the analysis consolidates the supply and demand results, producing a time series
view of the relationship between supply and demand from 2013 through 2025.
Supply Analysis Methodology
The A&M supply analysis was a three step process of understanding known supply history through 2012,
known future development activity over the following five years to 2017, and projections of supply beyond
2017 considering potential new stock, deterioration of existing stock, and conversion of existing stock to
non-commercial office use. Historic stock was sourced from a combination of CoStar, an industry leading
real estate data and information provider, and Cushman & Wakefield. CoStar was selected based on the
comprehensive nature of its office supply data covering all major product types across each of the
Boroughs. Cushman & Wakefield was selected because it is a leading provider of real estate services in
the New York City area. Supply was forecasted using the current announced development pipeline for the
next five years and a regression model for the subsequent period. The announced development pipeline
includes projects currently in various stages of planning, permitting, and development. This data was
obtained from several sources including F.W. Dodge and Cushman & Wakefield, and was reviewed and
validated by A&M REAS, the NYCEDC and JRT Realty. A&M and JRT estimated completions for each
known pipeline project. New supply beyond 2017 was modeled following the methodology utilized by
CBRE Econometric Advisors. New office supply is a function of office levels with lags, rent levels with
lags, vacancy rate with lags, and office employment with lags. A priori, we expect lags to be different for
each borough due to their unique historical patterns and trends. Rents will initially be forecast as current
rents (non-adjusted for inflation). We utilized inflation rates from the NYCOMB and other reputable third-
party sources to forecast real rents (inflation adjusted), and to also forecast office construction inflation
rates based on Engineering News Record and independent surveyed entities, e.g., Bovis Lend Lease. It
was critical to relate office rental rates with construction costs per square foot to determine when
reasonable new office supply may be delivered to the market from 2018 to 2025.
In addition to the assumptions implied from the preceding overview, other assumptions to the supply
analysis which impact all boroughs include:
The rate of office stock decay of Class A space to Class B or C was forecast to be 0.10 percent
for the Study forecast period. This is in line with historical rate of decay between 1996 and 2012.
Page 41
The rate of conversion of office space to non-office product was forecast to be 0.40 percent for
the forecast period. This is in line with historical rate of conversions between 1996 and 2012.
The rate of Manhattan Affordable Vacant Stock was forecast to be 26.8 percent for the Study
forecast period, based on leasing information provided by C&W and JRT Realty.
As indicated in the regression approach above, future rent projections and construction costs were used
as independent variables to determine the development or conversion of stock within each borough. A&M
utilized adjusted Marshall & Swift and ENR data to determine the relative feasibility of development by
area. Irrespective of developer return on investment and developer cost of capital, construction /
rehabilitation costs and market rents were compared to determine which markets justified rents or, in
other words would garner a break-even investment. Breakeven scenarios were developed for ground-up
construction, rehabilitation, or renovation considering relevant costs such as land, hard costs, soft costs,
capitalization rate, net operating income, operating expenditures; where the sum of the required net
operating income and operating expenditures equals the break-even point. A project break-even point
above market rental rates indicates an environment which is not amenable to proceeding with the project.
A project break-even point below market rental rates indicates an environment which is amenable to
proceeding with the project.
Demand Analysis Methodology
The A&M demand analysis was a multi-step process of understanding total New York City projected
demand through 2025 by extrapolating growth in employment by sector into a corresponding demand for
office space. Employment data was obtained from Moody‟s Economy.com and the United States Bureau
of Economic Analysis (BEA). Employment growth statistics for each industry were reviewed at the NAICS
fourth digit or NAICS Industry Group level. For the purposes of this study, the high-growth industries were
identified as those with a 2012 – 2025 CAGR of at least 2.6 percent. Additional candidates were identified
through primary and secondary market research sources, including market participant interviews, and the
NYCEDC. The final candidate industries include (in order of CAGR):
Healthcare
Technology
Business Services
Education
Non-profit
Advertising

Page 42
Research and Development
Based on empirical data and market research, adjustments were made to each Industry group to reflect
their use of office space as a percentage of total employment as well as assign a square foot per office-
using employee that reflects the nature of the business. For example, 90 percent of business services
employees are office users and each employee occupies approximately 175 square feet. Conversely, 70
percent of non-profit employees are office users and each employee occupies approximately 120 square
feet. The product of growth in employment per high-growth industry sector, percent of employees using
office space, and the square footage per office user yielded an aggregate demand for office space. Our
demand analysis accounts for a reduction in square footage per employee between 2012 and 2025. The
average change was about six percent for the HGI industries over the forecast period. These reduction
assumptions were confirmed by A&M‟s market research, including interviews with market participants, as
well as proprietary industry data.
Demand from non-HGI industries was also forecasted using the same methodology. Employment was
divided into FIRE (Finance, Insurance and Real Estate) and other non-farm employment. An office-using
percentage was then applied to FIRE and other non-farm employment growth between 2013 and 2025 in
order to predict the incremental demand from office-using employment. A square foot per employee
assumption was then applied to the FIRE and other non-farm office-using employment growth in order to
estimate office space demand between 2013 and 2025. The square feet per office-using employee
decreased over the forecast period from 250 in 2012 to 235 in 2025.
While an overwhelming proportion of office space is concentrated in Manhattan, our analysis recognizes
that High-Growth Industries are unique in their space and location requirements. Just as office occupants
are stratified among each of the boroughs today, we anticipate that stratification to hold true in the future
with some Boroughs and sub-markets attracting a lesser or greater share of new demand. Based on
historic rental market data, our analysis further breaks demand down by price point as aligned with the
typical Class A, B and C designations. For the purposes of this Study, „affordable‟ space is defined as
being below $40 per square foot on a base rent basis.
Gap Analysis Methodology
At the conclusion of the supply and demand analyses, A&M compared the model outputs to identify
differences in projected demand and supply. Taken alone, the difference between supply and demand will
indicate a surplus or a deficit of space.
Historically, a Borough-specific „vacancy‟ rate range has existed in New York City. Vacancy can vary by
class of space and sub-market. Ceterus paribus, vacancy rates impact the price elasticity of space within

Page 43
the market. When vacancy rates are low, there may be higher competition for space and, therefore, less
attractive lease terms for the occupant. Conversely, when vacancy rates are high, there may be a „renters
market‟ whereby lease terms are more negotiable.
The gap analysis leverages each of the preceding methodologies to identify how the availability of space
for High-Growth Industries will be impacted over time. Where negative vacancy exists (there is a
projected lack of available space by class or price point), opportunities may exist to create the conditions
necessary to close those gaps. Where positive vacancy exists (there is a projected surplus of space
available by class or price point, or a lack of interest), opportunities may exist to attract occupants to
those locations.

Page 44
Survey Results
A&M and JRT distributed surveys to New York City real estate brokers and tenants via e-mail on January
2, 2013 and received responses through February 13, 2013. The broker survey received 125 responses
and the tenant survey received 43 responses.

Page 45
Tenant Survey Responses
No 7%
Yes 93%
Do you consider this office a HQ location?
less than 2 years 21%
3 - 5 years 35%
6 - 10 years 12%
Greater than 10 years 32%
How old is your company?

Page 46
Note: Other answers included: home office and uniquely retrofitted space with low rent.
Class A 23%
Class B 32%
Class C 14%
Does not currently occupy space
5%
Don't Know 14%
Other (please specify)
7%
Space uniquely retrofitted to meet our firm's needs
5%
Which office space class type do you currently occupy?
0 sq ft 7%
> 1,000 sq ft 12%
1,000 - 1,999 sq ft 19%
2,000 - 4,999 sq ft 23%
5,000 - 9,999 sq ft
14%
10,000 - 24,999 sq ft
14%
25,000+ sq ft 9%
Don't know 2%
How many SQ ft of office space do you lease in your primary office locations?
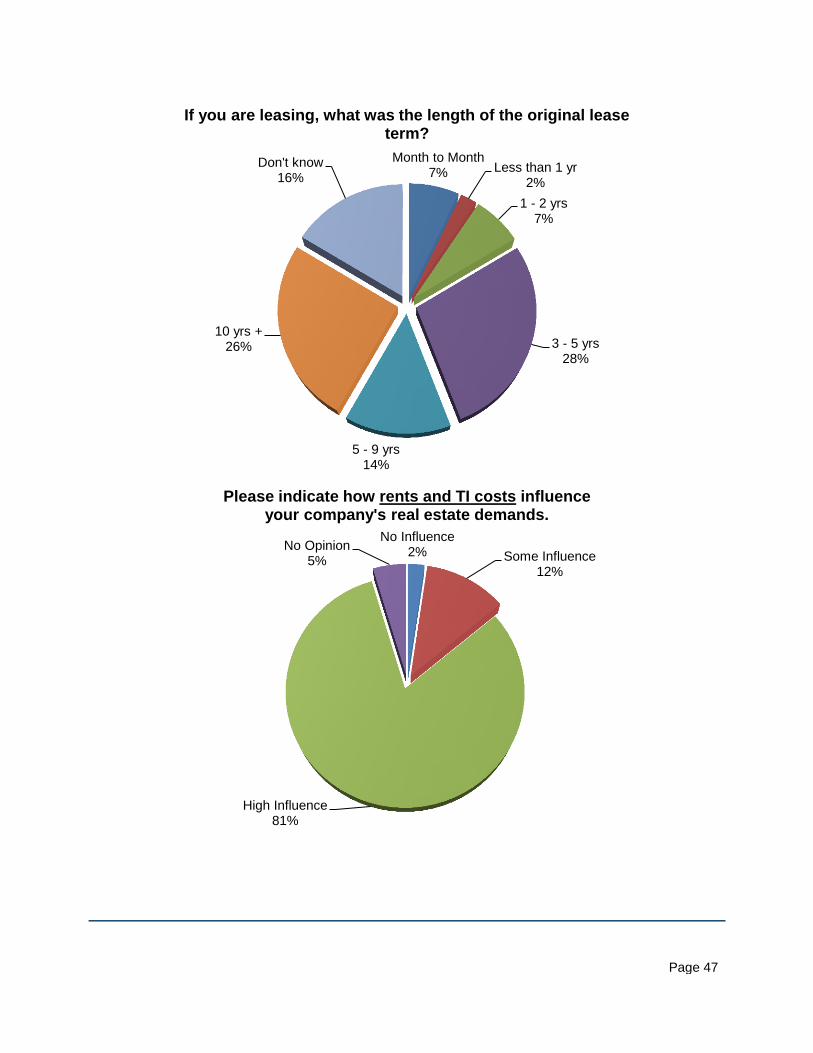
Page 47
Month to Month 7% Less than 1 yr
2%
1 - 2 yrs 7%
3 - 5 yrs 28%
5 - 9 yrs 14%
10 yrs + 26%
Don't know 16%
If you are leasing, what was the length of the original lease term?
No Influence 2% Some Influence
12%
High Influence 81%
No Opinion 5%
Please indicate how rents and TI costs influence your company's real estate demands.

Page 48
No Influence 5%
Some Infuence 30%
High Influence 60%
No Opinion 5%
Please indicate how lease length, termination and expansion provisions influence your company's real estate demands.
Some Infuence 12%
High Influence 81%
No Opinion 7%
Please indicate how proximity to public transportation influences your company's real estate demands.

Page 49
No Influence 42%
Some Infuence 28%
High Influence 18%
No Opinion
12%
Please indicate how labor costs influence your company's real estate demands.
No Influence 32%
Some Infuence 49%
High Influence
12%
No Opinion 7%
Please indicate how proximity to parks and recreational facilites influences your company's real estate demands.

Page 50
No Influence 32%
Some Infuence 49%
High Influence
12%
No Opinion 7%
Please indicate how proximity to restaurants, nightclubs and shops influences your company's real estate demands.
No Influence 68%
Some Infuence 21%
High Influence 2% No
Opinion 9%
Please indicate how proximity to affordable housing influences your company's real estate demands.

Page 51
No Influence 42%
Some Infuence 28%
High Influence 21%
No Opinion
9%
Please indicate how proximity to similar firms influences your company's real estate demands.
No Influence 16%
Some Infuence 30%
High Influence 47%
No Opinion 7%
Please indicate how proximity to customers influences your company's real estate demands.

Page 52
No Influence 49%
Some Infuence 30%
High Influence
12%
No Opinion 9%
Please indicate how proximity to universities/higher education influences your company's real estate demands.
No Influence 30%
Some Infuence 26%
High Influence 32%
No Opinion 12%
Please indicate how proximity to an educated workforce influences your company's real estate demands.

Page 53
No Influence 30%
Some Infuence 51%
High Influence
12%
No Opinion 7%
Please indicate how the regulatory and tax environment influences your company's real estate demands.
No Influence 7%
Some Infuence 35%
High Influence 51%
No Opinion 7%
Please indicate how broadband capacity (high-speed fiber) influences your company's real estate demands.

Page 54
$0 - $20 PSF 14%
$21 - $40 PSF 44%
$41 - $60 PSF 26%
$61 - $80 PSF 9%
No opinion 7%
What do you consider "affordable" on a dollar per sq ft basis?
Relocate to other parts of NYC
26%
Remain in the same location
37%
Try to relocate w/in 10 - 15 blocks
37%
Assuming rents elsewhere remained stable, if your rent were to increase by 10-15% over the next 4 years would you?

Page 55
1 30%
2 12%
3 16%
4 26%
5 16%
Please rate how important large floor plates are to your company. (1=low importance, 5=high importance)
1 26%
2 15%
3 33%
4 8%
5 18%
Please rate how important bike-friendly amenities are to your company. (1=low importance, 5=high importance)

Page 56
1 15%
2 12%
3 10%
4 34%
5 29%
Please rate how important high ceilings are to your company. (1=low importance, 5=high importance)
1 7%
2 25%
3 22%
4 29%
5 17%
Please rate how important large common areas are to your company. (1=low importance, 5=high importance)

Page 57
1 29%
2 17%
3 34%
4 10%
5 10%
Please rate how important a large kitchen is to your company. (1=low importance, 5=high importance)
1 45%
2 17%
3 25%
4 10%
5 3%
Please rate how important exposed brick is to your company. (1=low importance, 5=high importance)

Page 58
1 50%
2 27%
3 18%
4 5%
5 0%
Please rate how important an in building gym is to your company. (1=low importance, 5=high importance)
1 32%
2 30%
3 10%
4 15%
5 13%
Please rate how important high-speed elevators are to your company. (1=low importance, 5=high importance)

Page 59
1 12%
2 12%
3 25%
4 27%
5 24%
Please rate how important large conference rooms are to your company. (1=low importance, 5=high importance)
1 5% 2
10%
3 32%
4 23%
5 30%
Please rate how important large windows are to your company. (1=low importance, 5=high importance)

Page 60
1 57% 2
25%
3 10%
4 3%
5 5%
Please rate how important an in building cafeteria is to your company. (1=low importance, 5=high importance)
1 56%
2 12%
3 15%
4 10%
5 7%
Please rate how important parking is to your company. (1=low importance, 5=high importance)

Page 61
1 7%
2 12%
3 25%
4 18%
5 38%
Please rate how important central air is to your company. (1=low importance, 5=high importance)
1 7%
2 19%
3 22%
4 26%
5 26%
Please rate how important security is to your company. (1=low importance, 5=high importance)

Page 62
1 10%
2 2%
3 20%
4 35%
5 33%
Please rate how important redundant broadband service is to your company. (1=low importance, 5=high importance)
1 32%
2 20%
3 30%
4 15%
5 3%
Please rate how important a separate lobby entrance is to your company. (1=low importance, 5=high importance)
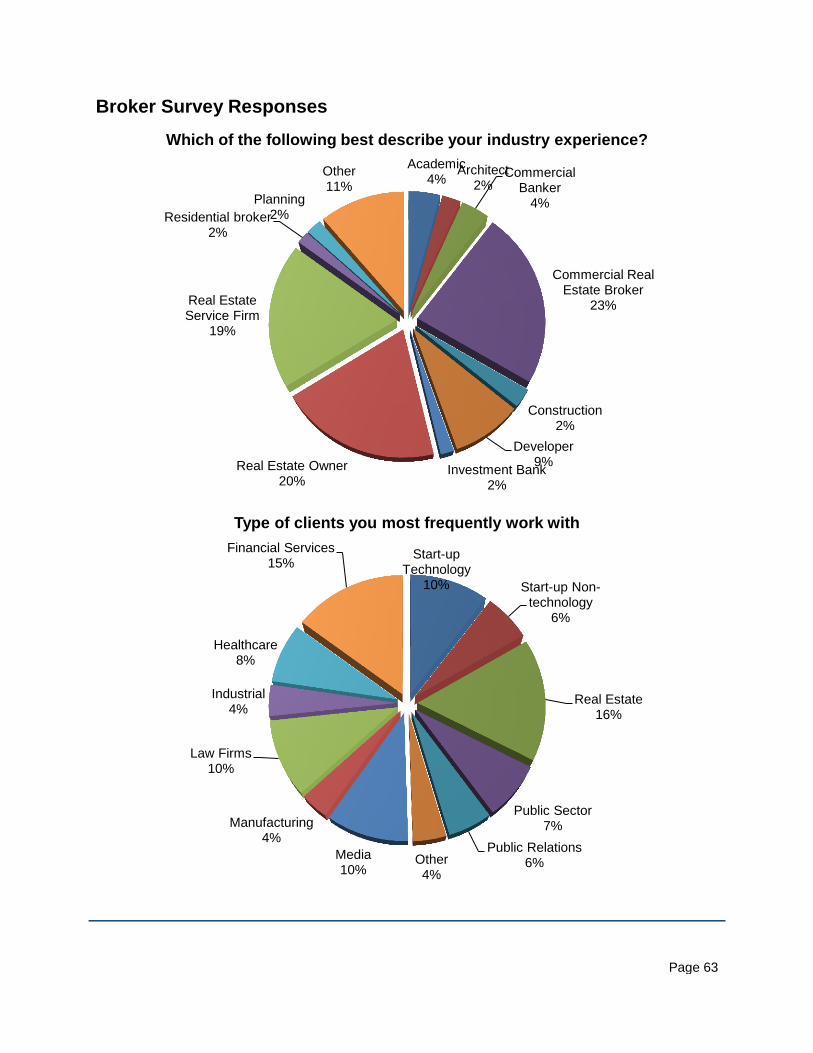
Page 63
Broker Survey Responses
Academic 4%
Architect 2%
Commercial Banker
4%
Commercial Real Estate Broker
23%
Construction 2%
Developer 9%
Investment Bank 2%
Real Estate Owner 20%
Real Estate Service Firm
19%
Residential broker 2%
Planning 2%
Other 11%
Which of the following best describe your industry experience?
Start-up Technology
10% Start-up Non-technology
6%
Real Estate 16%
Public Sector 7%
Public Relations 6% Other
4%
Media 10%
Manufacturing 4%
Law Firms 10%
Industrial 4%
Healthcare 8%
Financial Services 15%
Type of clients you most frequently work with

Page 64
Less than 2 years 4% 2 - 5 years
10%
6 - 10 years 13%
Greater than 10 73%
How many years of experience do you have in your industry?
Cyber-Security 6.2%
Biosciences 6.7%
Social-Media 8.2%
Advanced Pharmaceuticals
3.6%
Financial technology
7.5%
E-Commerce 7.6%
Digital Media 8.2%
Telecommunications
6.4%
Internet-based education technology
6.8%
Green/Clean energy tech
6.1%
High-tech manufacturing
2.6%
Computer systems design 5.8%
Data processing, hosting, and
related services 4.2%
Healthcare 7.2%
Financial Services 6.1%
Real Estate 6.7%
Which of the following industries do you expect will grow in Manhattan, Brooklyn, Queens, Staten Island and/or the Bronx in
the next 10 years?

Page 65
Agree 49%
Neither Agree nor Disagree
14%
Disagree 30%
No Opinion 7%
Do you agree or disagree with the following statement about the NYC area (all boroughs): There is currently sufficient supply of
Class B office space for tenants who seek quality affordable space.
Agree 34%
Neither Agree nor Disagree
24%
Disagree 18%
No Opinion 24%
Do you agree or disagree with the following statement about the NYC area (all boroughs): There is currently sufficient supply of
Class C office space for tenants who seek quality affordable space.
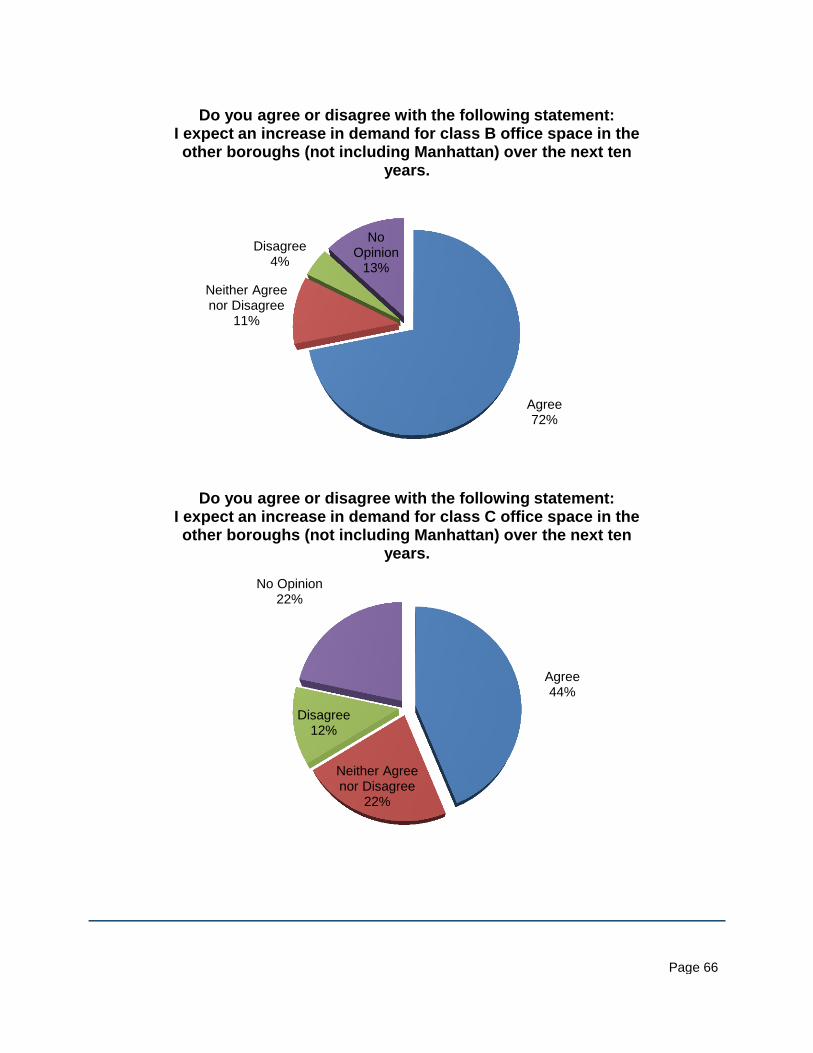
Page 66
Agree 72%
Neither Agree nor Disagree
11%
Disagree 4%
No Opinion
13%
Do you agree or disagree with the following statement: I expect an increase in demand for class B office space in the other boroughs (not including Manhattan) over the next ten
years.
Agree 44%
Neither Agree nor Disagree
22%
Disagree 12%
No Opinion 22%
Do you agree or disagree with the following statement: I expect an increase in demand for class C office space in the other boroughs (not including Manhattan) over the next ten
years.

Page 67
Agree 67%
Neither Agree nor Disagree
14%
Disagree 8%
No Opinion
11%
Do you agree or disagree with the following statement about the NYC area (all boroughs): I expect an increase in demand over
the next 10 years for specialized space that the current A, B and C office space does not satisfy.
Agree 70%
Neither Agree nor Disagree
16%
Disagree 5%
No Opinion 9%
Do you agree or disagree with the following statement about the NYC area (all boroughs): There is a growing demand to create affordable office space for entrepreneurial startup firms that
current, A, B and C office space does not satisfy.