commercial real estate market - investinginrussia.ru filemoscow commercial real estate market 4 st....
TRANSCRIPT

Overview
Content
Executive summary 1
Economy overview 2
Moscow commercial real estate market 4
St. Petersburg commercial real estate market 11
Investment market 18
Commercial Real Estate Market Moscow and St. Petersburg • Q1 2008
Executive Summary • Oil prices crossed the psychologically important threshold of $100 per barrel for the first
time.
• New office openings in the Q1 2008 were 313,000 sq m, which is 44% more than in the same period of 2007. We would emphasise that new volumes in Class A increased by more than four times thanks to such prominent developments as Western Tower, the Federation complex, and first stages of the Legion II and Legion III complexes.
• Warehouse growth rates slowed in Q1 2008 due to the international slowdown in business activity.
• Total stock of professional shopping centres in Q2 2008 will exceed 5 mln sq m.
• Average daily rate (ADR) in Moscow hotels continues to rise. Moscow and Paris shared first place in Europe by ADR in Q4 2007. But lower occupancy means that revenue per available room is lower than in London and Paris.
• Supply of high–quality office premises in St. Petersburg increased by 9% in Q1 2008. Supply of Class A business centres increased by 36%, while growth in Class B was only 5%.
• Total space at logistics centres scheduled to open in 2008 in St. Petersburg is 600,000 sq m. Plans for total 2 mln sq m have been announced.
• Total supply on the St. Petersburg commercial property market in Q1 2008 was over 3.2 mln sq m

2 Moscow and St. Petersburg Commercial Real Estate Market • Q1 2008 Knight Frank
www.knightfrank.ru
Economic ReviewKey events
• The US Federal Reserve lowered its refinancing rate three times during the quarter in an attempt to
alleviate liquidity shortages on capital markets, caused by negative impact of the mortgage crisis and
investor concerns about onset of a recession. The rate was lowered from 4.25% to 3.50% on 22 January,
then to 3.00% on 30 January and 2.25% on 18 March. Many experts expect further cuts towards a zero rate
in coming months.
• At the end of January the Russian government decided to extend agreements with food producers and
large retail chain on a price freeze for main food items (bread, milk, kefir, etc.) in order to combat inflation.
The freeze will be in place until 1 May, 2008.
• The Bank of Russia raised its refinancing rate by 0.25 p.p to 10.25% on 4 February, 2008, as part of efforts
to put a brake on price growth. The action reversed a 10–year process of refinancing rate reductions.
• On 11 March the international rating agency Standard & Poors raised its outlook for Russia’s sovereign
credit rating on long–term foreign currency debt from stable to positive. The last occasion when S&P
raised its outlook for Russia was in February 2002, and that was followed six months later by upward
revision of the rating itself.
• On 27 March Moody's international rating agency put its rating for the Russian Federation under review
with possibility of an upgrade. The current rating level is Baa2 (equivalent to BBB at other agencies).
Moody’s said that the possible upgrade reflects macroeconomic stability and the government’s positive
credit record in recent years.
Economic growth and inflation
The Russian Ministry of Economic Development and Trade reported that GDP grew by 7.8% in Q1
2008 (compared with 8.2% in Q1 2007). Growth was mainly due to acceleration of consumption and
investment demand in a context of expansion by processing industries.
Inflation in Q1 2008 was 4,8% (2.3% in January, 1.2%, in February and 1.2% in March) compared with
3.4% in the same period last year (1.7% in January, 1.1% in February and 0.6% in March).
The higher level compared with previous years is mainly due to rapid increase of prices for foodstuffs,
particularly fruit and vegetables. Food prices rose worldwide during this period.
International reserves, Reserve Fund and National Prosperity Fund
According to Bank of Russia statistics, international reserves in mid–March were at an extraordinarily high
level of over $0.5 trillion, which is more than 40 times higher in nominal terms than the reserve level at the
end of 1998.
Oil prices went above the psychologically important barrier of $100 per barrel in Q1 2008, reaching a level
of $100.01 at the close of trading on 19 February at the New York Commodities Exchange. Prices for oil
exceeded $110 per barrel on some days in March.
“Russia’s international reserves reached $0.5 trillion”.
2007 2008
Source: Russian Ministry of Finance, 2008
140
120
100
80
60
40
20
0
Nominal GDP, $ billion
2007 2008
* Consumer price index value, on an accrual basis from the start of the corresponding year
Source: Russian Ministry of Finance, 2008
Cumulative Inflation*, %
12
11
10
9
8
7
6
5
4
3
2
1
0
Jan
uar
y
Feb
ruar
y
Mar
ch
Ap
ril
May
Jun
e
July
Au
gu
st
Sep
tem
ber
Oct
ober
Nov
emb
er
Dec
emb
er
Jan
uar
y
Feb
ruar
y
Mar
ch
Ap
ril
May
Jun
e
July
Au
gu
st
Sep
tem
ber
Oct
ober
Nov
emb
er
Dec
emb
er

Knight Frank Moscow and St. Petersburg Commercial Real Estate Market • Q1 2008 3
www.knightfrank.ru
The average price per barrel for Urals crude oil was $88.4 in January and $90.6 in February 2008, which is
70% higher on average than in the same period of 2006.
The Russian Stabilisation Fund had accumulated 3,851.8 billion rubles as of 30 January, when it was
divided into two parts in accordance with the new Budget Code, which was approved in spring 2007.
A sum of 3,069 billion rubles was transferred to accounts of the Reserve Fund and 782.8 billion rubles were
transferred to the National Prosperity Fund.
Stock Market
Negative impact of the international liquidity crisis was decisive for the Russian stock market in the first
quarter. A major fall in January (the RTS Index lost more than 19% between 15 and 23 January) was only
partially mended in the rest of the quarter, and the RTS Index lost 10.7% overall in Q1 2008, ending the
quarter at 2054 points.
RTS index and oil prices*
Source: Bank of Russia, 2008
500
400
300
200
100
0
Russia’s international reserves, $ billionJa
nu
ary,
200
8
Feb
ruar
y , 2
008
Dec
emb
er, 2
007
476.39 483.23 490.66
Source: Bank of Russia, 2008
180
150
120
90
60
30
0
Reserve Fund and National Prosperity Fund, $ billion
156.81 157.38
127.81
32.22
Stabilisation Fund
Reserve Fund
National Prosperity Fund
* InterContinental Exchange FuturesSource: Russian Trading System, ICE, 2008
RTS Index Oil price
2,400
2,300
2,200
2,100
2,000
1,900
1,800
110
105
100
95
90
85
80
$ per barrelpoints
09.01.08 29.01.08 18.02.08 07.03.08 27.03.08
Jan
uar
y, 2
008
Feb
ruar
y , 2
008
Dec
emb
er, 2
007

4 Moscow and St. Petersburg Commercial Real Estate Market • Q1 2008 Knight Frank
www.knightfrank.ru
Moscow Office MarketKey indicators Class A Class B+ Class B–
Total high–quality class stock, mln sq m 7.31
including, mln sq m 1.21 4.0 2.1
Commissioned in Q1 2008, mln sq m 313
including, mln sq m 113 150 50
Vacancy rate, % 1.05 3.4 5.4
Base rents*, $ per sq m per annum 950–1,650 700–1,150 450–620
Operating expenses , $ per sq m per annum 110–150 90–110 60–90
Sale prices, $ per sq m 9,000–12,000 5,500–8,500 4,000–5,500
* Excluding operating expenses and VAT (18%)
Source: Knight Frank Research, 2008
Trends
• Large Russian and foreign companies are renting large spaces in expectation of future business growth.
Increase in the size of space rented has been accompanied by a change in geographical preferences.
Annual rents for high–quality space in Central Moscow are now at levels of $1,700–2,000 per sq m, and
there is growing demand for alternatives of comparable quality (A/B+) in the Third Transport Ring and
MKAD regions, where annual rents are several times lower ($450–900 per sq m per annum).
• Another important trend is development of a new system for payment of operating expenses.
Increasingly, owners of high–quality office premises are using an open–book system, by which all
possible payments are included in operating expenses and the tenant pays an average rate. Actual costs
attributable to individual tenants are then calculated at the end of the year and relevant reallocations are
made. The open–book system protects both sides from paying over the odds for operating expenses.
• Increasingly, owners are setting an artificial dollar–rouble exchange rate in order to cope with
devaluation of the US currency. The rate is usually fixed at 24–28 roubles to the dollar. Some owners of
high–class properties are choosing to abandon the dollar altogether and calculate payments in euros.
Key events
• TNK–BP signed a preliminary agreement in Q1 2008 to rent 37,000 sq m in the Western Gates business
park at Belovezhskaya street, 21. The deal confirms movement of supply and demand towards the MKAD,
where quality A/B+ office space can be rented 2–2.5 times more cheaply than in the city centre. Previously,
the biggest such deal had been the agreement by IBS to rent 36,850 sq m in the Nordstar Tower office
centre.
• Another important event is market entry by the development company, Evocom, which has presented
two new projects. The first is for a 23–storey Class A office centre with hotel at Oktyabrskaya street , 98
(total space of 44,000 sq m). The other project is a 180,000 sq m multi–functional complex as part of the
Orekhovo/Domodedovo business park. The complex will include a hotel for 250 guests and a Class A office
centre.
“Rents for high–quality office premises rose by 4–7% on average in Q1 2008. Average rents at the end of the period not including operating expenses and VAT were $1180 per sq m per annum for Class A, $835 for Class B+ and $520 for Class B–”.
Nagatino iLand,
Nagatinskaya poima

Knight Frank Moscow and St. Petersburg Commercial Real Estate Market • Q1 2008 5
www.knightfrank.ru
А 36%
В+48%
В–16%
• IFK Metropol presented a project for construction of a new business zone, Metropolia, on Volgogradsky
Prospect. An area of 21 hectares will be developed with Class A office buildings (700,000 sq m), retail
facilities (40,000 sq m), apartments (80,000 sq m) and 3–4* hotels (40,000 sq m). The master plan has
been prepared by the high–profile firm of architects, Nikken Sekkei.
• DC–Development (part of DON–Stroi) also presented new projects in Q1 2008. The developer will built
a multi–functional complex in Strogino with total space of 650,000 sq m and the Donskoy multi–functional
complex with more than 430,000 sq m of commercial real estate at 5th Donskoy passage.
Supply
Total 313,000 sq m of high–quality office premises was commissioned in Q1 2008, of which 113,400 sq m
are Class A, 149,900 are Class+ and 49,600 are Class B–.
We estimate that volumes of quality office space will double by 2011–2012 if all of the projects planned for
2008–2011 are implemented.
Key projects commissioned in Q1 2008
Name Address Total office space, sq m
Class A
Federation Complex, Western Tower Krasnopresnenskaya emb., 13 80,800
Legion II, phase 1 Bolshaya Tatarskaya str., 13 22,500
Legion III, phase 1 Kievskaya str., 3–7 17,700
Class B+
Riga Land, phase 1* Novorizhskoye hw., 7 km 36,200
Victoria Plaza Baumanskaya str., 6 20,700
Office building 2nd Spasonalikovskiy ln., 6 18,100
Office building Barklaya str., 6 15,400
Office building Pakgauznoye hw., 1 12,600
Class B–
Office building Timiryazevskaya str, 1 bld. 5 11,000
Office building Golubinskaya str, 4 8,500
Moskvich business centre Volgogradsky av., 42/8 5,900
Office building Butirskaya str., 76, bld. 2 5,400
* Knight Frank is project consultantSource: Knight Frank Research, 2008
Breakdown of office space commissioned in Q1 2008 by classes
Source: Knight Frank Research, 2008
Source: Knight Frank Research, 2008
7
6
5
4
3
2
1
0
Vacancy rate, %
Q1
200
6
IQ2
200
6
Q3
200
6
Q4
200
6
Q1
200
7
Q2
200
7
Q3
200
7
Q4
200
7
Q1
200
8
Class А Class В
Diamond Hall business centre
Olimpiysky av., bld. 12/16
6 Moscow and St. Petersburg Commercial Real Estate Market • Q1 2008 Knight Frank
www.knightfrank.ru
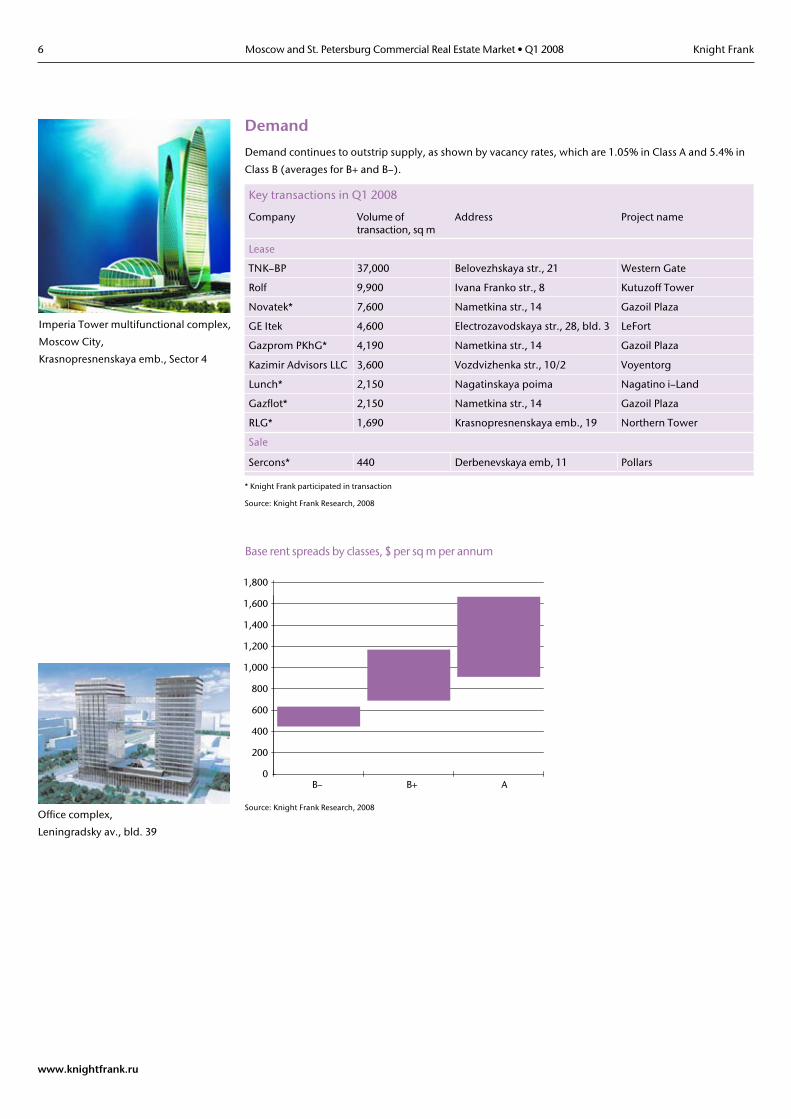
Demand
Demand continues to outstrip supply, as shown by vacancy rates, which are 1.05% in Class A and 5.4% in
Class B (averages for B+ and B–).
Key transactions in Q1 2008
Company Volume of transaction, sq m
Address Project name
Lease
TNK–BP 37,000 Belovezhskaya str., 21 Western Gate
Rolf 9,900 Ivana Franko str., 8 Kutuzoff Tower
Novatek* 7,600 Nametkina str., 14 Gazoil Plaza
GE Itek 4,600 Electrozavodskaya str., 28, bld. 3 LeFort
Gazprom PKhG* 4,190 Nametkina str., 14 Gazoil Plaza
Kazimir Advisors LLC 3,600 Vozdvizhenka str., 10/2 Voyentorg
Lunch* 2,150 Nagatinskaya poima Nagatino i–Land
Gazflot* 2,150 Nametkina str., 14 Gazoil Plaza
RLG* 1,690 Krasnopresnenskaya emb., 19 Northern Tower
Sale
Sercons* 440 Derbenevskaya emb, 11 Pollars
* Knight Frank participated in transaction
Source: Knight Frank Research, 2008
Imperia Tower multifunctional complex,
Moscow City,
Krasnopresnenskaya emb., Sector 4
Office complex,
Leningradsky av., bld. 39
Base rent spreads by classes, $ per sq m per annum
Source: Knight Frank Research, 2008
1,800
1,600
1,400
1,200
1,000
800
600
400
200
0B– B+ A

Knight Frank Moscow and St. Petersburg Commercial Real Estate Market • Q1 2008 7
www.knightfrank.ru
Moscow Warehouse MarketKey indicators Class А Class B
Total quality stock, mln sq m 2.790 1.775
including, mln sq m 8.765
Constructed in Q1 2008, thousand sq m 110 15
Project planned for delivery in 2008, thousand sq m 800
Vacancy ratio, % 0.4 0
Rental rates, $ per sq m per annum* 130–145 118–160
* Not including VAT, operating expenses and utilities
Source: Knight Frank Research, 2008
Trends
• Warehouse growth rates have slowed due to the international slowdown in business activity. Western
developers are in wait–and–see mode, showing caution in choice of development projects in Russia.
• Leading developers have set rental rates of $130–145 per sq m per annum for warehouse space (not
including utilities, operating expenses and VAT). But property coming onto the market can be leased at
higher rates (up to $170) due to supply shortages.
Key events
• Leading warehouse players, Eurasia Logistic and MLP, have postponed opening dates for next phases of
their logistics complexes, PLK Northern Domodedovo and MLP Podolsk, from 2008 to the start of 2009.
• Aksis&Co said that it will build the Ternovo–2 industrial park at a 206–hectare site in Kashirsky District of
Moscow Region. No time scale was set.
• Regions bordering Moscow Region have entered the race to attract foreign investments. Lemkon (part
of Finnish Lemminkainen) announced creation of a 500,000 sq m industrial park in Kaluga Region. Knight
Frank is exclusive consultant to the project.
Supply
There was overall decline in construction volumes in Q1 2008, but the Tomilino Complex with
100,000 sq m of warehouse space was opened.
Demand
As well as deferred demand due to shortage of large warehouse space, the market is starting to experience
surplus demand due to reduced warehouse construction rates.
“High rates for class B are due to shortage of small premises in class A complexes”.
* Not including VAT, operating expenses and utilities
Source: Knight Frank Research, 2008
160
140
120
100
80
Trends in Class A and B rental rates, $ per sq m per annum*
Class А Class В
Q1 2005 Q1 2006 Q1 2007 Q1 2008
500,000
400,000
300,000
200,000
100,000
0
Levels of demand by areas in Q1 2008, sq m
nor
th–e
ast
wes
t
nor
th–w
est
Mos
cow
east
sou
th–w
est
sou
th–e
ast
un
dec
ided
nor
th
sou
th
Source: Knight Frank Research, 2008

8 Moscow and St. Petersburg Commercial Real Estate Market • Q1 2008 Knight Frank
www.knightfrank.ru
Moscow Retail MarketKey indicators
Total stock of shopping centres, mln sq m 4.978
Gross leasable area, mln sq m 2.773
Total stock commissioned in 1Q 2008, thousand sq m 123
Gross leasable area commissioned in Q1 2008, thousand sq m 58
Vacancy rate, % 1.8
Source: Knight Frank Research, 2008
Key Events
• Tesco Plc, operator of one of the largest supermarket chains in the UK, announced plans to build its first
shops in Russia. The company is currently in negotiations to find specific premises.
• IKEA has bought 50 hectares adjacent to the town of Mytishchi, near the village of Chelobytevo in
Moscow Region. The Swedish company will build about 400,000–500,000 sq m of retail, office and hotel
space. Opening of the first phase is scheduled in 2010.
• The company Eurasia City will built a satellite town for 150,000 people near the village of Constantinovo.
The project is for construction of 2.6 mln sq m of commercial space, including a regional–scale retail and
entertainment centre.
Supply
Retail centres opened in Q1 2008
Opening date Name Size, sq m Address
Total GLA
27 February Oblaka 95,900 42,500 Orekhovy blvd, 22а
1 March Neglinnaya Plaza 27,000* 15,500 Trubnaya sq., 4
* Space in retail sectionSource: Knight Frank Research, 2008
Commercial terms
Type of offered premises Profile of commerce Rental rate, $ per sq m per annum
Premises of anchor tenants Food hypermarkets, other shops with space under 1,500 sq m
100–350
Supermarkets, other shops with space under 1,500 sq m
180–560
Premises of shopping galleries*
Children’s goods, books, services 400–900
Clothes, footwear 1,050–2,100
Leather accessories, trinkets, gifts, jewellery, mobile phones
2,100–6,000
* Rent for stores measuring about 100 sq m on the ground–floor Source: Knight Frank Research, 2008
“There was increased demand in Q1 2008 from public catering operators and retailers of accessories”.
Voskresensk Retail Centre, with 16,000
sq m of space, opened in Q1 2008.
Knight Frank was exclusive consultant
to the project.
Clothes,22.4%
Other,10%
Public catering,10.5%
Food,3.9%
Retail demand by business type
Source: Knight Frank Research, 2008
Accessories,11.1%
Health and beauty,8.2%
Services,6.6%
Gifts, flowers, art,4.7%
Mother and child,4.5%
Home goods,3.7%
Footwear,2.6%
Financial services,5.8%
Books and multimedia,2.6%
Furniture,2.6%

Knight Frank Moscow and St. Petersburg Commercial Real Estate Market • Q1 2008 9
www.knightfrank.ru
Moscow Hotel MarketKey indicators*
Total number of hotels in operation 141
Room stock (number of rooms) 28,856
Hotels opened in Q1 2008 2
Room stock of hotels opened in Q1 2008, rooms 222
* Data is given for 3–5* hotels
Source: Knight Frank Research, 2008
Hotels opened in Q1 2008
Name Address Category Room stock, rooms
Park Inn Sadu Bolshaya Polyanka str., 17 4* 118
Okhotnik Golovinskoye hw., 1 3* 104
Source: Knight Frank Research, 2008
Forecast
• Knight Frank expects increase of 3–5* room stock in the capital by about 1,000 rooms during 2008.
• Occupancy rates will stay relatively low (68–70%) due to limited flow of tourists (about 4.5 mln in 2008)
and high ADR.
“Construction of hotels as part of multi–functional complexes is developing rapidly”.
ADR, $ per day
Revenue per available room (RevPAR), $ per day
Occupancy rate, %
* Data is given for 3–5* hotels
Source: TRI Hospitality Consulting, 2008
Most expensive tourist centres in Europe by ADR, Q4 2007
4*28.6%
3*61.8%
Room stock in Moscow hotels by category,% of total room stock
Source: Knight Frank Research, 2008
5*9.6%
250
200
150
100
50
0
90
80
70
60
50
40
30
20
10
0Paris Moscow London
$ per day %
Ritz Carlton,
Tverskaya str., 3–5

10 Moscow and St. Petersburg Commercial Real Estate Market • Q1 2008 Knight Frank
www.knightfrank.ru
St. Petersburg Office MarketKey indicators Class А Class В
Total high–quality class stock, thousand sq m 857.4
including, thousand sq m 138.5 718.9
Commissioned in Q1 2008, thousand sq m 69.9
including, thousand sq m 37.0 32.9
Vacancy rate, % 7.4 3.1
Base rents*, $ per sq m per annum 610–1,250 355–850
* Not including VAT (18%), including operating expenses (not separated from rent, according to current practice in St. Petersburg)Source: Knight Frank Research, 2008
Trends
• There was faster growth in volumes of quality office space on the market, particularly in Class A.
Total volume of new openings doubled y–o–y.
• Rents rose strongly in the first quarter due to overall market development and reviews of rent agreements
in the New Year.
• Opening schedules continue to be missed. Most projects, which were due to open in the first quarter,
have been put back by a few months.
Key events
• Evli Property Investment acquired a business property, the Kellermann Centre. Deal amount was not
disclosed.
• The St. Petersburg Government decided at the start of 2008 to demolish the existing Marine Passenger
Terminal on Vasilievskiy Island and replace it with a multi–functional complex, including a new passenger
terminal to serve small vessels, a business centre, hotel and retail complex.
• The first high–rise commercial project was announced in Moskovskiy District. The 124–meter building
will include a class A business centre, hotel and apartments, restaurants and helipad.
Supply
Supply of quality space increased by 9% in the first quarter. Supply of space in class A business centres
increased by 36% while growth in class B was only 5%.
Trends in average office rents for classes A and B ($ per sq m per annum, excluding VAT)
Class А Class В
Source: Knight Frank Research, 2008
900800700600500400300200100
0 Q1 2007 Q2 2007 Q3 2007 Q4 2007 Q1 2008
Ovental History,
Sotsialisticheskaya str., 14
Kellermann Center,
10th Krasnoarmeyskaya str., 22

Knight Frank Moscow and St. Petersburg Commercial Real Estate Market • Q1 2008 11
www.knightfrank.ru
Key projects opened in Q1 2008
Name Address Developer Total space, sq m
Class А
Renaissance Plaza Marata str., 69/71 Renaissance Development
36,000
Class В
Ovental History Sotsialisticheskaya str., 14 Spetsproekt 10,000
Sodruzhestvo (phase 2) Kolomyazhskiy av., 33 Sodruzhestvo 12,000
Source: Knight Frank Research, 2008
Demand
Vacancy rates in Q1 2008 were 7.4% in class A business centres and 3.1% in class B centres. The high
vacancy rate in class A mainly reflects incomplete occupancy at the recently opened Renaissance Plaza.
Occupancy in most buildings that have been open for a longer period is close to 100%.
Commercial terms
Rents for operating class A premises vary in a range from $610 to $1,250 per sq m per annum including
operating expenses but not including VAT. Class B rents vary from $355 to $850 per sq m per annum.
Forecast
We expect more investment deals in the office segment in 2008, including sale of the Aeroplaza Business
Centre in Pulikovo–3 business zone. The buyer is likely to be a western investment fund.
“There was faster growth in volumes of quality office space on the market, particularly in Class A. Total volume of new openings doubled y–o–y”.
Vacancy rate (%)
Class A vacancy rate Class B vacancy rate
Source: Knight Frank Research, 2008
8
7
6
5
4
3
2
1
0 Q1 2007 Q2 2007 Q3 2007 Q4 2007 Q1 2008
Renaissance Plaza,
Marata str., 69/71

12 Moscow and St. Petersburg Commercial Real Estate Market • Q1 2008 Knight Frank
www.knightfrank.ru
St. Petersburg Warehouse MarketKey indicators Class A Class B
Total quality stock, thousand sq m 887.1
including, thousand sq m 388.4 498.7
Vacancy rate, % 1.5 3
Rental rates (triple net), $ per sq m per annum* 125–145 115–130
Operating expenses, $ per sq m per annum 30–35 25–30
* Без учета НДС, операционных расходов и коммунальных платежей Source: Knight Frank Research, 2008
Key events
• A subsidiary of Finnish SRV Group stated plans for a logistics complex on 24.9 hectares near KAD in the
northern part of St. Petersburg. Construction of the complex with 100,000 sq m of space will be in three
phases. The Finnish company will consider selling the project to an investor. The company estimates yield
at 10.0–10.5% per annum.
• Hon Hai Precision Industry (a contract producer of electronics under the Foxconn brand) signed an
agreement with Eurasia Logistics to buy 12 hectares at the Kollino Logopark (logistics park), which is being
built by Eurasia. Investments by Foxconn in land purchase and construction of a factory are about $50 mln.
The plot is already connected to utilities and work should start in Q1 2009.
• Sterkh corporation is developing plans for a logistics complex, to be called Osinovaya Roshcha (“Aspen
Grove”), on a 47–hectare plot near the village of Pargolovo. The complex should include dry and low–
temperature warehousing with about 130,000 sq m total space.
Demand
There is large excess demand on the market for high–class warehousing. We do not expect initial market
saturation before the end of 2012.
Main projects scheduled to open in 2008
Name Address Class Area, sq m Developer
Kolpino Industrial Park (phase 1)
Shushari Industrial Zone A 239,900 Eurasia Logistics
MLP Utkina Zavod (phase 2) Novosaratovka A 110,000 MLP
Neva Logopark Shushari Industrial Zone A 133,000 GK Avalon
Gorigo (phase 1) Gorelovo Industrial Zone A–B 75,000 EVLI Property Investments
AKM Logistics (phase 1) Shushari Industrial Zone A 52,600 Venture Investments & Yield Management
Teorema Terminal (phase 2) Obukhovskoi Oborony emb., 295
A+ 33,270 UK Teorema
Eurosib–Shushari Shushari Industrial Zone A 20,000 Eurosib–Terminal
Interterminal–Predportovy Kubinskaya str., 75/1 A 12,850 Big City, Green Mark
Source: Knight Frank Research, 2008
“We do not expect initial market saturation before the end of 2012”.
MLP Utkina Zavod, St. Petersburg,
Interior side of KAD, between Vantovy
Bridge and Murmansk highway
3,000
2,500
2,000
1,500
1,000
500
0
Supply Demand
Supply and demand on the high–class warehousing market, thousand sq m
Source: Knight Frank Research, 2008
2005 2006 2007 2008F 2009F

Knight Frank Moscow and St. Petersburg Commercial Real Estate Market • Q1 2008 13
www.knightfrank.ru
St. Petersburg Retail MarketKey indicators
Total stock of shopping centres, mln sq m 3.230
Gross leasable area, mln sq m 2.400
Total stock commissioned in Q1 2008, thousand sq m 119.2
Gross leasable area commissioned in Q1 2008, thousand sq m 86.2
Vacancy rate, % 4–6
Base rents, $ per sq m per annum: anchor tenants 100–500
shopping gallery operators 500–2,500
Source: Knight Frank Research, 2008
Key events
• A second Real hypermarket with total 16,000 sq m space was opened in St. Petersburg (in the Northern
Mall Retail Centre).
• Ramstor announced plans for a retail complex under the company name near the village of Ruchi (total
space will be 52,800 sq m).
• Plantation & General Investments acquired 12 property assets in central St. Petersburg including the
Kalinka Stockmann on Finlyandkskiy av. and Adidas shop premises on Malaya Sadovaya str. and
Bolshoy av., Petersburg Side.
• Glavstroy won a tender for reconstruction of the Apraksin Dvor territory. The project is for creation of
80,000 sq m of retail and entertainment space.
• The Finnish company S–Group announced plans for development of a chain of Prisma shops in
St. Petersburg. The company wants to open 15–20 shops by the end of 2015.
• Vegas is reprofiling its chain following closure of gambling establishments in the city. Jewellery shops
under the “For you” brand will be opened in place of “Yakor” gambling arcades.
Supply
There were 5 retail centre openings in St. Petersburg with total 119,200 sq m (gross leasable area
86,200 sq m) during Q1 2008.
Main large–scale retail centres opened in Q1 2008
Name Area, sq m Address Developer
Total GLA
Atlantic–City Retail and Office Centre
48,000 30,000 Savushkina str. SK Atlantik
Northern Mall (phase 1) 34,000 27,130 Kulturi av./KAD Meinl European Land
Source: Knight Frank Research, 2008
So, by the end of Q1 2008 there were 149 retail and retail–and–entertainment centres operating in
St. Petersburg with total space of 3.23 mln sq m (gross leasable area 2.4 mln sq m).
“The start of 2008 saw a slowdown in openings of new retail centre space. Volume of openings in the first quarter was 94.4% of the figure in the same period of 2007”.
Interio Trade and Entertainment Centre,
Bogatyrskiy av., 14

14 Moscow and St. Petersburg Commercial Real Estate Market • Q1 2008 Knight Frank
www.knightfrank.ru
Forecast
30 retail centres are scheduled to open in Q2–Q4 2008 with total space of 664,700 sq m, and gross leasable
area of 485,900 sq m.
Largest retail centres scheduled to open in Q2–Q4 2008
Name Area, sq m Address Developer Opening (quarter)
Total GLA
Slovatsky Dom Retail and Entertainment Centre
101,000 70,100 Belgradskaya str./ Salova str.
GK Tashir Q4
City Mall Retail and Entertainment Centre (phases 2–3)
91,800 60,500 Kolomyazhskiy av./Ispitateley av.
OOO Makromir Q3
Felicita/Irridium Retail and Entertainment Centre (phases 2–3)
83,000 63,000 Dalnevostochny av./ Kollontai str.
OOO Makromir Q2–3
Atmosphera Retail and Entertainment Centre
47,222 20,860 Komendantskaya sq. Adamant Holding Q3
Kupchino Retail and Entertainment Centre
24,840 15,182 Balkanskaya M. str., 57 RTM Q3
Interio Retail and Entertainment Centre
24,200 18,000 Bogatyrskiy av., 14 Interio Q2
Source: Knight Frank Research, 2008
“Total supply on the St. Petersburg commercial property market in Q1 2008 was over 3.2 mln sq m with gross leasable area of 2.4 mln sq m”.
Retail space openings in St. Petersburg, thousand sq m
Source: Knight Frank Research, 2008
Total space, sq m GLA, sq m
1,200
1,000
800
600
400
200
0 2001 2002 2003 2004 2005 2006 2007 Q1 2008

Knight Frank Moscow and St. Petersburg Commercial Real Estate Market • Q1 2008 15
www.knightfrank.ru
St. Petersburg Hotel Market Key indicators
Total number of hotels in operation, 3–5* 82
Room stock* 12,672
Number of hotels opened in Q1 2008* 1
Room stock at hotels opened in Q1 2008* 278
Number of hotels scheduled to open in 2008* 8
Room stock at hotels scheduled to open in 2008* 1,324
* Not including mini–hotels** and out–of–town hotels** Hotels with less than 20 roomsSource: Knight Frank Research, 2008
Trends
• The hotel market is expanding to new districts of St. Petersburg in 2008. There are new hotel projects
away from the city centre, including peripheral zones far from the airport.
• The share of business guests in total guests at hotels is gradually increasing. This reflects increase of
business activity in the region.
• More multi–functional complexes are being built with hotels included. Demand in this segment will be
driven mainly by increase in numbers of inter–regional and international companies on the market.
Key events
• The St. Petersburg city planning council approved plans for development of land at Moscow Goods
Railway Station, including three 3–4* hotels with 650–700 rooms.
• The Norwegian fund Linstow bought a hotel, which is now under construction at the corner of Liteiny av.
and Tchaikovskaya str. (plans are for a 4* hotel with 175 rooms). The hotel operator will be Reval Hotels.
• Concord Management and Consulting announced plans to built a wellness park near Yuntolovsky
Reserve by 2013. The complex will include 150 rooms. Planned investments are $120 mln.
Supply
Only one hotel was opened in St. Petersburg during the first quarter of 2008 – the 5* Holiday Club with
278 rooms. A spa complex will be opened at the new hotel in coming months.
Demand
St. Petersburg hotels experienced lower–than–usual decline of guests in the 2007–2008 low season due
increase in the share of business guests. Hotels in the city centre, which are equipped with conference
resources, benefited most.
“St. Petersburg’s first spa–hotel, the 5* Holiday Club with 278 rooms, opened in the city centre in 2008”.
Holiday Club St.Petersburg,
Birzhevoy lane., 2–4

16 Moscow and St. Petersburg Commercial Real Estate Market • Q1 2008 Knight Frank
www.knightfrank.ru
Commercial terms
ADR (average daily rate) in Q1 2008 was 3% higher in roubles than in the same period last year. The growth
was felt most in the 4–5* segment.
Forecast
A total of 8 significant hotels with 1,324 rooms are expected to open in the rest of 2008. Most of the new
supply will be from the Finnish hotel chain, Sokos.
Main projects scheduled to open in Q2–Q4 2008
Operator Brand Address Category Room stock
Sokos Hotels Sokos Bataiskiy lane, 3 4* 348
Sokos Hotels Sokos 8th Line, Vasilievskiy Island, 11 4* 225
Domina Hotels & Resоrts Dopmina Prestige Morskaya Bolshaya str., 54 4* 111
Source: Knight Frank Research, 2008
ADR range for double room by hotel categories in Q1 2008, $ per night*
* The diagramm shows max and min ADRs Source: Knight Frank Research, 2008
600
500
400
300
200
100
03* 4* 5*
5*14%
3*59%
Room stock in St. Petersburg hotels by category,% of total room stock
Source: Knight Frank Research, 2008
4*27%

Knight Frank Moscow and St. Petersburg Commercial Real Estate Market • Q1 2008 17
www.knightfrank.ru
Investment Market
Trends
• The investment market is currently affected by the international liquidity crisis. Expert opinions vary
concerning duration of the crisis.
• It has become more difficult to raise project finance: bank requirements for potential borrowers have
become tougher and cost of credits has risen. Companies, which have not been long on the market and
lack established relationships with large banks, are in the worst position.
• Need for capital entails increase in market supply, both of completed assets and development projects.
Some investment companies have decided to take profits, offering previously acquired assets for sale.
Capitalisation rates have mainly stabilised at the level achieved in the second half of 2007.
• Leading investors are positive about overall outlook for the Russian property market and remain very
interested despite the crisis on international capital markets. Conservative western investors in search
of steady returns are starting to enter the market. However, foreign companies view investment risks in
Russia as somewhat higher than on developed European, so they expect higher yield.
• We are seeing first signs that a secondary market for investment products is taking shape: some investors,
who came onto the Russian market in the last few years, are now selling their assets to other investment
companies and funds. This is evidence of a qualitatively new, more mature stage in development of the
overall Russian market.
Investment Transactions (Standing Assets)
Investor Assets acquired Amount*
KanAm Grund Kapitalanlagegesellschaft mbH
Purchase of four Class A office projects (total 101,000 sq m) in the Paveletskaya Business Zone in Moscow
$900 mln
Evli Property Investments Russia
Purchase of the company ZAO Pervomaiskaya Zarya, whose main asset is the 20,000 sq m Kellermann Business Centre in central St. Petersburg
–
Sponda Plc Two retail centres, Solnechny Ray I in Moscow and Solnechny Ray II in Moscow Region from London & Regional Properties
$109 mln
Eastern Property Holdings Purchase of 50% of the company OOO Inkonika, which specialises in construction of car parks and has rights for construction of 140,000 sq m of parking for 5,000 cars in central Moscow
–
Coalco Purchase of a hotel project for 250 guests adjacent to Komsomolskaya square in Moscow from the company Magma
$25–30 mln
* Estimated transaction amountSource: Knight Frank Research, 2008
Yield*
Office real estate 8–10%
Retail real estate 9–10%
Warehouse real estate 9–11%
* Net initial yield of prime buildings
Source: Knight Frank Research, 2008
Krekshino Logistics Park between Minsk
and Kiev highways, 24 km from MKAD

18 Moscow and St. Petersburg Commercial Real Estate Market • Q1 2008 Knight Frank
www.knightfrank.ru
Financing Transactions
Creditor Borrower Designated purpose Amount
Sberbank Business Centre on Tverskaya (GK Unikor)
Financing reconstruction of the former Minsk Hotel
$165 mln
Gazprombank, Goldman Sachs
RosEuroDevelopment Mezzanine loan $165 mln
Hypo Real Estate Bank International AG
Raven Russia Ltd. Refinancing first phase of Krekshino Class A Logistics Park
$89 mln (€56 mln)
VTB Bank Europe Plc Raven Russia Ltd. Financing construction of 200,000 sq m logistics complex in Rostov–on–Don
$170 mln
Sberbank Central Market (subdivision of RGI International)
Financing construction of retail centre in Moscow on Tsvetnoy blvd
$100 mln
Danske Bank A/S, Helsinki Branch
Sponda Plc Credit for financing investments in property market projects in Russia
€150 mln
Ilmarinen Mutual Pension Insurance Company
Sponda Plc Credit for financing investments in property market projects in Russia
€50 mln
Source: Knight Frank Research, 2008
Investment Transactions (Development Projects)
Investor Project Amount**
Northern European Properties Limited
Agreement on sale of portfolio of 39 property assets (mainly in Finland) to invest to money obtained in quality property assets in Russia
€800 mln
Invesco Real Estate Investment of about 20% of Central European Real Property Fund II in property projects in Russia
$250–300 mln
Goldman Sachs Creation of a fund for property investments in BRIC economies, of which about half for acquisition of projects in Russia
About $2 bln
Evli Property Investments Oy
Creation of a project portfolio for the fund Evli Property Investments Russia
€350–400 mln
RREEF (Deutsche Bank) The fund plans construction of an 80,000 sq m retail complex in Kazan
$150–170 mln
IKEA The company plans construction of a 400–500,000 sq m multifunctional complex adjacent to Mytishchi in Moscow Region
–
** Expected investmentsSource: Knight Frank Research, 2008
Solnechny Ray Retail Centre, 6
Borovskoye highway
“Attracting of project financing become more challenging”.

www.knightfrank.ru
Overview
ContactsOfficesAndrey Petrov, Partner +7(495) 981 0000 [email protected]
Industrial, regionsRoman Bourtsev, Partner +7(495) 981 0000 [email protected]
RetailYulia Dalnova, Director +7(495) 981 0000 [email protected]
Elite propertiesEkaterina Thain, Partner +7(495) 981 0000 [email protected]
Financial services and investmentHeiko Davids, Partner +7(495) 981 0000 [email protected]
Professional servicesConsulting and ValuationKonstantin Romanov, Partner +7(495) 981 0000 [email protected]
Property Management servicesRoman Bourtsev, Partner +7(495) 981 0000 [email protected]
Marketing, PR and ResearchMaria Kotova, Director +7(495) 981 0000 [email protected]
Founded in London more than a century ago, Knight Frank is the world’s largest privately owned consultancy. A global partnership with prominent New York based real estate firm, Newmark, has created a network of over 165 offices in 36 countries, staffed by more than 6, 300 professionals. Last year, the companies handled transactions valued at over $41 billion with annual revenues of over $545 mln.
Knight Frank’s mission is to provide the most comprehensive range of real estate related services in all countries where it operates, to offer the highest quality of services for clients and the best career opportunities for its staff.
In Russia and Ukraine, Knight Frank offers a complete range of agency and consulting services, and leads the Russian real estate market. Our key resource is a pool of over 330 talented professionals working in Moscow, Saint–Petersburg and Kiev.
Over 500 companies have used professional services offered by Knight Frank since it started operating on the Russian market.
Find this review as well as all the others at www.knightfrank.ru
America
USA
Bermuda
Brazil
Caribbean
Australasia
Australia
New Zealand
Europe
UK
Belgium
Czech Republic
France
Germany
Hungary
Italy
Ireland
Poland
Portugal
Russia
Spain
The Netherlands
Ukraine
Africa
Botswana
Kenya
Malawi
Nigeria
South Africa
Tanzania
Uganda
Zambia
Zimbabwe
Asia
China
Hong Kong
India
Indonesia
Macau
Malaysia
Singapore
Thailand
© Knight Frank 2008This overview is published for general information only. Although high standards have been used in the preparation of the information, analysis, views and projections presented in this report, no legal responsibility canbe accepted by Knight Frank Research or Knight Frank for any loss or damage resultant from the contents of this document. As a general report, this material does not necessarily represent the view of Knight Frank in relation to particular properties or projects. Reproduction of this report in whole or in part is allowed with proper reference to Knight Frank.