commercial real estate market trends: q1 - · pdf filecommercial real estate market trends:...
TRANSCRIPT
COMMERCIAL REAL ESTATE
MARKET TRENDS: Q1.2017
National Association of REALTORS®
2
Commercial Real Estate Market Trends: Q1.2017
Download: www.nar.realtor/research-and-statistics/commercial-real-estate-market-survey
©2017 | NATIONAL ASSOCIATION OF REALTORS®
All Rights Reserved.
Reproduction, reprinting or retransmission in any form is prohibited without written permission.
Although the information presented in this survey has been obtained from reliable sources, NAR
does not guarantee its accuracy, and such information may be incomplete. This report is for
information purposes only.

May 2017
COMMERCIAL REAL ESTATE MARKET TRENDS | Q1.2017
3NATIONAL ASSOCIATION of REALTORS® | RESEARCH DIVISION | www.nar.realtor/research-and-statistics
NATIONAL ASSOCIATION OF REALTORS®
2017 OFFICERS
President
Bill Brown
President-Elect
Elizabeth Mendenhall, ABR, ABRM, CIPS,
CRB, GRI, ePRO, LCI, PMN
First Vice President
John Smaby
Treasurer
Thomas Riley, CCIM, CRB
Immediate Past-President
Tom Salomone
Vice President
Mabél Guzmán, ABR, AHWD, CIPS, CRS
Vice President
Kevin Sears
Chief Executive Officer
Dale Stinton, CAE, CPA, CMA, RCE
May 2017
COMMERCIAL REAL ESTATE MARKET TRENDS | Q1.2017
4NATIONAL ASSOCIATION of REALTORS® | RESEARCH DIVISION | www.nar.realtor/research-and-statistics
CONTENTS
1 | Introduction…………………………………………………………………………………………….
2 | Survey Highlights..…………………………………………………………………………………..
3 | Investment Sales ………..…………..………………………………………………………………
4 | Leasing Fundamentals …………………………………………………………………………….
6 | Methodology…………………………………………………………………………………………..
5
6
7
10
13

5
May 2017
COMMERCIAL REAL ESTATE MARKET TRENDS | Q1.2017
NATIONAL ASSOCIATION of REALTORS® | RESEARCH DIVISION | www.nar.realtor/research-and-statistics
Introduction
Commercial space is heavily concentrated in
large buildings, but large buildings are a
relatively small number of the overall stock of
commercial buildings. In terms of inventory,
commercial real estate markets are bifurcated,
with the majority of buildings being relatively
small, while the bulk of commercial space is
concentrated in larger buildings.
The bifurcation continues along transaction
volumes as well, with deals at the higher end—
$2.5 million and above—comprising a large
share of investment sales, while transactions at
the lower end make up a smaller fraction.
Data are readily available for transactions in
excess of $2.5 million from several sources,
including Real Capital Analytics (RCA).
However, in general, data for smaller
transactions—many of which are handled by
REALTORS®—are less widely available.
National Association of REALTORS®’ (NAR)
Commercial Real Estate Market Trends gathers
market information for small cap properties and
transactions, mostly valued below $2.5 million.
Q1.2017 Update
The first quarter of this year marked a change in
the trend of investment sales. Sales volume in
REALTORS®’ markets declined for the first time
in five years, with a 4.4 percent slide. With tight
inventory continuing to top the list of concerns,
prices rose 7.2 percent from a year ago.
However, cap rates began moving upward. The
moves in investment metrics mirror, with a one
year lag, those recorded in large cap markets,
where sales volume has been declining for the
past five quarters.
GEORGE RATIU
Director, Quantitative & Commercial Research
-100%
-50%
0%
50%
100%
150%
200%
20
08
.Q4
20
09
.Q2
20
09
.Q4
20
10
.Q2
20
10
.Q4
20
11
.Q2
20
11
.Q4
20
12
.Q2
20
12
.Q4
20
13
.Q2
20
13
.Q4
20
14
.Q2
20
14
.Q4
20
15
.Q2
20
15
.Q4
20
16
.Q2
20
16
.Q4
Sales Volume (YoY % Chg)
Real Capital Analytics CRE Markets
REALTOR® CRE Markets
-40.0%
-30.0%
-20.0%
-10.0%
0.0%
10.0%
20.0%
20
08
.Q4
20
09
.Q2
20
09
.Q4
20
10
.Q2
20
10
.Q4
20
11
.Q2
20
11
.Q4
20
12
.Q2
20
12
.Q4
20
13
.Q2
20
13
.Q4
20
14
.Q2
20
14
.Q4
20
15
.Q2
20
15
.Q4
20
16
.Q2
20
16
.Q4
Sale Prices (YoY % Chg)
Real Capital Analytics CRE Markets
REALTOR® CRE Markets
Sources: NAR, Real Capital Analytics
6
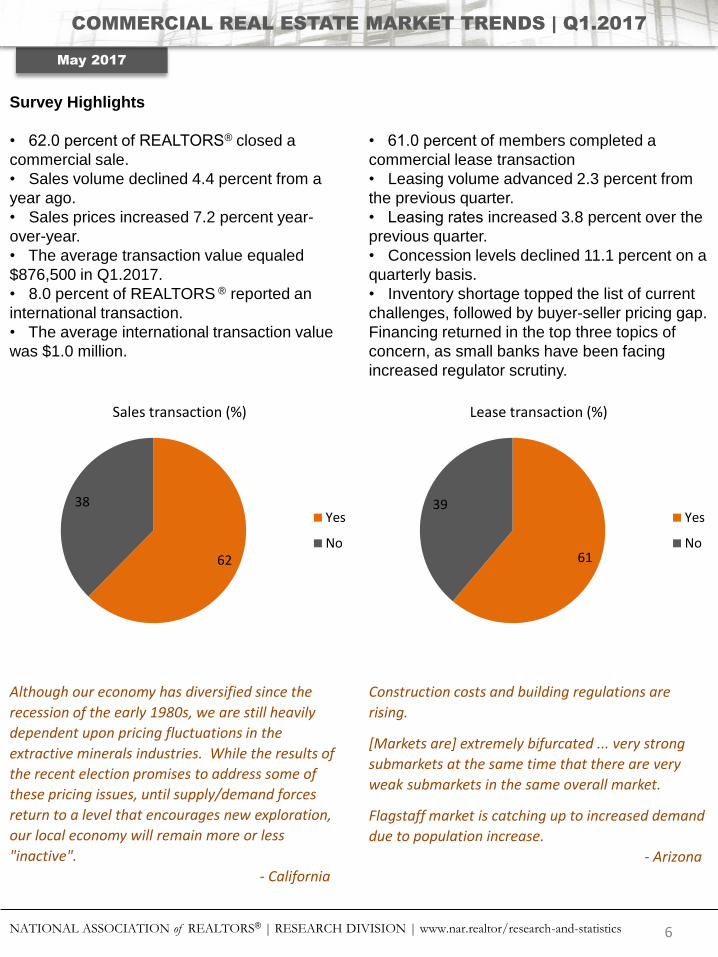
Survey Highlights
• 62.0 percent of REALTORS® closed a
commercial sale.
• Sales volume declined 4.4 percent from a
year ago.
• Sales prices increased 7.2 percent year-
over-year.
• The average transaction value equaled
$876,500 in Q1.2017.
• 8.0 percent of REALTORS ® reported an
international transaction.
• The average international transaction value
was $1.0 million.
May 2017
COMMERCIAL REAL ESTATE MARKET TRENDS | Q1.2017
NATIONAL ASSOCIATION of REALTORS® | RESEARCH DIVISION | www.nar.realtor/research-and-statistics
• 61.0 percent of members completed a
commercial lease transaction
• Leasing volume advanced 2.3 percent from
the previous quarter.
• Leasing rates increased 3.8 percent over the
previous quarter.
• Concession levels declined 11.1 percent on a
quarterly basis.
• Inventory shortage topped the list of current
challenges, followed by buyer-seller pricing gap.
Financing returned in the top three topics of
concern, as small banks have been facing
increased regulator scrutiny.
62
38
Sales transaction (%)
Yes
No61
39
Lease transaction (%)
Yes
No
Although our economy has diversified since the
recession of the early 1980s, we are still heavily
dependent upon pricing fluctuations in the
extractive minerals industries. While the results of
the recent election promises to address some of
these pricing issues, until supply/demand forces
return to a level that encourages new exploration,
our local economy will remain more or less
"inactive".
- California
Construction costs and building regulations are
rising.
[Markets are] extremely bifurcated ... very strong
submarkets at the same time that there are very
weak submarkets in the same overall market.
Flagstaff market is catching up to increased demand
due to population increase.
- Arizona
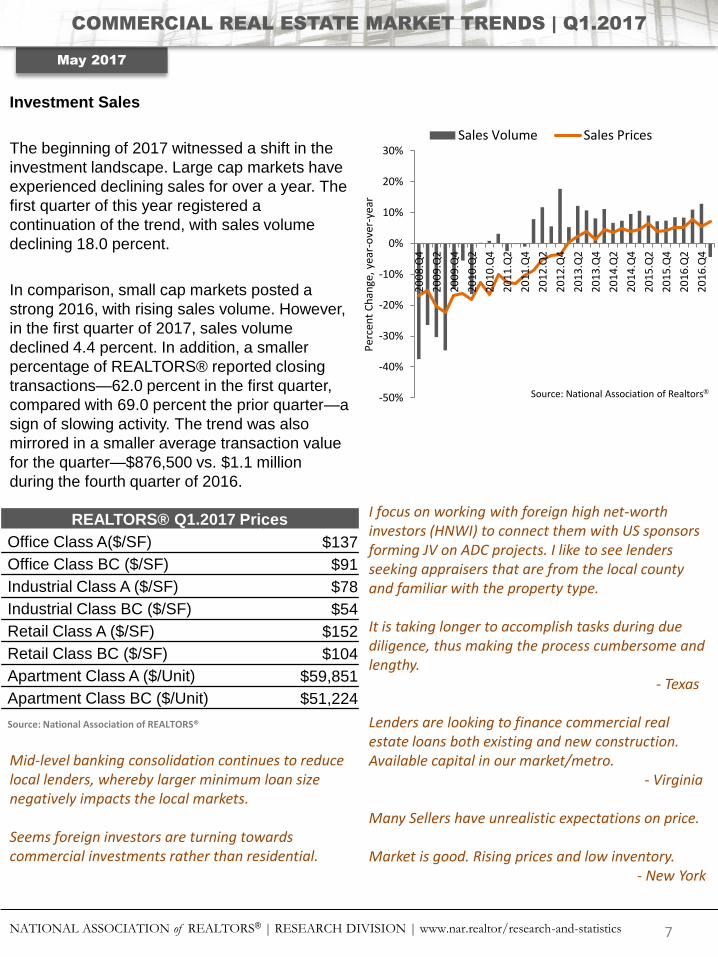
Investment Sales
The beginning of 2017 witnessed a shift in the
investment landscape. Large cap markets have
experienced declining sales for over a year. The
first quarter of this year registered a
continuation of the trend, with sales volume
declining 18.0 percent.
In comparison, small cap markets posted a
strong 2016, with rising sales volume. However,
in the first quarter of 2017, sales volume
declined 4.4 percent. In addition, a smaller
percentage of REALTORS® reported closing
transactions—62.0 percent in the first quarter,
compared with 69.0 percent the prior quarter—a
sign of slowing activity. The trend was also
mirrored in a smaller average transaction value
for the quarter—$876,500 vs. $1.1 million
during the fourth quarter of 2016.
7
May 2017
COMMERCIAL REAL ESTATE MARKET TRENDS | Q1.2017
NATIONAL ASSOCIATION of REALTORS® | RESEARCH DIVISION | www.nar.realtor/research-and-statistics
REALTORS® Q1.2017 Prices
Office Class A($/SF) $137
Office Class BC ($/SF) $91
Industrial Class A ($/SF) $78
Industrial Class BC ($/SF) $54
Retail Class A ($/SF) $152
Retail Class BC ($/SF) $104
Apartment Class A ($/Unit) $59,851
Apartment Class BC ($/Unit) $51,224
Source: National Association of REALTORS®
-50%
-40%
-30%
-20%
-10%
0%
10%
20%
30%
20
08
.Q4
20
09
.Q2
20
09
.Q4
20
10
.Q2
20
10
.Q4
20
11
.Q2
20
11
.Q4
20
12
.Q2
20
12
.Q4
20
13
.Q2
20
13
.Q4
20
14
.Q2
20
14
.Q4
20
15
.Q2
20
15
.Q4
20
16
.Q2
20
16
.Q4
Per
cen
t C
han
ge, y
ear-
ove
r-ye
ar
Sales Volume Sales Prices
Source: National Association of Realtors®
I focus on working with foreign high net-worth investors (HNWI) to connect them with US sponsors forming JV on ADC projects. I like to see lenders seeking appraisers that are from the local county and familiar with the property type.
It is taking longer to accomplish tasks during due diligence, thus making the process cumbersome and lengthy.
- Texas
Lenders are looking to finance commercial real estate loans both existing and new construction. Available capital in our market/metro.
- Virginia
Many Sellers have unrealistic expectations on price.
Market is good. Rising prices and low inventory. - New York
Mid-level banking consolidation continues to reduce local lenders, whereby larger minimum loan size negatively impacts the local markets.
Seems foreign investors are turning towards commercial investments rather than residential.
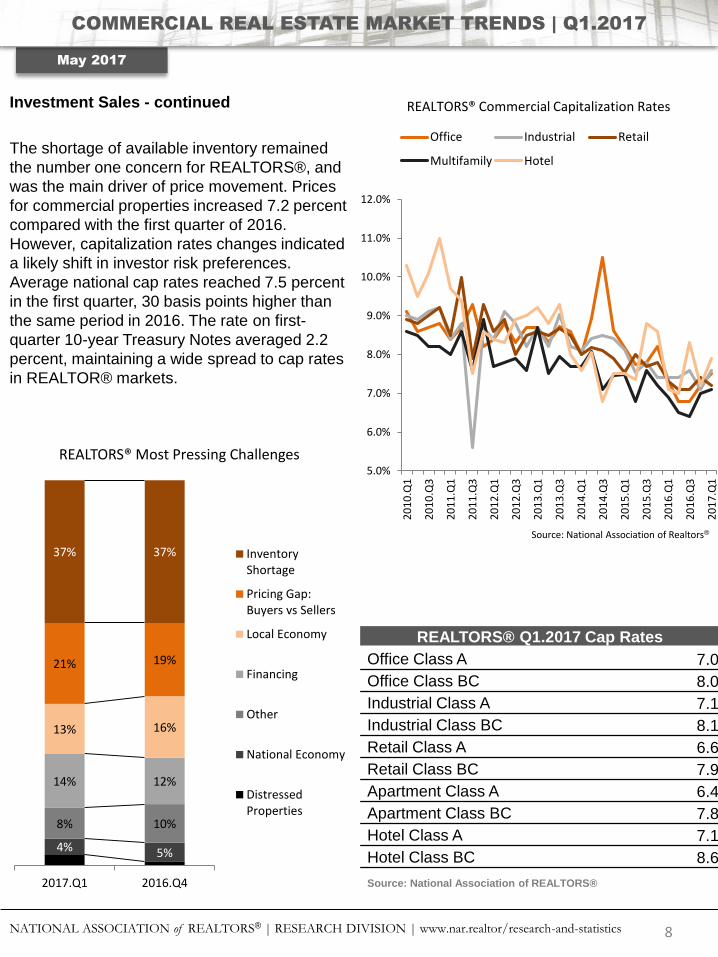
Investment Sales - continued
The shortage of available inventory remained
the number one concern for REALTORS®, and
was the main driver of price movement. Prices
for commercial properties increased 7.2 percent
compared with the first quarter of 2016.
However, capitalization rates changes indicated
a likely shift in investor risk preferences.
Average national cap rates reached 7.5 percent
in the first quarter, 30 basis points higher than
the same period in 2016. The rate on first-
quarter 10-year Treasury Notes averaged 2.2
percent, maintaining a wide spread to cap rates
in REALTOR® markets.
8
May 2017
COMMERCIAL REAL ESTATE MARKET TRENDS | Q1.2017
NATIONAL ASSOCIATION of REALTORS® | RESEARCH DIVISION | www.nar.realtor/research-and-statistics
4% 5%
8% 10%
14% 12%
13% 16%
21% 19%
37% 37%
2017.Q1 2016.Q4
REALTORS® Most Pressing Challenges
InventoryShortage
Pricing Gap:Buyers vs Sellers
Local Economy
Financing
Other
National Economy
DistressedProperties
5.0%
6.0%
7.0%
8.0%
9.0%
10.0%
11.0%
12.0%
20
10
.Q1
20
10
.Q3
20
11
.Q1
20
11
.Q3
20
12
.Q1
20
12
.Q3
20
13
.Q1
20
13
.Q3
20
14
.Q1
20
14
.Q3
20
15
.Q1
20
15
.Q3
20
16
.Q1
20
16
.Q3
20
17
.Q1
REALTORS® Commercial Capitalization Rates
Office Industrial Retail
Multifamily Hotel
Source: National Association of Realtors®
REALTORS® Q1.2017 Cap Rates
Office Class A 7.0
Office Class BC 8.0
Industrial Class A 7.1
Industrial Class BC 8.1
Retail Class A 6.6
Retail Class BC 7.9
Apartment Class A 6.4
Apartment Class BC 7.8
Hotel Class A 7.1
Hotel Class BC 8.6
Source: National Association of REALTORS®
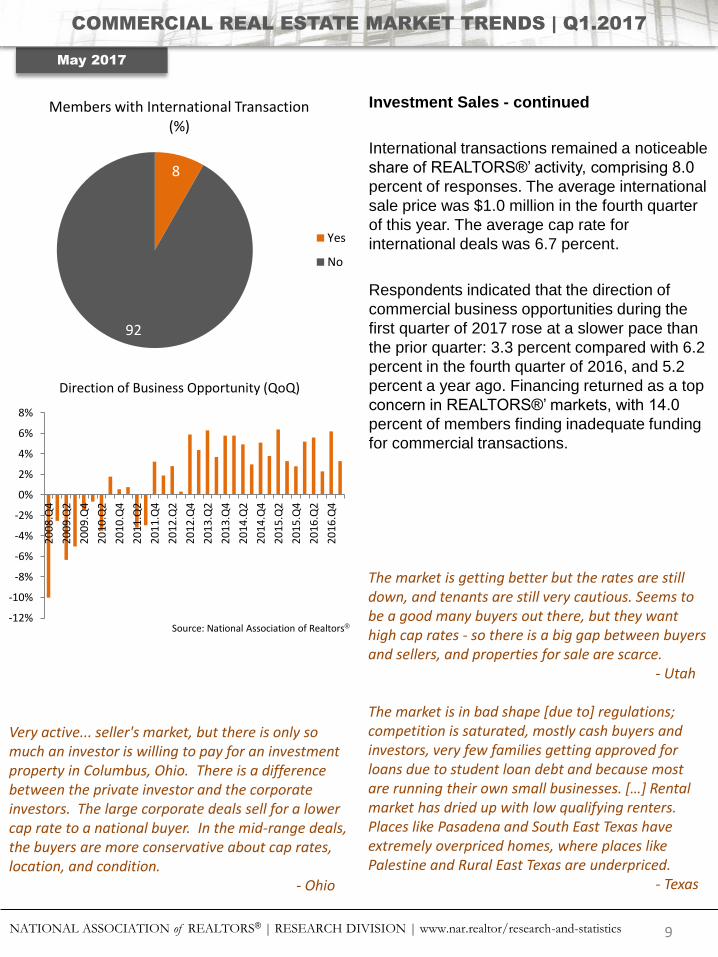
Investment Sales - continued
International transactions remained a noticeable
share of REALTORS®’ activity, comprising 8.0
percent of responses. The average international
sale price was $1.0 million in the fourth quarter
of this year. The average cap rate for
international deals was 6.7 percent.
Respondents indicated that the direction of
commercial business opportunities during the
first quarter of 2017 rose at a slower pace than
the prior quarter: 3.3 percent compared with 6.2
percent in the fourth quarter of 2016, and 5.2
percent a year ago. Financing returned as a top
concern in REALTORS®’ markets, with 14.0
percent of members finding inadequate funding
for commercial transactions.
9
May 2017
COMMERCIAL REAL ESTATE MARKET TRENDS | Q1.2017
NATIONAL ASSOCIATION of REALTORS® | RESEARCH DIVISION | www.nar.realtor/research-and-statistics
-12%
-10%
-8%
-6%
-4%
-2%
0%
2%
4%
6%
8%
20
08
.Q4
20
09
.Q2
20
09
.Q4
20
10
.Q2
20
10
.Q4
20
11
.Q2
20
11
.Q4
20
12
.Q2
20
12
.Q4
20
13
.Q2
20
13
.Q4
20
14
.Q2
20
14
.Q4
20
15
.Q2
20
15
.Q4
20
16
.Q2
20
16
.Q4
Direction of Business Opportunity (QoQ)
Source: National Association of Realtors®
8
92
Members with International Transaction (%)
Yes
No
The market is getting better but the rates are still down, and tenants are still very cautious. Seems to be a good many buyers out there, but they want high cap rates - so there is a big gap between buyers and sellers, and properties for sale are scarce.
- Utah
The market is in bad shape [due to] regulations; competition is saturated, mostly cash buyers and investors, very few families getting approved for loans due to student loan debt and because most are running their own small businesses. […] Rental market has dried up with low qualifying renters. Places like Pasadena and South East Texas have extremely overpriced homes, where places like Palestine and Rural East Texas are underpriced.
- Texas
Very active... seller's market, but there is only so much an investor is willing to pay for an investment property in Columbus, Ohio. There is a difference between the private investor and the corporate investors. The large corporate deals sell for a lower cap rate to a national buyer. In the mid-range deals, the buyers are more conservative about cap rates, location, and condition.
- Ohio
10
May 2017
COMMERCIAL REAL ESTATE MARKET TRENDS | Q1.2017
NATIONAL ASSOCIATION of REALTORS® | RESEARCH DIVISION | www.nar.realtor/research-and-statistics
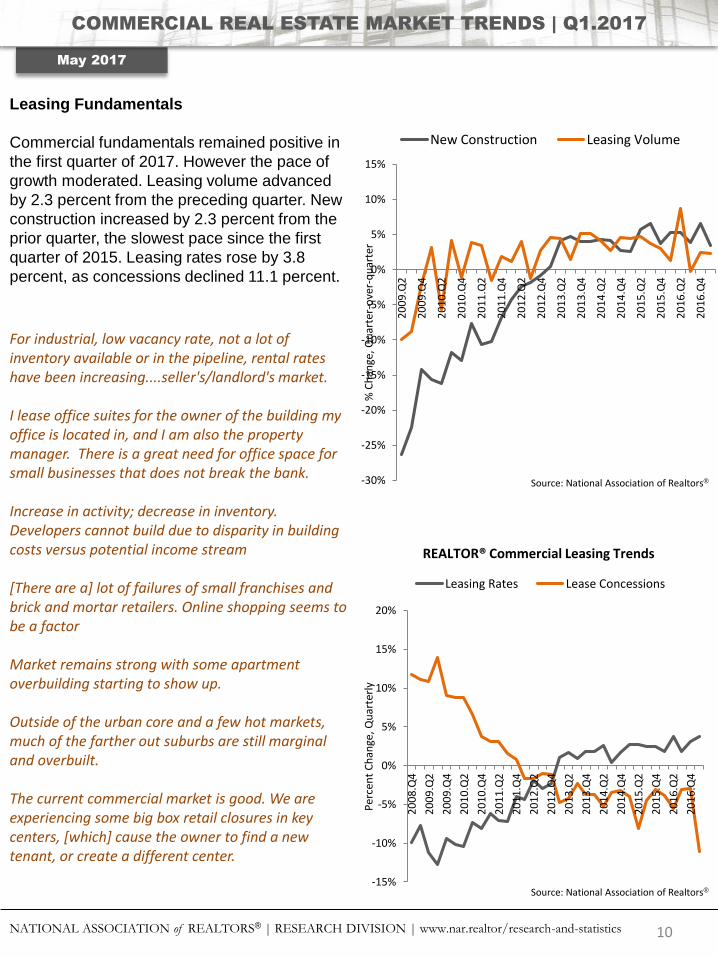
Leasing Fundamentals
Commercial fundamentals remained positive in
the first quarter of 2017. However the pace of
growth moderated. Leasing volume advanced
by 2.3 percent from the preceding quarter. New
construction increased by 2.3 percent from the
prior quarter, the slowest pace since the first
quarter of 2015. Leasing rates rose by 3.8
percent, as concessions declined 11.1 percent.
-30%
-25%
-20%
-15%
-10%
-5%
0%
5%
10%
15%
20
09
.Q2
20
09
.Q4
20
10
.Q2
20
10
.Q4
20
11
.Q2
20
11
.Q4
20
12
.Q2
20
12
.Q4
20
13
.Q2
20
13
.Q4
20
14
.Q2
20
14
.Q4
20
15
.Q2
20
15
.Q4
20
16
.Q2
20
16
.Q4
% C
han
ge, Q
uar
ter-
ove
r-q
uar
ter
New Construction Leasing Volume
Source: National Association of Realtors®
-15%
-10%
-5%
0%
5%
10%
15%
20%
20
08
.Q4
20
09
.Q2
20
09
.Q4
20
10
.Q2
20
10
.Q4
20
11
.Q2
20
11
.Q4
20
12
.Q2
20
12
.Q4
20
13
.Q2
20
13
.Q4
20
14
.Q2
20
14
.Q4
20
15
.Q2
20
15
.Q4
20
16
.Q2
20
16
.Q4
Per
cen
t C
han
ge, Q
uar
terl
y
REALTOR® Commercial Leasing Trends
Leasing Rates Lease Concessions
Source: National Association of Realtors®
For industrial, low vacancy rate, not a lot of inventory available or in the pipeline, rental rates have been increasing....seller's/landlord's market.
I lease office suites for the owner of the building my office is located in, and I am also the property manager. There is a great need for office space for small businesses that does not break the bank.
Increase in activity; decrease in inventory. Developers cannot build due to disparity in building costs versus potential income stream
[There are a] lot of failures of small franchises and brick and mortar retailers. Online shopping seems to be a factor
Market remains strong with some apartment overbuilding starting to show up.
Outside of the urban core and a few hot markets, much of the farther out suburbs are still marginal and overbuilt.
The current commercial market is good. We are experiencing some big box retail closures in key centers, [which] cause the owner to find a new tenant, or create a different center.

11
May 2017
COMMERCIAL REAL ESTATE MARKET TRENDS | Q1.2017
NATIONAL ASSOCIATION of REALTORS® | RESEARCH DIVISION | www.nar.realtor/research-and-statistics
Leasing Fundamentals - continued
Tenant demand remained strongest in the 5,000
square feet and below segment, accounting for
84.0 percent of responses. Demand for space in
the “Under 2,500 square feet” segment was
virtually unchanged from the last quarter,
capturing 45.0 percent of responses. Demand
for properties in the “10,000 - 49,999 square
feet” segment notched a noticeable jump,
accounting for 11.0 percent of total responses,
an almost two-fold increase from the prior
quarter.
0%
10%
20%
30%
40%
50%
60%
70%
80%
90%
100%
20
08
.Q4
20
09
.Q1
20
09
.Q2
20
09
.Q3
20
09
.Q4
20
10
.Q1
20
10
.Q2
20
10
.Q3
20
10
.Q4
20
11
.Q1
20
11
.Q2
20
11
.Q3
20
11
.Q4
20
12
.Q1
20
12
.Q2
20
12
.Q3
20
12
.Q4
20
13
.Q1
20
13
.Q2
20
13
.Q3
20
13
.Q4
20
14
.Q1
20
14
.Q2
20
14
.Q3
20
14
.Q4
20
15
.Q1
20
15
.Q2
20
15
.Q3
20
15
.Q4
20
16
.Q1
20
16
.Q2
20
16
.Q3
20
16
.Q4
20
17
.Q1
Average Leased Space by Size, Quarterly*
Over 100,000 sf
50,000 - 100,000 sf
10,000 - 49,999 sf
7,500 - 9,999 sf
5,000 - 7,499 sf
2,500 - 4,999 sf
Under 2,500 sf
Source: National Association of Realtors®*Prior to 2010.Q4 "Under 5,000 sf was the lowest category available.
People feel trust to move forward with business plans now - just need stifling regulations removed
The overall San Antonio market continues to be strong will low unemployment and new companies locating to the area. Hulu just announced a 500-person office to be located in San Antonio.
- Texas
There is limited commercial activity in smaller towns like this area. I travel outward about 150 miles from my hometown to stay busy with agricultural and general commercial appraisals.
We are a stable market with low operating costs and a good, available skilled labor pool.
Finding quality commercial appraisers to add to my firm is a difficult task. Training maybe the only long-term option.
While we have some modest increase in construction, we have not yet seen overall activity match the general optimism that keeps being reported on the news here locally.
12
May 2017
COMMERCIAL REAL ESTATE MARKET TRENDS | Q1.2017
NATIONAL ASSOCIATION of REALTORS® | RESEARCH DIVISION | www.nar.realtor/research-and-statistics
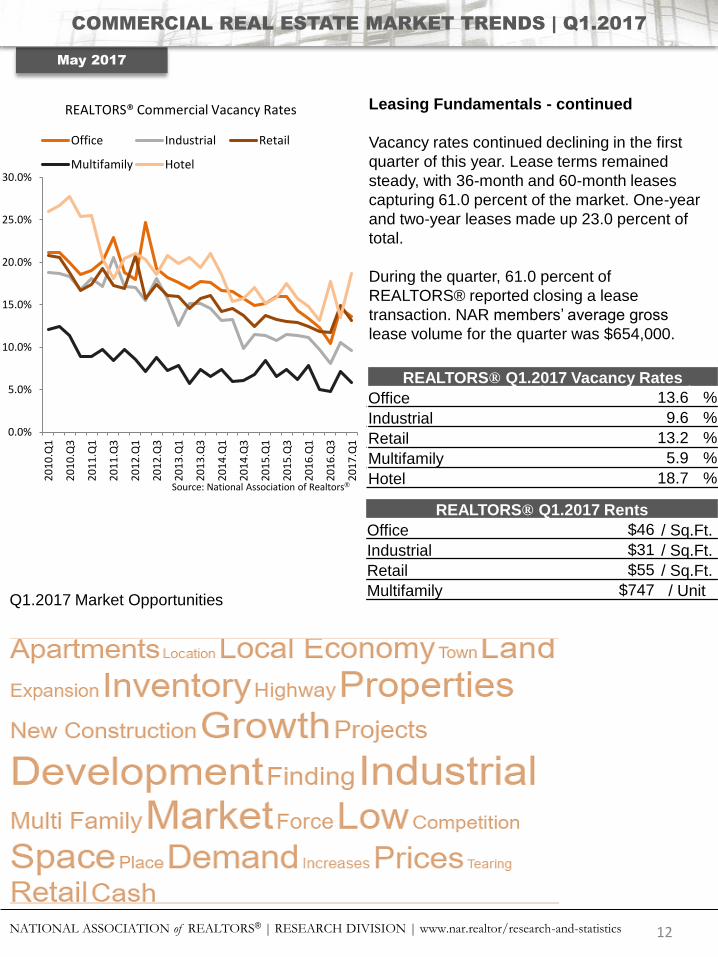
Leasing Fundamentals - continued
Vacancy rates continued declining in the first
quarter of this year. Lease terms remained
steady, with 36-month and 60-month leases
capturing 61.0 percent of the market. One-year
and two-year leases made up 23.0 percent of
total.
During the quarter, 61.0 percent of
REALTORS® reported closing a lease
transaction. NAR members’ average gross
lease volume for the quarter was $654,000.
REALTORS® Q1.2017 Vacancy Rates
Office 13.6 %
Industrial 9.6 %
Retail 13.2 %
Multifamily 5.9 %
Hotel 18.7 %
REALTORS® Q1.2017 Rents
Office $46 / Sq.Ft.
Industrial $31 / Sq.Ft.
Retail $55 / Sq.Ft.
Multifamily $747 / Unit
0.0%
5.0%
10.0%
15.0%
20.0%
25.0%
30.0%
20
10
.Q1
20
10
.Q3
20
11
.Q1
20
11
.Q3
20
12
.Q1
20
12
.Q3
20
13
.Q1
20
13
.Q3
20
14
.Q1
20
14
.Q3
20
15
.Q1
20
15
.Q3
20
16
.Q1
20
16
.Q3
20
17
.Q1
REALTORS® Commercial Vacancy Rates
Office Industrial Retail
Multifamily Hotel
Source: National Association of Realtors®
Q1.2017 Market Opportunities

13
May 2017
COMMERCIAL REAL ESTATE MARKET TRENDS | Q1.2017
NATIONAL ASSOCIATION of REALTORS® | RESEARCH DIVISION | www.nar.realtor/research-and-statistics
Methodology
The REALTORS® Commercial Real Estate Market
Trends measures quarterly activity in the
commercial real estate markets, as reported in a
national survey. The survey collects data from
REALTORS® engaged in commercial real estate
transactions. The survey is designed to provide an
overview of market performance, sales and leasing
transactions, along with information on current
economic challenges and future expectations.
In April 2017, NAR invited a random sample of
62,212 REALTORS® with an interest in commercial
real estate to complete an on-line survey. A total of
799 complete responses were received, for an
overall response rate of 1.3 percent. The main
measure of central tendency employed in the
analysis is the mean.
The National Association of REALTORS®, “The Voice for Real Estate,” is America’s
largest trade association, representing 1.2 million members, including NAR’s institutes,
societies and councils, involved in all aspects of the real estate industry. NAR
membership includes brokers, salespeople, property managers, appraisers, counselors
and others engaged in both residential and commercial real estate. The term
REALTOR® is a registered collective membership mark that identifies a real estate
professional who is a member of the National Association of REALTORS® and
subscribes to its strict Code of Ethics. Working for America's property owners, the
National Association provides a facility for professional development, research and
exchange of information among its members and to the public and government for the
purpose of preserving the free enterprise system and the right to own real property.
NATIONAL ASSOCIATION OF REALTORS®
RESEARCH DIVISION
The Mission of the National Association of REALTORS® Research Division is to collect
and disseminate timely, accurate and comprehensive real estate data and to conduct
economic analysis in order to inform and engage members, consumers, and policy
makers and the media in a professional and accessible manner.
To find out about other products from NAR’s Research Division, visit
www.nar.realtor/research-and-statistics
NATIONAL ASSOCIATION OF REALTORS®
RESEARCH DIVISION
500 New Jersey Avenue, NW
Washington, DC 20001
202.383.1000
COMMERCIAL REAL ESTATE MARKET TRENDS: Q1.2017