commercialization of n2 rich gas - university of oklahoma · production and commercialization of...
TRANSCRIPT

1
Commercialization of Nitrogen‐Rich Natural Gas
Authors:
Albert Bradley Curtis III
Monique Wess
Acknowledgements:
Dr. Miguel Bagajewicz
Quang Nguyen
Liu Shi
Roman Voronov
CH E 4273May 2, 2008

2
Abstract Currently, the natural gas supply in the United States does not support the nations demand. In
subsequent years the United States will be faced with the decision to find alternative sources for natural
gas or increase natural gas imports from foreign countries. A potential solution to ameliorate this issue
is to utilize the nation’s nitrogen rich natural gas reservoirs. The objective of this study is to identify and
analyze potential uses for this low quality natural gas (LQNG). An economic analysis on the feasibility of
production and commercialization of nitrogen rich natural gas was performed based on a mathematical
model built to determine the best process combination based on maximizing net present value. The
separation options include the purification of natural gas by cryogenic distillation, pressure swing
adsorption, membranes, and molecular gate technology. The commercialization options include
upgrading the natural gas to pipeline quality, conversion of methane to synthesis gas and its derivates,
and combustion of natural gas for power generation. The mathematical model found that urea was the
most profitable process for natural gas field flow rates higher than 5 MMscf/day.

3
Table of Contents Abstract ......................................................................................................................................................... 2
Introduction .................................................................................................................................................. 5
Nitrogen Separation Technologies .............................................................................................................. 10
Cryogenic Distillation .............................................................................................................................. 11
Pressure Swing Adsorption ..................................................................................................................... 11
Separation through membranes ............................................................................................................. 12
Molecular Gate Pressure Swing Adsorption ........................................................................................... 13
Additional Processing .................................................................................................................................. 15
Dehydration ............................................................................................................................................ 15
Desulfurization ........................................................................................................................................ 15
Power Generation from Natural Gas .......................................................................................................... 16
Steam Generation Units .......................................................................................................................... 16
Gas Turbines ........................................................................................................................................... 17
NOx emissions ........................................................................................................................................ 17
Electricity Demand and Forecast ............................................................................................................ 18
Synthesis Gas Product Selection ................................................................................................................. 20
Hydrogen ................................................................................................................................................. 21
Ammonia ................................................................................................................................................. 21
Urea ......................................................................................................................................................... 22
Methanol ................................................................................................................................................. 22
Formaldehyde ......................................................................................................................................... 22
Acetic Acid ............................................................................................................................................... 22
Dimethyl Ether ........................................................................................................................................ 23
Synthetic Fuel .......................................................................................................................................... 23

4
Mathematical Model .................................................................................................................................. 23
Results from the GAMS model ................................................................................................................ 27
Conclusions and Recommendations ........................................................................................................... 31
Resources .................................................................................................................................................... 33

5
Introduction Natural gas is one of the most vital sources of energy in the United States. It supplies approximately
one half of all energy used in residential areas, and is one of the most promising fuel sources for
industrial and commercial applications making up 18% of U.S. electricity generation by fuel sources1.
Natural gas is a fossil fuel primarily made up of methane along with traces of heavier hydrocarbons such
as ethane, propane, and butane. The gas is colorless and odorless, but generates a great deal of energy
when combusted. Natural gas is favored as a fuel source because unlike other energy sources, the
combustion of natural gas is clean and does not emit harmful substances into the atmosphere.
The table below displays typical composition percentiles of natural gas.
Chemical Formula Composition Percentile
Methane CH4 70-90%
Ethane C2H6 0-20%
Propane C3H8
Butane C4H10
Carbon Dioxide CO2 0-8%
Oxygen O2 0-0.2%
Nitrogen N2 0-5%
Hydrogen sulfide H2S 0-5%
Rare gases A, He, Ne, Xe trace
Table 1: Natural gas composition percentiles2
Low Quality Natural Gas Approximately 30% of all natural gas reserves in the United States contain low quality natural gas
(LQNG). LQNG is gas from any reservoir containing excessive amounts of non‐hydrocarbon components
which place the gas outside of pipeline specifications. The most common contaminates of natural gas
are carbon dioxide, nitrogen, and hydrogen sulfide. These non‐combustible contaminates lower the

6
heating value of natural gas and must be removed prior to use. Changes in the heating value also
impact the Wobbe index which is used to determine the interchangeability of fuel types. Aside from
lowering the heating value, the contaminants are toxic, corrode pipe lines, and harm the environment1.
Water is also considered a contaminant due to risk associated with pipeline corrosion and freezing,
however, all natural gas reservoirs contain quantities of water to some extent that must be removed by
dehydration prior to processing. While there is no universal standard or government regulation for
LQNG, the most commonly used specifications between gas purchasers and suppliers are:
• Natural gas containing greater than 2% carbon dioxide
• Natural gas containing greater than 4% nitrogen
• Natural gas containing greater than a 4% combination of carbon dioxide and nitrogen
• Natural gas containing greater the 4 ppm hydrogen sulfide
Minor contaminates of natural gas include helium, argon, hydrogen, and oxygen, however these
chemicals typically act as inert gases and pose no major problems in processing LQNG.
LQNG contaminated by high concentrations of nitrogen account for 57% of all LQNG reserves, followed
by carbon dioxide, and other contaminates as displayed in figure 1. In this study nitrogen was the
primary contaminant targeted for removal to upgrade natural gas.

The mid‐c
would be
to process
continent reg
advantageou
s.
Table 2: H
Figure 1:
gion has the la
us to establis
High nitrog
33%
Top C
Major co
argest area o
h a process in
gen natura
10%
Contamina
7
ntaminate
of LQNG reser
n this region
al gas by r
57%
ants of LQ
es in natur
rves at 15.31
to ensure a c
region in th
NG Reserv
NitrogenContent
Carbon DContent
Other Contami
al gas
trillion cubic
consistent sup
he United S
ves
n
Dioxide
ninants
feet. Therefo
pply of natur
States
ore, it
al gas

Statistics
nitrogen.
Fig
SupersThe twent
chemical
line. All in
pathways
• Th
• Th
ut
• Th
an
of high nitro
gure 2: Sta
structure ty three proc
process is lab
ntermediate p
s of process fl
he removal o
he combustio
tility.
he conversion
nd fuels can b
0
50
100
150
200
250
300
Num
ber o
f Fields
gen content
atistics of
of Procesesses examin
beled in each
products wer
ow are as fol
of nitrogen to
on of natural
n of natural g
be developed
0
0
0
0
0
0
0
4 ‐ 10 % 1
StatiNatura
show that th
high N2 co
sses ned as monet
box and the c
re taken into
lows:
obtain pipeli
gas as a fuel s
gas to synthes
d from synthe
1‐17% 18‐24%
Mole F
itistics oal Gas in
8
he majority o
ontent natu
ization option
chemical pro
consideration
ne quality na
source to gen
sis gas by met
esis gases that
% 24‐30% 31‐
Fraction of N2 i
of High Nn the Mid
of reserves co
ural gas in
ns for LQNG a
duced is indic
n for market s
atural gas thro
nerate electri
thane steam
t have potent
‐37% 38‐45%
n Natural Gas
N2 Conted‐Contin
ontain 11‐17%
n the midc
are displayed
cated by each
sale. The thr
ough separat
city for mark
reforming. S
tially promisin
46 ‐ 52% 52%
nt nent
% mole fracti
continent.
in Figure 3.
h process flow
ee major
ion processes
et and centra
Several chemi
ng markets.
% +
ion of
The
w
s.
alized
icals

9
Figure 3: Superstructure diagram of monetization option model
The synthesis gas conversion was employed with and without the nitrogen contaminant to test the
effects, if any, of reactor size by keeping nitrogen in the system as an inert. A nitrogen plant was also
installed into the model to aid in ammonia and urea production. The process model took advantage of
centralized utility with the flow of electricity, steam, and other chemicals from process to process as

necessary
market tr
discussed
NitrogeSeveral op
the two m
swing ads
Blending
high qual
small qua
promising
summariz
y. The integr
rends by elim
in detail in th
en Separaptions have b
main method
sorption. Th
contaminate
ity gas are n
antities of g
g applications
zes current ni
ration of cen
minating the
he report.
ation Techbeen explored
ds for removi
e drawbacks
d streams wi
eeded to dilu
gas. Separatio
s that are curr
trogen remov
Table 3:
ntralized utilit
need to pu
hnologiesd for the utili
ng nitrogen f
to these app
ith high quali
ute the nitrog
on though m
rently in the d
val technolog
Nitrogen S
10
ty allows pro
urchase outsi
s zation of nitr
from natural
plications are
ity gas is ano
gen present
membranes a
development
gies.
Separation
oduction to b
ide goods.
rogen rich nat
gas are cryo
that they are
other option,
and the majo
and Molecul
t and early co
n Technolo
be independe
Each proce
tural gas rese
ogenic distilla
e both expen
but sufficien
ority of LQNG
lar Gate ads
ommercializat
ogies4
ent of unfavo
ss will furth
erves. Curr
ation and pre
nsive and com
nt flow volum
G reserves co
sorption are
tion stage. Ta
orable
er be
ently,
essure
mplex.
mes of
ontain
both
able 3

11
Cryogenic Distillation Cryogenic distillation is the most common method of removing nitrogen from natural gas. For nitrogen
< 20% a single column can be used, otherwise a duel configuration is best. This technology is based on
the use of cold temperatures (below ‐150 ⁰C), therefore water vapor, carbon dioxide, C3+ hydrocarbons,
and aromatics must all be removed in costly pretreatment operations4 to avoid damage to the
equipment. Due to the complexity of cryogenic separation, it is not economically viable at rates lower
than 50‐100 MMscfd. However, most of the gas with high nitrogen content is located in smaller
reserves where this technology would not be applicable4.
Pressure Swing Adsorption After cryogenic distillation, pressure swing adsorption is the most widely used method for the
separation of nitrogen from natural gas. Variations in the adsorbents polarity and size determine the
degree of separation in this process. The main factors that determine the amount being adsorbed are
the adsorbent being used, the component being adsorbed, temperature, and partial pressure of the
adsorbate5.
Pressure swing adsorption involves two major steps: the introduction on LQNG feed at high pressures
and regeneration of the adsorbent material at low pressures. Methane is adsorbed into the bed
allowing nitrogen to be removed at feed pressure. Once nitrogen has been removed from the feed,
regeneration is accomplished by dropping, or “swinging”, the column pressure allowing the gas to
desorb, purging the adsorbent of methane. This requires costly recompression of the methane rich
stream5 which makes this method unsatisfactory for the purposes being investigated.

12
Separation Through Membranes Purifying nitrogen rich natural gas through the use of membranes poses many challenges, but it is
currently being investigated with nitrogen‐permeable glassy membranes or methane‐permeable rubber
membranes. Membranes are selective, semi‐permeable barriers that allow different components to
pass through at different rates. Permeability is defined as the rate at which gas moves through a
membrane of standard thickness (1 cm) under a standard driving force (a pressure difference of 1
cmHg)5. This method has significant savings in energy cost compared to other methods of nitrogen
removal due to the simplicity in operation.
At low temperatures, nitrogen is easily removed in rubber silicon membranes. Gas liquefies on the
surface of the membrane, dissolves, diffuses, and then vaporizes on the other side. A high‐pressure gas
mixture feed passes along one side of the membrane allowing the molecules that permeate the
membrane to be swept using a gas on the other side of the membrane in the so‐called permeate
stream. The non‐permeating molecules that remain on the feed‐stream side exit the membrane as the
retentate stream5. An illustration of a spiral wound membrane, commonly used in natural gas
purification due to its high packing density, is seen in figure 4.
Figure 4: Spiral Wound membrane model

13
The process design used for a stand‐alone membrane process is shown in Figure 5. Three consecutive
heat exchangers are used to cool the feed gas in order to improve the degree of separation and
condense valuable heavy hydrocarbons. The uncondensed portion of the feed gas is processed through
the membrane to produce a methane rich permeate product and a high pressure nitrogen rich residue
stream byproduct that is converted to a low pressure fuel stream after cooling the feed.
Figure 5: Membrane separation process flow diagram5
Molecular Gate Pressure Swing Adsorption The molecular gate pressure swing adsorption process, originally developed by Engelhard Corporation,
has proven to be more cost effective than the traditional process. This adsorption is unique from other
adsorption processes, since the nitrogen is adsorbed instead of the methane. The simplicity and
reliability of this new technology has made it a leading option for upgrading nitrogen contaminated
steams since its commercialization in 20016. The molecular gate nitrogen system is capable of handling
flow rates as low as 0.5 MMscfd with the economics of scale increasing with flow rate.
The Molecular GateTM adsorbent material is titanium silicate (CTS‐1) designed with size selective pore
openings to remove nitrogen from methane. The molecular sieve with a pore size of 3.7Å is custom
14
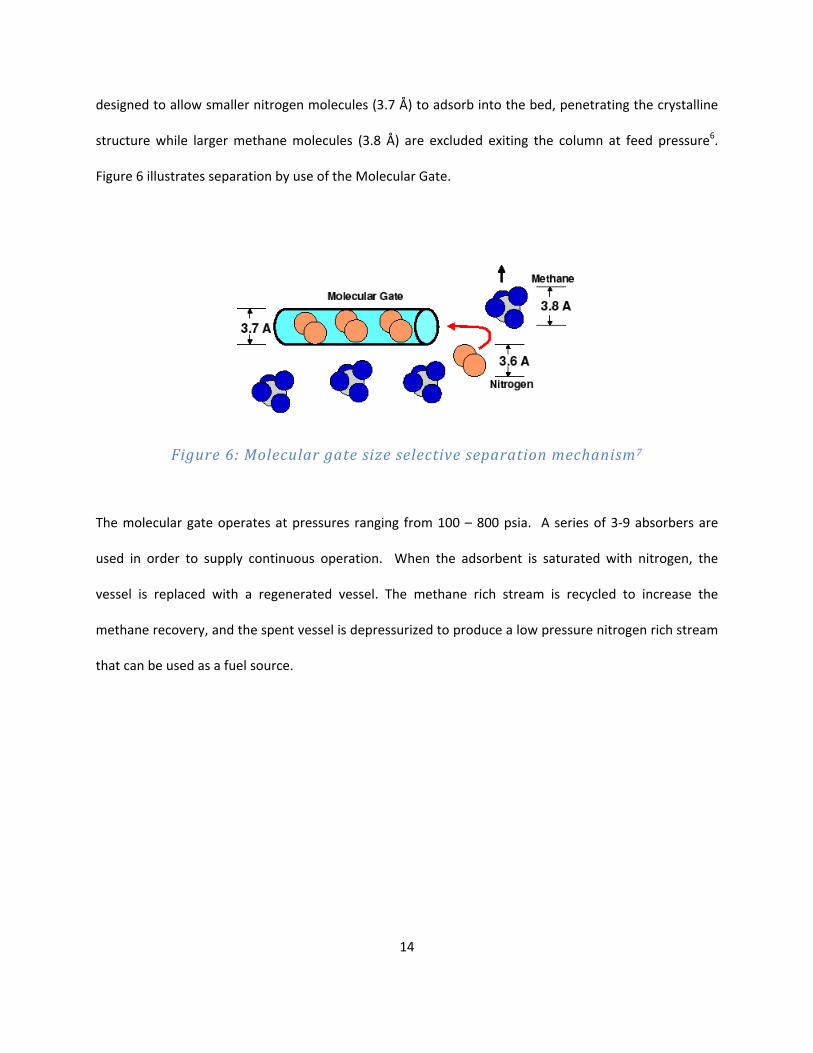
designed to allow smaller nitrogen molecules (3.7 Å) to adsorb into the bed, penetrating the crystalline
structure while larger methane molecules (3.8 Å) are excluded exiting the column at feed pressure6.
Figure 6 illustrates separation by use of the Molecular Gate.
Figure 6: Molecular gate size selective separation mechanism7
The molecular gate operates at pressures ranging from 100 – 800 psia. A series of 3‐9 absorbers are
used in order to supply continuous operation. When the adsorbent is saturated with nitrogen, the
vessel is replaced with a regenerated vessel. The methane rich stream is recycled to increase the
methane recovery, and the spent vessel is depressurized to produce a low pressure nitrogen rich stream
that can be used as a fuel source.
15
Additional Processing
Dehydration All gas wells contain quantities of water that must be removed in order to avoid freezing, corrosion,
and hydrate formation. Dehydrating natural gas usually involves one of two processes: absorption or
adsorption. Absorption is the use of a drying agent, such as glycol, to remove water vapor while
adsorption occurs when the water vapor is condensed and accumulated on a solid or liquid surface7.
In glycol dehydration, either diethylene glycol (DEG) or triethylene glycol (TEG)7 and liquid desiccant
dehydrators serve to absorb water vapor from the gas stream in a liquid gas contactor. Glycol has a high
affinity for water; therefore, it will serve to steal the water out of the gas stream. The heavy glycol
particles will then sink to the bottom of the contactor where water is boiled out of the solution in order
to reprocess the glycol. A recent addition to this technology is the introduction of a flash tank
separatator‐condenser to improve methane recovery. This operation allows the capture of methane
that was carried away with the glycol stream recovering up to 90 ‐ 99% of methane what would have
otherwise been flared into the atmosphere7.
Solid desiccation dehydration is a method that involves two or more adsorption towers filled with a solid
desiccate, typically activated alumina, granular silica gel, and other materials with high water capture
weight percents. Wet gas passes around the particles of desiccant material, and water is retained on
the surface of these desiccant particles. A high temperature heater is used to vaporize saturated
columns leaving dry desiccant allowing for further dehydration.
Desulfurization Hydrogen sulfide is both poisonous and foul‐smelling; therefore, a mandatory limit of 4 ppm is set for all
transmission lines. The combustion products of hydrogen sulfide release sulfur dioxide into the

16
atmosphere which is a significant environmental concern. Amine solutions are used to remove the
hydrogen sulfide through the amine or Girdler process which works similarly to glycol absorption.
Contaminated gas is run through a tower containing an amine solution that has a high affinity for sulfur.
Monoethanolamine (MEA) and diethanolamine (DEA) are the most common solutions used. Like glycol
dehydration, the amine solution can be processed and regenerated for continuous removal of hydrogen
sulfide7.
Each step in the process model called from dehydration and desulfurization processing prior to
operation, therefore it was not taken into cost considerations.
Power Generation from Natural Gas One consideration for the commercialization of LQNG is electrical power generation. Since the 1970’s,
natural gas has become the fuel source of choice due to economic, environmental, and technological
advantages. New power plants commonly use natural gas as an alternative to coal and nuclear sources
which release high levels of pollutants into the air. The high nitrogen content in the gas stream gives it
a medium heating value (200 to 800 BTU/scf)8. Combustion of fuel for electrical power generation is
normally conducted using steam unit, gas turbines, or a combined‐cycle turbine.
Steam Generation Units Steam units are the most basic combustion form of power generation. The process involves the burning
of fossil fuels in a boiler to heat water and produce steam that powers a turbine and generates
electricity. While the simplicity of this operation is advantageous the process performs poorly in terms
of energy efficiency converting only 30‐35% of the thermal energy produced into steam. Steam units
are commonly used for the combustion of large coal and nuclear generation plants8.

17
Gas Turbines Gas turbines operate by using the heated gases of fossil fuels to power the turbine and generate
electricity. Turbines are made up of three major components, a compressor, combustor, and power
turbine. The compressor draws in ambient air and compresses it up to 30 times ambient pressure. In
the combustor, fuel is introduced, ignited, and burned. Hot gases from combustion are diluted with air
from the compressor and directed to the power turbine section at temperatures up to 2600 oF. Here,
energy is expanded into the power turbine and recovered in the form of shaft horsepower4. This
process is illustrated in figure 8.
Figure 8: Gas turbine process flow diagram8
It was determined that the combination of a steam boiler and gas turbine were necessary for process
operation in the process flow model created.
Nitrogen Oxide Emissions
When combusting natural gas with nitrogen, one of the byproducts formed is nitrogen oxide (NOx),
which is any binary combination of nitrogen and oxygen. NOx emissions are very harmful to the
environment and can be fatal to humans at high concentrations. NOx reduction can be accomplished
using post‐combustion control techniques. Post‐combustion technologies chemically reduce NOx to
molecular nitrogen (N2) and water with or without the use of a catalyst.

18
Specific NOx control technologies were identified from the United States EPA control technology
database search, technical literature, control equipment vendor information, and personal process
knowledge and engineering experience. Potentially applicable control options for NOx identified as a
result of the above research are summarized in the Table 4 below. The table also provides a typical
control range for each option.
Table 4: Applicable NOx Control Options4
The control technology being used in this process is selective catalytic reduction due to the cost
effectiveness and pollutant control of this method. The technology has been applied to many industrial
combustion turbines and has been provide reliable. This technology works by mixing ammonia with the
NOx emissions and running the mixture over a zeolite based catalyst, this breaks down the mixture into
nitrogen and water.
Electricity Demand and Forecast Figure 10 represents the growing demand for electricity in the United States. Industrial, commercial,
and residential usages are factored into this forecast.
Control Technology Typical Emission Levels
SCONOxTM 2-5 ppm
XONON flameless combustion 3-5 ppm Selective catalytic reduction (SCR) 5-9 ppm Selective non-catalytic reduction (SNCR) 9-25 ppm Non-selective catalytic reduction (NSCR) 9-25 ppm Dry low NOx combustor 9-25 ppm Water or steam injection 25-40 ppm

19
Figure 10: Growing demand for electricity in the United States4
Figure 11 shows the stability of the electrify market. This is due to a decrease in the distribution
component (making up 24% of the market) along with a gradual increase in generation component (64%
of market). Uncertainties affecting the electricity market in the United States include price fluctuations
due to climates, regional markets, demand, and raw fuel cost4.
0
200
400
600
800
1000
1200
1400
1600
1800
2000
1960 1970 1980 1990 2000 2010 2020 2030
Elec
tric
al C
onsu
mpt
ion
(109
kW-h
r)
Year

20
Figure 11: Projected market for electricity in the United States4
Synthesis Gas Product Selection
Synthesis gas is a gaseous mixture made up of varying concentrations of carbon monoxide and
hydrogen. Syngas is produced from the gasification of carbon containing fuel by the follow equation.
CH4 + H2O → CO + 3H2
Synthesis can also be used as an intermediate to produce several different products and fuels. For this
evaluation eight different products were considered and compared to find the most valuable operation
for the commercialization of low quality natural gas. These products were analyzed on the basis of
demand, raw material and market price, operating cost, and capital investment. As illustrated in figure
3, each process was evaluated with and without nitrogen as a reactant or inert.
4
5
6
7
8
9
10
1960 1970 1980 1990 2000 2010 2020 2030
Elec
tric
al P
rice
(cen
ts/k
W-h
r)
Year

21
Hydrogen Hydrogen is a colorless, odorless gas that is synthesized by the steam reforming of methane. Steam
reforming is the most common method of producing commercial bulk hydrogen. At temperatures of
700‐1100⁰C in the presence of a metal‐based catalyst, such as nickel, steam reacts with methane to
form hydrogen and carbon monoxide by the following reaction.
CH4 +H2O → 3H2 + CO (1)
Additional hydrogen can be recovered at low temperatures along with carbon dioxide in the water shift
reaction.
H2O + CO2 → H2 +CO2 (2)
Hydrogen is most commonly used for the processing of fossil fuels and the production of ammonia or
methanol3.
Ammonia Ammonia is a colorless alkaline gas with a penetrating odor. It is synthesized by the Haber ‐ Bosch
process, with the use of an iron substrate (in which aluminum oxide and potassium oxide are used as
promoters) to react hydrogen and nitrogen to form ammonia.
3H2 + N2 → 2NH3 (3)
The reaction is carried out under operating conditions of 150‐250 atm and 450 ‐ 500⁰C. Ammonia is one
of the most largely produced inorganic chemicals as a key component in the fertilizer industry. Other
uses include the production of urea (also substantial in fertilizers), nitric acid, and ammonium nitrate3.

22
Urea Urea is produced as a solid typically in the form of prills or granules. It is most commonly used in
fertilizers, plastics, and as protein supplement in animal feed. Urea is created by reacting ammonia with
carbon dioxide3.
2NH3 + CO2 → NH2CONH2 + H2O (4)
Methanol Methanol, the simplest alcohol, is a light, volatile, colorless, and flammable chemical whose uses include
antifreeze, solvents, fuels, and as an intermediate in the production of other products. Methanol is
formed from synthesis gas in steam‐methane reforming or partial oxidation at low temperature and
high pressures3.
2H2 +CO →CH3OH (5)
Formaldehyde From the catalytic oxidation and dehydrogenation of methanol, formaldehyde is created. Silver metal or
iron oxide with molybdenum and vanadium are the most common catalysts used.
CH3OH → H2CO + H2 (6)
The chemical is most commonly used to produce polymers and a wide variety of specialty chemicals.
Acetic Acid Acetic acid, also known as ethanoic acid, is a weak carboxylic acid used in the production of vinyl acetate
monomer and acetic anhydride. The chemical is corrosive and its vapor causes irritation of the eyes,
nose, and throat, however it is best recognized as the chemical that contributes to the pungent taste
and smell of vinegar. A rhodium‐based catalyst is used to produce acetic acid from methanol by
methanol carbonylation3.
CO + CH3OH → CH3COOH (7)

23
Dimethyl Ether Dimethly ether is colorless, gaseous ether commonly used as aerosol spray propellant or as a
refrigerant. It is also commonly used in conjunction with propane to decrease temperatures as low as
negative 60⁰F. This feature is significant in cryogenic distillation. Dimethyl ether is produced in the
dehydration of methanol by the following equation:
2CH3OH → CH3OCH3 + H2O (8)
Synthetic Fuel Synthetic fuel, or synfuel, is a liquid fuel source obtained from natural gas. The Fischer‐Tropsch process
involves the reaction of synthesis gas over an iron or cobalt catalyst to produce liquid hydrocarbons.
Typical catalyses used for this reaction are iron and cobalt. The reaction is displayed in equation x,
where n is a positive integer.
(2n+1)H2 + nCO → CnH(2n+2) + nH2O (9)
Diesel and naphtha are the most common products produced from synthetic fuel. Diesel can be used as
a direct fuel source for diesel powered engines, and naphtha is used as a feed source to create higher
octane rated gasoline3.
Mathematical Model In order to determine the most profitable commercialization options for LQNG, a mathematical model
was coded and run in the Generic Algebraic Modeling System (GAMS). The model uses Mixed Integer
Linear Programming (MILP) methodology where continuous; integer and binary variables are combined

24
in a set of linear constraints that determine the feasible region for the solution of the problem. A total
investment of $100,000,000 was set to maximized is the Net Present Value (NPV) of the project.
The following assumptions were made in this model:
1.) The minimum accepted rate of investment was set to 11%, this is based on the investment
being entered into an established market. (Design pg. 322)
2.) The maximum investment available is $100,000,000.
3.) The project life is assumed to be twenty years.
4.) There is a standard inflation rate applied to all final product costs and raw material costs,
the reason for this, is because it is very difficult to predict the future prices of many of the
chemicals.
5.) Natural gas was previously taken from the ground and delivered; therefore there was no
cost in obtaining the natural gas. This assumption leads to very high net present worth
values, since the natural gas is “free” and all cost associated extracting the gas from the
reservoir site were negligible.
The model sets were defined as follows, the variable i is set to represent the 23 possible processes
displayed in figure 1, j corresponds to the chemicals used within the operation, and t is a time span of 20
years during which operating conditions remain constant. The following table defines variables used in
the model.
Variable Definition
capacity(I,t) capacity of each process z net present worth Y(i,t) binary variable FCI(i,t) fixed capital
25
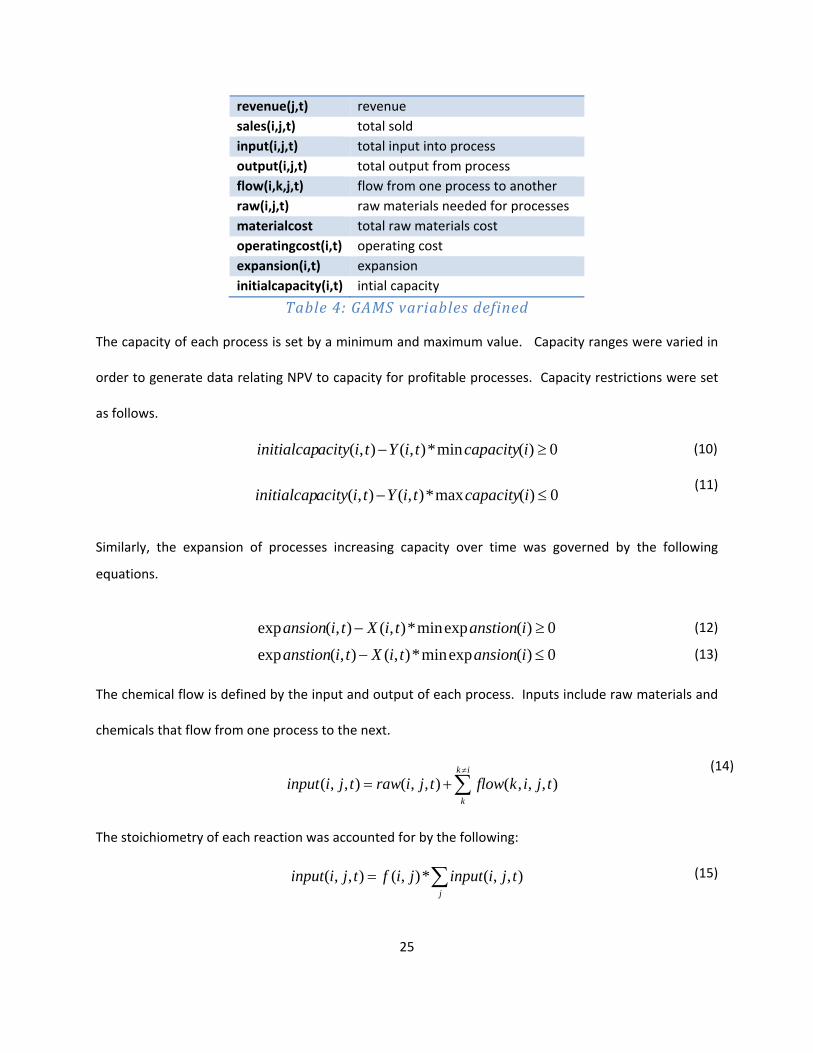
revenue(j,t) revenue sales(i,j,t) total sold input(i,j,t) total input into process output(i,j,t) total output from process flow(i,k,j,t) flow from one process to another raw(i,j,t) raw materials needed for processes materialcost total raw materials cost operatingcost(i,t) operating cost expansion(i,t) expansion initialcapacity(i,t) intial capacity
Table 4: GAMS variables defined
The capacity of each process is set by a minimum and maximum value. Capacity ranges were varied in
order to generate data relating NPV to capacity for profitable processes. Capacity restrictions were set
as follows.
(10)
(11)
Similarly, the expansion of processes increasing capacity over time was governed by the following
equations.
(12)
(13)
The chemical flow is defined by the input and output of each process. Inputs include raw materials and
chemicals that flow from one process to the next.
(14)
The stoichiometry of each reaction was accounted for by the following:
(15)
0)(min*),(),( ≥− icapacitytiYtiacityinitialcap
0)(max*),(),( ≤− icapacitytiYtiacityinitialcap
0)(expmin*),(),(exp ≥− ianstiontiXtiansion
0)(expmin*),(),(exp ≤− iansiontiXtianstion
∑≠
+=ik
ktjikflowtjirawtjiinput ),,,(),,(),,(
∑=j
tjiinputjiftjiinput ),,(*),(),,(

26
To further define the flow of the system, mass balances and constraints on output values were defined.
This standard mass balance states that everything that comes into the system must come out. The
variable gamma was used to represent flow from one process to the next.
(16)
(17)
(18)
To ensure that the market is not oversaturated with products, constraints were set on sales and demand
trends.
(19)
Revenue generated from each process is the raw profit made prior to any deductions, such as operating
costs. To account for costs associated with maintenance, labor, and utilities, operating cost must be
calculated for each process.
(20)
(21)
∑ ∑=j j
tjioutputtjiinput ),,(),,(
∑≠
+=jk
ktkjiflowtjisalestjioutput ),,,(),,(),,(
),,(*),,(),,,( kjioutputkjigammatjkiflow ≤
∑ ≤i
tjdemandtjisales ),(),,(
∑=i
tjisalestjpricetjrevenue ),,(),(),(
∑ ∑≤
+=tt
t jtjioutputiansiontiYideltatitoperating ),,()(exp),()(),(cos

27
Fixed capital investment, is the amount of money invested to start up the process. As stated, a
$100,000,000 investment was allocated for the construction and operation of the commercialization
processes.
(22)
(23)
Finally, the objective function of the mathematical model is to maximize the net present worth of the
project based on the following equation.
(24)
Using GAMS to construct the superstructure of processes illustrated by Figure 3 was essential in
determining the best options for nitrogen rich natural gas commercialization. In using this program
detailed spreadsheets were created specifying the input stoichiometry, output stoichiometry, demand,
cost of raw materials, and flow from each process over a twenty year period for all twenty three
processes. With the compilation of economic equations, process costs, and chemical flow and reaction
data, GAMS was able to successfully generate results for the 176,640,000 combinations defined in a
matter of seconds. This is also beneficial because different factors such as capacity and nitrogen
content could easily be altered to generate new results based on varying specifications.
),(*)()(*),(),( tiacityinitialcapibetaialphatiYtiFC +=
investmenterest
ttmaterialtiFC
tityear ≤
+∑
,)(int
)10
1.0(*)(cos,(
)int
)(cos),(),(cos),(()( )(∑ ∑ ∑∑ −−−=j i i
tyeart erest
ttmaterialtiFCtitoperatingtjrevenuezNPV

28
Results The mathematical model evaluated the 23 processes and reported operating cost, revenue, capital cost,
and raw material cost. The net present value (NPV) of each process was also calculated based on the
specified criterion in equation 24. NPV is a profitability calculation that determines if a process is
advantageous based on the difference of all cash inflows and outflows associated with a given process.
A profitable process is defined by a positive NPV while an unprofitable process will have a negative
value. This numerical factor was imperative in deciding which process should and should not be built.
Two different capacities and three different nitrogen contents were tested in the model to determine
the type of process that would be most profitable. For a reserve size smaller than 5MMSCF/D with a
nitrogen content less than 30%, the most profitable option was to upgrade the natural gas using the
molecular gate technology and sell the pipeline quality gas. The reasoning behind the simple solution is
that more complex operations would not generate enough revenue to make up for their high capital
costs.
Figure 12: Results for Q < 5MMSCF/D and Nitrogen Composition 4 30%

29
If the reserve capacity is set greater than 5 MMSCF/D and the nitrogen content is between 15‐30%, then
the best option is to upgrade the natural gas using the molecular gate technology and then converting it
to urea using the synthesis gas conversion route. The nitrogen plant is capable of supplying extra
nitrogen needed and provides a market for oxygen. Steam and electricity generated from the
contaminated natural gas will work as centralized utility to fuel the other processes.
Figure 13: Results for Q > 5MMSCF/D and Nitrogen Composition 15 30%
The last option considered a reserve size greater than 5 MMSCF/D and a nitrogen content less than 15%.
The production of urea was also favored for this option; however, the subsequent purification was not
necessary due to the low concentration of nitrogen. The reduction in nitrogen allowed for smaller
reactor sizes in the process allowing the nitrogen to remain the process as an inert without impacting
costs. Centralized utility for steam, electricity, and nitrogen were also factors of this operation as well.

30
Figure 15: Results for Q > 5MMSCF/D and Nitrogen Composition 4 15%
Table 5 below shows the investment costs and NPV for all three options considered.
Option # Reserve Size % N2 Content Initial Investment NPV
1 3 MMSCF/D 15% $475,000 $ 20,425,000
2 10 MMSCF/D 25% $9,250,000 $ 138,600,000
3 10 MMSCF/D 10% $6,200,000 $169,350,000
Table 5: Summary of GAMS Results

31
Since urea was the most economical choice of the mathematical model market of urea was explored.
Approximately 90% of urea is used in producing fertilizer; while the other 10% is used in various
commodities such as cigarettes, toothpaste, pretzels, etc.. Since these markets have been established
for long periods of time and are fairly constant the demand for urea has been constant for the past
seven years as shown in Figure 16.
Figure 16: Urea demand forecast3
The price of urea over the past has been volatile and is dependent on the market price of nitrogen and natural gas. Since both nitrogen and natural gas are being produced in the plant, the price should be stable.

32
Conclusions With the forecast of the natural gas demand in the United States continuing to exceed the supply of
natural gas, low quality natural gas is a great alternative. The evaluation of low quality natural gas leads
to two major conclusions. The first is that the most economical way of separating the nitrogen from
natural gas is using pressure swing adsorption with molecular gate technology. The second is that the
most economical product produced from nitrogen rich natural gas varies by reserve capacity and
nitrogen content. If reserve capacity is low the natural gas is most profitable by removing the nitrogen
using the PSA process and selling the natural gas via pipeline. If reserve capacity is high the most
profitable product produced is urea and is most economically produced by separating the nitrogen out
of the natural gas before processing at high nitrogen contents and keeping the nitrogen in when
processing at low nitrogen contents.

33
Resources 1. Overview of Natural Gas, http://www.naturalgas.org/overview/background.asp. Copyright
2004.
2. Achenson W.P, Hackworth J.H, Kasper S., McIlvried H.R, “Utilization of Low‐Quality Natural Gas –
A Current Assessment,” K & M Engineering and Consulting Corporation. January 1993.
3. Bailey K., Farberow C., “Green is Seen in Fertilizers ‐ A New Approach to Municipal Solid Waste
Management,” University of Oklahoma. 1 May 2007.
4. Lavaja J., Lawson B., Lucas A., “Upgrading Low BTU Gas of High Nirtogen Content to Power of
Pipeline,” University of Oklahoma.
5. Kidnay A., Parrish W., “Fundamentals of Natural Gas Processing,” 21 June 2006.
6. Molecular Gate® Adsorption Technology, http://www.moleculargate.com/nitrogen‐
rejection.html, Guild Associated Inc., Copyright 2007.
7. Processing Natural Gas, http://www.naturalgas.org/naturalgas/processing_ng.asp,
NaturalGas.org, Copyright 2004.
8. Electrical Generation using Natural Gas,
http://www.naturalgas.org/overview/uses_eletrical.asp, NaturalGas.org, Copyright 2004.