commerzbank 4.0 transformation continues – stable business performance … · 2017-12-04 ·...
TRANSCRIPT
Commerzbank 4.0 transformation continues –stable business performance in Q3Credit update to fixed income investors – Q3 2017 results
GM – Investor Relations | GM – Treasury | Europe | December 2017
These written materials and the information contained herein are not being issued and may not be distributed in the United States of America, Canada, Japan or Australia.

Disclaimer
1
This presentation contains forward-looking statements. Forward-looking statements are statements that are not historical facts; they include, inter alia, statements about Commerzbank’s beliefs and expectations and the assumptions underlying them. These statements are based on plans, estimates, projections and targets as they are currently available to the management of Commerzbank. Forward-looking statements therefore speak only as of the date they are made, and Commerzbank undertakes no obligation to update any of them in light of new information or future events. By their very nature, forward-looking statements involve risks and uncertainties. A number of important factors could therefore cause actual results to differ materially from those contained in any forward-looking statement. Such factors include, among others, the conditions in the financial markets in Germany, in Europe, in the United States and elsewhere from which Commerzbank derives a substantial portion of its revenues and in which it hold a substantial portion of its assets, the development of asset prices and market volatility, potential defaults of borrowers or trading counterparties, the implementation of its strategic initiatives and the reliability of its risk management policies.
In addition, this presentation contains financial and other information which has been derived from publicly available information disclosed by persons other than Commerzbank (“external data”). In particular, external data has been derived from industry and customer-related data and other calculations taken or derived from industry reports published by third parties, market research reports and commercial publications. Commercial publications generally state that the information they contain has originatedfrom sources assumed to be reliable, but that the accuracy and completeness of such information is not guaranteed and that the calculations contained therein are based on a series of assumptions. The external data has not been independently verified byCommerzbank. Therefore, Commerzbank cannot assume any responsibility for the accuracy of the external data taken or derived from public sources.
Copies of this document are available upon request or can be downloaded from https://www.commerzbank.de/en/hauptnavigation/aktionaere/investor_relations.html
GM – Investor Relations | GM – Treasury | Europe | December 2017
These written materials and the information contained herein are not being issued and may not be distributed in the United States of America, Canada, Japan or Australia.

Commerzbank at a glance: Selected Group Financials
Shareholder structure as of Nov. 2017Figures
Op. result(in €m)
Consolidated profit 1
(in €m)
CET 12
Op. RoTE 3
Cost income ratio op. business
Total revenues(in €m)
7,000 9,399 6,971
1,062 1,399 1,144
96 279 664
76.1 % 75.5 % 76.0 %
12.3 % 12.3 % 13.5 %
5.4 % 5.3 % 5.7 %
9M 2016 FY 2016 9M 2017
Employees(FTE)
42,19042,512 41,626
30.09.2016 31.12.2016 30.09.2017
21) Attributable to Commerzbank shareholders2) Basel 3 fully phased-in3) Operating return on tangible equity
4) Incl. (€807m) restructuring charges
Commerzbank 4.0
simple – digital – efficient
~25%PrivateInvestors ~50%
Institutional Investors
> 15%Federal Republic of Germany
> 5%BlackRock
> 5%Cerberus
GM – Investor Relations | GM – Treasury | Europe | December 2017
These written materials and the information contained herein are not being issued and may not be distributed in the United States of America, Canada, Japan or Australia.
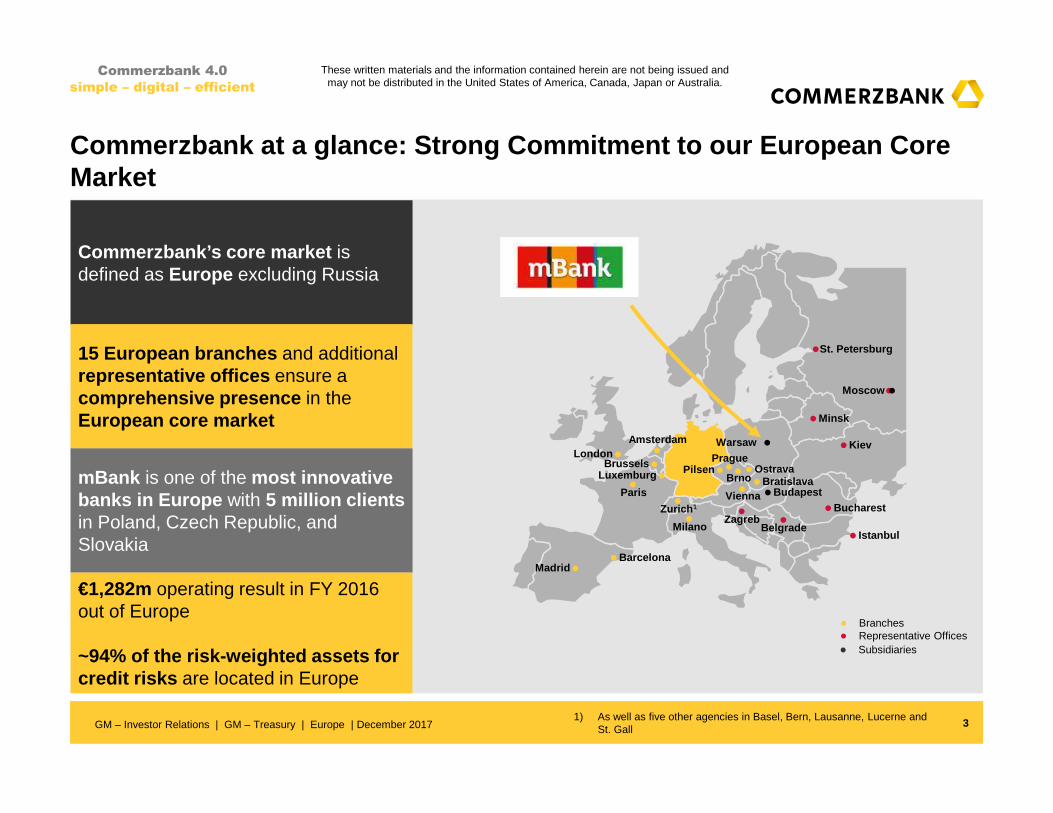
Commerzbank at a glance: Strong Commitment to our E uropean Core Market
Commerzbank’s core market is defined as Europe excluding Russia
15 European branches and additional representative offices ensure a comprehensive presence in the European core market
3
mBank is one of the most innovative banks in Europe with 5 million clients in Poland, Czech Republic, and Slovakia
€1,282m operating result in FY 2016 out of Europe
~94% of the risk-weighted assets for credit risks are located in Europe
1) As well as five other agencies in Basel, Bern, Lausanne, Lucerne and St. Gall
•Warsaw
•Madrid•Barcelona
• Istanbul
•Bucharest•Budapest
•Belgrade•Zagreb
•Paris
•London •Amsterdam
•Brussels•Luxemburg
•Zurich 1
•Milano
•Prague
•Brno •Bratislava•Ostrava
•Vienna
•Pilsen
•Kiev
•Minsk
•Moscow
•St. Petersburg
•
Commerzbank 4.0
simple – digital – efficient
● Branches
● Subsidiaries● Representative Offices
GM – Investor Relations | GM – Treasury | Europe | December 2017
These written materials and the information contained herein are not being issued and may not be distributed in the United States of America, Canada, Japan or Australia.
4
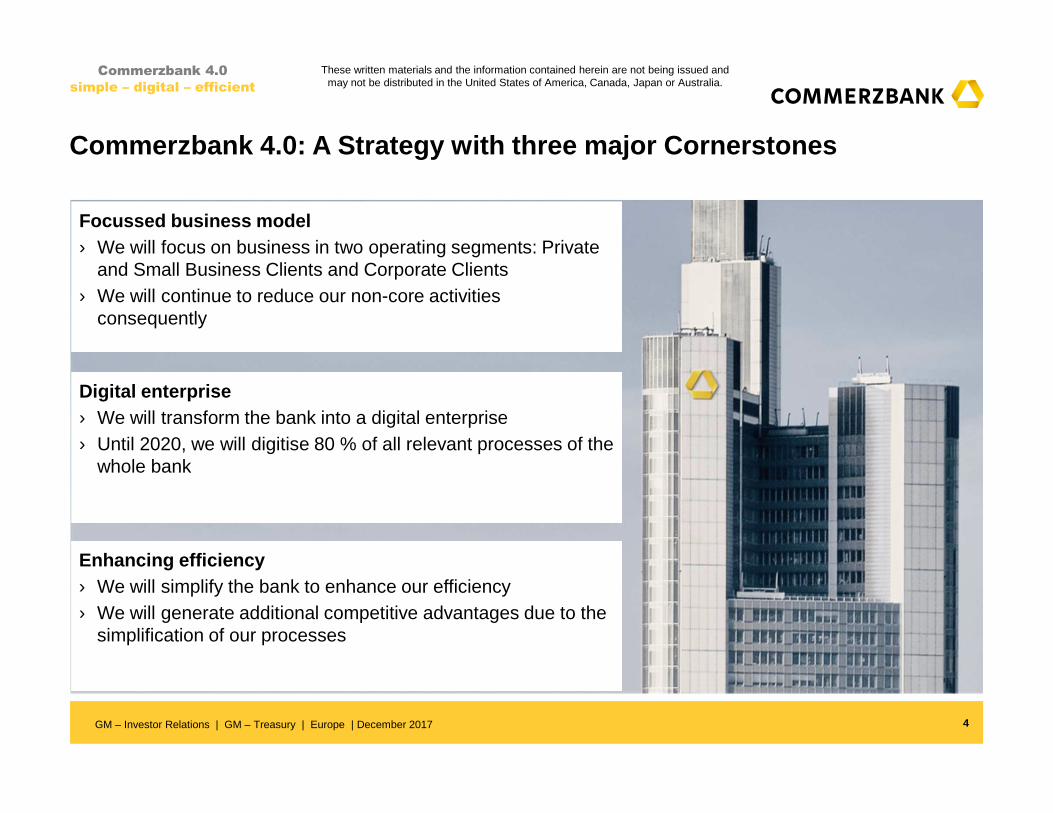
Focussed business model› We will focus on business in two operating segments: Private
and Small Business Clients and Corporate Clients› We will continue to reduce our non-core activities
consequently
Commerzbank 4.0: A Strategy with three major Corner stones
Digital enterprise› We will transform the bank into a digital enterprise› Until 2020, we will digitise 80 % of all relevant processes of the
whole bank
Enhancing efficiency› We will simplify the bank to enhance our efficiency› We will generate additional competitive advantages due to the
simplification of our processes
Commerzbank 4.0
simple – digital – efficient
GM – Investor Relations | GM – Treasury | Europe | December 2017
These written materials and the information contained herein are not being issued and may not be distributed in the United States of America, Canada, Japan or Australia.
5
Strategy
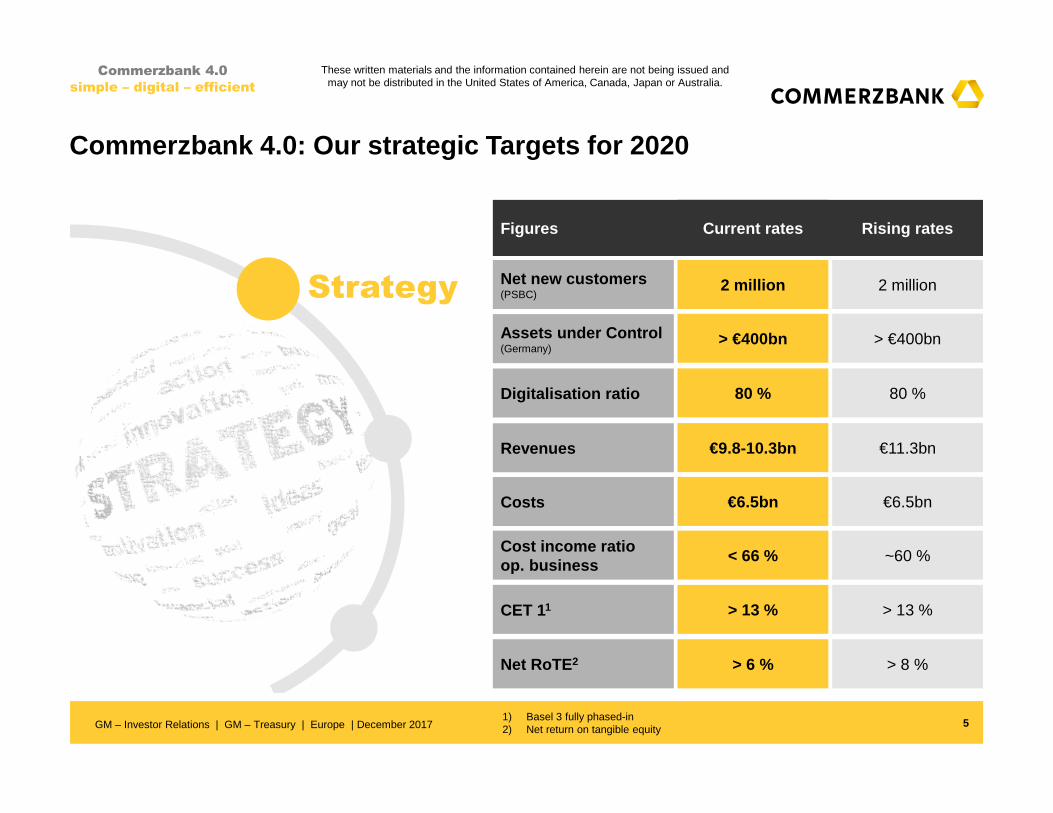
Commerzbank 4.0: Our strategic Targets for 2020
Figures
Assets under Control (Germany)
Digitalisation ratio
Costs
Cost income ratio op. business
Revenues
Net new customers (PSBC)
2 million 2 million
> €400bn > €400bn
80 % 80 %
€9.8-10.3bn €11.3bn
€6.5bn €6.5bn
< 66 % ~60 %
Current rates Rising rates
CET 11
Net RoTE 2
> 13 % > 13 %
> 6 % > 8 %
1) Basel 3 fully phased-in2) Net return on tangible equity
Commerzbank 4.0
simple – digital – efficient
GM – Investor Relations | GM – Treasury | Europe | December 2017
These written materials and the information contained herein are not being issued and may not be distributed in the United States of America, Canada, Japan or Australia.
Commerzbank 4.0 transformation continues – stable bu siness performance in Q3
6
Commerzbank 4.0
simple – digital – efficient
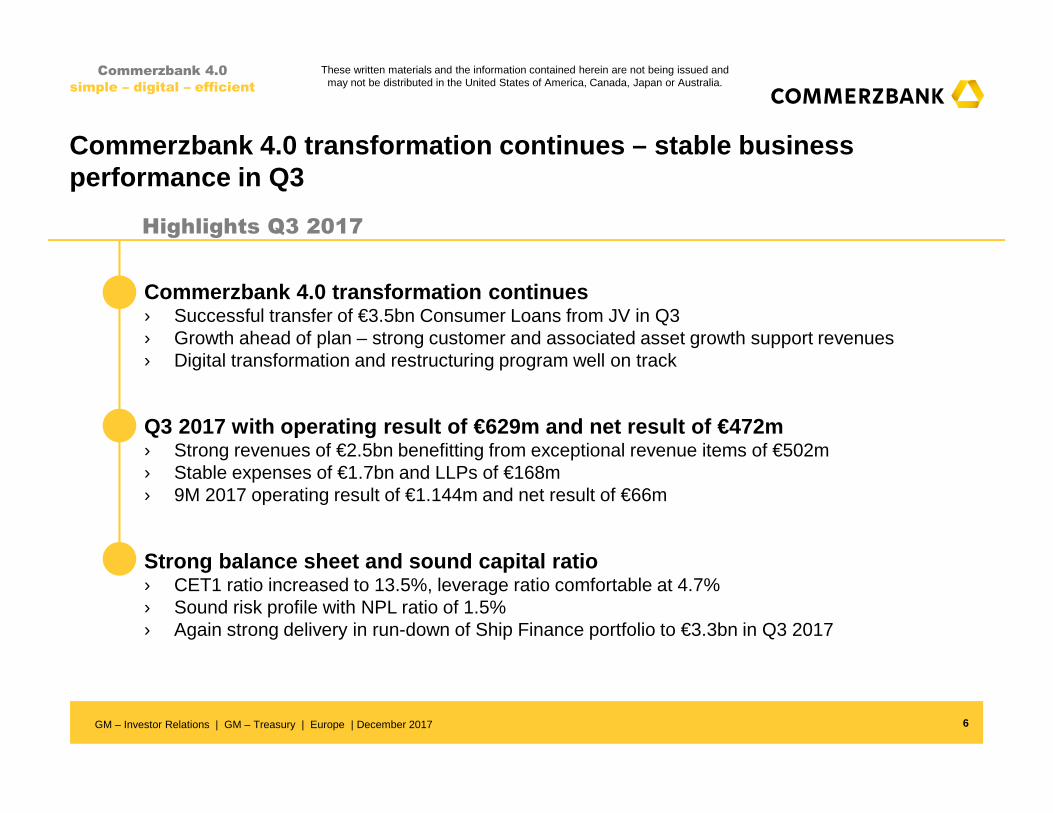
Commerzbank 4.0 transformation continues › Successful transfer of €3.5bn Consumer Loans from JV in Q3 › Growth ahead of plan – strong customer and associated asset growth support revenues› Digital transformation and restructuring program well on track
Highlights Q3 2017
Q3 2017 with operating result of €629m and net resu lt of €472m› Strong revenues of €2.5bn benefitting from exceptional revenue items of €502m › Stable expenses of €1.7bn and LLPs of €168m› 9M 2017 operating result of €1.144m and net result of €66m
Strong balance sheet and sound capital ratio› CET1 ratio increased to 13.5%, leverage ratio comfortable at 4.7%› Sound risk profile with NPL ratio of 1.5%› Again strong delivery in run-down of Ship Finance portfolio to €3.3bn in Q3 2017
GM – Investor Relations | GM – Treasury | Europe | December 2017
These written materials and the information contained herein are not being issued and may not be distributed in the United States of America, Canada, Japan or Australia.
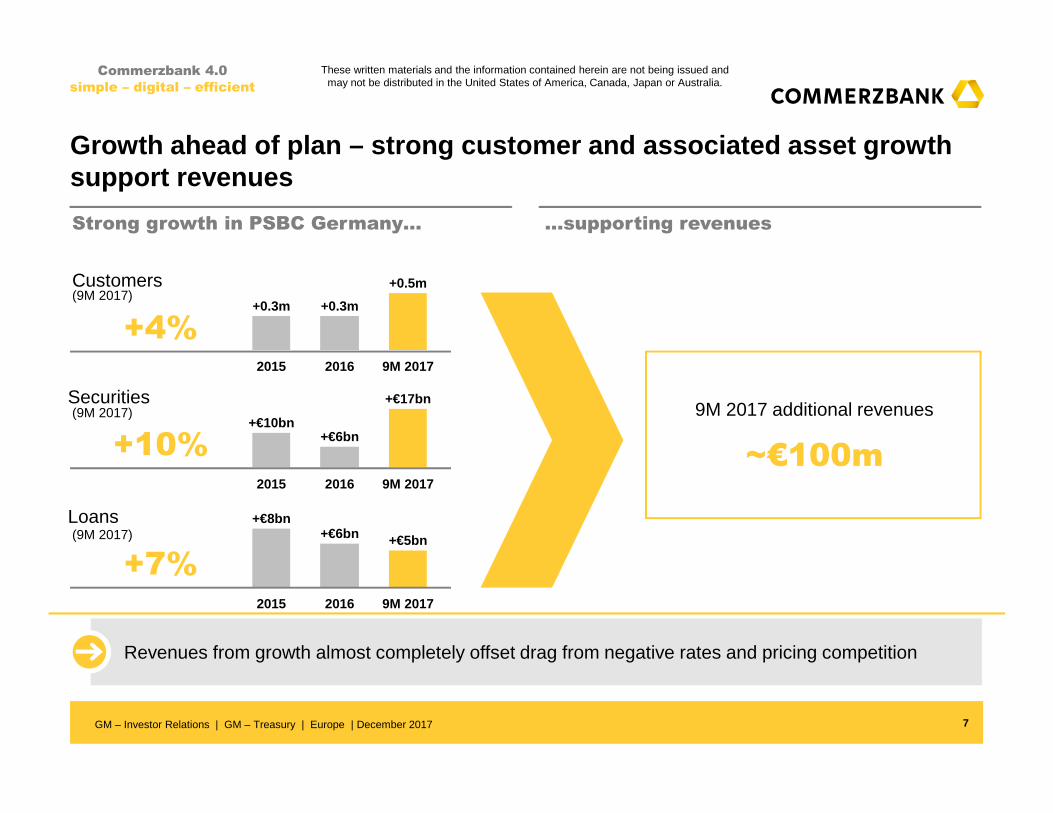
+€17bn
20162015 9M 2017
+€10bn+€6bn
+€8bn+€6bn
9M 2017
+€5bn
20162015
+0.3m
2015
+0.3m
9M 2017
+0.5m
2016
7
Strong growth in PSBC Germany… …supporting revenues
Commerzbank 4.0
simple – digital – efficient
Growth ahead of plan – strong customer and associate d asset growth support revenues
Revenues from growth almost completely offset drag from negative rates and pricing competition
+4%
+10%
+7%
Customers
Securities
Loans
9M 2017 additional revenues
~€100m
(9M 2017)
(9M 2017)
(9M 2017)
GM – Investor Relations | GM – Treasury | Europe | December 2017
These written materials and the information contained herein are not being issued and may not be distributed in the United States of America, Canada, Japan or Australia.

Progress of key execution indicators in line with p lan
Commerzbank 4.0
simple – digital – efficient
Net new customers (GER)
(m cumulated)
0.6 0.5
2020
2.0
2017Since 10/2016
Net new customers
(k cumulated)
3.54.1
2020
10.0
2017Since 01/2016
Digitalisation ratio
(%)80
5043
202020179M 2017
Assets under Control (GER)
(€bn eop)
2020
>400
2017
>345
9M 2017
366
Revenues/ RWA
(%)
2020
4.2
2017
3.7
9M 2017
3.7
Digital IT investments
(%)50
4050
202020179M 2017
Market share SBC1) (Wallet)
(%)8
65
202020179M 2017
Market share TFS2) (GER)
(%)
2017 2020
3230
9M 2017
30
FTE development
41.6
9M 2017 20202017
3642
Private and Small
Business Customers
Corporate Clients
Group
(k)
81) SBC = Small Business Customers2) TFS = Trade Finance & ServicesGM – Investor Relations | GM – Treasury | Europe | December 2017
These written materials and the information contained herein are not being issued and may not be distributed in the United States of America, Canada, Japan or Australia.

Exceptional revenue items
9
Commerzbank 4.0
simple – digital – efficient
2016 2017
› Hedging & valuation adjustments› Extraordinary dividend EKS (PSBC)› Sale of bond positions (CC) €155mQ1
Q2
Q3
Q4
€68m€44m€43m
› Hedging & valuation adjustments› Sale Visa Europe (PSBC)
€157m
€34m€123m
Revenues
› Hedging & valuation adjustments› Sale of CISAL (PSBC)
€231m
€206m€25m
› Hedging & valuation adjustments› Heta (ACR)› Property sales gains (O&C) €288m
€20m€135m€133m
€831mFY
› Hedging & valuation adjustments
€108m
€108m
Revenues
€8m
› Hedging & valuation adjustments €8m
€502m
› Hedging & valuation adjustments› Concardis (PSBC)› Consumer Finance Joint Venture
- thereof PPA effect Q3› Property sales gains (O&C)
€28m€89m
€160m-€16m
€225m
› Consumer Finance JV PPA Q4 (PSBC)
-€28m
GM – Investor Relations | GM – Treasury | Europe | December 2017
These written materials and the information contained herein are not being issued and may not be distributed in the United States of America, Canada, Japan or Australia.

13.513.011.8
Q3 2017Q2 2017Q3 2016
4.64.5 4.7
Q3 2017Q2 2017Q3 2016
472
-637
-288
Q3 2017Q2 2017Q3 2016
Key financial figures at a glance
10
Group Financial Results Group Capital
198 175 127
Q3 2017Q2 2017
1838
Q3 2016
429
231502
629
Operating result(€m)
Net result1)
(€m)
Commerzbank 4.0
simple – digital – efficient
Leverage ratio fully phased-in(% end of period)
B3 CET1 ratio fully phased-in(% end of period)
1) Consolidated result attributable to Commerzbank shareholders
Exceptional revenue items
GM – Investor Relations | GM – Treasury | Europe | December 2017
These written materials and the information contained herein are not being issued and may not be distributed in the United States of America, Canada, Japan or Australia.

-205-99 -117
Q3 2017
-100
Q2 2017
-82
Q3 2016
-108
-131-69 -110
Q3 2017Q2 2017
-111
Q3 2016
-63
Operating result of Commerzbank divisions
11
141 143
249
Q3 2017
381
238
Q2 2017
142
Q3 2016
27324
Private and Small Business Customers(€m)
Others & Consolidation(€m)
Commerzbank 4.0
simple – digital – efficient
Asset & Capital Recovery (€m)
Corporate Clients(€m)
Exceptional revenue items
-1
107
6
17 1797
223 232243
Q3 2017Q2 2017
2419
234104
327
Q3 2016-9
238
1
GM – Investor Relations | GM – Treasury | Europe | December 2017
These written materials and the information contained herein are not being issued and may not be distributed in the United States of America, Canada, Japan or Australia.

Group operating result of €629m and net result of €472m i n Q3 2017
12
Highlights
Group operating result(€m)
Group P&L
› Positive 9M 2017 net result of €66m despite €807m restructuring charge, covering full Commerzbank 4.0 efficiency program
› Stable underlying revenues in PSBC and CC q-o-q despite seasonally slower Q3
› Lower underlying revenues in ACR mainly due to portfolio sales – reduced treasury contribution in O&C due to slower markets
629
183
332337429
351282
Q2Q1Q4Q3Q2Q1 Q3
2016 2017
Commerzbank 4.0
simple – digital – efficient
1) Consolidated result attributable to Commerzbank shareholders
1)
in € m Q3 2016 Q2 2017 Q3 2017 9M 2016 9M 2017
Revenues 2,437 2,068 2,511 7,000 6,971
Revenues excl. exceptional items 2,206 2,060 2,009 6,457 6,353
LLP -275 -167 -168 -610 -530
Costs 1,733 1,718 1,714 5,328 5,297
Operating result 429 183 629 1,062 1,144
Impairments on goodw ill and other intangible assets
627 - - 627 -
Restructuring expenses 57 807 - 97 807
Taxes on income 14 -12 135 161 204
Minority interests 19 25 22 81 67
Net result -288 -637 472 96 66
CIR (%) 71.1 83.1 68.3 76.1 76.0
Ø Equity (€bn) 29.4 29.8 29.6 29.5 29.7
Net RoE (%) -4.1 -8.9 6.6 0.4 0.3
Net RoTE (%) -4.5 -9.8 7.3 0.5 0.3
Operating return on CET1 (%) 7.5 3.1 10.7 6.1 6.5
GM – Investor Relations | GM – Treasury | Europe | December 2017
These written materials and the information contained herein are not being issued and may not be distributed in the United States of America, Canada, Japan or Australia.
Cost development fully in line with plan
13
Highlights
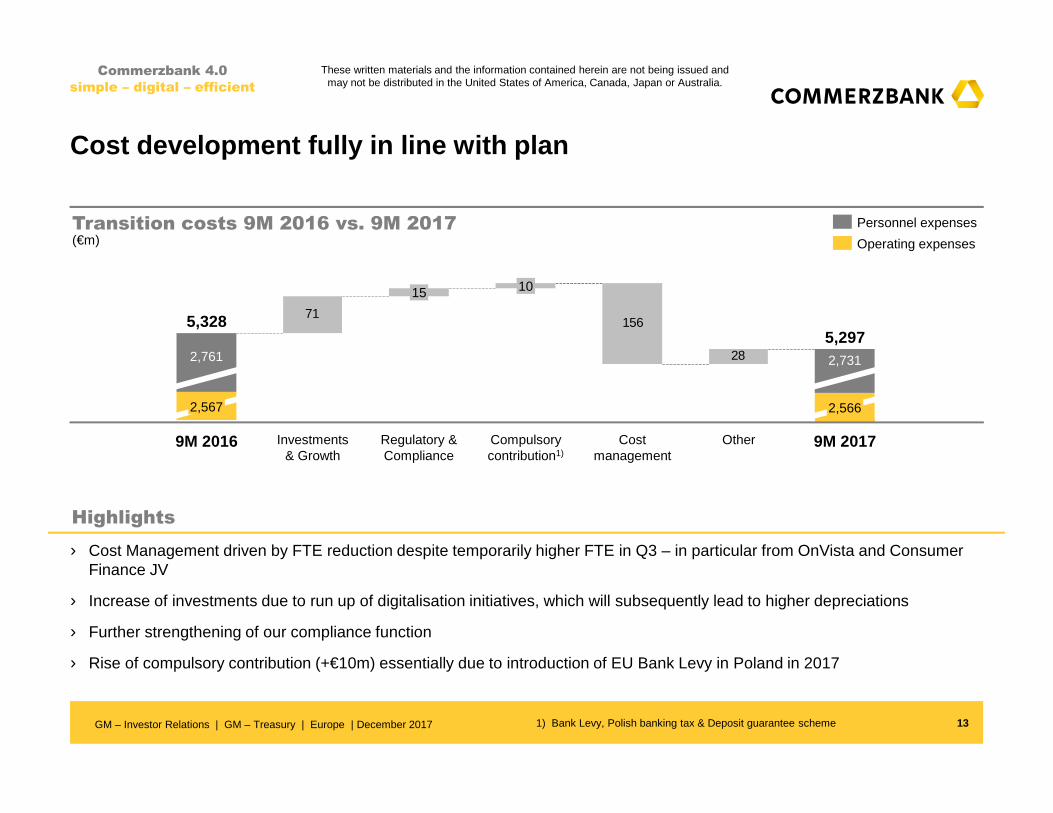
Transition costs 9M 2016 vs. 9M 2017(€m)
› Cost Management driven by FTE reduction despite temporarily higher FTE in Q3 – in particular from OnVista and Consumer Finance JV
› Increase of investments due to run up of digitalisation initiatives, which will subsequently lead to higher depreciations
› Further strengthening of our compliance function
› Rise of compulsory contribution (+€10m) essentially due to introduction of EU Bank Levy in Poland in 2017
Commerzbank 4.0
simple – digital – efficient
71156
28
9M 2017
5,297
2,566
2,731
OtherCost management
Compulsory contribution1)
10
Regulatory & Compliance
15
Investments & Growth
9M 2016
5,328
2,567
2,761
Operating expenses
Personnel expenses
1) Bank Levy, Polish banking tax & Deposit guarantee scheme GM – Investor Relations | GM – Treasury | Europe | December 2017
These written materials and the information contained herein are not being issued and may not be distributed in the United States of America, Canada, Japan or Australia.
Stable loan loss provisions in an overall benign credit en vironment
14
Highlights
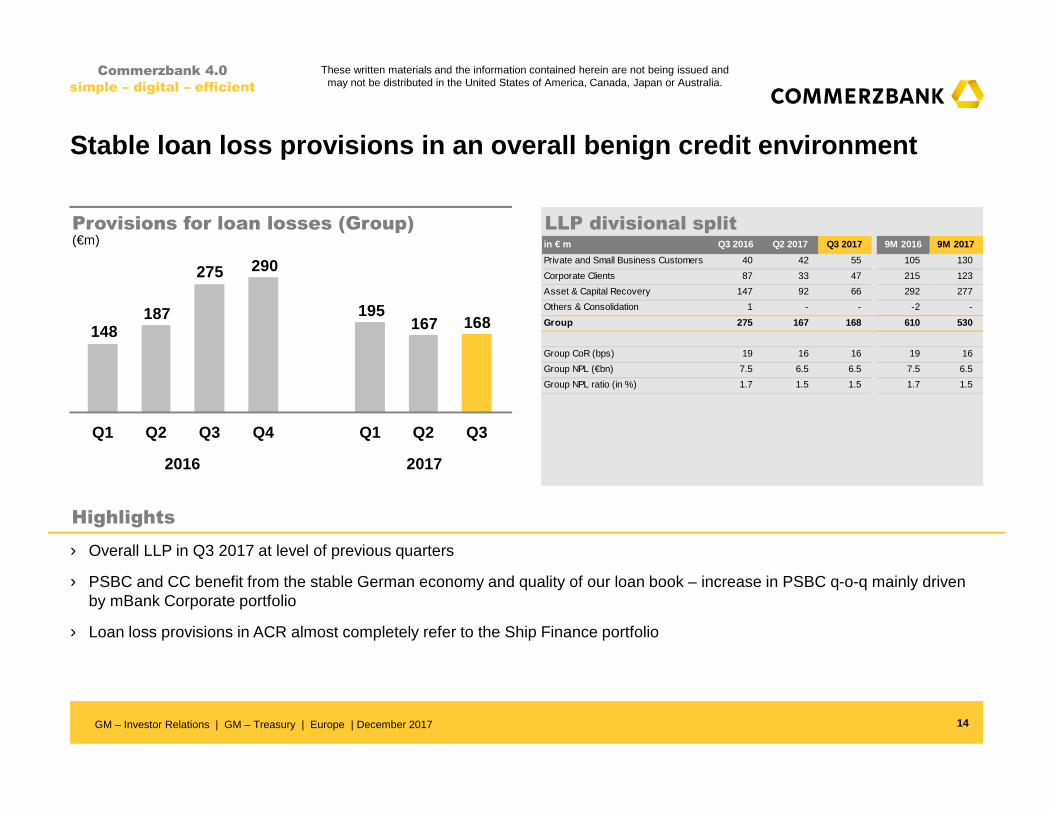
Provisions for loan losses (Group)(€m)
LLP divisional split
› Overall LLP in Q3 2017 at level of previous quarters
› PSBC and CC benefit from the stable German economy and quality of our loan book – increase in PSBC q-o-q mainly driven by mBank Corporate portfolio
› Loan loss provisions in ACR almost completely refer to the Ship Finance portfolio
168167195
290275
187148
Q3 Q3Q2Q1Q4Q2Q1
Commerzbank 4.0
simple – digital – efficient
2016 2017
in € m Q3 2016 Q2 2017 Q3 2017 9M 2016 9M 2017
Private and Small Business Customers 40 42 55 105 130
Corporate Clients 87 33 47 215 123
Asset & Capital Recovery 147 92 66 292 277
Others & Consolidation 1 - - -2 -
Group 275 167 168 610 530
Group CoR (bps) 19 16 16 19 16
Group NPL (€bn) 7.5 6.5 6.5 7.5 6.5
Group NPL ratio (in %) 1.7 1.5 1.5 1.7 1.5
GM – Investor Relations | GM – Treasury | Europe | December 2017
These written materials and the information contained herein are not being issued and may not be distributed in the United States of America, Canada, Japan or Australia.

Sound risk profile with NPL ratio of only 1.5%
15
Highlights
NPL in Group Cost of Risk2) in Group
› Cost of risk in the operating segments PSBC and CC on low levels of 11bp and 9bp
› Overall cost of risk reflects stable German economy and quality of our loan book
› Q3 2017 increase in PSBC by €0.1bn due to transfer of consumer loans
› NPL in ACR Ship Finance will come down with final closing of portfolio sales by year end 2017
6.97.1 6.5
YE 2016YE 2015 9M 2017
Commerzbank 4.0
simple – digital – efficient
(bp)(€bn)
1) NPL ratio = Default volume LaR loans / Exposure at Default 2) Cost of Risk = Loan Loss Provisions / Exposure at Default (annualised)
PSBC 12 9 11
CC 5 9 9
O&C 7 - -
ACR 192 380 258
PSBC 2.0 1.7 1.8
CC 2.9 3.4 2.8
O&C 0.1 0.0 0.0
ACR 2.2 1.8 1.9
NPL ratio1) Group 1.6% 1.6% 1.5%
Coverage ACR 45% 57% 45%
2116 16
9M 2017YE 2016YE 2015
GM – Investor Relations | GM – Treasury | Europe | December 2017
These written materials and the information contained herein are not being issued and may not be distributed in the United States of America, Canada, Japan or Australia.
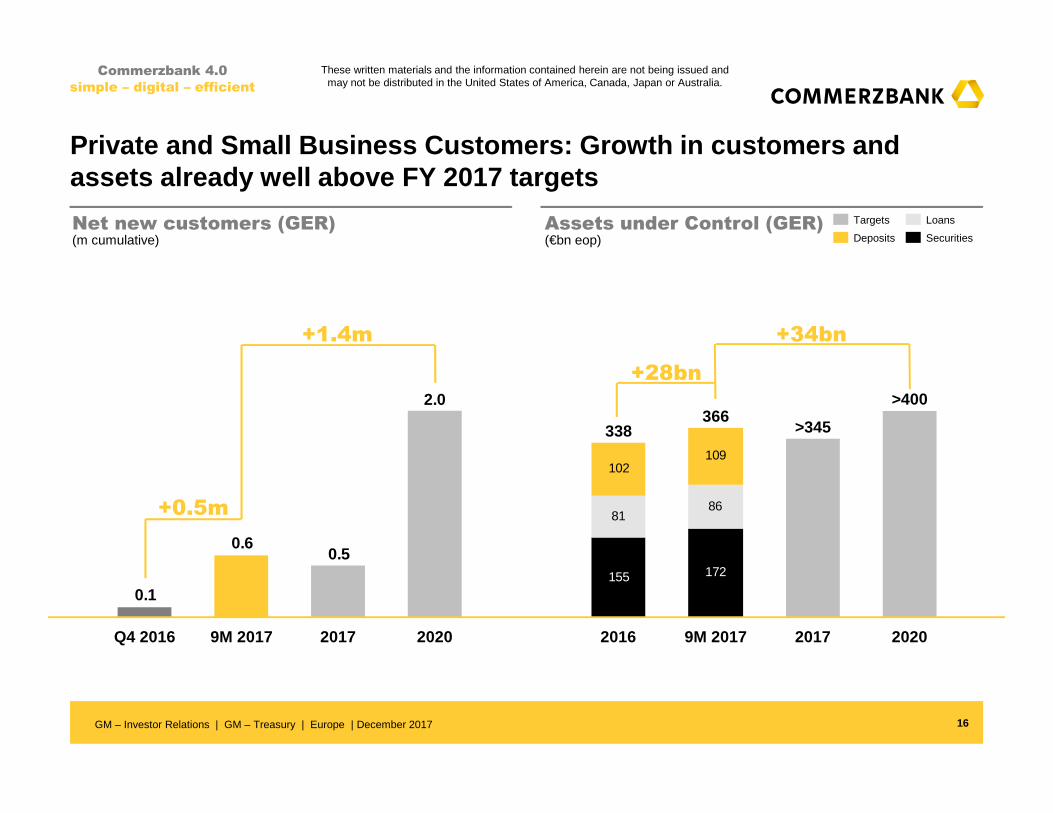
155 172
8186
102109
2020
>400
2017
>345
9M 2017
366
2016
338
Private and Small Business Customers: Growth in cust omers and assets already well above FY 2017 targets
16
Commerzbank 4.0
simple – digital – efficient
2.0
0.5
0.1
0.6
202020179M 2017Q4 2016
Net new customers (GER)(m cumulative)
Assets under Control (GER)
+1.4m
(€bn eop)
+34bn
Securities
Loans
Deposits
Targets
+0.5m
+28bn
GM – Investor Relations | GM – Treasury | Europe | December 2017
These written materials and the information contained herein are not being issued and may not be distributed in the United States of America, Canada, Japan or Australia.

Private and Small Business Customers: Overall stabl e businessperformance in Q3 supported by strong asset growth
17
Highlights
Operating result(€m)
Segmental P&L
› Slightly increased underlying revenues q-o-q – strong growth in assets under control of €9bn
› In seasonally slower Q3 further 65k net new customers in PSBC Germany
› Transfer of €3.5bn Consumer Loans from JV in mid-August, thus only half of Q3 contributed to revenues
› Y-o-Y underlying revenues from growth offset drag from negative rates and loan pricing pressure – higher incentives for customer acquisition and asset appraisal in Q3 2016 lead to lower revenues
381
142194
232273295277
Q2 Q4 Q2Q3 Q1 Q3Q1
Commerzbank 4.0
simple – digital – efficient
2016 2017
in € m Q3 2016 Q2 2017 Q3 2017 9M 2016 9M 2017
Revenues 1,216 1,111 1,363 3,643 3,642
o/w Private Customers 573 519 531 1,732 1,639
o/w Small Business Customers 199 189 198 592 588
o/w Commerz Real 109 65 52 219 164
o/w comdirect 82 94 91 255 275
o/w mBank 229 243 254 658 738
o/w exceptional revenue items 24 1 238 187 239
Revenues excl. exceptional items 1,192 1,110 1,125 3,456 3,403
LLP -40 -42 -55 -105 -130
Costs 903 927 927 2,693 2,795
Operating result 273 142 381 845 717
RWA fully phased in (end of period) 37.1 37.7 39 .2 37.1 39.2
CIR (%) 74.3 83.4 68.0 73.9 76.7
Ø Equity (€bn) 4.1 4.0 4.2 4.1 4.1
Operating return on equity (%) 26.6 14.1 36.0 27.2 23.4
GM – Investor Relations | GM – Treasury | Europe | December 2017
These written materials and the information contained herein are not being issued and may not be distributed in the United States of America, Canada, Japan or Australia.
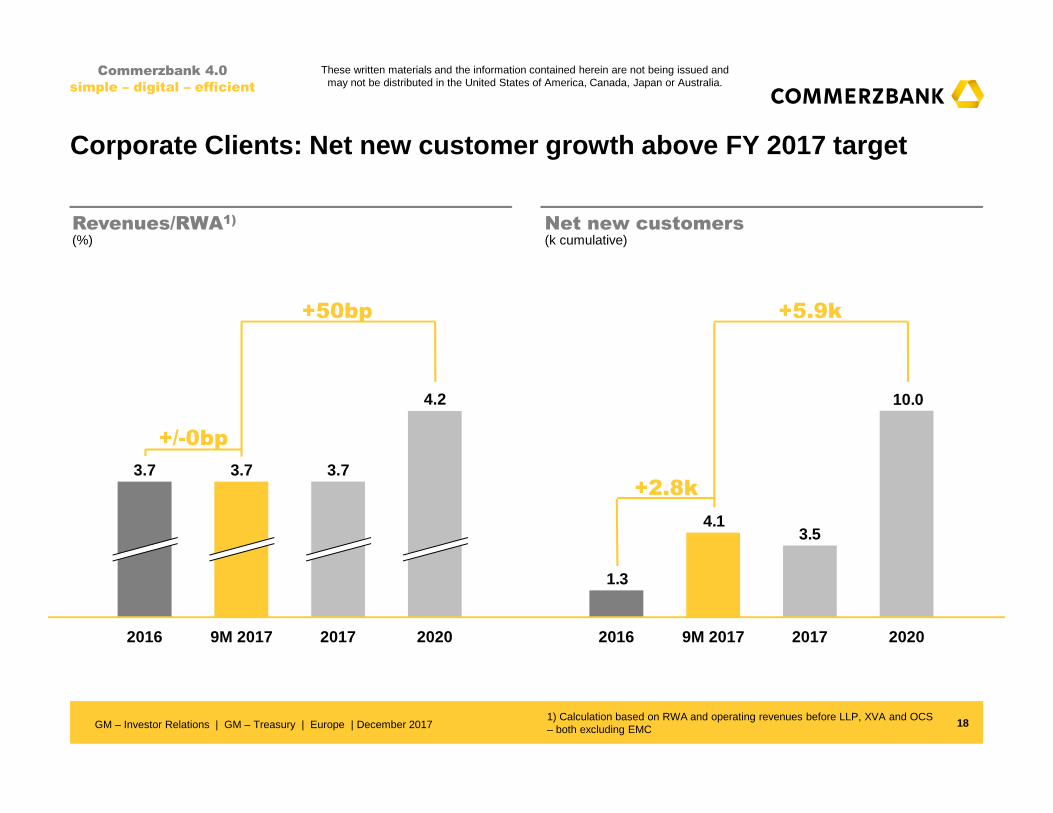
Corporate Clients: Net new customer growth above FY 2017 target
18
Commerzbank 4.0
simple – digital – efficient
Revenues/RWA1)
(%)Net new customers(k cumulative)
2020
4.2
2017
3.7
9M 20172016
3.7 3.7
+50bp
10.0
3.54.1
1.3
9M 20172016 20202017
+5.9k
1) Calculation based on RWA and operating revenues before LLP, XVA and OCS – both excluding EMC
+2.8k
+/-0bp
GM – Investor Relations | GM – Treasury | Europe | December 2017
These written materials and the information contained herein are not being issued and may not be distributed in the United States of America, Canada, Japan or Australia.
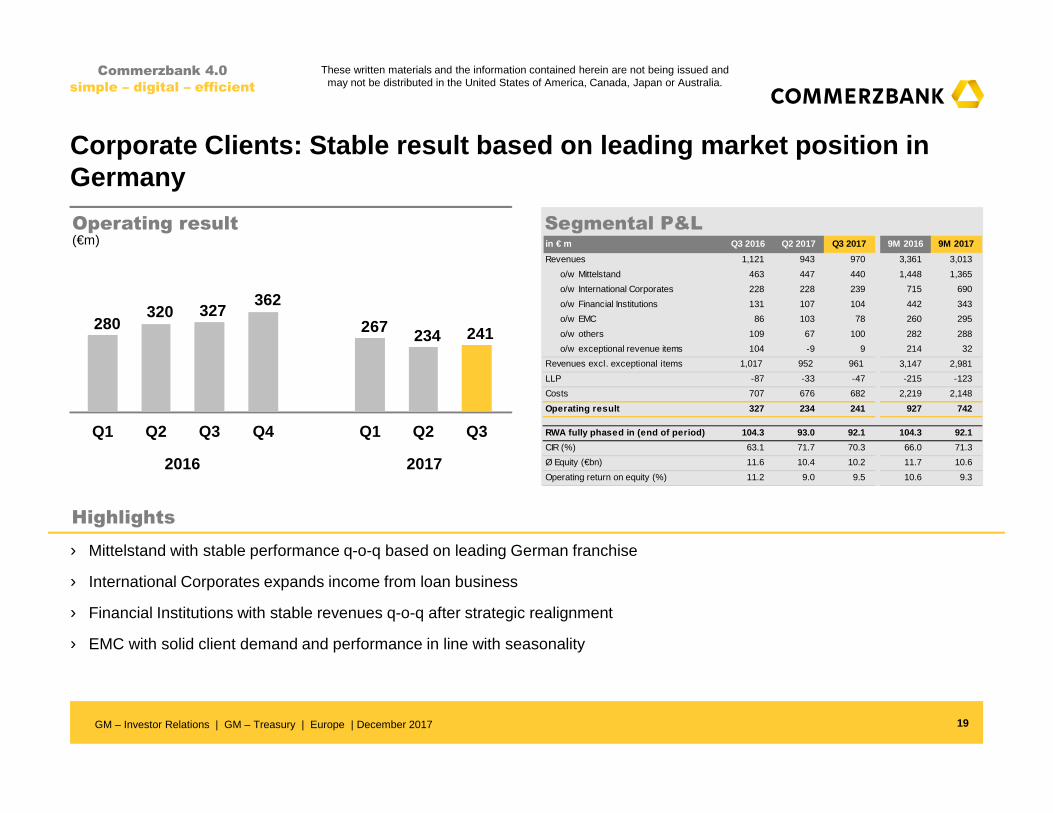
Corporate Clients: Stable result based on leading marke t position in Germany
19
Highlights
Operating result(€m)
Segmental P&L
› Mittelstand with stable performance q-o-q based on leading German franchise
› International Corporates expands income from loan business
› Financial Institutions with stable revenues q-o-q after strategic realignment
› EMC with solid client demand and performance in line with seasonality
241234267
362327320
280
Q2Q1Q4Q3Q2Q1 Q3
Commerzbank 4.0
simple – digital – efficient
2016 2017
in € m Q3 2016 Q2 2017 Q3 2017 9M 2016 9M 2017
Revenues 1,121 943 970 3,361 3,013
o/w Mittelstand 463 447 440 1,448 1,365
o/w International Corporates 228 228 239 715 690
o/w Financial Institutions 131 107 104 442 343
o/w EMC 86 103 78 260 295
o/w others 109 67 100 282 288
o/w exceptional revenue items 104 -9 9 214 32
Revenues excl. exceptional items 1,017 952 961 3,147 2,981
LLP -87 -33 -47 -215 -123
Costs 707 676 682 2,219 2,148
Operating result 327 234 241 927 742
RWA fully phased in (end of period) 104.3 93.0 9 2.1 104.3 92.1
CIR (%) 63.1 71.7 70.3 66.0 71.3
Ø Equity (€bn) 11.6 10.4 10.2 11.7 10.6
Operating return on equity (%) 11.2 9.0 9.5 10.6 9.3
GM – Investor Relations | GM – Treasury | Europe | December 2017
These written materials and the information contained herein are not being issued and may not be distributed in the United States of America, Canada, Japan or Australia.

9695 9196
Sep-17Jun-17
103100
126125
Jun-17 Sep-17
20
Highlights
PSBC Corporate Clients
Commerzbank 4.0
simple – digital – efficient
(€bn)(€bn) Deposit volume
Loan volume
Deposit volume
Loan volume
› 3% continued loan growth in Private and Small Business Customers over the last 3 months (+7% in 9M 2017) mainly driven by strong mortgage business in Germany
› Corporate Clients with overall stable development – net loan growth of €1bn
› Successful reduction of deposits of €5bn in Corporate Clients leads to LTD ratio >100%
Strong loan growth in Private and Small Business Cu stomers – active deposit management in Corporate Clients
GM – Investor Relations | GM – Treasury | Europe | December 2017
These written materials and the information contained herein are not being issued and may not be distributed in the United States of America, Canada, Japan or Australia.

-100-82
-33
-156
-108-132
-119
Q2Q1Q4Q3Q2Q1 Q3
Asset & Capital Recovery: Strong delivery – year-end 2017 Ship Finance target of ~€3bn confirmed
21
Highlights
Operating result(€m)
Segmental P&L
› Continued portfolio run-down in all sub-segments – in Q3 2017 Ship Finance exposure reduced by €0.6bn to €3.3bn, supported by value-preserving portfolio sales
› With 34% reduction over the last 12 months fully on track to reach year-end Ship Finance portfolio target of ~€3bn
› Lower revenues compared to Q2 2017 due to portfolio sales and in line with smaller portfolio size
Commerzbank 4.0
simple – digital – efficient
2016 2017
in € m Q3 2016 Q2 2017 Q3 2017 9M 2016 9M 2017
Revenues 72 38 -12 30 141
Revenues excl. exceptional items -25 21 -29 -69 16
LLP -147 -92 -66 -292 -277
Costs 33 28 22 97 79
Operating result -108 -82 -100 -359 -215
RWA fully phased in (end of period) 21.5 20.1 19 .1 21.5 19.1
Ø Equity (€bn) 3.3 3.2 2.9 3.4 3.1
CRE (EaD in €bn) 2.7 1.9 1.7 2.7 1.7
Ship Finance (EaD in €bn) 5.0 3.9 3.3 5.0 3.3
Public Finance (EaD in €bn) 9.5 9.5 9.3 9.5 9.3
GM – Investor Relations | GM – Treasury | Europe | December 2017
These written materials and the information contained herein are not being issued and may not be distributed in the United States of America, Canada, Japan or Australia.

RWA with reduction of €2bn in Q3 2017
22
Highlights
RWA (B3 fully phased-in) development by RWA classification(€bn eop)
› Credit Risk RWA driven by growth in business segments but more than offset by declining market values, FX effects and targeted reduction of sub portfolios – mainly Ship Finance
› Market Risk RWA decreased by €2bn q-o-q in markets with low volatility
› Increase of OpRisk RWA by €2bn q-o-q mainly due to new and increased loss events in external database
Commerzbank 4.0
simple – digital – efficient
154 155 150 146 145 141 139
24 24 24 22
19 21 20 202321
22
-2bn
Q3
177
Q2
17817
Q1
186
Q4
190
Q3
195
Q2
198
Q1
19518
15
2016 2017
Credit Risk
Operational Risk
Market Risk
Note: Numbers may not add up due to roundingGM – Investor Relations | GM – Treasury | Europe | December 2017
These written materials and the information contained herein are not being issued and may not be distributed in the United States of America, Canada, Japan or Australia.
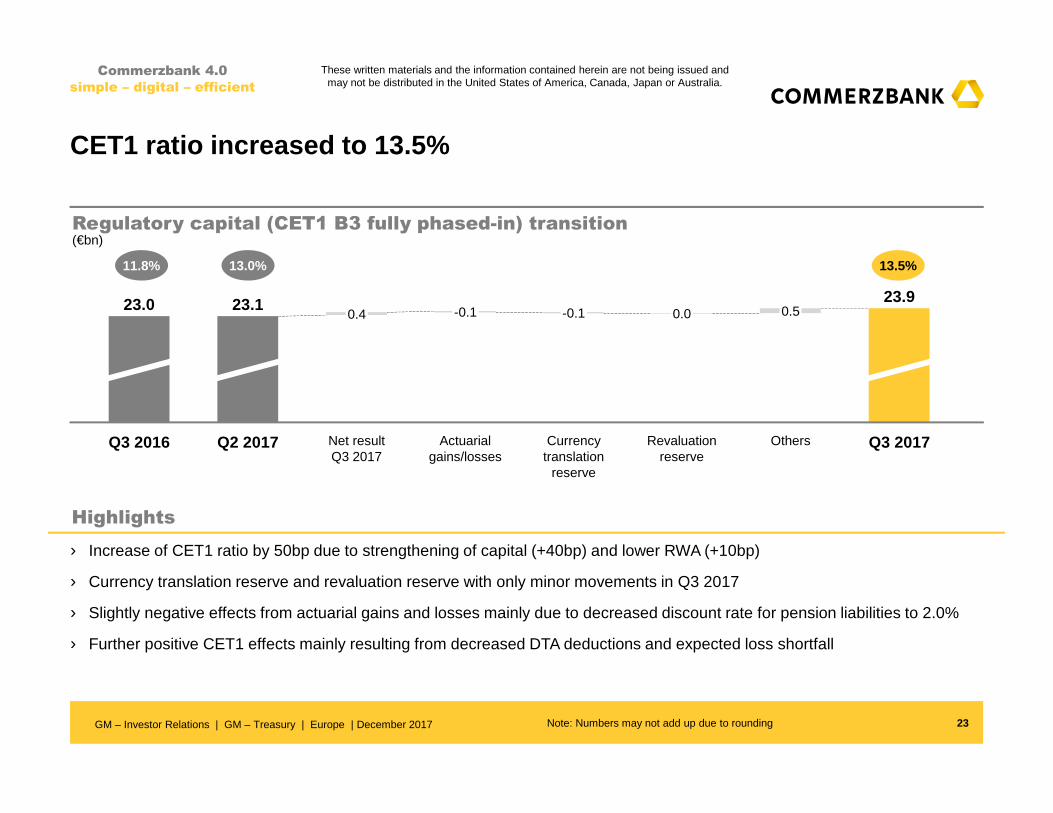
Q3 2017
23.9
Others
0.5
Revaluation reserve
0.0
Currency translation
reserve
-0.1
Actuarial gains/losses
-0.1
Net result Q3 2017
0.4
Q2 2017
23.1
Q3 2016
23.0
CET1 ratio increased to 13.5%
23
Highlights
Regulatory capital (CET1 B3 fully phased-in) transition(€bn)
› Increase of CET1 ratio by 50bp due to strengthening of capital (+40bp) and lower RWA (+10bp)
› Currency translation reserve and revaluation reserve with only minor movements in Q3 2017
› Slightly negative effects from actuarial gains and losses mainly due to decreased discount rate for pension liabilities to 2.0%
› Further positive CET1 effects mainly resulting from decreased DTA deductions and expected loss shortfall
Commerzbank 4.0
simple – digital – efficient
Note: Numbers may not add up due to rounding
13.5%13.0%11.8%
GM – Investor Relations | GM – Treasury | Europe | December 2017
These written materials and the information contained herein are not being issued and may not be distributed in the United States of America, Canada, Japan or Australia.
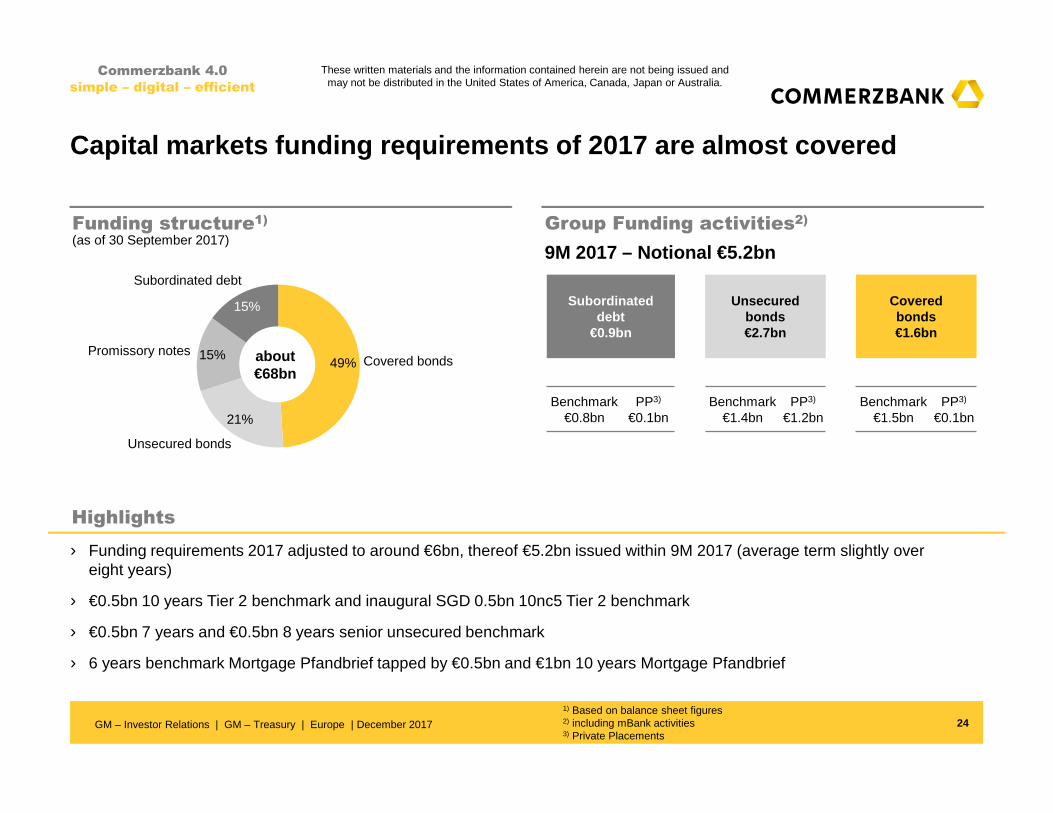
24
Highlights
Funding structure1)
› Funding requirements 2017 adjusted to around €6bn, thereof €5.2bn issued within 9M 2017 (average term slightly over eight years)
› €0.5bn 10 years Tier 2 benchmark and inaugural SGD 0.5bn 10nc5 Tier 2 benchmark
› €0.5bn 7 years and €0.5bn 8 years senior unsecured benchmark
› 6 years benchmark Mortgage Pfandbrief tapped by €0.5bn and €1bn 10 years Mortgage Pfandbrief
Group Funding activities2)
9M 2017 – Notional €5.2bn
Promissory notes 15%
15%
Unsecured bonds
21%
Covered bonds49%
Subordinated debt
about€68bn
(as of 30 September 2017)
Commerzbank 4.0
simple – digital – efficient
Subordinated debt
€0.9bn
Unsecured bonds€2.7bn
Covered bonds€1.6bn
Benchmark€0.8bn
PP3)
€0.1bnBenchmark
€1.4bnPP3)
€1.2bnBenchmark
€1.5bnPP3)
€0.1bn
Capital markets funding requirements of 2017 are almost c overed
1) Based on balance sheet figures2) including mBank activities3) Private Placements
GM – Investor Relations | GM – Treasury | Europe | December 2017
These written materials and the information contained herein are not being issued and may not be distributed in the United States of America, Canada, Japan or Australia.
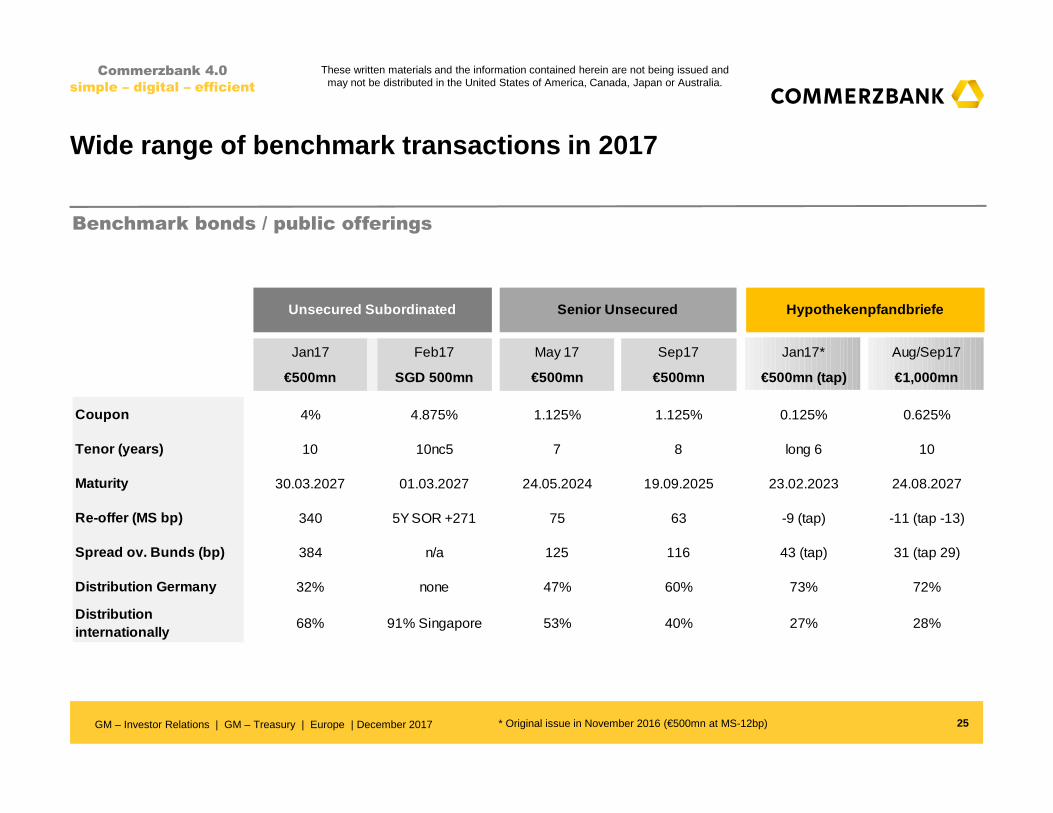
Wide range of benchmark transactions in 2017
* Original issue in November 2016 (€500mn at MS-12bp)
Jan17 Feb17 May 17 Sep17 Jan17* Aug/Sep17
€500mn SGD 500mn €500mn €500mn €500mn (tap) €1,000mn
Coupon 4% 4.875% 1.125% 1.125% 0.125% 0.625%
Tenor (years) 10 10nc5 7 8 long 6 10
Maturity 30.03.2027 01.03.2027 24.05.2024 19.09.2025 23.02.2023 24.08.2027
Re-offer (MS bp) 340 5Y SOR +271 75 63 -9 (tap) -11 (tap -13)
Spread ov. Bunds (bp) 384 n/a 125 116 43 (tap) 31 (tap 29)
Distribution Germany 32% none 47% 60% 73% 72%
Distribution internationally
68% 91% Singapore 53% 40% 27% 28%
HypothekenpfandbriefeUnsecured Subordinated Senior Unsecured
Commerzbank 4.0
simple – digital – efficient
GM – Investor Relations | GM – Treasury | Europe | December 2017
Benchmark bonds / public offerings
25
These written materials and the information contained herein are not being issued and may not be distributed in the United States of America, Canada, Japan or Australia.

Balanced capital markets maturity profile
Source: balance sheet figures as of 30.09.2017* Unsecured bonds and promissory notes
› Outstanding capital markets volume about €68bn as of September 30th
› Well balanced profile of funding products
› Manageable maturity profile of all instruments
Total outstanding Maturities(€bn) (€bn)
Highlights
Commerzbank 4.0
simple – digital – efficient
GM – Investor Relations | GM – Treasury | Europe | December 2017 26
These written materials and the information contained herein are not being issued and may not be distributed in the United States of America, Canada, Japan or Australia.

27
Commerzbank 4.0
simple – digital – efficient
GM – Investor Relations | GM – Treasury | Europe | December 20171) Additional Tier 1 covers capital deductions2) Reflecting linear amortisation according to CRR Article 64 and capital deductions
Strong total capital position – Tier 2 layer above 3%
YE 2017Q3 2017
5.7
YE 2018 YE 2019 YE 2020
› Capital efficiency via replacement of amortizing Tier 2 instruments.
› New supply will be limited and manageable aiming to maintain or slightly increase Tier 2 layer
› Broader market access includes US market and niche markets
Total Capital1)
Highlights
17.8%
Q3 2017
14.4%
(25.4bn)
3.2%
(5.7bn)
CET1(phase-in)
Tier 2(phase-in)
(0.4bn)AT1
(phase-in)0.2%
Tier 2 roll-off profile2)
(€bn)
These written materials and the information contained herein are not being issued and may not be distributed in the United States of America, Canada, Japan or Australia.
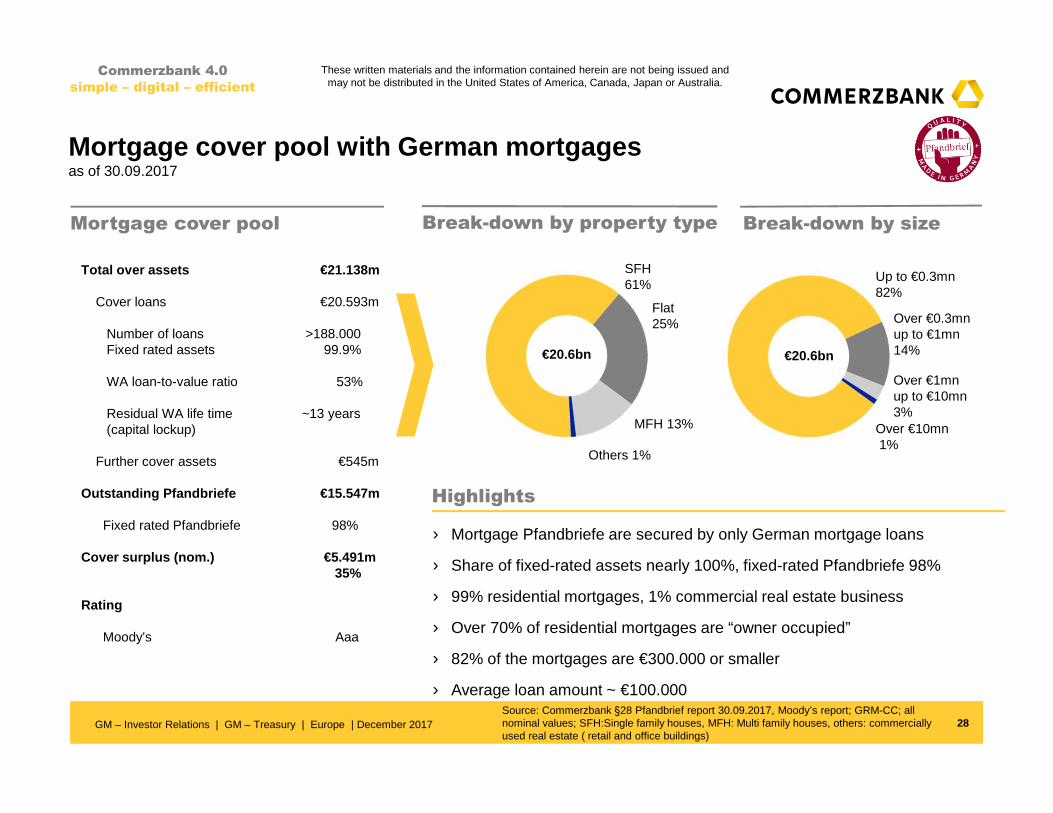
Mortgage cover pool with German mortgagesas of 30.09.2017
Break-down by sizeBreak-down by property type
Others 1%
Flat 25%
MFH 13%
SFH61%
10-20%
€20.6bn
Up to €0.3mn 82%
Over €0.3mnup to €1mn 14%
Over €1mnup to €10mn3%
Over €10mn1%
› Mortgage Pfandbriefe are secured by only German mortgage loans
› Share of fixed-rated assets nearly 100%, fixed-rated Pfandbriefe 98%
› 99% residential mortgages, 1% commercial real estate business
› Over 70% of residential mortgages are “owner occupied”
› 82% of the mortgages are €300.000 or smaller
› Average loan amount ~ €100.000
€20.6bn
Source: Commerzbank §28 Pfandbrief report 30.09.2017, Moody’s report; GRM-CC; all nominal values; SFH:Single family houses, MFH: Multi family houses, others: commercially used real estate ( retail and office buildings)
Mortgage cover pool
Total over assets €21.138m
Cover loans €20.593m
Number of loans >188.000Fixed rated assets 99.9%
WA loan-to-value ratio 53%
Residual WA life time ~13 years(capital lockup)
Further cover assets €545m
Outstanding Pfandbriefe €15.547m
Fixed rated Pfandbriefe 98%
Cover surplus (nom.) €5.491m35%
Rating
Moody’s Aaa
28
Highlights
GM – Investor Relations | GM – Treasury | Europe | December 2017
Commerzbank 4.0
simple – digital – efficient
These written materials and the information contained herein are not being issued and may not be distributed in the United States of America, Canada, Japan or Australia.

Portfolio break down public sector cover poolas of 30.09.2017
Break-down by borrower / guarantor country
10-20%
Germany 50% €11.1bn
Italy 9%
Switzerland 10%
Austria 6%
US 4%
France 4%
Spain 3%
UK 3%
Others 11%
Source: Commerzbank §28 Pfandbrief report 30.09.2017, Moody’s report; GRM-CC; all nominal values
› Public sector cover pool is dominated by legacy public sector assets of former Hypothekenbank Frankfurt AG
› 2% ECA (Euler Hermes) guaranteed loans.
Public sector cover pool
Total cover assets €11. 389m
Cover loans in €11.130m
Number of loans 264
Fixed rated assets 76%
Residual WA life time ~9 years
Further cover assets in €259m
Outstanding Pfandbriefe in €10.214m
Fixed rated Pfandbriefe 84%
Cover surplus (nom.) €1.174m12%
Rating
Moody’s Aaa
29
Highlights
GM – Investor Relations | GM – Treasury | Europe | December 2017
Commerzbank 4.0
simple – digital – efficient
These written materials and the information contained herein are not being issued and may not be distributed in the United States of America, Canada, Japan or Australia.
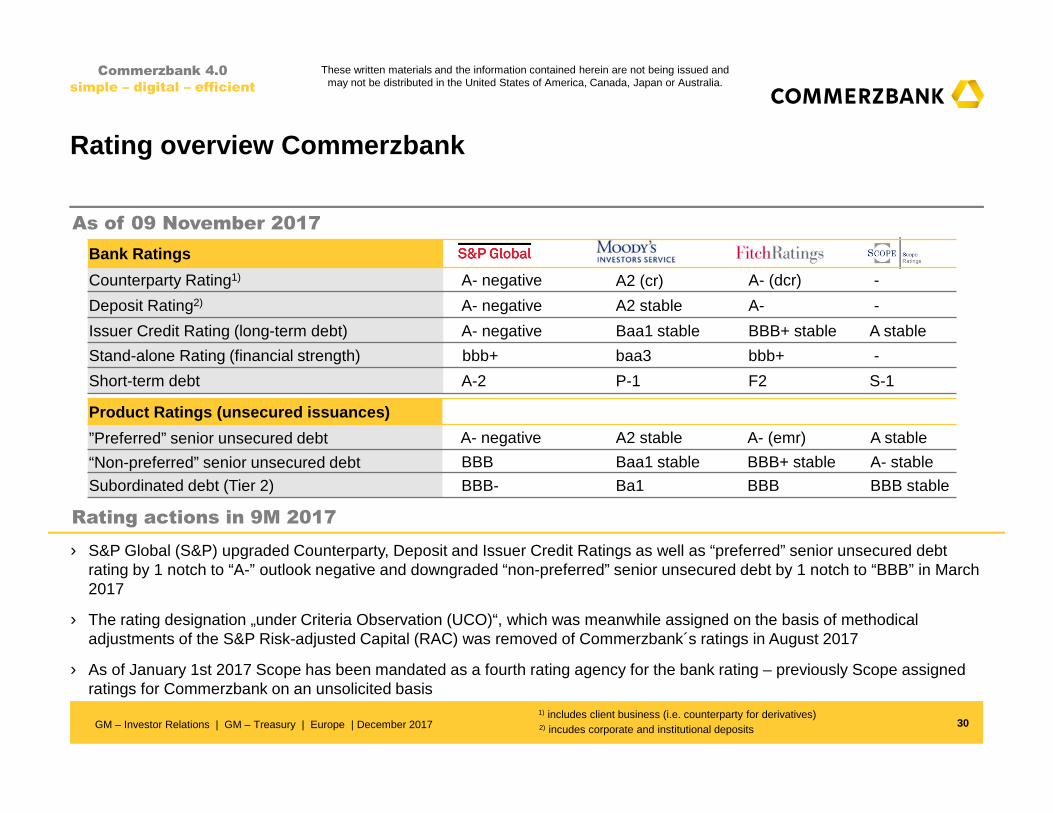
Rating overview Commerzbank
30
Rating actions in 9M 2017
› S&P Global (S&P) upgraded Counterparty, Deposit and Issuer Credit Ratings as well as “preferred” senior unsecured debt rating by 1 notch to “A-” outlook negative and downgraded “non-preferred” senior unsecured debt by 1 notch to “BBB” in March 2017
› The rating designation „under Criteria Observation (UCO)“, which was meanwhile assigned on the basis of methodical adjustments of the S&P Risk-adjusted Capital (RAC) was removed of Commerzbank´s ratings in August 2017
› As of January 1st 2017 Scope has been mandated as a fourth rating agency for the bank rating – previously Scope assigned ratings for Commerzbank on an unsolicited basis
As of 09 November 2017
Commerzbank 4.0
simple – digital – efficient
Bank Ratings
Counterparty Rating1) A- negative A2 (cr) A- (dcr) -
Deposit Rating2) A- negative A2 stable A- -
Issuer Credit Rating (long-term debt) A- negative Baa1 stable BBB+ stable A stable
Stand-alone Rating (financial strength) bbb+ baa3 bbb+ -
Short-term debt A-2 P-1 F2 S-1
Product Ratings (unsecured issuances)
”Preferred” senior unsecured debt A- negative A2 stable A- (emr) A stable
“Non-preferred” senior unsecured debt BBB Baa1 stable BBB+ stable A- stable
Subordinated debt (Tier 2) BBB- Ba1 BBB BBB stable
1) includes client business (i.e. counterparty for derivatives) 2) incudes corporate and institutional depositsGM – Investor Relations | GM – Treasury | Europe | December 2017
These written materials and the information contained herein are not being issued and may not be distributed in the United States of America, Canada, Japan or Australia.

Objectives and expectations for 2017
FY 2017
31
Commerzbank 4.0
simple – digital – efficient
We expect our cost base to be below €7.1bn
We aim for a CET1 ratio of at least 12.5% including IFRS 9 impact effective Jan 1st 2018
We expect LLPs at ~€800m – including ACR with ~€400m
We will further strengthen our market position and focus on the execution of Commerzbank 4.0
We expect a slightly positive net result for the financial year 2017
GM – Investor Relations | GM – Treasury | Europe | December 2017
These written materials and the information contained herein are not being issued and may not be distributed in the United States of America, Canada, Japan or Australia.
Commerzbank 4.0
simple – digital – efficient
32GM – Investor Relations | GM – Treasury | Europe | December 2017
These written materials and the information contained herein are not being issued and may not be distributed in the United States of America, Canada, Japan or Australia.

Appendix
33
Commerzbank Group
P&L Tables
Other Information
Major pillars of PSBC 37
New customer earnings 38
New customer growth potential 39
Major pillars of Corporate Clients 40
Corporate Clients: Leverage strong position 41
Commerzbank financials at a glance 42
Scenario: NII sensitivity 43
Commerzbank Group 47
Private and Small Business Customers 48
Corporate Clients 49
Asset & Capital Recovery 50
Others & Consolidation 51
mBank 52
German economy 34
German insolvency hierarchy 35
Art. 72b of Draft CRR II 36
Shipping market 44
ACR Ship Finance portfolio 45
Residential mortgage business 46
Commerzbank 4.0
simple – digital – efficient
GM – Investor Relations | GM – Treasury | Europe | December 2017
These written materials and the information contained herein are not being issued and may not be distributed in the United States of America, Canada, Japan or Australia.
German economy 2017 – ongoing moderate growth ahead
34
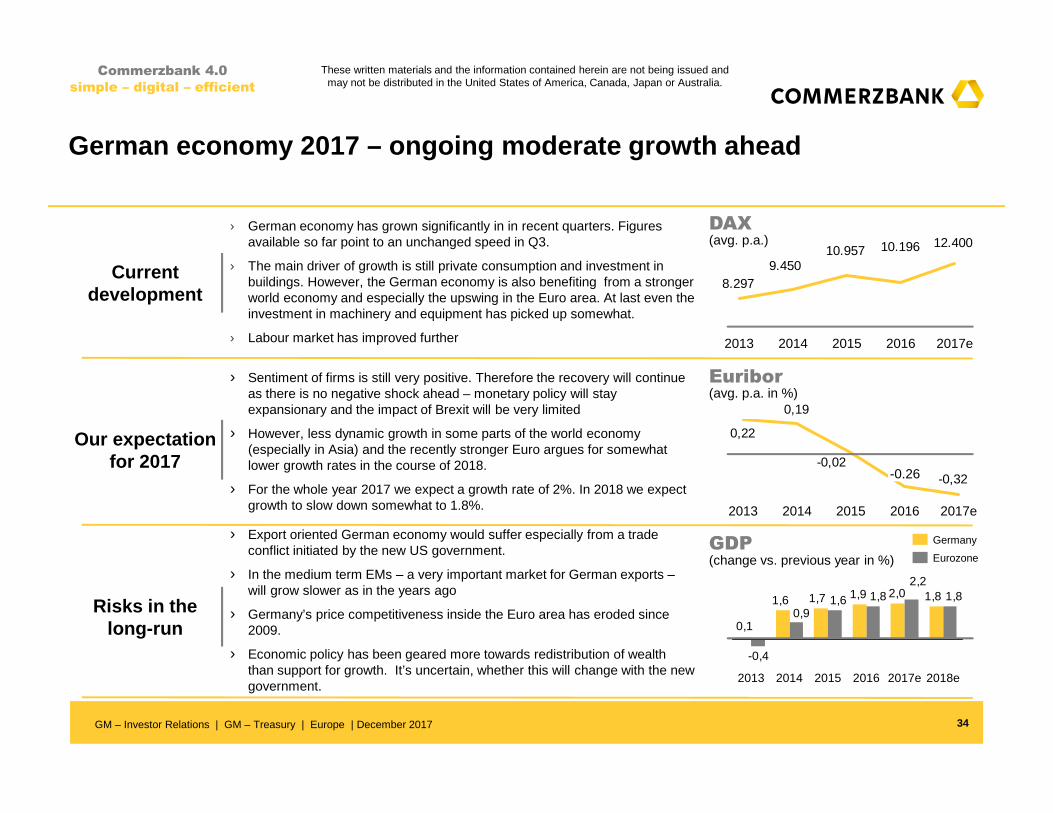
› German economy has grown significantly in in recent quarters. Figures available so far point to an unchanged speed in Q3.
› The main driver of growth is still private consumption and investment in buildings. However, the German economy is also benefiting from a stronger world economy and especially the upswing in the Euro area. At last even the investment in machinery and equipment has picked up somewhat.
› Labour market has improved further
Current development
› Sentiment of firms is still very positive. Therefore the recovery will continue as there is no negative shock ahead – monetary policy will stay expansionary and the impact of Brexit will be very limited
› However, less dynamic growth in some parts of the world economy (especially in Asia) and the recently stronger Euro argues for somewhat lower growth rates in the course of 2018.
› For the whole year 2017 we expect a growth rate of 2%. In 2018 we expect growth to slow down somewhat to 1.8%.
Our expectation for 2017
› Export oriented German economy would suffer especially from a trade conflict initiated by the new US government.
› In the medium term EMs – a very important market for German exports –will grow slower as in the years ago
› Germany’s price competitiveness inside the Euro area has eroded since 2009.
› Economic policy has been geared more towards redistribution of wealth than support for growth. It’s uncertain, whether this will change with the new government.
Risks in the long-run
DAX(avg. p.a.)
Euribor(avg. p.a. in %)
GDP(change vs. previous year in %)
12.40010.19610.9579.450
8.297
2014 2017e2013 20162015
-0,32 -0,02
0,19
0,22
2013 2014 2015 2016 2017e
-0.26
1,82,01,91,71,6
0,1
1,82,2
1,81,60,9
-0,4
2014 2015 2017e2016 2018e2013
Germany
Eurozone
Commerzbank 4.0
simple – digital – efficient
GM – Investor Relations | GM – Treasury | Europe | December 2017
These written materials and the information contained herein are not being issued and may not be distributed in the United States of America, Canada, Japan or Australia.
35
Commerzbank 4.0
simple – digital – efficient
German insolvency law protects depositors and opera tional liabilities
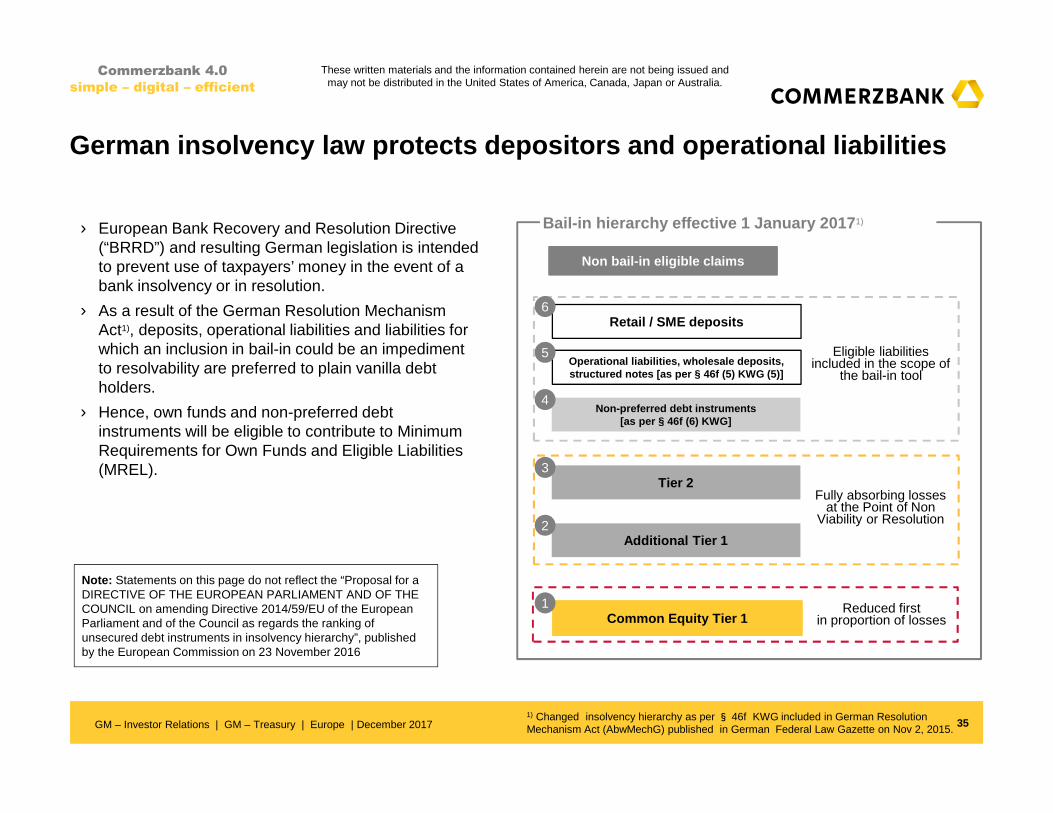
› European Bank Recovery and Resolution Directive (“BRRD”) and resulting German legislation is intended to prevent use of taxpayers’ money in the event of a bank insolvency or in resolution.
› As a result of the German Resolution Mechanism Act1), deposits, operational liabilities and liabilities for which an inclusion in bail-in could be an impediment to resolvability are preferred to plain vanilla debt holders.
› Hence, own funds and non-preferred debt instruments will be eligible to contribute to Minimum Requirements for Own Funds and Eligible Liabilities (MREL).
Bail-in hierarchy effective 1 January 20171)
Common Equity Tier 1
Additional Tier 12
Tier 23
Non-preferred debt instruments [as per § 46f (6) KWG]
4
Operational liabilities, wholesale deposits, structured notes [as per § 46f (5) KWG (5)]
5
Non bail-in eligible claims
Eligible liabilities included in the scope of
the bail-in tool
Fully absorbing losses at the Point of Non
Viability or Resolution
Reduced first in proportion of losses
Retail / SME deposits6
1) Changed insolvency hierarchy as per § 46f KWG included in German Resolution Mechanism Act (AbwMechG) published in German Federal Law Gazette on Nov 2, 2015.
1
Note: Statements on this page do not reflect the “Proposal for a DIRECTIVE OF THE EUROPEAN PARLIAMENT AND OF THE COUNCIL on amending Directive 2014/59/EU of the European Parliament and of the Council as regards the ranking of unsecured debt instruments in insolvency hierarchy”, published by the European Commission on 23 November 2016
GM – Investor Relations | GM – Treasury | Europe | December 2017
These written materials and the information contained herein are not being issued and may not be distributed in the United States of America, Canada, Japan or Australia.
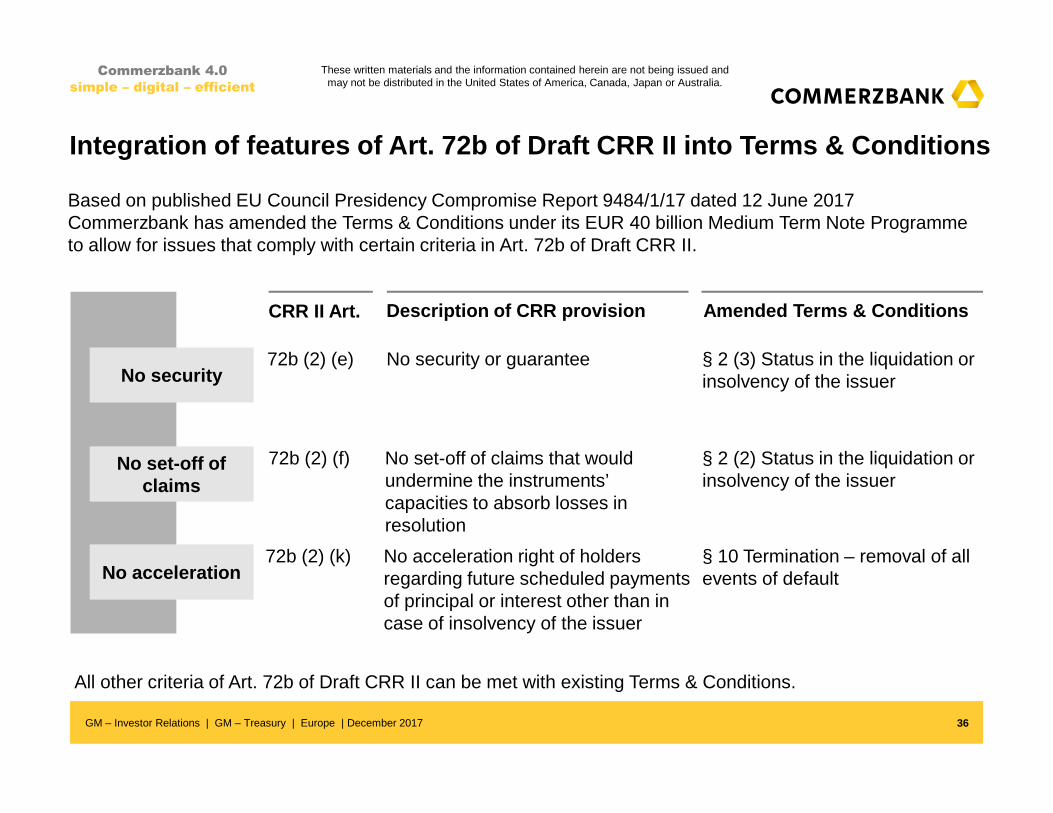
Integration of features of Art. 72b of Draft CRR II into Terms & Conditions
No security or guaranteeNo security
§ 2 (3) Status in the liquidation or insolvency of the issuer
No set-off of claims that would undermine the instruments’ capacities to absorb losses in resolution
No set-off of claims
§ 2 (2) Status in the liquidation or insolvency of the issuer
No acceleration right of holders regarding future scheduled payments of principal or interest other than in case of insolvency of the issuer
No acceleration§ 10 Termination – removal of all events of default
Description of CRR provision Amended Terms & Conditi ons
Based on published EU Council Presidency Compromise Report 9484/1/17 dated 12 June 2017 Commerzbank has amended the Terms & Conditions under its EUR 40 billion Medium Term Note Programmeto allow for issues that comply with certain criteria in Art. 72b of Draft CRR II.
All other criteria of Art. 72b of Draft CRR II can be met with existing Terms & Conditions.
72b (2) (e)
CRR II Art.
72b (2) (f)
72b (2) (k)
36
These written materials and the information contained herein are not being issued and may not be distributed in the United States of America, Canada, Japan or Australia.
Commerzbank 4.0
simple – digital – efficient
GM – Investor Relations | GM – Treasury | Europe | December 2017
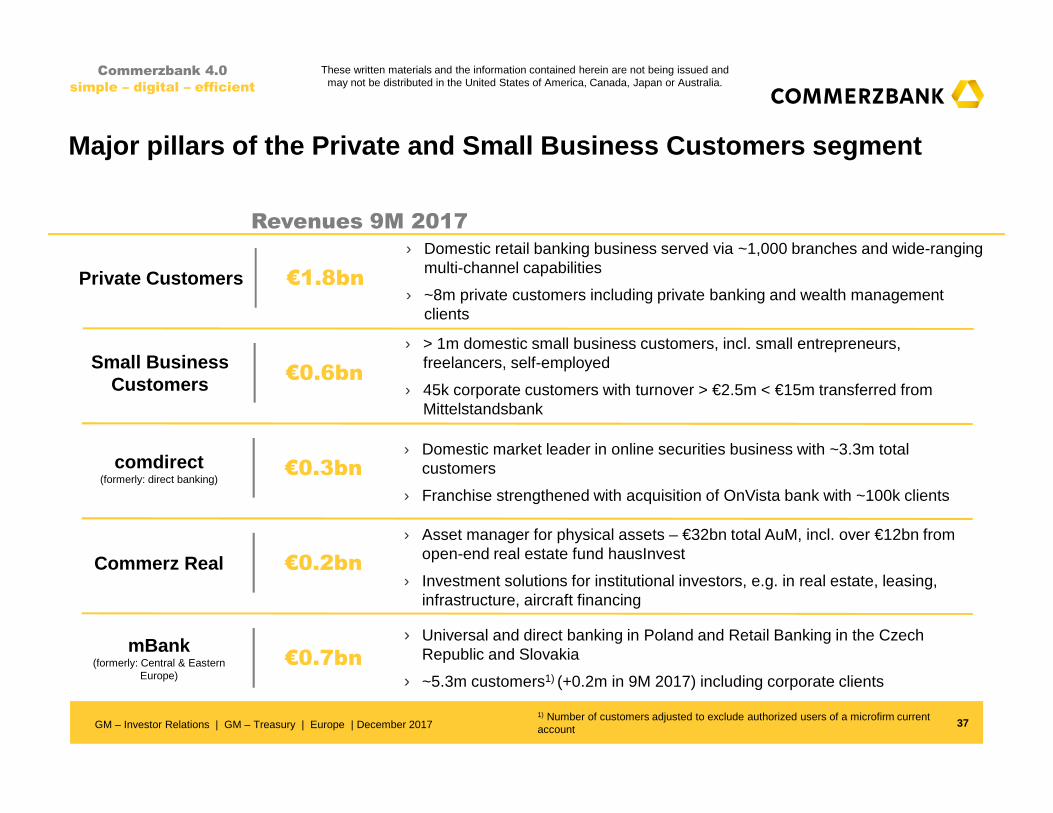
Major pillars of the Private and Small Business Custome rs segment
Revenues 9M 2017
› Domestic retail banking business served via ~1,000 branches and wide-ranging multi-channel capabilities
› ~8m private customers including private banking and wealth management clients
Private Customers €1.8bn
37
› > 1m domestic small business customers, incl. small entrepreneurs, freelancers, self-employed
› 45k corporate customers with turnover > €2.5m < €15m transferred from Mittelstandsbank
Small Business Customers €0.6bn
› Domestic market leader in online securities business with ~3.3m total customers
› Franchise strengthened with acquisition of OnVista bank with ~100k clients
comdirect(formerly: direct banking)
€0.3bn
› Asset manager for physical assets – €32bn total AuM, incl. over €12bn from open-end real estate fund hausInvest
› Investment solutions for institutional investors, e.g. in real estate, leasing, infrastructure, aircraft financing
Commerz Real €0.2bn
› Universal and direct banking in Poland and Retail Banking in the Czech Republic and Slovakia
› ~5.3m customers1) (+0.2m in 9M 2017) including corporate clients
mBank(formerly: Central & Eastern
Europe)€0.7bn
Commerzbank 4.0
simple – digital – efficient
1) Number of customers adjusted to exclude authorized users of a microfirm current accountGM – Investor Relations | GM – Treasury | Europe | December 2017
These written materials and the information contained herein are not being issued and may not be distributed in the United States of America, Canada, Japan or Australia.
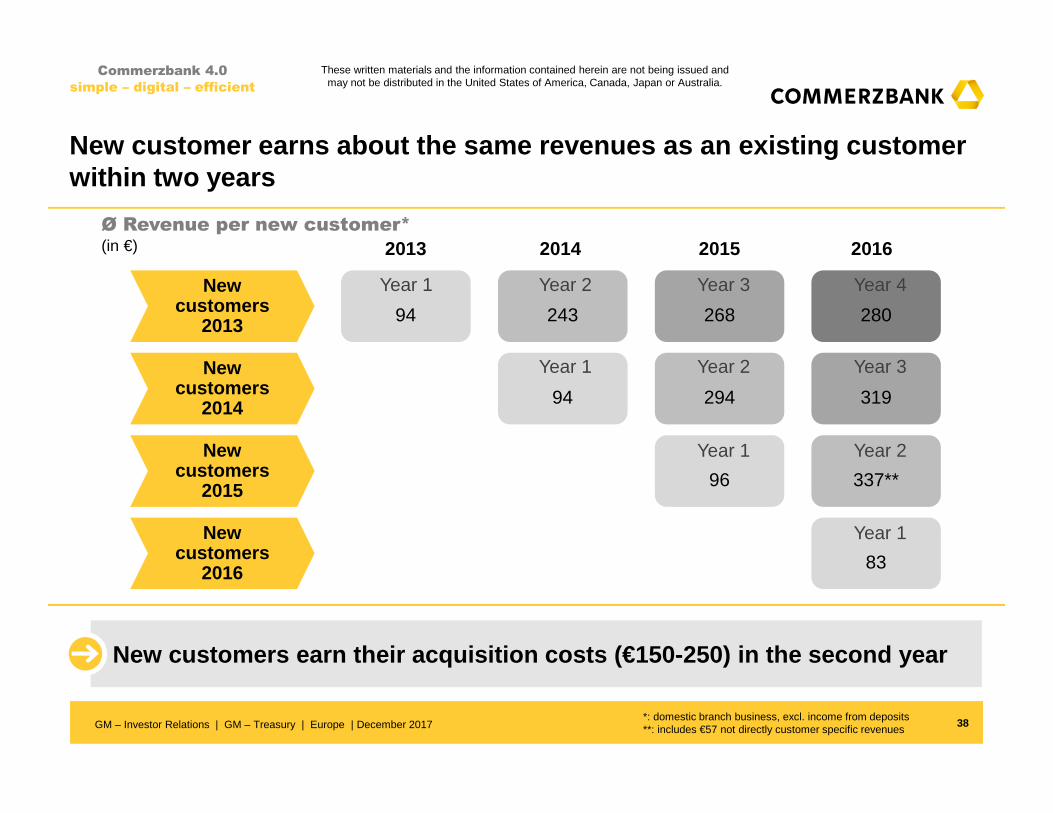
New customer earns about the same revenues as an ex isting customer within two years
New customers
2013
New customers
2014
New customers
2015
Ø Revenue per new customer* (in €)
94 243 268
94 294
96
2013 2014 2015
Year 1 Year 2 Year 3
Year 1 Year 2
Year 1
38
New customers
2016
280
319
337**
2016
Year 4
Year 3
Year 2
83
Year 1
Commerzbank 4.0
simple – digital – efficient
*: domestic branch business, excl. income from deposits**: includes €57 not directly customer specific revenues
New customers earn their acquisition costs (€150-25 0) in the second year
These written materials and the information contained herein are not being issued and may not be distributed in the United States of America, Canada, Japan or Australia.
GM – Investor Relations | GM – Treasury | Europe | December 2017
0
250
500
750
1.000
0 25 50 75
13%Payments20%
Deposits
28%
Securities
39%
Loans
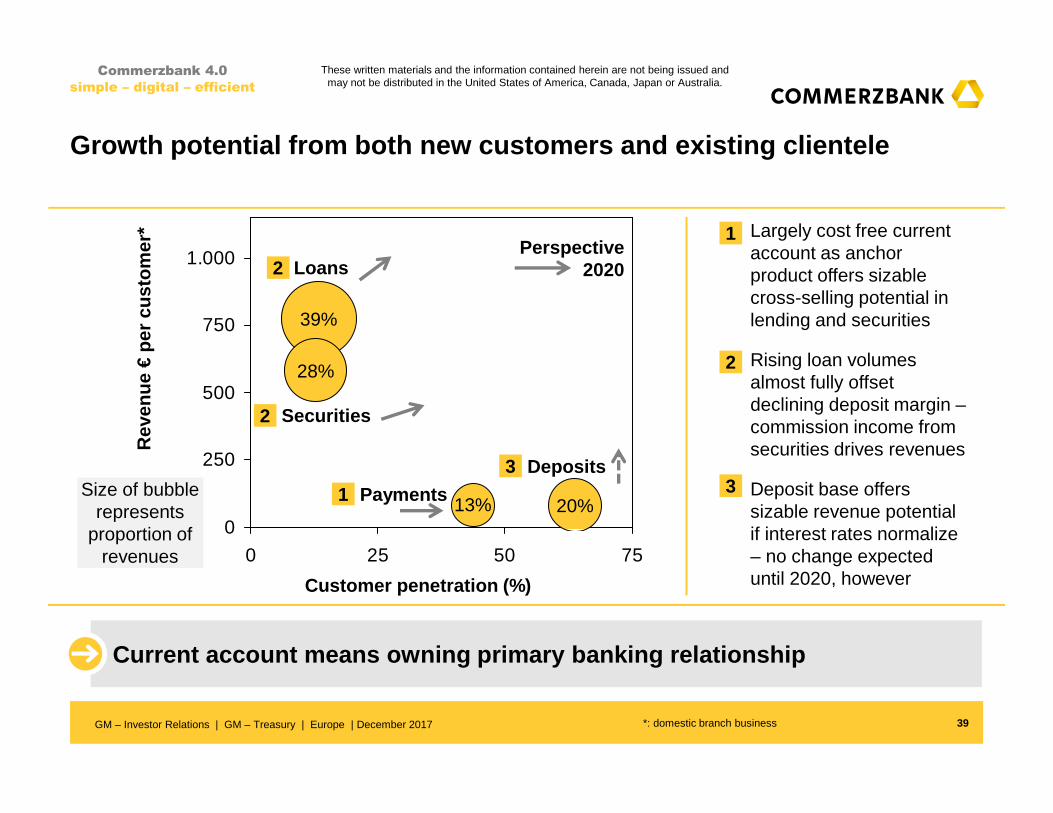
Growth potential from both new customers and existi ng clientele
39
› Largely cost free current account as anchor product offers sizable cross-selling potential in lending and securities
› Rising loan volumes almost fully offset declining deposit margin –commission income from securities drives revenues
› Deposit base offers sizable revenue potential if interest rates normalize – no change expected until 2020, however
Commerzbank 4.0
simple – digital – efficient
1
1
2
3
Rev
enue
€pe
r cu
stom
er*
Customer penetration (%)
Perspective 2020
3
2
2
Size of bubble represents
proportion of revenues
*: domestic branch business
Current account means owning primary banking relati onship
GM – Investor Relations | GM – Treasury | Europe | December 2017
These written materials and the information contained herein are not being issued and may not be distributed in the United States of America, Canada, Japan or Australia.

Major pillars of the Corporate Clients segment
Revenues 9M 20171)
› Full range of products out of ~150 branches in Germany
› German mid-sized and large corporates with sales >15m€ (as long as not listed in DAX or MDAX)
Mittelstand(German corporates
w/ sales > €15m)€1.4bn
40
› Large German corporates (listed in DAX or MDAX)
› Corporates / insurances located outside of Germany, including multinational clients
International Corporates
(Corporates outside of Germany and multinationals)
€0.7bn
› Full range of services; focus on processing foreign payment transactions, trade finance and risk management
› FIs in Germany and abroad, including central banks; global network of correspondent banks
Financial Institutions
(FIs and central banks)
€0.3bn
› Structured financial instruments and investment products
› EMC products are offered to all customers of Commerzbank, both in Germany and abroad
EMC(Ring-fencing the financial products manufacturing and market making
business)
€0.3bn
› Positions from non strategic business and valuation effects
› Effects from risk management for the Segment Corporate ClientsOther Result €0.3bn
1) Excl. OCS, FVA and net CVA/DVA
Commerzbank 4.0
simple – digital – efficient
GM – Investor Relations | GM – Treasury | Europe | December 2017
These written materials and the information contained herein are not being issued and may not be distributed in the United States of America, Canada, Japan or Australia.
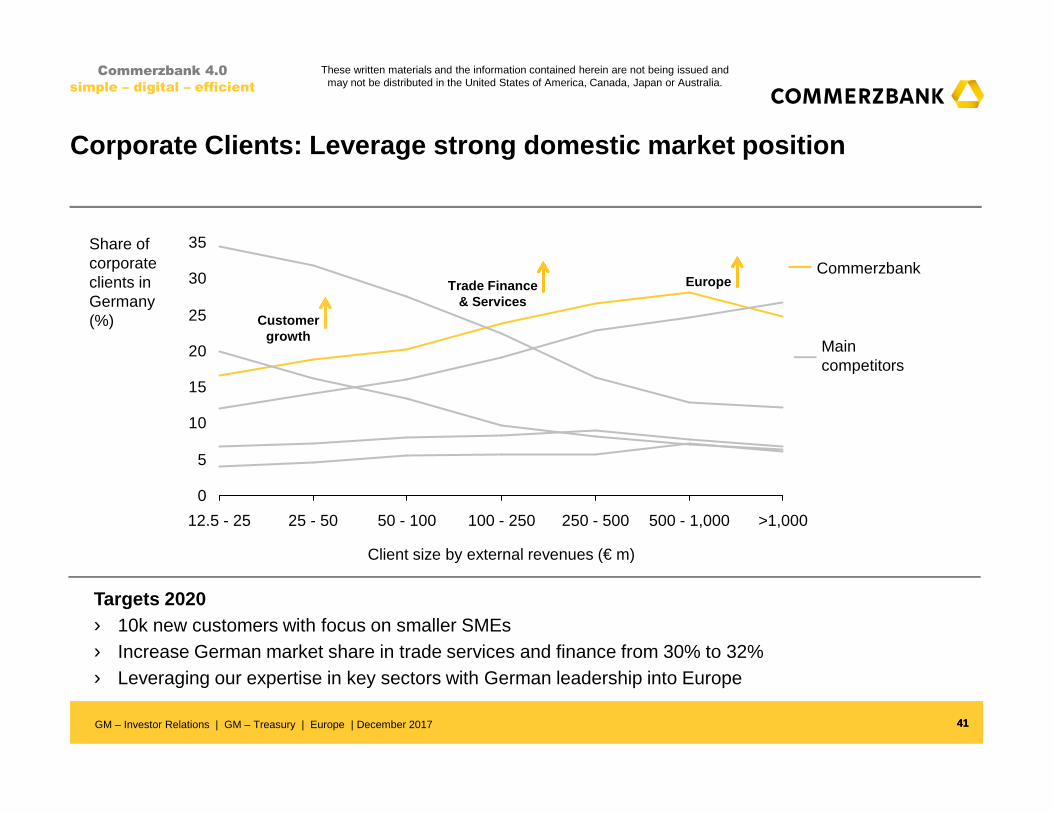
Corporate Clients: Leverage strong domestic market position
41
Commerzbank
0
5
10
15
20
25
30
35
Client size by external revenues (€ m)
>1,000500 - 1,000250 - 500100 - 25050 - 10025 - 5012.5 - 25
Share ofcorporateclients in Germany(%)
41
Targets 2020› 10k new customers with focus on smaller SMEs› Increase German market share in trade services and finance from 30% to 32%› Leveraging our expertise in key sectors with German leadership into Europe
Customer growth
Trade Finance& Services
Europe
Main competitors
Commerzbank 4.0
simple – digital – efficient
GM – Investor Relations | GM – Treasury | Europe | December 2017
These written materials and the information contained herein are not being issued and may not be distributed in the United States of America, Canada, Japan or Australia.

Commerzbank financials at a glance
42
Commerzbank 4.0
simple – digital – efficient
Group Q3 2016 Q2 2017 Q3 2017
Operating result (€m) 429 183 629
Net result (€m) -288 -637 472
CET1 ratio B3 phase-in (%) 13.6 13.9 14.4
CET1 ratio B3 fully phased-in (%) 11.8 13.0 13.5
Total assets (€bn) 514 487 490
RWA B3 fully phased-in (€bn) 195 178 177
Leverage ratio (fully phased-in) (%) 4.5 4.6 4.7
Cost/income ratio (%) 71.1 83.1 68.3
Net RoE (%) -4.1 -8.9 6.6
Net RoTE (%) -4.5 -9.8 7.3
Total capital ratio fully phased-in (%) 14.9 16.3 16.7
NPL ratio (in %) 1.7 1.5 1.5
CoR (bps) 19 16 16
GM – Investor Relations | GM – Treasury | Europe | December 2017
These written materials and the information contained herein are not being issued and may not be distributed in the United States of America, Canada, Japan or Australia.
2.0
1.5
1.0
0.5
-0.58Y6Y4Y2Y0Y
900-1,000
500-550
43
Highlights
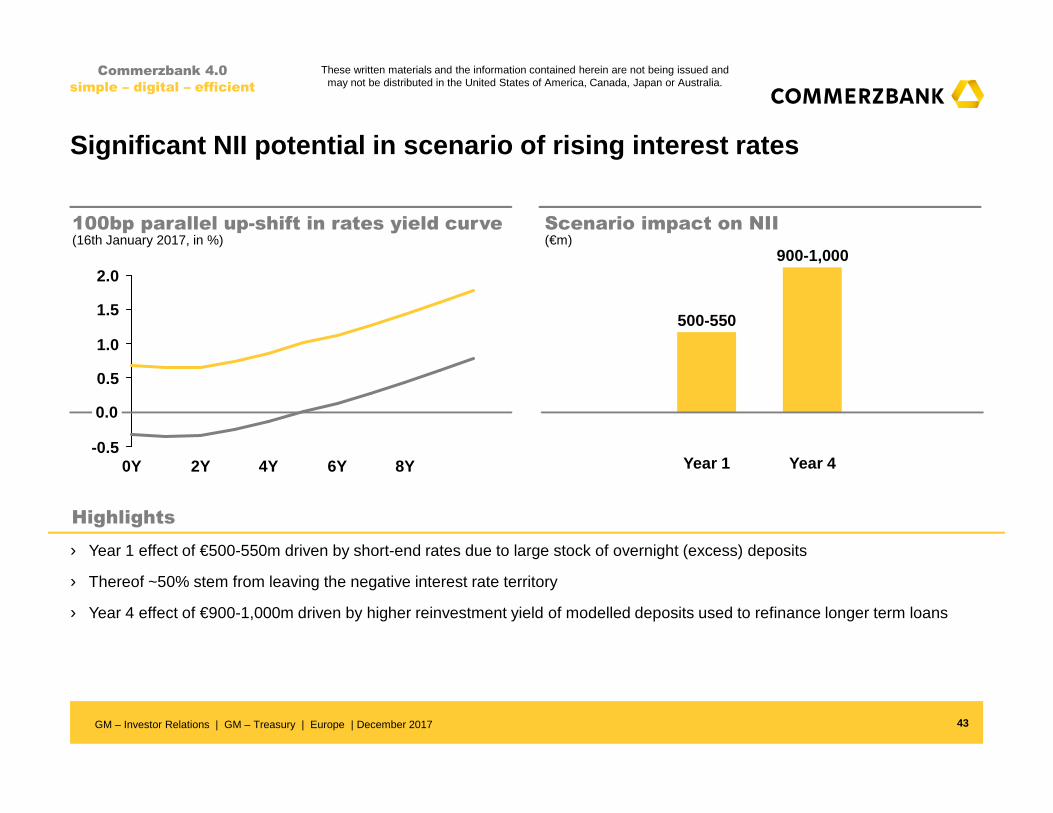
100bp parallel up-shift in rates yield curve Scenario impact on NII
Commerzbank 4.0
simple – digital – efficient
(€m)(16th January 2017, in %)
› Year 1 effect of €500-550m driven by short-end rates due to large stock of overnight (excess) deposits
› Thereof ~50% stem from leaving the negative interest rate territory
› Year 4 effect of €900-1,000m driven by higher reinvestment yield of modelled deposits used to refinance longer term loans
Significant NII potential in scenario of rising int erest rates
Year 1 Year 4
0.0
GM – Investor Relations | GM – Treasury | Europe | December 2017
These written materials and the information contained herein are not being issued and may not be distributed in the United States of America, Canada, Japan or Australia.

Overview Ship Finance – Fleet and charter rate index
44
Commerzbank 4.0
simple – digital – efficient
Fleet index(%)
Charter rate index(%)
90
120
150
180
210
2017e
169
145
196
2014201220102008
Container Fleet
Tanker Fleet
Bulker Fleet
19
4537
0
20
40
60
80
100
2017e2014201220102008
Container Charter Rate
Tanker Charter Rate
Bulker Charter Rate
Additional information
› Net fleet growth for 2017 expected at 2% to 3% for bulker/container and 5% for tanker, with very narrow new orderings seen this year
› Sale of loan portfolios by competitors likely to cause some price pressure – diverse development for different ship types expected
› Steadily declining ratio of NPL / CET1 capital in recent years – approaching 5%
› Strong portfolio run down of €21bn (-83%) since 2008 – sufficient coverage ratio level of 52% (ACR)
GM – Investor Relations | GM – Treasury | Europe | December 2017
These written materials and the information contained herein are not being issued and may not be distributed in the United States of America, Canada, Japan or Australia.

ACR Ship Finance portfolio as of 30 September 2017
45
Commerzbank 4.0
simple – digital – efficient
30 September 2017 (31 December 2016)
Performing portfolio SF by ship type | €m Total Container Tanker Bulker
Exposure at Default 1,922 (3,511) 861 (1,116) 421 (875) 326 (912)
Expected Loss 212 (288) 102 (85) 14 (12) 49 (121)
Risk Density (in bp) 1,105 (820) 1,180 (760) 333 (131) 1,506 (1,324)
30 September 2017 (31 December 2016)
Default portfolio SF by ship type | €m Total Container Tanker Bulker
Default volume 1,351 (1,243) 418 (548) 205 (111) 307 (154)
SLLP 588 (628) 175 (223) 43 (56) 91 (78)
GLLP 114 (172) 40 (36) 10 (4) 21 (54)
Coverage ratio incl. GLLP excl. collaterals (%) 52 (64) 52 (47) 26 (54) 37 (85)
Collaterals 739 (466) 160 (178) 189 (73) 234 (82)
Coverage ratio incl. GLLP and collaterals (%) 107 (102) 90 (80) 118 (119) 113 (138)
NPL ratio (%) 41.3 (26.2) 32.6 (32.9) 32.7 (11.3) 48.5 (14.5)
GM – Investor Relations | GM – Treasury | Europe | December 2017
These written materials and the information contained herein are not being issued and may not be distributed in the United States of America, Canada, Japan or Australia.
Residential mortgage business vs. property prices
46
Commerzbank 4.0
simple – digital – efficient
1) RD = Risk Density (Expected Loss / EaD)
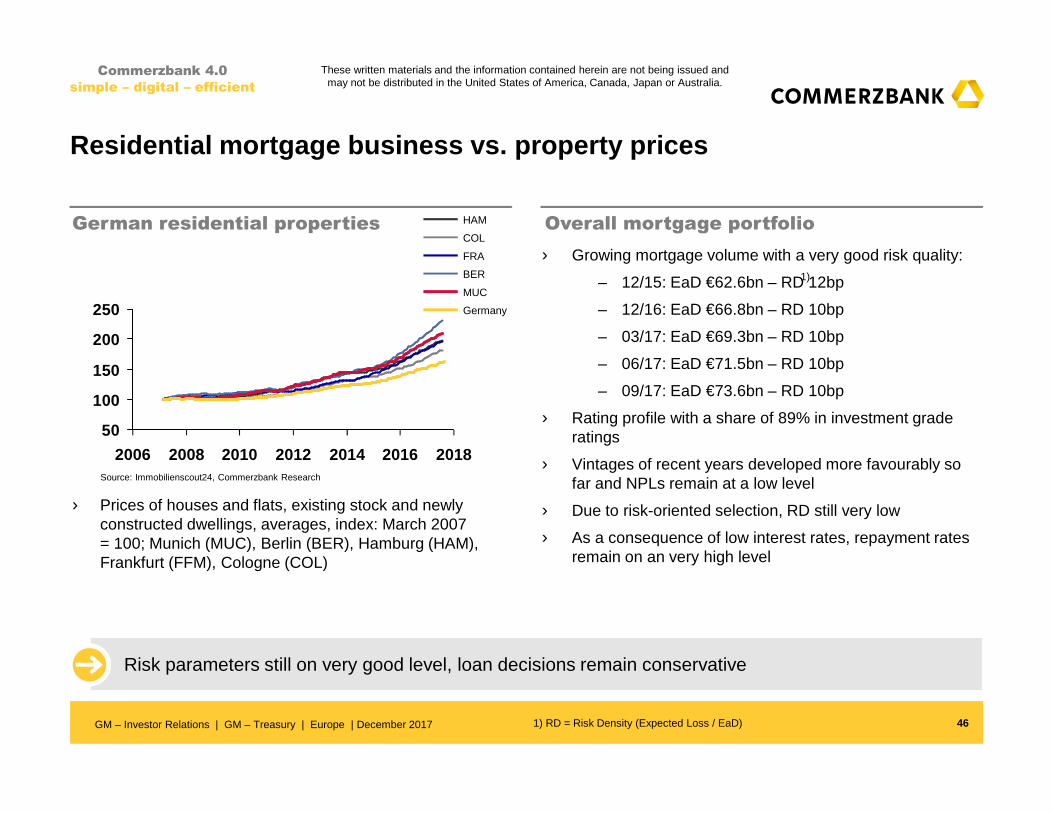
German residential properties Overall mortgage portfolio
50
100
150
200
250
2006 2008 2010 2012 2014 2016 2018
Germany
MUC
BER
FRA
COL
HAM
Source: Immobilienscout24, Commerzbank Research
› Growing mortgage volume with a very good risk quality:
– 12/15: EaD €62.6bn – RD 12bp
– 12/16: EaD €66.8bn – RD 10bp
– 03/17: EaD €69.3bn – RD 10bp
– 06/17: EaD €71.5bn – RD 10bp
– 09/17: EaD €73.6bn – RD 10bp
› Rating profile with a share of 89% in investment grade ratings
› Vintages of recent years developed more favourably so far and NPLs remain at a low level
› Due to risk-oriented selection, RD still very low
› As a consequence of low interest rates, repayment rates remain on an very high level
› Prices of houses and flats, existing stock and newlyconstructed dwellings, averages, index: March 2007 = 100; Munich (MUC), Berlin (BER), Hamburg (HAM), Frankfurt (FFM), Cologne (COL)
Risk parameters still on very good level, loan decisions remain conservative
1)
GM – Investor Relations | GM – Treasury | Europe | December 2017
These written materials and the information contained herein are not being issued and may not be distributed in the United States of America, Canada, Japan or Australia.
Commerzbank Group
47
Commerzbank 4.0
simple – digital – efficient
€mQ1
2016Q2
2016Q3
20169M
2016Q4
2016FY
2016Q1
2017Q2
2017Q3
20179M
2017% Q3vs Q3
% Q3vs Q2
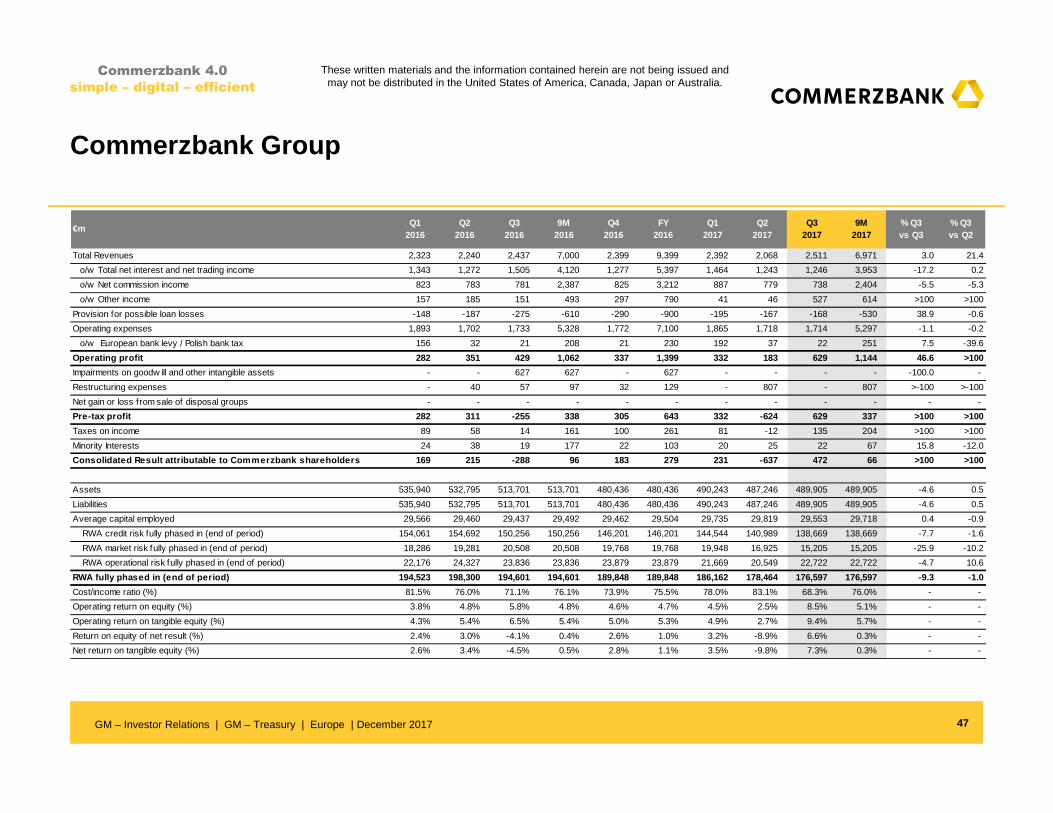
Total Revenues 2,323 2,240 2,437 7,000 2,399 9,399 2,392 2,068 2,511 6,971 3.0 21.4
o/w Total net interest and net trading income 1,343 1,272 1,505 4,120 1,277 5,397 1,464 1,243 1,246 3,953 -17.2 0.2
o/w Net commission income 823 783 781 2,387 825 3,212 887 779 738 2,404 -5.5 -5.3
o/w Other income 157 185 151 493 297 790 41 46 527 614 >100 >100
Provision for possible loan losses -148 -187 -275 -610 -290 -900 -195 -167 -168 -530 38.9 -0.6
Operating expenses 1,893 1,702 1,733 5,328 1,772 7,100 1,865 1,718 1,714 5,297 -1.1 -0.2
o/w European bank levy / Polish bank tax 156 32 21 208 21 230 192 37 22 251 7.5 -39.6
Operating profit 282 351 429 1,062 337 1,399 332 183 629 1,144 46.6 >100
Impairments on goodw ill and other intangible assets - - 627 627 - 627 - - - - -100.0 -
Restructuring expenses - 40 57 97 32 129 - 807 - 807 >-100 >-100
Net gain or loss from sale of disposal groups - - - - - - - - - - - -
Pre-tax profit 282 311 -255 338 305 643 332 -624 629 337 >100 >100
Taxes on income 89 58 14 161 100 261 81 -12 135 204 >100 >100
Minority Interests 24 38 19 177 22 103 20 25 22 67 15.8 -12.0
Consolidated Result attributable to Commerzbank sha reholders 169 215 -288 96 183 279 231 -637 472 66 >100 >100
Assets 535,940 532,795 513,701 513,701 480,436 480,436 490,243 487,246 489,905 489,905 -4.6 0.5
Liabilities 535,940 532,795 513,701 513,701 480,436 480,436 490,243 487,246 489,905 489,905 -4.6 0.5
Average capital employed 29,566 29,460 29,437 29,492 29,462 29,504 29,735 29,819 29,553 29,718 0.4 -0.9
RWA credit risk fully phased in (end of period) 154,061 154,692 150,256 150,256 146,201 146,201 144,544 140,989 138,669 138,669 -7.7 -1.6
RWA market risk fully phased in (end of period) 18,286 19,281 20,508 20,508 19,768 19,768 19,948 16,925 15,205 15,205 -25.9 -10.2
RWA operational risk fully phased in (end of period) 22,176 24,327 23,836 23,836 23,879 23,879 21,669 20,549 22,722 22,722 -4.7 10.6
RWA fully phased in (end of period) 194,523 198,300 194,601 194,601 189,848 189,848 186,162 178,464 176,597 176,597 -9.3 -1.0
Cost/income ratio (%) 81.5% 76.0% 71.1% 76.1% 73.9% 75.5% 78.0% 83.1% 68.3% 76.0% - -
Operating return on equity (%) 3.8% 4.8% 5.8% 4.8% 4.6% 4.7% 4.5% 2.5% 8.5% 5.1% - -
Operating return on tangible equity (%) 4.3% 5.4% 6.5% 5.4% 5.0% 5.3% 4.9% 2.7% 9.4% 5.7% - -
Return on equity of net result (%) 2.4% 3.0% -4.1% 0.4% 2.6% 1.0% 3.2% -8.9% 6.6% 0.3% - -
Net return on tangible equity (%) 2.6% 3.4% -4.5% 0.5% 2.8% 1.1% 3.5% -9.8% 7.3% 0.3% - -
GM – Investor Relations | GM – Treasury | Europe | December 2017
These written materials and the information contained herein are not being issued and may not be distributed in the United States of America, Canada, Japan or Australia.

Private and Small Business Customers
48
Commerzbank 4.0
simple – digital – efficient
€mQ1
2016Q2
2016Q3
20169M
2016Q4
2016FY
2016Q1
2017Q2
2017Q3
20179M
2017% Q3vs Q3
% Q3vs Q2
Total Revenues 1,195 1,232 1,216 3,643 1,175 4,818 1,168 1,111 1,363 3,642 12.1 22.7
o/w Net interest income 646 599 613 1,858 620 2,478 589 598 608 1,795 -0.8 1.7
o/w Net trading income 14 13 16 43 7 50 21 18 15 54 -6.3 -16.7
o/w Net commission income 486 474 492 1,452 504 1,956 545 477 465 1,487 -5.5 -2.5
o/w Other income 49 146 95 290 44 334 13 18 275 306 >100 >100
Provision for possible loan losses -23 -42 -40 -105 -14 -119 -33 -42 -55 -130 -37.5 -31.0
Operating expenses 895 895 903 2,693 929 3,622 941 927 927 2,795 2.7 -
o/w European bank levy / Polish bank tax 32 21 21 73 21 95 63 27 22 113 8.3 -18.5
Operating profit 277 295 273 845 232 1,077 194 142 381 717 39.6 >100
Impairments on goodw ill and other intangible assets - - - - - - - - - - - -
Restructuring expenses - - - - - - - - - - - -
Net gain or loss from sale of disposal groups - - - - - - - - - - - -
Pre-tax profit 277 295 273 845 232 1,077 194 142 381 717 39.6 >100
Assets 112,832 115,166 117,035 117,035 119,392 119,392 120,480 123,025 125,463 125,463 7.2 2.0
Liabilities 134,997 136,827 137,413 137,413 141,396 141,396 144,563 148,018 149,951 149,951 9.1 1.3
Average capital employed 4,222 4,105 4,101 4,149 4,046 4,122 3,966 4,023 4,234 4,080 3.3 5.3
RWA credit risk fully phased in (end of period) 29,403 29,023 28,902 28,902 28,126 28,126 28,604 30,927 32,351 32,351 11.9 4.6
RWA market risk fully phased in (end of period) 1,380 1,386 1,162 1,162 1,031 1,031 845 786 831 831 -28.5 5.8
RWA operational risk fully phased in (end of period) 6,503 7,053 7,085 7,085 6,955 6,955 6,424 6,010 6,023 6,023 -15.0 0.2
RWA fully phased in (end of period) 37,286 37,462 37,149 37,149 36,112 36,112 35,873 37,722 39,205 39,205 5.5 3.9
Cost/income ratio (%) 74.9% 72.6% 74.3% 73.9% 79.1% 75.2% 80.6% 83.4% 68.0% 76.7% - -
Operating return on equity (%) 26.2% 28.7% 26.6% 27.2% 22.9% 26.1% 19.6% 14.1% 36.0% 23.4% - -
Operating return on tangible equity (%) 25.7% 27.8% 25.6% 26.3% 21.9% 25.2% 18.6% 13.6% 34.7% 22.5% - -
GM – Investor Relations | GM – Treasury | Europe | December 2017
These written materials and the information contained herein are not being issued and may not be distributed in the United States of America, Canada, Japan or Australia.

Corporate Clients
49
Commerzbank 4.0
simple – digital – efficient
€mQ1
2016Q2
2016Q3
20169M
2016Q4
2016FY
2016Q1
2017Q2
2017Q3
20179M
2017% Q3vs Q3
% Q3vs Q2
Total Revenues 1,145 1,095 1,121 3,361 1,086 4,447 1,100 943 970 3,013 -13.5 2.9
o/w Total net interest and net trading income 752 766 798 2,316 720 3,036 754 594 672 2,020 -15.8 13.1
o/w Net commission income 345 315 295 955 325 1,280 347 312 279 938 -5.4 -10.6
o/w Other income 48 14 28 90 41 131 -1 37 19 55 -32.1 -48.6
Provision for possible loan losses -56 -72 -87 -215 30 -185 -43 -33 -47 -123 46.0 -42.4
Operating expenses 809 703 707 2,219 754 2,973 790 676 682 2,148 -3.5 0.9
o/w European bank levy 82 3 - 86 - 86 96 4 - 100 -100.0 -100.0
Operating profit 280 320 327 927 362 1,289 267 234 241 742 -26.3 3.0
Impairments on goodw ill and other intangible assets - - 627 627 - 627 - - - - -100.0 -
Restructuring expenses - 12 10 22 - 22 - - - - -100.0 -
Net gain or loss from sale of disposal groups - - - - - - - - - - - -
Pre-tax profit 280 308 -310 278 362 640 267 234 241 742 >100 3.0
Assets 259,304 263,921 229,794 229,794 210,768 210,768 208,707 198,222 189,818 189,818 -17.4 -4.2
Liabilities 271,466 262,151 238,993 238,993 223,776 223,776 232,754 228,946 212,675 212,675 -11.0 -7.1
Average capital employed 11,664 11,739 11,644 11,660 11,418 11,600 11,225 10,436 10,161 10,629 -12.7 -2.6
RWA credit risk fully phased in (end of period) 85,374 85,742 81,549 81,549 83,856 83,856 78,914 75,673 75,155 75,155 -7.8 -0.7
RWA market risk fully phased in (end of period) 10,455 11,291 11,671 11,671 9,560 9,560 9,231 7,747 6,735 6,735 -42.3 -13.1
RWA operational risk fully phased in (end of period) 10,095 11,420 11,125 11,125 11,743 11,743 9,765 9,552 10,230 10,230 -8.0 7.1
RWA fully phased in (end of period) 105,924 108,45 2 104,345 104,345 105,159 105,159 97,909 92,972 92,120 92,120 -11.7 -0.9
Cost/income ratio (%) 70.7% 64.2% 63.1% 66.0% 69.4% 66.9% 71.8% 71.7% 70.3% 71.3% - -
Operating return on equity (%) 9.6% 10.9% 11.2% 10.6% 12.7% 11.1% 9.5% 9.0% 9.5% 9.3% - -
Operating return on tangible equity (%) 8.7% 10.0% 10.2% 9.7% 11.5% 10.1% 8.7% 8.2% 8.7% 8.5% - -
GM – Investor Relations | GM – Treasury | Europe | December 2017
These written materials and the information contained herein are not being issued and may not be distributed in the United States of America, Canada, Japan or Australia.

Asset & Capital Recovery
50
Commerzbank 4.0
simple – digital – efficient
€mQ1
2016Q2
2016Q3
20169M
2016Q4
2016FY
2016Q1
2017Q2
2017Q3
20179M
2017% Q3vs Q3
% Q3vs Q2
Total Revenues -18 -24 72 30 183 213 115 38 -12 141 >-100 >-100
o/w Net interest income 3 -50 61 14 272 286 80 70 49 199 -19.7 -30.0
o/w Net trading income -30 24 37 31 -233 -202 23 -39 -65 -81 >-100 -66.7
o/w Net commission income - 1 - 1 3 4 - 1 - 1 >100 -
o/w Other income 9 1 -26 -16 141 125 12 6 4 22 >100 -33.3
Provision for possible loan losses -70 -75 -147 -292 -307 -599 -119 -92 -66 -277 55.1 28.3
Operating expenses 31 33 33 97 32 129 29 28 22 79 -33.3 -21.4
o/w European bank levy 5 1 - 6 - 6 5 3 - 7 - -100.0
Operating profit -119 -132 -108 -359 -156 -515 -33 -82 -100 -215 7.4 -22.0
Impairments on goodw ill and other intangible assets - - - - - - - - - - - -
Restructuring expenses - - - - - - - - - - - -
Net gain or loss from sale of disposal groups - - - - - - - - - - - -
Pre-tax profit -119 -132 -108 -359 -156 -515 -33 -82 -100 -215 7.4 -22.0
Assets 24,128 30,494 30,940 30,940 27,005 27,005 25,905 24,876 23,583 23,583 -23.8 -5.2
o/w Assets excl repos, collaterals and trading assets 13,283 13,039 12,779 12,779 11,674 11,674 11,143 9,671 8,803 8,803 -31.1 -9.0
Liabilities 15,186 22,677 22,427 22,427 20,203 20,203 19,664 19,425 19,347 19,347 -13.7 -0.4
Exposure at default 17,478 17,380 17,221 17,221 16,184 16,184 16,107 15,253 1,914 1,914 -88.9 -87.4
Average capital employed 3,296 3,463 3,332 3,351 3,181 3,308 3,165 3,182 2,916 3,063 -12.5 -8.4
RWA credit risk fully phased in (end of period) 16,947 17,077 14,217 14,217 13,157 13,157 15,384 13,710 12,809 12,809 -9.9 -6.6
RWA market risk fully phased in (end of period) 3,007 3,150 4,471 4,471 5,486 5,486 5,598 4,649 4,288 4,288 -4.1 -7.8
RWA operational risk fully phased in (end of period) 2,468 3,021 2,856 2,856 1,914 1,914 1,786 1,720 1,968 1,968 -31.1 14.4
RWA fully phased in (end of period) 22,422 23,249 21,544 21,544 20,557 20,557 22,768 20,079 19,064 19,064 -11.5 -5.1
GM – Investor Relations | GM – Treasury | Europe | December 2017
These written materials and the information contained herein are not being issued and may not be distributed in the United States of America, Canada, Japan or Australia.
Others & Consolidation
51
Commerzbank 4.0
simple – digital – efficient
€mQ1
2016Q2
2016Q3
20169M
2016Q4
2016FY
2016Q1
2017Q2
2017Q3
20179M
2017% Q3vs Q3
% Q3vs Q2
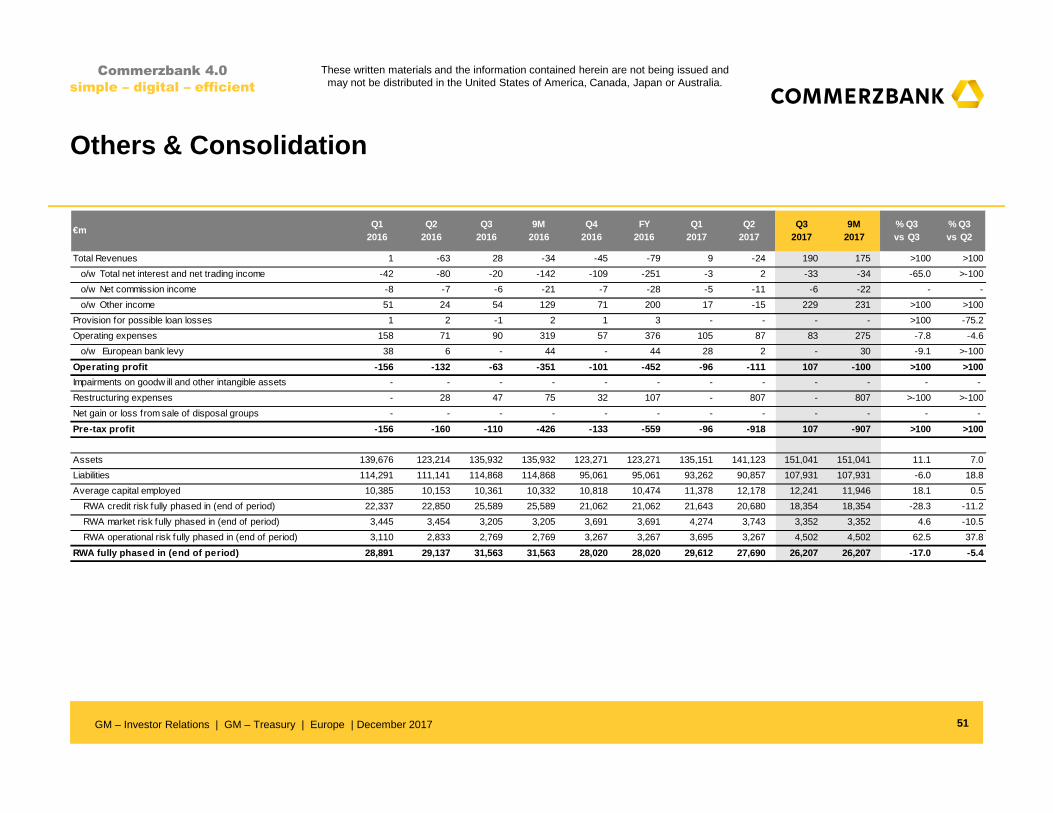
Total Revenues 1 -63 28 -34 -45 -79 9 -24 190 175 >100 >100
o/w Total net interest and net trading income -42 -80 -20 -142 -109 -251 -3 2 -33 -34 -65.0 >-100
o/w Net commission income -8 -7 -6 -21 -7 -28 -5 -11 -6 -22 - -
o/w Other income 51 24 54 129 71 200 17 -15 229 231 >100 >100
Provision for possible loan losses 1 2 -1 2 1 3 - - - - >100 -75.2
Operating expenses 158 71 90 319 57 376 105 87 83 275 -7.8 -4.6
o/w European bank levy 38 6 - 44 - 44 28 2 - 30 -9.1 >-100
Operating profit -156 -132 -63 -351 -101 -452 -96 -111 107 -100 >100 >100
Impairments on goodw ill and other intangible assets - - - - - - - - - - - -
Restructuring expenses - 28 47 75 32 107 - 807 - 807 >-100 >-100
Net gain or loss from sale of disposal groups - - - - - - - - - - - -
Pre-tax profit -156 -160 -110 -426 -133 -559 -96 -918 107 -907 >100 >100
Assets 139,676 123,214 135,932 135,932 123,271 123,271 135,151 141,123 151,041 151,041 11.1 7.0
Liabilities 114,291 111,141 114,868 114,868 95,061 95,061 93,262 90,857 107,931 107,931 -6.0 18.8
Average capital employed 10,385 10,153 10,361 10,332 10,818 10,474 11,378 12,178 12,241 11,946 18.1 0.5
RWA credit risk fully phased in (end of period) 22,337 22,850 25,589 25,589 21,062 21,062 21,643 20,680 18,354 18,354 -28.3 -11.2
RWA market risk fully phased in (end of period) 3,445 3,454 3,205 3,205 3,691 3,691 4,274 3,743 3,352 3,352 4.6 -10.5
RWA operational risk fully phased in (end of period) 3,110 2,833 2,769 2,769 3,267 3,267 3,695 3,267 4,502 4,502 62.5 37.8
RWA fully phased in (end of period) 28,891 29,137 31,563 31,563 28,020 28,020 29,612 27,690 26,207 26,207 -17.0 -5.4
GM – Investor Relations | GM – Treasury | Europe | December 2017
These written materials and the information contained herein are not being issued and may not be distributed in the United States of America, Canada, Japan or Australia.
52
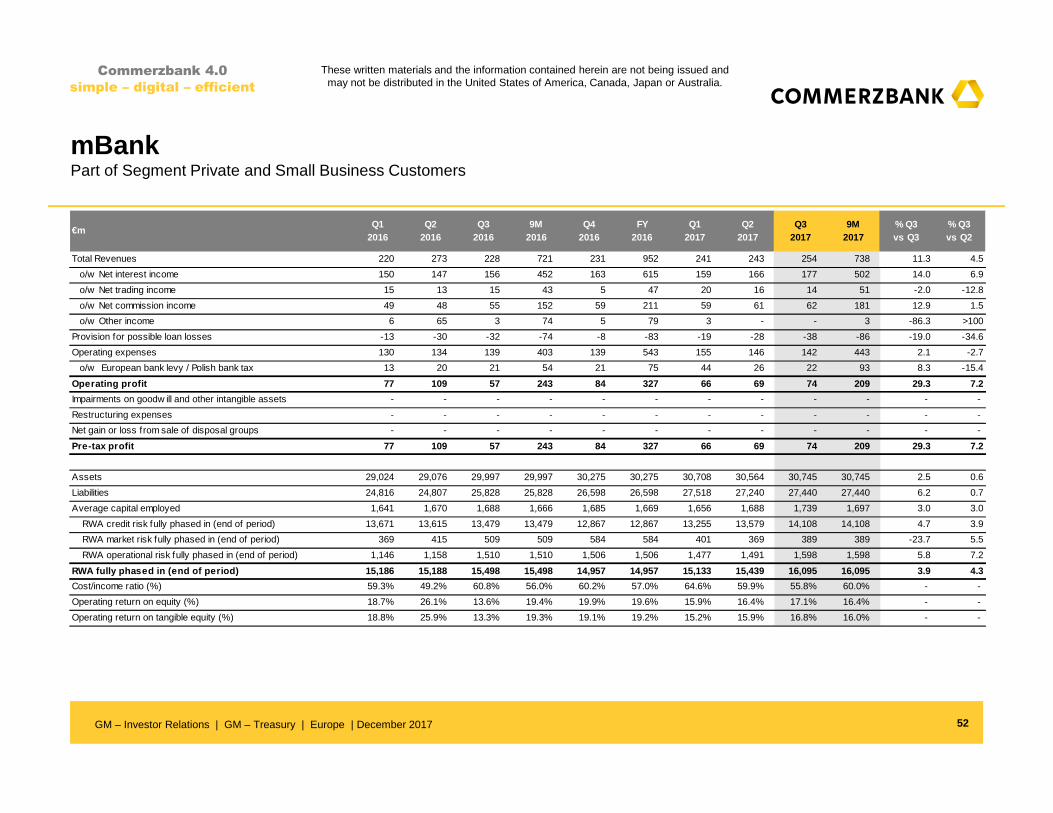
mBankPart of Segment Private and Small Business Customers
Commerzbank 4.0
simple – digital – efficient
€mQ1
2016Q2
2016Q3
20169M
2016Q4
2016FY
2016Q1
2017Q2
2017Q3
20179M
2017% Q3vs Q3
% Q3vs Q2
Total Revenues 220 273 228 721 231 952 241 243 254 738 11.3 4.5
o/w Net interest income 150 147 156 452 163 615 159 166 177 502 14.0 6.9
o/w Net trading income 15 13 15 43 5 47 20 16 14 51 -2.0 -12.8
o/w Net commission income 49 48 55 152 59 211 59 61 62 181 12.9 1.5
o/w Other income 6 65 3 74 5 79 3 - - 3 -86.3 >100
Provision for possible loan losses -13 -30 -32 -74 -8 -83 -19 -28 -38 -86 -19.0 -34.6
Operating expenses 130 134 139 403 139 543 155 146 142 443 2.1 -2.7
o/w European bank levy / Polish bank tax 13 20 21 54 21 75 44 26 22 93 8.3 -15.4
Operating profit 77 109 57 243 84 327 66 69 74 209 29.3 7.2
Impairments on goodw ill and other intangible assets - - - - - - - - - - - -
Restructuring expenses - - - - - - - - - - - -
Net gain or loss from sale of disposal groups - - - - - - - - - - - -
Pre-tax profit 77 109 57 243 84 327 66 69 74 209 29.3 7.2
Assets 29,024 29,076 29,997 29,997 30,275 30,275 30,708 30,564 30,745 30,745 2.5 0.6
Liabilities 24,816 24,807 25,828 25,828 26,598 26,598 27,518 27,240 27,440 27,440 6.2 0.7
Average capital employed 1,641 1,670 1,688 1,666 1,685 1,669 1,656 1,688 1,739 1,697 3.0 3.0
RWA credit risk fully phased in (end of period) 13,671 13,615 13,479 13,479 12,867 12,867 13,255 13,579 14,108 14,108 4.7 3.9
RWA market risk fully phased in (end of period) 369 415 509 509 584 584 401 369 389 389 -23.7 5.5
RWA operational risk fully phased in (end of period) 1,146 1,158 1,510 1,510 1,506 1,506 1,477 1,491 1,598 1,598 5.8 7.2
RWA fully phased in (end of period) 15,186 15,188 15,498 15,498 14,957 14,957 15,133 15,439 16,095 16,095 3.9 4.3
Cost/income ratio (%) 59.3% 49.2% 60.8% 56.0% 60.2% 57.0% 64.6% 59.9% 55.8% 60.0% - -
Operating return on equity (%) 18.7% 26.1% 13.6% 19.4% 19.9% 19.6% 15.9% 16.4% 17.1% 16.4% - -
Operating return on tangible equity (%) 18.8% 25.9% 13.3% 19.3% 19.1% 19.2% 15.2% 15.9% 16.8% 16.0% - -
GM – Investor Relations | GM – Treasury | Europe | December 2017
These written materials and the information contained herein are not being issued and may not be distributed in the United States of America, Canada, Japan or Australia.

For more information, please contact Commerzbank’s IR team
53
Commerzbank 4.0
simple – digital – efficient
Christoph Wortig (Head of Investor Relations)P: +49 69 136 52668M: [email protected]
Institutional Investors and Financial Analysts
Michael H. KleinP: +49 69 136 24522M: [email protected]
Fabian BrügmannP: +49 69 136 28696M: [email protected]
Retail Investors
Simone Nuxoll P: +49 69 136 45660M: [email protected]
Dirk Bartsch (Head of Strategic IR / Rating Agency Relations)P: +49 69 136 22799 M: [email protected]
Financial calendar
201808 Feb
Annual Press Conference
08 Nov
Q3 2018 results
Ansgar Herkert (Head of IR Communications)P: +49 69 136 44083M: [email protected]
08 May
Annual General Meeting
15 May
Q1 2018 results
07 Aug
Q2 2018 results
GM – Investor Relations | GM – Treasury | Europe | December 2017
These written materials and the information contained herein are not being issued and may not be distributed in the United States of America, Canada, Japan or Australia.