commission of the european communitiesaei.pitt.edu/13068/1/13068.pdf · commission of the european...
TRANSCRIPT

----------
COMMISSION OF THE EUROPEAN COMMUNITIES
COM(87) 413 final
Brussels, 16 September 1987
Commission report to the Council and to Parliament
on the borrowing and lending activities of the Community
in 1986
COM(87) 413 final
~--~--------------
- 2 -
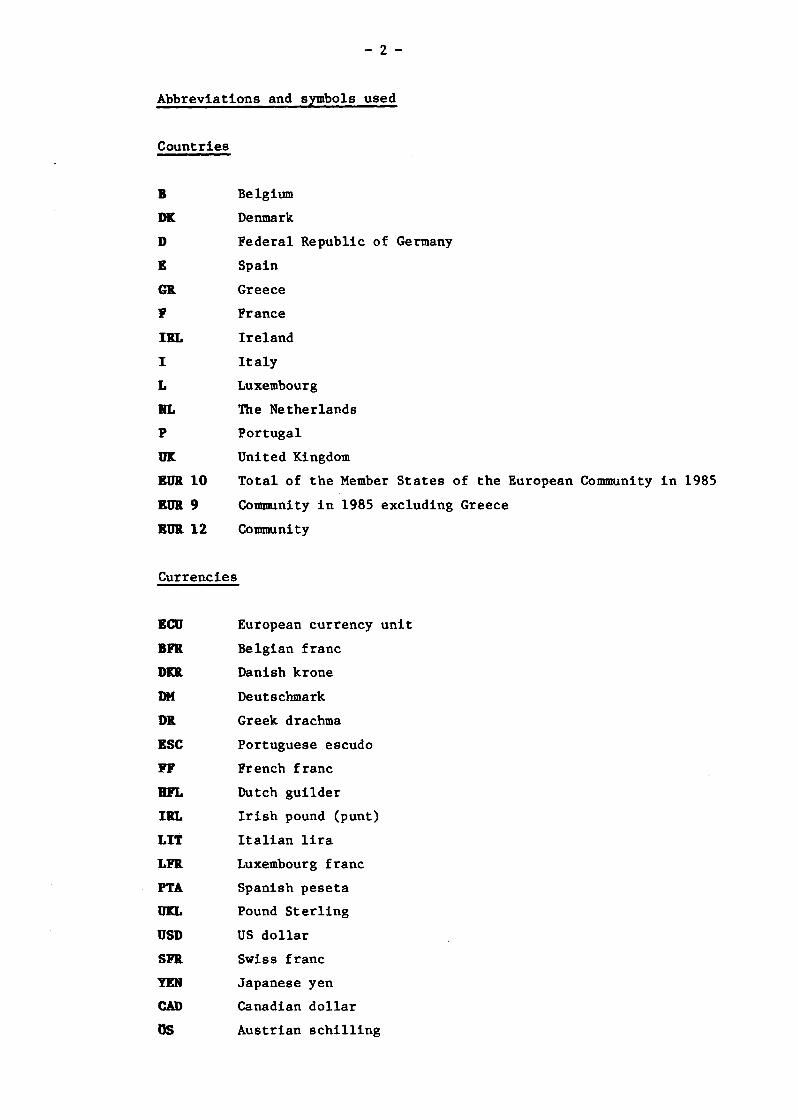
Abbreviations and symbols used
Countries
• DK
D
E
G1t
F
I IlL
I
L
RL
p
1JI(
BUR 10
BUR 9
ElJlt 12
Currencies
ECU
BFR.
DO
DM
DJl
ESC
FF
BFL
I IlL
LIT
LFR.
PTA
un. USD
SFR.
YEll
CAD
OS
Belgium
Denmark
Federal Republic of Germany
Spain
Greece
France
Ireland
Italy
Luxembourg
The Netherlands
Portugal
United Kingdom
Total of the Member States of the European Community in 1985
Community in 1985 excluding Greece
Community
European currency unit
Belgian franc
Danish krone
Deutschmark
Greek drachma
Portuguese escudo
French franc
Dutch guilder
Irish pound (punt)
Italian lira
Luxembourg franc
Spanish peseta
Pound Sterling
US dollar
Swiss franc
Japanese yen
Canadian dollar
Austrian schilling

- 3 -
Other abbreviations
ACP African, Caribbean and Pacific countries having signed the
Lo~ Convention
ECSC
EDF
EIB
EMCF
EMS
E~F
European Coal and Steel Community
European Development Fund
European Investment Bank
European Monetary Cooperation Fund
European Monetary System
European Regional Development Fund
EURATOM European Atomic Energy Community
EUROSTAT Statistical Office of the European Communities
GDP (GNP) Gross domestic (national) product
GFCF Gross fixed capital formation
mio Million
NCI
OCTs
OECD
OPEC
SMEs
SOEC
toe
New Community Instrument
Overseas Countries and Territories
Organization for Economic Cooperation and Development
Organization of Petroleum Exporting Countries
Small and medium-sized enterprises
Statistical Office of the European Communities
Tonne of oil equivalent

Methodological comments
Foreword
- 4-
Contents
1. Financial change and Community financial engineering
1.1 Recent financial changes
1.2 The European dimension : the establishment of an
integrated financial market in th~ Community
8
10
12
12
15
1.3 The emergence of financial engineering 18
1.3.1 The tools 19
1.3.2 Application to large-scale infrastructure 20
projects of European interest
1.3.3 Other fields of application 24
2. Investment in the Community 27
2.1 Investment : a factor for growth 27
2.2 Investment in the Member States 28
2.3 The stimulus provided by industrial investment 32
3. Developments and decisions relating to the borrowing and
lending instruments in 1986 34
3.1 The New Community Instrument (NCI) 34
3.2 Euratom 35
3.3 European Coal and Steel Community (ECSC) 35
3.4 European Investment Bank (EIB) 36
Box Financing intangible investment
4. Borrowing
4.1 Situation on capital markets in 1986
4.1.1 General
4.1.2 Currencies of borrowing and interest rates
4.2 Community borrowing in 1986
Box Operations under the Community loans mechanism
designed to support Member States' balances of
payments
38
42
42
42
43
46
51
- 5-
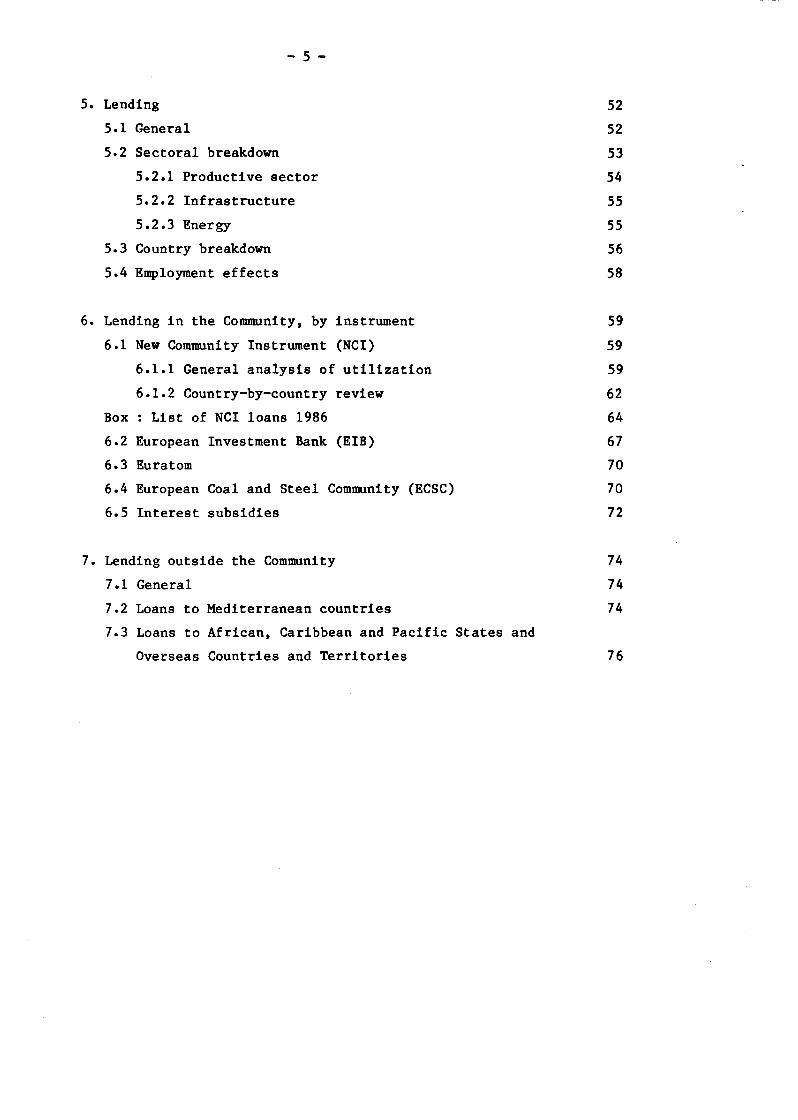
5. Lending
5.1 General
5.2 Sectoral breakdown
5.2.1 Productive sector
5.2.2 Infrastructure
5.2.3 Energy
5.3 Country breakdown
5.4 Employment effects
6. Lending in the Community, by instrument
6.1 New Community Instrument (NCI)
6.1.1 General analysis of utilization
6.1.2 Country-by-country review
Box : List of NCI loans 1986
6.2 European Investment Bank (EIB)
6.3 Euratom
6.4 European Coal and Steel Community (ECSC)
6.5 Interest subsidies
7. Lending outside the Community
7.1 General
7.2 Loans to Mediterranean countries
7.3 Loans to African, Caribbean and Pacific States and
Overseas Countries and Territories
52
52
53
54
55
55
56
58
59
59
59
62
64
67
70
70
72
74
74
74
76

- 6 -
LIST OP TABLES
30
1. Investment in the Community
2. Volume of capital raised on international markets, 1985-86 43
3. International bond issues, by currency 46
4. International bond issues, by geographical zone of issuer 47
5. Trend of borrowing by Community institutions 48
6. Community borrowing in 1986, by currency 50
7. Trend of lending in the Community 52
8. Lending in the Community in 1985 and 1986, by sector and
by instrument 53
9. Geographical breakdown of lending in the Community in 1985
and 1986 57
10. NCI utilization 60
11. ECSC interest subsidies paid out in 1986 72

- 7 -
List of graphs
Graph 1 - Public sector yields on national markets
Graph 2 - Yields on international markets
Graph 3 - Trend of borrowing contracted by the European Community
by instrument (1977-1986)
Graph 4 - Trend of lending in the Community by instrument (1977-1986)
Graph 5 - Breakdowm of loans in the Community in 1986 by instrument
and by sector
Graph 6 - Breakdown of NCI loans in 1986, by country and sector
- 8 -
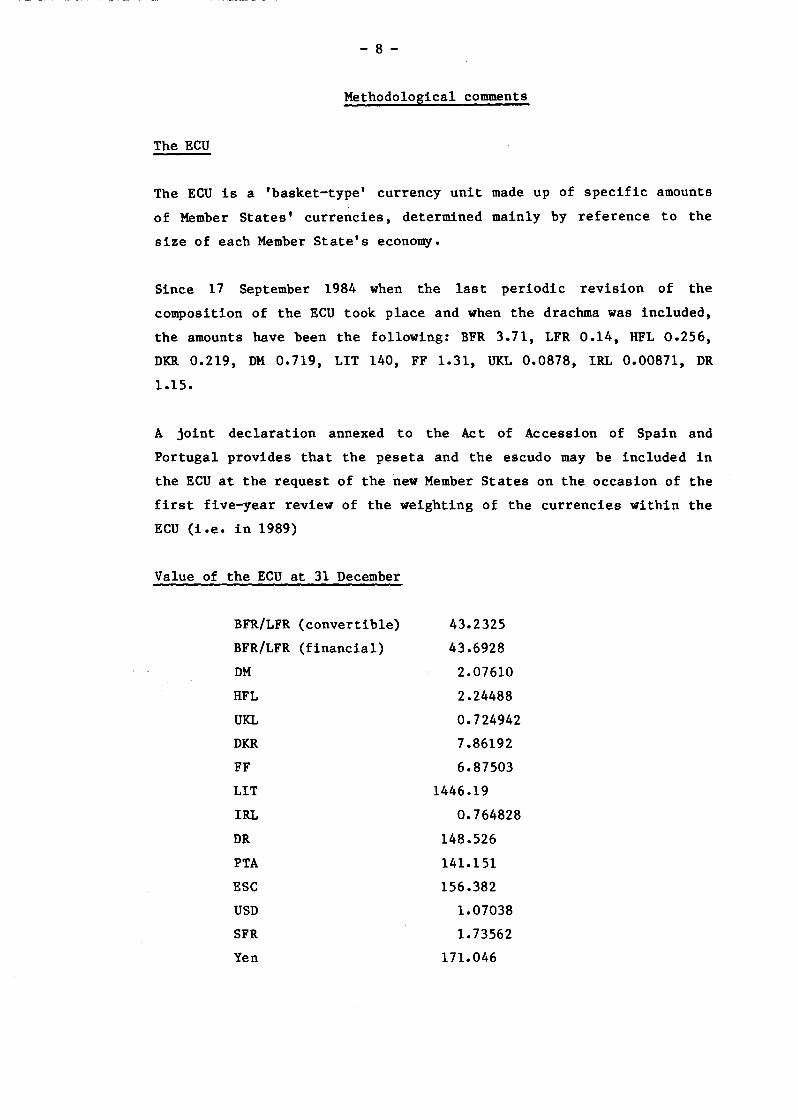
Methodological comments
The ECU
The ECU is a 'basket-type' currency unit made up of specific amounts
of Member States' currencies, determined mainly by reference to the
size of each Member State's economy.
Since 17 September 1984 when the last periodic revision of the
composition of the ECU took place and when the drachma was included,
the amounts have been the following: BFR 3.71, LFR 0.14, HFL 0.256,
DKR 0.219, DM O. 719, LIT 140, FF 1.31, UKL 0.0878, IRL 0.00871, DR
1.15.
A joint declaration annexed to the Act of Accession of Spain and
Portugal provides that the peseta and the escudo may be included in
the ECU at the request of the new Member States on the occasion of the
first five-year review of the weighting of the currencies within the
ECU (i.e. in 1989)
Value of the ECU at 31 December
BFR/LFR (convertible) 43.2325
BFR/LFR (financial) 43.6928
DM 2.07610
HFL 2.24488
UKL 0.724942
DKR 7.86192
FF 6.87503
LIT 1446.19
IRL 0.764828
DR 148.526
PTA 141.151
ESC 156.382
USD 1.07038
SFR 1. 73562
Yen 171.046
- 9-
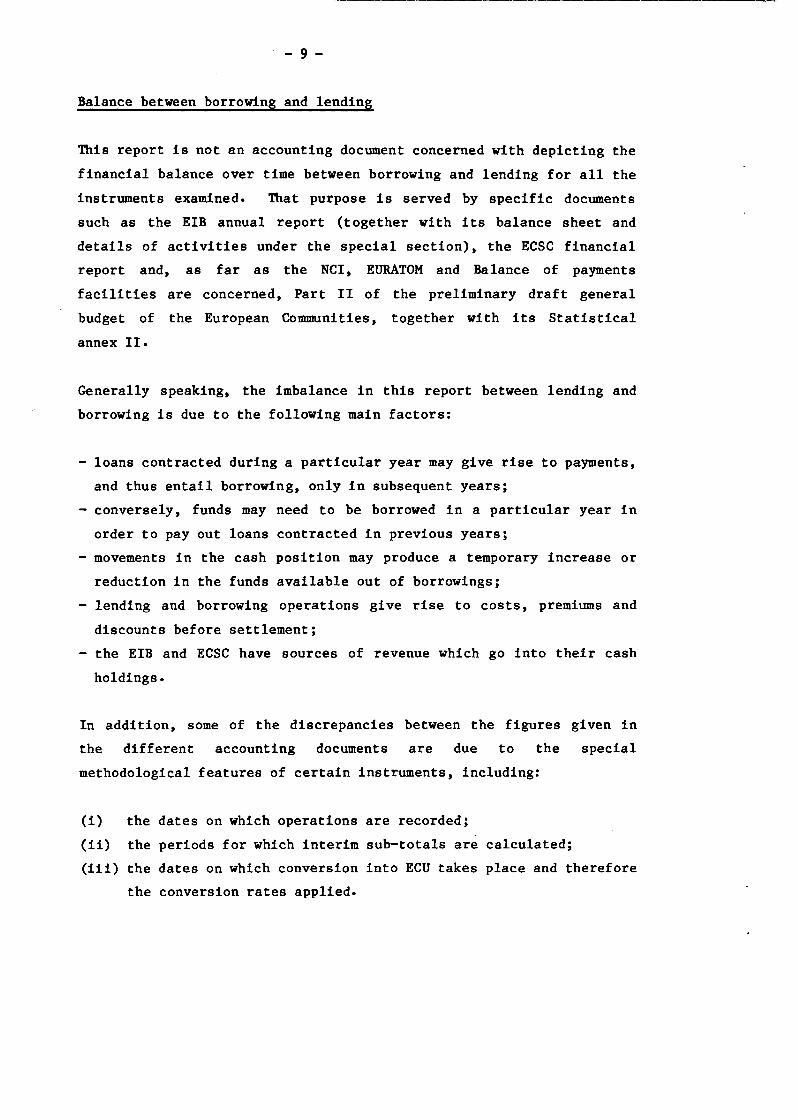
Balance between borrowing and lending
This report is not an accounting document concerned with depicting the
financial balance over time between borrowing and lending for all the
instruments examined. That purpose is served by specific documents
such as the EIB annual report (together with its balance sheet and
details of activities under the special section), the ECSC financial
report and, as far as the NCI, EURATOM and Balance of payments
facilities are concerned, Part II of the preliminary draft general
budget of the European Communities, together with its Statistical
annex II.
Generally speaking, the imbalance in this report between lending and
borrowing is due to the following main factors:
- loans contracted during a particular year may give rise to payments,
and thus entail borrowing, only in subsequent years;
- conversely, funds may need to be borrowed in a particular year in
order to pay out loans contracted in previous years;
- movements in the cash position may produce a temporary increase or
reduction in the funds available out of borrowings;
- lending and borrowing operations give rise to costs, premiums and
discounts before settlement;
- the EIB and ECSC have sources of revenue which go into their cash
holdings.
In addition, some of the discrepancies between the figures given in
the different accounting documents are due to the special
methodological features of certain instruments, including:
(i) the dates on which operations are recorded;
(ii) the periods for which interim sub-totals are calculated;
(iii) the dates on which conversion into ECU takes place and therefore
the conversion rates applied.

- 10 -
Foreword
This is the seventh comprehensive report drawn up by the Commission to
provide the Council and Parliament with information on the Community's
borrowing and lending activities. It covers the year 1985.
It was drawn up to meet the wishes expressed by Parliament on various
occasions, and in particular in its resolution on improving political
monitoring of the Community's borrowing and lending activities (1)
The report reviews all the borrowing and lending activities for
structural purposes (i.e. excluding those intended to support the
balance of payments of Member tates) including those of the ECSC and
the EIB(2). It thus fulfils the Commission's obligation to inform the
Council and Parliament each year about:
- the activities of Euratom, in accordance with Article 4 of the
Council Decision of 29 March 1977;(3)
- the activities of the NCI, in accordance with Article 6 of the
Council Decision of 16 October 1978 (NCI I) (4), Article 6 of the
Council Decision of 15 March 1982 (NCI II) (5) and Article 7 of the
Council Decision of 19 April 1983 (NCI III) (6);
- the Community aid granted by way of exception for the reconstruction
of the regions affected by the Italian earthquake in November 1980,
in accordance with Article 7 of the Council Decision of 20 January
1981 (7);
- the Community aid granted by way of exception for the reconstruction
of the regions affected by the Greek earthquakes in February/March
1981, in accordance with Article 7 of the Council Decision of 14
December 1981 (8).

-11-
Like the previous reports, this report, which covers the 1986
financial year, provides a complete picture of the borrowing and
lending activities for structural purposes of the Community
instruments within the European Community. It reviews not only the
activities of Euratom and the NCI, but also those of the ECSC and, in
brief, those of the EIB.
It also includes loans granted by the EIB in third countries from its
own capital market borrowing and from the Community's budgetary
resources. These loans concern the ACP States, the OCTs, and the
Mediterranean countries linked to the Community through agreements
establishing different forms of economic and/or financial cooperation
(Maghreb and Mashreq countries, Israel, Cyprus, Malta, and Turkey).
The ECSC's financial report and the EIB's annual report will, of
course, be sent to Parliament and the Council as before.

- 12 -
1. Financial change and Community financial engineering
For a number of years, western financial systems have been undergoing
rapid and substantial changes. Although these changes vary in nature
and intensity from one country to another, they nevertheless display
some common features.
The explosive growth of financial markets, which is causing a decline
intraditional bank intermediation, is illustrated by the growing
volume of issues of negotiable securities and the contraction of bank
lending. In the first half of the 1980s the volume of international
loans fell to a quarter of the levels previously reached, declining
from approximately USD 100.000 million to some USD 25.000 million per
year. At the same time, issues of bonds and other securities
quadrupled from USD 50.000 million to almost USD 200.000 million.
While this pattern no doubt reflects the decline since 1982 in
traditional bank intermediation on behalf of the developing countries
as a result of their debt crisis, securitization is also the result of
the changing behaviour of non-financial operators-public and private
borrowers and savers-in response to the changes in the economic
environment.
The slowdown in growth resulting from the oil shocks has added to
economic disequilibria and, given the growing burden of debt interest,
has substantially increased public sector borrowing requirements. In
order to cover those requirements while at the same time limiting the
monetary financing of deficits, governments have had recourse to the
securities markets at both the long end (bonds) and the short end
(Treasury bills and certificates).
The adjustment measures which they have taken have brought into
beingrestrictive monetary policies giving rise to high real interest
rates. ntis rise in rates has led firms to reduce their debts by
cutting their bank borrowing, to increase their equity capital and to
make use of the securities market.

- 13 -
This trend has been encouraged by the public authorities, which have
promoted capital increases through tax incentives or by opening up the
share market to medium-sized companies. As a result, there has been a
decline in firms'need for loan finance.The biggest companies, anxious
to improve their debt management and to cut the cost of their new
borrowing, have been led by the banks'intermediation spreads to tap
the market directly. Their long-term financing requirements have been
covered by bond issues and their short-term needs by the use of
commercial paper.
Like that of borrowers, the behaviour of savers has changed. In many
countries, the investment of savings in property and the loan demand
which it generates, hampered by the high level of real interest rates,
have declined in favour of financial investments. Savers have opted
for products offering the highest rate of market-related return.
Savings invested in shares, bonds or short-term instuments have thus
grown as funds have been switched from demand deposit accounts or
savings accounts. The virtually continuous fall in nominal rates,
which has increased the yield on bond investments, and rising share
market prices have underpinned this trend.
The growth of the markets has been accompanied by
diversification of financing instruments. A whole
securities has been added to traditional shares and bonds.
a growing
variety of
This trend towards financial innovation developed in response to
increasing uncertainty about the economic environment, reflected in
fluctuating inflation, interest and exchange rates. Most of the
innovations have been motivated primarily by the desire to ensure that
risks within the financial system are shared and covered, for
borrowers but particularly for lenders and investors. This desire to
improve risk division and liquidity led to the introduction of
variable rates (first of all in bank lending and then on bond
markets), the opening up-through convertible bonds or bonds with
warrants attached -of opportunities for reviewable arbitrage between
fixed and variable rates and between currencies, the development of
short-term instruments(particularly commercial paper and "billets de
tresorerie", the French variant) and the emergence of various other
products (zero coupon bonds, non-voting shares, etc.).
- 14 -
This trend has been encouraged by national Treasuries, which have been
intent on offering investors attractive investment products such as
renewable and exchangeable bonds in France or Index-linked bonds in
the United Kingdom.
Finally, one of the most striking aspects of the recent changes has
been the decompartmentalization and growing integration of markets.
Decompartmentalization has a sectoral aspect in that it links up
hitherto separate markets: shares and bonds ,the short-term and the
long-term sections,gilts and bank loans. It is reflected in the
despecialization of financial intermediaries as a consequence of
securitization, deregulation and competition. In an effort to
diversify their activities, the commercial banks have moved into the
securities market. Mergers with activity sectors with which they are
henceforth in competition (brokerage, insurance) are being carried out
and are giving rise to single units which provide loans for firms,
undertake investment and look after cash management, thus offering
almost the whole range of banking and financial services.
It is the geographical dimension of this decompartmentalization,
however, which merits particular attention. The trend towards greater
integration of markets is the result of the expansion of world output,
trade, the international activities of firms and the opening up of
domestic markets to foreign financial institutions. However, the vital
catalyst has been the new information technologies. The advances which
have boosted the capacity for and speed of processing and
dissemination of financial information and altered clearing and
settlement techniques have led to the establishment of an operating
round the clock world market. By offering opportunities for instant
arbitrage, the development of decision-making aids using micro
computers has greatly increased transactions and the interlinking of
markets.

- 15 -
1. 2 !h!. Eu!_O.E_ean _d!m!.n.!i£n_:_the _e _!t abli sh_!!e.!!_t _o.f !.n _i .!!_t ,!;.g.!.a _!e~
f i!!_a.!!.c.!_al .!!ark!_t _i.!!_ th!_ CO,!!Jillln!_ tz.
The Community cannot remain aloof from these major developments in
the financial world. It must take part in the internationalization,
globalization and innovation process affecting financial activities
and derive the maximum benefit therefrom by creating at Community
level a competitive and stable financial area which truly serves its
economic development. The large internal market which the Community
proposes to complete by 1992 as stated in the Single Act must be given
its full financial dimension.
Continued progress must be made towards liberalizing capital movements
if an integrated financial market is to be set up in the Community.
Two Council Directives adopted in 1960 and 1962, have hitherto formed
the framework laying down Member States' obligations. They provide
mainly for the liberalization of capital movements directly linked to
the exercise of the other freedoms provided for in the Treaty (direct
investments and personal capital movements linked to freedom of
establishment and the free movement of workers, short- and medium-term
credits linked to trade in goods and services) and the liberalization
of the acquisition by residents of a Member State of securities
(shares or bonds) issued in another Member State and dealt in on a
stock exchange. The process of gradually liberalizing capital
movements then became blocked. The situation even deteriorated in that
many Member States took advantage of the safeguard clause provided by
Article 108 §3 of the Treaty in the event ofbalance-of-payments
difficulties to escape for long periods the liberalization obligations
arising from the Directives.
In 1983, the Commission transmitted to the Council a communication on
financial integration(9) with the intention of reviving Community
discussion of the matter. To help achieve the large internal market,
the liberalization of capital movements was subsequently made one of
the priorities of Community action, with the Commission presenting a
two-phase programme(10) to the Council on 23 May 1986.
-------~-
- 16-
The first phase consists of extending the scope of the liberalization
obligation to all transactions most directly linked to the proper
functioning of the common market or essential for the interlinking of
national financial markets.
This phase was completed in November 1986 with the adoption of a new
Directive(ll) which extends the previous liberalization obligations to
three new categories of capital movement
- long-term credits (five years or more) related to commercial
transactions or to the provision of services in which a resident is
participating; only short- and medium-term credits were previously
liberalized;
- the acquisition of securities not traded on a stock exchange
(shares, bonds or units of collective investment undertakings);
- the admission of the securities of a company from one Member State
to the capital market of another Member State : shares and bonds,
provided that they are traded on or in the process of introduction
to a Community stock exchange; units of collective investment
undertakings subject to the coordinating provisions of the Council
Directive of 20 December 1985 (12).
The new Directive came into force at the end of February 1987. Because
of the transitional period allowed for capital movements by the 1985
Act of Accession, Spain and Portugal have until the end of 1990 and
the end of 1992 respectively to implement it.
Application of this Directive will enable operators to diversify
their investments and their medium- and long-term borrowing. The
liberalization of the acquisition of securities not traded on a stock
exchange should in particular facilitate the movement of equity issued
by small and medium-sized companies. The opportunity given to any
company in a Member State to issue new securities on different
financial markets will be exploited by the promoters of large-scale
European projects in the infrastructure and industrial cooperation
fields.

- ---------·--·-------~ ··------··-----------·-------------------
- 17 -
The Commission has also since 1984 taken a much stricter line on
application of the safeguard clause in Article 108 §3 of the Treaty.
The protective measures previously authorized in France and Denmark
have been completely dismantled and the relaxation of exchange
controls in those two countries already goes beyond Community
obligations. Apart from the transitional arrangements laid down in the
Act of Accession for Spain and Portugal, three Member States-Italy,
Ireland and Greece-are currently benefiting from a safeguard clause
which has been strictly limited in scope and duration.
The second phase recommended by the Commission in its 1986 programme
should permit the principle of complete liberalization of capital
movements to be established. This would therefore also cover financial
loans and credits (including those granted in national currencies to
non-residents), transactions in mon~y market instruments and the " I
building up of deposits and liquid assets in foreign currencies. Such I
transactions are currently liberalized) only in the Federal Republic of I I
Germany, the United Kingdom, the/~etherlands and,subject to the
constraints of a dual foreign exchange market, Belgium and
Luxembourg. The Commission is currently examining the implications of,
and the conditions for,achieving this complete liberalization of
capital movements and is shortly to transmit its initial conclusions
to the Council and to Parliament. The preparatory work should continue
until the autumn of 1987, with the Commission planning to present
further proposals to the Council before the end of the year.
While the free movement of capital is an essential pre-condition of
financial integration in the Community, it does not alone suffice. An
integrated financial area which is more than simply a free trade area
must also have two other vital features.
Firstly, if trade is to grow within that area, it must be sustained by
stable exchange rates between the Member St'ates' currencies.
Arrangements must therefore be made for a Community response to the
extra constraints imposed on coordination of economic and monetary
policies by complete liberalization of capital movements, without
compromising rigorous application of the European Monetary System.

- 18-
Secondly, Community residents should be able to establish relations with
each other within a regulatory and prudential framework which is as
uniform as possible. In keeping with the guidelines and measures set out
by the Commission in the White Paper on completing the internal
market,(13) further progress must therefore be made in harmonizing the
national rules and regulations applied to the exercise of national
activities (activities of credit institutions and insurance companies,
operation of securities markets, the taxation of savings, etc.). At the
same time, steps must be taken at Community level to guarantee proper
protection for savers, to maintain fair conditions of competition
between financial institutions and to ensure the stability of the
financial system.
'lbe Commission has been working on an approach - similar to that
developed by the Member States - towards refashioning the Community's
assistance methods so as to adapt them better to the Community's
priority needs.
On 9 December 1986 it adopted a communication on fitiant:ial engineering
(14) which explains its initiative.
Financial engineering at Community level means adapting to a new
financial context and meeting new needs.
'Ibis context and these needs are as follows:
• the concern of national authorities to limit their budgetary
commitments;
• the constraints on the Community budget;
• the abundance of readily available private capital, which is all too
frequently invested in purely financial transactions;
• the necessity of improving the channels through which savings pass in
the Community;
- 19-
• the need for cohesion, which has become even greater with
enlargement and which requires the Community to refashion the
methods and tools it uses to provide structural assistance. In its
communication "Making a success of the Single European Act",(15) the
Commission explained the steps it intends to take to reinforce the
effectiveness and coordination of the Community's structural
instruments.
This context and these needs call for a redistribution of the
financing roles played by the public and private sectors. Financial
engineering must encourage the market to create or develop instruments
or mechanisms for facilitating the financing of measures or projects
to which the Community attaches particular importance and which are
not spontaneously or adequately financed through the market.
To achieve this, Community action must exert a catalytic, multiplier
and leverage effect while being sparing with budget resources.
1. 3. 1 The tools
In order to provide firms with the financial products and services
they need, the Commission intends to promote the use in Europe of a
range of instruments and mechanisms with the aim of:
- enabling a greater volume of funds to be lent for priority
investment by small-and medium-sized enterprises;
- improving the provision of equity capital by providing inducements
to set up investment companies (e.g. high-technology projects);
- helping set up guarantee funds to encourage the temporary
acquisition of equity investments in innovative projects;
- facilitating the change of conventional EIB loans into limited
recourse loans (large-scale infrastructures); this new form of EIB
activity will be made possible through guarantees based on the
Community budget;
- helping large-scale ComDUnity projects raise adequate volumes of
capital by making a budget contribution in the form of equity
capital; this is designed to trigger the assembly of financf:al
packages;
- 20 -
- helping establish service agencies {mainly financial services but
also consultancy, help with setting up abroad, finding partners);
- signalling a political priority conferring a number of advantages
{"declaration of European interest" for large-scale projects).
This is the set of tools that the Commission plans to use in devising
tailor-made solutions that meet the new needs for investment funding
in the Community.
These tools have the following features in common:
- they require little in the way of budget resources;
- they meet funding needs which are insufficiently met by the market;
- they make maximum use of the Community dimension;
- they seek systematically to promote private funding by employing the
"Community multiplier" effect.
They do not constitute an end in themselves but rather a means of
helping to achieve the Community's major objectives.
The following three priority areas have been singled out : small- and
medium-sized enterprises, high technology and large-scale
infrastructure projects of European interest.
1. 3. 2 .!P.E.lic.!,tio.!!. _!o _lar.le.:.s.£8le _inf!,a_!t _!U£_t~.!:, .E.r~j.!:.c!_s_of Eu!,O.E,e,!.Il
interest
Large-scale infrastructure projects of European interest will serve as
the first illustration of the new Community approach, since they were
the subject of the Commission's first proposals. The Commission
adopted a communication and a proposal for a Council decision in this
field on 9 December 1986.(16).
There are three reasons why Community assistance of the financial
engineering type is appropriate for infrastructure projects.

- 21-
The first is to do with the existence of a number of large-scale,
frequently transnational, infrastructure projects in Europe which are
being held back by numerous difficulties. These include the
Paris-Cologne high-speed train link, the Milan-Ulm rail link via the
Spluga tunnel, the road and rail links with Scandinavia (Scanlink),
the planned broadband telecommunications network, the cleaning up of
the North Sea and the Mediterranean (an environmental project) and the
building of the Severn dam in the United Kingdom (an energy project).
Community assistance could help to get these projects underway.
It would be all the more justified because all of these projects will
benefit the Community.
These projects would contribute to the unification of the internal
market by facilitating trade and reducing its cost. They would
constitute a major factor in moves to integrate the outlying regions
and would reinforce Community cohesion through the multiplier e.ffect
they would have on the economic development of those regions. They
would also improve the competiveness of European industry.
Finally, one of the obstacles facing these projects is their very high
cost:between 20.000 million ECU and 30.000 million ECU in total.
Financing on this scale is difficult to provide, not only because of
the sums involved but also because of the substantial risks and
delayed return of infrastructure projects. Account must also be taken
of the new financial context in Europe, which is characterized by the
concern of national authorities - which have traditionally played an
important part in financing infrastructure projects - to limit their
financial involvement, whether directly in the form of grants or
indirectly in the form of government guarantees.
It is therefore appropriate that the Community should seek, by
developing new financial engineering formulae, to channel private
capital towards the funding of these large-scale infrastructure
projects.

- 22-
The role which the Commission proposes the Community should play would
be twofold:
- to provide the requisite conditions for large-scale projects to
emerge and be launched;
to mobilize the market through a new form of Community
assistance.
Providing the requisite conditions for large-scale projects to emerge
and be launched.
The following three types of assistance are envisaged
- A budget contribution to preparatory studies.
Before large-scale infrastructure projects can be carried out, their
technical and financial viability must be demonstrated. This will
determine whether or not the private sector becomes involved.
The feasibility studies, analyses and other preparatory work
involved in this phase entail high costs and risks, particularly as
they may lead to the abandonment of the project.
The Community would aim to play a pump-priming role and to lever
finance from the private sector by making a contribution from the
Community budget to such studies.
- A "declaration of European interest"
Projects in respect of which such a declaration is made are given a
special dimension and prominence and will receive political support
from the Community. Selected projects would benefit from special
advantages: an improved financial environment, specific loans from
the EIB and a Community budget contribution to their financial
launching. This declaration will be made by the Commission.
To qualify, projects will need to comply with the objectives and
criteria laid down by the Community programmes for the sectors·· to
which they relate, such as the medium-term transport infrastructure
programme (17) presented in June 1986.
------------ ------- -----------------------
- 23-
- A Community contribution to the initial financing of projects.
Such contributions would be made in the form of equity capital
injections through repayable advances financed from the Community
budget.
The raising of a large volume of equity capital is particularly
suited to large-scale infrastructure projects. It helps to limit the
level of debt during the construction period and to tailor loan
repayment more closely to the pace at which cash flow is generated.
It also signals the project's viability to the banking and financial
markets.
Mobilizing the market through a new form of assistance
The "project financing" technique bases reimbursement to lenders
exclusively on the cashflow generated by the project. The loan
guarantee relates to the assets of the project and not to those of the
promoter.
Such a technique is particularly suited to the financing of
large-scale infrastructure projects of European interest for which
promoters and Member States are not willing or able to provide
first-class security.
The Community should therefore be able to contribute to the financing
of such projects by means of similar techniques.
Community loans ,and particulary those granted by the EIB, must be
backed by first-class guarantees.
A formula must therefore be found which makes it possible to ask the
EIB to offer limited recourse loans to the promoters of projects
declared to be of European interest, with repayment backed solely by
the revenues of the project.
The formula proposed by the Commission is to grant an appropriate
guarantee under the Community's general budget.
- 24-
The Community budget guarantee would be limited and conditional. It
would be granted on a case-by-case basis by the Commission and would
be tailored to the type of project concerned and the financial
package. It would be subject to an overall ceiling set by the Council,
which would decide to raise it on a proposal from the Commission.
The effectiveness of all of these measures could be increased if steps
were taken:
- firstly, to improve the environment for private investors;
- secondly, to streamline the decision-making and financial process
for large-scale infrastructure projects.
The Commission therefore also looked into these aspects in its
communication. It put forward a number of ideas, including the
granting of "most favoured security'' status to securities issued by
the promoters of large-scale projects, the adoption of a technique
similar to that of tax-exempt bonds in the United States and the
setting up of a European infrastructure agency modelled on the United
States "Autliorities".
Financing small- and medium-sized enterprises.
The Commission has explored a number of new approaches to this
problem. A few years ago, it embarked upon some decidedly innovative
measures: the financing of innovation and the development of a
genuinely European venture capital activity.
It has thus instigated and given financial backing to the setting up
of an association representing the main Europ~an venture capital
companies: the European Venture Capital Association (EVCA). With the
help of that association, it has also launched an experimental
programme ("Venture Consort") designed to facilitate the financing of
innovation in SMEs, if possible through transnational cooperation.
Drawing on its budget resources, the Community supplements the equity
capital provided simultaneously to a SME by EVCA member companies.
- 25-
At regional level, the Community is to use its budget resources to
help finance the following two main types of action in areas covered
by the Integrated Mediterranean Programmes, where venture capital
activitiy is inadequate:
- the setting up or extension of funds for guaranteeing capital
holdings, the aim being to encourage this type of investment by
reducing the risks of loss run by tnvestors;
- extension of the acquisition of holdings in the equity capital of
SMEs situated in IMP areas through the medium of investment
companies already existing or being set up.
The EEC credit institutions specializing in long-term credit have
decided, in consultation with the Commission and the EIB, to set up a
European Financial Engineering Company (EFEC) (18). This company which
was formally set up on 10 April 1987, is to provide support for SME
initiatives, particularly those of a transnational nature,
involving high-tech or innovative projects. Its activity will be
centred on the promotion of initiatives, the study of business plans,
assistance with implementing such plans, the integration of financial
services and support for launching initiatives. The Commission and the
EIB are to provide financial assistance during the start-up period.
The task now is to continue and to expand these measures, which are
aimed: at increasing the supply of funds lent to help finance SMEs'
investment; at providing access to credit for firms whose financial
standing is too low to provide the necessary security (development of
mutual guarantee schemes); at increasing the equity capital of SMEs
(promotion of European venture capital activity) or at providing them
with the financial and other services they need in order to grow.
Some of these measures can be extended beyond the territory of the
Community so as to step up investment by SMEs in third countries,
particularly in the form of joint ventures. Work on this is already
underway in the context of the cooperation agreements concluded with
the ASEAN and southern Mediterranean countries(19).
- 26-
Financing high technologies
Equity capital is the best form of finance for projects that are
situated midway between research and industrial application. Yet the
provision of equity capital is particularly difficult to organize if
the project is the result of international cooperation and if it is a
long way back in the chain which runs from research to industrial
application. Wide-ranging joint research programmes are being
part-financed by the Community or undertaken with its collaboration
within a broader framework such as EUREKA. The projects making up
these programmes are at the research stage or at the pre-competitive
development stage, for which grants are the appropriate form of
finance since their success is too uncertain. Against this, no
specific mechanism exists for projects that represent the industrial
follow-up to those programmes.
To overcome this particular difficulty, the Commission has sounded out
the financial community and professional circles and has found
confirmation of the relevance of new financial packages. These would
be base on the setting up of investment companies (EUROTECH CAPITAL),
with exlusively private capital, and the establishment of a guarantee
scheme (EUROTECH INSUR) that would be publicly and privately funded
and would back up the EUROTECH CAPITAL companies. These suggestions
have met with a favourable response and the Commission will soon put
forward proposals for instituting the guarantee scheme.

- 27-
2. Investment in the Community
Community GDP increased by 2.5% in real terms in 1986 and growth is
now being sustained by domestic demand.
Exports performed disappointingly in 1986, growing by only 1. 7% in
volume compared with 5.6% in 1985. The reasons lie in contracting
demand for industrial products from the oil-producing countries; slow
growth of imports by the non-oil developing countries due to financial
difficulties connected with their external debt, depressed raw
material prices and lack of foreign currency; and the loss of price
competitiveness suffered by Community exports.
The sluggish performance of exports-compared with that of imports,
which increased by 6.5% in volume - was offset by the buoyancy of
domestic demand, and particularly of two of its components: private
consumption and investment in plant and machinery. Private consumption
increased by 3.8% in real terms and gross fixed capital formation by
3.4%. While investment in construction picked up in 1986 (+2.4%) after
having declined in 1985, it is expanding at only a moderate pace. The
main engine of growth remains investment in plant and machinery.
Because of the relatively modest pace of growth, the number of jobs in
the Community has so far been merely stabilized. Continued investment '
growth, !which -the Commission recommends as part of its cooperative
strategy,(20) is essential if the job losses caused by an excessively
low level of investment in the second half of the 1970s and the early
1980s are to be made up.
'11te aggregate investment ratio in the Community is still some 4
percentage points below the level reached before the first oil shock.
Only an increased effort will raise production capacity and create new
· jobs.
·--~----··--··- ----·----------------
- 28-
A number of the determinants of investment are performing
favourably. 'nle average return on the capital stock is increasing,
although it is only in Germany that it is almost back to its pre-oil
shock level.The degree of utilization of productive capacity is
growing rapidly in all Community countries. 'nle decline in nominal
interest rates is continuing and is helping to modify the return on
financial investments in favour of that on productive investment.
These positive developments should help to remove any lingering
uncertainties about the trend of demand.
2.2 Investment in the Member States
In 1986, investment growth was strongest in Denmark (+12.8%), Spain
(+8.4%),Portugal (+8%), the Netherlands (+7.1%) and Belgium (+5.3%).
In Denmark, the marked improvement in business profitability, the
healthier budget which has facilitated the financing of firms, and the
resultant sharp fall in interest rates all contributed to the
continuing growth of investment. Activity in building and
construction, however, while still at a high level, is showing signs
of weakening.
In Spain, GFCF benefited from the favourable effects of improved
profits, better sales prospects and the necessary industrial
modernization triggered by accession. Business profits, which had
fallen to a relatively low level since 1980, recovered and were
boosted by tax measures. Steps were taken in March 1986 to stimulate
saving and investment.
After showing a cumulative fall of 25.5% in real terms during the
preceding three years, investment in Portugal picked up in 1986 thanks
to the improved financial position of firms, to the measures taken to
boost productive and residential investment and to the public
investment programmes. The recovery of investment has been the
priority objective since 1985.
- 29-
In the Netherlands, investment grew briskly despite the weak trend of
housing demand and public investment. In 1986, falling interest rates
reinforced the stimulatory effect which improved business
profitability is having on investment.
In Belgium, investment growth has been mainly generated by the
business sector. Firms' profit margins, profitability and financial
positions improved in line with the reduction in real wage costs which
has resulted from the policies pursued since 1982. Firms also
benefited from the further reduction in corporation tax and the fall
in interest rates.
Investment also grew in France (+3.5%), in Germany (+3.1%), in
Luxembourg(+3%) and, to a lesser extent, in Italy (+2.1%).
In France, the upturn in investment continued and spread to the
distributive trades and services. The improvement in firms' financial
positions should make it possible to correct the inadequate level of
investment recorded for many years in the competitive sector and the
unsatisfactory sectoral distribution of that investment.
- 30 -
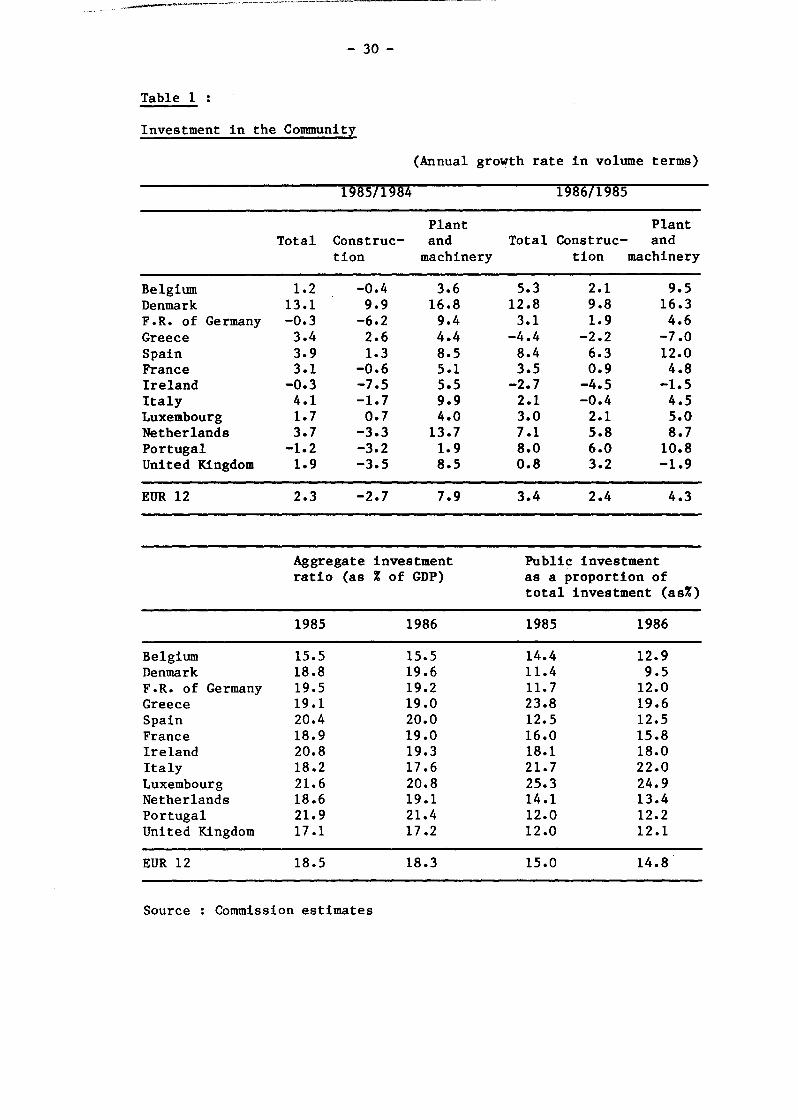
Table 1 . . Investment in the Community
(Annual growth rate in volume terms)
1~8571~84 198671985
Plant Plant Total Construe- and Total Construe- and
tion machinery tion machinery
Belgium 1.2 -0.4 3.6 5.3 2.1 9.5 Denmark 13.1 9.9 16.8 12.8 9.8 16.3 F .R. of Germany -0.3 -6.2 9.4 3.1 1.9 4.6 Greece 3.4 2.6 4.4 -4.4 -2.2 -7.0 Spain 3.9 1.3 8.5 8.4 6.3 12.0 France 3.1 -0.6 5.1 3.5 0.9 4.8 Ireland -0.3 -7.5 5.5 -2.7 -4.5 -1.5 Italy 4.1 -1.7 9.9 2.1 -0.4 4.5 Luxembourg 1.7 0.7 4.0 3.0 2.1 5.0 Netherlands 3.7 -3.3 13.7 7.1 5.8 8.7 Portugal -1.2 -3.2 1.9 8.0 6.0 10.8 United Kingdom 1.9 -3.5 8.5 0.8 3.2 -1.9
EUR 12 2.3 -2.7 7.9 3.4 2.4 4.3
Aggregate investment Public investment ratio (as % of GDP) as a proportion of
total investment (as%)
1985 1986 1985 1986
Belgium 15.5 15.5 14.4 12.9 Denmark 18.8 19.6 11.4 9.5 F .R. of Germany 19.5 19.2 11.7 12.0 Greece 19.1 19.0 23.8 19.6 Spain 20.4 20.0 12.5 12.5 France 18.9 19.0 16.0 15.8 Ireland 20.8 19.3 18.1 18.0 Italy 18.2 17.6 21.7 22.0 Luxembourg 21.6 20.8 25.3 24.9 Netherlands 18.6 19.1 14.1 13.4 Portugal 21.9 21.4 12.0 12.2 United Kingdom 17.1 17.2 12.0 12.1
EUR 12 18.5 18.3 15.0 14.8
Source Commission estimates

- 31-
In Germany, business investment was underpinned by a further rise in
profits. "nte renewed growth of productive capacity led to an
appreciable increase in non-residential construction.
Investment in residential construction, by contrast, showed a less
favourable trend because of demographic factors and the disparity
between the trend of building costs and that of incomes, which is
strengthening the tendency for demand to slacken. The crisis in
construction has been aggravated in recent years by the fall in public
investment, particularly at local authority level, caused by budgetary
consolidation measures. Since 1985, however, public investment has
begun to grow again and measures have been taken to promote urban
renewal, the development of infrastructures and the protection of the
environment.
In Luxembourg, where economic activity has remained at a high level,
measures to diversify the economy were continued in the form of
selective action to help new firms.
In Italy, business profits benefited from the fall in import prices
and the appreciable easing of production costs. The financial
structure of enterprises also improved as a result of savings flowing
into equities and of the further improvement in the situation of those
public sector branches in deficit.
In the United Kingdom, by contrast, the growth of investment has
slackened over the last two years probably as a result of the
relatively sharp increase between 1982 and 1984 and the continuing
high level of real interest rates.
Business profitability has improved appreciably despite the continued
rise in real wages, thanks to a higher rate of productivity growth and
to a fall in non-wage costs. In 1986, however, business profits fell
overall owing to the worsening profits situation in the oil sector and
despite the continued improvement in other sectors.
(3)
- 32 -
The level of investment fell in Ireland and Greece.
In Ireland, private sector investment in plant and machinery has
contracted since reaching the peak of the replacement cycle in
1984-85. The overall recovery in business profits in recent years is
due mainly to foreign firms; national firms must consolidate their
results before new investment can be undertaken. In 1986, the high
level of real interest rates more than made up for the tax benefits
enjoyed by firms borrowing from banks. There were few signs of an
upturn in construction and public sector investment continued to
decline.
In Greece, public sector investment fell and the budgetary constraints
affecting public enterprises are casting doubt on any upturn
in investment in plant and machinery.
Industrial investment is maintaining its role of stimulating gross
fixed capital formation and growth in the Community.
According to the findings of the investment survey carried out in the
Community at the end of 1986, industrial investment spending increased
by 9% in 1986 (i.e.by about 5% in real terms). With private
consumption feeding the upturn, the increase was strongest among
manufacturers of consumer goods.On average, investment is still
growing at an appreciable rate, albeit below that forecast. The
sluggish economic trend in the second half of 1986 and the rapid
depreciation of the dollar probably caused many firms to cut their
planned spending on investment.
Investment increased by 14% in the processing industries (textiles,
wood,paper, plastics, etc.) and by 13% in the mechanical and
electrical engineering and basic products industries.

-----------------·-·---------------
- 33 -
By contrast, the European food industries increased their investment
by only 2%, while investment in the metal working industries fell by
4% owing to the gloomier economic outlook and a further inescapable
reduction in capacity in the steel industry. The investment cutbacks
in this latter sector occured mainly in the Federal Republic of
Germany, France, the United Kingdom, Denmark and Greece.
Industrial investment in 1987 is expected to increase by roughly the
same amount as in 1986 (9% in nominal terms, 6% in real terms). While
this is a less buoyant trend than in the period 1984/85, the level of
real investment in 1987 should be a quarter higher than the level
recorded in 1984. Nevertheless, the persistently low level of
investment in the early 1980s and the associated job losses have not
yet been made good and a rapid growth of investment is therefore still
necessary.

- 34 -
3. Developments and decisions relating to the borrowing and lending
instruments in 1986
On 7 June 1985,(21) the Commission had proposed that the activities of
the New Community Instrument be continued by providing for a new
programme of loans amounting to 1500 million ECU (NIC IV) to be used
for financing productive investment projects carried out by small and
medium-sized enterprises, particularly projects involving the
application of new technologies and innovation.
Three new features were introduced to ensure that the lending
arrangements were better suited to such investment projects and to
SMEs:
- the financing base was to be extended to cover certain types of
intangible assets directly connected with the investment projects
concerned, such as patents, licences, know-how, computer software
and research and development expenditure. This extension was in
response to the rise in intangible investment throughout the
Community and to the resultant new financing requirements (see box);
- the possibility of permitting deferment of interest payments - and
not only of repayment of the principal - was to be introduced;
- financial intermediaries were to be able to pass on to firms the
funds made available either in the form of loans or in the form of a
capital contribution, with the financial intermediary being
responsible for servicing the loan and for the associated risk in
both cases.
On 17 November 1986, the Council endorsed the essential object of the
Commission proposal, i.e.that an amount of 1500 million ECU should be
made available to small and medium-sized enterprises in the form of
loans.
--------------------
- 35-
To this end, the Council decided:
- to provide 750 million ECU through NCI IV;
- to request the European Investment Bank to provide 750 million ECU
from its own funds, on the understanding that the EIB loans would
have the same scope and would be made on the same conditions as
those provided for in the NCI IV Decision.
On 8 December 1986, in line with that agreement, the Council approved
as a common position the decision to adopt a figure of 750 million Ecu
for NCI IV. It also formally requested the EIB to make 750 million Ecu
available to SMEs from its own resources. The EIB's Board of Governors
responded favourably to that request in February 1987.
Parliament requested a conciliation meeting, which took place on 9
March 1987 and produced an agreement. This was the subject of a formal
Council decision on the same date(22).
3.2 Euratom
Following the raising of the ceiling for Euratom borrowing, decided on
by the Council on 5 December 1985 (23), the Commission is now
empowered to contract loans up to a total of 3000 million Ecu in
principal for the purpose of contributing to the financing of nuclear
power-stations and industrial fuel cycle installations.
The granting of Euratom loans, which had slowed in 1985 as the line of
credit authorized by the Council was used up, was stepped up
substantially in 1986, reaching its highest level ever.
In 1986 the Commission continued to pursue its industrial conversion
policy in accordance with Article 56 of the Treaty. However, it
decided on 16 July to adjust the interest-subsidy rates for loans to
take account of the substantial fall in interest rates on capital
markets. The rate was thus cut from 5% to 3% for global loans and from
- 36-
3% to 2% for direct loans. One of the effects of this was to place the
Commission in a better position to meet increased demand in this
sector within the limits of the budgetary resources currently
available.
With regard to industrial loans, 1986 saw the carrying out of the
first operations designed to promote the consumption of Community
steel.
With regard to subsidized housing, 1986 was the first year of
application of the second instalment of the lOth programme (1986-88).
However, almost all the payments made during the year related to loan
contracts concluded under the first instalment.
The accession of Spain and Portugal to the Community has had a marked
effect on the EIB, both at institutional level (the participation of
two new Member States in its decision-making and management bodies,
contributions to the Bank's capital) and on the operational front (the
EIB will no longer operate in these two countries under the
pre-accession aid agreements but on the same basis as in the other ten
Member States, i.e.without pre-determined limits on the amounts which
may be lent).
The Bank continued to pursue its activities in the Community of Twelve
on the basis of the objectives set out in Article 130 of the Treaty of
Rome and spelt out in greater detail by its Board of Governors in the
context of Community policies. The Bank gave priority not only to
regional development but also to projects in the energy sector, to
advanced technologies, to environmental
infrastructure projects of Community interest.
protection and to
·-·------~---~-------~----·--·-------------
- 37 -
Following the Council's request to the Bank to make available 750
million ECU from its own resources for loans meeting NCI IV
objectives, the Bank's Board of Governors authorized the Bank on 25
February 1987 to accept the mandate to administer NCI IV and to grant
loans for projects carried out by SME's outside areas in receipt of
regional aid.
Outside the Community, the year was marked by the entry into force of
the third Lom~ Convention and the committing of the bulk of the funds
available under the. second financial protocols concluded with the
Maghreb and Mashreq countries and Israel.
So as to be able to deal with the increase in EIB financing from the
EIB 's own resources in the years ahead, while at the same time
maintaining a first rating on the capital markets, the Board of
Governors had decided to double the Bank's capital with effect from 1
January 1986. This increase, which took account of the contribution of
Spain and Portugal and the alignment of Italy's contribution on those
of Germany, France and the United Kingdom, brought the subscribed
capital to 28.800 million Ecu. The outstanding amount of loans and
guarantees can thus total 72.000 million Ecu.
- 38 -
Financing intangible investment
1. Expansion of intangible investment
With growth slackening and rapid technological change intensifying competition on domestic and export markets, firms are obliged to sharpen their competitive edge. Technology is of paramount importance here. Its development and application hold the key to a firm's future. However, technology alone is not sufficient. It must be accompanied, within an overall strategy, by efforts to train the workforce and to promote products.
Firms, therefore, have had to step up spending on intangible investment increasing its share relative to their physical investment. This has meant higher expenditure on R&D, vocational training, marketing, software, licences, patents, know-how, etc.
No comprehensive analysis has yet been made of total investment -tangible and intangible - at microeconomic, sectoral or macroeconomic level. France seems to be virtually the only country where research has been undertaken to identify and measure the intangible component of investment, defined there as the sum of spending on R&D, marketing, vocational training and information technology. It is reckoned at the moment to be equivalent to over 40% of gross fixed capital formation and will probably grow four times faster than tangible investment over the next five years.
Proper use of the latest technology confers a decisive advantage in competition on domestic and export markets. R&D spending affects external trade in a variety of ways, notably through the balance on patents and royalties and through technical cooperation.
Training performs three main roles :
- it provides the workforce with the skills needed to adapt to changes in a firm's plans, thereby boosting productivity;
- it permits the acquisition of new knowledge in a changing industrial world;
- it fosters development of the individual skills that make it easier for workers to change jobs more frequently in reponse to modernization.
Spending on marketing relates to a range of coordinated activities (market surveys, product definition, promotion, advertisirtg, mobilization of sales force) that help to find a market for and increase the sales of a particular product or service.
Such spending is expected to go on expanding in response to the growing role of advertising in firms' business strategies and to the spread and strengthening of sales networks abroad.
-------- ------------------------------
- 39-
The growth in spending on software is also expected to continue as information technology advances by leaps and bounds and prices of components fall. Intangible investment linked to information technology is bound to expand further because of :
- the on-going computerization of the various functions of a business (design, production, commercial management) using what have already become traditional tools;
- and the development of new techniques (artificial intelligence, electronic banking, automated manufacturing and other computer-assisted techniques, software engineering).
Both developments will also be assisted by technological progress incorporated in equipment (miniaturisation, computing power) which is opening up new horizons.
The following information, which is no more than illustrative, is based on the findings of a survey conducted among a numer of large financial institutions in the Community.
At the moment, intangible investment is reckoned to be equivalent to between 30% and 40% of tangible investment in the Community, with probably a higher percentage in the high-technology sectors and the service sector.
This new pattern of investment does, of course, raise the question of how it is to be financed. Steps should, therefore, be taken to ensure that intangible investment is financed in the appropriate manner and the financing procedures adapted where necessary.
2. Financial practice in the Community
Accounting rules and practices may be an obstacle to the financing of intangible investment.
Although an asset is customarily defined in terms of its ability or potential to generate services or profits for the entity owning or controlling it and although intangible investment satisfies this definition, it is rarely shown on the assets side of a company's balance sheet.
Intangible investment is classified as expenditure not so much because it lacks physical substance but because of the uncertainties and difficulties involved in estimating the profits it will generate and because of the problems associated with determining its intrinsic value.
As a general rule, intangible investment undertaken by a company itself is regarded as expenditure whereas a more flexible approach is adopted if it is obtained by way of acquisition. This inherently conservative practice ensures the consistency and uniformity of business accounts and varies from one country to another.

All the financial aforementioned survey intangible investment.
- 40 -
institutions questioned as part of the are able, to differing degrees, to finance
Basically, three approaches are followed:
- Under the most liberal approach, the cost of intangible investment is regarded as forming part of a company's overall net borrowing needs. It is followed by institutions that finance companies and not projects. For them, the nature of the investment, whether tangible or intan~ible, is irrelevant;
- The second approach applies the technique of project financing to intangible investment. Only intangible investment directly linked to a tangible investment project and indispensable to its success is considered eligible for mediumrterm or long-term financing. A project may not consist solely of intangible investment and financing of the latter in isolation is precluded. In some cases, the intangible investment eligible for financing must not exceed a certain percentage (15%-20%) of the overall cost of the project and capitalization of the items financed in this way must be permitted by law.
However, some financial institutions that have opted for this approach can, in some cases, especially when it is a matter of financing innovation, finance a wider range of intangible investments even where these are not directly linked to tangible investment projects and can even finance intangible investment on its own.
- Under the third approach, the ways in which financial institutions may finance intangible investment are laid down by law. In this case it is possible to finance such investment separately from tangible investment.However, the law gives very precise definitions of the categories eligible :
• either by stipulating that financial institutions may finance only non-physical assets that may be capitalized under accounting law;
• or by authorizing financial institutions to provide finance only as part of specific programmes covering a clearly defined number of non-physical assets.
Leaving aside R&D and the acquisition of new technologies, the categories of non-physical assets that may be financed vary from one Member State to another.

- 41 -
The term for which loans are made by financial institutions towards intangible investment differs according to the approach applied. Institutions financing such investment on its own make loans whose term generally ranges from 2 to 6 years or, more rarely, depends on the economic life of the investment if this can be estimated. Institutions applying a project-financing approach help to finance non-physical assets on the same terms as the tangible investments to which they are directly linked.
Financing of intangible investment is also hampered by problems of loan guarantees. While some non-physical assets such as patents, licences and know-how can be realized and hence used as security for a loan, this is not the case with most other forms of intangible investment. The practice generally followed by financial institutions in the case of intangible investments consists in securing the loans through a claim on the company's physical assets or accepting any other form of security, notably a bank guarantee.
On the whole, although financial institutions in all Member States finance intangible investment to differing degrees, the conditions under which they do so need to be improved. In other words, intangible investment is not yet regarded as being investment in the full sense of the word. Financial practice in Europe should in future be more closely tailored to the new pattern of investment.
- 42-
4. Borrowing
4.1 Situation on capital markets in 1986 ------------------4.1.1 General
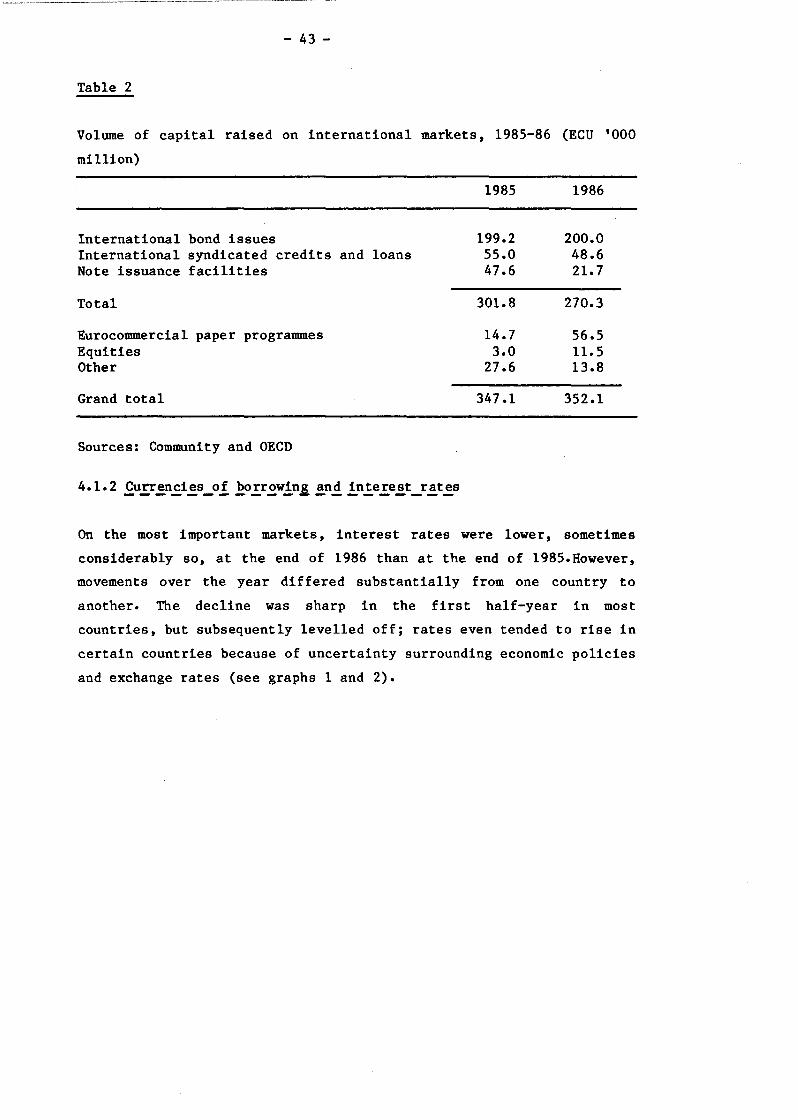
The volume of funds raised on international capital markets once again
expanded vigorously in 1986, although at a slower rate than in 1985.
The scale of the expansion - due among other things to increasingly
close integration of markets - is not fully reflected in Table 2, for
whereas aggregates are expressed in ECUs a major share of
transactions was in fact denominated in dollars, a currency that
depreciated sharply in 1986. Measured in dollars, borrowing increased
by over 30%.
For some years, the bond market has been by far the most active sector
of the capital market. Among the other instruments, the most
spectacular increase has been in Eurocommercial paper (ECP) and, to a
lesser extent, Euroequities. Syndicated credits were more or less
static in relation to 1985, while note issuance facilities (NIFs)
contracted sharply.
The predominance of such instruments as bonds, ECP and Euroequities is
due to massive calls on the markets by prime quality borrowers (public
sector and private sector), who can approach investors direct,
by-passing the banks; the vast majority of borrowers raising funds
through bond issues are nationals of OECD countries.
-~-------··---- ------- ---------------------
- 43-
Table 2
Volume of capital raised on international markets, 1985-86 (ECU '000
million)
International bond issues International syndicated credits and loans Note issuance facilities
Total
Eurocommercial paper programmes Equities Other
Grand total
Sources: Community and OECD
1985
199.2 55.0 47.6
301.8
14.7 3.0
27.6
347.1
1986
200.0 48.6 21.7
270.3
56.5 11.5 13.8
352.1
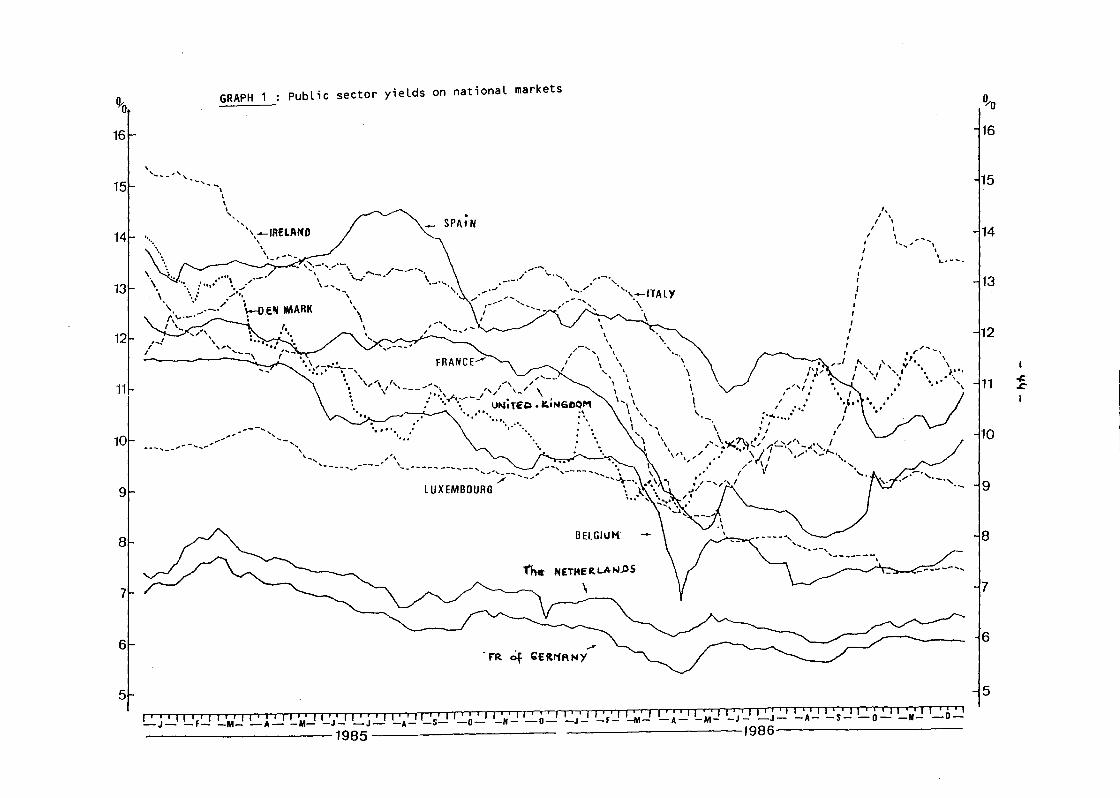
On the most important markets, interest rates were lower, sometimes
considerably so, at the end of 1986 than at the end of 1985.However,
movements over the year differed substantially from one country to
another. The decline was sharp in the first half-year in most
countries, but subsequently levelled off; rates even tended to rise in
certain countries because of uncertainty surrounding economic policies
and exchange rates (see graphs 1 and 2).
1),-0
14
13
12
11,
10
9
8
7
6
5
GRAPH 1 Public sector yields on national markets
' '' ,_-- '----~I I I
"· '',,,._fR£1.AND / \.- SPA·i N
' ' \ .. _, ........ ~''·-·---·-· - . \ ', .. ,..,.~-./·-.-· ....... , ....... .._ , __ ...... . -, ., ~llEN IMARK \ . . \
______ ,- ___ ,,,,'' _,--, ', ,_ ' ,_ ... -,
,.•-'
/ ..... --............. ,---, -·-· ' .. -.......
·.
\
' \ I
'- \ I '"/ \ \ ,' :' \ \ ~ ,'''','
\ \ I I '
\,\I \ I .'•.'
\ ', '-._ :·..t.. .... : I \ \ • I 1 /
\ '·\ \ :'/ , I
' .... \'1(.7\'"," ~ ........... ' ... "''' I \ I '"' ~,;-f' '1 '\ ' ' .,....,_, ' ' / ' \I ,/ ... '
I I
I I
I I
I
I
'"'.,' .. ....'('\/ ·, ..·· ," ,, \._, ' .. ____ ....... ,----' '--" ..... __ -- ....... -- ....
..... ,-:,;.- .......
LUXEMBOURG
BELGIUM
1'ht N£TI4ERLAN.DS
/
F'R 4 C0Ut1ANY
I, I ' I I
I I I ,,_ ... ,, \
I . .... --.
• 1"/'-,
' t f I \
I ' y • \ ' .. .' .\ -~-~ .. .. ·· .....
r • •, 1 1
• , 1 1
,, 1 1
, • • 1 1 ,. 1 1 ,, 1 1 ,, , 1 1
, , 11 , , 1 1 , r , 1 1 • , 11 , , , 1 1 • , 1 1 , , 1 1 .' 1 1 • •, 11 •. 1 1 ' , 1 1 •' '1 1 c • 1 1' • 11 •, , 11 , , 1 1 •• "'' -J- -F- -M- -A--M- -J- -J- -A--S- -0- -H- -0- -J- -f- -M- -A--M- -J- -J- -A--S- -0- -N- -0-
--------------------1985 1986--------------------
1!-o
16
15
14
12
11
10
9
8
7
6
5
-1: .c: I

% 13
12
11
10
9
8
7
6
5
\'··· .... ·... i
'•p•'
GRAPH 2
,... .. ··.:.:::c......--
........ -it, ..... !\ .. ,, I • ! I\.
. I I . \\ ...
·I; '. '-......_/ ,. ... ,,. \ . 1\ .'('flo,,, I --... _ '· -? _, . ~ . .;, ,._ ,~ ·---., ·-· ,.. ..._ ...
Yields on international markets
I
!\ . ;·i I i
I\ / i ,· I I . I .
.~
1\ ~· I I • / I
I ! t/ \ ;,,I \ "
• I I ··-· , .. ,, ' I . \ ~ / ',
. Euro FF
I
., I I \ ,, ,-... ' ' I, • I \
·r ...... 1 1 .. , Euro ... ..!.·;~~·........................ \....... \ ,--',' ......... \I UKL
,'\ I - .... , I '\ I \
I ''·'' ',
, ........ ·r ... ~ , . : ·. ' ,_ -~-- ........ -'~!\ ··\·,.."'/ ...... \
_?~·-·- ' ····\ / .... ···· ..... ,,.I Euro CAD /''.. ' / ·· ..
..... \. .............. :;;~·········· ... ·:·:F-~······\~·:"/··· ....... ,/ \ ,_.,-
... \,"' \1"
I ' I I
I \ \
······-.....
\,..._/\,'-_/~/""""~------,-~----- /,/-. ECU
-"'·-... ,.-'· ... ·---.... " ,..' '-,.1'·,·-·-· ''·-·> ..... ~.-'· ·~ ..... , ___ ,· ....
. .
\
.""''·- ....... , ~·
Euro YEN '!
. '-....
I S FR forei«N"
.............. · .. ..... , ,.-·..... "·-·, ,.. ·,. ... ..... -., ...... -·-·""' ..... _,._._ ..... -· .... -· ... ·-·,
I I • ' I I I I I I I I I I I I I I I ' I I I ' I I I I ' ' I I ' I I ' ' I I ' I I ' I I I I I I I I I I I I I I •• I I I I I I I I I I I ' ' I I I I I I I I I I ' I I I ' I I ' I • ' ' I J • ' rTrT 1 I -J- -F- -M- -A- -M- -J- -J- -A--S- -0- -N- -0- -J- -f- -M- -A- -M- -J- -J- -A--S--o--N- -0-
----------1985 1986-----------
% 13
12
11
10
s:-9 V'(
1
8
7
6
5
- 46-
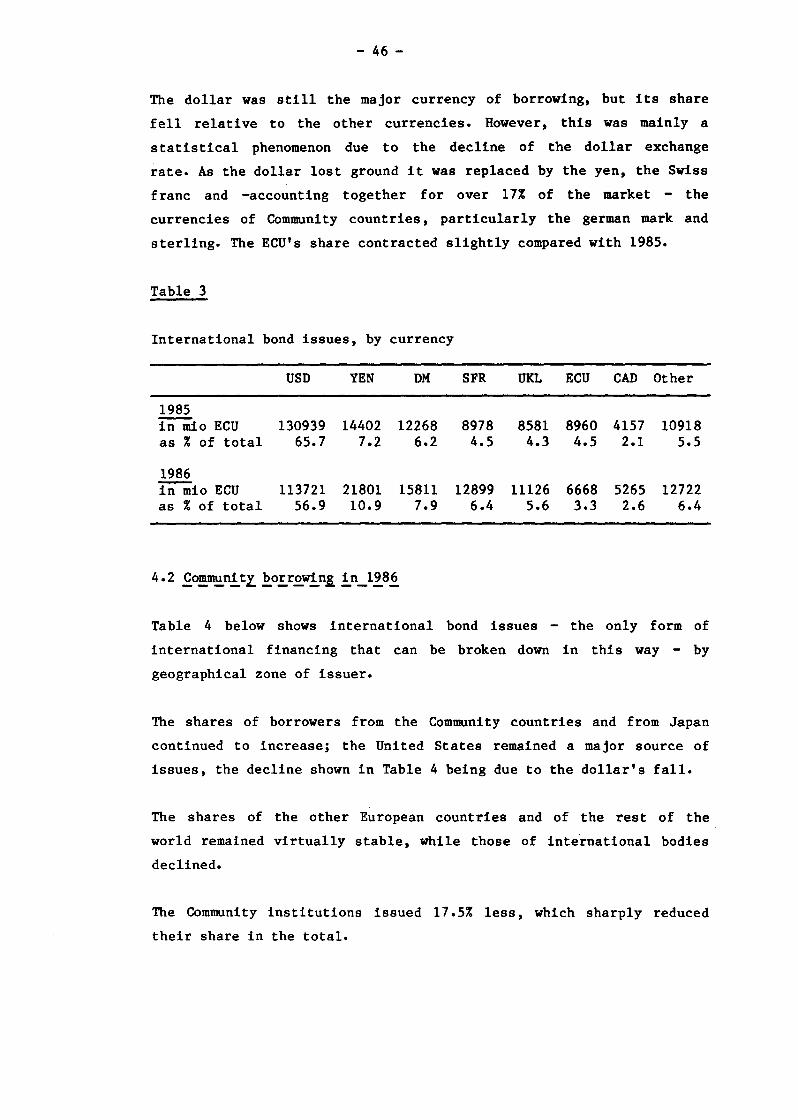
The dollar was still the major currency of borrowing, but its share
fell relative to the other currencies. However, this was mainly a
statistical phenomenon due to the decline of the dollar exchange
rate. As the dollar lost ground it was replaced by the yen, the Swiss
franc and -accounting together for over 17% of the market - the
currencies of Community countries, particularly the german mark and
sterling. The ECU's share contracted slightly compared with 1985.
Table 3
International bond issues, by currency
1985 in mio ECU as % of total
1986 in mio ECU as % of total
USD
130939 65.7
113721 56.9
YEN
14402 7.2
21801 10.9
DM
12268 6.2
15811 7.9
SFR
8978 4.5
12899 6.4
UKL ECU CAD Other
8581 4.3
11126 5.6
8960 4.5
6668 3.3
4157 2.1
5265 2.6
10918 5.5
12722 6.4
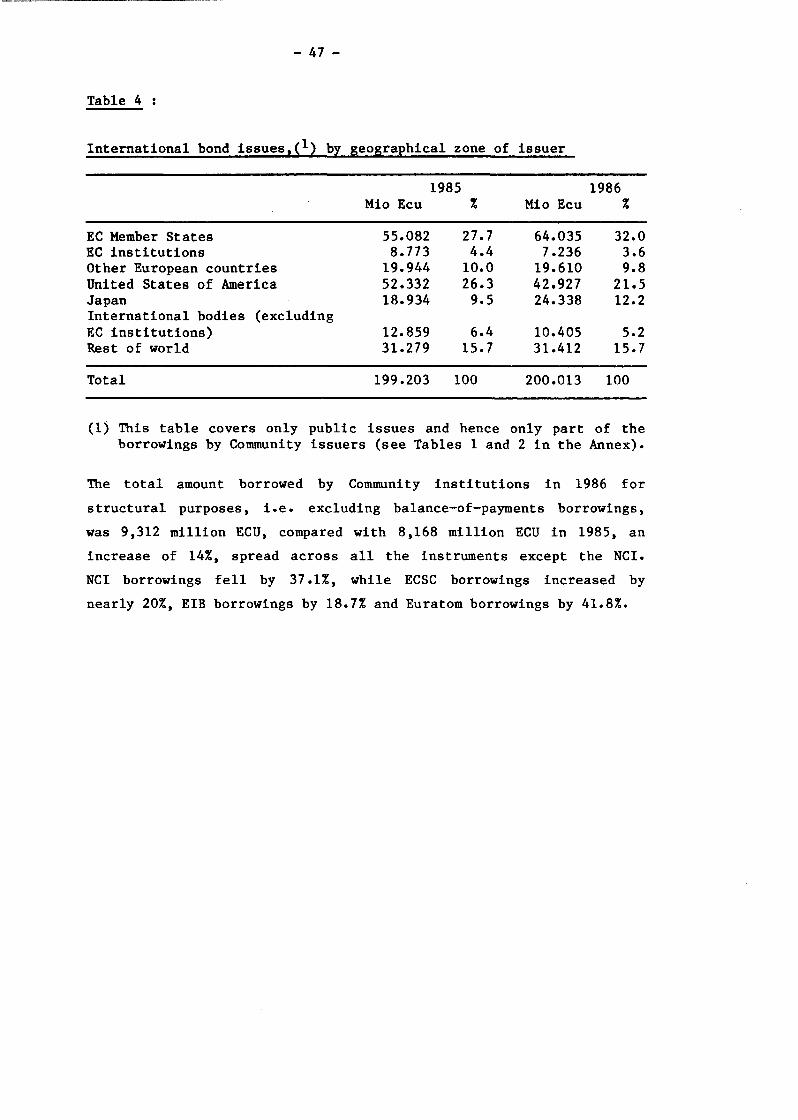
Table 4 below shows international bond issues - the only form of
international financing that can be broken down in this way - by
geographical zone of issuer.
The shares of borrowers from the Community countries and from Japan
continued to increase; the United States remained a major source of
issues, the decline shown in Table 4 being due to the dollar's fall.
The shares of the other European countries and of the rest of the
world remained virtually stable, while those of inte.rnational bodies
declined.
The Community institutions issued 17.5% less, which sharply reduced
their share in the total.
- 47 -
Table 4
International bond issues 1 (1) bz seosraehical zone of issuer
1985 1986 Mio Ecu % Mio Ecu %
EC Member States 55.082 27.7 64.035 32.0 EC institutions 8.773 4.4 7.236 3.6 Other European countries 19.944 10.0 19.610 9.8 United States of America 52.332 26.3 42.927 21.5 Japan 18.934 9.5 24.338 12.2 International bodies (excluding EC institutions) 12.859 6.4 10.405 5.2 Rest of world 31.279 15.7 31.412 15.7
Total 199.203 100 200.013 100
(1) This table covers only public issues and hence only part of the borrowings by Community issuers (see Tables 1 and 2 in the Annex).
The total amount borrowed by Community institutions in 1986 for
structural purposes, i.e. excluding balance-of-payments borrowings,
was 9,312 million ECU, compared with 8,168 million ECU in 1985, an
increase of 14%, spread across all the instruments except the NCI.
NCI borrowings fell by 37 .1%, while ECSC borrowings increased by
nearly 20%, EIB borrowings by 18.7% and Euratom borrowings by 41.8%.
- 48-
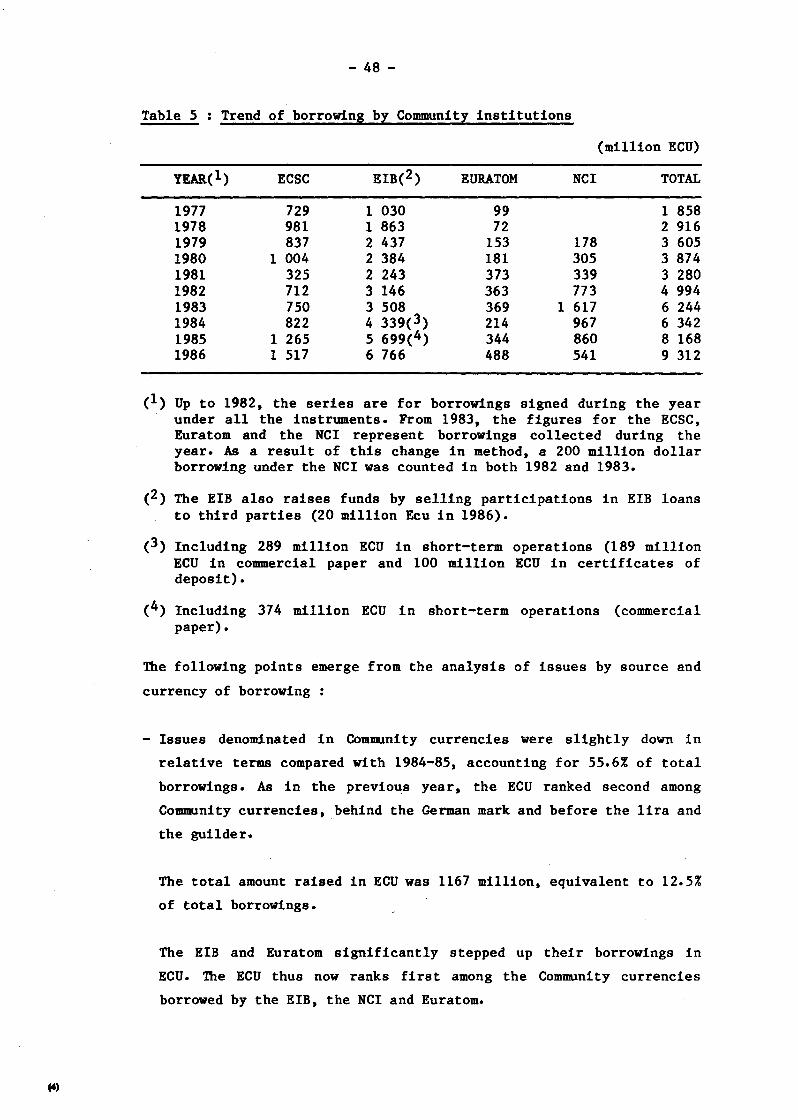
Table 5 Trend of borrowins bl Communitl institutions
(million ECU)
YEAR(l) ECSC EIB(2) EURATOM NCI TOTAL
1977 729 1 030 99 1 858 1978 981 1 863 72 2 916 1979 837 2 437 153 178 3 605 1980 1 004 2 384 181 305 3 874 1981 325 2 243 373 339 3 280 1982 712 3 146 363 773 4 994 1983 750 3 508 369 1 617 6 244 1984 822 4 339(3) 214 967 6 342 1985 1 265 5 699{4) 344 860 8 168 1986 1 517 6 766 488 541 9 312
(1) Up to 1982, the series are for borrowings signed during the year under all the instruments. From 1983, the figures for the ECSC, Euratom and the NCI represent borrowings collected during the year. As a result of this change in method, a 200 million dollar borrowing under the NCI was counted in both 1982 and 1983.
(2) The EIB also raises funds by selling participations in EIB loans to third parties {20 million Ecu in 1986).
(3) Including 289 million ECU in short-term operations (189 million ECU in commercial paper and 100 million ECU in certificates of deposit).
{4) Including 374 million ECU in short-term operations (commercial paper).
The following points emerge from the analysis of issues by source and
currency of borrowing :
- Issues denominated in Community currencies were slightly down in
relative terms compared with 1984-85, accounting for 55.6% of total
borrowings. As in the previous year, the ECU ranked second among
Community currencies, behind the German mark and before the lira and
the guilder.
The total amount raised in ECU was 1167 million, equivalent to 12.5%
of total borrowings.
The EIB and Euratom significantly stepped up their borrowings in
ECU. The ECU thus now ranks first among the Community currencies
borrowed by the EIB, the NCI and Euratom.

- 49-
Issues denominated in lire increased considerably in 1986, placing the
lira in third position among Community currencies. Issues in German
marks, guilders and French francs fell back, while issues in sterling
increased.
- Borrowing in non-Community currencies increased to 44.4% of the
total. Dollar issues rose sharply (by 43.5%). This was mainly due to
the EIB using dollars for fixed-rate issues, but also for
floating-rate and interbank transactions.
The US dollar accounted for the entire amount of the EIB's floating
rate transactions in 1986 (540. 6 million ECU or 8% of the total
raised) and for 296.2 million ECU of the 321 million ECU in interbank
transactions.
Issues in Swiss francs also increased, and the EIB tapped the Austrian
schillings market.
- Some 26% of the funds borrowed by Community instruments was raised in
the form of private placings.
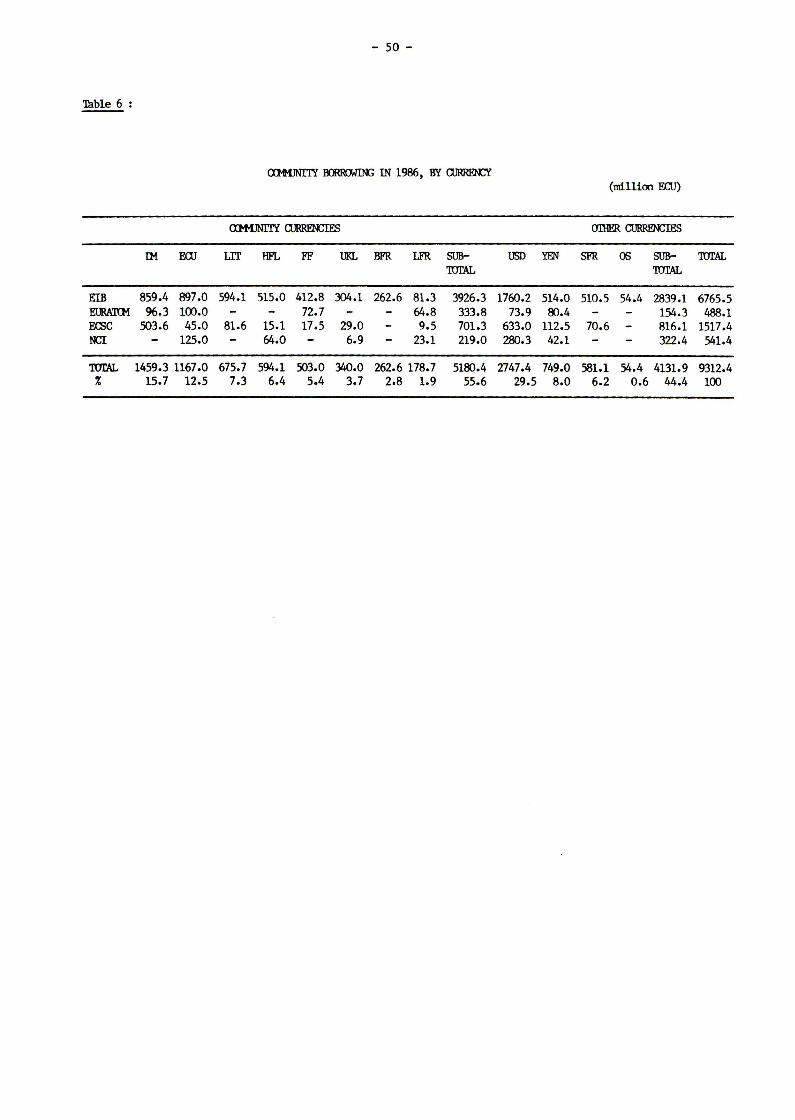
- 50 -
'lable 6 :
ClMilNI'lY ~ IN 1986, BY aJRREOCY (million ECU)
aMllNI'lY CllRROCIES amER aJRRENCIES
IM EQJ LIT HFL FF UKL BFR LFR SUB- USD YFN SFR OS SUB- 'IUl'AL rorAL rorAL
EIB 859.4 007.0 594.1 515.0 412.8 304.1 262.6 81.3 3926.3 1760.2 514.0 510.5 54.4 2839.1 6765.5 EmAnM 96.3 100.0 72.7 64.8 333.8 73.9 ~-4 154.3 488.1 ro;c 503.6 45.0 81.6 15.1 17.5 29.0 9.5 701.3 633.0 112.5 70.6 - 816.1 1517.4 NCI 125.0 64.0 6.9 23.1 219.0 280.3 42.1 322.4 541.4
'lUl'AL 1459.3 1167.0 675.7 594.1 503.0 340.0 262.6 178.7 51~.4 2747.4 749.0 581.1 54.4 4131.9 9312.4 % 15.7 12.5 7.3 6.4 5.4 3.7 2.8 1.9 55.6 29.5 s.o 6.2 0.6 44.4 100
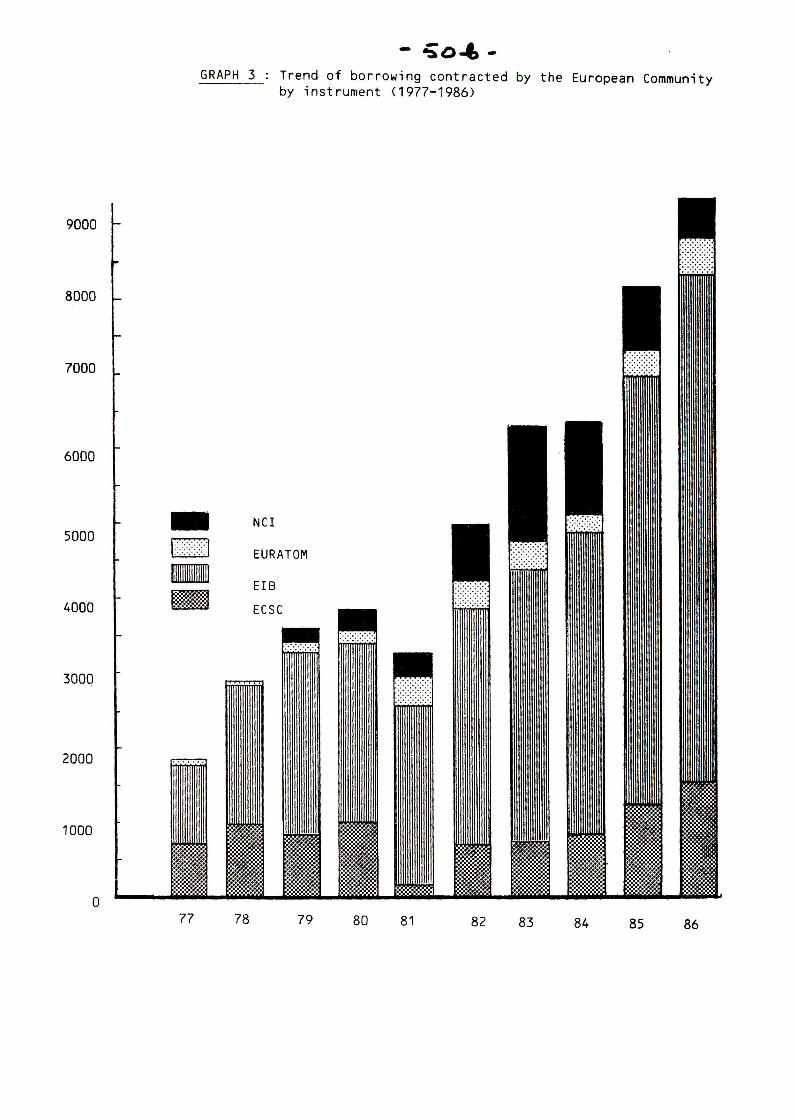
9000
8000
7000
6000
5000
4000
3000
2000
1000
0
- .;o-t, .. GRAPH 3 Trend of borrowing contracted by the European Community
by instrument C1977-1986)
.. NCI
[I[] EURATOM
1111 EIB - ECSC ~
77 78 79 80 81 82 83 84 85 86
- 51 -
Operations under the Community loans mechanism designed to support Member States' balances of payments
Established in 1975 (1), the balance of payments support mechanism was adjusted in 1981 and 1985 (2). It serves a different purpose from that of the other borrowing and lending instruments for financing investment projects discussed in this report. The Community uses its credit-worthiness to borrow and then onlend the borrowed funds on identical terms to any Member State in balance-of-payments difficulties.
Under this mechanism the Council, acting on a proposal from the Commission and after consulting the Monetary Committee, decided on 16 May 1983 to grant the French Republic a loan equivalent to 4000 million ECU (3).
In July 1986, France made early repayment of part of the loan, worth USD 1800 million, so that the Commission also made early repayment of a 1800 million Ecu loan whose terms had been adjusted in 1985.
The mechanism was used again when the Council decided on 9 December 1985, on a proposal from the Commission and after consultinf, the Monetary Committee, to grant Greece a loan of 1750 million Ecu { ).
The Commission arranged the first tranche of this loan in January and February 1986, and made borrowings on the capital markets for the equivalent of 865 million Ecu as follows:
- a seven year floating-rate loan of 350 million Ecu; - a six year floating-rate loan of DM 500 million; - a five-year fixed-rate loan of USD 150 million which was
subsequently the subject of an interest rate swap to arrive at a variable rate below Libor;
- a six-year fixed-rate loan of SFR 227 million.
Council Regulations {EEC) No 397/75 and No 398/75 of 17 February 1975. Council Regulations {EEC) No 682/81 of 16 March 1981 and No 1731/85 of 30 April 1985. Council Decision 83/298/EEC. Council Decision 85/543/EEC.
-52-
s. Lending
5.1 General
The total value of loans granted in 1986 was 8583.5 million ECU, a
nominal increase of 10.8% and a stronger surge than in the two
previous years.
ECSC activity increased by 5.8%, with the growth of lending to the
steel industry (up by 55.7%), to the coal industry and for low-cost
housing more than offsetting the decline in industrial conversion
loans and loans for thermal power stations. The use of global loans
for conversion projects continued to expand (96.5% of conversion
loans) and there was also an increase, though less strong, in the use
of this lending technique to promote the consumption of Community coal
and steel (40% of loans for this purpose). ECSC global loans amounted
altogether to i48.2 million Ecu in 1986.
EIB lending increased by 18.4% in nominal terms. Euratom lending,
whose expansion had slowed down in 1985 as the borrowing ceiling was
reached, gathered momentum and more than doubled. By contrast, NCI
lending fell by over half as the amounts available under NCI III were
gradually used up.
Table 7 Trend of lendin~ in the Communit~ (1)
YEAR ECSC EIB EURATOM (2) (3)
1977 709.0 1.390.9 96.9 1978 797.7 1.966.5 70.3 1979 675.8 2.281.2 151.6 1980 1.030.7 2.738.4 181.3 1981 387.6 2.805.9 357.6 1982 740.6 3.446.0 361.8 1983 778.1 4.243.5 366.4 1984 825.5 5.007.0 186.0 1985 1.010.6 5.640.7 211.0 1986 1.069.2 6.678.1 443.2
(1) Balance of payments loans are not (2) Including loan guarantees: 1980:
. 1981: 1983:
(million ECU)
NCI TOTAL
2.196.4 2.834.5
277.0 3.386.4 197.6 4.148.0 539.8 4.090.0 791.0 5.339.4
1.199.6 6.587.6 1.181.8 7.200.3
883.7 7.746.0 393.0 8.583.5
included in this table. 14.2 million ECU
282.1 million ECU 97.6 million ECU
ANNUAL GROWTH
RATE AS %
7 29 19 23
1 30 23 9 8
11
(3) Including loans for reconstruction in areas stricken by t~ earthquakes in Italy in November 1980 and in Greece in February/ March 1981 (1981-86).
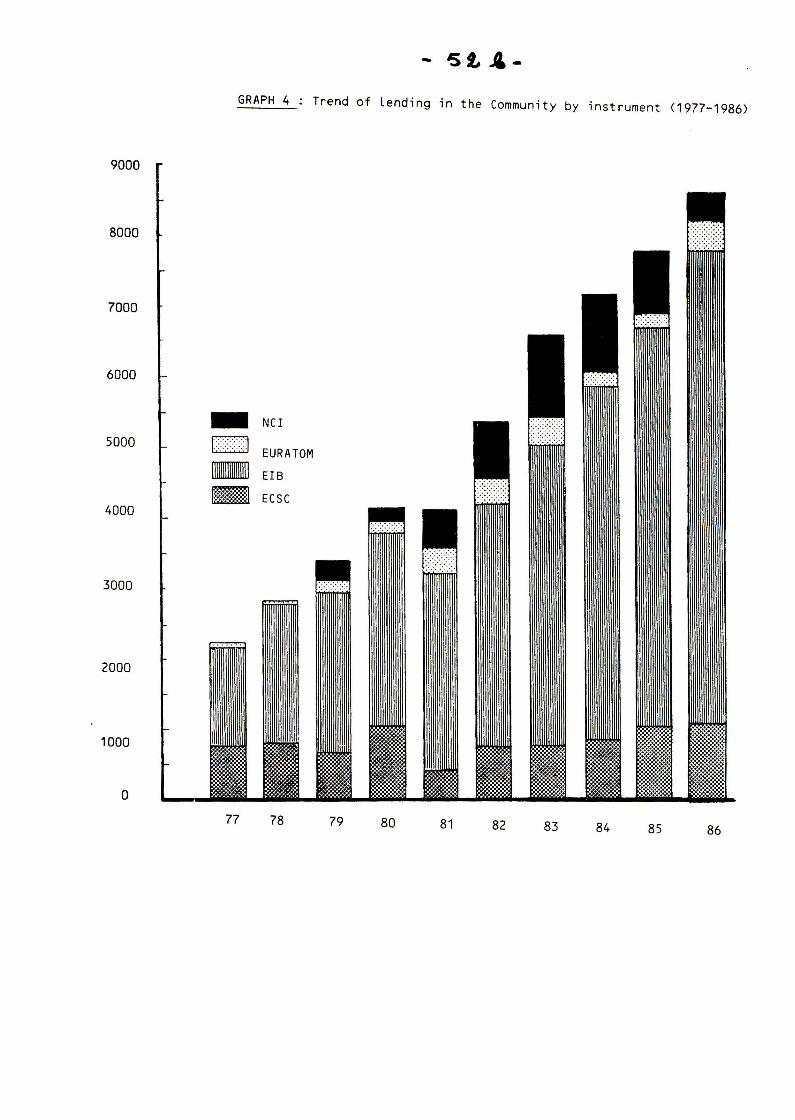
9000
8000
7000
6000
5000
4000
3000
2000
1000
0
GRAPH 4 Trend of Lending in the Community by instrument (1977-1986)
-1:::::::::: :::1
aillJ tiiZl
77
NCI
EURATOM
EIB
ECSC
78 79 80 81 82 83 84 85 86
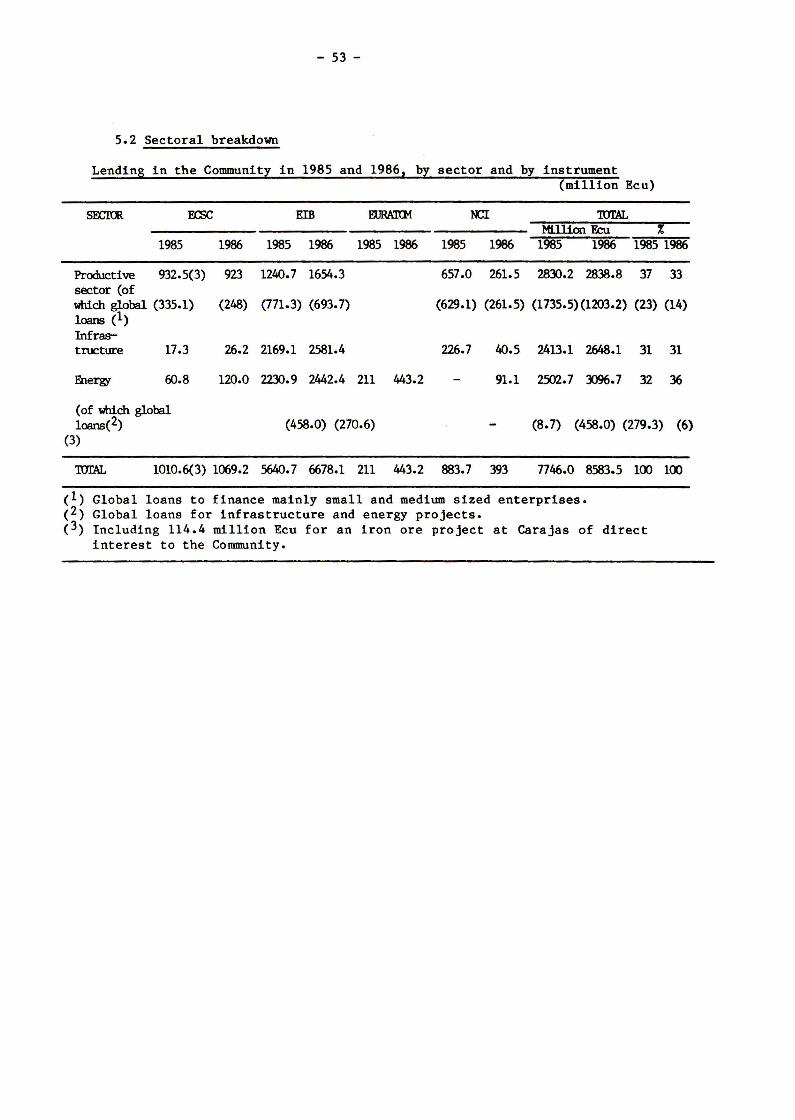
- 53 -
5.2 Sectoral breakdown
Lending in the Community in 1985 and 1986, by sector and by instrument (million Ecu)
EIB Ml.llion F.cu f
1985 1986 1985 1986 1985 1986 1985 1986 1985 1986 1985 1986
Productive 932.5(3) 923 1240.7 1654.3 sector (of Which global (335.1) (248) (771.3) (693.7) loans (1)
657.0 261.5 2830.2 2838.8 37 33
(629.1) (261.5) (1735.5)(1203.2) (23) (14)
Infrastructure 17.3 26.2 2169.1 2581.4 226.7 40.5 2413.1 2648.1 31 31
Energy 60.8
(of Which global loans(2)
(3)
120.0 2230.9 2442.4 211 443.2 91.1 l5!1..7 :m6.7 32 36
(458.0) (270.6) (8.7) (458.0) (279.3) (6)
1010.6(3) 1069.2 5640.7 6678.1 211 443.2 883.7 393 n46.o 8583.5 100 100
(1) Global loans to finance mainly small and medium sized enterprises. (2) Global loans for infrastructure and energy projects. (3) Including 114.4 million Ecu for an iron ore project at Carajas of direct
interest to the Community.
-54-
5.2.1 Productive sector
Despite the growth of EIB lending, loans to the productive sector,
while remaining at a high level (2838.8 million Ecu), were virtually
stable compared with the previous two years. Their share of total
lending was consequently down to 33%.
ECSC lending declined by 1.4%, as the expansion of industrial loans
did not eGtirely offset the decline in conversion loans.
EIB lending expanded by a third, reflecting the brisk growth of
individual loans (from 470 million Ecu to 960 million ECU), which more
than made up for the fall-off in global loans. NCI lending was down
sharply as most of NCI III had been used up. NCI lending to the
productive sector, which accounts for 66.5% of NCI activity, took the
form of global loans amounting altogether to 261.5 million Ecu to
finance productive investment by small and medium sized enterprises
outside assisted areas. EIB global loans totalled 693.7 million Ecu;
an amount of 595 million Ecu was for small and medium-sized projects
in less-favoured areas, 43.6 million Ecu for investment furthering the
development or deployment of advanced technologies outside areas
assisted under regional aid schemes, and the rest for industrial
investment consistent with the Community's aims for energy and
environmental protection.
Sub-loans allocated in 1986 from new or current global loans for small
and medium-scale industrial investment projects declined significantly
in relation to 1985, to 1023,6 million Ecu. A total of 3569 sub-loans
were allocated comprising 2104 (572.7 million Ecu) from EIB resources
in areas eligible for regional aid, 1368 (304 million Ecu) from NCI
resources, mainly outside assisted areas, 80 (91 million Ecu) for
investment in the efficient use of energy, 14 (44 .million Ecu) for
investment in advanced technology projects, and 6 (13 million Ecu) for
environmental protection projects.
ECSC global loans amounted to 248 million Ecu (235 million Ecu for
conversion and 13 million Ecu for coal and steel consumption).
-55-
5.2.2 Infrastructure
Lending for infrastructure projects increased by almost 10%.
EIB and NCI loans for transport were up again, while those for
telecommunications (579.6 million Ecu, including 83.4 million Ecu
for satellite links) levelled off. Assistance for water engineering
projects, including sewerage declined. Global loans totalled 173.5
million Ecu. ECSC lending to finance low cost housing rose considerably,
to 26.2 million Ecu.
Lending to the energy sector showed the sharpest increase (23.7%) under
the combined impact of the doubling of ECSC and Euratom lending, the
granting of NCI loans (of which there were none in the sector in 1985)
and the 9.5% increase in EIB lending. While ECSC loans for thermal power
stations fell sharply, with only one loan in 1986, an amount of 103.6
million Ecu was lent for coal production, for which no loans were made
in 1985.
After slackening in 1985, Euratom lending expanded sharply owing to the
increase in the borrowing ceiling decided by the Council on 5 December
1985.EIB loans totalled 2442.4 million Ecu. The financing of nuclear
power stations and nuclear fuel reprocessing and storage facilities
still accounts for a major, if declining, share (712. 8 million Ecu).
Loans for hydroelectric, geothermal and coal-fired power stations
expanded, as did loans for oil and gas exploitation, transport projects
and energy distribution projects.
There had been no NCI loans in the energy sector in 1985; in 1986, NCI
loans totalled 91.1 million Ecu.
Global loans from the EIB and the NCI to the energy sector totalled
105.8 million Ecu.

, NCI
GRAPH 5 Breakdown of Loans in the Community in 1986 by instrument and by sector.
, EURATOM
,EIB ~ ,. ECSC
- 56-
More than 70% of lending was concentrated in countries with major
regional problems : Greece, Ireland, Italy, Spain, Portugal and the
United Kingdom; the figure is 83% if France is included.
The share of Ireland tended to increase in line with the expansion of
EIB financings, that of the United Kingdom in line with EIB and
Euratom financings.
Since the rate of increase in lending to Italy was considerably below
that of total lending, owing to the contraction in NCI loans, Italy's
share in the total fell.
Lending to France declined by 38% owing to a contraction in loans from
all the instruments except Euratom, and especially in NCI global
loans; the result was a very sharp contraction of France's share in
the total : from 20.2% in 1985 to 11.2%.
Spain and Portugal received loans from the NCI and the EIB. The
amounts lent by the EIB were considerably higher than financing under
the pre-accession arrangements.
Germany's share in Community loans (EIB and ECSC) increased
appreciably and was comparable in 1986 to France's share.
EIB and NCI loans contributing to regional objectives totalled 3585
million Ecu in 1986, equivalent to more than half of the total. As
much as 70% went to the countries experiencing the most serious
structural problems (Italy, Greece, Ireland, Portugal, Spain).
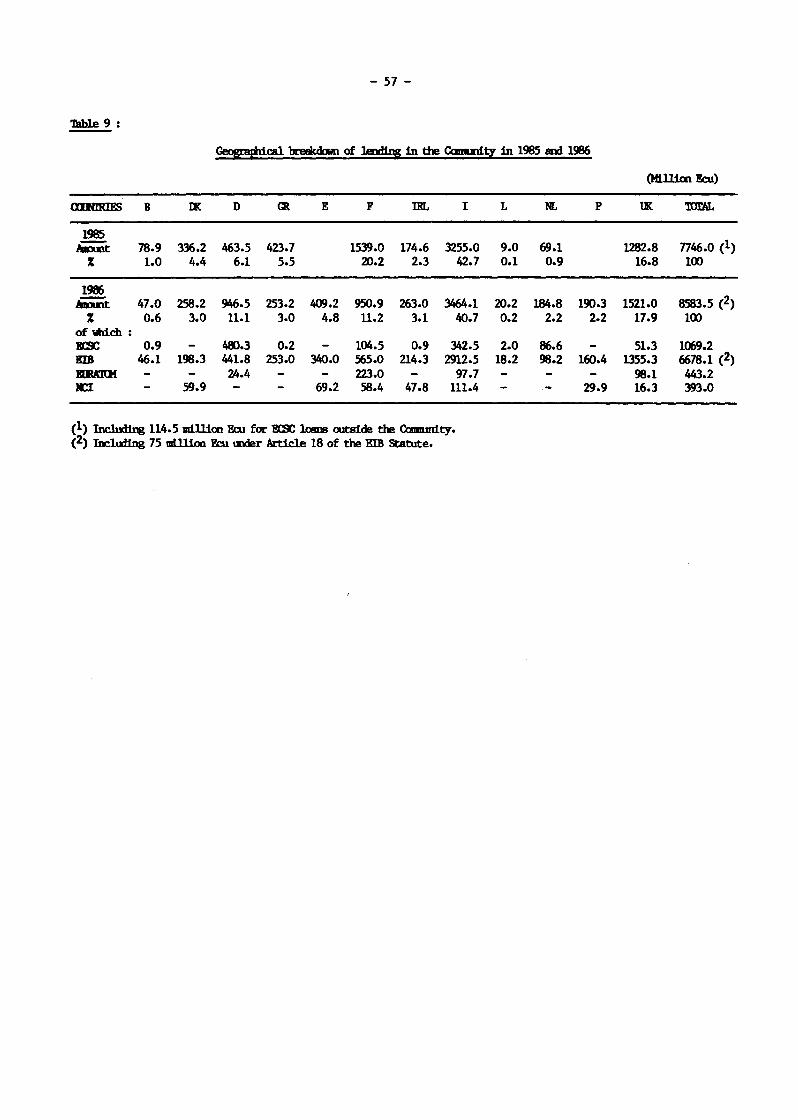
- 57 -
'Dlble 9 :
Geographical breakcbm of lmdfng in the Q:murl.~ in 1985 and 1986
(MUllen Ecu)
anmuES B D E F IRL I L NL p tl{ 'IDrAL
1985 liiiiiit 78.9 336.2 463.5 423.7 1539.0 174.6 3255.0 9.0 69.1 1282.8 n46.o <1>
% 1.0 4.4 6.1 5.5 Z).2 2.3 42.7 0.1 0.9 16.8 100
1986 AUnt 47.0 258.2 946.5 253.2 409.2 950.9 263.0 3464.1 Z).2 184.8 190.3 1521.0 8583.5 (2)
% 0.6 3.0 11.1 3.0 4.8 11.2 3.1 40.7 0.2 2.2 2.2 17.9 100 of llbich : 113: 0.9 W.3 0.2 104.5 0.9 342.5 2.0 86.6 51.3 1069.2 EIB 46.1 198.3 441.8 253.0 340.0 .565.0 214.3 2912.5 18.2 98.2 160.4 1355.3 6678.1 (2) !IBmM 24.4 223.0 97.7 98.1 443.2 JI:I 59.9 69.2 58.4 47.8 111.4 29.9 16.3 393.0
(1) lnchJding 114.5 millicn Ecu for 'mlC lams outside the O:mlunity. (2) licluHng 75 ml.l.llon Fru \DJer Article 18 of the EIB Statute.
·--------------- -----
- 58-
According to forward estimates, the total amount of investment which
the EIB and NCI helped to finance is 22 800 million Ecu; and the
average contribution is put at a third of total costs.
Information provided by promoters when investment projects were
appraised suggest that the investment projects financed by the EIB and
the NCI in 1986 should together help to create some 30 000 permanent
jobs, of which 23 000 in industry. Most of the jobs created (18500)
will stem from ventures financed through global loans. A total of 67%
are in the assisted areas.
While, by their nature, projects financed by Euratom create few new
jobs directly, ECSC conversion loans made in 1986 could help to
generate about 31 000 extra jobs.
Although these estimates are necessarily very rough, they show that
the impact on employment in the Community is considerable.
- 59-
6. Lending in the Community, by instrument
The table below shows the situation regarding loans signed by 31
December 1986, specifying the borrowing authorizations and their
respective ceilings:
- NCI I was fully allocated by 31 December 1984;
- NCI II was virtually fully allocated by 31 December 1986;
- 96% of the first tranche of NCI III, and 91% of the second tranche,
have been committed; the balance is covered by loans already
approved but not yet signed.
At 31 December 1986, loans signed under the three borrowing
authorizations totalled 4707 million Ecu.
In addition to these ordinary operations, which make up its principal
activity, the NCI also helps to finance the exceptional assistance
operations in the regions of Italy and Greece stricken by the
earthquakes of 1980-81.
The Council decisions on such reconstruction aid do not lay down any
precise amounts for NCI lending, but limit the overall amount of
assistance, financed both from the EIBs' own resources and from NCI
resources, to:
- 1000 million ECU in borrowing and lending for Italy (24);
- 80 million ECU in borrowing and lending for Greece (25).
All of the 80 million Ecu authorized for Greece was committed in 1982
in a single loan. The exceptional aid operations in the Italian areas
hit by the 1980 earthquakes still have a balance of some 73 million
Ecu in loans to be signed, some of which have already been approved.
These loans are granted from EIB and NCI resources, with the NCI
having covered 66% of the loans signed so far.
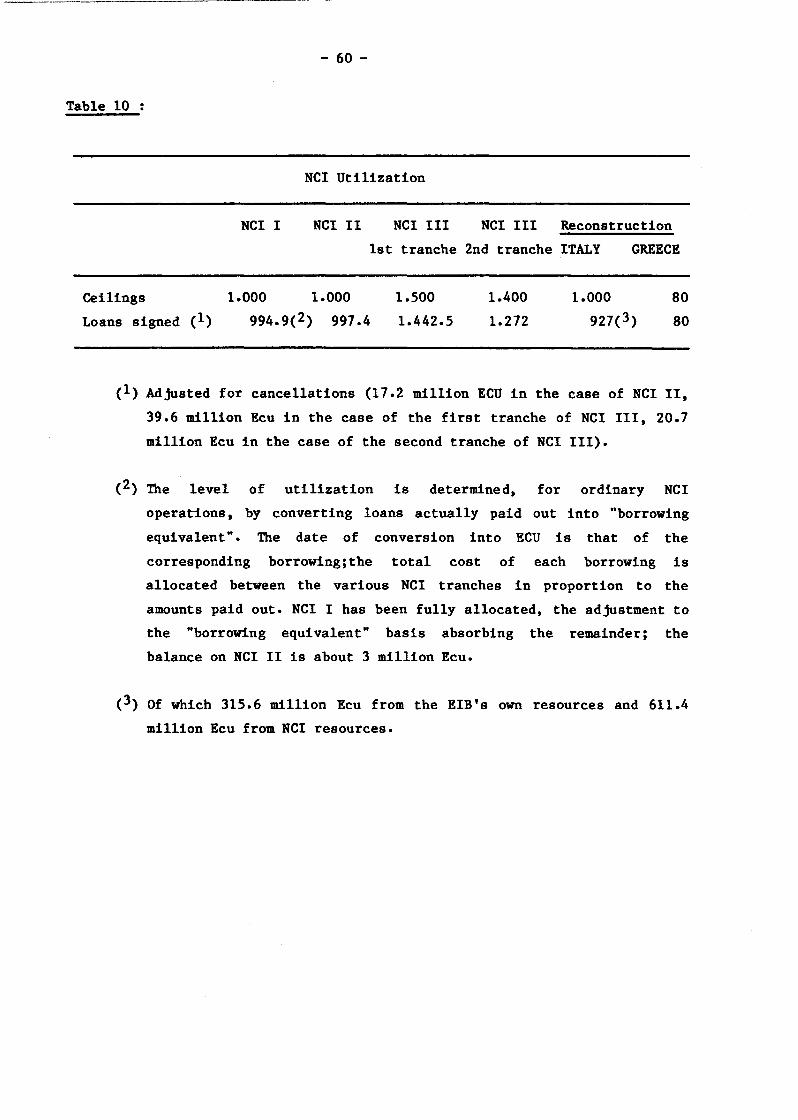
Table 10
Ceilings
Loans signed (1)
- 60-
NCI Utilization
NCI I NCI II NCI III NCI III Reconstruction
1st tranche 2nd tranche ITALY GREECE
1.000 1.000
994.9(2) 997.4
1.500
1.442.5
1.400
1.272
80
80
(1) Adjusted for cancellations (17.2 million ECU in the case of NCI II,
39.6 million Ecu in the case of the first tranche of NCI III, 20.7
million Ecu in the case of the second tranche of NCI III).
(2) The level of utilization is determined, for ordinary NCI
operations, by converting loans actually paid out into "borrowing
equivalent". The date of conversion into ECU is that of the
corresponding borrowing;the total cost of each borrowing is
allocated between the various NCI tranches in proportion to the
amounts paid out. NCI I has been fully allocated, the adjustment to
the "borrowing equivalent" basis absorbing the remainder; the
balance on NCI II is about 3 million Ecu.
(3) Of which 315.6 million Ecu from the EIB's own resources and 611.4
million Ecu from NCI resources.
(5)
- 61 -
NCI lending, which fell by 25% in 1985, contracted sharply once more
in 1986(by 55.5%) to 393 million Ecu, as amounts available under
NCI III were used up.
Loans to the productive sector accounted for 66.5% of total lending
(261. 5 million Ecu), all in the form of global loans to small and
medium-sized industrial firms outside regional aid areas. Twelve new
global loan agreements were concluded with intermediary institutions
in five countries, including Spain and Portugal. Of the 1368 sub-loans
(totalling 304.1 million Ecu) made to SMEs from global loans in 1986,
SO% by number and 22% by amount went to firms employing fewer than 20
workers, 75% by number and 46% by amount to firms employing fewer than
50 workers and 94% by number and 81% by amount to firms employing
fewer than 200 workers.
Loans in the energy sector (91.1 million Ecu, including 8.7 million
Ecu in global loans) accounted for 23.2% of total lending. They helped
to finance the Moneypoint coal-fired power station in Ireland, the
district heating grid serving the greater Copenhagen area and projects
involving the efficient use of energy (a global loan to Italy).
The remaining 10.3% of loans (40.5 million Ecu) went to infrastructure
projects. They helped to finance electrification of the railway
network in Scotland and the improvement of basic infrastructure for a
new business distict in Naples.
No NCI loans were granted to Italy in 1986 towards reconstruction in
the earthquake areas, but 24.6 million Ecu was lent for that purpose
from the EIBs' own resources. Taking into account earlier loans, this
brings the total amount of subsidized loans committed for Italian
reconstruction work to 927 million Ecu, including 315.6 million Ecu
from the EIB's own resources.
Table 6 in the annex provides a breakdown of NCI loans by country and
by sector.
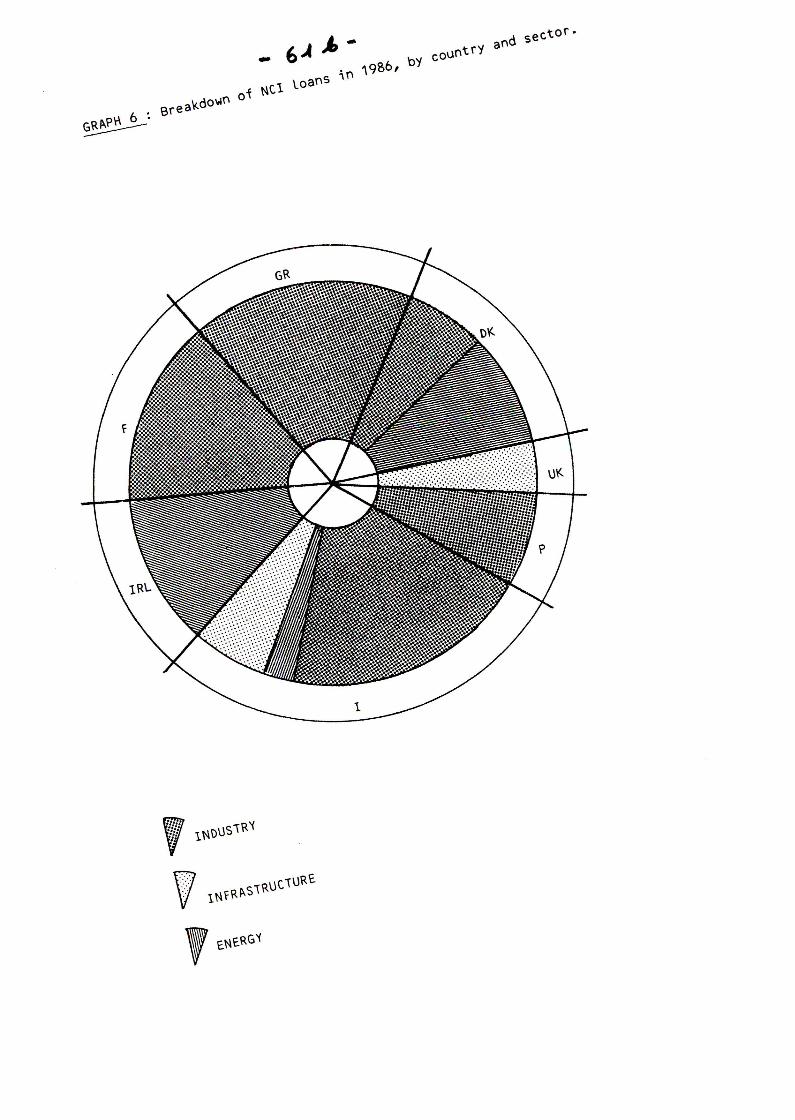
\J7 l~t~~SI~uciU~t
' c~c~G't
- 62-
The overall decrease in NCI lending compared with 1985 is reflected in
the level for each of the recipient countries, with the amounts lent
down by 13% in Denmark, 70% in Italy and 85% in France. There were no
NCI loans to Greece in 1986. Only Ireland received more in such loans,
and financing was granted for the first time to Spain and Portugal.
Italy's share fell from about 40% in 1985 to 28.4% in 1986, while
France's share fell from 40% to 14.9%. Spain's share in NCI loans was
17.6%, Portugal's 7.6%.
In Denmark, lending fell by 12.6% to 59.9 million Ecu, of which 34.6
million Ecu was for a district heating network at Copenhagen. The rest
was used, in the form of global loans, to finance productive
investment in industrial SMEs.
During the year, 131 sub-loans totalling 45.3 million Ecu were granted
from global loans currently under drawdown.
In France, NCI lending totalled 58.4 million Ecu in the form of one
global loan to the CEPME to finance productive investment in SMEs.
From global loans already under allocation, 81.6 million Ecu in
sub-loans was granted to 631 SMEs.
Spain received 69.2 million Ecu in the form of two global loans, used
to finance investment by agro-industrial SMEs and by SMEs in the
industrial and service sectors.
Ireland received loans totalling 47.8 million Ecu to finance the
Moneypoint coal-fired power station.
In Italy, lending totalled 111.6 million Ecu. Global loans accounted
for more than 70% (78. 7 million Ecu). They were concluded with six
institutions specializing in the financing of SMEs.
- 63 -
The rest was granted in the infrastructure sector for the provision of
basic infrastructure for a new business district in connection with
the Naples integrated operation (24.2 million Ecu), and in the form of
a global loan to finance small and medium-sized investment projects to
improve energy efficiency in the infrastructure, industrial and
building sectors (8.6 million Ecu).
From global loans already under allocation, 564 small and medium-sized
firms mainly located in various areas in the centre and north of the
country were granted sub-loans amounting to 169.1 million Ecu.
Portugal received a global loan of 29.9 million Ecu to finance
productive investment by SMEs in industry, tourism and services and
investment in energy conservation or environmental protection.
In the United Kingdom, a loan of 16.3 million Ecu contributed to the
electrification of the railway network south-west of Glasgow.
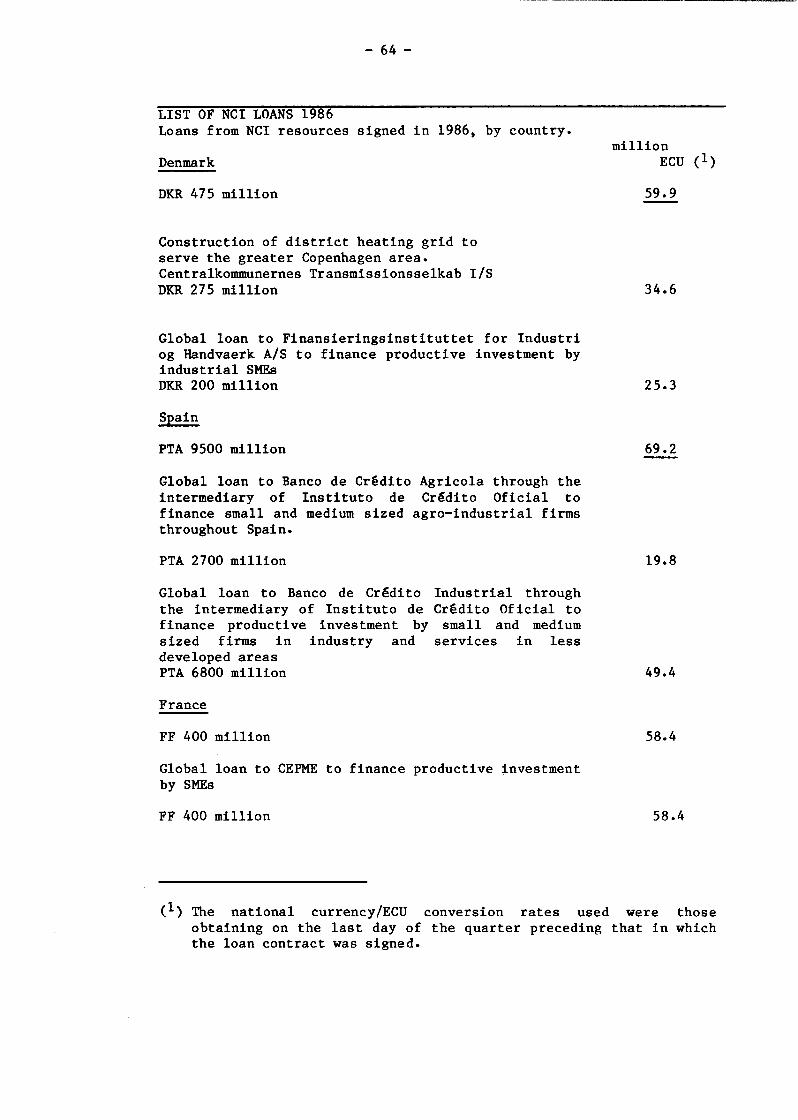
- 64-
LIST OF NCI LOANS 1986 Loans from NCI resources signed in 1986, by country.
Denmark
DKR 475 million
Construction of district heating grid to serve the greater Copenhagen area. Centralkommunernes Transmissionsselkab I/S DKR 275 million
Global loan to Finansieringsinstituttet for Industri og Handvaerk A/S to finance productive investment by industrial SMEs DKR 200 million
Spain
PTA 9500 million
Global loan to Banco de Cr~dito Agricola through the intermediary of Instituto de Cr~dito Oficial to finance small and medium sized agro-industrial firms throughout Spain.
PTA 2700 million
Global loan to Banco de Cr~dito Industrial through the intermediary of Instituto de Cr~dito Oficial to finance productive investment by small and medium sized firms in industry and services in less developed areas PTA 6800 million
France
FF 400 million
Global loan to CEPME to finance productive investment by SMEs
FF 400 million
million ECU (1)
59.9
34.6
25.3
69.2
19.8
49.4
58.4
58.4
(1) The national currency/ECU conversion rates used were those obtaining on the last day of the quarter preceding that in which the loan contract was signed.
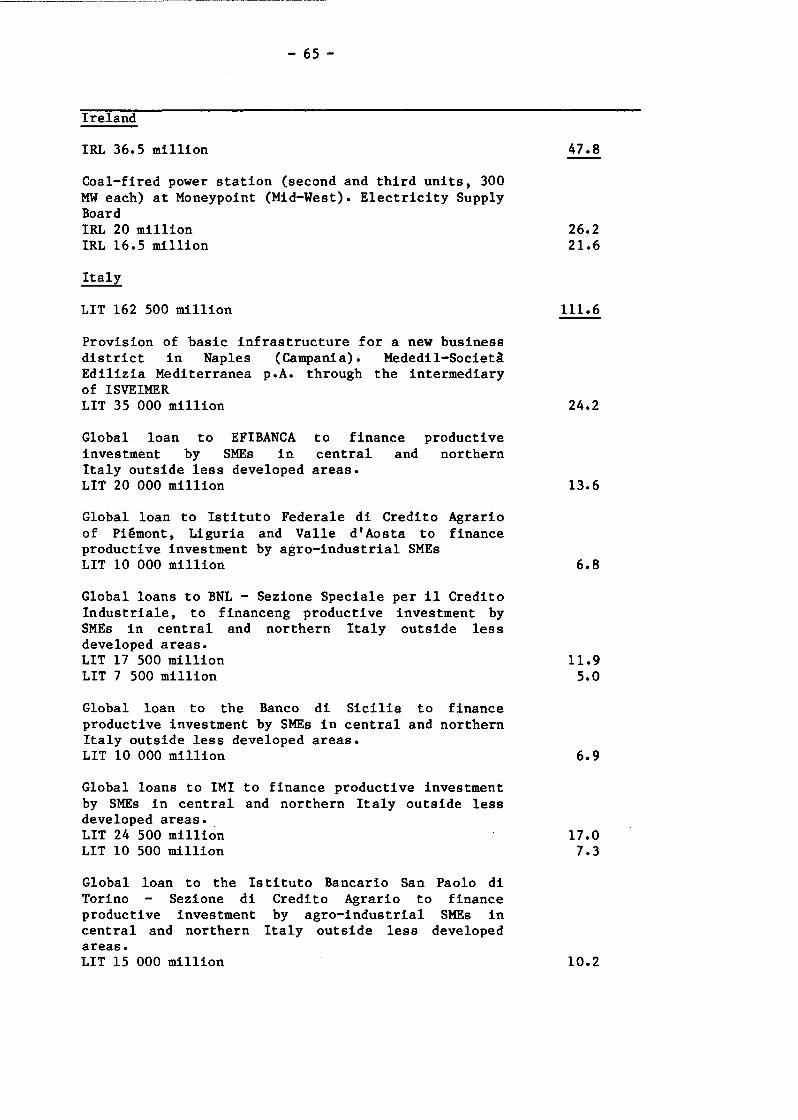
- 65-
Ireland
IRL 36.5 million
Coal-fired power station (second and third units, 300 MW each) at Moneypoint (Mid-West). Electricity Supply Board IRL 20 million IRL 16.5 million
Italy
LIT 162 500 million
Provision of basic infrastructure for a new business district in Naples (Campania). Mededil-Societ~ Edilizia Mediterranea p.A. through the intermediary of ISVEIMER LIT 35 000 million
EFIBANCA SMEs
Global loan to investment by Italy outside less LIT 20 000 million
in to finance productive central and northern
developed areas.
Global loan to Istituto Federale di Credito Agrario of Piemont, Liguria and Valle d' Aosta to finance productive investment by agro-industrial SMEs LIT 10 000 million
Global loans to BNL - Sezione Speciale per il Credito Industriale, to financeng productive investment by SMEs in central and northern Italy outside less developed areas. LIT 17 500 million LIT 7 500 million
Global loan to the Banco di Sicilia to finance productive investment by SMEs in central and northern Italy outside less developed areas. LIT 10 000 million
Global loans to IMI to finance productive investment by SMEs in central and northern Italy outside less developed areas. LIT 24 500 million LIT 10 500 million
Global loan to the Is tituto Bancario San Paolo di Torino Sezione di Credito Agrario to finance productive investment by agro-industrial SMEs in central and northern Italy outside less developed areas. LIT 15 000 million
47.8
26.2 21.6
111.6
24.2
13.6
6.8
11.9 5.0
6.9
17.0 7.3
10.2

- 66-
Global loan to Venefondario to finance small and medium-sized investment projects for efficient use of energy in the infrastructure, industry and building sectors in central and northern Italy. LIT 12500 million
Portugal
ESC 4530 million
Global loan to Banco de Fomento Nacional to finance productive investment by SMEs in industry, tourism and services, and investment in energy conservation or environmental protection. ESC 4530 million
United Kingdom
UKL 10 million
Electrification of the Ayr railway line south-west of Glasgow and rolling stock (Scotland). Strathclyde Regional Council
8.6
29.9
16.3
UKL 10 million 16.3
- 67 -
In 1986 the EIB made loans from its own resources totalling 7059.9
million Ecu; loans within the Community accounted for 6678.1 million
Ecu and loans outside the Community for 381.8 million Ecu.
Loans were granted in all the countries of the Community of Twelve,
and therefore for the first time in Spain and Portugal. They were
highly concentrated in countries with the greatest structural
problems: 58.6% of the total went on investment projects in Portugal,
Greece, Ireland, Spain and Italy, and 28.8% on projects in the United
Kingdom and France. The other loans - a higher total than in previous
years -went to Germany, the Netherlands, Belgium and Luxembourg. In
addition, a loan for EUTELSAT telecommunications satellites benefiting
the whole of the Community was granted on the special authorization of
the Bank's Board of Governors (Article 18 of the Bank's Statute).
Table 9 in the annex gives a breakdown by country and sector of loans
in the Community.
The main feature of the year was the sharp increase in loans for
investment projects contributing to environmental protection and for
high tech industrial projects.
However, the bulk of the assistance (3596.8 million Ecu and 54% of the
total) continued to go to regional development projects.
Those projects were located mainly in regions accorded priority under
Community regional policy: in Italy (1802.2 million Ecu), mainly in
the Mezzogiorno (1598.4 million Ecu), in Spain (294.6 million Ecu), in
Greece (2 53 million Ecu), in Ireland (214. 3 million Ecu) and in
Portugal (160.4 million Ecu); loans were also granted for projects in
France (389.6 million Ecu), in the United Kingdom (387.7 million Ecu)
and a small proportion in other countries.
- 68-
These loans were for transport and telecommunications infrastructure
(1412 million Ecu) and for productive investment in industry,
agriculture and services (1211.1 million Ecu). The remainder was
divided between other infrastructure projects, in particular water
engineering (418.5 million Ecu) and energy (555.1 million Ecu).
Financing for projects helping to attain the Community's energy
objectives was used for developing indigenous resources (1400.9
million Ecu, of which 743.4 million Ecu was for nuclear energy), for
the efficient use of energy, particularly within the framework of
global loans (724 million Ecu) and for diversifying imports (354.2
million Ecu).
Loans for environmental protection more than doubled (701. 7 million
Ecu) and went mainly to major projects designed to purify waste water
or to improve the quality of drinking water in Ireland, the United
Kingdom, Germany and France but also to equipment for reducing the
pollution caused by power stations and refineries in Germany, Greece
and Italy.
Loans totalling some 561.5 million Ecu were granted for infrastructure
projects facilitating intra-Community communications.
With the aim of helping to strengthen the competitiveness of European
industry,the Bank granted a total of 573.9 million Ecu for investment
projects which, particularly in the electronics and chemical
industries, are designed to develop or introduce advanced
technologies; in addition, 170 million Ecu were granted for industrial
projects carried out jointly by firms from different member countries
or intended to make it easier for Spanish firms to adapt to the new
market conditions created by accession.
A summary breakdown by sector of the Bank's loans for infrastructure
projects shows the high proportion taken by transport and
telecommunications projects (1887 million Ecu out of 2581.4 million
Ecu) and the continuing high level of loans for equipment projects in
the energy sector.
----·-----------·------- ------------- ---- - --------- ---- ------------------~~~-----------~-------
- 69-
Lending for projects in the productive sectors totalled 1654.3 million
Ecu 960.6 million Ecu went into individual loans, mainly for
investment projects in industry, and a total of 693.7 million Ecu went
into global loans for the financing of small and medium-sized firms.
From global loans on tap in 1986, 2546 allocations totalling 942.7
million Ecu were made, broken down as follows:
- 2104 allocations totalling 572.7 million Ecu for small and
medium-sized ventures in regional aid areas;
- 249 allocations totalling 91.2 million Ecu for small-scale
infrastructure and equipment projects carried out in the same areas
by local authorities;
- 14 allocations totalling 43.6 million Ecu for technologically
innovative investment projects;
- 164 allocations totalling 198.5 million Ecu for industrial and
small-scale infrastructure projects meeting the Community's energy
objectives;
- 15 allocations totalling 36.7 million Ecu from the first global
loans granted for environmental protection purposes.

- 70-
6.3 Euratom
In 1986 the Commission continued its lending activities through
Euratom to finance investment in the industrial production of
nuclear-generated electricity and industrial fuel-cycle installations.
It paid out six loans totalling 443.2 million Ecu for investment
projects undertaken by the following five enterprises:
1. NERSA SA
(for the Creys-Malville project - two loans)
2. Ente Nazionale per l'Energia Elettrica (ENEL)
(for the Montalto di Castro project)
3. Kernkraftwerke Lippe-Emsland (KKW)
(for the Lingen project)
4. South Scottish Electricity Board
(for the North Berwick project)
5. Electricit~ de France
(for the Flamanville project)
All these major projects are being co-financed by Euratom and the EIB;
the EIB, in its capacity as Euratom agent, signed these loan contracts
jointly with the Commission.
Between the inception of Euratom lending activities and 31 December
1986, the Commission paid out loans totalling 2577.5 million Ecu.
The total amount of loans paid out by the ECSC in 1986 was 5.8% higher
than in 1985, amounting to 1069.2 million Ecu (1010.6 million Ecu in
1985). This figure reflects, on the one hand, an increase in
industrial loans under Article 54 and, on the other, a decrease in
conversion loans under Article 56.
-71-
Industrial loans rose from 629.9 million Ecu to 799.5 million Ecu in
1986, an increase of 26.9%. Loans to the steel industry in particular
increased considerably, from 424.6 million Ecu to 661.2 million Ecu.
This amount was divided between 18 loans in four Member States (six
loans in the Federal Republic of Germany, five in France, six in Italy
and one in the Netherlands). In addition, a loan was granted in the
iron ore sector in Germany.
By contrast with 1985, when no loans were granted in the coal sector,
the ECSC paid out in 1986 a loan of 103.6 million Ecu for financing
coal production in Germany.
Loans for financing investment projects designed to promote
consumption of Community coal, generally granted in the form of global
loans, were down (7.7 million Ecu in 1986 compared with 30 million Ecu
in 1985).
By contrast, the new lending instrument for investment designed to
facilitate the disposal of Community steel was well received. Three
loans totalling 16.4 million Ecu were paid out in 1986.
The financing of thermal power-stations was down sharply compared with
the previous year. A single loan of 8.7 million Ecu was paid out in
Germany.
Conversion loans contracted sharply (by 33%), from 363.4 million Ecu
to 243.5 million Ecu in 1986. A total of 71 loans were paid out: three
direct loans totalling 8.5 million Ecu and 68 global loans totalling
235 million Ecu. Global loans thus accounted for 96.5% of the total
amount of conversion loans.
In 1986 the ECSC paid out a total of 26.2 million Ecu to finance
low-cost housing for employees in the coal and steel industries: 17.8
million Ecu was granted from its own funds at an interest rate of 1% a
year and 8.4 million Ecu from borrowings at the market interest rate.
Some 3600 low-cost dwellings were financed this way in 1986, bringing
the number of such dwellings financed by the ECSC since 1954 to more'
than 192 000.

- 72-
6. 5 Interest subsidies
Only two interest-subsidy mechanisms for lending within the Community
were used in 1986:
- ECSC subsidies (on ECSC loans);
- subsidies related to the special aid for the Italian and Greek areas
stricken by earthquakes in November 1980 and February/March 1981.
The !CSC_i.!!,t_!r_!S_!,!,ubs.,!d.!e!. granted by the Commission on ECSC loans in
1986 were reserved for conversion projects financed under Article 56
of the Treaty and for investment projects designed to increase
consumption of Community coal financed under paragraph 2 of Article 54
of the Treaty.
The following table summarizes the subsidy amounts paid out in 1986:
Table 11
ECSC interest subsidies paid out in 1986
( million Ecu)
B DK D F IRL I L NL UK TOTAL
Art. 54 4.42 0.27 0.21 1.00 5.90
Art. 56 0.51 0.23 14.29 0.80 0.12 1.69 0.27 0.13 15.04 33.08
TOTAL 0.51 0.23 18.71 1.07 0.12 1.90 0.27 0.13 16.04 38.98
- 73-
Th!_ in te.!.e_!t _subsidi!_S J2..r _r!!_c2..n.!t ,!!J.£_t io~ !,n_e!,rth.,g,u!,ke-_!t ri cken areas
are governed by Council Decisions 81/19/EEC of 20 January 1981 in the
case of Italy and 81/1013/EEC of 14 December 1981 for Greece. They are
paid annually on the loan interest dates, in non-discounted form, a
rate of 3% per annum being applied to the capital still outstanding;
the loans and subsidies have a maximum life of 12 years.
Tables 17 and 18 in the annex list all the loans signed by the end of
the 1986 financial year, with the amount of each interest subsidy paid
in 1986.
In 1986 the subsidized loans for reconstruction in the areas of
Campania and Basilicata in Italy totalled 24.2 million ECU and were
made from the EIB's own resources.
They were for the development of industrial estates, road
infrastructures and the Naples-Bari motorway.
By the end of 1986, the loans signed for Italy totalled 927 million
Ecu out of the 1000 million Ecu authorized. The entire 80 million Ecu
authorized for Greece had been taken up by a single operation signed
in 1982.
Of the total of 1007 million Ecu in loans signed (68.7% of which was
from NCI resources):
- 57.2% was for economic infrastructure (roads, railways, telephones,
electricity, water supply, industrial estates);
- 39.4% was for social infrastructure (housing, schools and public
buildings);
- 3.4% was for the rehabilitation of the means of production.
On the loans signed since 1981, interest subsidies worth 28.8 million
Ecu were paid out in 1986.
- 74-
7. Lending outside the Community
7.1 General
The EIB has been granting loans outside the Community since 1963 for
projects contributing to the economic and social development of the
countries concerned. The loans are granted from the EIB's own
resources, from those of the EDF and from the general budget of the
Communities.
The 1986 financial year was marked by the entry into force on 1 May of
the third Lo~ Convention concluded with the 66 ACP countries and of
the specific aid arrangements for the Overseas Countries and
Territories. The Convention provides for Community aid of 8500 million
Ecu (7400 million ECU under the EDF and 1100 million Ecu in the form
of loans from the EIB's own resources).
While negotiations on the renewal of the financial protocols concluded
between the EEC and the Mediterranean countries continued, the EIB
committed most of the remaining amounts available under the second
generation of protocols, which were in force until the end of 1986.
In 1986 the EIB granted loans in 18 ACP States and one Overseas
Country or Territory; it provided financings in nine Mediterranean
countries.
In 1986 EIB loans from own resources amounted to 381.8 million Ecu and
to 91.9 million Ecu from Community resources, making a total of 473.7
million Ecu. Of the total amount of loans granted from the EIB's own
resources, 231.1 million Ecu went to Mediterranean countries and 150.7
million Ecu went to the African, Caribbean and Pacific States pursuant
to the second and third Lom~ Conventions and the decisions relating to
the Overseas Countries and Territories.
Operations in the ACP States and the Overseas Countries and
Territories from EDF resources amounted to 59 million Ecu in
risk-capital financing. In the Mediterranean region, loans from
budgetary resources amounted to 32.9 million Ecu.

- 75-
7.2 Loans to Mediterranean countries
In 1986 the EIB continued and largely completed the allocation of the
amounts provided for under the second financial protocols concluded
between the Community and the Maghreb and Mashreq countries and
Israel. It continued to apply the protocols in force with Malta and
Cyprus and granted a loan in Turkey under the reactivated 1973
additional protocol. The loans which the EIB grants from its own
resources to Mediterranean countries are covered by a guarantee from
the Community general budget set at 75% of loans outstanding by a
guarantee contract concluded between the Commission and the EIB.
Financing from the EIB' s own resources in the Mediterranean region
totalled 231.1 million Ecu, with loans amounting to 110.5 million Ecu
in the Maghreb countries, 87.6 million Ecu in the Mashreq countries,
20 million Ecu in Israel and 13 million Ecu in Malta. Loans totalling
33 million Ecu were granted from the Community's budgetary resources
in Tunisia, Cyprus and Turkey.
Of the loans granted, 46.4% (122.5 million Ecu) went to the productive
sector (almost a third in the form of global loans), 35.2% went to
infrastructure projects (92. 8 million Ecu) and 18.4% went to energy
equipment projects (48.7 million Ecu).
In Algeria, 60 million Ecu were granted under the second financial
protocol for upgrading to motorway standard the highway from the south
of Algiers to Blida.
In Tunisia, a total of 63.5 million Ecu (13 million Ecu from budgetary
resources) was lent for the development of agriculture: 20 million Ecu
were allocated to infrastructure projects, irrigation and the purchase
of equipment on five State-run farms; 20 million Ecu were granted in
the form of global loans for agricultural and agro-industrial
projects; 21 million Ecu were used for agricultural complexes in the
north and centre of the country; finally, 2.5 million Ecu went to the
construction of a dairy.
(~
- 76-
In Egypt, EIB loans totalled 62. 5 million Ecu; of that total, 32.5
million Ecu went to the construction of a white cement plant and 30
million Ecu to the extension of the Soubrah el Kheima power station,
which operates principally on natural gas.
In Jordan, a total of 9.1 million Ecu helped to finance work on the
second part of the industrial estate to the south east of Amman and
improvements to the sewage system in the town of Zarqa.
In Syria, a 16 million Ecu loan was granted towards the modernization
and extension of the sewage system in Aleppo.
In Israel, a loan of 20 million Ecu, which exhausted the amount under
the second financial protocol, was granted for small and medium-scale
industrial ventures.
In Cyprus, a 1.2 million Ecu loan from budgetary resources contributed
to the extension of the sewage system in the capital, Nicosia.
In Malta, a loan of 13 million Ecu, which exhausted the amount under
the first financial protocol, enabled internal and international
telecommunications (telephone, telex) to be modernized and extended.
Finally, a total of 18.7 million Ecu was granted to Turkey, pursuant
to the additional protocol concluded at the time of the 1973 Community
enlargement, to finance a hydro-electric project on the River Peri;
the project comprises a dam and a power station which should reduce
the country's dependence on oil imports.
7.3 Loan_! _!o_Afric!!l.J... .£aribbea.!!_ and
Countries and Territories
Pacific States and Overseas
Projects were financed in 18 ACP countries (13 in Africa, 3 in the
Caribbean and 2 in the Pacific) and in one Overseas Country or
Territory (Monserrat). The funds provided totalled 209.7 million Ecu
(150.7 million Ecu from the EIB's own resources and 59 million Ecu in
the form of risk capital assistance).

-77-
The bulk of the loans were granted under the third Lore Convention,
which came into force on 1 May 1986 (205 million Ecu); a further 4.7
million Ecu of loans were committed under the second Convention.
Two thirds of the projects financed in industry are designed to
exploit national resources and to promote local production with the
aim of reducing imports or expanding exports.
The total cost of the investment projects financed amounted to 1430
million Ecu. A total of 85 allocations were made from ongoing global
loans to small and medium-scale investment projects at a total cost of
41.1 million Ecu.
In 1986 the EIB continued to provide funds for the rehabilitation of
industries or infrastructures; more than 40% of those funds went to
the modernization and restructuring of businesses, to the
strengthening of business financial structures in the form of risk
capital and to improvements in infrastructure facilities (water,
electricity).
In Africa, operations totalled 164.4 million Ecu: 108.7 million Ecu in
the form of loans from the EIB's own resources and 55.7 million Ecu in
the form of risk-capital operations. Some 70% of the funds went to the
productive sector. They were used to finance the rehabilitation and
consolidation of capacity for exploiting copper and cobalt deposits in
Zaire, the construction of a cotton ginning plant and the
modernization and extension of a corrugated paper factory in the Ivory
Coast, the restructuring of a chemical complex in Senegal, the
rehabilitation of a textile mill in Madagascar, the construction of a
sawmill and a plywood factory in Malawi,the setting up of a weaving
factory in Mauritius and investment projects carried out by SMEs (17.5
million Ecu of global loans) in Senegal, Burundi and Mauritius.
Energy accounted for some 18% of financings reinforcement and
extension of the high-tension power network in Ghana, construction of
the Roseires hydro-electric complex in the Sudan;risk capital for the
construction of a hydro-electric power station in Equatorial Guinea.

- 78 -
A total of 12% of the funds provided went to infrastructure projects,
and in particular to telecommunications in the Ivory Coast and to
water distribution in the Congo.
In the Caribbean, financings totalled 23.5 million Ecu:21.5 million
Ecu from the EIB's own resources and 2 million Ecu in the form of
risk-capital operations.
Industry received 10 million ECU, all of which went to small and
medium-sized firms in Jamaica.
A loan of 8.5 million Ecu was granted for the repair of the water
supply network in the Bahamas. A loan of 5 million Ecu was granted in
the energy sector for the construction of a thermal power station and
the provision of a power line in St Lucia.
In the Pacific, financings amounted to 21.5 million Ecu : 20.5 million
Ecu in the form of loans from the EIB's own resources and 1 million
Ecu in the form of risk capital.
The bulk of the funds (17 million Ecu) went to the energy sector for
the construction of a dam and the extension of the Ramu power station
in Papua New Guinea. A total of 4.5 million Ecu was allocated to the
modernization and construction of sawmills in Fiji.
One Overseas Country or Territory, Monserrat, received 260000 ECU in
the form of risk capital for a feasibility study relating to the
possible use of wind energy.
- 79-
(1) Doc. PE 67134 of 5.3.81; OJ C 287, 9.11.81
(2) An independent Community institution governed by public law and enjoying operational autonomy in its role as a Bank.
(3) Decision 77/270 Euratom : OJ L 88, 6.4.77
(4) Decision 78/870/EEC : OJ L 298, 25.10.78
(5) Decision 82/169/EEC OJ L 78, 24.3.82
(6) Decision 83/200/EEC : OJ L 112, 28.4.83
(7) Decision 81/19/EEC : OJ L 37, 10.2.81
(B) Decision 81/1013/EEC : OJ L 367, 23.12.81
(9) Doc. COM(83)207 final.
(10) Doc. COM(86)292 final.
(11) Council Directive 86/566/EEC of 17.11.86; OJ L 332, 26.11.86.
(12) OJ L 375, 31.12.1985. This Directive, which lays down minimum common rules for the organization and operation of such undertakings, will not come into force until October 1989. The liberalization of the admission of units issued by such undertakings to the capital market of another Member State will therefore not take effect until that date.
(13) Doc. COM(85)310 final, 14.6.1985.
(14) Doc. COM(86)723 final.
(15) Doc. COM(87) 100.
(16) Doc. COM(86) 722.
(17) Doc. COM(86) 340, 25.6.1986.
(18) The EFEC's registerd office is in Luxembourg (10, bld Royal -L-2449).
(19) See COM(86) 603 final.
(20) Doc. COM(85)570 final of 17 October 1985.
(21) Doc. COM(85)250 final.
(22) Council Decision 87/182/EEC of 9 March 1987; OJ L 71, 14.3.87
(23) OJ L 334, 12.12.1985
(24) Decision 81/19/EEC, OJ L 37, 10.2.1981.
(25) Decision 81/1013/EEC, OJ L 367, 23.12.1981.

A N N E X E S
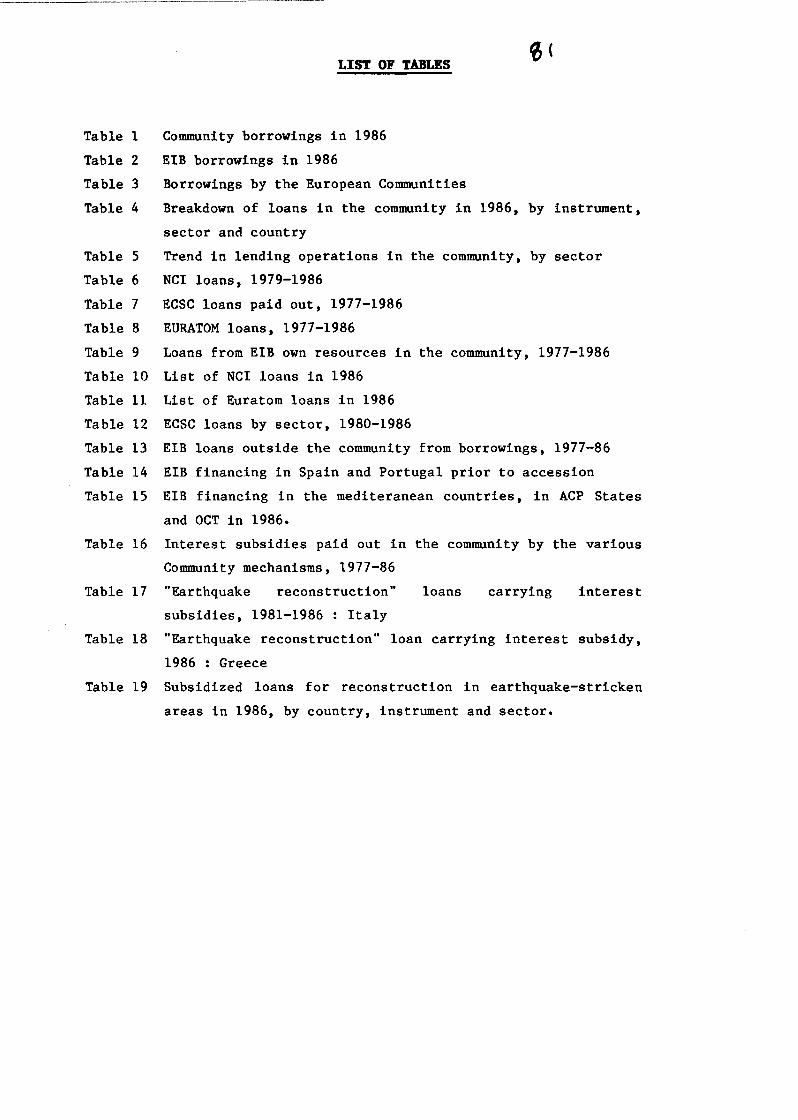
Table 1
Table 2
Table 3
Table 4
Table 5
Table 6
Table 7
Table 8
Table 9
Table 10
Table 11
Table 12
Table 13
Table 14
Table 15
Table 16
LIST OF TABLES
Community borrowings in 1986
EIB borrowings in 1986
Borrowings by the European Communities
~(
Breakdown of loans in the community in 1986, by instrument,
sector and country
Trend in lending operations in the community, by sector
NCI loans, 1979-1986
ECSC loans paid out, 1977-1986
EURATOM loans, 1977-1986
Loans from EIB own resources in the community, 1977-1986
List of NCI loans in 1986
List of Euratom loans in 1986
ECSC loans by sector, 1980-1986
EIB loans outside the community from borrowings, 1977-86
EIB financing in Spain and Portugal prior to accession
EIB financing in the mediteranean countries, in ACP States
and OCT in 1986.
Interest subsidies paid out in the community by the various
Community mechanisms, 1977-86
Table 17 "Earthquake reconstruction"
subsidies, 1981-1986 : Italy
loans carrying interest
Table 18 "Earthquake reconstruction" loan carrying interest subsidy,
1986 : Greece
Table 19 Subsidized loans for reconstruction in earthquake-stricken
areas in 1986, by country, instrument and sector.
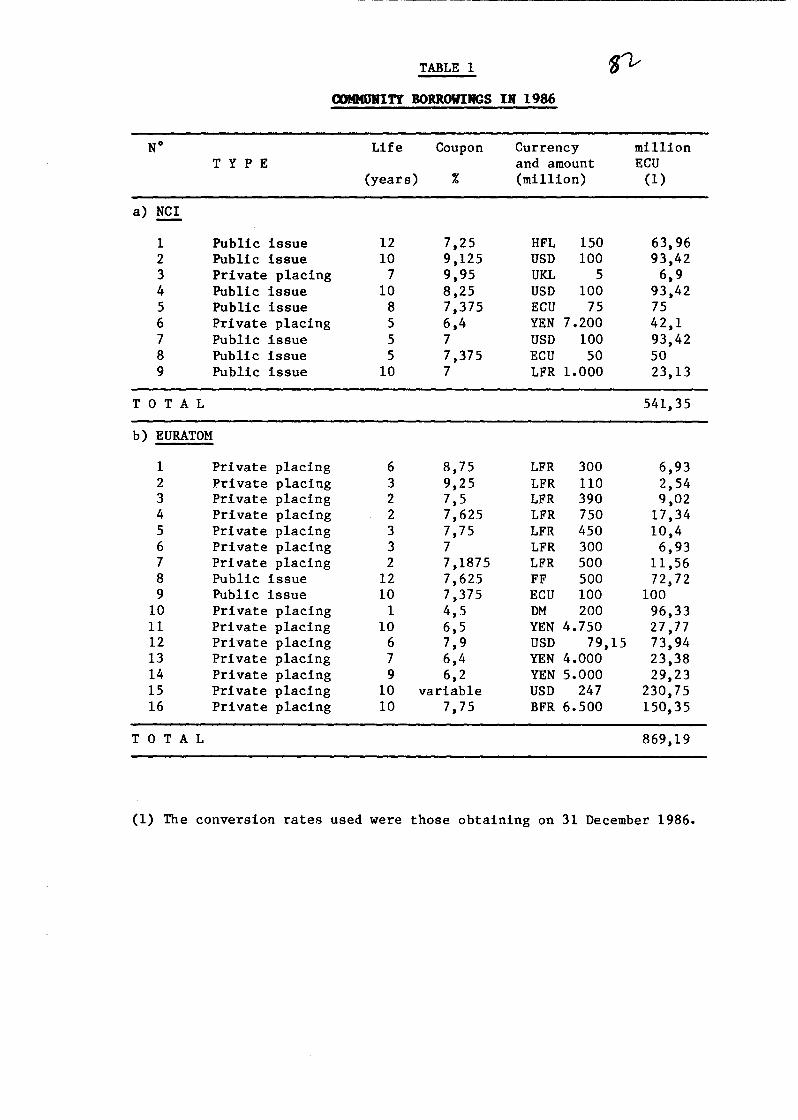
TABLE 1 8'1--OOMMURITY BORROWIJIGS IN 1986
No Life Coupon Currency million T Y P E and amount ECU
(years) % (million) (1)
a) NCI
1 Public issue 12 7,2S HFL 1SO 63,96 2 Public issue 10 9 ,12S USD 100 93,42 3 Private placing 7 9,9S UKL s 6,9 4 Public issue 10 8,2S USD 100 93,42 s Public issue 8 7,37S ECU 7S 7S 6 Private placing s 6,4 YEN 7.200 42,1 7 Public issue s 7 USD 100 93,42 8 Public issue s 7,37S ECU so so 9 Public issue 10 7 LFR 1.000 23,13
T 0 T A L S41,3S
b) EURATOM
1 Private placing 6 8, 7 s LFR 300 6,93 2 Private placing 3 9,2S LFR 110 2,S4 3 Private placing 2 7,S LFR 390 9,02 4 Private placing 2 7,62S LFR 7SO 17,34 s Private placing 3 7,7S LFR 4SO 10,4 6 Private placing 3 7 LFR 300 6,93 7 Private placing 2 7,187S LFR soo ll,S6 8 Public issue 12 7,62S FF soo 72,72 9 Public issue 10 7,37S ECU 100 100
10 Private placing 1 4,S DM 200 96,33 11 Private placing 10 6,S YEN 4.7SO 27,77 12 Private placing 6 7,9 USD 79,1S 73,94 13 Private placing 7 6,4 YEN 4.000 23,38 14 Private placing 9 6,2 YEN S.OOO 29,23 1S Private placing 10 variable USD 247 230,7S 16 Private placing 10 7,7S BFR 6.SOO 1S0,3S
T 0 T A L 869,19
(1) The conversion rates used were those obtaining on 31 December 1986.
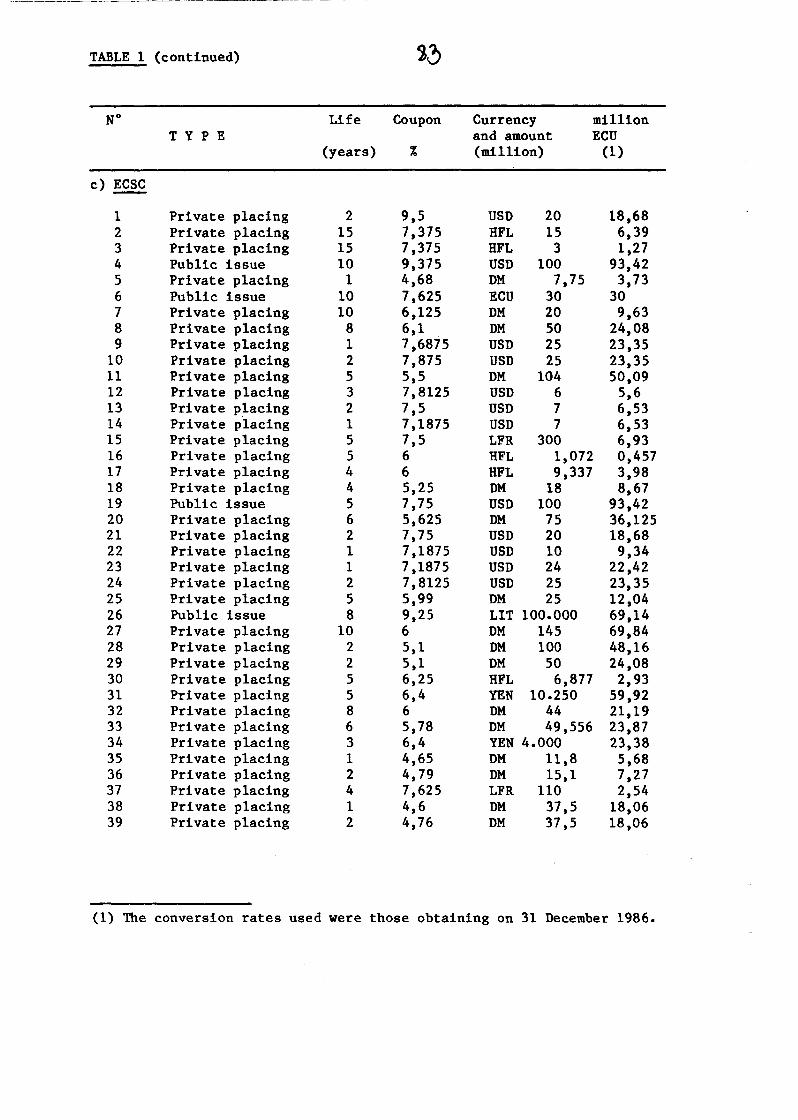
TABLE 1 (continued)
No Life Coupon Currency million T Y P E and amount ECU
(years) % (million) (1)
c) !£!£
1 Private placing 2 9,5 USD 20 18,68 2 Private placing 15 7,375 HFL 15 6,39 3 Private placing 15 7,375 HFL 3 1,27 4 Public issue 10 9,375 USD 100 93,42 5 Private placing 1 4,68 DM 7,75 3,73 6 Public issue 10 7,625 ECU 30 30 7 Private placing 10 6,125 DM 20 9,63 8 Private placing 8 6,1 DM 50 24,08 9 Private placing 1 7,6875 USD 25 23,35
10 Private placing 2 7,875 USD 25 23,35 11 Private placing 5 5,5 DM 104 50,09 12 Private placing 3 7,8125 USD 6 5,6 13 Private placing 2 7,5 USD 7 6,53 14 Private placing 1 7,1875 USD 7 6,53 15 Private placing 5 7,5 LFR 300 6,93 16 Private placing 5 6 HFL 1,072 0,457 17 Private placing 4 6 HFL 9,337 3,98 18 Private placing 4 5,25 DM 18 8,67 19 Public issue 5 7,75 USD 100 93,42 20 Private placing 6 5,625 DM 75 36,125 21 Private placing 2 7,75 USD 20 18,68 22 Private placing 1 7,1875 USD 10 9,34 23 Private placing 1 7,1875 USD 24 22,42 24 Private placing 2 7,8125 USD 25 23,35 25 Private placing 5 5,99 DM 25 12,04 26 Public issue 8 9,25 LIT 100.000 69,14 27 Private placing 10 6 DM 145 69,84 28 Private placing 2 5,1 DM 100 48,16 29 Private placing 2 5,1 DM 50 24,08 30 Private placing 5 6,25 HFL 6,877 2,93 31 Private placing 5 6,4 YEN 10.250 59,92 32 Private placing 8 6 DM 44 21,19 33 Private placing 6 5,78 DM 49,556 23,87 34 Private placing 3 6,4 YEN 4.000 23,38 35 Private placing 1 4,65 DM 11,8 5,68 36 Private placing 2 4,79 DM 15,1 7,27 37 Private placing 4 7,625 LFR 110 2,54 38 Private placing 1 4,6 DM 37,5 18,06 39 Private placing 2 4,76 DM 37,5 18,06
(1) The conversion rates used were those obtaining on 31 December 1986.

TABLE 1 (continued) g't
No Life Coupon Currency million TYPE and amount ECU
(years) % (million) (1)
40 Private placing 5 4,75 SFR 41,2 23,73 41 Private placing 4 4,75 SFR 43,8 25,23 42 Private placing 2 4,75 SFR 7,6 4,37 43 Private placing 3 4,75 SFR 30 17,28 44 Private placing 4 6,4 YEN 5000 29,23 45 Private placing 2 9,93 UKL 20 27,58 46 Private placing 10 6,6 DM 40,6 19,55 47 Private placing 10 10 LIT 12000 8,29 48 Public issue 3 7 USD 75 70,06 49 Private placing 10 8 ECU 15 15 50 Private placing 4 variable USD 40,6 37,93 51 Public issue 10 8,25 USD 108 100,89 52 Private placing 5 11,7 UKL 1 1,37 53 Private placing 2 8,4 FF 60 8,72 54 Private placing 3 8,5 FF 60 8,72 55 Private placing 15 7 DM 17,5 8,42 56 Private placing 5 5,95 DM 44,3 21,33 57 Private placing 14 6,71 HFL 13,4 5,71 58 Private placing 10 8,25 USD 85 79,41 59 Private placing 10 10 LIT 6000 4,14 60 Private placing 10 6,5 DM 20 9,63 61 Public issue 10 8 ECU 100 100 62 Private placing 6 5,87 DM 11,45 5,51 63 Public issue 4 5,375 YEN 20000 116,92 64 Private placing 5 5,75 DM 50 24,08 65 Private placing 5 5,8 DM 67,479 32,5 66 Private placing 1 4,95 DM 3,951 1,9
T 0 T A L 1739,68
TOTAL NCI + EURATOM + ECSC 3150,22
(1) The conversion rates used were those obtaining on 31 December 1986.
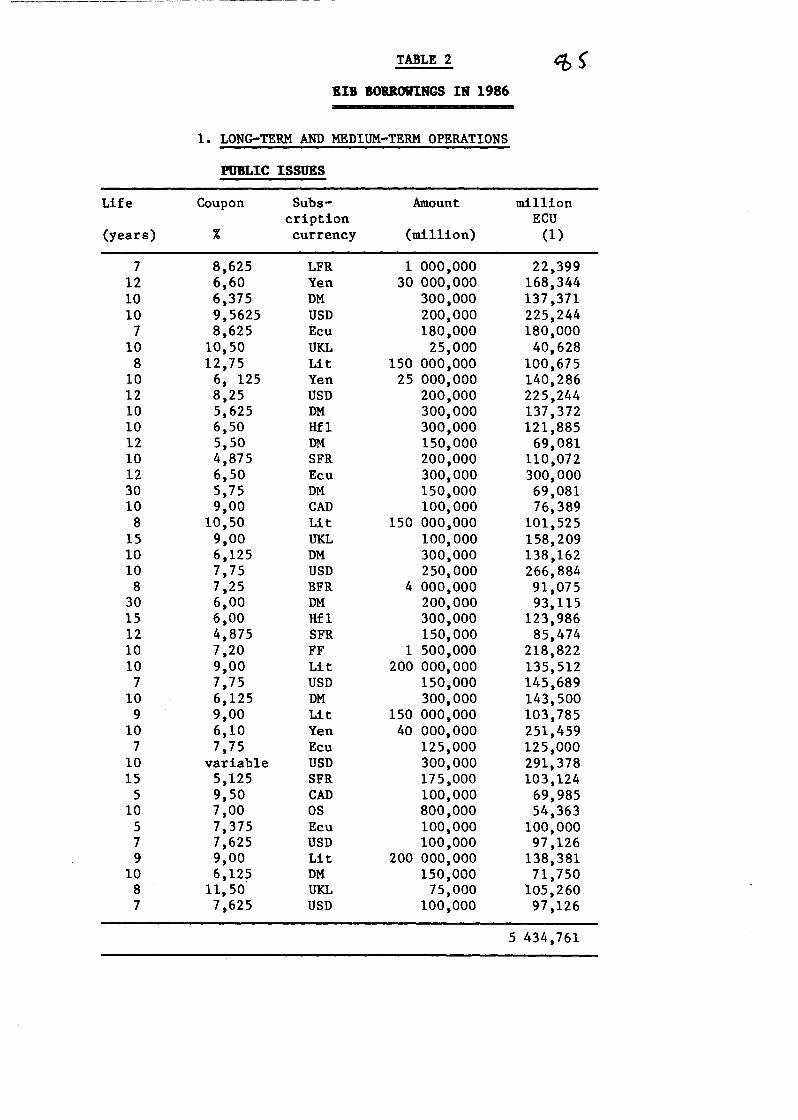
TABLE 2 <;~
EIB BORROWINGS IN 1986
1. LONG-TERM AND MEDIUM-TERM OPERATIONS
PUBLIC ISSUES
Life Coupon Subs- Amount million cription ECU
(years) % currency (million) (1)
7 8,625 LFR 1 000,000 22,399 12 6,60 Yen 30 000,000 168,344 10 6,375 DM 300,000 137,371 10 9,5625 USD 200,000 225,244
7 8,625 Ecu 180,000 180,000 10 10,50 UKL 25,000 40,628
8 12,75 Lit 150 000,000 100,675 10 6, 125 Yen 25 000,000 140,286 12 8,25 USD 200,000 225,244 10 5,625 DM 300,000 137,372 10 6,50 Hfl 300,000 121,885 12 5,50 DM 150,000 69,081 10 4,875 SFR 200,000 110,072 12 6,50 Ecu 300,000 300,000 30 5,75 DM 150,000 69,081 10 9,00 CAD 100,000 76,389
8 10,50 Lit 150 000,000 101,525 15 9,00 UKL 100,000 158,209 10 6,125 DM 300,000 138,162 10 7,75 USD 250,000 266,884 8 7,25 BFR 4 000,000 91,075
30 6,00 DM 200,000 93,115 15 6,00 Hfl 300,000 123,986 12 4,875 SFR 150,000 85,474 10 7,20 FF 1 500,000 218,822 10 9,00 Lit 200 000,000 135,512
7 7,75 USD 150,000 145,689 10 6,125 DM 300,000 143,500
9 9,00 Lit 150 000,000 103,785 10 6,10 Yen 40 000,000 251,459
7 7,75 Ecu 125,000 125,000 10 variable USD 300,000 291,378 15 5,125 SFR 175,000 103,124
5 9,50 CAD 100,000 69,985 10 7,00 OS 800,000 54,363
5 7,375 Ecu 100,000 100,000 7 7,625 USD 100,000 97,126 9 9,00 Lit 200 000,000 138,381
10 6,125 DM 150,000 71,750 8 11,50 UKL 75,000 105,260 7 7,625 USD 100,000 97,126
5 434,761
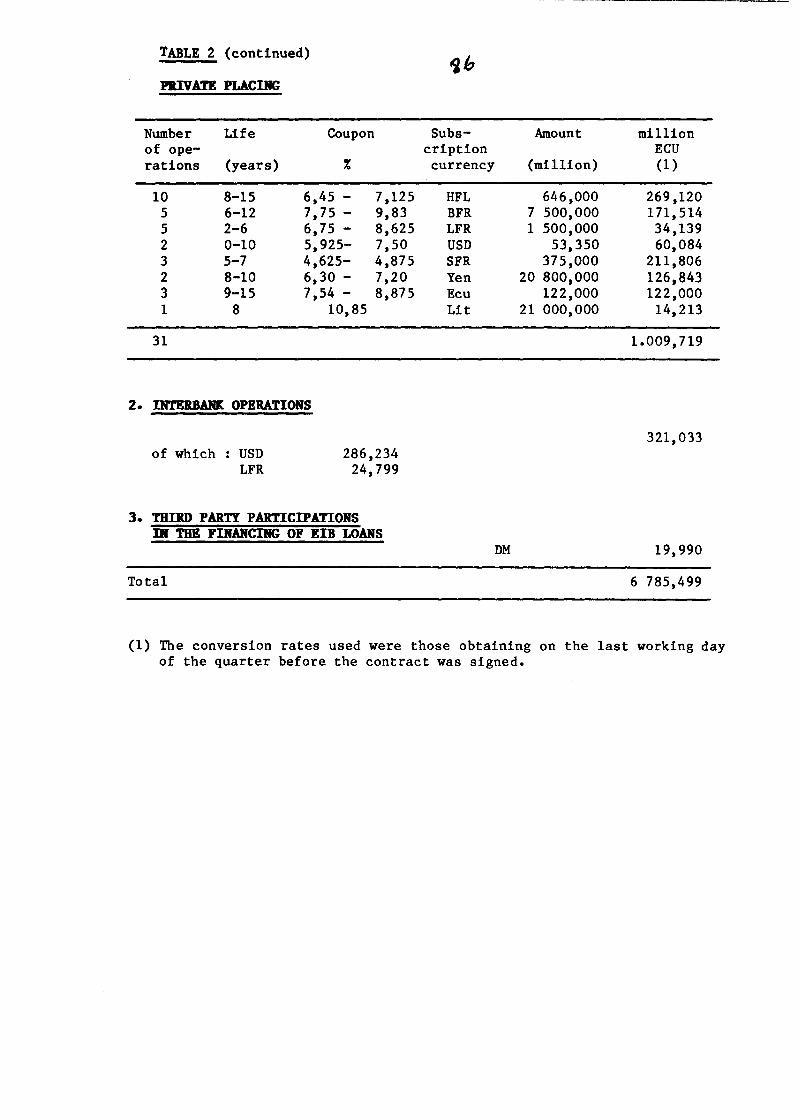
TABLE 2 (continued)
PRIVATE PLACING
Number Life Coupon of ope-rations (years) %
10 8-15 6,45 - 7,125 5 6-12 7,75- 9,83 5 2-6 6,75 - 8,625 2 0-10 5,925- 7,50 3 5-7 4,625- 4,875 2 8-10 6,30 - 7,20 3 9-15 7,54- 8,875 1 8 10,85
31
2. INTERBARK OPERATIONS
of which USD LFR
286,234 24,799
3. THIRD PARTY PARTICIPATIONS D THE FINANCING OF EIB LOANS
Total
~h
Subs- Amount million cription ECU currency (million) (1)
HFL 646,000 269,120 BFR 7 500,000 171,514 LFR 1 500,000 34,139 USD 53,350 60,084 SFR 375,000 211,806 Yen 20 800,000 126,843 Ecu 122,000 122,000 Lit 21 000,000 14,213
1.009,719
321,033
DM 19,990
6 785,499
(1) The conversion rates used were those obtaining on the last working day of the quarter before the contract was signed.
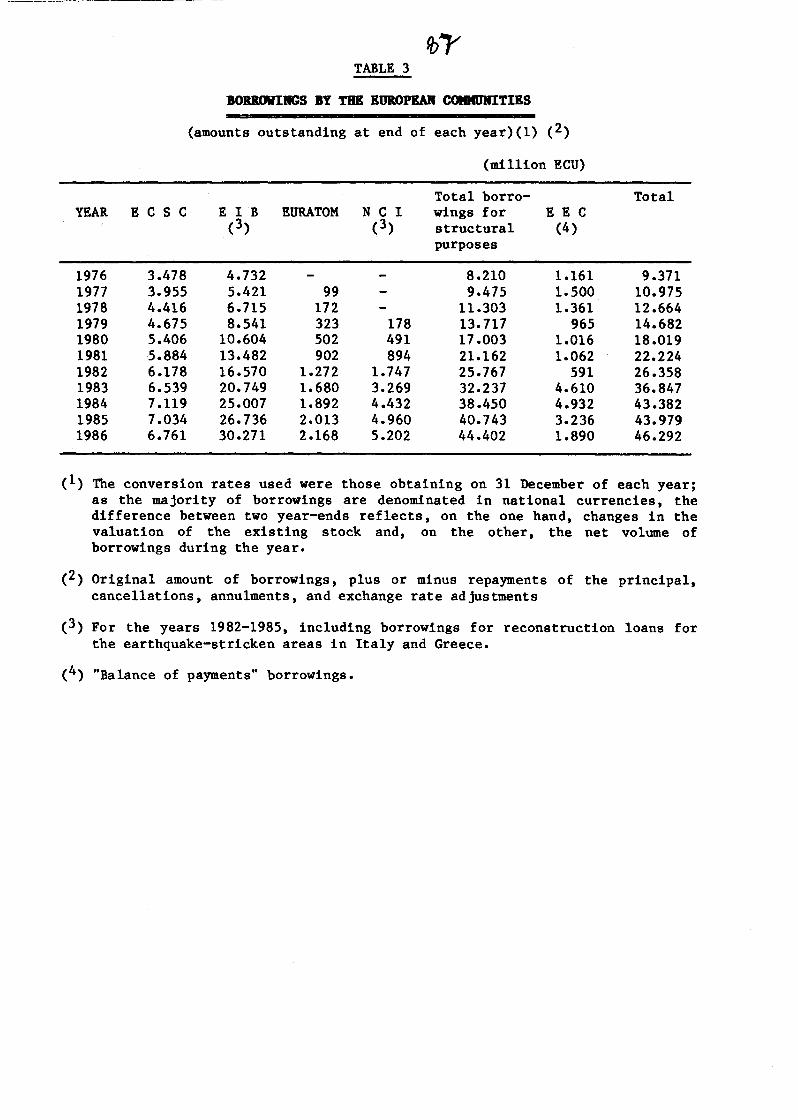
------- -------
fb-r TABLE 3
BOUOWIBGS BY THE EUR.OPEAB COMMUNITIES
(amounts outstanding at end of each year)(1) (2)
(million ECU)
Total borro- Total YEAR E C S C E I B EURATOM N C I wings for E E C
(3) (3) structural (4) purposes
1976 3.478 4.732 8.210 1.161 9.371 1977 3.955 5.421 99 9.475 1.500 10.975 1978 4.416 6.715 172 11.303 1.361 12.664 1979 4.675 8.541 323 178 13.717 965 14.682 1980 5.406 10.604 502 491 17.003 1.016 18.019 1981 5.884 13.482 902 894 21.162 1.062 22.224 1982 6.178 16.570 1.272 1.747 25.767 591 26.358 1983 6.539 20.749 1.680 3.269 32.237 4.610 36.847 1984 7.119 25.007 1.892 4.432 38.450 4.932 43.382 1985 7.034 26.736 2.013 4.960 40.743 3.236 43.979 1986 6.761 30.271 2.168 5.202 44.402 1.890 46.292
(1) The conversion rates used were those obtaining on 31 December of each year; as the majority of borrowings are denominated in national currencies, the difference between two year-ends reflects, on the one hand, changes in the valuation of the existing stock and, on the other, the net volume of borrowings during the year.
(2) Original amount of borrowings, plus or minus repayments of the principal, cancellations, annulments, and exchange rate adjustments
(3) For the years 1982-1985, including borrowings for reconstruction loans for the earthquake-stricken areas in Italy and Greece.
(4) "Balance of payments" borrowings.
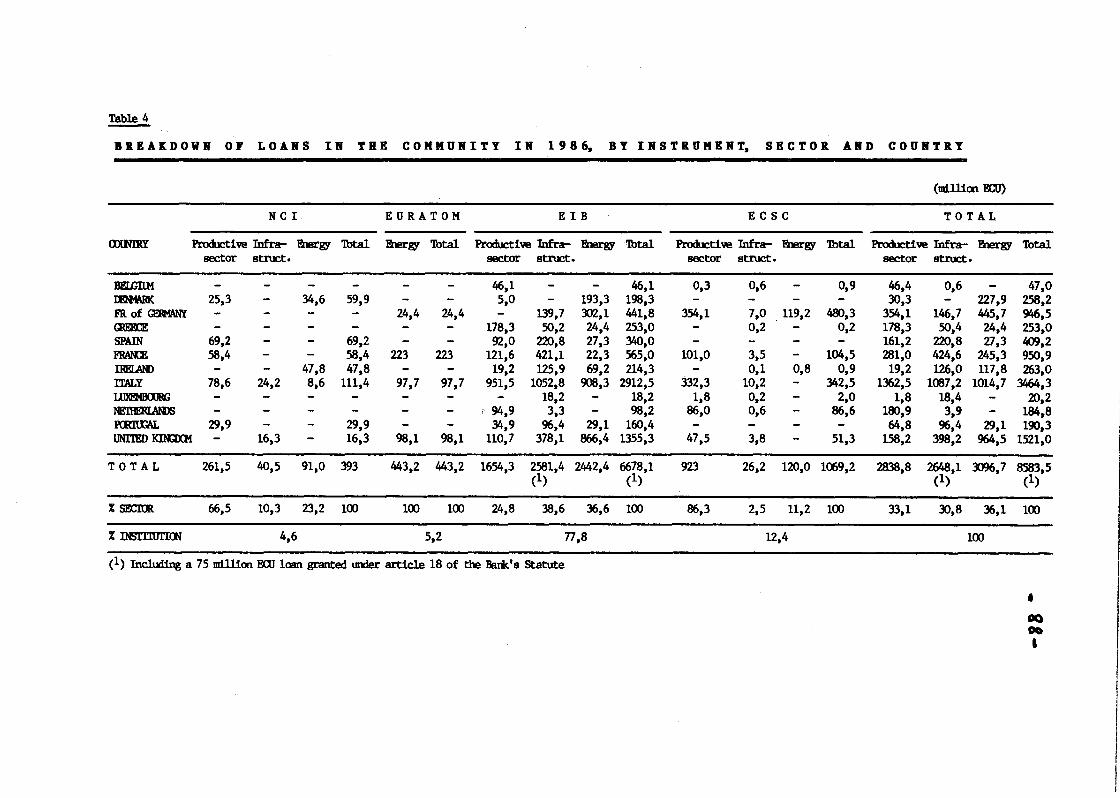
Table 4
BB.EAKDOWR or LOARS IR THE COMMURITY IR 19 8 6. II Y I R S T B. U M E R T. SECTOB. ARD COURTB.Y
(milli.m Ern)
NCI EURATOM EIB ECSC TOTAL
CXXMRY Product! ve Infra- '&lergy 'lbtal '&lergy 'lbtal Productive Infra- '&lergy Total Productive Infra- '&lergy 'lbtal Productive Infra- l!hergy 'lbtal sector stiUCto sector stiUCt. sector stiUCt. sector stiUCt.
Bll'.UmM - - - - - - -46,1 - - -46,1 0,3 0,6 - 0,9 -46,4 0,6 - 47,0 IEtfARK 25,3 - 34,6 59,9 - - 5,0 - 193,3 198,3 - - - - 30,3 - 227,9 258,2 FR.of<F.RHANY - - - - 24,4 24,4 - 139,7 ))2,1 441,8 354,1 7,0 119,2 480,3 354,1 1-46,7 445,7 946,5 GmPC:E - - - - - - 178,3 50,2 24,4 253,0 - 0,2 - 0,2 178,3 50,4 24,4 253,0 SPAIN 69,2 - - 69,2 - - 92,0 220,8 27,3 340,0 - - - - 161,2 220,8 27,3 lt09,2 FRAl'CE .58,4 - - .58,4 223 223 121,6 421,1 22,3 .565,0 101,0 3,5 - 104,5 281,0 424,6 245,3 950,9 IRElAND - - 47,8 47,8 - - 19,2 125,9 69,2 214,3 - 0,1 0,8 0,9 19,2 126,0 117,8 263,0 ITALY 78,6 24,2 8,6 111,4 97,7 97,7 951,5 1052,8 908,3 2912,5 332,3 10,2 - 342,5 1362,5 1087,2 1014,7 3464,3 IlJXF.MBOORG - - - - - - - 18,2 - 18,2 1,8 0,2 - 2,0 1,8 18,4 - 20,2 NE'l1!F.RIANil) - - - - - - 0 94,9 3,3 - 98,2 86,0 0,6 - 86,6 180,9 3,9 - 184,8 ~ 29,9 - - 29,9 - - 34,9 96,4 29,1 160,4 - - - - 64,8 96,4 29,1 190,3 UNI'1ED KitGXM - 16,3 - 16,3 . 98,1 98,1 110,7 378,1 866,4 1355,3 47,5 3,8 - 51,3 1.58,2 398,2 964,5 1521,0
TOTAL 261,5 40,5 91,0 393 443,2 443,2 1654,3 2.581,4 2442,4 6678,1 923 26,2 120,0 1069,2 2838,8 2648,1 3096,7 8.583,5 (1) (1) (1) (1)
%~ 66,5 10,3 23,2 100 100 100 24,8 38,6 36,6 100 86,3 2,5 11,2 100 33,1 30,8 36,1 100
% INSTI'll1l'I~ 4,6 5,2 n,8 12,4 100
( 1) Including a 7 5 m1lli.m EaJ loan granted \DJer article 18 of the Bark's Statute
• OQ 00
'
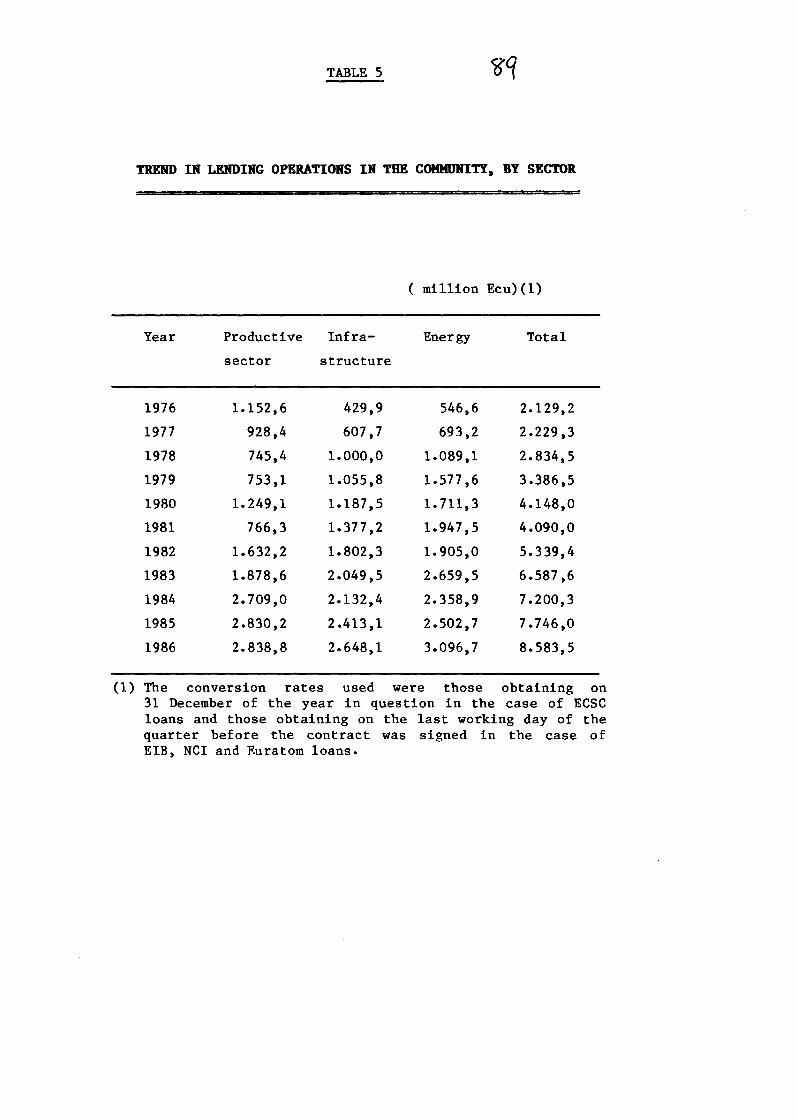
--- -----------------------------------------------------------
TABLE 5
TREND IN LENDING OPERATIONS IN THE COMMUHITY, BY SECTOR
Year
1976
1977
1978
1979
1980
1981
1982
1983
1984
1985
1986
Productive
sector
1.152,6
928,4
745,4
753,1
1.249,1
766,3
1.632,2
1.878,6
2.709,0
2.830,2
2.838,8
Infra-
structure
429,9
607,7
1. 000,0
1.055,8
1.187,5
1.377,2
1.802,3
2.049,5
2.132,4
2.413,1
2.648,1
(million Ecu)(1)
Energy
546,6
693,2
1.089,1
1.577,6
1.711,3
1.947,5
1.905,0
2.659,5
2.358,9
2.502,7
3.096,7
Total
2.129,2
2.229,3
2.834,5
3.386,5
4.148,0
4.090,0
5.339,4
6.587,6
7.200,3
7.746,0
8.583,5
(1) The conversion rates used were those obtaining on 31 December of the year in question in the case of ECSC loans and those obtaining on the last working day of the quarter before the contract was signed in the case of EIB, NCI and Euratom loans.
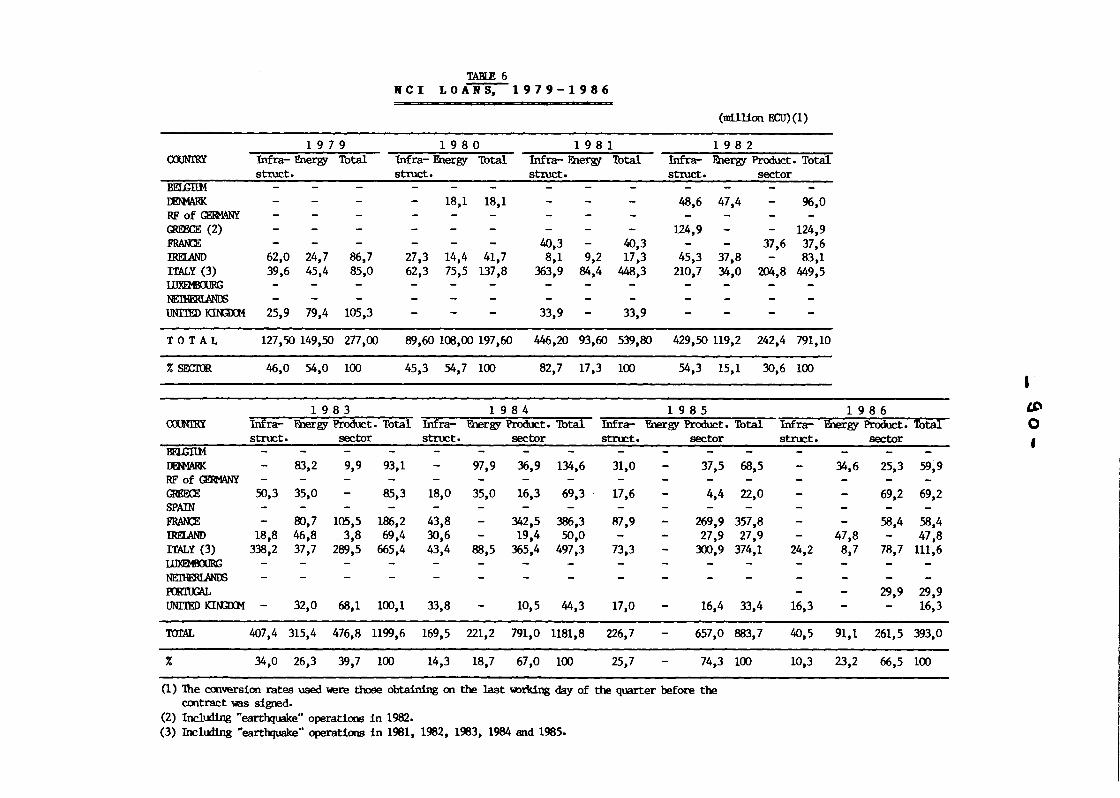
TABlE 6 RCI LOANS, 1979-1986
(million ECU)(l)
1 9 7 9 1 9 8 0 1 9 8 1 1 9 8 2 CXl.lNl'RY Infra- Energy Total Infra- Fnergy Total Infra- Fnergy Thtal Infra- Fnergy Product. Total
struct. struct. struct. struct. sector BEI..GilM ~ - - - - 18,1 18,1 - - - 48,6 47,4 - 96,0 RFofGERMANY GREECE (2) - - - - - - - - - 124,9 - - 124,9 FRArn: - - - - - - 40,3 - 40,3 - - 37,6 37,6 IRELAND 62,0 24,7 86,7 27,3 14,4 41,7 8,1 9,2 17,3 45,3 37,8 - 83,1 ITALY (3) 39,6 45,4 85,0 62,3 75,5 137,8 363,9 84,4 448,3 210,7 34,0 204,8 449,5 I1JXI<MinlRG NEmERlANil)
UNI'1'ED KilGXM 25,9 79,4 105,3 - - - 33,9 - 33,9
TOTAL 127,50 149,50 277,00 89,60 108,00 197,60 446,20 93,60 539,80 429,50 119,2 242,4 791,10
% SECIUR 46,0 54,0 100 45,3 54,7 100 82,7 17,3 100 54,3 15,1 30,6 100
1983 1 9 8 4 1 9 8 5 1 9 8 6 <mNl'RY Writ- -Filergy Product. Thtal Infra- Fnergy Product. Thtal Infra- F.nergy Product. Thtal Infra- F.nergy Product. Thtal
struct. sector struct. sector struct. sector BELGilM - - - - - - - - - - - -JJFNofARK - 83,2 9,9 93,1 - 97,9 36,9 134,6 31,0 - 37,5 68,5 RFofrnRMANY GREECE 50,3 35,0 - 85,3 18,0 35,0 16,3 69,3 17,6 - 4,4 22,0 SPAIN FRArn: - 80,7 105,5 186,2 43,8 - 342,5 386,3 87,9 - 269,9 357,8 IRELAND 18,8 46,8 3,8 69,4 30,6 - 19,4 50,0 - - 27,9 27,9 ITALY (3) 338,2 37,7 289,5 665,4 43,4 88,5 365,4 497,3 73,3 - 300,9 374,1 llJXEMinlRG NEmERlANil)
:roR1tW. UNTIED r<nnxM - 32,0 68,1 100,1 33,8 - 10,5 44,3 17,0 - 16,4 33,4
rorAL 407,4 315,4 476,8 1199,6 169,5 221,2 791,0 1181,8 226,7 - 657,0 883,7
% 34,0 26,3 39,7 100 14,3 18,7 67,0 100 25,7 - 74,3
(1) The conversion rates used were those obta.ining on the last 'Wt:>r\dng day of the quarter before the contract was sigred.
(2) Incluling "earthquake" operations in 1982. (3) Including "earthquake" operations in 1981, 1982, 1983, 1984 and 1985.
100
struct. sector - - - -- 34,6 25,3 59,9
- - 69,2 69,2
- - 58,4 58,4 - 47,8 - 47,8
24,2 8,7 78,7 111,6
- - 29,9 29,9 16,3 - - 16,3
40,5 91,1 261,5 393,0
10,3 23,2 66,5 100
I lJ)
0
'
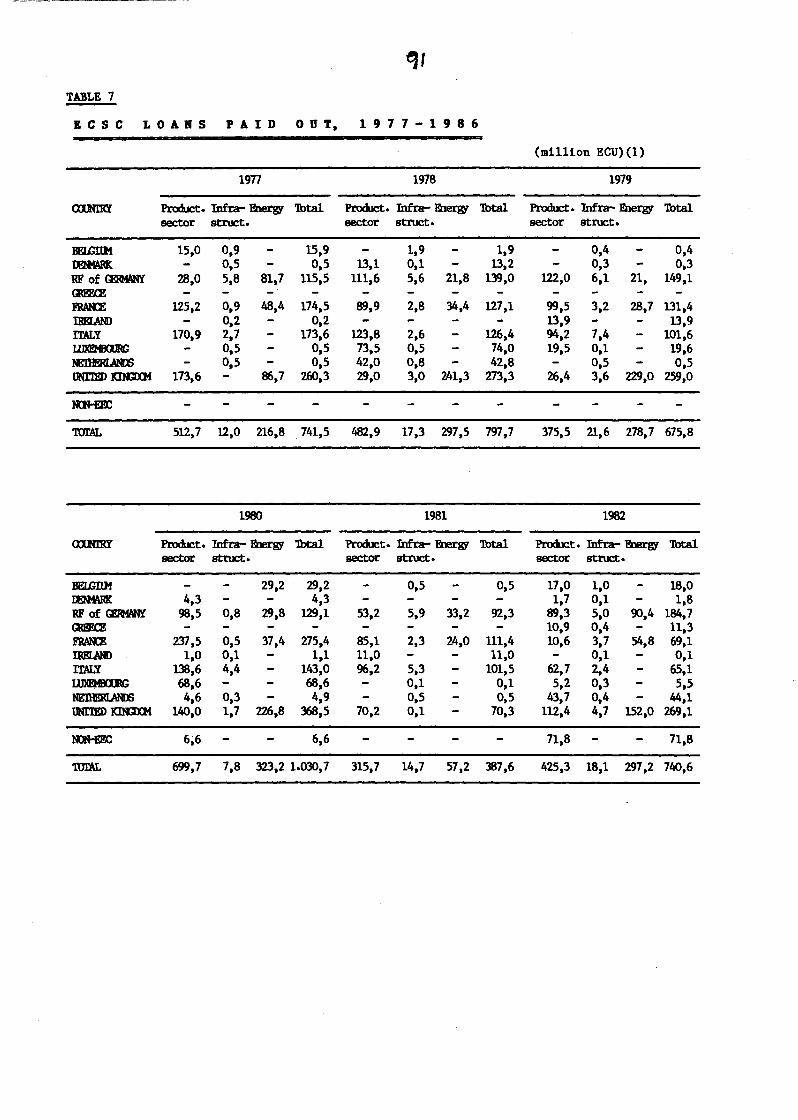
qr TABLE 7
B C S C LOARS PAID 0 U T, 1 9 7 7 - 1 9 8 6
(million ECU)(1)
1977 1978 1979
Product. Infra- Fnergy Total Product. Infra- Fnergy Total Product. Infra- Fnergy Total sector sttuct. sector struct. sector struct.
BElmtM 15,0 0,9 15,9 1,9 1,9 0,4 0,4 ~ 0,5 0,5 13,1 0,1 13,2 0,3 0,3 RF of CDMANY 28,0 5,8 81,7 115,5 111,6 5,6 21,8 139,0 122,0 6,1 21, 149,1 QlF.FlE F1W[E 125,2 0,9 48,4 174,5 89,9 2,8 34,4 127,1 99,5 3,2 28,7 131,4 IRElAN> 0,2 0,2 13,9 13,9 ITALY 170,9 2,7 173,6 123,8 2,6 126,4 94,2 7,4 101,6 UlXEMimRG 0,5 0,5 73,5 0,5 74,0 19,5 0,1 19,6 ~ 0,5 0,5 42,0 0,8 42,8 0,5 0,5 UNl'lPD KilGXM 173,6 ~.7 260,3 29,0 3,0 241,3 273,3 26,4 3,6 229,0 259,0
lUJ-EII:
rorAL 512,7 12,0 216,8 741,5 482,9 17,3 297,5 797,7 375,5 21,6 278,7 675,8
1980 1981 1982
Product. Infra- Pnergy Total Product. Infra- Fnergy Total Product. Infra- Fnergy Total sector sttuct. sector stiUct· sector struct.
BELGilM 29,2 29,2 0,5 0,5 17,0 1,0 18,0 IErtfARK 4,3 4,3 1,7 0,1 1,8 RFof~ 98,5 0,8 29,8 129,1 53,2 5,9 33,2 92,3 89,3 5,0 90,4 184,7 QlF.FlE 10,9 0,4 11,3 F1W[E 237,5 0,5 37,4 275,4 85,1 2,3 24,0 111,4 10,6 3,7 54,8 69,1 IRELAND 1,0 0,1 1,1 11,0 11,0 0,1 0,1 ITALY 138,6 4,4 143,0 96,2 5,3 101,5 62,7 2,4 65,1 ~ 68,6 68,6 0,1 0,1 5,2 0,3 5,5 NE'llD!'.RlANl) 4,6 0,3 4,9 0,5 0,5 43,7 0,4 ~.1 tlNilED KllGXM 140,0 1,7 226,8 368,5 70,2 0,1 70,3 112,4 4,7 152,0 269,1
lOl-EEC 6,6 6,6 71,8 71,8
1.UrAL 699,7 7,8 323,2 1.030, 7 315,7 14,7 57,2 387,6 425,3 18,1 297,2 740,6
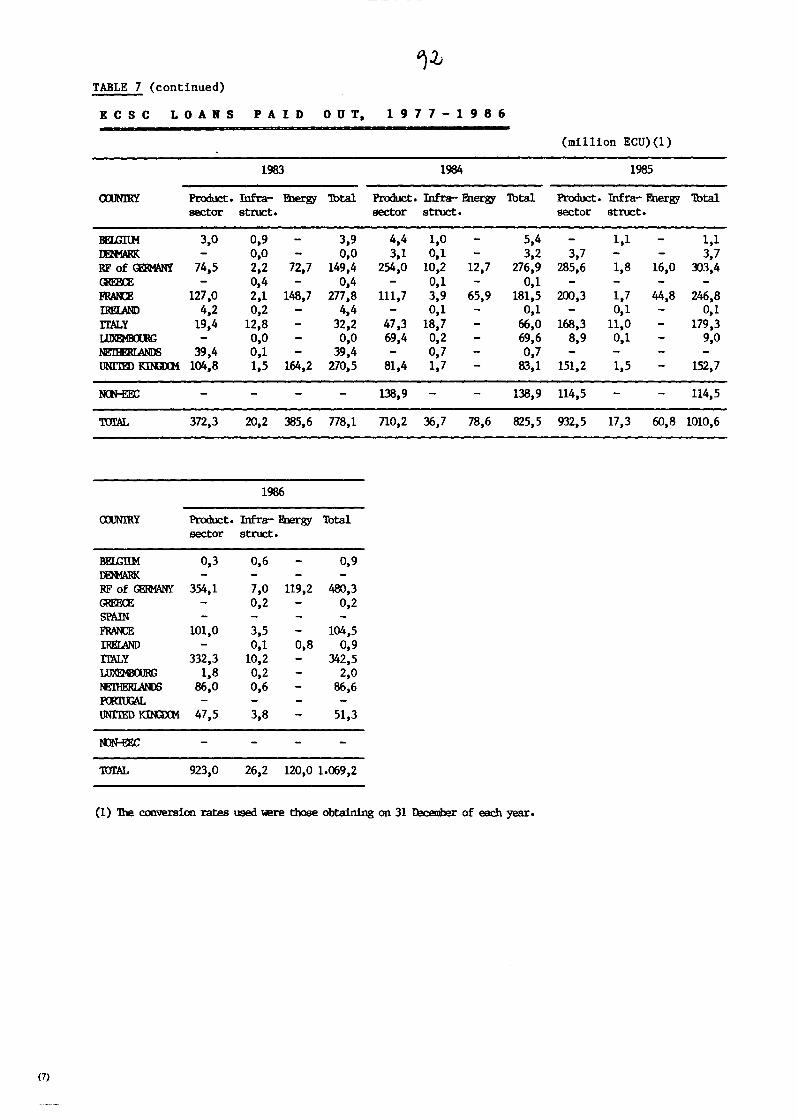
~.2; TABLE 7 (continued)
E C S C LOARS PAID 0 U T, 1 9 7 7 - 1 9 8 6
(million ECU)(1)
1983 1984 1985
Product. Infra- Fnecyy Total Product. Infra- Fnergy 'lbtal Product. Infra- Fnergy 'lbtal sector stnJct. sector struct. sector stnJct.
BELGilM 3,0 0,9 3,9 4,4 1,0 5,4 1,1 1,1 IE+fARK o,o o,o 3,1 0,1 3,2 3,7 3,7 RFof<ERWINY 74,5 2,2 72,7 149,4 254,0 10,2 12,7 276,9 285,6 1,8 16,0 ~)3,4 GRE'.F.Q': 0,4 0,4 0,1 0,1 FlWl:E 127,0 2,1 148,7 277,8 111,7 3,9 65,9 181,5 200,3 1,7 44,8 246,8 IRELAND 4,2 0,2 4,4 0,1 0,1 0,1 0,1 ITALY 19,4 12,8 32,2 47,3 18,7 66,0 168,3 11,0 179,3 Ull!EHlmRG o,o o,o 69,4 0,2 69,6 8,9 0,1 9,0 ~ 39,4 0,1 39,4 0,7 0,7 UNlTED KilGlM 104,8 1,5 164,2 270,5 81,4 1,7 83,1 151,2 1,5 152,7
NCN-EEC 138,9 138,9 114,5 114,5
TOl'AL 372,3 20,2 385,6 778,1 710,2 36,7 78,6 825,5 932,5 17,3 60,8 1010,6
1986
axJNIRY Product. Infra- Energy 'lbtal sector struct.
BEI.GTIM 0,3 0,6 0,9 IEtfARK RFofG:RMANY 354,1 7,0 119,2 480,3 GREECE 0,2 0,2 SPAIN :FRAIU: 101,0 3,5 104,5 IRELAND 0,1 0,8 0,9 ITALY 332,3 10,2 342,5 UJXI'MlOORG 1,8 0,2 2,0 NEIHERI.ANDS 86,0 0,6 86,6 ~
UNITED KimXM 47,5 3,8 51,3
mN-£EC
'IDIAL 923,0 26,2 120,0 1.069,2
(1) The conversion rates used lolere those obtaining on 31 fl:ocenher of each year.
(7)
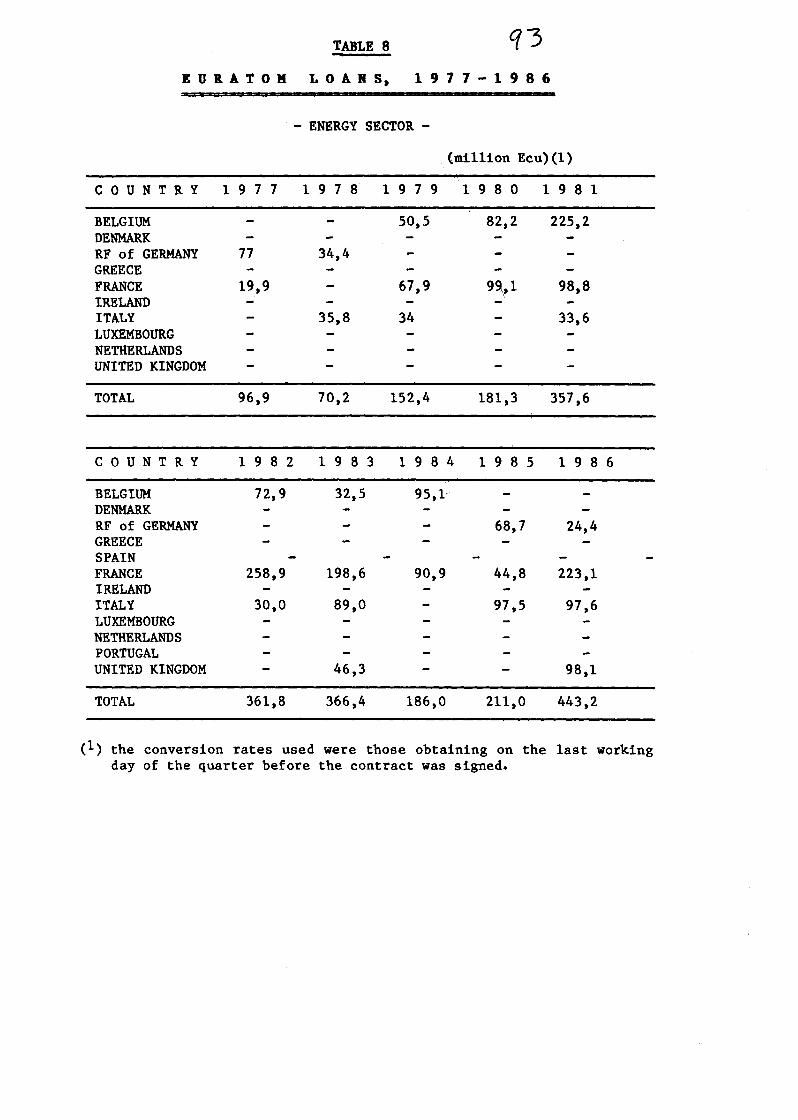
TABLE 8
E U It A T 0 M L 0 A II s. 1 9 7 7 - 1 9 8 6
C 0 U N T R Y
BELGIUM DENMARK RF of GERMANY GREECE FRANCE IRELAND ITALY LUXEMBOURG NETHERLANDS UNITED KINGDOM
TOTAL
COUNTRY
BELGIUM DENMARK RF of GERMANY GREECE SPAIN FRANCE IRELAND ITALY LUXEMBOURG NETHERLANDS PORTUGAL UNITED KINGDOM
TOTAL
1
- ENERGY SECTOR -
(million Ecu)(1)
9 7 7 1 9 7 8 1 9 7 9 1 9 8 0 1 9 8 1
50,5 82,2 225,2
77 34,4
19,9 67,9 9~,1 98,8
35,8 34 33,6
96,9 70,2 152,4 181,3 357,6
1 9 8 2 1 9 8 3 1 9 8 4 1 9 8 5 1 9 8 6
72,9 32,5 95,1
68,7 24,4
258,9 198,6 90,9 44,8 223,1
30,0 89,0 97,5 97,6
46,3 98,1
361,8 366,4 186,0 211,0 443,2
(1) the conversion rates used were those obtaining on the last working day of the quarter before the contract was signed.
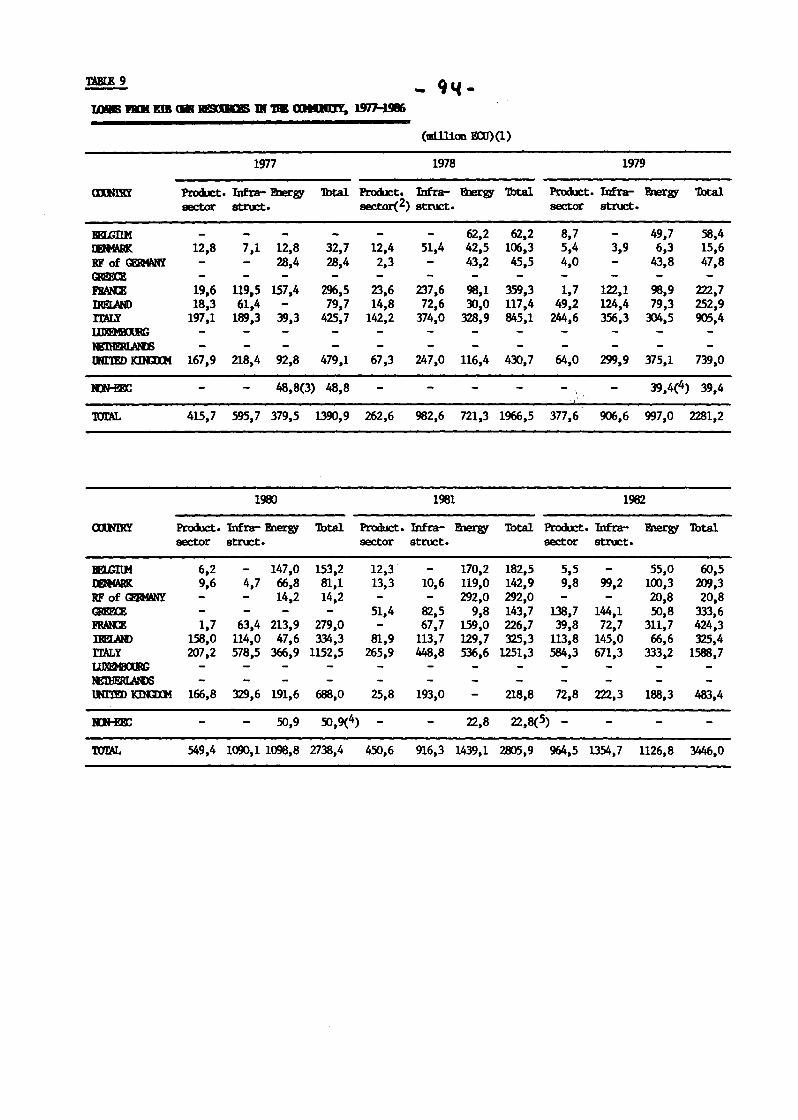
TABlE 9 9C.C--UME IIIII Ell <IIIIII!SODS lll 'liB ~ 1.977-lB
(ml.llion mJ)(1)
1977 1978 1979
Product. Infra- Jb!rgy 'lbtal Product. Infra- 1b!rgy 'lbtal Product. Infra- l!'nergy Total sector stnl::t· sectar(2) sttuct. sector sttuct.
BFI.GnM 62,2 62,2 8,7 49,7 58,4 lBffARK 12,8 7,1 12,8 32,7 12,4 51,4 42,5 106,3 5,4 3,9 6,3 15,6 RFof~ 28,4 28,4 2,3 43,2 45,5 4,0 43,8 47,8 ~
FBt\lrn 19,6 119,5 157,4 296,5 23,6 237,6 98,1 359,3 1,7 122,1 98,9 222,7 IRFLt\ND 18,3 61,4 79,7 14,8 72,6 30,0 117,4 49,2 124,4 79,3 252,9 ITALY 197,1 189,3 39,3 425,7 142,2 374,0 328,9 845,1 244,6 356,3 314,5 905,4 llJXI!)IIDG
RmiER1RD3 OO'IED KilQXM 167,9 218,4 92,8 479,1 67,3 247,0 116,4 430,7 64,0 299,9 375,1 739,0
IUHmC 48,8(3) 48,8 39,4(4) 39,4
mrAL 415,7 595,7 379,5 1390,9 262,6 982,6 721,3 1966,5 377,6 906,6 997,0 2281,2
19a> 1981 1982
Pr<xb:t. Infra- Fnergy 'lbt81 Pr<xb:t. Infra- Fnergy 'lbt81 Product. Infra- lnergy 'lbt81 sector struct. sector struct. sector struct.
'IIFUmM 6,2 147,0 153,2 12,3 170,2 182,5 5,5 55,0 60,5 IBtfARK 9,6 4,7 66,8 81,1 13,3 10,6 119,0 142,9 9,8 99,2 100,3 209,3 RFof<DfANY 14,2 14,2 292,0 292,0 20,8 20,8 QU!'.Pm 51,4 82,5 9,8 143,7 138,7 144,1 .50,8 333,6 FlWIE 1,7 63,4 213,9 279,0 67,7 159,0 226,7 39,8 72,7 311,7 424,3 ImAR> 158,0 114,0 47,6 334,3 81,9 113,7 129,7 325,3 113,8 145,0 66,6 325,4 ITALY 207,2 578,5 366,9 1152,5 265,9 448,8 536,6 1251,3 584,3 671,3 333,2 1588,7 UJXF.HIDJRG tmliERlNUl (Kl'1'ED KilQXM 166,8 329,6 191,6 688,0 25,8 193,0 218,8 72,8 222,3 188,3 483,4
Im-El!X: .50,9 .50,9(4) 22,8 22,8(5) -mrAL 549,4 1090,1 1098,8 2738,4 4.50,6 916,3 1439,1 28)5,9 964,5 1354,7 1126,8 3446,0

--------- ----------------------------------~-----------------
_/
TABLE 9 (continued) -~'i
LOANS HOM. EIB OWN RESOURCES IN THE COMMDRITY, 1977-1986
(million ECU){1)
1983 1984 1985
Product. Infra- Energy Total Product. Infra- Energy Total Product. Infra- Energy sector struct. sector struct. sector struct.
BEI.GitM 32,5 32,5 77,8 IEH<\RK 14,4 4,3 228,7 247,4 4,9 59,2 119,8 183,9 9,5 4,0 250,5 RFof<EM\NY 22,9 129,3 152,2 134,3 134,3 91,4 GREECE 63,2 193,3 107,8 364,3 61,0 125,9 88,6 275,5 44,2 285,8 71,7 l"lWa 130,9 316,4 260,6 707,9 128,3 479,6 206,1 814,0 290,2 407,8 191,6 IRElAND 13,9 201,4 19,3 234,6 64,0 60,0 124,0 25,1 114,5 7,0 ITALY 730,8 636,5 578,4 1945,7 894,0 930,0 714,2 2538,2 723,7 996,3 884,0 UJmiBOORG 16,4 16,4 NE'lllERU\NDS 69,1 UNl'lED Km:DM 53,4 269,9 268,0 591,3 55,6 255,1 577,5 888,2 148,1 291,6 657,0
NCN-EEC
TCTfAL 1029,5 1621,9 1592,1 4243,5 1207,8 1926,2 1873,1 5007,0 1240,7 2169,1 2230,9
1986
<XXJNI'RY Product. Infra- l'ilergy Total sector struct.
BEI.illtM 46,1 46,1 IEMARK 5,0 193,3 198,3 RFofGERMANY 139,7 302,1 441,8 GREECE 178,3 50,2 24,4 253,0 SPAIN 92,0 220,8 27,3 340,0 FRAia 121,6 421,1 22,3 565,0 IRElAND 19,2 125,9 69,2 214,3 ITALY 951,5 1052,8 908,3 2912,5 LUXEMBOORG 18,2 18,2 NE'lHERUNDS 94,9 3,3 98,2 P<Rim\1 34,9 96,4 29,1 160,4 UNITED I<:mD:M 110,7 378,1 866,4 1355,3
IDN-EEC 75,0(6) - 75,0
rorAL 1654,3 2581,4 2442,4 6678,1
( 1) The conversion rates used were those obtaining on the last working day of the quarter before the contract was signed. ·
(2) Industry, agriculture and services. (3) Norway. (4) Austria and '1\misia. ( 5) '1\lnisia. (6) loon for a satellite concerning the Camunity as a whole.
Total
77,8 264,0 91,4
401,7 889,6 146,6
2603,9
69,1 1096,7
5640,7
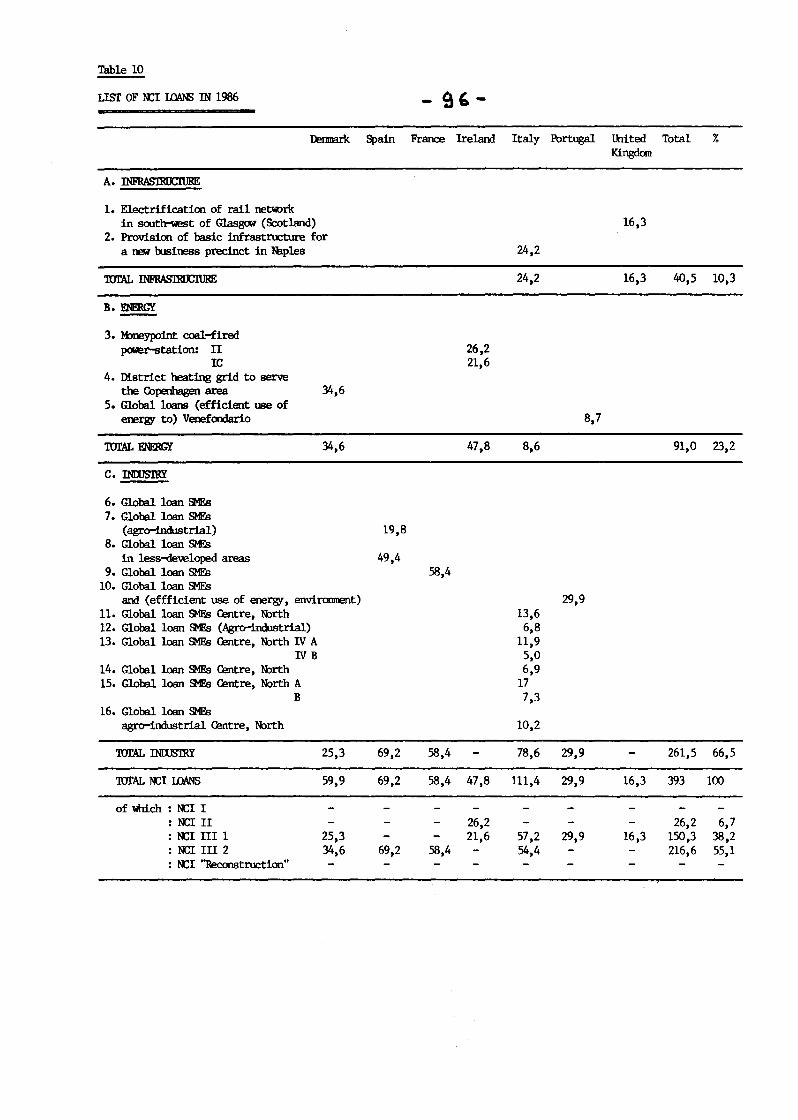
Table 10
USf OF :oci UlANS IN 1986 - 9'-1l:!rmm:k Spain France Ireland Italy Portugal United Total %
Kingdan
A. INFRAS1RUCllJRE
1. Electrification of rail net:w:>rk in south-1oiest of Glasgow {Scotland) 16,3
2. Provision of basic infrastructure for a new business precinct in N:lples 24,2
'lUrAL INFRAS'l'RI£lUR 24,2 16,3 40,5 10,3
B. ENERGY
3. M>mypoint coal-fired p<:Mer-station: n 26,2
IC 21,6 4. District heating grid to serve
the Copenhagen area 34,6 5. Global loans {efficient use of
energy to) Venefondario 8,7
'lUrAL ENERGY 34,6 47,8 8,6 91,0 23,2
c. INillSTRY
6. Global loan He 7. Global loan SMFs
(agro-industrial) 19,8 8. Global loan SMFs
in less-developed areas 49,4 9. Global loan SME's 58,4
10. Global loan ~ and (effficlent use of energy, envii'O!ll'l5lt) 29,9
n. Global loan~ Centre, N:>rth 13,6 12. Global loan SMFs {Agro-industrial) 6,8 13. Global loan ~ Centre, N:>rth IV A 11,9
!VB 5,0 14. Global loan~ Centre, N:>rth 6,9 15. Global loan SME's Q!ntre, N:>rth A 17
B 7,3 16. Global loan SME's
agro-industrial Centre, N:>rth 10,2
'lUrAL INOOS'IRY 25,3 69,2 58,4 78,6 29,9 261,5 66,5
'lUrAL f\l:I UlANS 59,9 69,2 58,4 47,8 111,4 29,9 16,3 393 100
of which : f\l:I I : :ocr II 26,2 26,2 6,7 : f\l:I III 1 25,3 21,6 57,2 29,9 16,3 150,3 38,2 : :oci III 2 34,6 69,2 58,4 54,4 216,6 55,1 : t-l:I "Reconstruction"
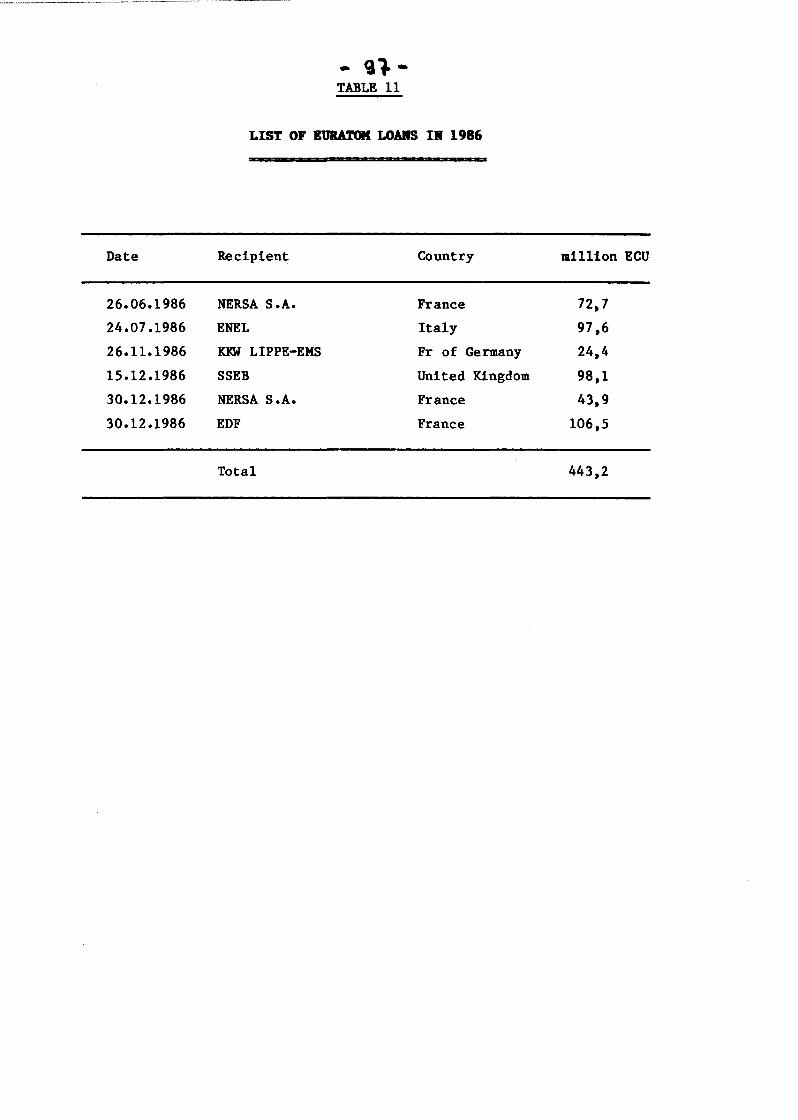
--·~--------------~-------------------~ ------ -- -
- 9l-TABLE 11
LIST OF EURATOM LOARS IR 1986
Date Recipient Country million ECU
26.06.1986 NERSA S.A. France 72,7
24.07.1986 ENEL Italy 97,6
26.11.1986 KI.<W LIPPE-EMS Fr of Germany 24,4
15.12.1986 SSEB United Kingdom 98,1
30.12.1986 NERSA S.A. France 43,9
30.12.1986 EDF France 106,5
Total 443,2
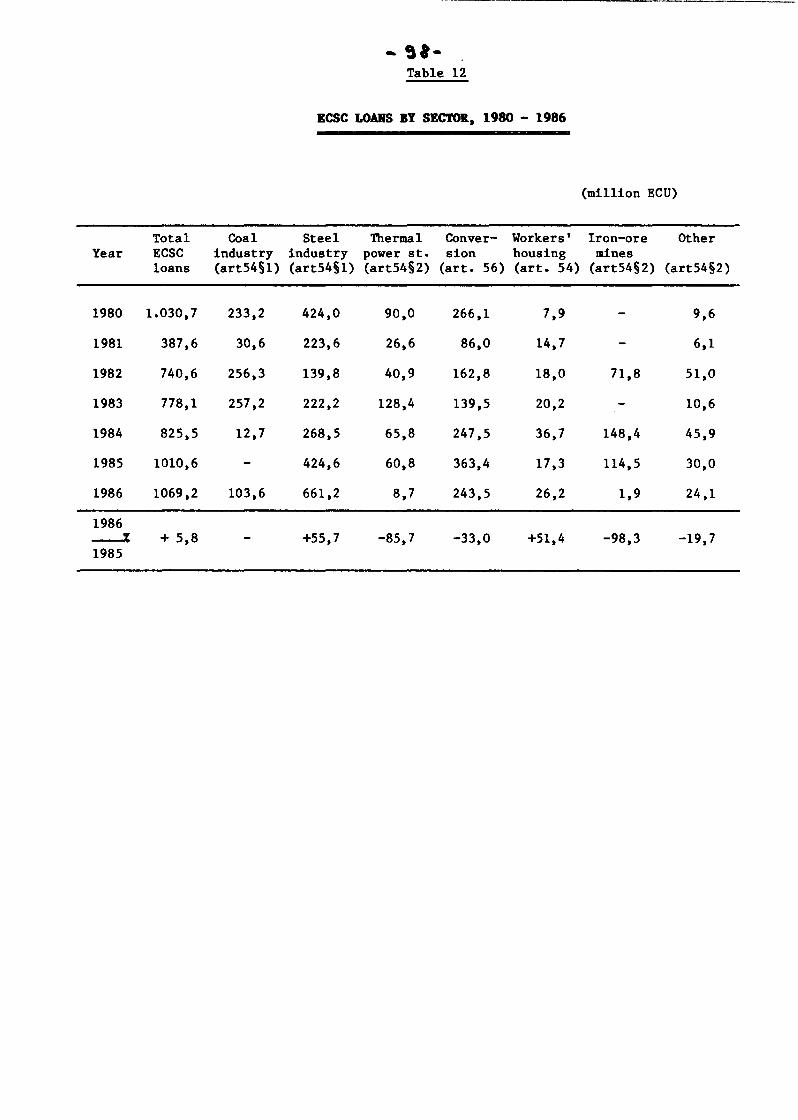
- ,,_ Table 12
ECSC LOANS BY SECTOR. 1980 - 1986
(million ECU)
Total Coal Steel Thermal Conver- Workers' Iron-ore Other Year ECSC industry industry power st. sion housing mines
loans (art54§1) (art54§1) (art54§2) (art. 56) (art. 54) (art54§2) (art54§2)
1980 1.030,7 233,2 424,0 90,0 266,1 7,9 9,6
1981 387,6 30,6 223,6 26,6 86,0 14,7 6,1
1982 740,6 256,3 139,8 40,9 162,8 18,0 71,8 51,0
1983 778,1 257,2 222,2 128,4 139,5 20,2 10,6
1984 825,5 12,7 268,5 65,8 247,5 36,7 148,4 45,9
1985 1010,6 424,6 60,8 363,4 17,3 114,5 30,0
1986 1069,2 103,6 661,2 8,7 243,5 26,2 1,9 24,1
1986 ---% + 5,8 +55,7 -85,7 -33,0 +51,4 -98,3 -19,7 1985
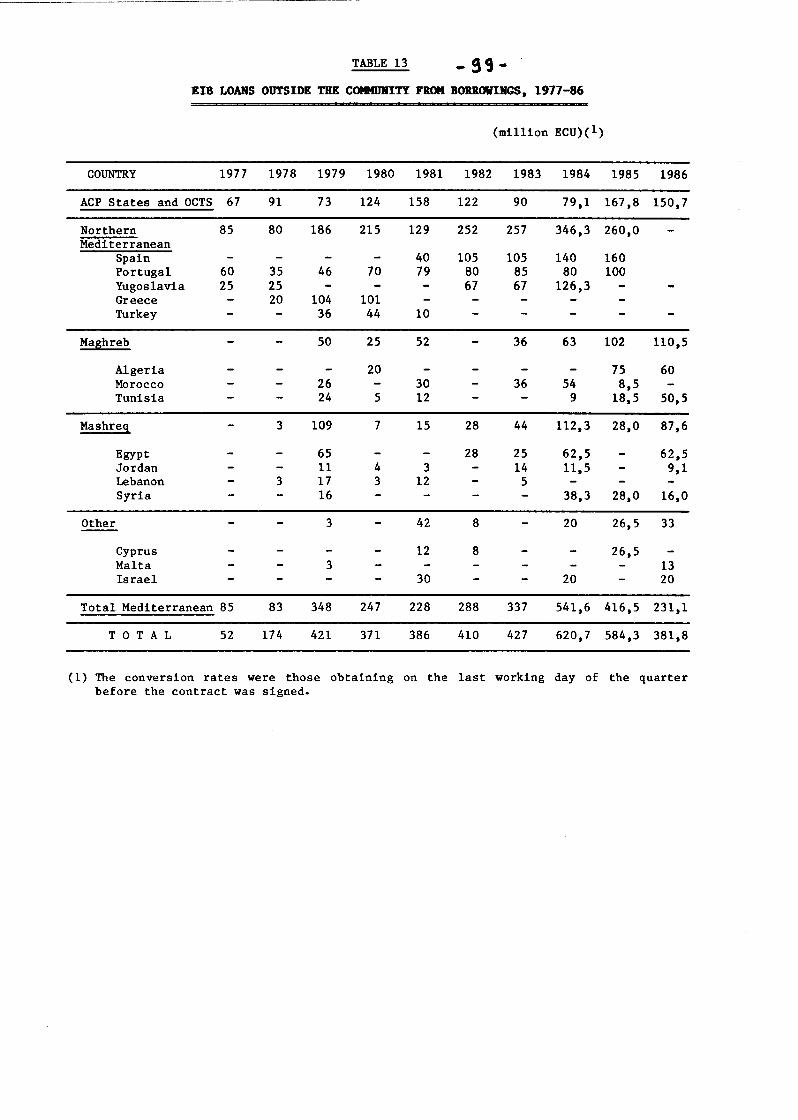
-------------- ---------
TABLE 13 - SCJ .. EIB LOANS OUTSIDE THE COMKORITY FROM BORROWIBGS, 1977-86
(million ECU)(l)
COUNTRY 1977 1978 1979 1980 1981 1982 1983 1984 1985 1986
ACP States and OCTS 67 91 73 124 158 122 90 79,1 167,8 150,7
Northern 85 80 186 215 129 252 257 346,3 260,0 Mediterranean
Spain 40 105 105 140 160 Portugal 60 35 46 70 79 80 85 80 100 Yugoslavia 25 25 67 67 126,3 Greece 20 104 101 Turkey 36 44 10
Mash reb 50 25 52 36 63 102 110,5
Algeria 20 75 60 Morocco 26 30 36 54 8,5 Tunisia 24 5 12 9 18,5 50,5
Mashreg 3 109 7 15 28 44 112,3 28,0 87,6
Egypt 65 28 25 62,5 62,5 Jordan 11 4 3 14 11,5 9,1 Lebanon 3 17 3 12 5 Syria 16 38,3 28,0 16,0
Other 3 42 8 20 26,5 33
Cyprus 12 8 26,5 Malta 3 13 Israel 30 20 20
Total Mediterranean 85 83 348 247 228 288 337 541,6 416,5 231,1
T 0 T A L 52 174 421 371 386 410 427 620,7 584,3 381,8
(1) The conversion rates were those obtaining on the last working day of the quarter before the contract was signed.
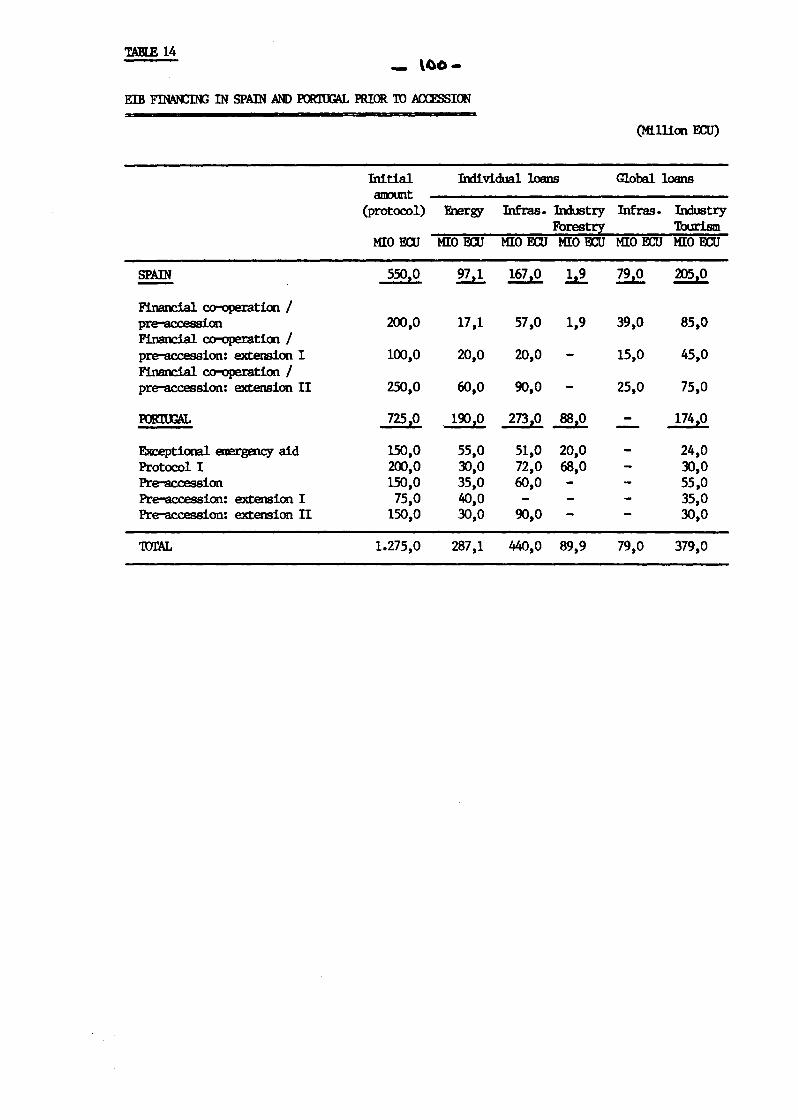
TABlE 14 - \00•
EIB ~ IN SPAIN AND RRI.'OOAL PRIOR TO ACX:mSION
(Million ECU)
Initial Individual loans Global loans BI!Dlmt
(protocol) F.nergy Infras. Industry Infras. Industry Forest!I Tourism
MIO ECU MIO ECU MIO ECU MIO ECU MIO ECU MIO ECU
SPAIN 5.50,0 97,1 167,0 1,9 79,0 205,0
Financial co-operation I pre-accession 200,0 17,1 57,0 1,9 39,0 85,0 Financial co-operation I pre-accession: extension I 100,0 20,0 20,0 15,0 45,0 Financial co-operation I pre-accession: extension II 250,0 60,0 90,0 25,0 75,0
R>R:lWAL 725,0 . 1~,0 273,0 aa,o 174,0
Exceptional emergency aid 150,0 55,0 51,0 20,0 24,0 Protocol I 200,0 30,0 72,0 68,0 30,0 Pre-accession 150,0 35,0 60,0 55,0 Pre-accession: extension I 75,0 40,0 35,0 Pre-accession: extension II 150,0 30,0 90,0 30,0
'1UfAL 1.275,0 287,1 440,0 89,9 79,0 379,0
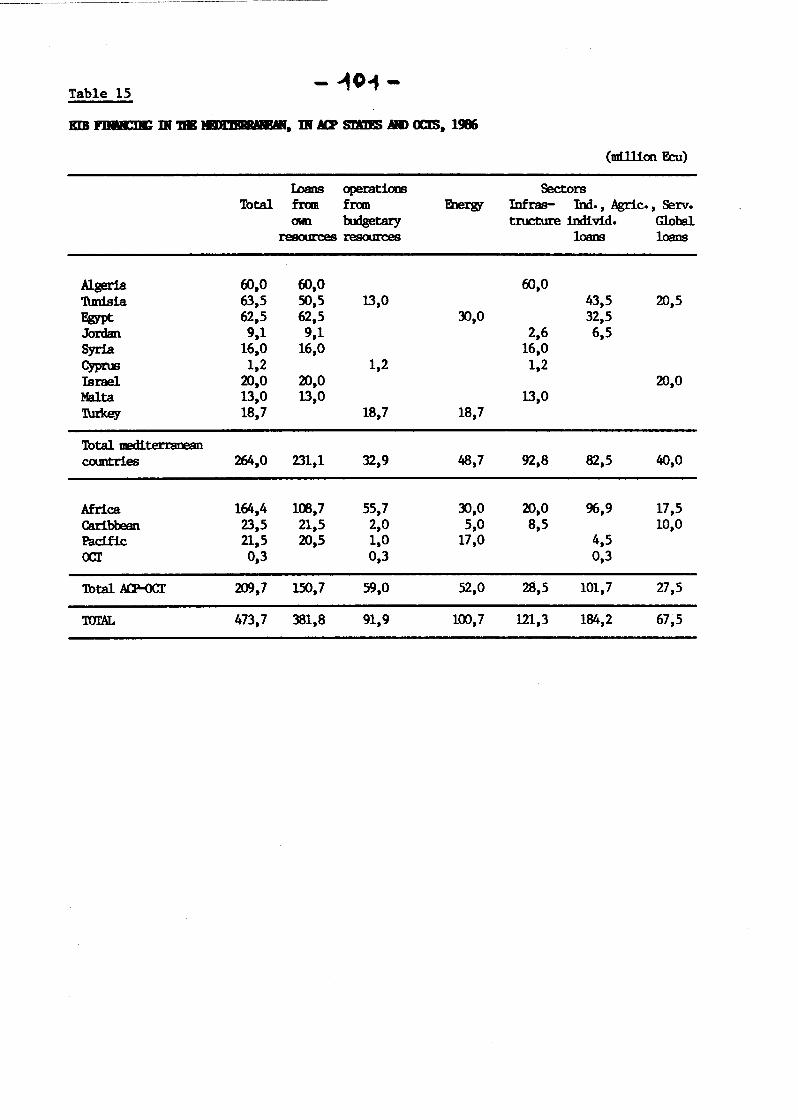
Table 15 - ~0-1-
(ml111on &u)
lDans operatioos Sectors Total fran fran Fnergy Infras- Ind. , Agric. , Serv.
own lu:Jgetary tructure individ. Gl.obtl resources resources loans loans
Algeria 60,0 60,0 60,0 'l\m1sia 63,5 50,5 13,0 43,5 20,5 Fmrt: 62,5 62,5 30,0 32,5 Jordan 9,1 9,1 2,6 6,5 Syria 16,0 16,0 16,0 Cyprus 1,2 1,2 1,2 Israel 20,0 20,0 20,0 Malta 13,0 13,0 13,0 '1\n'key 18,7 18,7 18,7
countries 264,0 231,1 32,9 48,7 92,8 82,5 40,0
Africa 164,4 1~,7 55,7 30,0 20,0 96,9 17,5 Caribbean 23,5 21,5 2,0 5,0 8,5 10,0 Pacific 21,5 20,5 1,0 17,0 4,5 ocr 0,3 0,3 0,3
Total ACP-OCr 200,7 150,7 59,0 52,0 28,5 101,7 27,5
rorAL 473,7 381,8 91,9 100,7 121,3 184,2 67,5
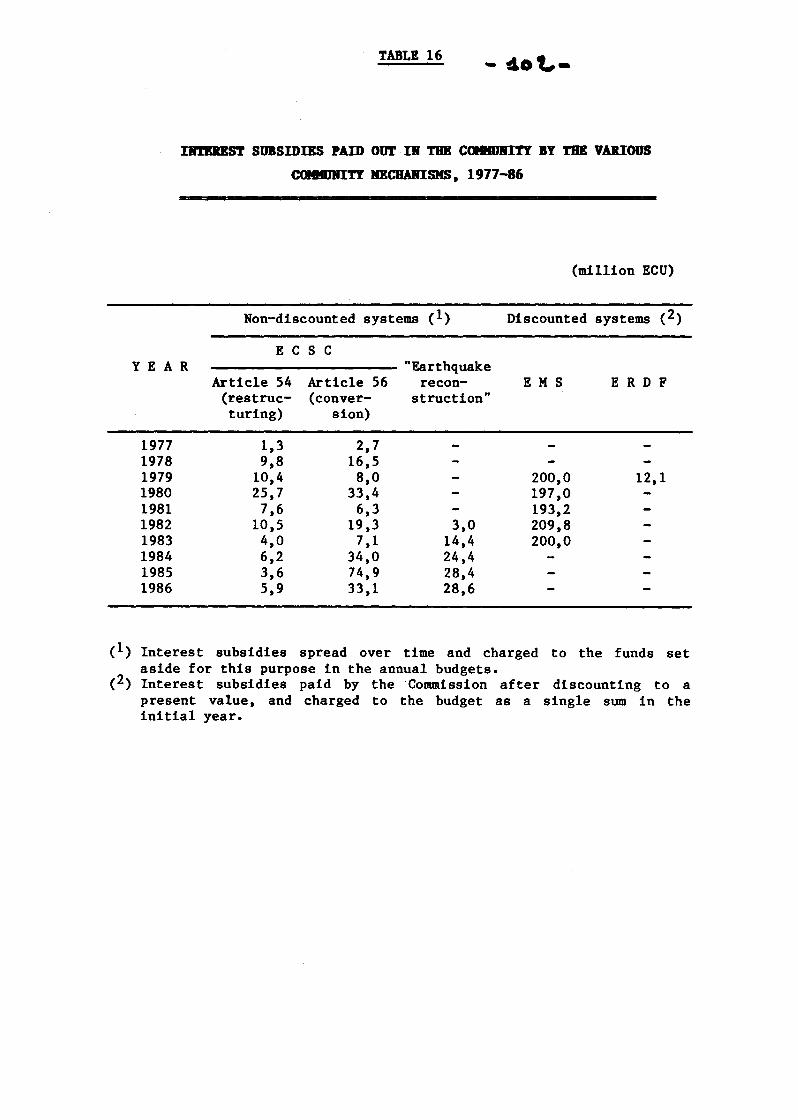
TABLE 16 - 4o~-
IB!'BDS'r SUBSmiBS PAID Otrr IR THE ~Wit'Y BY TilE VARIOUS
C<BIIJRITY IIECIIARISMS, 1977-86
(million ECU)
Non-discounted systems (1) Discounted systems (2)
E C S C YEAR "Earthquake
Article 54 Article 56 recon- E M S E R D F (restruc- (conver- struction" turing) sion)
1977 1,3 2,7 1978 9,8 16,5 1979 10,4 8,0 200,0 12,1 1980 25,7 33,4 197,0 1981 7,6 6,3 193,2 1982 10,5 19,3 3,0 209,8 1983 4,0 7,1 14,4 200,0 1984 6,2 34,0 24,4 1985 3,6 74,9 28,4 1986 5,9 33,1 28,6
Interest subsidies spread over time and charged to the funds set aside for this purpose in the annual budgets. Interest subsidies paid by the Commission after discounting to a present value, and charged to the budget as a single sum in the initial year.
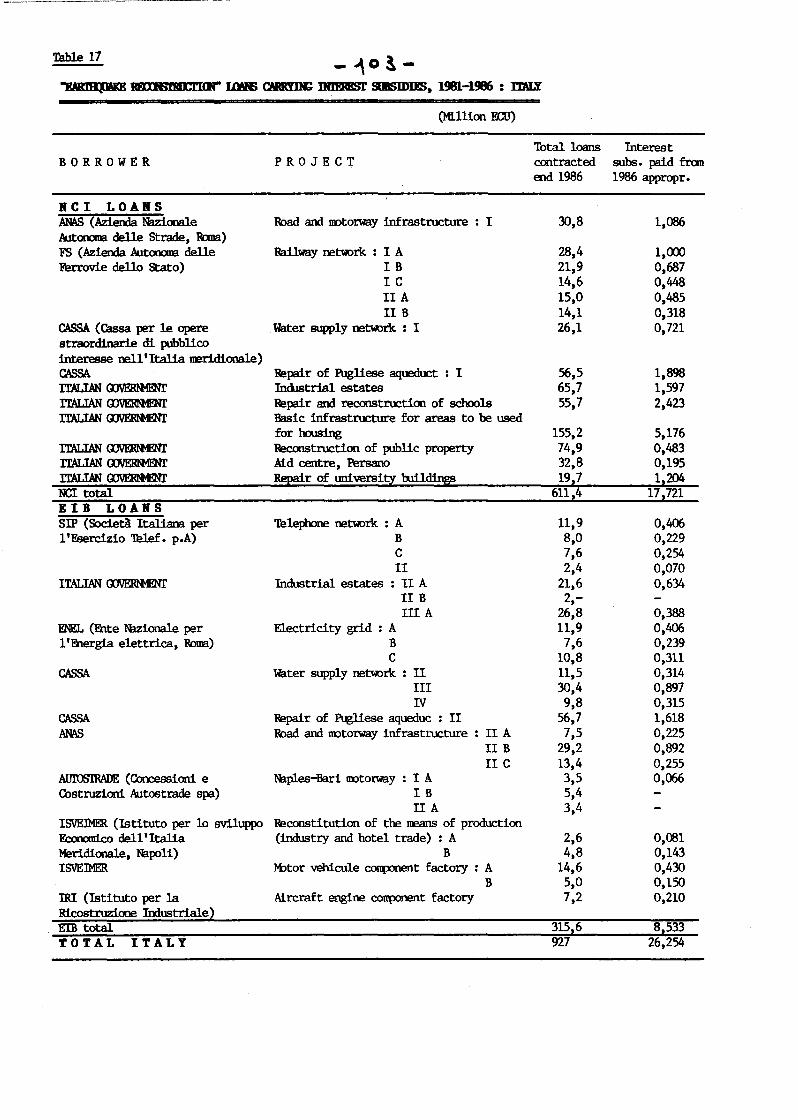
Table 17
BORROWER
BCI LOABS ANAS (Azienda Nazionale AutOl'lOOB delle Strade, Rcma) FS (Azienda AutOl'lOOB delle Ferrovie de11o Stato)
CASSA (Cassa per le opere straordinarie di pubblico interesse ne11'Italia meridionale) CASSA ITALIAN OOVERlt1ENr ITALIAN~ ITALIAN OOVERlHNr
~total EIB LOABS SIP (Societa Italiana per 1 'Fserclzio Telef. p.A)
ITALIAN OOVERlHNr
ENEL (Fnte Nizionale per 1 'F.nergia elettrica, RDlm)
CASSA
CASSA ANAS
AI11m'1lWJE (Coocessioni e Chstruzioni Autostrade spa)
ISVElMER (Istituto per 1o sviluppo &onood.co dell 'Italia Meridionale, Napoli) ISVElMER
IRl (Istituto per 1a Ricostruzione IOO.ustriale) EIB total TOTAL ITALY
(Ml.lllon ECU)
PROJECT
Road and mtorway infrastructure : I
Railway network : I A IB IC IIA liB
Water supply network : I
Repair of Pugliese aqueduct : I IndJstria1 estates Repair and reconstruction of schools Basic infrastructure for areas to be used for housing Reconstruction of public property Aid centre, Persano Repair of university bdldings
Telephone network : A B c II
Industrial estates : II A liB III A
Electricity grid : A B c
Water supply network : II III IV
Repair of Pugliese aqueduc : II Road and mtorway infrastructure : II A
liB IIC
Naples-Bari mtorway : I A IB IIA
Reconstitution of the neans of production (industry and hotel trade) : A
B 1-btor vehicule cooponent factory : A
B Aircraft engine cooponent factory
Total loans contracted end 1986
30,8
28,4 21,9 14,6 15,0 14,1 26,1
56,5 65,7 55,7
155,2 74,9 32,8 19,7
611 4
11,9 8,0 7,6 2,4
21,6 2-,
26,8 11,9 7,6
10,8 11,5 30,4 9,8
56,7 7,5
29,2 13,4 3,5 5,4 3,4
2,6 4,8
14,6 5,0 7,2
315 6 927
Interest subs. paid fran 1986 appropr.
1,086
1,000 0,687 0,448 0,485 0,318 0,721
1,898 1,597 2,423
5,176 0,483 0,195 1,204
17 721
0,406 0,229 0,254 0,070 0,634
0,388 0,406 0,239 0,311 0,314 0,897 0,315 1,618 0,225 0,892 0,255 0,066
0,081 0,143 0,430 0,150 0,210
8 533 26,254
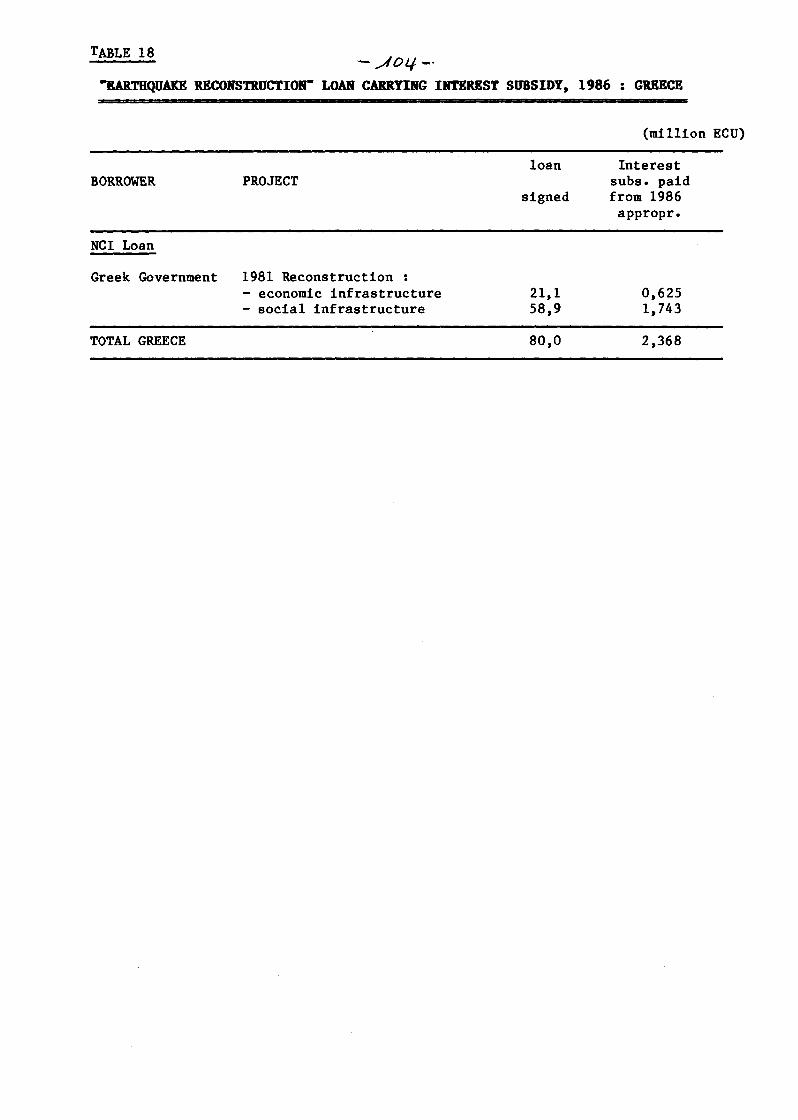
TABLE 18 - _.AOI.f -·
""EARTHQUAKE RECORSTRUCTIOR• LOAR CAIUtYIRG INTEREST SUBSIDY, 1986 : GREECE
BORROWER PROJECT
NCI Loan
Greek Government 1981 Reconstruction : - economic infrastructure - social infrastructure
TOTAL GREECE
loan
signed
21,1 58,9
80,0
(million ECU)
Interest subs. paid from 1986 appropr.
0,625 1,743
2,368
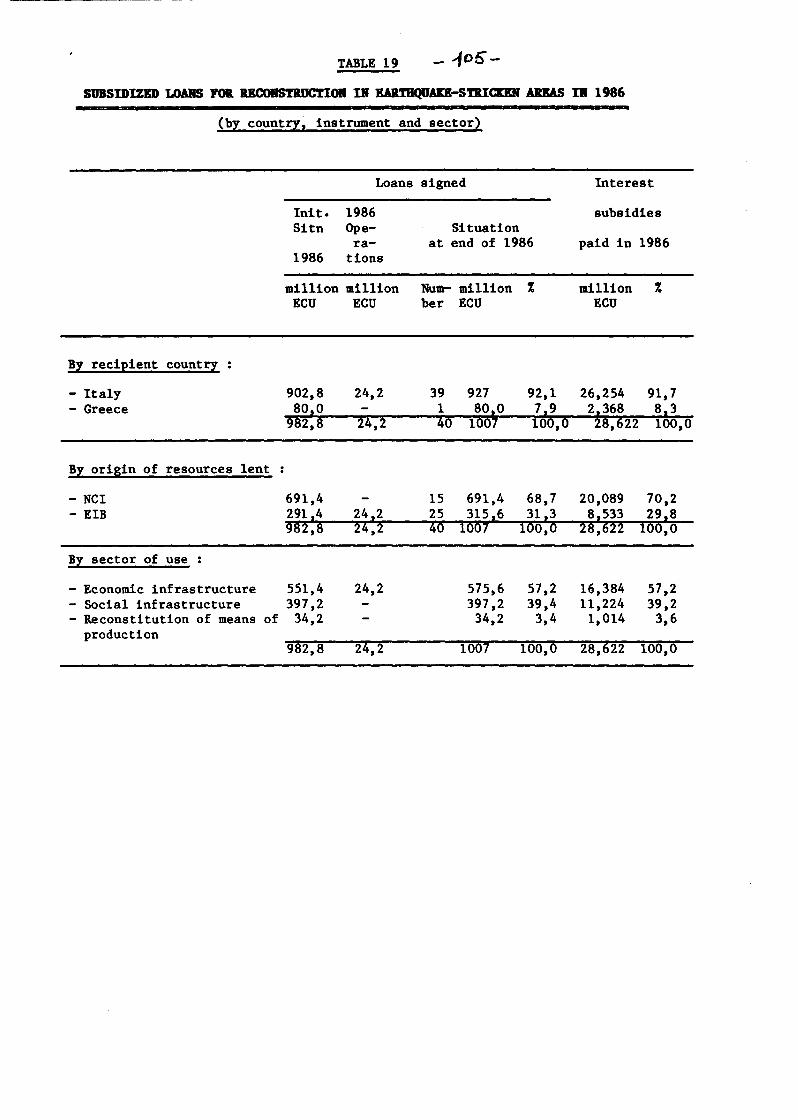
TABLE 19
SUBSmiZED LO.ARS 1'01. UCORSTRDCTIOB IB UI.TIIQUAD-5TitiCZEB .ADAS IB 1986
(by country, instrument and sector)
Loans signed Interest
lnit. 1986 subsidies Sitn Ope- Situation
ra- at end of 1986 paid in 1986 1986 tions
million million Num- million % million % ECU ECU ber ECU ECU
Bl reciEient country
- Italy 902,8 24,2 39 927 92,1 26,254 91,7 - Greece 8010 1 80 10 719 21368 813
982,8 24,2 4o 1007 100,0 28,622 100,0
Bl orisin of resources lent
- NCI 691,4 15 691,4 68,7 20,089 70,2 - EIB 29114 24 12 25 31516 3113 81533 2918
9~2,8 27+,2 ?+o Ioo7 100,0 2~,~~~ Joo,o
Bl sector of use :
- Economic infrastructure 551,4 24,2 575,6 57,2 16,384 57,2 - Social infrastructure 397,2 397,2 39,4 11,224 39,2 - Reconstitution of means of 34,2 34,2 3,4 1,014 3,6
production 982,8 24,2 1007 100,0 28,622 100,0