commission of the european communities.aei.pitt.edu/7438/1/7438.pdf · of the council regulation of...
TRANSCRIPT

COMMISSION OF THE EUROPEAN COMMUNITIES.
REPORT ON THE
COM(81) 419 final
Brussels, 9 September 1981
BORROWING AND LENDING ACTIVITIES OF THE COMMUNITY
Financial year 1980
COMC81) 419 final

CONTENTS
I. Measures taken or proposed in 1980 in respect of Community borrowing and lending
1. New Community Instrument CNCI)
Orig.: F
2. Interest subsidies on Loans for the reconst~uction of th~ stricken areas in Italy
3. Euratom
4. Community borrowing
II. Overall view of Community borrowing and lending in 1980-Trends compared with previous .Years.
1. Lending
Trends in Lending operations in the Community, by instrument
I
2 •. Borrowing
Trends in borrowing operatiqns by the European Communities, by instrument
3. Bala~ce bet~~en borrowing and lending
III. Lending in 1980
1. New Community Inst~ument (NCI)
2. Euratom
3. ECSC
4. European Investment Bank CEIB)
IV. Borrowing in 1980 \
1. The situatio~ on capital markets
2. Breakd6wn of Community borrowing in.1980
Borrowing in 1980 by currency
•
Page
2
2
4
4
4 ) .
5
5
5
7
8
9
10
10
11
12
13
15
15
16
18

•
V. Interest subs id~:e,'&
1.. Community interest subsidy mechanisms'
TABLES
List of rep,art,s; at"'G' dox;uments an C,ommwnity' borrowing ancl lendi<ngc aet'ivi,ti es which ha,ve been subm1,tted, to t,he CotilmcH and' tc>- Partiamem~
Page,
19 . 19
19
23
24
25 - 42
43

Orig.: F
REPORT ON THE BORROWING AND LENDING ACTIVITIES OF
THE COMMUNITY
Financial year 1980
1. This report ~~s drawn up to provide the Council arid Parliament wtth
information on the Community's borrowing and lendi.ng activities during 1980. '
!t meets the wish~s expressed by Parliament on various occasions,
particularly when granting the discharge to the Commission on the implemen
tation of the general budget of the European Communities f~r 1978 and 1979,(1)
and in its·Resolu!ion on improving political control over the Communities'
b . d l d" t" "t" ( 2) orrow1ng an en 1ng ac 1v1 1es •.
2. .It also fulfils the Commission's obligation to inform the Council and
Parliamen~ each year ~bout the activities of:
Euratom, in accordan~e with A~ticle 4 of the Council Decision of
29 March 1977;
the NCI, in accordance with Article 6 of the Council Decision of
16 October 1978;
the EMS interest subsidy inst~ument, in accordance with Article 10 . of the Council Regulation of 3 August 1979.
3. Furthermore, in order to provide a complete picture of the Communities'
borrowing and lending·activifies which goes beyond this instjtutional frame.-;
work, the report also reviews the borrowing and lending carried out last
year by the ECSC and - at a general level - by the EIB. !he ECSC's finan
cial report and the EIB's annual report will be sent to Parliament and the
Council as before.
(1) Doc. PE 65085 of 23 May 1980, p. 17 Doc. PE 71.959 of 11 March-1981 (points 74 and 75)
<2> Doc. PE 67134 of 5 March 1981.

\
4. A list of the various dotuments and reports so far transmitted to the ~ '
Council and ParLiament on Community borrowing and lending is annexed to
,this report.
I. Measures taken or. proposed in 1980 in respect of Corpmunity borrowing and
Lending
· 5. During 1980, the Community took severaL steps which reflect Hs concern
to keep the borrowing and_Lending instruments flexible and to adapt them to • changing requirements. Acting on proposals from the Commission, the Council
thus authori~ed further borrowings by the NCI and Euratom. The Commission
also submitted proposals to the Council for adjusting the Community loan
mechanism for supporting the balance of payments of Member States and for
taking exceptional aid measures designed to contribute to the reconstruction
of the r_egions in southern Italy affected by the earthquake in November 1980.
6: A large number of measures involving the €ommunity borrowing and lending
instruments. were· therefore either adopted by the Council or proposed b the
_Commission in 1980.
1. New Community Instrumen~ (N~I)
7. This instrument wa~ created by a Council Decision in October 1978,<1>
which empowers the Commissio.n tb contract Loans, the proceeds of which af'e
to be Lent to finance investment projects which meet •priority Community
obj~ctives in the energy, industry and infrastructur~ sectors. During an
initial period, this instrument was to be used on an e~perimental basis"
The amount of borrowing w~s therefore limited to 1 000 million ECU in prin
cipal, to be activated tranche bytranche by the Council, which was to lay
down the guidelines for the eligibility of projects.
In May 1979, the Council autho~ized a first tranche of borrowings
amounting to 500 million ECU, to be used for financing investment projects .. th d . f ' (2) 1n e energy an 1n rastructure sectors.
<1) Council Decision 78/870/EEC of 16 October 1978
(2) Council Decision 79/486/EEC of 14 May 197'9
, ..

- 3 ~
In July 1980, it authorized a second tranche of borrowings of 500 million
Ecu b d d . . h 't . (1) . N b 1 f h . , to e use accor 1ng to t e same cr1 er1a; 1n ovem er o · t e same ( 2 ) . t d d D . . ll . . f . . l d year, 1 a opte a ec1s1on • ow1ng 1n rastructure pro)ects to 1nc u e
housing and advance factori•s, provided that they f6r~ed part of a total ,/
project of econo~ic and industrial ~evelopment presenting a regional interest.
The initial·ceiling im~osed on.borrowing by this instrum~nt was reached
when this second tranche was authorized. After r~viewing this experimental.
~eriod, the Commission proposed in October 1980 (3) that the ins~rument should continue to be used, but should be amended in.a number of respects,
part1cularly so·as ~o allow simultaneous tranches.
8. Shortly after the earthquake in southern Italy in November 1980, the
\European Council, meeting in Luxembourg in December 1980~ invit~d the Council
to de~ide without delay, on a proposal from the Commission, on exceptional
aid measures designed' to contribute to the reconstruction programme in the
areas affe~ted. The Commissioh im~ediately submitted a proposal for a
·Decision providing for Community aid to Ital~,<4 > which has since been
adopted. by the Council.<5>
This Decision empowers the ,Commission, by way. of sote exception and by
extending the initial provisions of the NCI, to contract Loans for the
purpose of financing ihvestments for the recoRstruction ~f the means of
production and-the economic and social infrastructur~ of the stricken areas. . . These loans may not exceed a total of 1 000 million ECU in principal, less.
any operations of t~e same natu~e carried out by the EIB out of its own
resources.
(1) Council Decisi~n 80/739/EEC df 22 July 1980
<2> Council Decision 80/1103/E~C of 25 November 1980
(3) Proposal for a Council Decision, dated 30 October 1980 (COM (80) 670 fir .I_) ·
<4> Commission proposal of 5 December 1980 (Doc. COM (80) 863 final)
(5) Council D·ecision ~9/81/EEC of 20 January 1981 <OJ L 37/21 of 10 February 1981).

- 4 -
2. Interest subsidies on loans for the .recorrstructioo 0f th'E! s:t:ricken areas
in lta'ly
9. The loans to be granted for this purpose f.rom tbe resources of the NCI
and from those of the EIB will be accompanied by interest subsidies charge
able to the Community's general budget. These interest subsidies are to
be granted by the Commission at a rate of 3 pe,rcent:a;.ge points per annum (1)
for a maximum period of 12 years.
3. Euratom
10. The Council having decided in 1979 (2) to increase the ceiling fixed ,,
for Euratom loans from 500 mHlion ECU to 1 000 million ECU, there were no
further amendments in 1980 to this instrument, (3 ) under which the ,Commission
is empowered to contract loans for the purpose of contributing to the fin
ancing of nuclear power stations.
4. Community borrowing
11. The Council decided, en a proposal from t'lae Commi·ssion dated 30 October
1980 t d t R l . (4 ) d. . h c . l h . , o a op a egu at1on a JUStln-g t e 0tlllmMl1ty oan .mec amsm
designed to support the balances of payments of Member States, which had . . . (5)
been set up in 1975. The revamped mec,J<t.vtni'5m i.s able to mobilize a sub-
stant.ially greater 'tdlume <Yf funds, the ceitin<g on it:s ~orrbwing operations
having been increased to the equivalent of 6 000 111illion EC~ in princdpal.
(1) Council Decision 19/81/EEC of 20 Jan.uary 1981 (OJ L 37/21 of 10 February 1981)
(2) Council Decis.ion :of 20 December 1979 amending Decision 77/271/Euratom
(3) Decision 77/270/Euratom of 29 March 1977
(4) Courici l Regulation C'EEC> No. 682/80 of 1.6 Mar.ch 1981 (OJ L 73 of 19 Marc'h 1<J81)
(5) Council Regulation <EEC) No. 397/75 and 39~/75 of 17 February 1975 (OJ L 46/1 of 20 February 1975).

- 5 -
II, Overall view of Community borrowing and Lending in 1980 ~
Trends compared with previous years
1. Lending
12. The Loan~ g~ant~d by Community instr~ments i_n 1980 totalled 4 530.4
million ECU: 4 152.4 'million inside the Community and 378 million outside.
The external financing operations were carried out by the EIB and the ECSC.
Lending in member countries in 1980 increased by 22.6% compared with I
1979. This increase, whic~ has tak~n place in an economic situation which
is still difficult, is in re~ponse to the call made on several occasions, I
both by the European Council and the Council of Ministers, for the Community
to step up financial assistance to encourage investment,. stimulate job
.creation and reduce the economic disparities between member countries.
The support given by lending activities to the Community's major policy
objectives can be gauged from their breakdown by sector and by country.
I
Year
1970
1971
1972
1973
1974
1975 ' 1976 i
1977
1978
1979
1980
Trend in lending operations in the Community, by instrument (1 )
<in mitlion ECU)
ECSC EIB Euratom 1 NIC Total
31.6 338.6 370.2
112.2 469.0 581.2
188.5 505.9 694.4
286.4 696.8 983.2
377.9- 849.7 1,227.6
804.9 917.5 1,722.4
1 ,063. 8 1,086.0 2,149.8
741.5 1,401.3 96.9 2,239.7
797.7 1,966.5 70.3 2,834.5
675.8 2,281.2 152.5 277.0 3,386.5
1,020.3 2,753.2 181.3 197.6 4,152.4
(1) The "balance of payments" loans are not shown in this table, since they do not serve a st ruch1ra l purpose.

- 6 -
13. The sectoral breakdown of Lending within the Community in 1980 under
the four instruments was as follows:
(in mill ion ECU)
Sector Total ECSC EIB. Euratom NIC ' --
Productive sector 1,277.8 692.5 585.3
Infrastructure 1,204.8 4.6 1,110.6 89.6 I
Energy 1,669.8 323.2 1,057.3 '181 "3 1 'I 08 ,, 0
. 4------Total 4,152.4 1,020.3 2,753 .. 2 ') 81'. 3 ! 'I 97' 6 ' I ___ t_ _____
14. The percentage shares of the three sectors were as follows: 31% of
Lending went to the productive sector, 29% to infrastructure and 1+0% to
energy.
·The energy sector has be.come increasingly dominant over the years (having
accounted for only 11% of Lending in 1970), a develop~ent clearly in line
with one of the Community's piiority objectives. The Community borrowing
and Lending instruments have assisted particularly in the development of
indigenous energy resources, in the diversification of energy imports and
in energy saving.
Lending to th~ productive sector, on the other hand, sh6~ed the slowest
growth during the period, despite a sharp increase from 1979 to 1980 due
mainly to an upturn in investment project financing in the ECSC industries
and to major advance factory projects financed by the EIB in Ir~land. The
productive sector's share ~f total Lending fell from 54% in 1976 tQ 31% in
1980. This sharp fall reflects the general slowdown in productive investment
in the Com~unity. The sector should b~ given increased assistar1ce since it
is a direct creator of permanent jobs, particularly in small and medium
sized firms, where the global (oans technique has led to the diversification
and reinforcement of Community assistance.
c

-.7-
Lending to the infrastructure sec.tor has gro.wn steadily since 1970
(from 125 million to 1 205, million ECU), although its share of total Commu
nity lending has fallen from 34% ~o 29%. ~The EIB has provi~ed the bulk of
this finance, sine~ the NCI's activities are too recent and those of the
ECSC are restricted to the construction of housing for ECSC workers. The
·value of the contributions-made by the EIB and the NCI to the fi~ancing of
infras~ructure proje~ts Lies mainly in their impact on the e~onomic devel
opment of the Community's. less prosperous region~, particularl~ the Mezzo
giorno, Ireland, the assisted areay in the United Kingdom and Greenland,
and in the improvement in communications betw~en var~ous.Co~munity member
countries.
15. Lending is conce.ntrated in those Community countries with major reg.i.o.nal
problems. I~ 1980, Italy accounted for 34.4% of loans, the United Kingdom
for 25.4% 'nd Ireland for 9.1% <i.e. a total of 69%). This ~foportion has
remained fairly stat~c in recent years. France accounted for 15.7% of the
1980 total and Belgium for 6.4%.
2. Borrowing
16. The increase in the total volume of borrowing - 3 874 .miLlion ECU in :.
1980 as against 3 605 million ECU in 1979- was due .maihly to incre•sed c~Lls
by the NCI and the ECSC on the capital markets •.
Over a Longer period, it will be noted that, while total borrowing b~
the Commis$ion and the EIB is approaching 4 000 miLlion -ECU, the figure of
3 000 million ECU was almost reached in 1976 owing.to substantial borrowihg
to finance balance of payments deficits.
• -1 . The. ECSC pract1cally reached the 1 000 million ECU mark as· early as 1976
and 1978 and the EIB has increased its borrowing very, sharply since 1977,
the year in which it topped ·1 000 million ECU for'the first 'time. EuratOtm
h~s continued to e~pand its borrowing ~teadi(y. No loans in support of
payments balances have been contracted durin~ the Last three years.

WHh this growth in bo.rrowing, particularly si,noe 19<13', the Community
is ptaying an inc.reasingly important ro.Le in recycling capital from. countries
with balance of payments surp'Luses and in p.romoting priority investments in
the Community. Thanks to the' Community_'s standing., due mainly to the
gu;ilrantees it can offer and its financial capacity, it can raise substantial
amounts on capital markets on the best terms for investors.
. Year E.CSC
1970 \ 60
1971 102
1972 230
1973 263
1974 528
1975 731
1976 956 . 1977 729
1978 981
1979 837
1980 1,004 .
Trend in borrowing operations
by the European Communities,
by instrument
EIB(1) Euratom . EEC (Z)
169
413
462
60.8
826
814
732 1,249
1,030 99 S7.1 •.,
1,863 72
2,{+37 153
2,384 181
(in million ECU)
' NIC Total
?29
5'1 5
692
871
1,.354 I
1,545
2,937
2,429
2,916 i
~
178 3,605
305 3,874
<1> Excluding third-party participations in EIB finam:ing, which amounted to 402.3 million ECU from 1972 to 1980 <44.6 million in 1979 and 83.3 mill ion in t980>.
<2> Borrowing to finance batance of payllfents deficits.
' ..

- 9 -
3. , Balance between borrowing and lending
17. In the case of the N£I and Euratom, lending must move in line with
borrowing, since borrowing is undertaken only with a view to lending and no
loans are granted from cash resources. The difference that can be noted
in the case of the NCI is due to activities str~ddling the year-end and to
costs incurred in floating loans.
The same generally applies to the ECSC, since lending from own !eSources
mainly for low-cost housing,- is relatively limited. The situation is
different with the EIB, which has it~ own resources and cash holdings. ·It
was d,ue to this latter source that, in 1980, total .lending reached 3 124.6
million ECU, exceeding total borrowing by more than 700 million ECU.
(in million ECU)
Lending
1980 Borrowing EEC Non-EEC Total
NCI 304.5 197.6 197.6
Euratom 181.3 181.3 181.3
ECSC 1,004.0 1,020.3 6.6 1,026.9 EIB (1) 2,383.5 2, 753.2 371.4 3,124.6
Total 3,873.3 4,152.4 378.0 . 4;,530.4
(1) Excluding operations carried out under mapdate, on behalf, for the account and at the risk of the Community, which are accounted for off balance sheet 1in the EIB's Special Section (in addition to the NCl mentioned above, 1~6.3 million ECU of fin~ncing outside the Community). ·
'

- 10 -
III. Lending in 1980
1. New Community Instrument (NCI)
19.' Loans from the NCI's resources :totalled 197.6 million ECU in 1980.
They were granted for infrastructure investment helping to reduce regional
disparities, projects helping to implement Community energy policy and
projects involving both regional and energy policy aspect'S.
Except for the Friuli motorway, these projects were financed jointly
with the EIB, on a complementary basis, thus covering a substantial propor·
tion of the investment cost and facilitating the implementation of the
pr Jrity projects concerned. Depending on the time-scale of the projects
and their amortization period, the loans are for ten to twenty years. The
eleven projects fina~ced represent between them an investment of 1 660 million
ECU, of which ener.gy accounts for 911 million ECU •. The NCI Loans thus make
up 11.9% mf the finance required on average, the range for individual pro-.
jects varying from 7.4% to 31.7%.
20. In Italy, more than half the Loans are for inv~stment projects contri
buting to the development of the southern regions. The improvement of the
urban and inter-urban telephone networks in Apulia, with an additional
120 000 Lines, will strengthen the Links between this outlying region and
the re~t of the country and the Community and will make it easier to develop
productive activities. Infrastructure work (access roads, water supplies,
f~ood barriers) on the Syracuse industrial estate ~ill contribute to the
industrialization of Sicily.
The gas pip.eline being .cons.tructed between the Algerian/Tunisian frontier
and northern Italy (the financed section of which crosses Sicily, the straits
of Messina and part of C~labria) will provide the Mezzogiorno with natural
gas and, once connected to the European gas pipeline network, will help to
diversify and safeguard Community supplies.
..

11
Exploitation of a number of small gas and oil deposits in Lombardy and '
in the Adriatic or Tyrrhenian Sea will yield up to 1.7 mill~on toe per year, '
i.e. almost 1.5% of Italian oil imports. The introduction of an integrated
system for administering and controlling the generation and distribution of
electricity will lead to energy savings of some 50 000 toe per year., . '
Finally, in nort~ern Italy, the construction of the new Carni~/Pontebba
section of the Friuli motorway will improve the links between this mountai
nous region and the rest of Italy and Austria.
21. In Ireland, the various loans granted constitute essential elements
of the regional development programme. Peat production and the manufacture
of briquettes for heating are part of the programme for exploiting peat
resources, which should meet 20% of the country's electricity requirements.
The continuation of thE programme for modernizing and extending the tele
communications network will add more than 80 000 new telephone subscribers
and pro~ide numerous telex facilities, thereby improving conditions for
establishing and running firms.
22. In Denmark, finally, NCI assistance was provide~ for the first time
for two coal-fired_power stations, ~ne at Asnaes for the generation of
electricity and the other at Randers for the combined production of elec
tricity and heat for the urban heating network.
2. Euratom
23. For various reasons, not all the Community countries are committed to
the same extent to nuclear power programmes. Only Belgium and France turned
to Euratom fo~ financial assistance in 1980.
In Belgium, Euratom co~financed the second production unit (900 MW) of
the1 Tihangt. nuclear power station.-

- 12 -
In France, Euratom co.,.financed units II, Ill and IV (900 MW each) of
.the nuclear po~er station at Dampierre-en-Burly and continued to assist
the construction of the NERSA fast-breeder nuclear power station at Creys
Malvilles (in9us.trial prototype of 1 200 MW); participation in the NERSA
project breaks down as follolt!!s: EDF (1) 51%; ENEL <2> 35.5%, and the German
company SBK 14.5% (SI;iK combining German, Belgian, Dutc.h and United Kingdom
interests>.
These projects ¥e dgsi!J_ned to reduce dependence on imported oil and
are therefore given priority by the Community.
The projects finq,ne~d ~Y ~uratom have all al&o been financed by the
EIB. Even when combined, n,owever,.the financing provided does not exceed ' ' 24.4% of the cost of the investment tranches concerned. It should be noted,
however, that the total amount of inve.stment in each project is substantial:
some 1.5 mi.llion liCU p~f' MW ..
3. ECSC
24. The leve( of ECSC l~nding was particularly high in 1980: as in 1976,
the figure of 1 000 ECU ~rtaa-· again exceeded, with the number of loans total
ling 114.
The mining of c.Qql C~nd its transpor"tation to thermal power stations
account,ed for almost "~· t:,hird of the Loans. lt was mainly in the United
Kingdom that Large-scale. miAiAg projects on new sites were financed, parti
cularly the Se.Lby .project in Yorkshif\e. In the case of fhermal power stations~
finance w,ent to projects in a.~Lgium,, Germany an~ France. \
<·1 > EDF = Electri cJt>& de France
(2) ENEL = Ent.e Nazionale pe.r l'Energia Elettrica •.

- 13 -
In the steel indust~y, finance was provided mainly in Germany, France,
Italy and Luxembourg. This was the th~rd consecutive year in which
Luxembourg had apptied for ECSC loans, whereas its application in previous·
years had been negligible. By contrast, the United Kingdom steel industry,
which had received substantial Loans up to 1977, submitted no new appli
cations. A Large-scale project being prepared in BelgiYm had not been
finalized by 1980. Owing to the small .number of plants in Denmark, Ireland·
and even the Netherlands, these. countries' sh_are in ECSC financing must be
assessed over a number of years.
25. Loans were gra~ted for investment proj~ct~ in shipyards in Italy and
Germany, in the interests of providing a market for steel products. Certain
conversion Loans also have this secondary effec~, where they are granted to
engineering industries for example. Their main aim, ~owever, remains the
re-employment of workers made ~edundant in ECSC industries. Substantial
loans were granted for this purpose in 1980 in France and the United Kingdom.
For the first time, the financing provided by the ECSC for conversion pro~
jects accounted for a quarter of its total Lending.
26. The level of Lending for workers' housing in 1980 was ~ower than in
previous years owing to the fact that pro~rammes previously carried out
over two years were spread over three years a~d owing to the delays in
implementing the new programme (the ninth) now underway.
4. European Investment Bank (EIB>
27. In 1980 the EIB provided ~inancing totalling 3 124.6 million ECU (1)
from its own resources, mainly capital raised through borrowing. As regards
the operations it carried out as agent of the Community (Leaving aside Loans
from NCI resources), the EIB granted 176.3 million ECU from the Community's
budgetar~ resources for projects· Located q.utside the Community.
(1) 371.4 million ECU outside the Co~munity.

- 14 -
28. The financing provided by the Bank from its own resources breaks down
as follows: 88.1% to Com~unity countrie~, 5.5% to Greece and Portugal,
more than 2.4% to other Mediterranean countries, and 4% to ACP couritries
~nd oversea~ countries and territories.
The financing provided in the Community from the Bank's own resources
totalled 2 753.2 million ECU. Almost two~thirds of t~is amount went to
regional investment projects (irrigation, water supply, treatment of waste
water; telecommunications and transport; energy; industries, particularly
in the form of global loans for small and medium-sized ventures> located
mainly in the regions given ptiority under Community regional policy (the
Mezzogiorno, Ireland, Nbrtherh Ireland, Greenland).
Financing for projects h~lpihg to achieve the Community energy objec
tives (development of indigenous resources; diversification of energy
imports and energy sa~irigs) totalled 1 102.7 million ECU (1) (432.~ million
ECU for the nuclear sector> and constituted the bulk of lending for pro
jects of common European interest; loans for imprcwing communications
between member countries (sea links between the United Kingdom and Ireland
and the Continent, access to the Fr~jus tunnel, etc.) totalled 103.5 mil.lion
ECU.
29. As much as four-fifths of this financing was concentrated in Italy,
Ireland and the United Kingdom - the countries with the most acute struc
tural problems; the remaining loans were granted in'France, Belgium,
Denmark and Germany ana for two investment projects in Austria and Tunisia
which will help to safeguard the Community's energy supplies. (2)
<1) The difference between this tigt:Jre and tfre "energy" column "in Table 5 is due to the fact that some indtistrfal proje'cts contribute to the Community energy objectives, while other pt'ojetts in the energy sector - e.g. distribution of electricity ~ are financed under the regional developlne'nt policy.
(2) Loans granted On specHrl authorization from the EIB's Board of Governors under A'rticle 18 or the Bank's Statute.

- 15 -
IV. Borrowing i.n 1980
1~ The situation on capital markets
30. Borrowing conditions remained. very difficult during .1980 on most capital
markets. The worsening inflationaty strains resulting in particular from
the s~ccessive, rises in oil prices and also the uncertainty connected with
the situation ~n the Near ~nd Middle East were larg~ly responsible for
this situation. I~ the United States, the adoption of a restrictive mone
tary and budg~tary po(icy caused interest rates to rise sharply, although
this trend was interrupted in the second quarter,·when fears of a worsen-
ing recession led to ·a temporary relaxation of this policy:
31. In most indust~ialized countries, widening,balance of payments deficits
were a further factor pushing up interest rates. As rates were rising in
the United ~tates, they also went up both on national capital markets and
on the Euro-dollar market~ In Europe, they maintained theit upward tendency
until the end of 1980, although there was some ~asin~ in the middli of the
year.
32. On a number of financial markets, short-term interest rates reached
·exceptionally high levels, higher than those of long-term rates. It has
therefore become very difficult to raise Long-term funds through convent
ional fixed-rate bond issues, and such issues have had to be concentrated
on the few perjods in which there was an easing of long-term rates. This
situation led to an increase in variable-rate issues denominated in dollars
a~d, towards the end of the year, an upturn in stock market prices boosted
convertible bond issues. In the United Kingdom, only one foreign issue
was floated following the abolition of the relevant restrictions, while
the 'OUnt of Euro-sterl ing issues · incr~ased rapidly. In Germany, the
amount of foreign public issues denominated in German.marks remained at
roughly the same level as in 1979, despite many strains caused by the

- 16 -
deterioration in the country's current account. In Fr:ance, the maintenance
of positive real interest rates and the lead enjoyed by bond market rates
helped to boost issue~ on th~s market. Similarly, the amOUQt of issues
denominated in Euro-francs increased sharply. Issues denominated in
Belgian and Luxembourg francs fell, re~lecting exchange market pressures
on these currencies, while placements in guilders increased.
Outside the Community, the amount of foreign public issues fell in
Japan, .but remained the sime in Switzerland.
2. Breakdown of Community borrowing in 1980
33. The volume of borrowing carried out by the four community instruments
in 1979 and 1980 breaks down a:; follows:
1979 1980 I in mill ion ECU
I I' ..
ECSC 837 1,004 -EIB 2,437 2,384
Euratom 153 181
NCI 178 305
Total 3,605 3,874
Activity therefore in~reased despite the diffictilties experienced in
carrying out operations because of the sometimes unfavourable situation on
markets.
..

''
- 17-
Community financial markets provided 64% of the total funds raised
in 1980; · the proportions provided by national markets outside the Community I
(the United States and Switzerland> and the international m.arket were 10%
and 26% respectiv~Ly.
34. A breakdown of borrowing by currency is given in the·table on the
following page. This breakdown partly reflects the preferences of Loan
recipients, but is also greatly inf~uenced by interest rates and the vary-.
ing extent to which currencies wer~ available.
The high number of operations ~arried out in the for• of private
placings should also be noted. The use made of this borrowing techniqae
was due usually to the small amount per loan ~pplic~tion or to the impos-
.sibilit/of floatirig a public Loan in the desired currency at the particular
moment. On a more technical Level, the use of this technique makes it
possible to spread borrowing over a period of time and to take better
advantage of market fluctuations.

Borrowing in 1980, by c!Jrrency ..
(in mill ion ECU)
. _, - - . -- - ~ . -
Member country currencies Non-m:ember i:QUntry :-currencies
'
DM HfL ff LlT BfR UKL LfR US1> SFR YEN ~ . ..
NCI 48.4 91.5 164.6 . -
Euratom 17.5 22.3 50.5 48.5 33.9 8.6 -
ECSC 406.5 17.9 127.1 60.5 82.0 27.8 202.3 79.9
EIB 614.3 226.1 136.6 42.7 45.7 51.7 • 666.0 233.8 166.6 .. •
Total 1,2a6. 7 357.8 314.2 42.7 109.0 127.7 113.4 1,032.9 322.3 166.6
% ~3.2 9.3 8.2 1.1 2.8 3.2 2.9 ,. 26.7 8.3, 4.3 ·• "
(1) Taking into account third-party participations in EIB loans (83~3 mllli-on ECU), the total funds raised in 1980 am6unt to 2 466.8 million ECU. ·
;; ~ I·
" ,..
Total
304 .. 5
181.3
1,004.0
2,383.5(1)
3,873.3
100
\\
. f _. 00
I•
•

...; 19 -'I
v. I~terest subsidies\
1. Community interest subsidy mechanisms
35. The Community is currently able to grant four types of interest subsidy:
ECSC subsidies Con ECSC Loans)
EMS subsidies Con NCI and EIB loans in Italy and Ireland)
E~DF subsidies Con EIB loans in ERDF regions> <1>
Subsidies under the special aid arrangements for the Italian areas
stricken by the November 1980 earthquake (from NCI and EIB resources>.
The "eart~quake" interest subsidies were not applied in 1980. Each of
the four types of subsidy has the effett of lowering the interest rate by
three percentage points. However, the technique of granting the subsidies
varies: the EMS and ERDF, interest subsidies are dis-counted and charged to
the Commu~ity budget a~ a single sum, Whereas the ECSC subsidies are not
discounted and are charged annually to the ECSC budget over the first five
years of the loan. The "earthquake" interest subsidies are also to be
charged annually, but to the general budget of the Communities ~nd for not
more than twelve years.
- 2. EMS . b "d" (2) 1nterest su s1 1es ·
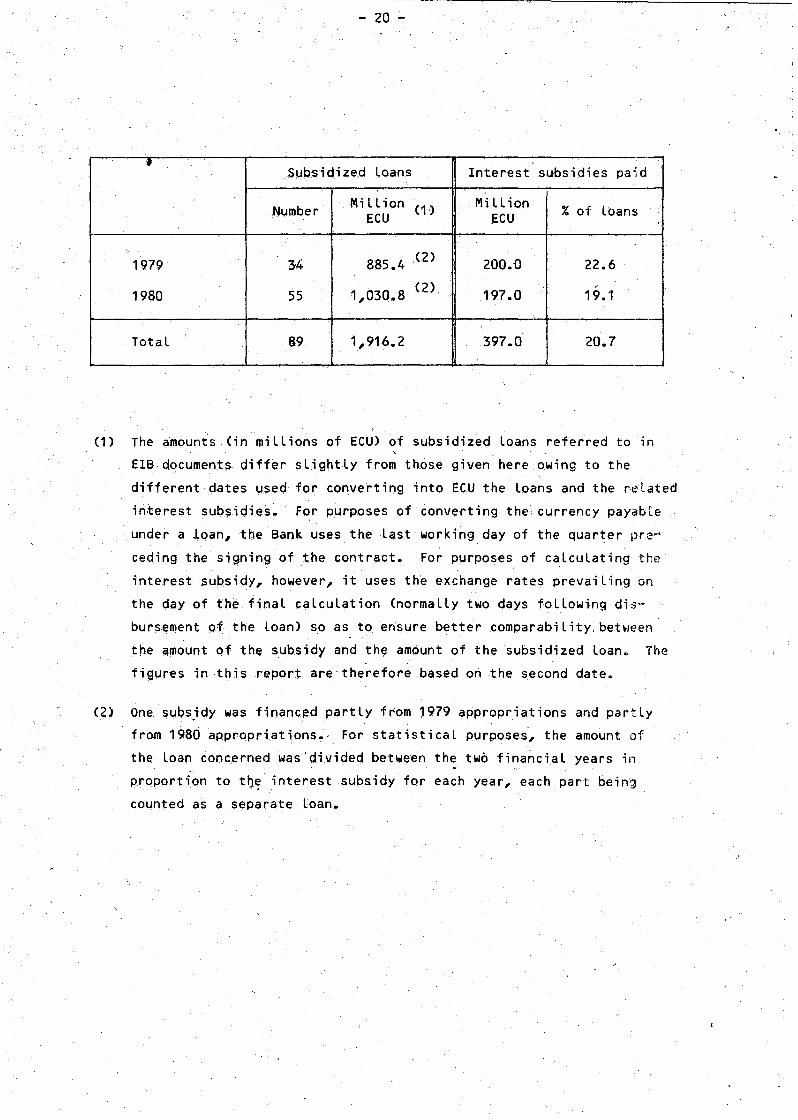
36. Sirice Council Regulation (EEC) No. 1736/7? of 3 August 1979 came into ' force, 89 loans hav& been subsidiz~d under the European Monetary .System,
55 from 1980 budget ~ppropriations.
{1) · An ERPF interest subsidy has been granted only once, since only one application for such subsidies has been received from Member States.
(2) Discounted interest subsidies, charged to the general budget as a single sum for each,Loan.
- 20 ":'
• ---Supsidized Loans Interest subsidies pa'ld
Number Mill ion {1) Mill ion % of loans ECU ecu --
-885.4 ,( 2) 1979 34 200.0 22.6
1980 55 1,030.8 (2)' 197.0 19.1
Total 89 1, 916.2 397.0 20.7
(1) The amounts (in millions of ECU) of subsidized Loans referred to in
EIB documents differ slightly from those given here owing to the
different dates used for converting into ECU the Loans and the r-elated
interest subsidies. For purposes of converting the. currency payable
. under a loan, the Bank uses the last working day of the quarter pre'"'
ceding the signing of the contra~t. For purposes of calculating the
interest subsidy, however, it uses th~ exchange rate~ prevailing on
the day of the final calculation (normally two days following dis
bursement of the Loan> so as to e~sure better comparability.between
the amount of the subsidy and th~ amount of the subsidized loan. The . '
figures in this report are therefore based on the second date.
(2) One subsjdy was financ~d partly from 1979 appropriations and partly
from 1980 appropriations.· For statistical purposes, the amount of
the Loan concerned was'divided between the twb financial years in
proportion to t~!· interest subsidy for each year, each part being
counted as a separate loan.

- 21 -
The 1980 operatio~s rela,ted to 44 investment projects which were
financed ~Y 47 Loa~s-from the EIB's own re~ources (884 million ECU) and
by 8 Loans from NCI resources <147 million ECU>, gi~ing a total of 1 031
million ECU; 7 projects were financed jointly from the EIB's own resources
and from those of the NCI. Four projects received several subsidized Loans.
The discounted amount of interest r~te subsidies totalled 197 million
ECU. The ratio of the total amount of interest subsidies to that of sub
sidized loans was 19.1~, as against 22.6% in 1979; this ratio depends inter
aLia on the length of the loans.
The amount of each interest subsidy and of each subsidized loan is
given in the annexed lists.
The interest subsidies break down by recipient country as follows:
two-thirds for Italy and one-third for Ire Land.
By origin. of. resources' lent, they break down ·into eight Loans from
NCI resources and 47 loans from the EIB's own resources (i.e. 15% and 85%
respectively).
37. An an~lysis by sector of use shows that 44% of the total amount of
interest subsidies went to projects in the energy secior: 22% for the
development of primary energy sources (hyrdocarbons, peat, hydroelectric
power>, 5% for thermal power stations and heat production, and 17% for
energy transmission (gas pipelin~ and power lines). Infrastructure projects
in the other sectors ~ccounted for the remaining 56% of the interest subsi
dies: 30% went to _water supplie~ and irrigation, 16% to the construction
of turnkey factories and variou~ infrastructure projects in industrial areas,
and 10% to the improvement of telecommunications networks and sea links and
the development of fishing ports and forests.
A~most four-fifths of the interest rate subsidies related to projects
Located wholly or partly in ~riority regions. Since the projects involve
infrastructure, the number of new permanent jobs for running the completed
projects is necessarily limited, except for the establishments that will '
occupy the advance factories. constructed in Ireland. Nevertheless, these

- 22 -
projects will eventually contribute, largely indire.ctly, to the development
of productive activities which will create a substantial number of jobs;
.moreover, the work involved and the supplies needed for carrying out these
infrastructure schemes will have di rec,t and indirect te~po·rary repercussions
on the employment situation over whay may, in some cases, be relatively
long periods. ·
EMS' tnterest Subsidies paid from 1980 Appropriations 1
Subsidized loans Int~rest subsidies paid
Number Million ECU Million ECU % ~
'
By recipient country
Italy 34 731.9 129.8 65.9
Ireland 21 298.9 67.2 34.1
55 1,030.8 197.0 I 100.0 ... -
i Bl orilllin of resources L,nt I
I .,
NCI 8 146.8 29.6 I 15.0 I -·
EJB 47 884.0 167.4 I 85.0 ! 55 1,030.8 197 .o I 100.0 I
i
By sector of use I ' I
Primary energy production 12 253.8 43.5 I
22.1 I
Transformation of energy \ 5 51.9 10.7 I 5.4 I I
Transmission of energy 7 177 .o 32.9
~ Sub-total: energy 24 482.7 87.1 2 '
Water engineering H 312~4 59.0 30.0
Industrial i nf rast ructure 8 146.0' 31.3 I 15.9
Transport and communitications 5 79.4 17.3 l 8.7 I Forestry, fishing 1 10.3 2.3 1.2 !
Sub-total: other infrastructure 31 548.1 109.9 55.8
Total 55 1,030.8 197 .o I 100.0 I

- 23 -
3. ECSC interest subsidies (1)
.. 38. ECSC interest subsidies were first used - in the 1960s - to make con
version loans more attractive and thus provide a more effective means of
re-employing labour. They have also been used, since the 1970s, to promote I
those investments projects in the ECSC industries which are beneficial to
the environment, to overcome bottlene-cks (coking plants in the steel industry)
and to set up research or vocational training centres. Finally, during the '
last three years, interest subsidies have be~n granted mainly to support
investment projects c'ohtributing to the reqt,.~ired restructuring of the steel
industry.
The allocations made in 1980, both those for conversion and those for
restructuring, were the highest so far made, and they are continuing to
increase. It should be hoted, however, that the incentive Affect of these
interest subsidies - which are uniformly fixed at three percentage points
for five years - diminishes as interest rates increase.
D 8 F L NL UK OK IRL I Total
, • Article 54 8.0 1. 9 8.0 5.4 0.3 1.5 0.5 1.8 27.4 ...
restructuring
Article 56 1.1 - 17.7 0.8 - 13.6 - 0.1 - 33.3 conversion
Total 9.1 1. 9 25.7 6.2 0.3 15.1 0.5 0.1 1.8 60.7
(1) Non-discounted interest subsidies, paid annually.

. Table 1
Table 2
Table 3'
Table 4
Table 5
Table 6
Table 7
Table 8
Table 9
Table 10
Table 11
Table 12
Table 13.
Table 14
Table 15
- 24 -
ANNEXES
TABLES
Borrowing by the European Communities (amounts outstanding)
Commission borrowing in 1980
Trend in lending operations in the Comm.unity, by sector
Total amount of loans granted by the Community in member and non-member count r1ies .;,. 1975 to 1980
Breakdown of loans.in the Community in 1980
NCI loans
Euratom loans
ECSC loans
EIB loans I
List of N'CI loans in 1980
List of Euratom loans in 1980
Breakdown of the amount of ECSC loans paid out during 1980
' I
Interest subs.idies granted by the various Community mechanisms (1970-80)
EMS interest subsidies, Financial year.· 1980: Italy
• EMS interest subsidies, Financial year 1980: Ireland
* * * * * *
List of reports. and do.cuments on Community borrowing and lending activities which have been submitted to the Council and to ParLiament ·

Table 1 -Borrow\ngs by. the European Coa111un\ t\ es (aaounts outstand\ng) ·
Year ECSC EIB Eu~ato1l1J' 1970 741 I 020 : 1971 802 I 423 : 1972 963 1184 : 1913 1 172 2 287 : 1974 1 617 3 124 : 1975 2 393 3 926 17 1976 1477 4132 14 1977 3956 5 421 . 110 1978 4416 6115 i82 1979 4 713 8 541 333 1980 s 300 (1) IO_S98 S02
(1) Excludlno Euratoa f111N• for the period pr\or to 1975
(2) Balance of paJieats f\Rancha
(3) Estl~&.te
~: Coa11\ss\on staff and EIB
{at end of each year, In m\11\on ECU)-I
EEC[2J ICI Totall1J - - I 761 - - 2 225 - - 2 747 - - 3 459 . - - 4 741 - - 6 336
1 161 - 9 384 I SOO - 10 986 I 361 ·- 12 674
96S 178 . 14 730 I 016 . .f02. 17 898
•
~
I

r I
No
r· A). NCI r 1 i I
I 2
3
4
5
6
7-
8
9
10
11
12
13
14
15
16
NCI
B)
Euratom
17
' 18 I 19
20
21
22
' 23
24 . '
25 I I
26
J Euratom
TABL.E 2
Commission borrowings in 1980
-Life Coupon Currency and Mill i Type (years) % amo_unt (milL ion> ECU
-
public issue 15 11 3/4
private placing 15 10 3/8
" 15 8,3 It 15 11 7/8
" 10 9 ,4·5 I•
II 10 14
oublic issue 15 11 .. • 15 11
private placing 15 13 .. 10 8 3/8 II 15 8,318. II 20 11 II 20 11 1/4 .. 15 11 1/4
" 15 11 1/4
public issue 15 13 3/4 :
Total
publ i·c issue 8 9 3/4 II 12 14,60 .
private placing· 10 - 8 II 15 11 1/4 II 20 10. 7/8 II 6 6 It 7 12 3/4
'
II 7 12 3/4
" 7 12 3/4 public issue 7 . 13
. Total
~---- -.
us .s 20
HFL. 40
DM 41
HFL '·0 OM 27,9
us g 8
us s 75
us g 70
us g 20
OM 22 I DM 33 I
HFL 75 I I
HFL 26 I ;
-·- ! ---,
15," ..J
14,
16,
14,
10,
6.,
57,
3
0
3
9
3
53 ..
3 1 s , .. 8, 6
': 2,
1..6 f''
9!' 3 'l -· -
'
. I_
I
HFL 51 . : .r, ;· I HF l 25
us g 26 ___ ....;.
LFR 500
FF 300
· DM 45
Hfl 15
HH 47,5 SFR 20 LFR 250 LFR 300 LFR 350
Bf 2000
~ ---- -·
! 9 , j 9, ~ t--·--
I
304,.
12,
50,
17,
5,
17,
8,
!21,
48,
5 !
---~
09
51
11
02
64
38
! l
181 ,. :

No Type
C) ECSC
27 bond issue
28 bol"d issue
29 bond issue
30 private placing
31 " 32 bond issue
33 " 34 " 35 " 36 " 37 " 38 " 39 " 40 " 41 " 42 private placing
43 ..
44 " 45 " 46 " 47 " 48 .. 49 " 50 " 51 " 52 " 53, II
54 " 55 " 56 . " 57 II
58 " 59 " 60 " 61 "
I
Life (years)
8
8
10
8
10
10
6
12
8
7
10
12
8
10
8
12
15
5
5
8
7
7
10
8,
8
8
8
8
12
~2
12
12
8
8
8
Coupon %
7 7/8
11 1/2
11 5/8
10 7/8
8
10
14 1/4
14
11 1/2
11
11 1/4
7 7/8
9 1/2
6
13 1/2
12,225
12 3/4 13 1/4
13,30
13,60
13,95
14,30
14,30
9,65
8 3/4
8 1/4
8 1/8
8 1/8
8 1/8
8 - 10
8
8
7,90
8,35
12:- 10
11 3/4
to
Currency and amount {min ion)
OM 150
us s 40
us s 50
FF 20
OM 40 LFR 500
FF 150
FF 400
' us s 100
us s 25
us s 50
OM 150
OM 150 SFR 80
UK t: 20
FF 20
FF 80
FF 20
FF 10
FF 20
FF 15
FF 20
OM 50
OM 40
OM 70
OM 35
OM 10
OM 50
OM 12
OM 12
OM 12
OM . 12
OM 250
LFR 250
LFR 400
Million ECU
58,5
30,3
38,2
3,4
15,6
12,1
25,3
67,3
76,4
19,1
38,2
58,5
58,5
34,5
36,4
3,4
13,5
3,4
1,7
3,4
2,5
3,4
19,5
15,6
27,3
13,6
3,9
19,5
4,7
4,7
4,7
4,7
97,4
6,0
9,7
I
..

No
62
63
64
65
66
67
68
69
ECSC
NCI +
Type
private placing / II
" II
" ' " II
II
Total
Euratom + ECSC
Life (years)
8
8
6
6
·s 5
15
5
.
Coupon %
p 1/2
13 3/8
5 1/4
5 114.
6 1/4
5 7/8
10 7/.8
17-14 3/4
.
€.ur'r,ency and amount (m.i ll ion)
BF 500
BF 2000
SFR 38
SFR 17
.SFR 30
SFR 20
HFL 50
UK t 25 .
Million ECU
12,1
48,4
16,4
7,3
13,0
8,6
17,9
45,5
1.004,0
1489,8
~==========--==================::===~=~============·===============================-
_________ .....:....._~ -~--.:.-~--·'· .,

Year Prod~~tive sector
1970 . 203,9
1971 340,3
1972 328,3
1973 503,8
1974 604,0
1975. .758, 7
1976 1.163,5
1977 938,8
1978• 745,4
1979 756,4
1980 1.277,9
TABLE 3
Trend in lending operations in the Community
by sector
Infrastructure
125,1
192,6 \ 191.,2
196,9
143,4
469,9
429,9
607,7
1.000,0
1.055,8
1. 204,7
(in million ECU)
--Energy Total ·
41,2' 370,2
. 48,3 581,2
174,9 694,4
282,5 983,2
480,2 1. 227,6
488,8 1. 722,4
556,4 2.149,8
693,2 2.239,7
1 .089, 1 2.834,5
1 .574,3 3.386,5
1.669,8 4.152,~

TABLE 4
Total Amount of Loans granted by the Community in Member and Non-Member Countries
1975 to 1980
(in mill ion ECU)
1975 1976 1977 1978 1979 1980 TOTAL
EIB + ECSC EIB + ECSC EIB+ECSC+EUR* EIB+ECSC+EUR EIB+ECSC+EUR EIB+ECSC+EUR 1975/1980 + NCI + NCI ' ,,
Million " Million " M1llion " ~ill ion % ~i l tion i. Mi ll10n i.
Belgium 52.9 3.1 55.2 2.6 15.9 0.7 64.1 2.3 139.6 4.1 264.6 6.4
Denmark 40.7 2.4 9.1 0.4 33.2 1.5 119.5 4.2 15.9 0.5 103.5 2.5
fed. Rep. of Germany 150.9 8.7 297 .. 7 13.8 221.0 9.9 218.9 7.7 196.9 5~8 143.3 3.4
France 275.1 16.0 193.3 9.0 490.8 21~9 486.4 17.2 391.5 11.6 653.5 15.7
Ireland 37.9 2.2 58.1 2.7 79.9 3.6 117.4 4.1 353.5 10.4 377.1 9.1
Italy 535.4 31.1 530.4 24.7 599.2 26.7 1007.3 35.6 1126.0 33.3 1430.0 34.4 '
Luxembourg 1.1 o.1 0.1 - 0.6 - 73.9 2.6 . 19.8 0.6 68.6 1.6 ' Netherlands 30.4 1.7 69.0 3.2 o.s- ~ 42.8 1 .5 0.6 - 4.9 o.1
United Kingdom 597.9 34.7 936.9 43.6 749.8 ~ 33.5 704.0 24.8 1103.3 32.6 1056.0 25.4 Non-EEC (1) - - - - 48.8 2.2 - - 39.4 1.1 57.5 1.4
Total 1722.4 100 ~.149.8 100 . Z239.7 100 2834.5 100 3386.5 100 4159.0 100 ' .
/
Source: Borrowing-and Lending instruments in the context of the Community's financiaL· instruments (updated)European Economy, July 1980, No. 6.
* EUR = Euratom
Million
592.3
321.9
1228.7
2490.6
1023.9
5228.3
164.1
148.2
514].9
145.7
16491.6
(1.) The EIB statistics for the Community iriclude operations 0f direct interest to the Community carried out under the second sub-paragraph of Article 18 (1) of the Bank's Statute, which stipulates that the Board of Governors may authorize loans for investment projects outside the Community.
.,
i.
3.6
1.95
7.5
15.1
' 6.2
31.7
1.0
o.9
31.2
0.9
~

TABLE 5
· Breakdown,of Loans in the Community in 1980
(in mill ion ECU)
NCI
Infr •. Energy Total
B
D 18,1 18,1
FRG
F
IRl 27,3 14,4 41,7
IT 62,3 75,5 137,8
L
NL
UK
Non-EEC (1)
Total 89,6 108,0 197,6
Pr. S. = Productive sector
Infr. = Infrastructure
'
Euratom ECSC
Energy Total Pr. S. Infr. Energy
82,2 82,2 29,17
4,29
98,48 0,78 29,79 .
99,1 99,1 237,55 0,51 37,41
iJ,97 0,13
_138,63 1,13
68,62 \
4,59 0,27
139,37 1,73 226,85
6,63
181,3 HS1 ,3 699,131 4,55 323,22
EIB Total
Total Pr. S. Infr. Energy Total Pr. s. Infr. Energy I
29,17 6,2 147,0 153,2 6,2 258,4
4,29 9,6 25,1 46,4 81,1 13,9 25,1 64,5
129,05 ~ 14., 2 14,2 98,5 0,8 44,0
275,47 1~7 63,4 .213,9 279,0 239,3 63,9 350,4
1,10 177,2 114,0 43,1 334,3 178,2 141,4 57,5
139,76 223,8 57.8.,5 350,2 1152,5 362,4 641,9 . 425,7
68,62 68,6
4,86 4,6 0,3
367,95 166,8 329,6 191,6 688,0 256,2 331,3 418,4 -
6,63 50,9 50,9 6,6 50,9
1026,9~1585,3 1110,6 1057,3 2753,2 1277,9 1204,7 1669,8 L...___ __ - --
(1) The EIB statistics for the Community include operations of direct interest to the Community carried out under the second sub-paragraph of Article 18 (1) of the Bank's Statute, which stiupulates that the Board of Governors may authorize loans for investment projects outside the Community.
l '
Total i
!
264,6
103,5
143,3
653,6
377,1
1430,-o
68,6
4,9
1055,9
. 57,5
4152,4 -------'------- --

NCI Loans 1979·~1980
(in J:UHo:t I~CiJ)
\
1979 1980 ---·-···--·-··-----~
Pr.s. lnfr. Energy Total .
Belg1um • f.------------------+--·------------···----' L.!!~mmark·------------· ~------- 18.1 __ 1_8._1 __ I rR of Geruny 1· France - ..
Ireland ... 62.0
I tal)! - 39.6 Lux81lbourg .. -Netherlands - ... United Kingdom - 25.9 .
Non-.EEC - -Total - 127.5
Pr.Se • Productive sector •
!nfr. • Infrastructure
-24.7
.~tS.lt
--79.4
-149.5
- .. - - -86 .. 7 r .. _ 27.3 1fi .• Jt lt1.7
·-85.0 .. 62.3 75.5_ 137.8
1 .. - - - I - :-----~ .. - .. -
105.3 - .. - .. ... - - .. -
277.0 ... 89.6 108.0 197.6

I 1977
Pr.s. lnfr. Energy Total
Belgium - - - -. Oellllark - - - -
FR of Germany - - 77.05 77.05
' 19.85 19.85 France - -Ireland - - - -Italy - - - -laXSIIboUrg - - - -JJether 1 ands - - - -United K\-ngdo11 - - - -lloa-EEC - - - -Total - - 96.90 96.90
Pr.s. • Producttve sector lnfr. • Infrastructure
TABLE 7
Eurato11 Loans 1977-1979 "'
(in ~illion ECU)
1978 1979 . 1980 .
Pr..S. I nfr. Energy I otal ~ .. Pr.S.Infr. Energy Total Pr.s. lnfr. Energy Total I
- - - - - - 50.54 . 50.54 - .. 82.2 82.2 ·-- - - - - - - - I - - - - I
34.37 34.37 -·-------·--.. - - - .. ·• - - - -
67 .ss 67 .sa 99.1 ---
99.1 I - - .. .. - .. - - -- - - - - - - , - - - - - I
- - 35.89 . 35.89 - - 34.04 34.04 a - - - , I
! - - - - - - - - ~ - - -I - - .; - - - - - - - - -- .. - - - - - - - - - - i .
- - - - - - - - - - - --
- - 70.26 70.26 - - 152.46 152.46 ..... - 181.3 181.3

{1970.19nl
Denmark FR of Ge!'lllany France
Ire. land Italy
Nether 1 an ds
TABLE 8
ECSC loans 1970-1980
(1n million ECU)
1$7(1 1971 ' 1972 1973 -·-~·----sect In· £ne1· To\al s.ct(1) In· £nar- Total s..ct In· Ener- Total · Sfllct tn· t.ner·. TOfat
PrOd Ira• goa prO(! fras goe prod ha~ gte prod bee. g1e
2.90- 2.90 19.03 - 19.93 15.33 '.20 - 16.!>3 0.72 0.62 1.3-4 10 28 ·--------------------·-
7.81 181 0 2! -
11.69 1.11 1000 ---·------..,-------------
~.03 2 ::s 7.61 71 00
6.04 - 1,&1· 1.18 33!16 - 63.~< 2.66 1.06 63.24 ·---------------'------------- ·--~-......,-----~----·~ ---·---
6.00- 6.00 ~.eo - 1,60 ~.i!fi 1.4<1 - ·2~.73 0.76 1.01 1.n ·-------------'--:...-'----------..--:----:------,--·---2.00- 2.00 0.21 - 0.29 . - o ... - o••
2 . ..0 0 ... - Ul r..e& 0.06 - 6.00 IO.CI tQ 61 3,18 () &0 ·- 3.11e 1fJ5- 18~
UnHed Kingdom ~~~~~~------------------------------------------------~--------------~-----------
32.76 1.72 J() ~I 65.0~
Non-EEC
Total 28,23 1,58 1.84 31.$1 1111.111 .0,51 21.80112. 11! 166.118 7,115 14.li7 188.60 225.94 S.6li 54.81 286.41 299.96 4 <!i 7145 377.87 •
(1} I ndustr,y
(1975-1979)
·c1117S 1171 1917 lil78
~1) In- ~ner· Total Sect In- Ener- Total Sect In· tner- Total Sect In- ~ner- lotal Prod tras goe prOd fraa. got prod fras o•• prod 1ras Qift
Belg1um ..0.35 1 77 - •2.12 3oi.S8 2.69 - 37.27 15.01 0.86 -- 15,87 1.1W- 1.89
Oenaark 22.58 o.•t - 22.99 0,50 - 0.50 13.07 0.10 - 13.11
FR of Gertany' 1u1.32 7.80 23.65 150.&7 la6,75 8.117 10,48 186.111 ?7.80 5.86 81,7!) 11651 115,1;3 5.60 17.60 139.03
\ France Ireland
Italy
luxembourg
Netherlands
112.14 4,95 - 117,09 101.12 4,28 27.00 133,20 125.27 0,87 48,37174.51 89.94 2.77 34,43127.14
0.17 - 0.17 O.lf4 0.15 - 0.69 0.19 - 0.19 0.02 - 0.02
175.75 0.84 - 176.59 1<6.~ 0.91 - 147,74 170.66 2.69 - 17H5 123.13 2 63 - 126.36
0.61> Q.48 - 1,13 0,08 - 0,08 0.58 0.58 73 50 0.44 -· 73.94
211.54 0.89 - 30.43 38.lli 0.311 ·-- 38,55 0.51 0.51 42.00 0.82 - 42.82
untted K1ngdom 125.12 1.13137.22283.47 37s.t2 o.04 142.36 s111.32 113.59 ~ 6li 73260.Jt
Non·fiC
(tn 111!lH~n ECU)
Sect '"· E.ner· Total prod trp;s c·• 30.21 0 ...
0.19 0.?8.
125.40 5.08 I 7.58 149 iJ6
69.26 2.97 28.7'\ 100 94
13.90 0.00 -: '13.93
94.25 7.33 -· 101 58
19.0!06 0.31 -- 19 77
OS6- 055
26.35 3.&:1229.04 2!>9 01
Total 120.45 18.541&0.87 &04.a& 865.ro 1&;21179.85 106:1,7& s12.& 12.04 21s.ss 741.~ <62.84 17.211297.58 797.88 3re.83 21.11 21:u3 67s.7e
(1) Industry
1980
Prod. Sect. lnfras. [~ Total
Bel gtua ... - 29.17 29.17 Oe111ark 4-.29 - .. ' 4 . .29 FR of Geraany 98.4-8 0.78 29.79 129.05 France 237.55 0.51 37.41 275.47
I
0.97 . 0.,13 1.10 Ireland .. ltalr ' --~38_.63 1.13 139.,76 - -Luxeabourg 68.62 - "' .68.62-
-Netherlands 4.59 0.27 - 4.86 Untted Ktngd0111 139.37 1.73 226.85 367.95
Non-EEC 6.63 - ... - 6.63
Total 699.,13 4.55 323,.22 1026.,90

TABLE 9
Loans froa-EIB own resources
(1970-1974) (In million ECU)
1970 ' 1971 1972 1973 197~
Sect 111 In- lOner- Total Prod lraa l)te
Sect In- lOner- Total prod ',,... o••
Sect In· £.ncr- Total Sect 1 !n- tnet· Tot~! 'Sect In- tr'ler T.Jlat prod traa g1e \ prod has Qle prod fras 'Jtf::
6.0 16,0 22.0 14.~ 14,4
Dena irk 3.5 3.3 6.8 6.4 ~ 4
F'R of Ger111any -'E 1 46,1 29.7 26.8 5.4 61.9 44 6 85 8 130.4' 79.0 -- 125 5• 204.5 26.5 - 6"" % ' ·--------France ::0 0 18.-o 23,4.- 81,4 ~.9 53.6 16.0 124.5 4.5 80.4 60 0 144.9 53.8 85 6 31.2 170,8 45.5 56 8 91.
Ireland 7.3 15.3 22.6 -21.2 2~.2 4f ••
. I hly 100.8 10o4.5 205.2 157.9 111.7 5.0 274,6 113.2 103.0 2·16.2 70.1 86.8 24.4 181.9 136.1 38 5 ·~3 4 2 ·~ s :----:-------·------;------------------------------Lux811bourg Netherlands Un\ted Khgdom Non-EEC
1,0
1t75
t.O
2.8 a.o 8.0
182., 21.4 4611.0
67.1 67.1 68.3 13.1 68.1 149 s
182.3 _183.4 160.2 ~.a 2n.9 1a1.2 221.1 111111.8 304.0 t38.o 406.7 &4V
(In 11tlllon ECU) 1
1877 1178 1979 --------------
5«1111 lr>- £ner· Total Sect In- £ner- Total Sect In· 1\ner- Total Sect tn- !One<- Total Sect In- £ner· Total Prod tru 111• prod. lraa. gie prod lras g1e prod Ires goa prod lras g•e
Belglllll 10.8 10,1 17,9 17,9 62.2 82.2
Dena ark 1Ul 8.1 17,7 9.1 9.1 12.8 1, I 12,8 32.7. 12.4 SH 42.5 106.3 5.4 38 6)
FR of Garaany 11.2 101.11 110.8 28,4 28.4 2 3 43.2 45.5 4.0 438
France 1.2 121.9 20.11 158.0 '9·1 60.1 lfU 119.5 296.5 236 231.6 ll8.1 35113 1,7 122,1 ll89 222 7
Ireland 7.1 30.0 37.7 29.11 24.2' 3.1 57.4 18.3 61.4 79.1 ~~.8 72.6 30.0 111 4 49.2 124. 79 3
Italy 52.9 208.2 117,7 358.1 137.~ 1115,1 50,0 382.6 1117,1 189.3 39.3 425.7 142.2 l74.0 32U &45.1
luxeabourg Netherlands 30.4 30.4
----------------------------------UnHed Ktngdom &7.1 au 1112.4 334.& 94,1 132.3 1111.2 417.e 11a.• 218,4 92.8 -'69.5 67.3 2•r.o 116.4 430) 64.o 2999 J/5.1 n9.o
Non-EEC
138.2 4$1.4 327.9 t17,& 297.1 411.7 3711.5 loe&.o 426.2 SGb.7 379,5 140'1.3 262.e 982.8 721.3 ;968,5 3n.a ~-~~ 991 o m1.2
Industry, agr\ cUltUl"e and servt ces I.~Sstrt a and tfo v
Bel gila
08Mal"k FR of Gel'ltaaY•
France lrelmd · Italy Luxeabourg Netllerl ands '
llll,ted Kingdol No..£EC
total
Prod. Sect.
6.2
9.6
-1.7
177.2 223.8
---166.8
-585.3
1980 -lnfras.
-~5.1
-63.4-
114-.0 578.5
--329.6
-1110.6
Energy Total
147 153,.2 -
. 4-6.4- 81.1 --~---
14-.2 1Ap.2 ·--- -~
213.9 . 279.0 --
4-3.1 334-.3 350,.2 1152.5
- -- -
191.6 688.0 50.9 50.9
1057.3 2753.2

----~-~~~~-----~-----:------:---------
TABLE 1'0
List of NCI Loans in.1980
(in mill ion ECU) /
Title of Project' Italy Ireland Denmark Total % "
A.It1frastructure
I
I
\
1. Friuli motorway 37,3
2. Apulia telephone 12,5
3. Syracuse i ndust r·i a l estate 12,S
4. Irelal'ld - telecommunications 27,3
TOTAL 62,3 27~3 89,6 45,3
a. Energx_
5.
·6.
7.
8.
9.
1 o. 11.
Algeria-Italy gas pipeline 41,7
Control system for elect. grid .. J7. J . ~ ' I
' Hydrocarbon deposits 16,7
" ~ .... .. :s· s· ~ .. ...
Peat produ~tion .. , .. ··1 . -~ ' ; . ;~ .. F? :, " .. ·~;'
Peat production and manufacture . of briquettes \ 8,9·~.
•, . '" ' ..
station- Asnaes Coal-fired power ' 8,9 . Combined heat and power station - Randers 9,2
TOTAL 75.-5 14,4 18. 1 108,0 54,7
TOTAL A + B· 137,8 41.7 18,1 197,.6
% 69,7 2J,1 9, 2 JOO
For this tab~e, the ambunts of the loans were c6nverted into ECU in the same way
for all loans, whether subsidized or not. The am~unts of th~ subsidized loans
therefore differ slightly from those shown in the other tables, wliich. comJjare the
sjze of the subsidy with that of the loan~
"

TABLE 11
List of Euratom Loan~ in 1980
\ (in million ECU) .
Title o.f Project Loans
France : '
NERSA fast-breeder nuclear reactor for nuclear 48,6 power station at Creys-Malville
Electricite de France for power station at ~
Dampierre-en-Burly 50,5
Belgium :
Intercom, for unit II of the Tihange power station 82,2
TOTAL 181,3

TABLE 12
Breakdown of the Amount of ECS~ Loans paid out durin~ 1980
r 0
r -+. .., z c: OJ 0 (!) -n ...... 7" (!) n Community )( (!) (!) en a. ., ..., ..... ..... c: rl- 0
Sector (!) r- ::J (!) • Ql (!) .... ::J ::J :::r 3 3 I.Q 3 ., ::J ,- Ql 10 ...... (!) 3 :z o- ...... Ql 3 ::0 n Ql r-" a...-t ., c: 0 in million in 0 c ., Ql (!) (!) ::J '< 0 (!) ,- ::J ::J c: 3 "" ::J"O a. 3 a. Ql -'· I ECU X ., '< • - ::J rl-
' (Q a. '< Ill -·
6,40 -
226,85 1
- Coal industry 233,25 22,7~ · (Art. 54 § 1)
/ ',
Iron ore mines (Art. 54 § 1) '
SteeL industry 63,78 4,29 90,92- 121,30 133,56 ),52 6,63 424,00 41, 2~
(Art. 54§ 1) -· j ' . . -
Thermal power stations ' 89,97 8, 71 29,17 23,39 37,41 '
<Art. 54 § 2)
· Other projects (Art. 54 § 2) 5,07 . 4,59 9,66 0,9A
'
Total 63,78 29,17 4,29 ~ 20, T1 158,11 ' 138,63 230,37 4,59 6,63 756,88 73,7'
- Conversion (Art. 56) 4,84 7,56 116,25 0,91 135,85 265,47 25,2 '
- Workers' housing (Art. 54> 0,78 0,51 o, 13 1 '13 1,73 0,27 4,55 0,4
I I I Overall total 68,62 29,17 ~.29 h 29,05 I
275,47 1 ,1 0 139,76 367,95 4,86 6,63 1026,90 1 00,0(
i - !
·~
' . . ' . . . -
" /!;•'

•,
..
TABLE 13
Interest Subsidies granted by the various,Community
Mechanisms (1970-1980)
(in million ECU)
ECSC (1)
'
Year Article 54 Article 56 EMS (2) EROF (2)
(3) (4) •
1970 1 6,8
1971 2,2 2,2
1972 4 3 \
1.973 0,~ 3
1974 6,1 5,4
1975 6,4 6,6
1976 3,4 6,7
1977 2,5 17,3
'1978 12,2 18,1
1979 21,7 25,5 200 12,1
1980 25,6 ' 33,3 197 '
(1) Non-discounted interest subsidies, paid in annual tranches.
<2> Discounted interest subsidies, cha~ged to the general budget as a single capitalized sum.
(3) Restructuring.
(4) Conversion.

TABLE 14
EMS Interest Subsidies! Financial Year 1980: ITALY
Borrower
NCI Loans ------
AGIP S.p.A.
Ente Nazionale per l'Energia Elettrica (ENEL)
ENEL
Ente Nazionale Idrocarburi
Cassa per iL Mezzogiorno
EIB Loans
AGIP S.p.A.
ENEL
ENEL
Municipality of Brescia
ENEL
ENEL
ENI
EN!
SNAM S.p.A.
(EN!)
Project
Hydrocarbons .,
Hydroelectric power station at Alto Gesso
Control system
Gas pipeline Algeria/Italy I + II
Industrial estate Syracuse
Hydrocarbons Nilde
NCI total
- Settala Amelia B - Cupello
IV
Hydroelectric power stations: -Alto Gesso B - Edolo A - Edolo B - Prescenzano .
Thermal power stations:
._
Loan
16,5
18,2
16,9
41,7
12,4
105,7
5,5 7,5 3,3
60,5 51,9 50,8 16,4
- Brindisi IIA 8,4 - Sulcis 5,3
District heating Brescia B 4,2
Electricity Sardinia A 8,4
Electricity Lazio South 14,8
Gas pipeline Algeria/It~ly IIB 37,6
Gas pipeline IV Calabria 32,9
Gas pipeline Minerbio-timella 24,7
C1) Exc~uding part financed from 1979 appropriations
( 1)
{in million ECU)
Interest ··,subsidy
2,88
3,86
3,38
8,35
2,65
?1,12
0,47 1,09 0,43
10,02 9,26 8,26 2,66
1,40 0,86
0,83
1,45
2,41
6,78
6,52
3,99
en
. ·"'

Borrower
Cassa per il Mezzogiorno
Cassa per il Mezzogior:no
Cassa per il Mezzogiorno
T 0 T A L
Project
Irrigation: .., Oristano - Forto•re (Foggia) ' - Campidano - Codin-io (Peligna) - Nurra (Sassari) - Chil ivani
Alta Stornara B (Taranto)
Aqueducts: - Verde , - Pertusillo IIIB - Ruzzo A - Basilicata. IA
Industrial estates:
I T A L Y
Latium/Abruzzi IIA 1 Campania/Sicily IliA - Syracuse Ilia'
EIB total
(in mil~ion ECU)
Loan
18,6 . 70,5 24,9 16,5 18,1
4,1 32,9
8,2 41,2 4,1
12,4
20,9 12,5
9,1
626,2 .
731,9
Interest subsidy
3,80 12,08 4,26 2,85 3,14 0,71 6,65
1,43 7,12 0,68 2,15
3,66 2,16 1,59
108,71
129,83.
=========================================================================

TABL.E 15
EMS Interest Subsidies, Financial Year 1980: IRELAND
Borrower
NCI Loans
Bord Na Mona
Bord Na Mona
Irish Government
EIB loans
Bord Na Mona
Project
Peat production
Peat production and minufacture of peat briquettes
Telephoneenetwork.VII A
NCI total
Peat production I C
Electricity Supply Peat power stations A Board <ESB) Shannonbridge and Lanesborough
ESB
Irish Government
Irish Government
Irish Government
Irish Government
British and Irish Steam Packet Co.
Irish Government
Irish Government
Coal-fired power station Moneypoint A
Water engineering Shannon B Water eng. Mayo-SligoB Water eng. East & South-East B Water eng. South~West_A Water eng. Midlands & North-East
A Land drainage 8
Advance factories: - Industrial Devt.Auth. II
II II II II B
- Shannbn Free Airport Devt.Co. II·
- Gaeltarra Eireann II
Telephone network - VII A - VII B
Roll o'n/roll off vessel
Forestry development
Development of fishing ports
EIB total
T 0 T A L IRELAND
Loan
5,5
8,8
26,8
41,1
8,9
4,4
29,6
9,9 7,4 5,9
14,8 14,7
8,2
49,0 27,1 10,9
4,1
29,7· 3,3
11,1
10,3"
8,5
257 ,,8
298,9
(in million ECU)
Inter~st
subsid>:
1,11
1,77
5,55
.8,43
1,65·
P,97
6,66
2,32 1,73 1,35 3,47 3,38
1 ,9,1
10,85 7,04 2,42
0,92
6,85 0,75
2,11
2,36
1,98
58,72 . ....
67,15 =========================================================================

- 43 -
LIST
of reports and documents on Community borrowing and Lending activities
which have been submitted to the Council and to Parliament
1. The annual financial reports of th~ ECSC.
2. The annual reports on Eur.atom borrowing and lending activities, the
latest in respect of the financial year 1979 and dated 28 February 1980
(Doc. COM (80) 70).
3. The annual report'~n the borrowing and lending aGtivities of the NIC -
financial year 1979 - dated 16 April 1980 (Doc. COM (80) 192).
4. The annual report on the application of EMS interest subsidies (to
NCI and EIB loans>, financial year 1979, dated 16 April 1980
(Doc. COM (80) 192).
5. The general reports on Community borrowing and lending activities:
(a) The first dated 17 March 1976 (Doc. COM (76) 111).
(b) The second dated 22 J~nuary 1981 (Doc. COM <81) 8>~
' 6. The accounts drawn up for a~l the borrowing .and lending guaranteed
by the Community's general budget:
(a) In Part II of the general budget.
(b) In the revenue and expenditure accounts and balance sheets
relating to the implementation of the budget.
(c) In the ann~x to the budget, provided as an alternative to
inclusion therein, concerning capital operations and debt
management, in accordance with Article 16 (3)(b) of the
Financial Regulation.

\ .. 44 -
7. The EIB submits an annual: report, with a balan.ce sheet and profit
and Loss account, after approval by its Board of Governors, on the
Bank's activities from its own resources and on those carried out
under mandate.
8. T~e report on the experience gained in applying the NCI, together
with a proposal for its c.ontinued use, dated 30 October 1980 (Doc.
COM (80) 670).
9. The report on the experience gained in applying EMS interest subsidies,
about to be transmitted to Parliament.