commission of the european communitiesaei.pitt.edu/5683/1/5683.pdf · commission of the european...
TRANSCRIPT

COMMISSION OF THE EUROPEAN COMMUNITIES
COM (88) 655 final
7 December 1988 Brussels,
COMMISSION REPORT
Medium-term projections of . . social Protection Expenditure and its f1nanc1ng
1990 Projections - Summary report

CONTENTS
1. Introduction
2. Social protection main indicators and trends
2.1 Expenditure and receipts as %of GDP 2.2 Demographic indicators 2.3 Trends 2.4 Conclusions
3. Receipts : structure and trends
3.1 Nature 3.2 Social contributions in detail 3.3 Sector of origin 3.4 Conclusions
4. Expenditure : structure, trends and amounts per person
4.1 Nature and type 4.2 The functions of social protection benefits 4.3 Main functions in detail
4.3.1 4.3.2 4.3.3 4.3.4
Health Old age and survivors Maternity/family Employment
4.4. Fiscal benefits and capital transactions 4.5 Conclusions
~EE~!}9i£~§. A. The methodology of social protection statistics
B. Economic assumptions
C. Demographic assumptions
D. Detailed tables
++++++++++++++
2 4 5 7
8 11 11 11
16 17 20
21 21 24 24
25 27

1. INTRODUCTION
On 28 July 1978 the Commission sent the Council a report on 1980 projections of social expenditure and its financing, together with the national reports on which it was based.
The Council expressed its satisfaction with the work accomplished and acknowledged the value of the document submitted. The Council went on to request the Commission, in cooperation with governmental experts, to evaluate the experience gained during the preparation of the report and to come back with proposals for a further stage of the work.
The Commission services submitted proposals for a four-year work programme, which were accepted by the Council in December 1982 (1).
This programme is designed to provide those responsible - at Community and at national level - with regular information on medium-term trends in social expenditure and its financing, particularly its major component : social security, including the cost implications of Community proposals in this field, especially those designed to improve the employment situation (such as flexible retirement).
The programme consists of :
1. Annual summary reports
2. Priority policy analyses
to be drawn up by Commission services. The results of the analyses will be examined notably in the framework of concertation in the social security field, set up by Council resolution in January 1974.
This document, third and four-year work-programme reference to the latest protection (1984) at the started.
last of the annual reports under the present contains the projections (2)for 1990 by available statistical data on social time when the works for this report were
Projections are made by national experts using economic assumptions developed in 1986 by the Commission•s services (COMET econometric model, DG II) that do not necessarily coincide with official national views. Demographic and other assumptions have a national origin (3)
(1)COMC81) 661 final
(2) Based on legislation at 1st May 1986. The use of constant legislation implies that the 1990 data are projections rather than attempts at realistic forecasts.
(3) The data for Italy are the previous ones to the major statistical revision that has taken place recently.
3

- 2 -
This report is structured as follows. Chapter 2 gives a panoramic view of social protection expenditures and receipts in the EEC from 1980 to 1984 and its projection up to 1990 as r. of GOP. This aggregate indicator is compared with some crude "indicators of need" such as dependency ratios or unemployment ratios.
A closer view of receipts and expenditures is taken respectively in chapters 3 and 4 where structure and projected growth trends up to 1990 is analyzed. For those member States that provided data, fiscal benefits and capital expenditures are also discussed in cha~ter ;.
Several appendices explain the main methodological issues concerning social protection and provide the economic and demographic assumptions underlying the projections and computations of the main text. Detailed data on expenditures and receipts are also contained in the appendices.
Lastly it should be noted that data for Spain, appearing for ~he firs~ time in the European Soc1aL Budget projections together with
Portugal, refer exclusively to social protection provided by the public sector, although crude estimationsof privately provided social protection indicate that this would not amount to much more than 1 % of GOP.
2. SOCIAL PROTECTION : MAIN INDICATORS
Social protection schemes have definite objectives and rely on important amounts of resources for their fulfillment in all member States of the EEC.
The fact that, in general, all member States provide their c1t1zens with almost universal coverage, 1n varying degrees, for the main functions of social protection (or "risks" in the more traditional terminology of social security) explains the level that the resources allocated to these schemes have reached as a proportion of each country's GOP.
2.1. Expenditure and receipts as %of GOP
Both expenditures and receipts are shown as r. of GOP in table 2.1. where not only base (1984) and projected (1990) years are included but also historical data for the 19~0-1983 period in order to make the trend clear.

- 3 -
Table 2.1. Social Protection as % of·GnP 1980-1990
Receipts Expenditures
1980 1981 1982 1983 1984 1990 1980 1981 1982 1983 1984 1990
(' 28,1 31,3 30,7 31,5 31,7 - 28,1 29,4 30,4 30,9 29,6 -or. 30,6 32,1 32,5 33,5 31,1 30,3 29,7 30,9 31,1 30,6 28,9 '27,0
D 30,1 31,0 30,9 30,2 29,5 27,6 28,6 29,4 29,4 29,1 28,5 26,4
GR 15,3 16,8 19,0 20,2 20,2 19,3 13,3 16,0 18,8 20,0 20,0 20,2
SP 15,7 16,5 18,2 17,9 17,7 18,4 15,6 17,2 17,2 17,6 17,4 18,0
F 27,0 27,5 28;7 29,5 30,2 28,0 25,9 27,4 28,5 29,0 29,4 28,4
IRL 20,8 21,5 23,1 23,3 25,8 24,5 20,6 23,8 23,2 23,9 23,9 22,3
IT 24,4 25,5 26,7 29,3 28,4 28,1 22,8 25,3 25,8 27,1 27,3 26,4
L 28,2 29,6 29,3 28,3 27,5 26,5 26,4 26,3 27,4 26,1 25,2 24,4
NL 36,9 37,5 39,0 41,5 39,4 39,8 30,4 31,7 33,1 33,9 32,8 32,1 p 14,8 16,2 15,5 15,6 16,1 14,0 14,6 16,0 15,7 15,5 15,2 13,4
UK 25,7 26,9 28,0 28,0 28,3 26,2 21,7 23,8 23,8 24,1 24,6 22,8
EEC 26,9 27,7 28,5 29,2 28,8 27,2 24,9 26,3 26,8 2 7,2 27,1 25,6
Sources : 1980-1983, except Spain, EUROSTAT; 1984-1990 national reports and table B-1 of appendix B; Spain 1980-83, national official Estimates.
Keeping in mind that projections based on constant legislation may overestimate observed trends, the data of table 2.1 confirm the trend towards stabilisation of expenditures and receipts as a percentage of GDP. The case of Portugal is due to a rather optimistic (although not unthinkable> hypothesis about real GDP growth.
Legislative changes under way in several countries may change the outlook in 1990 but if the projections of table 2.1 are confirmed, no convergence of social protection Levels at the European scale should be expected by the end
of this decade.
5
I
:
I I

- 4 -
2.2. Demographic indicators
The comparison of data from table 2.1 with the demographic indicators offered in table 2.2 is interesting as no one country expects to have comprehensive demographic relief in 1990. Indeed all the countries but Greece and Ireland project a deterioration of their "aged dependency ratio" (1) (to which pensions and health expenditure is closely related) and total population <to which also health expenditure is related) will only decrease slightly m the federal f.ep..Ol ic Germal:ly. in exchange the "total dependency ratio" (2) (influencing child and fa,:.ily allowances and education expenses) will substantially decrease everywhere except in Greece, while the unemployment picture is only expected to be brighter in about half of the countries.
This ambiguous and still worrying demographic picture contrasts with the trend tow~rds a stabilizing level of social protection emerging from table 2.1.
Table 2.2. Demographic indicators 1984-1990
Total p~pulation Aged dependency Total dependency Unemployment (x10 ) ratio (a) ratio (b)
1984 1990 1984 1990 1984 1990
B <J853 9734 23,0 25,1 68,2 66,3
OK 5112 5138 25,6 25,8 72,0 66,2 I) 61875 61036 23,92 24,63 62,96 56,19
GR 9650 10242 22,28 21,79 77,76 79,34
SP 38494 39378 21,29 22,74 78,90 71,71
F 54721 56083 22,41 23,85 73,49 71,34
lRL 3535' 3545 20,95 20,56 98,18 90,06
IT 57005 57358 21,60 23,77 69,43 64,07
L 365 371 21,4 20,1 61,9 58,70
NL 14394 14724 20,05 21,13 68,96 61,94 p 9613 9983 20,98 22,10 77,98 71,88
UK 56488 56724 25,83 26,69 74,03 70,76
EEC 320405 324316 22,70 24,13 71,16 66,64 (a)(populat1on 65+/populat1on 20-64)x100 (b)(population C0-19)+population 65+ /population 20-64)x100 Sources : tables B.1 and C.1 in the appendices.
ratio
1984 1990
14,4 11,2
10,1 9,0 8,4 5,6
8,4 10,4
-11,1 20,7
9,9 10,2
16,5 17,0
10,6 9,3
1,7 1,1
14,5 12,3
6,7 9,8
11,8 11,0
11,2 10,4
(1) See note a) in table 2.2 for a definition. Quite often depen~ency ratios are a misleading -Indicator of the "burden" of the population concerned unless corrected for particular purposes. To do this correction (by activity ratios, specific consumption Levels, etc.) at the European scale is a necessary task, to which the Commission will pay closer attention in the future.
(2) See note b) in table 2.2 6
i I
I i !
'
'

- 5 -
2.3. Trends
The projected ratios of social protection expenditures compared to GOP do not allow,nevertheless, an appreciation that social protection expenditures are projected to grow jn real terms in all the cnllntries at, at least, a rate above 1 X per year an4, on the other hand, they embody the negative differential growth of private cunsumption' price index <used to_ deflat~nominal social protection expenditures) as compared to the GDP deflator.
Indeed, the projected ratio for 1990 may be expressed in relat~onship to the 1984 one as follows
where
E90 GDP90 = E84
GDP84 X <1+e). C1+pe>J 6
(1+g). (1+p) ( 1)
E90 CE84) = social protection expenditures in 1990 (1984) at current prices
GDP90 (GDP84) = Gross Domestic Product in 1990 (1984) at current prices
e = annual cumulative rate of growth of social protection expenditure in volume Creal terms) between 1984 and 1990
pe = annual cumulative rate of growth of the private consumption price index between 1984 and 1990
g = annual cumulative rate of growth of GDP in volume <real terms) between 1984 and 1990
p = annual cumulative rate of growth of the GDP defla tor between 1984 and 1990
7
- 6 -
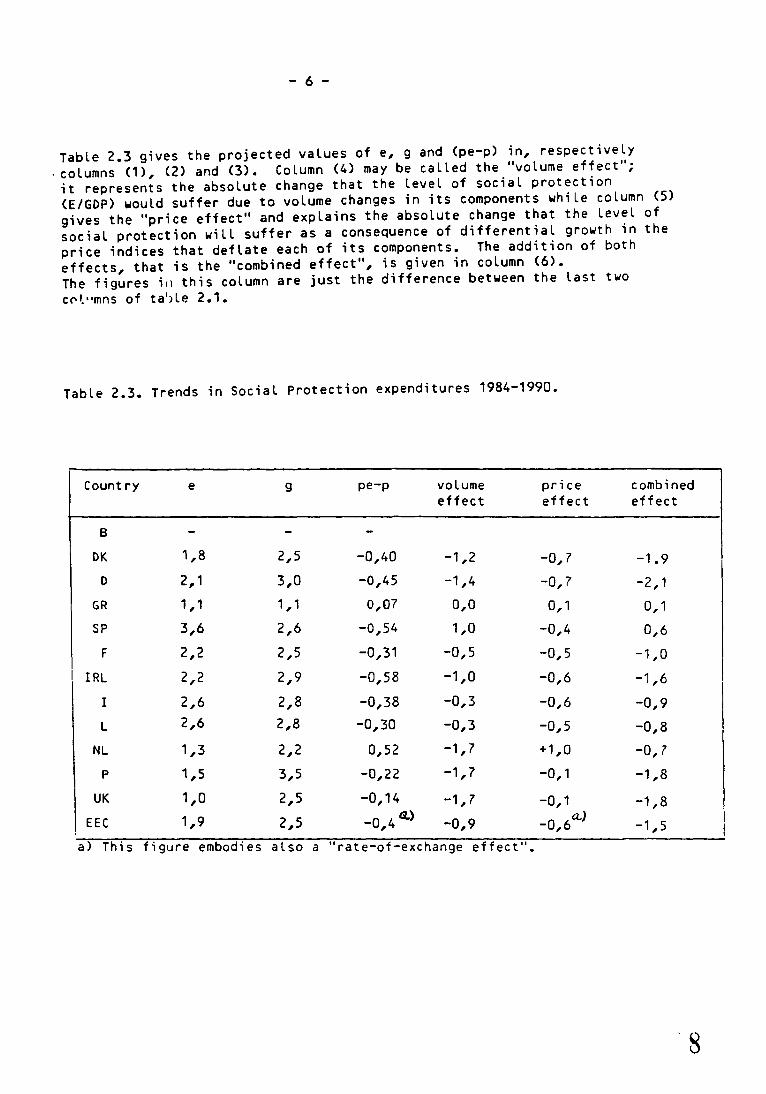
Table 2.3 gives the projected values of e, g and (pe-p) in, respectively . columns (1), (2) and (3). Column (4) may be called the "volume effect"; it represents the absolute change that the Level of social protection (E/GDP) would suffer due to volume changes in its components while column (5) gives the "price effect" and explains the absolute change that the level of social protection will suffer as a consequence of differential growth in the price indices that deflate each of its components. The addition of both effects, that is the "combined effect", is given in column (6). The figures i11 this column are just the difference between the last two c c- '· "m n s of t a' i l e 2 • 1 •
Table 2.3. Trends in Social Protection expenditures 1984-1990.
Country e 9 pe-p volume price combined effect effect effect
8
OK 1,8 2,5 -0,40 -1,2 -0,7 -1.9
0 2,1 3,0 -0,45 -1,4 -0,7 -2,1
GR 1,1 1,1 0,07 0,0 0,1 0,1
SP 3,6 2,6 -0,54 1,0 -0,4 0,6
F 2,2 2,5 -0,31 -0,5 -0,5 -1,0
IRL 2,2 2,9 -0,58 -1,0 -0,6 -1,6
I 2,6 2,8 -0,38 -0,3 -0,6 -0,9
L 2,6 2,8 -0,30 -0,3 -0,5 -0,8
NL 1,3 2,2 0,52 -1,7 +1,0 -0,7 p 1,5 3,5 -0,22 -1,7 -0,1 -1,8
UK 1,0 2,5 -0,14 -1,7 -0,1 -1,8 EEC 1,9 2,5 -a 4 a.> , -0,9 -0,6a..) -1,5
a) This figure embodies also a "rate-of-exchange effect".

- 7 -
2.4. Conclusions
The projection of social protection expenditures, without allowing for Legislative changes, indicates that its share over GDP would diminish in most of the Member States by 1990. At the same time a more favourable overall demographic situation (dependency ratios and unemployment ratio) is not to be expected.
Despite that, projections show that real social protection expenditures will grow at a cumulative yearly rate ranging from 1 %in the United Kingdom to a 3.6% in Spain. The fact that real GOP will grow at a higher rate in most of the Member States, explains Largely the evolution of the level of social protection as a consequence of a sort of relative volume effect. Prices also play their role,generally reinforcing the volume effect with the exception of Greece, Spain and the Netherlands. In this latter country the price effect helps to hide more than half the volume effect. Price effects are also important in Germany, Spain, Ireland and Italy while the volume effect is particularly negative in the United Kingdom and Portugal. At the Community level the price effect (combined with the rate-of-exchange effect) plays a certain role but the evolution in the level of social protection is mainly due to the higher real growth of the GDP as compared to that of real social protection expenditures.
9

- 8 -
3. RECEIPTS STRUCTURE AND TRENDS
Data in table 2.1 also suggests that most of the countries will h~ve a fzll in the share of social protection receipts in their GOP's. At a community level this implies a fall in 1.6 GOP percentage points, just enough to finance the fall in the share of (current) social protection expenditures. It seems thus that in the years between 1984 and 1990 the financing of social protection should not put higher net pressure on tax and contribution payers, although some reallocation may be observed when noticing that receipts are of different nature and come from different institutional sectors of the economy where trends may also be different.
This section first considers the nature of the receipts (both its structure and projected trends), then goes on to a closer look at social contributions which by themselves account for 2/3rds of ~otal social protection financing at community Level and ends with the analysis of the sectors-of-origin version of receipts. As in the previous section a final subsection summariies the main points of this part of the report.
3.1. Receipts by nature
According tothei1 nature,social protection receipts are basically divided into social contributions, funds from government ang other receipts amongst which notably investment income is included. Chart 3.1. shows this breakdown in percentage structure.
At community Level social contributions could reinforce theirrole in the financing of social protection. This could also be the case in all the countries but Spain and the Netherlands.· In Spain this counter-trend is particularly strong. Despite that the standard deviation of the distribution of social contribution shares as a percentage of the average share should not change si~nificantly be'C\/een 1YcsL. and 1990.
The diminishing role of government financing could also consistently be stablished, both at the community Level and at the country level with the sole exception of Spain (and marginally Portugal). In the cases of the U.K. and notably the Netherlands an important proportion of receipts comes from investment income as a consequence of their much more developed private pensions system. These are nevertheless simple percentage shares and the changes just discussed do not imply that absolute· values even in real terms reve to change accordingly.
10

.,_ ... ~
Chart 3.1. -Nature of receipts
Social contributions
Funds from government
Other receipts
Social contributions
Funds from government
Other rl!teipts
r. structure
EUR B DK
14.0 66.6
EUR B DK
68.0
D GR 1.2.aL
SP F IRL I L NL p UK
46.91173.11 176.41 l33.3ll67.7lls9.5ll68.2ll64.4ll47.1
3.5 4.2 1.0 3.4 0.8 1.6
D GR 1990
S.P F IRL !
73.11 147.31 164.51 178.51 133.71 168.4
L
57.2
NL
66.6
177) 13. 7,
19.7
2.5
p UK
2.4
I
""

- 10 -
Indeed, table 3.1 shows that the main constituents of~ a~ we~l o$ total, social protection receipts could grow in volume with the sole exception of government financing in the Netherlands.
Table 3.1. -Nature of receipts :
Averare yearly changes CX> 1984-1990 Adjusted for projected inflation
Social contributions Funds from Government
B - -DK 4.5 1.6
0 2.8 1.2
GR 0. 5 0.1
SP 1.6 9.1 ;
F 2.0 0.0
IRL 2.8 2.5
I 3.2 2.7
L 1.8 4.2
NL 1.4 -2.4 p 1.2 1.4
UK 1 • 1 0.7
EECa 2.2 1.3
a) at 1984 ECU rates.
Total receipts
-2.5
2.3
0.3 3.8·
1 • 5
2.6
3.0
2.5
1.8
1.3 c
0.9 i
I 1.9 I
In average, and also in general, social contributions uould grow faster than funds from government but total receipts would also grou in volume at a lower rate than GOP. The analysis done in sector 2.3 would apply also to social protection receipts without significant differences.
1~

- 11 -
3.2. Social contributions in~tail
No significant change at the Community level should be expected in the structure of social contributions in the period under review. This structure, as shown in table 3.2 , includes two main components : social contributions paid by employers (be they private or public) and social contributions ~aid by protected persons Cm they employees, self-employed or pens1oners>. Major changes in this structure could nevertheless occur in the case of Greece, Spain and the Netherlands. In the Latter two countries~ actual contributions could increase significantly their share in total contributions at the expense of those paid by self-employed and other protected persons and even of imputed contributions. Yet in both countries social contributions as a whole will grow less than .GOP in real or volume terms <Tables 3.1 and 8.1>.
3.3. Receipts by sector of origin
Illustrative as it is, the breakdown by nature of receipts is just a partial approach focused on the financial instruments used. From an econom~c point of view it has also to be known which sector of the economy <basically, firms, households and the public sector) is directly financing social protection expenditures.
Cha~t 3.2 supplies data about receipts by sector of origin while Table 3.3 gives the "stylized facts" that can be concluded from the chart using simple summary statistics.
What they basically tell us is that, at the ommunity level, the financing coming from the governmental sector could decrease its share in· total financing at the expense of the other two sectors, i.e. firms and households. At the country level,· nevertheless, countries like Spain and Portugal <although marginally) would be moving in the opposite oirection. The Netherlands would increase just tile share of firms in total f1nancing.
The data in columns IV and V of Table 3.3 suggest that the projected changes would, if accomplished, increase the differences already existing in the "financial models" of social protection.
Table 3.4 is self-explanatory and sheds more light on what has been said in the previous paragraphs.
3.4. Conclusions
If social protection receipts expressed as a percentage of GDP could fall 1n all the rlember States~ but Spain and the Netherlands. as reviewed in the previous section~ its structure would also suffer cer:din changes.CCont. in page 15)

- 12 -
Table 3.2 - Nature of social contributions Percentage structure
Employers Protected Persons
1984 -- Actual Imputed a Totalb Employees Self-employed Total 0
and others
B - - - - - -DK 27.2 45.4 72.6 27.4 - 27.4
D 36.4 21.4 57.8 30.3 11.9 42.2
GR - - 49.0 - - 51.0
SP 64.6 8.1 72.7 14.4 1 ~·. 9 27.3
F 55.9 12.1 67.9 25.3 t... I 32.1
IRL 42.5 22.4 64.9 - - 35.1
I 51.4 27.1 78.5 14.8 6.7 21.5
L 42.2 14.4 56.6 37.7 5.7 43.4
NL 40.6 6.1 46.7 37.4 15.9 53.3 p 62.2 11.0 73.2 24.7 2.1 26.8
UK 45.5 19.1 64.6 33.1 2.3 35.4
EEC - - 65.1 - - 34,9
1990 -B - - - - - -
DK 38.1 32.8 70.9 29.1 29.1
D 36.9 20.5 57.4 31.0 11.6 42.6
GR - - 47.5 - - 52.5 . SP 69.7 7.2 76.9 14.5 8.6 23.1
F 55.5 11.5 67.0 26.4 6.6 33.0
IRL 42.6 22.4 65.0 - - 35.0
ll : 51.1 27.8 78.9 14..-2 6.9 21.1
L 43.5 14.5 58.0 36.2 5.8 42.0
NL 42.7 5.9 48.6 37.6 13.8 51.4 p 62.3 10.7 73.0 24.9 2.1 27.0
UK 45.7 18.6 64.3 33.4 2.2 35.7
EEC - 65.4 - - 34.6
(a) imputed contributions are the counterpart of social protection benefits directly granted by employers to their present or former empl9yees and/or their dependents.
(b) row totals add-up to 100
14
!

""'""* c.J1 Ch11rt 3.2
Enterprises
Government
Households
Other sectors
Enterprises
Government
Households
Other sectors
Rrr.eipts by sector of origin : percentage structure
EEC
32.6 ~
26.2
1.7
EEC
33.1
20,7 ~
8 OK D GR SP F IRL -
1984
L NL
1990
p ~
..... lJo,l
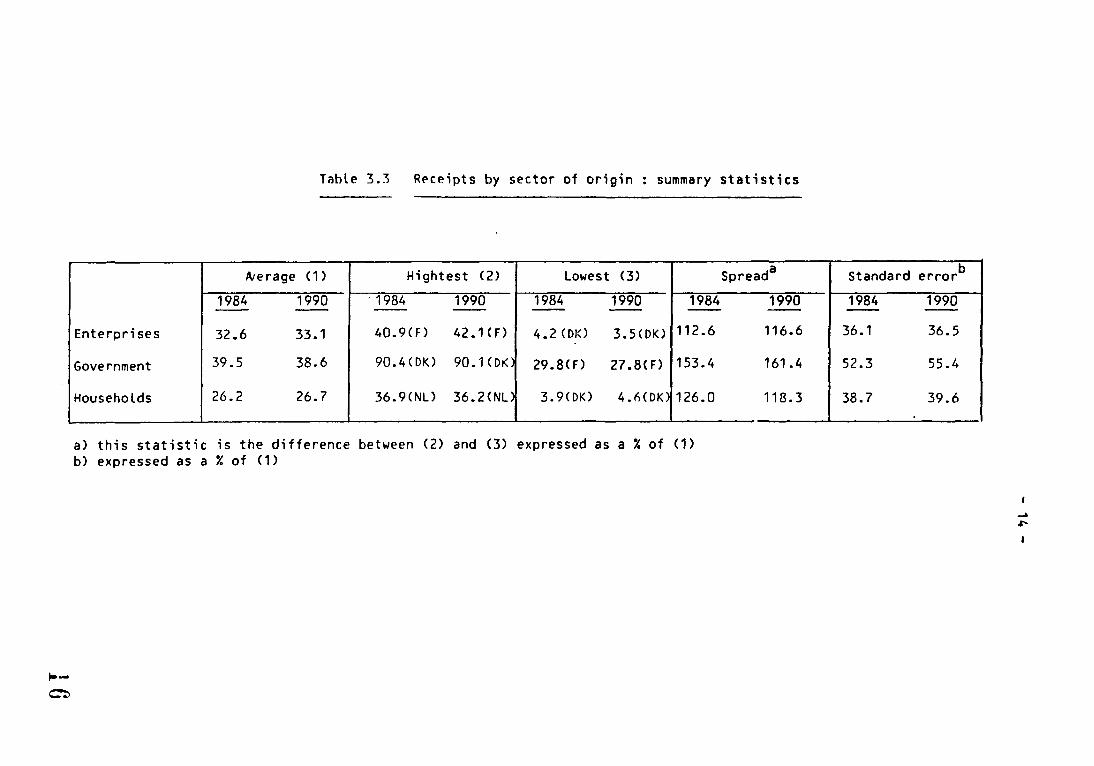
Table 3.3 R~ceipts by sector of origin : summary statistics
Aterage (1) Hightest <2> Lowest (3) Spread a
1984 1990 '1984 1990 1984 1990 1984 1990 -- -- -- -- -- -- -- --Enterprises 32.6 33.1 40.9(F) 42.1<F) 4.2 (010 3.5(DK) 112.6 116.6
Government 39.5 38.6 90.4CDK) 90.1CDK 29 .8( F) 27.8(F) 153.4 161.4
Households 26.2 26.7 36.9CNL) 36.2CNLJ 3.9CDK) 4.6CDK) 126.0 118.3 --- -- -
a) this statistic is the difference between (2) and (3) expressed as a ~ of (1) b) expressed as a ~ of (1)
~-C':l
Standard error b
1984 1990 -- --36.1 36.5
52.3 55.4
38.7 39.6 - --- -
I I
I
I
I
I
I
.... s:--

- 15 -
Table 3.4 : Sector of origin
Average yearly changes eo 1984 - 1990 adjusted for projected· inflation
Enterprises State Households Total
B DK 0.7 2.4 5.6 2.5
D 2.6 1.6 3.0 2.8 GR SP 2.6 7.0 -1.3 3.8 F 2.0 0.3 2.2 1.5 IRL 2.5 2.5 2.7 2.6 I 3.1 3.0 2.9 3.0 L 2.0 3.2 1.4 2.5 NL 3.2 0.5 1.5 1.8 p 1.1 1.3 1.3 1.3 UK 1.2 0.6 1.3 0.9b EECa 2.3 1 • 5 2.3 2.0
a) at 1984 ECU rates b) the discrepancy between this total and that of Table 3.1 is due to
the exclusion of Greece.
<Comes from page 11) Depending on its nature (contributions vs. funds from Government basically) the cha~ges ~ld be biased towards an increased share of contributions in total receipts with the exceptions of the Netherlands and Spain. In the first case the share of Government subsidies ~Ld also significantly decrease .... hile "other receipts" could substantially increase its share by about 40 X. ln the case of Spain the share of Government subsidies would take the part left by the decreasing share of social contributions. DepenGing on the sector of origin, the projected changes (closely related to those just dlscussed) point towards a larger (relative) primary burden being born by f1rms and nouseholds with the significant exception of Spain. As an additional result the divergence of the national sector-of-origin financial models could ~ncrease.
17

- 16-
4. EXPENDITURE : STRUCTURE, TRENDS AND AMOUNTS PER PERSON
Social protection expenditure has a rather complex structure whose study must be undertaken with the help of the vdrious classifications described in appendix A. But before that is done in the coming pages a new Look at Table 2.1 would enable the reader to note the differences for each country in the G DP shares for receipts and expenditures. These differences are reduced and in most of the cases they account for capital expenditures not recorded in the expenditure side while the receipts that eventually finance them come obviously from general receipts.
It may also be the case that operating deficits occur but they are nevertheless reduced because government financing always pre\<••t Large d~ficits from showing-up Cin turn government deficits may rise).
The significant differences between the Netherlands and the u~ and the other countries lies in the nature and extent of their private pension systems, and
.thi£ basically mean that reserves are being accumulated in order to fund accrued liabilities and future commitments within these systems.
4.1. Nature and type
I
The core of social protection expenditures is unveiled when a first possible classification is applied as in Table 4.1. Indeed social protection benefits account for slightly more than 95 r. of total expenditure at the community level with · very little spread between countries. Differences are, naturally, much more signif1cative for administrative and other current expenditure with Portugal and Spain being the two extreme cases in 1984 but the Latt~rbeing replaced by the United Kingdom in 1990 Cin fact 1989/90).
Table 4.1 : current social protection expenditure by nature percentage structure
Social protection Administr. costs and benefits other curr. expend.
1984 1990 1984 1990
8 - - - -OK 97.2 96.8 2.8 3.2
D 96.3 95.9 3.7 - 4. 1 GR 95.2 94.0 4.8 6.0 SP 96.3 95.6 3.7 4.4 F 94.6 95.1 5.4 4.9 IRL 95.7 95.7 4.3 4.3 I 92.8 93.0 7.2 7.0 L 95.1 96.0 1.9 4.0 NL 96.5 96.1 3.5 3.9 p 92.7 92.8 7.3 7.2 UK 96.1 96.6 3.9 3.4 EEC 95.3 95.3 4.7 4.7
18
- 17 -
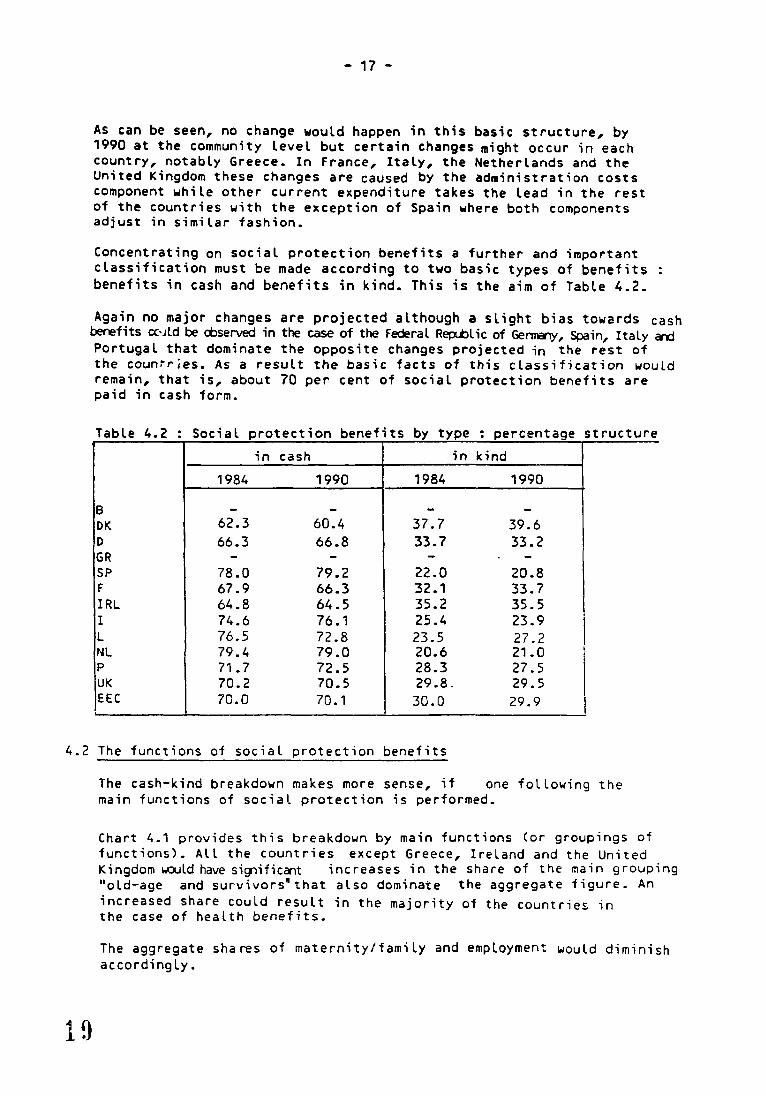
As can be seen, no change would happen in this basic structure, by 1990 at the community level but certain changes might occur in each country, notably Greece. In France, Italy, the Netherlands and the United Kingdom these changes are caused by the administration costs component while other current expenditure takes the lead in the rest of the countries with the exception of Spain where both components adjust in similar fashion.
Concentrating on social protection benefits a further and important classification must be made according to two basic types of benefits benefits in cash and benefits in kind. This is the aim of Table 4.2.
Again no major changes are projected although a slight bias towards cash benefits cc·Jld be dJserved in the case of the Federal Replbl ic of Genl'li:rl)', Spain, Italy an:i Portugal that dominate the opposite changes projected in the rest of the countries. As a result the basic facts of this classification would remain, that is, about 70 per cent of social protection benefits are paid in cash form.
Table 4 2 • Social protection benefits by type . . percentage structure
in cash in kind
1984 1990 1984 1990
B - - - -OK 62.3 60.4 37.7 39.6 0 66.3 66.8 33.7 33.2 GR - - - -SP 78.0 79.2 22.0 20.8 F 67.9 66.3 32.1 33.7 IRL 64.8 64.5 35.2 35.5 I 74.6 76.1 25.4 23.9 L 76.5 72.8 23.5 27.2 NL 79.4 79.0 20.6 21.0 p 71.7 72.5 28.3 27.5 UK 70.2 70.5 29.8. 29.5 EEC 70.0 70.1 30.0 29.9
4.2 The functions of social protection benefits
The cash-kind breakdown makes more sense, if one following the main functions of social protection is performed.
Chart 4.1 provides this breakdown by main functions Cor groupings of functions). All the countries except Greece, Ireland and the United Kingdom ROUld have sig:1ificcnt increases in the share of the main grouping "old-age and survivors•that also dominate the aggregate figure. An increased share could result in the majority of the countries in the case of health benefits.
The aggregate shares of maternity/family and employment would diminish accordingly.

t~
0
Chart 4.1
Health
Old-age and survivors
Maternity/Family
Employment
Others
EEC
37.0
Main functions of social protection benefits : percentage structure 1984
B OK D GR SP F IRL I L NL p
. "43.3
UK
..... co

~~ Chart 4.1 <Cont.> ~
Health
Old-age and survivors
Maternity/Family
Employment Others
EEC B OK 0
31 .3
37.5
1990
GR SP F IRL I l Nl p UK
19.9 45.
...A
-a

- 20 -
Italy is the country that could see thelargest rearrangement of social protection benefits.
The rearrangement of shares just described does ~t imply that absolute <real) amounts have to follow necessari~y the same pattern. Table 4.3 gives a more vivid idea of what are t~e projected cumulative yearly growth rates of the real magnitudes assigned to the different function of social protection.
The real growth of old-age and survivors benefits could be particularly rapid in Italy, Spain and France while real health expenditures wouldalso increase fast in France, Spain and Germany.
Table 4.3
B DK D GR SP F IRL I L NL p
UK EECa
Main functions of social protection benefits : average yearly changes <X> 1984-1990 adjusted for projected inflation
Health old-age and Maternity E11ployment survivors /Family
- - - -2.1 2.1 4.1 -L8 2.5 2.2 1.0 0.0 1.2 0.9 6.0 -3.3 2.7 4.2 -3.9 4.3 2.8 3.4 -0.1 -1.9 2.2 2.0 3.6 0.5 1.3 4.8 0.0 0.0 3.6 2.1 2.3 -10.3 I
1.2 2.4 2.0 -2.0 1.4 1.8 1 01 1.4 2.2 0.9 0.2 -0.5 2.2 2.8 0.1 -0.6
a) at 1984 ECU rates
The above comments mean that the possible overal_ containmen~ of social protection expenditures reviewed in section 2 IC-Ld be cone ot the expense of the other expenditure lines.
f·lore detailed inforr.~ation about the different ro~a-., functions so far considered is offered in the following subsectio~.
4.3 Main functions in detail
All the headings in this subsection have the sa~~ basic structure. namely a breakdown by subfunctions in percentage terms, a breakdown by type (cash/kind) within each sub-function,bo:· in 1990, and a comparison 1984-1990 of amounts per person for selected subfunctions <•>.
(*) No data on amounts per person for Luxembourg will be provided given the large number of cross-border workers receiving benefits who are not part of the country's population.

- 21 -
Amounts per person are expressed in stnndard (units) of ourchasing power <PPS) whose definition is given in Appendix B. They are~ basically, Ecu•s corrected bv the differing purchasing power of national currencies. This is so far the most sensible way of performing international comparisons. Amounts per personcompu~tions are based upon specific age or socio-economic groups whose composition is explained inthe notes to the tables where these figures are tncluded. Most of the tables are self-explanatory.
Last but not least, amounts per person should be compared across countries bearing in mina that net all persons considered in the ccmputations actually receive benefits ard that elegibility ccnditions ccverage ratios and take-up ratios may vary ccnsiderably bEtween countries. Given the scarcity of information acout these the ccmputations performed in this report provide a sensible starting point.
4.3.1 Health
Table 4.4 offers a pancrama of health benefits and its percentage structure by sucfunctions and type in 1990. The mcst impcrtant component of h~alth benefits is sickness which accounts for well over 50% in all ccuntries and makes up 2/3 of all health benefits at Community level. The fact that sickness benfits are mostly in kind determines also the dominance of this type for the whole of healtt1 benefits.
Certain differences~ observed at country Level for h~alth subfunctions other than sicknessr are more significant, as can be seen in Table 4.5. This table gives amounts per person for the ~ajar healtt1 subfunctions and within-country and cross-country comparisons are immediately possible. Amounts are in fact voll~e magnitudes expressec in 1984 prices so that comparisons are meaningful.
All countries would experience real increases per person (except Greece in the case of invalidity/disability be·nefits) ~Jhich are. Larger in the case of s1ckness where the Community (cummulative) y~arly rate of incre~se is 2.2 %, than in the case of in~alidity/disability w~ere the corresponding r~te is only 0.7 % per year.
When cross-ccuntry ccmparisons for a given year are p~rformed, Large differences arise, fer both subfunctions, as m~asured by the large standard de~iations sh0wn in Table 4.5. These divergences would not diminish but would increase in the case of sickness benefits.
4.3.2 Old-age and survivors
Tabll 4.6 h~s the san:e structure a~ ir1 the previous case. As is well kncwn these benefits are overw~elmingly pai~ in cash form and that is why Table 4.7 ondts the cash/kind breakdown in the ccmputation of amounts per perscn.

- 22 -
Table 4.4 Health benefits by subfunctions and type - 1990 percentage structure
Sickness. Invalidity/ Occupational Health 01sability ace. and d1s. Total
a tot. cc:sb kind a tot. cash kind a tot. ca·sh -- -- -- -- - -- -- --8 - - - - - - - -OK 70.2 25.8 74.2 26.7 71.9 28.1 3.0 80.4 0 68.0 21.8 78.2 24.4 72.5 27.5 7.6 55.8 GR 60.6 - - 25.7 - - 13.6 -SP 63.8 14.5 85.5 28.7 98.5 1.5 7.5 63.4 F 77.4 7.6 92 ·'·· 14.8 70.7 29.3 7.7 86.2
I
IRL 79.2 26.5 73.5 19.2 51.7 48.3 1.6 100.0 I 52.0 7.4 92.6 41.4 90.6 9.4 6 .• 6 94.5 L 59.1 12.9 87.1 33.5 97.7 2.3 7.4 83.7 NL 59.0 33.7 66.3 41.2 87.4 12.6 - -p 60.2 15.0 85.0 34.6 98.6 1.4 5.2 99.5 UK 66.2 25.9 74.1 31.3 63.7 36.3 2.5 95.0 EE.Cb 66.1 17.0 83.0 27.7 79.0 21.0 A.2 75.0
a) Row totals add-up to 100 b) Cash and kind figures exclude Greece.
Table 4.5 Health b~nefits by subf~nctions and type p~rson in 1984 - prices and PPSa
kind cash kind -- -- --- - -
19.6 60.4 39.6 44.2 36.7 63.3 - - -
36.6 42.3 57.7 13.8 23.0 77.0 0.0 32.5 67.5 5.5 47.6 52.4
16.3 46.6 53.4 - 55.7 44.3
0.5 48.3 51.7 5.0 39.4 60.6
25.0 37.8 62.2
arr:ounts per
Sickness b Invalidity/Disabilityc 1984 1990 1984 1990
TotC:Il cash kind Total cash kind -- -- -- -- -- --8 - - - - - - - -OK 311 956 247 709 5C8 5r:;r:;
-'-' 399 156 0 990 1168 255 913 603 654 474 180 GR 151 162 - - 136 129 - -SP 325 360 52 308 237 278 274 4 F 874 1047 80 987 374 37( 267 110 IRL 514 576 153 423 240 268 139 129 I 579 635 47 588 691 670 607 63 L 819 1195 155 1040 953 1069 1034 25 NL 1042 1071 361 710 1232 1262 1103 159 p 251 273 41 232 253 277 274 3 UK 563 621 161 460 460 525 334 191 EECd 676 773 135 659 521 545 439 117
(45.3) (48.5) (61.6) (61 .6)
a) PPS = purchasing pcwer standards, see appendix 8 b) The base for these calculations is total population c> The b'se for these calculations is total population aged between 20
and retirement ase except for ItC:Ily where these benefits remain payable after retiremer.t age.
d) figures between bracket~ are standard deviations as % of ccmmunity averages
e> without Greece.

- 23 -
Table 4.6 Old-age and survivors benefits by subfunctions and 1990 X type . structure . Old-age Survivors
Total a Cash Kind Total a cash Kind -- - -- -B - - - - - -DK 99.7 73.7 26.3 0.3 100.0 -0 67.8 93.7 6.3 32.2 94.9 5.1 GR 93.1 - - 6.9 - -SP 75.5 98.8 1.2 24.5 100.0 0.0 F 83.8 97.4 2.6 16.: 100.0 0.0 IRL 76.7 85.0 15.0 23.3 100.0 0.0 I 78.1 99.0 1.0 21.9 98.8 1.2 L 61.8 96.9 3.1 38.2 98.9 1 . 1 NL 86.6 100.0 o.o 13.4 100.0 0.0 p 81.5 99.6 0.4 18.5 96.0 4.0 UK 96.2 95.9 4.1 3.8 100.0 0.0 EEC 80.1 96.2 3.8 19.9 97.5 2.5
a) row totals add-up to 100
As within the previous subfunction, large differences subsist also in this although they are more moderate but projected to increase. A very important demographic indicator, the share of population over retirement age in total population, closely related to these benefits, is also given in Table 4.7.
Table 4.7 : Old-age and survivors benefits amounts per person in 1984 prices and PPSa
Old-age and survivors b Population over retirement age as X of total population'
1984 1990 1984 1990 -- -- - --B - - - -OK 10 446 11 195 13.0 13.7 D 10 512 11 148 14.7 15.8 GR 5 967 5 695 15.1 15.7 SP 5 513 6 189 11.9 13.3 F 7 976 8 979 17.9 19.1 IRL 5 366 5 920 10.6 10.8 I 5 655 6 781 21.4 23.3 L 12 293 14 286 13.2 12.7 NL 10 354 10 643 11.9 13.1 p 2 333 2 456 '13.3 14.4 UK 6 675 6 856 17.9 18.3 EECd. 7 269 8 008 0 16.5 17.6
(39. 7) (40.2)
a) PPS = purchasing power standards, see appendix 8 b) The base for these computation is total population above legal
retirement age c) Comparisons between countries should be done taking into account
that retirement ages differ across countries. See appendix c. d) Figures between brackets are standard deviations as % of community
averages.

- 24 -
4.3.3 Maternity/Family
Family benefits are the main component of this grouping for all the countries but Spain where they account for slightly less than 50 X and are mainly paid in cash form. Maternity benefits are provided equally in both forms <cash and kind) at Community level but with the balance changing following the particular country concerned. This can be seen in Table 4.8.
Given the generally Large share of family benefits in this grouping, amounts per person are provided only for this subfunction. They may be also seen in Table 4.8 where the large differences, which could increase by 1~90, may also be confirmed.
Table 4.8 Maternity/Family benefits by subfunctions and type 1990 X structure and amounts per person
Maternity Family Fam1ly benet15s
per person
Total a Cash Kind Total a Cash Kind 1984 1990 -- -- -- -- -- --8 - - - - - - - -DK 15.4 85.5 14.5 84.6 19.4 80.6 1232 1677 D 11.0 51.3 48.7 89.0 89.2 10.8 920 1169 GR 30.7 - - 69.3 - - 102 108 SP 52.0 23.3 76.7 48.0 100.0 0.0 64 44 F 13.1 59.5 40.5 86.9 84.2 15.8 1109 1182 IRL 21.0 18.4 81.6 79.0 97.4 2.6 448 584 I 12.4 100.0 0.0 87.6 49.7 50.3 567 527 L 16.1 77.3 22.7 83.9 85.2 14.8 1065 1246 NL 5.4 42.9 57.1 94.6 85.2 14.8 1107 1386 p 14.9 72.4 17.6 85.1 97.1 2.9 ·159 192 UK 11.5 24.0 76.0 88.5 76.3 23.7 1051 1140 EECc,d 12.3 52.0 48.0 87.7 79.1 20.9 744 834
<58.3) (65.0)
a) row total add-up to 100 b) in 1984 prices and PPS <=purchasing power standards, see appendix 8).
The base for those calculations is total population under age 20 c) cash and kind figures do not include Greece d) _figures between brackets are standard deviations as X of community
average.
4.3.4 Employment
This heading is rather misleading for, as can ce seen in Table 4.9; an average of 92 X of the funds involved are spent on unemployment benefits with a very small remainder ~ing spent n proliloting e~o~ployment v1a the social protection schemes • Certain changes could nevertheless happen ~s lower unemployment ratios are expected in several countries by 1990.
26

·- 25 -
For similar reasons as for family Genefits only unemployment benefits per person are considered in Table 4.9. The distribution of these benefits per person across countries shows the second standard deviation in relationship with the other benefits.
The numbers of unemployed people in each country have been computed according to the following expression :
civilian unemployment ratio x civilian activity ratio x total population.
These data may be foun~ in the appendices. Given the lack of adequate projections about the activity rat~that of 1990 has been proxied by that of 1984.
Table 4.9 Employment benefits by subfunctionsa and amounts per person
1984 - 1990 X structure
Promotion 06 b Unemp lc yme nt lhemp loyment c employment benefits per person 1984 1990 1984 1990 1984 1990 . -- -- -- -- -- --
·e - - - - - -OK 3.7 4.9 96.3 95.1 11294 11142 0 17.2 28.7 82.8 71.3 5247 6792 GR - - 100.0 100.0 1009 604 SP 9.9 10.6 90.1 89.4 2630 3445 F 3.4 3.3 96.6 96.7 8327 7055 IRL 12.3 19.7 87.7 80.3 4014 3690 I 2.6 3.4 97.4 96.6 1894 1933 L 42.9 32.6 57.1 67.4 6466 5735 NL - - 100.0 100.0 8903 9087 p 9.9 9.8 90.1 90.2 651 495 UK 9.7 14.3 90.3 85.7 4583 4564 EECd 8.0 12.1 92.0 87.9 4658 4699
(69.9) (69.2)
a> these benefits are given in cash form in practically all cases b) row figures for each year add-up to 100 c) in 1984 prices and PPS (purchasing power standards, see appendix 8 ). The
base for these calculations is the unemployed population, see ~~ain text for details about its definition t
d) figures between brackets are standard deviations as % of community average.
4.4 Fiscal benefits and capital transactions
These are given respectively in Tables 4.10 and 4.11. The information here is rather incomplete and scattered, but it shows, in particular concerning fiscal benefits, that the share of social protection expenditure in GOP could go up by more than 1 X in the countries that give this kind of indirect benefits by way of a tax relief. '
- 26 -
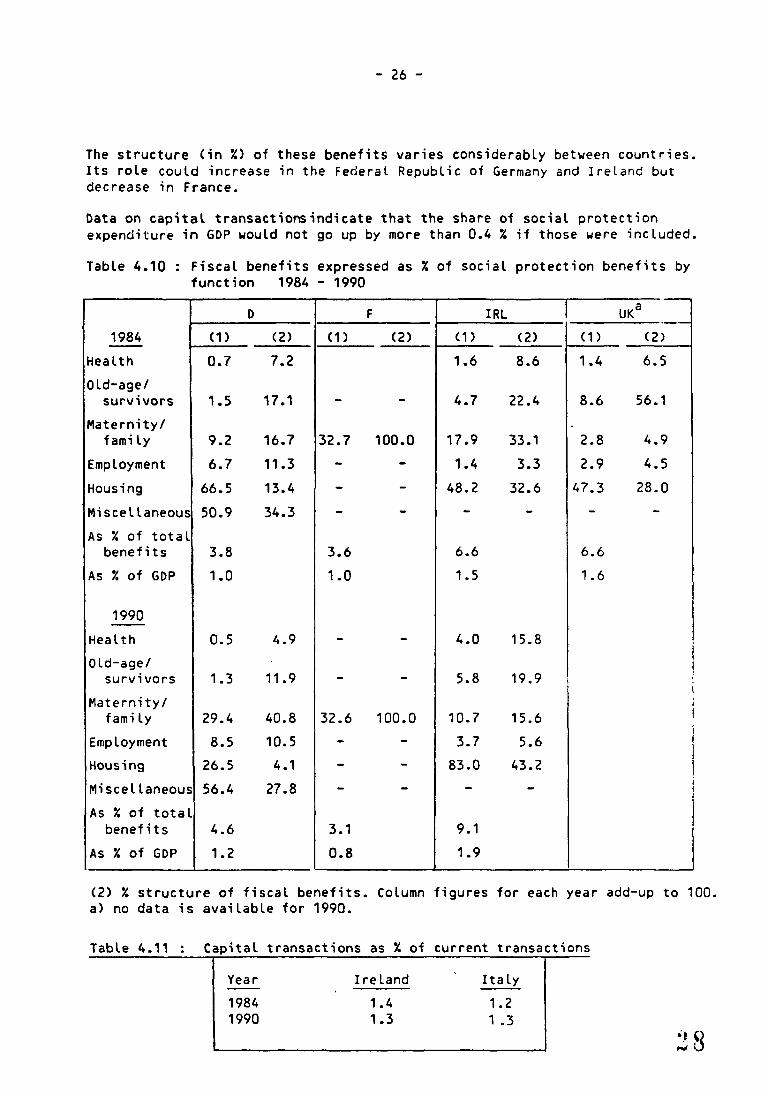
The structure (in ~) of these benefits varies considerably between countries. Its role could increase in the Federal Republic of Germany and Ireland but decrease in France.
Data on capital transactionsindicate that the share of social protection expenditure in GDP would not go up by more than 0.4 ~ if those were included.
Table 4.10 : Fiscal benefits expressed as X of social protection benefits by function 1984 - 1990
-D F IRL I UK a
·--1984 ( 1) (2) (1) (2) (1) <2> (1) (2) --
Health 0.7 7.2 1.6 8.6 1.4 6.5
Old-age/ survivors 1.5 17.1 - - 4.7 22.4 8.6 56.1
Maternity/ family 9.2 16.7 32.7 100.0 17.9 33.1 2.8 4.9
Employment 6.7 11.3 - - 1.4 3.3 2.9 4.5
Housing 66.5 13.4 - - 48.2 32.6 47.3 28.0
Miscellaneous 50.9 34.3 - - - - - -As % of total
benefits 3.8 3.6 6.6 6.6
As % of GOP 1.0 1.0 1.5 1.6
1990 --Health 0.5 4.9 - - 4.0 15.8
Old-agel survivors 1.3 11.9 - - 5.8 19.9 I I
I Maternity/
family 29.4 40.8 32.6 100.0 1 a. 7 15.6
Employment 8.5 10.5 - - 3.7 5.6
Housing 26.5 4.1 - - 83.0 43.2
Miscellaneous 56.4 27.8 - - - - I As % of total
benefits 4.6 3.1 9.1
As % of GOP 1.2 0.8 1.9
(2) % structure of fiscal benefits. Column figures for each year add-up to 100. a) no data is available for 1990.
Table 4.11 Capital transactions as X of current transactions
Year
1984 1990
Ireland
1.4 1.3
Italy
1.2 1 . 3
., 8 ~·

- 27 -
.4.5 Conclusions
The main conclusion that emerges from the analysis done in this section is that although no significant change would happen in the nature and type of social protection expenditure, when one descends to the particular functions of social protection significant rearrangements are projected.
Concerning functions themselves, health benefits and above all, old-age pensions woul~ see major increases in their share of total benefits.
Amounts per person for almost all-functions and countries would increase. The differences between countries, already quite large, would not change, in general, significatively. The largest differences in the distrihution of benefits-per pe~son across countries are observen to happen in Invalidity/ disability and .unemployment benefits.·
L C[

APPENDIX .A
The methodology of Social Protection statistics
I. Classification of receipts and expenditures tables A-1 to· A-5
II. The contents of social protection functions
III. "Social benefits" and "Social protection ben~fits•• difference?
is there a
Note the materials for parts I ard II h~ve been taken from the much more cc•mprehensive EuROSTAT publication : European Sy~tem of Integrated Social Protection Statistics <ESSPRCS)- Methology, 1981. This metho dology has been revised recently and will be used in the next pro jections exercise
00~0

I. Classification of receipts a~d expenditures
Receipts
Table A-1
Table A-2
31
Classification of receipts used for financing social protection expenditure
1. Current tranS8ctions 11. Employers' social contributions
1 1 1. Actual social contributions 1 12.1mputed social contrib.nions
12. Social contributions paid by the protected person 121. Soc11l contributions paid by employees 122. Social contributions paid by self-employed persons 123. Social contributions paid by pensioners or other persons
13. Current general government contributions 14. Other current receipts 1 5. Current transfers bet'o'l!een agencies
2. Capi'tal transactions
Classification of sectors from which receipts originate
1. Enterprises
2. General government 21 Central government 22. Local government 23. Social security funds
3. Households
4. Private non-profit institutions
5. Rest of the world 51 . EEC counuies 52. Non·EEC countnes
2.

Expenditure
Table A-3
Table A-4
Classification of social protection expenditure
1. Current transactions 1 1 . Soctal protectton benefits 12. Administration costs
121. Compensation of employees 122. Purchases of goods and services 1 23. Taxes linked to production
13. Other currentexpenditure 14. Current transfers between agenc1es
2. Capital transactions 21. Gross fixed capital formation 22. Investment grants
Abbreviated classification of types of social protection benefits
1. Cash benefits 11. Income ma1ntenance benefits
11 1. long-term periodic beneftts 112. Short-term penod1c benefitS 1 13. Benefits paid once only
12. Benef1ts to compensate for spec1al expenditure 121. long-term periodic benef1ts 122. Short-term penodac benefits 123. Benefits pa1d once only
13. Other cash benefits 131 . Other long-term periodic benef1ts 132. Other short-term penod1c benefits 133. Other benefits paid once only
2. Benefits in kind 21. Reimbursement
221. Medacal care 212 Socaal assistance 213. Other reimbursements
22. Directly provided benefits 221. Medtcal care 222. Soc1al assistance 223 Other direct benefits
3.
l I i I
32

Table A-5
.• 3 t:Jt.
Classification of social protection functions
1. Health 11. Sickness 12. lnvalidrty, disability 13. Occupational accidents and d1seases
2. Oldaga 21.01d age
3. Survivors 31. Sui"VIvors
4. Maternity/Family 41. Maternity 42. Family
5. Employment 51. Placement, vocational guidance. resenlement 52. Unemployment
6. Housing 61. Hous1ng
9. Miscellaneous 91. Notseparable 92. Not provided for elsewhere
4.

I I. SOCIAL PROTECTION FUNCTIONS -CONTENT
Sickness function
511. Sickness must be understood in the strict sense as a more or less deep-seated alteration in the health of the individual, affecting his physical or mental health in general.
5.
512. This function includes:
(a) allowances intended as total or partial compensation for the loss of income resulting from the suspension of an occupation;
(b) payments to all protected persons equivalent to all or part of the cost of medical care' or a preventive or therapeutic nature; with regard to prevention, the main areas covered are med1cal check-ups, vaccination campaigns. health education, preventive measures, etc.;
(c) expenditure of public health services, insofar as it relates to allowances or medical care;
(d) other forms of social assistance related to sickness.
513. The following are excluded:
(a) medical care given to an invalid or a disabled person (handicapped person, etc.) as specific treatment for their invalidity or disability, i.e. in direct relation to the particular condit1on of the person concerned ;2
(b) medical care g~ven to victims of occupational accidents or workers suffering from occupational diseases. in so far as this care is directly related to the injury or disease in question;J
(c) prenatal, obstetrical and postnatal medical care;4
(d) medical care given to conscripted military personnel during their compulsory mil'itary serv1ce;s
(e) any payments made to supplement allowances granted on account of family responsib1lit1es s
I Medocal care mcludes the following goods and services. la 1 services provoded by doctors lgeneral practitiOners or specialists) and other med1cal personnel. w1thon or outs1de establishments ion ouo-patoents
depanments, surgenes, and at home), lbl stays 1n hospitals: med1caltreatment and maintenance; lc I dental care; ldl medicones and prostheses: med1cines and pharmaceutical products. optical appliances (spectacles. lensesl and heanng aods orthopaedoc pro
ducts and prostheses, dental products and prostheses; lei other med1calaorv1ces: laboratory analyses, rad1olog1cal and electro-physical examonat1ons. hydrotherapy salt-water and sea-aor cures. funct1onal
rohabilrt1t10n, tranapon of 11ck persona, health education and,diaeaae prevent1on campaigns. vaccln&tlons and ommun1zaroons. etc 2 These benefots ant classofoed under the 'lnvahd1ty /dosabolity' function. · 3 TheM benefot& ant claSSified underthe function 'Occupational acc1dents and diseases 4 These benefit$ are classified under the funCtion 'Matemoty'. 5 The cost of lh1s care IS not regarded as expenditure by the soc1al protectoon system. 6 These payment& are claSSified under the functiOn 'Fa moly'

4~.-.~\ -,·!""
6.
Invalidity I Disability function
514. Invalidity I disability (physical or mental) is the inability to engage in any activity to an extent prescribed, or to lead a normal social life, which inability is likely to be permanent or persists beyond a limited period, such as may be defined in legislation covering insurance against sickness. It can be congenital or the result of a disease (with the exception of occupational d1seases), of an accident (with the exception of occupational accidents), or of a political event.
Comment
The above exclusions (occupational accidents and diseases) apply only to cases where the benefit is granted under conditions (legal or other kinds) which make explicit reference to these two nsks.
515. This function covers the following:
(a) pensions, allowances and other cash benefits granted to invalids and disabled persons because of their cbndition;
(b) remuneration paid to disabled persons when they engage in an occupation adapted to the1r handicap in sheltered workshops;
(c l the specific med1cal care granted to invalids or disabled persons as a result of their condition;
(d} the functional, occupational and social rehabilitation of invalids and disabled persons;
(e l other forms of so~ial assistance provided for invalids and disabled persons.
51 6. The following are excluded:
(a I the medical carel granted to members of the family of invalids and disabled persons;2
(b) the pensions, allowances, funeral expenses and death grants paid to the surviving dependants of invalids and disabled persons;J
(c) all increases in pensions, allowances, etc., granted on account of family responsibilities.•
Occupational Accidents and diseases function
517. An occupational accident is an accident which occurs in the process or work, or during work, or while travelling between home and work.
An occupational disease is one so defined by national legislation.
518. This function covers the following categories:
(a) pensions, allowances, compensation payments and other cash benefits granted to the v1ct1ms;
(b l the specific medical care1 granted to victims on account of their condition; this includes in particular the supply, repair and replacement of prostheses or orthopaediC appliances required as a result of the accident;
(c} the funct1onal, occupational and social rehabilitation of victims;
1 See lhe finn footnoUI under the func11on 'S1ckness' 2 These benef1ts are claS&•f•ed underJhe tunct10n 'SICkness' 3 These benefiiS are class•hed under the funct10n 'Su1V1vors 4 Th.,se 1ncreases are class1f1ed under the tunct1on · Fam11y'
;;5
7.
(d) accident prevention (limited to expenditure made by the insurance, provident and social security organizations);
(e) other forms of social assistance for victims.
519. The following are excluded:
(a) the medical care1 granted to members of the families of victims;z
(b) pensions, allowances, funeral expenses and death grants paid to the ~urviving dependants of the victims;J
(c) all increases in pensions, allowances, etc., granted on account of family responsibilities.•
Old-age .function
520. Old age is defined as the state of having reached a certain minimum age, beyond which, as a rule, one's main occupation may cease.
521. This function covers the following:
(a) pensions, allowances, compensation payments and other cash benefits paid in the case of survival beyond a prescnbed age;
(b I the cost of staying in nursing homes for the aged and old-people's homes;
(c l payments described as early retirement pensions and effected in accordance with laws or regulations, in so lar as the criteria for granting the benefits indicate that the objective is complete and final retirement for reasons of age, L e. that the measure taken may be interpreted as part of a general tendency towards reducing the upper age-limit for employment;s
(d) other forms of social assistance for old people: home helps, benefits in kind, etc.
522. This function excludes:
(a) medical care' given to old people;z
(b I all increases in pensions, etc. granted on account of family responsibilities. •.
Survivors function
523. A survivor's benefit is a benefit granted on the basis of a derived right, i.e. a right originally acquir· ed by another person whose death is a condition for granting the benef'rt. However, certain insurance organizations treat this right as a direct one, L e. there is no connection between the benefit received and that which the deceased member of the family would have been able to claim.
524. Survivors in receipt of benefit may be the spouse ·or ex-spouse of the deceased person. h•s or her children, grandchildren, ascendants or relatives. In exceptional cases (e.g. funeral expenses), ttie benefit may be paid to a person outside the family.
1 See the first foo1n01e under the function 'Sickness". 2 These benefots are classified under the functton · Sockness', 3 These benefrts are classrfied under the function • Survivors'. 4 These increases are clasaified under the functoon • Famay'. S These remarlls are designed so that benelots may be classifoed under the functions 'Old age' or 'Unemploymenl' aaappropnate.

8.
525. This function covers:
(a I pensions, compensation payments and other cash benefits paid out to survivors in the1r capacity as relatives of the deceased person;
tb I pensions reverting to next-of-kin;
(c) death grants, funeral expenses, etc.
526. The following are excluded:
(a l medical care 1 given to survivors;2
(b I any increases in pensions, etc., granted on account of family responsibilities.3
Maternity function
527. The maternity function includes all benefits awarded to cover expenditure resulting from pregnancy and childbirth (live or still births), as well as those of a similar nature which are granted in the case either of abortion or of adoption.
528. This function includes:
(a) allowances (including, where appropriate, continued payment of wages and salaries) intended to offset in whole or in part the loss of income resulting from the suspension of one's occupation as a result of pregnancy and confinement;
(b l special allowances which may be granted either during pregnancy or after childbirth. in so far as they are ~onnected with this event (e. g. for prenatal or postnatal examinations);
(c l flat-rate allowances paid on the birth of the child;
(d l the medical care1 given:
1) to the expectant mother during pregnancy,
2 l during confinement,
31 to the mother and child after the birth and up to the time they leave the clin1c, in so far as the care has been given in. an establishment, or for an equivalent period (approximately one week in most cases) when the confinement takes place at home;
(e) other forms of social assistance given to expectant mothers or mothers of newborn children.
529. This function does not include medical care' given beyond the period indicated above.l
Family function
530. The family function includes all benefits granted with a view to covering costs incurred in the bringing-up of children, and possibly, if relevant provisions are contained in nat1onal legislation, care of other members of the family (spouse, ascendant, etc.).
1 See me fintloo~note under Ule luncaon 'S1ckness'. 2 Those benefitS ant class1fied under me 1\Jncuon · S1ckness·. 3 These 1ncreases ent class•hed under the 1\Jncuon 'Family'.
37

531. This function includes:
(a I family allowances;
(b I allowances, compensation payments and other cash benefits granted for dependent children or, if relevant provisions are contained in national legislation, for other members of the family;
9.
(c) supplementary payments for children where the legal basis for these benefits •s the cover of another risk (sickness, invalidity, etc. I;
(d) supply of food, clothing, holiday accommodation and assistance, in particular household assistance (unless it is directly related to the 'Education' function);
(e I expenditure in the field of family planning;
(f) otherforms of social assistance for children and the family.
Placement, vocational guidance and resettlement function
532. This function includes:
(a) administrative costs (compensation of employees, purchases of goods and services) incurred by placement or vocational guidance offices;
(b) removal and installation allowances for unemployed persons who have agreed to move house and work in another region;
(c) payments compensating for loss of earnings due to absence from work in order to receive vocational training.,
533. This function excludes:
(a I the administrative costs of the agencies supervising placement offices;
(b) direct payments from employers not giving rise to a general government subsidy in compensation;
(c) the direct cost of vocational training (remuneration of training staff. supply of teaching materials, etc. I;
(d) subsidies paid by the public authorities to enterprises in order to encourage the laner to reta1n their employees.
Unemployment function
534. This function includes all benefits designed to provide scme income for protected persons who have lost part or all of their wages or salary as a result of unemplo}ment, such as :
<a> basic or compensatory unemployment benefits;
(b) allowances for short-time wcrking for operational, technical or eccnomic reason~;
<c> allowancer for short-timewcrking resulting from bad weather;
(d) redundancy payments;
<e> other expenditure to the benefit of unemployed perscr.s.

10.
535. This function does not include :
(a) medical care given to u~employed persons and members of their families;
(b) removal expenses and installation allowance for unemployed 2 persons who have agreed to move house and work in another region ;
(c) various pa~ments made, under specific conditions, to the elderly unemployed
Housing function '
536. This function includes payments made by'general government on behalf of certain categories of households - in particular, those with limited means - in order to help to pay for the use of their accommodation.
It covers:
(a) cash benefits paid directly to households (tenants or owners);
(b) subsidies paid to private owners or to public bodies which own hous1ng, in so far as they are expressly intended to compensate for a loss of income due to the imposition of reduced rents on behalf of tenant households.
537. This function does not include all those general measures (even if they are organized by generar government bodies) aimed principally at encouraging building construction, such as building subsidies, bonus payments on savings for housing purposes, subsidies intended to compensate for reductions in the interest rates on building loans. etc.
Miscellaneous function
538. This function includes:
(a J benefits which, as they are linked to several other functions at the same t1me, cannot be allocated to any one of these functions. even as estimates;
lb) benefits relating to areas other than those covered by the other functions but whose purposes are similar to those of social protection in the wide sense:
1) assistance for destitute persons, in so far as the contingency responsible for their lack of resources cannot be classified under another function (old age, family, etc.);
2) expenditure effected in the context of social assistance measures aimed at combating poverty;
3) expenditure on behalf of children and of Juvenile delinquents (re1ntegrat1on. etc.). with the exception of educational measures;
--------------------1 benefits classified under the Sickness function 2These are
3These benefits are classified ur·der the Promotion of employment function These benefits are classified under the Old Age function
;)9

11 •
4) compensation payments and other benefits in cash or in kind not classified elsewhere, for victims of political events or natural disasters;
5) legal aid and assistance to victims of criminal violence;
61 other forms of social assistance for persons without means, the homeless and the socially handicapped (drug addicts, etc.).
N. B.- This is a limitative enumeration.
C-GROUPING OF FUNCTIONS
539. In the case of certain needs there may be no point in making two-digit breakdown of the benefits, as appears in Table D. A less detailed subdivision is accordingly provided for, using the one-digit headings and containing only the following broad areas: health, old age, survivors, maternity/family, employment, housing and miscellaneous items.

12.
II I • ~· S_~c-i a_l __ b_e_n_e_f_i_t_s_" __ a~d- _"_ s_o_c_ i a_l p_ r_o_t _e_c_!j~ --~-e~_f i _t_~·-· is there a difference?
The term "Social benefits" in Community statistics ot nat1onal accounts is a heading in the "Distribution of Income Account" of the European system of integrated economic accounts CESA), which records all transactions relating to the production process and the generation of income, the distribution and redistribution of income and its allocation between final consumption a?~>saving, as well as capital formation and lending or borrowing the Community •
In national accounts, goods and services are recorded in widely differing ways depending on the type of economic unit which consume them. In a given country, if a private individual cons~2)S a doctor, buys medicines on a prescription and then claims reimbursement for his expenditure from the responsible social security institution, the service provided by the doctor and the goods represented by the medicines are described as "market" goods and services, and as such are regarded as having been consumed by t~>sick person; accordingly, they come under the aggregates "Social benefits" and "Final consumption of households". On the other hand, in a neighbouring country with a national health ser'ti5e which provides the si-ck person with a medical consultation and medicines free of charge, the reasoning adopted is as follows : since the doctor is remunerated and the medicines are purchased by a general government department, the latter becomes the consumer of the goods and the service, the cost of which then comes under the aggregate "general government consumption" : at the same time, these general government departments set themselves up as producers of "Health services" which in the final analysis accrue to the sick person but which, since they are "non-market" services, cannot be regarded as "Social benefits".
Of course, for the sick person these accounting distinctions are meaningless he is treated by the same means - a doctor and medicines - regardless of the manner in which th~ former is remunerated or the Latter purchased.
The fact that goods are always of the "market" type means that :
Ca> social benefits other than cash benefits include goods, and market services only;
----- -· ---------(1) See EUROSTAT "National Accounts ESA" for definitions. C2> It does not matter whether the reimbursement is total or partial (i.e.
whether or not the insured person pays part of the cost of treatment). <3> In order to be classified under "Social benefits", benefits in kind (goods
and services) must always be of the "market" type. (4) In fact, in all countries - even those without a national health service -
there are goods and services which belong to both categories. The distinction made between these categories is justified. solely by the classification, definition, relations between sectors, etc. used by economic accounting systems as needs dictate.
" 1 'i

Cb) other benefits in protection system services.
13.
the form of goods and services provided by the social include goods, market services and all non-market
"Social protection benefits", on the other hand, are defined to measure what the person or beneficiary receives - for example, medical care or medicines - irrespective of the conventional economic description of the methods in which such goods or services are delivered. It covers a wider field than the narrow definition of "Social benefits", by including "Other benefits in the form of goods and services". It will thus result in higher figures than those in an apparently similar heading in the economic accounts.
The definition, even though it may seem open to the accusation of Nexaggerating" the amounts spent on the social services, does have the advantage of providing more comparable figures, in particular between countries with a national health service and those without.
f 2 'J ~

APPENDIX B
Economic Assumptions
The main sources for table 8.1 are the baseline projections 1986-1990 supplied by the services of DG II, completed by data currently available in EUROSTAT publications, notably :
"Europe, Etats-Unis, Japon, 1970-1986 : Principaux indicateurs des comptes economiques".
Note : a PPS/SPA (purchasing power standard/standard de pouvoir d'achat) is a numeraire against which each national currency has an exchange value, that takes into account the own purchasing power of that currency, computed following the purchasing-power-parities method. In fact one PPS equals one ECU, once adjusted by purchasing power. This makes international comparisons more realistic. More details about the definition and computation of PPS/SPA's are contained in the abovementionned EUROSTAT publication, pages 111 - 117.
Note GOP figures for Luxembourg may differ from national due to the treatment of imputed financial services. from the Statistical Office have been kept in order comparability between Member states.
statistics The data
to ensure
Note The latest avaible EUR12 figures from DG II (June,1988)for GOP (in PPS) and unemployment are
43
1984 1990
GOP (mrds of PPS)
37 12.3 56 00.0
Unemployment (%)
11,7 11.0

•. r.~ ..._ .....
Table 8.1 Economic assumptions
---
EEC B
GDP 9 10 nat.currency I 1984 - 4 380.t
at current prices 1990 - 5841 .o
X growth rate, voluae (annual average 84-90)
2.5 2.0
109 current prices and ECU rates 1984 3000.9 96.4
1990 4199.1 135.9
109 current pdces and PPS/SPA rates 1984 3598.2 115.9
1990 5346 166.4
Prices 1990 (1984=100)
GDP Defla tor 127.5 118.4
Private Consumption Def. 124.5 117.2
Exchange Rates
1 ECU = X nat.curr. 1984 - ~5.442
29.05.1987 - 42.990
1 PPS = X nat.curr. 1984 - 37.789
1990 - 35.092
Unemployment (%) . 1984 11.Z 14.4
1990 10.4 11.2
.
DK D GR
559.9 1745.4 3772.0
867.5 2321.7 8329.7
2.5 3.0 1.1
68.7 779.9 42.7
111.0 1118.2 53.9
67.9 808.1 64.6
111 1230.3 88.0
133.6 111.4 206.8
130.4 108.5 207.6
8.1465 2.2381 88.340
7.8118 2.0762 154.60
8.2459 Z.1599 58.356
7.8191 1,8872 94.651
10.1 8.4 8.1
9.0 5.6 10.4
SP F IRL I L NL p UK
25121 4277.1 16.3 615113 199.1 394.8 2822.4 318. ~
43340 6066.2 24.0 1014168 279.3 467.8 7226.9 449.7
2.6 2.5 2.9 2.8 2.8 2.2 3.5 2.5
198.5 622.4 22.4 445.3 4.4 156.5 24.4 539.3
299.3 876.5 31.0 676.7 6.5 203.9 44.7 641.5
322.5 692.1' 27.9 590.9 6.0 178.6 57.7 666.4
479.6 1023.3 42.3 884.8 9.0 259.5 Y0.5 961.3
147.9 122.3 124.1 139.7 118.9 104.0 208.3 124.8 N
143.5 120.1 120.0 136.4 116.8 107.3 194.0 124.0
126.57 6.8717 0.72594 1381.4 45.442 2.5233 115.67 0.59063
144.82 6.9209 0.77511 1498.9 42.990 2.3384 161.80 0.70096
77.896 6.1801 0.58355 1041.0 36.877 2.Z102 48.905 0.4 7791
90.359 5.9Z80 0.5679~ 1146.3 34.390 1.8028 79.897 0.46779
21.1 9.9 16.5 10.6 1.7 14.5 6.7 11.8
20.7 10.2 17.0 9.3 1.1 12.3 9.8 11.0

APPENDIX C
Demographic Assumptions
Population statistics (1984) and projections (1990) are offered in Table C-1, by sex for different age groups. The figures are percentages over the corresponding sex totals. Fertility rates CEUROSTAT : Demographic statistics, 1986), activity rates -civilian working-population over total population- CEUROSTAT : Employment and Unemployment, 1987) and retirement ages (CCE Tableaux comparatifs des Regimes de Securite Sociale, 1984) are also included •
. •, 5 '2 ~

..,r_ ... c;-:,
Table C.1 Demographic statistics
---- --
EEC a
Less than 20
1984 f 26.84 25.64
" 29.83 28.19 T 28.29 26.89
1990 F 24.24 23.67
" 26.86 26.03 T 25.51 21o.82
20 to 54
1984 F 45.83 46.20
" 1,9.05 49.52 T 47.40 47.82
1990 F 47.43 46.85
" 50.81 50.40 T 49.08 48.58
55 to 59
1984 F 5.75 6.10
" 5.56 6.00 T 5.66 6.05
1990 F 5.61 5.85
" 5.61 5.82 T 5.61 5.84
60 to 64
1984 F 5.63 5.76
" 5.09 5.37 T 5.37 5.57
1990 F 5.47 5.87
" 5.16 5.53 T 5.32 5. 71
-- --
DK D 6A
25.94 22.38 29.88 28.00 25.67 32.54 26.96 23.95 31.20
23.38 19.02 30.88 25.23 21.48 33.32 24.29 20.21 32.09
46.18 46.87 45.37 49.09 53.50 45.92 47.61 50.03 45.64
48.72 49.36 43.25 52.12 55.63 44.33 50.39 52.38 43.79
5.32 6.02 6.04 5.20 5.67 5.61 5.26 5.85 5.83
4.98 5.80 6.90 4.91 6.20 6,28 1,.94 5.99 6.59
5.44 6.34 5.00 5.08 4.54 4.58 5.26 5.48 4.77
4.98 5.74 5.59 4.71 5.56 5.17 4.85 5.66 5.38
SP F JAL I
30.67 28.01 38.11 26.82 33.79 30.93 39.82 29.72 32.20 29.44 38.97 28.23
27.19 26.39 35.52 23.26 29.95 29.12 37.63 25.94 28.55 27.72 36.57 24.56
44.75 45.59 41.82 46.44 46.30 48.64 42.99 48.62 45.51 47.08 42.41 47.50
46.22 46.26 44.51 47.91 48.23 49.49 lo5.32 50.70 47.21 47.84 44.91 49.27
,,
5.69 5.61 4.19 6.13 5.48 5.48 4.06 5.92 5.59 5.51, 4.12 6.03
5.77 5.42 3.94 6,05 5.59 5.38 4.03 5,89 5.68 5.40 3.98 5,97
5.01 5.24 4.08 5,81 1,,56 4.79 3.79 6.14 4,79 5.02 3.93 5.49
5.50 5.31 3.79 ' 5.91 5.11 1,.94 3.67 5.49 5.31 5.13 3.73 5.71
L NL
23.81 28.01 26.30 29.91 25.02 28.95
23.25 24.32 25.48 26.12 24.34 25.21
48.96 48.13 53.15 51.25 51.00 49.67
49.39 50.51 53.11 53.99 51.21 52.23
6.07 5.01 5.80 4.79 5.94 4.90
5.90 4.93 6.11 4.98 6.00 4.96
5.43 1,.86 4.22 4.38 4.85 4.62
5.90 4.72 5.69 4.1,1 5.80 4.56
p
30.27 33.90 32.03
27.71 30.30 28.97
45.28 46.14 45.70
46.80 48.39 47.58
5.69 5.27 5.49
5.62 5.29 5.46
5.23 4.76 5.00
5.36 4.90 5.14
UK
26.26 29.19 27.69
24.49 27.20 25.81
44.72 47.71 46.17
46.88 49.94 48.37
5.47 5.52 5.49
5.10 5.17 5.13
5.95 5.64 5.80
5.16 4.96 5.06
IV
I
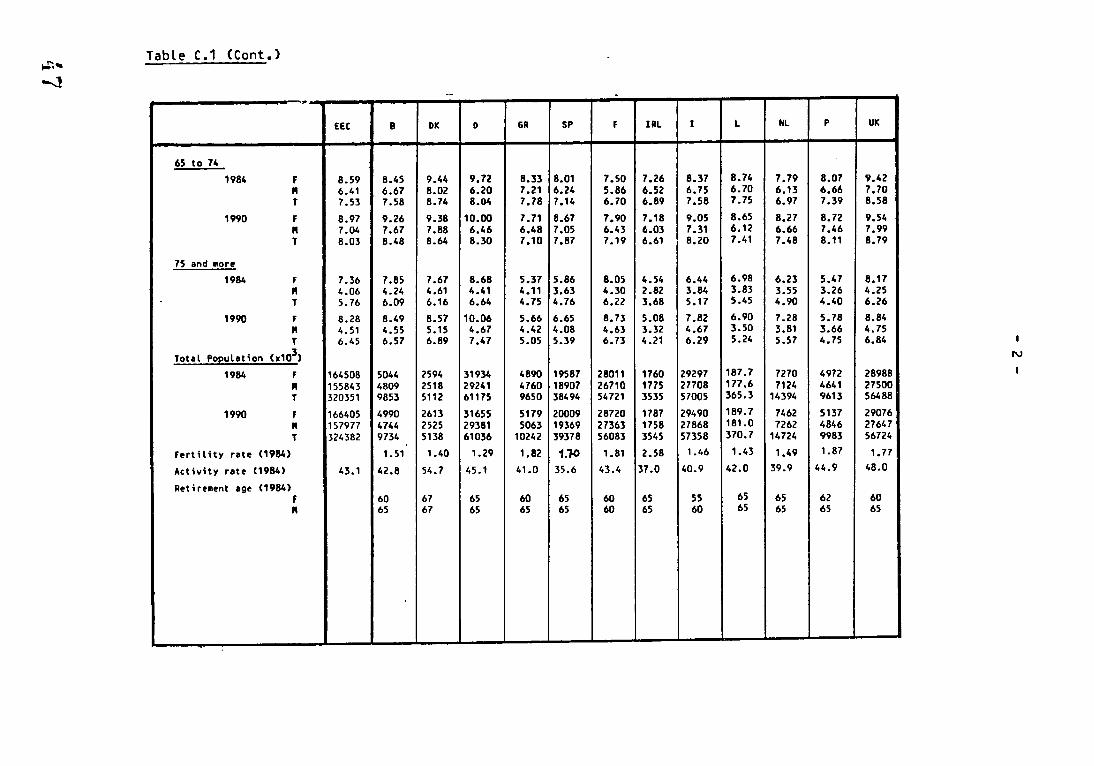
Table C.1 (Cont.> ...r.--.}
--- . .. EEC 8 DK D GR SP F IRL I L NL p UK
65 to 74
1984 F 8.59 8.45 9.44 9.72 8.33 8.01 7.50 7.26 8.37 8.74 7.79 8.07 9.42
" 6.41 6.67 8.02 6.20 7.21 6.24 5.86 6.52 6.75 6.70 6,13 6.66 7.70 T 7.53 7.58 8.74 8.04 7.78 7.14 6.70 6.89 7.58 7.75 6.97 7.39 8.58
1990 F 8.97 9.26 9.38 10.00 7.71 8.67 7,90 7.18 9.05 8.65 8.27 8.72 9.54
" 7.04 7.67 7.88 6.46 6.48 7.05 6.43 6.03 7.31 6.12 6.66 7.46 7.99 T 8.03 8.48 8.64 8.30 7.10 7.87 7.19 6.61 8.20 7.41 7.48 8.11 8.79
75 and 111ore
1984 F 7.36 7.85 7.67 8.68 5.37 5.86 8.05 4.54 6.44 6.98 6.23 5.47 8.17
" 4.06 4.24 4.61 4.41 4.11 3.63 4.30 2.82 3.84 3.83 3.55 3.26 4.25 T 5.76 6.09 6.16 6.64 4.75 4.76 6.22 3.68 5.17 5.45 4.90 4.40 6.26
1990 F 8.28 8.49 8.57 10.06 5.66 6,65 B. 73 5.08 7.82 6.90 7.28 5.78 8.84
" 4. 51 4.55 5.15 4.67 4.42 4.08 4.63 3.32 4.67 3.50 3.81 3.66 4.75 T 6.45 6.57 6.89 7.47 5.05 5.39 6.73 4.21 6.29 5.24 5.57 4.75 6,84
Total Poeulation (x103> N
1984 F 164508 5044 2594 31934 4890 19587 28011 1760 29297 187.7 7270 4972 28988
" 155843 4809 2518 29241 4760 18907 26710 1775 27708 177.6 7124 4641 27500 T 320351 9853 5112 61175 9650 38494 54721 3535 57005 365.3 14394 9613 56488
1990 F 166405 4990 2613 31655 5179 20009 28720 1787 29490 189.7 7462 5137 29076
" 157977 4744 2525 29381 5063 19369 27363 1758 27868 181.0 7262 4846 27647 T 324382 9734 5138 61036 10242 39378 56083 3545 57358 370.7 14724 9983 56724
Fertility rate (1984) 1.51 1.40 1.29 1.82 1.10 1.81 2.58 1.46 1.43 1.49 1.87 1. 77
Activity rate (1984) 43.1 42.8 54.7 45.1 41.0 35.6 43.4 37.0 40.9 42.0 39.9 44.9 48.0
Retire111ent age (1984) F 60 67 65 60 65 60 65 55 65 65 62 60
" 65 67 65 65 65 60 65 60 65 65 65 65
-

APPENDIX D
Detailed tables
Tables D-1 through D-4 provide the figures upon which most of the computations given in the main text are based. Those come from the national reports and are organized following some of the classifications presented in Appendix A. The computations in ECU have been carried-outu~ng the exchange rates of table B-1 where the figures for 1990 were proxied by the rates of 29.05.87.
48

~~
Table 0.1 Expenditure in 1984 at current prices and nat. currency (billions)
. - . --
EEC 8 DK D 6R SP F JRL J L (ECU) <•1012)
J. CURRENT TRANSACTIONS 812.0 1296.4 161.9 497.1 754.0 4379.0 1255.8 3.90 167.85 50.63
-A. Social protection benefits 774.6 1254.8 157.4 478.7 718.0 4216.7 1188.0 3.74 155.85 48.15
1. Health 286.1 414.9 18.2 194.8 141.0 1482.7 395.8 1.32 67.86 20.84 1.1. Sickness 186.1 263.9 34.2 130.8 85.0 975.9 295.8 1.06 34.33 11.04 1.2. Jnvalid1ty,disability 82.3 118.8 12.9 48.9 41.0 396.6 66.5 .25 29.42 7.95 1.3. Occupational accidents
32.2 1.2 15.1 15.0 110.2 33.5 .02 4.12 and d1seases 17.7 1.85
2. Old age 260.3 342.5 57.1 137.6 470.0 1487.6 404.3 .91 55.43, 13.75
3. Survivors 65.9 154.3 0.2 66.3 36.0 479.4 79.6 .26 16.36 8.10
4. Maternity/family 67.6 135.3 16.1 33.0 27.0 101.7 131.3 .45 10.46 4.31 4.1. Maternity 8.4 11.0 2.1 3.9 8.0 40.1 20.9 .09 .97 0.72 4.2. Family 59.2 124.3 14.0 29.1 18.0 61.6 110.4 .36 9.49 3.59
5. Employment 68.4 169.7 27.3 31.2 18.0 657.5 122.3 .57 5.49 1.08 5.1. Placement,vocational
gu1dance, resettlement 5.7 26.0 1.0 5.4 65.4 4.1 .07 .14 0.46 5.2. Unemployment 62.8 143.7 26.3 25.8 18.0 592.1 118.2 .50 5.35 0.62
6. Housing 12.4 - 2.7 3.7 4.0 29.9 .17 0.03
7. Miscellaneous 13.5 18.2 5.8 12.2 28.0 7.8 24.8 .06 .24 0.04
B. Administration costs 28.4 54.4 4.6 13.7 24.0 107.1 53.8 • 16 5.81 1.57
C. Other current expenditures 9.4 7.2 - 4.7 12.0 55.2 14.0 .01 6.19 0.91
JJ. CAPITAL TRANSACTIONS n.a. n.a. n.a. n.a. n.a. n.a. .06 2.06
Ill. SOCIAL PROTECTION 3.96 169.91 EX PEND ITURE (J+JI) ..,.
NL p UK
129.6 492.15 78.28
125.1 397.87 75.25
55.0 192.66 22.61 31.8 118.22 15.20 23.2 64.33 6.76
- 10.11 0.64 ;
33.6 117.62 30.93
5.5 28.19 1.32
10.6 28.19 8.85 0.5 4.26 0.99
10.2 23.93 7.86 N
16.1 10.07 7.66
1 :oo 0.74 16.1 9.07 6.92
2.0 0.04 2.92
2.4 21.09 0.96
4.5 30.20 3.01
1.08 0.03
n.a. n.a.
U1 0
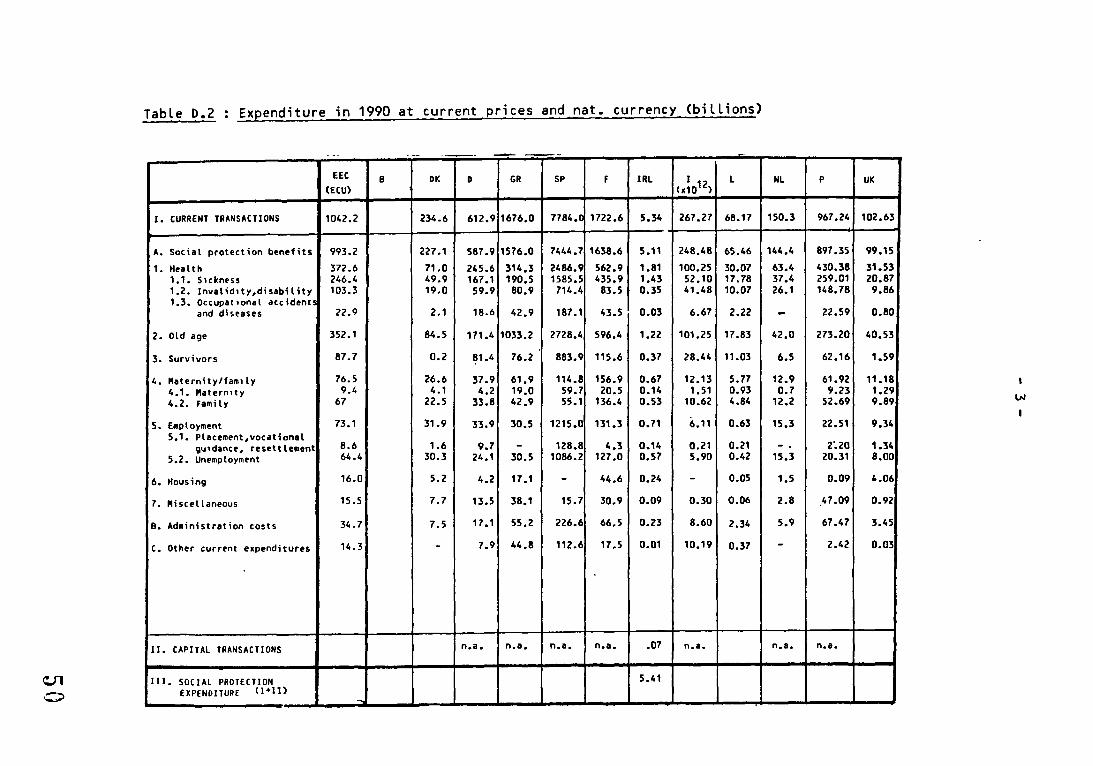
Table 0.2 Expenditure in 1990 at current prices and nat. currency (billions>
--- - -- -- - - -EEC 8 OK D GR SP F lRL I L
(EtU) (x1012>
1. CURRENT TRANSACTIONS 1042.2 234.6 612.9 1676.0 7784.(1 1722.6 5.34 267.27 68.17
A. Social protection benefits 993.2 227.1 587.9 1576.0 7444.7 1638.6 5.11 248.48 65.46
1. Health 372.6 71.0 245.6 314.3 2486.9 562.9 1.81 100.25 30.07 1. 1. S1Cknl'SS 246.4 49.9 167.1 190.5 1585.5 435.9 1.43 52.10 17.78 1.2. lnvalidlty,disability 103.3 19.0 59.9 80.9 714.4 83.5 0.35 41.48 10.07 1.3. Occupational accidents
and di Sl'aSl'S 22.9 2.1 18.6 42.9 187.1 43.5 0.03 6.67 2.22
2. Old agP 352.1 84.5 171.4 1033.2 2728.4 596.4 1.22 101.25 17.83
3. Survivors 87.7 0.2 81.4 76.2 883.9 115.6 0.37 28.44 11.03
4. Maternity/family 76.5 26.6 37.9 61.9 114.8 156.9 0.67 12.13 5.77 4.1. MatPrnlty 9.4 4.1 4.2 19.0 59.7 20.5 0.14 1.51 0.93 4.2. Family 67 22.5 33.8 42.9 55.1 136.4 0.53 10.62 4.84
5. Employment 73.1 31.9 33.9 30.5 1215.0 131.3 0.71 6.11 0.63 5.1. PlacemPnt,vocational
gu1dancp, resPttlement 8.6 1.6 9.7 - 128.8 4.3 0.14 0.21 0.21 5.2. Unemployment 64.4 30.3 24.1 30.5 1086.2 127.0 0.57 5.90 0.42
6. Housing 16.0 5.2 4.2 17.1 - 44.6 0.24 - 0.05
7. Miscellaneous 15.5 7.7 13.5 38.1 15.7 30.9 0.09 0.30 <>.06
B. Administration costs 34.7 7.5 17.1 55.2 226.6 66.5 0.23 8.60 2.34
C. Other currPnt expenditures 14.3 - 7.9 44.8 112.6 17.5 0.01 10.19 0.37
IJ. CAPITAL TRANSACTIONS n.a. n.a. n.a. n.a. .07 n.a.
III. SOCIAL PROTECTION 5.41 EXPENDITURE (I +11)
.... --- --
NL p
150.3 967.24
144.4 897.35
63.4 430.38 37.4 259.01 26.1 148.78
- 22.59
42.0 273.20
6.5 62.16
12.9 61.92 0.7 9.23
12.2 52.69
15.3 22.51
-. z:zo 15.3 20.31
1.5 0.09
2.8 47.09
5.9 67.47
- 2.42
n.a. n.a.
UK
102.63
99.15
31.53 20.87 9.86
0.80
40.53'
1.59
11.18 1.29 9.89
9.'34
1.34 8.00
4.06
0.92
3.45
0.03
VI
I
(!. "1
~
Table 0.3 Receipts in 1984 at current prices and nat. currency (billions)
EUR B DK D 6R SP F lRL I L (ECU) (x1012
> •
~ 1. Social contributions 563.3 848.5 24.5 366.6 357.0 3256.4 985.5 1.40 1 118,21 32.62
1.1. E111ployers 364.5 574.6 17.8 212.0 175.0 2368.2 669.6 0.91 92.81 18.46'
1.1.1. Actual 437.8 6.7 133.5 - 2104.3 550.6 0.60 60.7 13.78 1.1.2. Imputed 136.8 11.1 78.5 - 263.9 119.0 0.31 32.0~ 4.68
1.2 •. Protected pl'rsons 198.8 273.9 6.7 154.6 182.0 888.2 315.9 0.49 25.42 14.16
1.2.1. Employl'es 212.5 6.7 111.1 - 467.3 249.8 - 17.47 12.31 1.2.2. Sl'lf-l'mployed 51.2 0.0 6.0 - 268.5 1 - 1 .9e 1.61 1.2.3. Pl'nsioners or )66.1
others 10.3 0.0 37.5 - 152.4 - - 0.23
2. General governml'nt funds 257.8 469.5 137.4 130.2 373.0 1147.8 260.4 2.77 53.67 17.68
3. Other receipts 44.1 71.5 12.5 18.0 32.0 47.9 44.2 0.04 2.79 4.53
TOTAL RECEIPTS 865.2 1389.1 174.4 514.8 762.0 ~452.1 ~ 290.1 4.21 174.74 54.83
SECTOR OF ORIGIN
1. Enterprhes 279.3 465.3 7.4 169.6 - 768.0 527.5 0.57 47.86 14.85
2. General government 339.8 608.5 157.7 168.9 - 765.1 384,3 3.12 74.55 25.24
2.1. Central 552.1 90.7 130.4 - 496.0 325.7 2.96 64.82 23.24 2.2. Local 52.4 54.5 37.5 - 131.6 48,9 0.16 8.39 1.88 2.3. Social security funds 4.0 12.5 1.0 - 137.5 9.7 o.oo 1.39 0.12
' 3. Households 223.3 311.6 6.7 155.9 - 918.7 352.3 0.49 51.75 14.63
4. Other sl'ctors 14.2 3.7 2.6 20.4 - 0.2 26.0 0.03 0.59 0.12
(without Grl'l'Cl')
NL p UK
106.1 292.8 42.42 49.6 214.2 27.42
43.1 182.0 19.30 6.4 32.2 8.12
56.6 78.6 15.00
39.7 72.4 14.04 4.2 5.5 0.64
12.7 0.6 0.32
27.6 150,4 38.93
22.0 11.2 8.75
~
155.7 454.4 90.09
49.0 171.1 26.54
48.2 196.5 48,47
40.9 193,8 40.81 6.9 2.3 7.55 0.5 0.5 0.11
57.4 85.8 15.08
1,1 1,0 -

~-!
('...:>
Table 0.4 Receipts in 1990 at current prices and nat. currency
EEC B OK 0 GR SP F lRL (ECU) .
~ 1. Social contributions 734.3 41.5 468.9 761.8 5133.7 1333.0 1.98
1.1. Employers 476.7 29.4 269.0 361.8 3948.7 893.2 1.29
1 • 1 • 1 • Actual 15.8 173.1 3576.8 739.5 0.84 1.1.2. Imputed 13.6 95.9 371.8 153.7 0.44
1.2. Protected persons 257.6 12.1 199.9 400.0 1185.0 439.8 0.69
1.2.1. Employees 12.1 145.6 742.7 351.8 -1.2.2. Self-employed 0.0 7.7 - 441.8 i 88.0 -1.2.3. Pensioners or 0.0 46.7 - 0.5 -
others
2. General government funds 315.5 196.5 151.7 780.9 2776.3 314.2 3.85
3. Other receipts 56.1 24.6 20.9 66.7 55.1 50.3 0.04
TOTAL REC E l PTS 1'\05.9 262.6 641.6 609.4 7965.1 1697.5 5.87
SECTOR OF ORIGIN
1. Enterprises 361.7 9.2 214.8 - 2956.2 713.9 0.79
2. General government 423.4 236.7 201.2 - 3791.8 472.3 4.34 2.1. Central 134.0 153.1 - 3339.3 397.6 4.17 2.2. Local 78.1 46.8 - 225.3 61.8 0.17 2.3. Social security funds 24.63 1.4 - 227.2 12.9 o.oo
3. Households 292.9 12.08 201.7 - 1217.0 484.3 0.69
4. Other sectors 17.5 4.65 24.0 - 0.1 27.0 0.05
(Without Greece>
-------·-
I (x1012>
L NL p UK
194 .sc 42.43 124.0 650.2 55.84 I 153.74 ?4.tl2 60.3 474.4 35.92
I 99.55 18.45 53.0 405.1 25.55 ! 54.19 6.17 7.3 69.3 10.37
41.05 17.80 63.7 175.8 19.92
27.58 15.34 46.6 162.0 18.66 13.47 2.11 3.6 12.4 0.86 - 0.35 13.5 1.4 0.40
85.83 26.44 25.6 336.2 50.29
4.00 5.20 36.7 24.4 11.23 i
I V1
284.62 74.08 186.3 1010.7 117.37
78.53 19.67 63.6 377.7 35.10
121.34 35.62 53.5 438.8 62.22
' 32.74 44.9 432.7 52.96 2.70 8.0 5.1 9.14 0.18 0.5 1.0 0.12
83.79 18.61 67.4 191.5 zo.oc;
0.96 0.18 1.8 2.8 0.01
- - ---